
Experimental and computational study of thermal energy...
15
Experimental and computational study of thermal energy storage with encapsulated NaNO 3 for high temperature applications Ying Zheng a , John L. Barton a , Kemal Tuzla a,⇑ , John C. Chen a , Sudhakar Neti b , Alparslan Oztekin b , Wojciech Z. Misiolek c a Chemical and Biomolecular Engineering, P.C. Rossin College of Engineering and Applied Science, Lehigh University, Bethlehem, PA 18015, USA b Mechanical Engineering and Mechanics, P.C. Rossin College of Engineering and Applied Science, Lehigh University, Bethlehem, PA 18015, USA c Materials Science and Engineering, P.C. Rossin College of Engineering and Applied Science, Lehigh University, Bethlehem, PA 18015, USA Received 20 September 2014; received in revised form 15 December 2014; accepted 5 February 2015 Communicated by: Associate Editor Halime Paksoy Abstract The objective of this work is to establish methods for storage of thermal energy using encapsulated phase change materials (EPCMs) at temperatures up to 440 °C applicable in concentrating solar plants (CSPs), in which heat transfer fluid (HTF) from the solar collector would pass through the storage system embedded with EPCM capsules. NaNO 3 , having latent heat of 176 kJ/kg at 308 °C, is selected as the storage medium. Stainless steel capsules containing NaNO 3 are fabricated and installed in a pilot-scale thermal energy storage (TES) system for performance tests. Compressed air is used as heat transfer fluid in the current tests. The test section (T/S) with EPCM capsules successfully demonstrate the ability to transfer thermal energy to and from a transport fluid, achieving energy storage and retrieval in multiple charging and discharging cycles. In a given cycle where capsule temperatures varied from 250 °C to 386 °C, the EPCM is found to store significant energy per unit mass (211 kJ/kg of capsule), with the phase change material (PCM) NaNO 3 accounting for 95% of the total energy stored in the capsules. The latent heat of the NaNO 3 contributes to 42% of the energy stored in the cap- sules. It is expected that the storage density of the EPCM would be even greater for plant size TES systems with larger size capsules, without the penalties associated with the limited scale used here. A mathematical model has been developed for the test section with EPCM capsules and its predictions are found to agree with experimental measurements within 7% discrepancy in stored energy. The dynamic performance of charging and discharging rates are also well predicted by the model, giving confidence for engineering design capabilities in future applications using EPCMs for thermal energy storage. Ó 2015 Elsevier Ltd. All rights reserved. Keywords: Thermal energy storage; Encapsulated phase change material; Latent heat storage; High temperature solar applications; NaNO 3 ; Concentrated solar plants 1. Introduction Renewable energy is of considerable current interest due to increasing demands on the world’s supply of fossil fuels, and world-wide attention on global warming associated with the increasing amount of CO 2 in our atmosphere, as noted by latest declarations from the Intergovernmental Panel on Climate Change (Metz et al., 2005). To date, renewable sources have only been minor contributors to the worlds energy supply. In 2011, approximately 13% of the total electricity generation in US was derived from renewable energy sources, with solar energy accounting for 1% (Energy Information Administration, 2012b). http://dx.doi.org/10.1016/j.solener.2015.02.002 0038-092X/Ó 2015 Elsevier Ltd. All rights reserved. ⇑ Corresponding author. Tel.: +1 610 758 4729; fax: +1 610 758 5057. E-mail address: [email protected] (K. Tuzla). www.elsevier.com/locate/solener Available online at www.sciencedirect.com ScienceDirect Solar Energy 115 (2015) 180–194
Transcript of Experimental and computational study of thermal energy...
Available online at www.sciencedirect.com
www.elsevier.com/locate/solener
ScienceDirect
Solar Energy 115 (2015) 180–194
Experimental and computational study of thermal energy storagewith encapsulated NaNO3 for high temperature applications
Ying Zheng a, John L. Barton a, Kemal Tuzla a,⇑, John C. Chen a, Sudhakar Neti b,Alparslan Oztekin b, Wojciech Z. Misiolek c
a Chemical and Biomolecular Engineering, P.C. Rossin College of Engineering and Applied Science, Lehigh University, Bethlehem, PA 18015, USAb Mechanical Engineering and Mechanics, P.C. Rossin College of Engineering and Applied Science, Lehigh University, Bethlehem, PA 18015, USA
c Materials Science and Engineering, P.C. Rossin College of Engineering and Applied Science, Lehigh University, Bethlehem, PA 18015, USA
Received 20 September 2014; received in revised form 15 December 2014; accepted 5 February 2015
Communicated by: Associate Editor Halime Paksoy
Abstract
The objective of this work is to establish methods for storage of thermal energy using encapsulated phase change materials (EPCMs)at temperatures up to 440 �C applicable in concentrating solar plants (CSPs), in which heat transfer fluid (HTF) from the solar collectorwould pass through the storage system embedded with EPCM capsules. NaNO3, having latent heat of 176 kJ/kg at 308 �C, is selected asthe storage medium. Stainless steel capsules containing NaNO3 are fabricated and installed in a pilot-scale thermal energy storage (TES)system for performance tests. Compressed air is used as heat transfer fluid in the current tests. The test section (T/S) with EPCM capsulessuccessfully demonstrate the ability to transfer thermal energy to and from a transport fluid, achieving energy storage and retrieval inmultiple charging and discharging cycles. In a given cycle where capsule temperatures varied from �250 �C to �386 �C, the EPCM isfound to store significant energy per unit mass (�211 kJ/kg of capsule), with the phase change material (PCM) NaNO3 accountingfor �95% of the total energy stored in the capsules. The latent heat of the NaNO3 contributes to �42% of the energy stored in the cap-sules. It is expected that the storage density of the EPCM would be even greater for plant size TES systems with larger size capsules,without the penalties associated with the limited scale used here. A mathematical model has been developed for the test section withEPCM capsules and its predictions are found to agree with experimental measurements within 7% discrepancy in stored energy. Thedynamic performance of charging and discharging rates are also well predicted by the model, giving confidence for engineering designcapabilities in future applications using EPCMs for thermal energy storage.� 2015 Elsevier Ltd. All rights reserved.
Keywords: Thermal energy storage; Encapsulated phase change material; Latent heat storage; High temperature solar applications; NaNO3; Concentratedsolar plants
1. Introduction
Renewable energy is of considerable current interest dueto increasing demands on the world’s supply of fossil fuels,and world-wide attention on global warming associated
http://dx.doi.org/10.1016/j.solener.2015.02.002
0038-092X/� 2015 Elsevier Ltd. All rights reserved.
⇑ Corresponding author. Tel.: +1 610 758 4729; fax: +1 610 758 5057.E-mail address: [email protected] (K. Tuzla).
with the increasing amount of CO2 in our atmosphere, asnoted by latest declarations from the IntergovernmentalPanel on Climate Change (Metz et al., 2005). To date,renewable sources have only been minor contributors tothe worlds energy supply. In 2011, approximately 13% ofthe total electricity generation in US was derived fromrenewable energy sources, with solar energy accountingfor �1% (Energy Information Administration, 2012b).

Nomenclature
DH latent heat (kJ/kg)Dr radius step (m)Dt time step (s)Dx step in x axis (m)A surface area of per unit volume of unit cell
(m2/m3)Cp heat capacity (J/kg �C)G flow flux (kg/m2 s)h convective heat transfer coefficient (W/m2 s)k thermal conductivity (W/m �C)L length (m)m mass (kg)_m mass flow rate (kg/s)Q energy change (J)_Q rate of energy change (W)r radius (m)S displacement of the melting front (m)t time (s)x location in x axis (m)z elevation (m)d thickness (m)q density (kg/m3)
Subscripts
a ambientCapsules capsules include the encapsulated materials
and encapsulation shellsCopper copper capsulesc chamber of test sectionf heat transfer fluidin at the inlet of test sectionj at location j
l heat lossesout at the outlet of test sectionPCM phase change materials shell of the capsulet at time t
t0 at time t0
Acronyms
CSP concentrating solar plantEPCM encapsulated phase change materialHTF heat transfer fluidPCM phase change materialTES thermal energy storageT/S test section
Y. Zheng et al. / Solar Energy 115 (2015) 180–194 181
One disadvantage of most renewable sources, includingsolar energy, is their intermittent and variable nature asthey are governed by locations and weather conditions.Even in locations with favorable solar incidence, the diur-nal cycle provides only about 3000 h of significant irradi-ance in a year. Consequently, current solar power plantshave average capacity factors of barely 20%, in comparisonto capacity factors of 85% for conventional coal plants and90% for advanced nuclear power plants (EnergyInformation Administration, 2012a). One way to improvethe capacity factor of solar plants is to integrate a thermalenergy storage system in the power plants. Such systemsenable the storage of energy when the solar incidence isstrong, and then release that energy for power generationduring cloudy or nocturnal periods of low or no solar inci-dence. It has been reported that the use of storage systemscan double the capacity factor of the solar thermal/electricpower plants to �40% or greater (Kuravi et al., 2013).
There are three mechanisms for thermal energy storage:sensible heat, latent heat, and thermo-chemical energy.Compared with thermo-chemical energy storage, sensibleenergy storage systems and latent heat storage systems,which utilize the reversible enthalpy changes of a storagemedium, are thermodynamically attractive and eco-nomically promising. Several concentrating solar plantshave been built with two-tank TES systems (Dunn et al.,2012), where the energy is stored by sensible heating ofmolten salt, and the molten salt is stored and circulates
between a cold tank and a hot tank. In daytime with excesssunshine, the molten salt is pumped through a heatexchanger to capture the energy from a heat transfer fluid(HTF), such as oil, and store the energy in the hot tank.When the energy is needed, the molten salt is pumped fromthe hot tank to release the energy to the HTF in a heatexchanger, and then circuit back to the cold tank. A one-tank TES system with hot fluid at the top and cold fluidat the bottom of the tank, was developed by SandiaNational Laboratories, using quartzite rock and silica sandas the storage medium (Pacheco et al., 2002). Such one-tank TES system using sensible heating of the storagemedium was predicted to reduce the investment of the stor-age system by �32% compared to the two-tank system(Dunn et al., 2012). However, large solar plants would needTES components of 500 MW h thermal, or greater, requir-ing large volumes of storage medium, of the order�5 � 105 m3. Latent heat storage, which utilizes latent heatof phase change to complement sensible heat storage, canachieve significantly higher storage densities (IRENA,2013), thus reducing the required volume of storage medi-um and its containment vessel. This promises to significant-ly reduce the capital cost of TES, and the total cost of solarelectric generating plants.
A few research and development efforts have pioneeredthe use of latent heat storage technology at temperaturessuitable for CSPs. Several reports has been focused on ashell-and-tube system, with the phase change materials,

182 Y. Zheng et al. / Solar Energy 115 (2015) 180–194
such as KNO3, placed in a large container and a heat trans-fer fluid flowing in the embedded tubes in the PCM (Dinteret al., 1991; Michels and Pitz-Paal, 2007; Kuravi et al.,2013). A difficulty of such shell-and-tube system is its slowcharging and discharging rates, which are due to the lowthermal conductivity of most PCMs and limited heat trans-fer area of the immersed tubes. This is of special concernduring the heat extraction (discharging) phase when liquidPCM would form a frozen layer on the heat transfer sur-faces, hampering further energy transfer between PCMand the heat transfer fluid (HTF).
To address this issue, three different approaches havebeen identified (Steinmann et al., 2010): (a) encapsulationof the storage material to limit the average distance forheat transfer; (b) addition of a substance to the PCM tocreate a composite material with high thermal conductivity;and (c) integration of heat transfer structures, such as fins(Laing et al., 2013) to ensure sufficient heat transferbetween PCM and HTF. The approach investigated inthe current development is to reduce the dimensional scaleof the PCM by containing measured amounts of the PCMin individual capsules, of which the approach has been pro-posed in early 1988 by Luz International Ltd. et al. (1988).By placing limited amounts of the PCM in individual cap-sules, one minimizes the dimensional scale for conductionpath within the PCM, and simultaneously increases thetotal contact area of the capsules for convective heat trans-fer with the HTF. With appropriate selection of the cap-sules’ dimensions, the physical scale for heat transfer canbe optimized to reduce conduction resistance within thePCM and to enhance external convective heat transferbetween the capsules and the HTF. The ideal dimensionsfor the capsules can be optimized for various PCMs andHTFs with different thermal properties. In plant applica-tions, this beneficial improvement of heat transfer wouldbe balanced against fabrication cost of encapsulation.Initial cost estimates indicated that these types of EPCMbased TES system can be implemented with a less expen-sive investment than currently used two-tank system forstorage of thermal energy (Zheng et al., 2013; Zhaoet al., 2012).
Several issues need to be resolved for the proposed useof encapsulated PCMs for thermal energy storage inCSP: (1) Selection of a PCM for operating temperaturesup to 440 �C; (2) Selection of an encapsulation material,compatible with the PCM; (3) Dimensional optimizationof the capsules for heat transfer, as described above; (4)Characterization of the encapsulated PCM, and evaluationof its storage performance in long-term melting/freezingcycles.
All four issues have been addressed in recent develop-ment work and the solutions are described in severalreports and publications (Zheng et al., 2013; Zhao et al.,2012; Blaney et al., 2013). The present work follows theseprecursor developments by actually designing, operating,and testing a pilot-scale TES system with EPCMs. Toverify that such a system can be successfully engineered,
a computer simulation model of the EPCM based TES sys-tem is also developed and its predictions compare to actualmeasurements of performance.
2. Design, operation and energy measurements of the EPCM
based TES system
In previous research for identification of qualifiedencapsulated phase change materials, NaNO3 and cylin-drical stainless steel capsule was found to be compatiblewith the NaNO3 in long-term thermal cycling (Zhenget al., 2013). These investigators illustrated that the stor-age capacity has not been deteriorated under repeatedthermal tests in a specially-made calorimeter. The presentwork is aimed to establish a method for storage of ther-mal energy utilizing encapsulated PCM and demonstrateits technical and economic feasibilities through testing apilot-scale EPCM based TES system. For TES systemswith EPCM, most of the experimental research havebeen focused on low temperature applications (Faridet al., 2004; Lane, 1976; IRENA, 2013; Nallusamy andVelraj, 2009), such as using encapsulated CaCl2�6H2Oas a construction material for buildings’ thermal manage-ment. There are very few process demonstrations beingdeveloped for high temperature applications, and mostof the high temperature studies have been limited inthe level of theoretical and computational studies (Dutilet al., 2011; Regin et al., 2008; Sharma et al., 2009;Verma et al., 2008). Therefore, it is essential to developand execute the experimental verification of technical fea-sibility of the EPCM in test facilities. On one hand, itcan be a demonstration to evaluate the technology viabi-lity before scale-up and commercialization. On the otherhand, experimental testing data, such as stored energyand temperature profiles of EPCM, can be obtained tocompare with model predictions to verify and adjustthe mathematical model.
In the design of the EPCM based TES system, severalparameters need to be determined: (1) Configuration ofthe EPCM based test section (T/S); (2) Physical dimensionsof the test section; (3) Physical dimension, and number ofthe EPCM capsules; (4) Selection of HTF; and (5)Operating conditions of the HTF.
For determination of those parameters, a mathematicalmodel is developed to analyze the effects of these para-meters, and further optimize the test section design fordesired performance. The key information of the model isdescribed in the section below and more details aredocumented by Zheng (2015). There are four main criteriafor quantification of these parameters: (1) Majority of theenergy should be stored into or extracted from the PCM.In other words, the thermal masses of the other compo-nents are desired to be minimized. (2) The temperaturedrops of HTF should be large across the TES system, sothat the errors for calculation of the total energy fromthe HTF will be small. Though air is used as the HTF, inthis research, experiments are conducted with temperature
Y. Zheng et al. / Solar Energy 115 (2015) 180–194 183
drops of the HTF higher than 20 �C considering the accu-racy of the calibrated thermocouple (K-type) is within0.4 �C. (3) All the encapsulated PCM will be preferred tocomplete phase change in a time period that is applicablefor solar power plants. Considering the scale of currentfacility, the desired experiment duration is about 2–6 hfor a charging/discharging process, and the experiment isended when the temperature drop of the HTF decreasesbelow 20 �C.
With considerations of many configurations, one-col-umn inline system is chosen with heat transport fluid flow-ing across horizontally-oriented EPCM capsules.Following these design criteria, the mathematical modelhas been run to develop a set of those design parameters,including physical dimensions and operating conditionsfor desired test performance from EPCM capsules. It isfound that the diameter of the capsule is one of the mostimportant parameters. It is preferred to have a small dia-meter for the capsules considering that the thermal massand conduction path will be small; while the EPCM willgreatly contribute for the energy storage with a large dia-meter and a large amount of PCM mass. Through carefullyanalyzing multiple diameter options and manufacturingcosts, the size of the cylindrical stainless steel capsules areselected to be constructed with a diameter of 76 mm, anda length of 254 mm. Considering the significant thermalexpansion (Tufeu et al., 1985; Bauer et al., 2009), whichis �25% volume change for NaNO3 for a temperaturechange from room temperature to 440 �C, the capsuleswere fabricated with an approximately 30% void space asan allowance for thermal expansion of NaNO3.Considering thermal expansion of the PCM and the gasin the void, with the shell thickness of 1.6 mm, the shellis exposed to �35 MPa tensile stress (Blaney et al., 2013).
The general layout of the test facility is shown inFig. 1. The key component of the test loop is the verticaltest section with ten EPCM capsules. The chamber of thetest section is fabricated in rectangular, with a height of1118 mm, a width of 93 mm and a length of 26 mm. TheT/S is made of stainless steel 304 with a thickness of3.175 mm which is chosen so that the relatively narrowT/S is strong enough to stand up without an externalsupport. It is thin enough so that the thermal residuestored in it is minimized in the thermal charging and dis-charging process. The gap between the T/S surface andcapsules is 8.3 mm, which has been minimized withinthe fabrication capabilities to provide a good contactarea for the heat transfer between the HTF and the cap-sules. Considering the weight of the ten capsules in theT/S, In the test section, the ten EPCM capsules areseparated into two stacks, with five capsules in the topsection (capsules #1–#5) and the other five capsules inthe bottom section (capsules #6–#10). For each stack,the bottom capsule is supported by the test section shelland the other four capsules sit on the supported capsule.In each stack, the capsule is horizontally orientated and
sits on the lower one with their special-made square endplates. The overall test section is externally insulated with150 mm thick mineral wool insulation to reduce its heatlosses to the ambient.
Available HTFs, such as VP1 can only stand tem-perature up to 400 �C. The HTF is selected to be air inthe current test facility for both charge and discharge theEPCM considering its flexibility over liquid HTFs. In atypical charging or discharging process, the air is preheatedto a selected temperature by an external electric heaterwhich is shown in Fig. 1(a), and flows from the top ofthe test section to transfer the heat to or extract the energyfrom the EPCM capsules. With the considerations of theexpensive valves and the potential difficulties in theiroperations at high temperatures, the air is chosen to alwaysbe sent into the test section downwards, i.e., flow from thetop of the T/S to the bottom in current demonstrations, sothat a simulation model for the EPCM based test sectioncan be verified first and capable of working further onthe cases using different air flow directions (Zheng, 2015).In this test facility, the air can be operated in the rangeof 0.01–0.05 kg/s for its mass flow rate, and up to 600 �Cfor its temperature. To accommodate a 1–5 psi pressuredrop across the flow distributors at the inlet and at the out-let of the test section, the air is slightly pressurized with�20 psig pressure before the first EPCM capsule. At theoutlet of the test section, the air still possess considerableheat and is hot, therefore, a cooler is assembled with spray-ing water inside to cool the air to 40–60 �C for safety beforeexhausting the air to the outside.
In order to demonstrate the energy storage within andretrieval from the encapsulated NaNO3, it is necessary tomeasure the total energy stored in the capsules in thecharging process and the total energy extracted fromthe capsules in the discharging process. For the materialof NaNO3, it is very difficult to determine its total ener-gy change directly with temperature sensors, since it ishard to measure and identify the molten fraction orsolidification fraction inside the capsules. However, theenergy storage and retrieval of the encapsulatedNaNO3 capsules can be measured indirectly by subtract-ing the energy stored into the other components – cham-ber, insulation and heat losses, from the total energyfrom the HTF, as described below in Eq. (1).
QCapsulesðtÞ ¼ Qf ðtÞ � ½QcðtÞ þ QiðtÞ þ QlðtÞ� ð1Þ
where t indicates the time; Qf is the total energyexchanged between the TES system and the HTF; Qc
is the energy stored in the chamber of the TES system;Qi is the energy stored in the insulation; and Ql is theheat losses to the ambient at the outside surface of theinsulation. And each of the energy term in the right-handside of the Eq. (1) can be explored further as below formeasurements:

Fig. 1. The test facility with EPCM based TES system for process demonstration. (a) Schematic of the general test loop (without insulation); (b) a photoof the encapsulated NaNO3 capsules in the test section.
184 Y. Zheng et al. / Solar Energy 115 (2015) 180–194
Qf ðtÞ ¼Z t
t0
_mf ðtÞCp;f ðT f ;inðtÞ � T f ;outðtÞÞdt;
QcðtÞ ¼X
j
mc;jCp;cðT c;t � T c;t0Þ ð2Þ
QiðtÞ ¼X
j
mi;jCp;iðT i;t � T i;t0Þ and
QlðtÞ ¼X
j
Z t
t0
_Ql;jðtÞ � Al;jdt
With known thermal properties of the air, T/S chamberand insulation (Incropera and DeWitt, 2001; Zheng,2015) the amount of energy captured by the components– HTF, T/S chamber, insulation and heat losses can bedetermined through measuring the other parameters inthe Eq. (2), and further determine the total energy storageand retrieval of the NaNO3 capsules by using Eq. (1).
For the total energy exchanged between the HTF andthe TES system, the mass flow rates of the HTF _mf ðtÞare calculated with the measurements of its volumetric flowrate (m3/s) before the heater with temperature and pressurecompensations, as shown in Fig. 1. Thermocouples withaspirating subsystem are specially designed to measurethe high temperature air flow at the inlet and at the outletof the TES system. This aspirating subsystem consists of astainless steel tube to cover the air thermocouple, and apump to aspirate a specific amount of air out of the TESsystem. With delicate calculations and designs, the aspirat-ing subsystem is effective to minimize the errors in measur-ing the high temperature air due to the radiation loss ofthermocouples tips to the chamber surface, and it is expect-ed to have the total energy of the HTF measured within±2% errors with error analysis. Though about 20% ofthe energy from the air is lost through the insulation in

Y. Zheng et al. / Solar Energy 115 (2015) 180–194 185
the experiment, T/Cs are located in 9 groups at selectedlocations and 7 depths of the insulation to establish heattransfer through the insulation, and 12 heat flux metersare located in 3 groups at selected locations to determinethe heat losses at the surface of the insulation. It has beenfound that the energy storage and retrieval of the EPCMcapsules can be measured within 5% errors with the mea-surement facilities, of which the details are discussed inthe validation tests.
3. A mathematical model for the EPCM based TES system
For the numerical model, the overall height of the testsection is denoted as Z [m]. The total length of test sectionis divided into N equal cells, where N equals the number ofthe EPCM capsules, and each cell contained one capsule.For each cell, energy balances are calculated for each com-ponent of the test section, i.e. HTF, EPCM capsules, T/Schamber, insulation and heat losses from the outside sur-face of the insulation, to investigate the transient heattransfer process during thermal charging and dischargingcycles. Furthermore, the capsule and the PCM inside areradially divided to small meshes in order to calculate radialtemperature variation as shown in Fig. 2(b). When thePCM inside the capsule reaches melting temperature, it isallowed to melt or solidify by adding the latent heat. Asa result at any given time the capsule has three different lay-ers: the solid shell, liquid PCM and a solid PCM. For sim-plicity of calculations, it is assumed that the solid PCMstays at the center of the capsule and there is no naturalconvection in the liquid PCM layer.
The heat conduction is assumed to be in the radial direc-tion only, that is the temperature of the PCM, and the tem-perature of the shell is the function of time and radiallocation only as described by
qPCMCp;PCM@T PCM=@t¼ kPCM=rPCM½@ðrPCM@T PCM=@rPCMÞ=@rPCM�ð3Þ
qsCp;s@T s=@t ¼ ks=rs½@ðrs@T s=@rsÞ=@rs� ð4Þ
While Eq. (3) only accounts for the heat conduction insidethe PCM in its single phase, the energy balance in the
Fig. 2. The details of the model for an EPCM capsule in a specific elevatiotemperature is dependent on the radial location r and time t in this model; (c)
interface between two phases is analyzed when the tem-perature of the PCM reaches its melting point as describedby
qPCMDHPCMLCapsule � p½ðSPCMðtÞÞ2
� ðSPCMðt � DtÞÞ2�=Dt
¼ ðkPCMAPCM@T PCM=@rPCMÞrPCM¼SPCM�DrPCM;solid
� ðkPCMAPCM@T PCM=@rPCMÞrPCM¼SPCMþDrPCM;liquid ð5Þ
In this equation, SPCM is the distance of the interface (mov-ing front) from the inside surface of the shell, as sketched inFig. 2(c). It can be used as an indicator for the progress ofthe phase change – when its value is zero, it means that thePCM is 100% in single phase; when its value is equal to theradius of the PCM, it means that the PCM has completedthe phase change. And the value of the displacement of themelting front can also be used to calculate the percentageof the molten fraction, and further decide the contributionof the phase change in the overall energy stored into andretrieved from the EPCM. As indicated in Fig. 2, the cap-sule is considered to be filled with the PCM having uniformdensity. Since the real capsule has a specific void space inthe capsule as an allowance for PCM’s thermal expansion,the density is adjusted accordingly in this model to ensure aconstant mass. The density is assumed to be independent ofthe temperature, therefore during the phase change thesolid PCM would stay in the center when liquid phaseforms on the outside as shown in Fig. 2(c).
For the heat transfer fluid flowing across a specific zoneof Dz, part of the total energy from the HTF is transferredto the capsule and T/S chamber by convection, while theother part is captured by the HTF itself in this section asdescribed by
qf Cp;f@T f =@t ¼ Gf Cp;f@T f =@z� ½hsAsðT f � T sÞ�rs¼Rs
� ½hcAcðT f � T cÞ�xc¼0 ð6Þ
The convective heat transfer coefficient from the HTF tothe surface of the capsule is calculated using Zhukauskascorrelation (Zhukauskas, 1972) for the circular cylindricalin cross flow with the assumption that it is independentof the angular coordinate h and length direction l. And
n. (a) Temperature of PCM is a function of (r, h, l, t) (front view); (b)melting front inside the PCM during its phase change.

186 Y. Zheng et al. / Solar Energy 115 (2015) 180–194
the average convective heat transfer coefficient from theHTF to the surface of the T/S chamber is also calculatedusing Zhukauskas correlation considering that with thecurrent design, the flow of HTF at the surface of the T/Schamber is similar to the flow of HTF at the surface ofthe EPCM capsule. It is found that the effects of radiationis negligible with less than 2% of the convective heat trans-fer power according to calculation for current facilitydesign.
One-dimensional model is applied for the inside heatconduction for the T/S chamber and insulation.Including a changing surface area for heat conduction fromthe inside surface of chamber to the outside surface of theinsulation the energy equations are described by
ðqcCp;c@T c=@tÞxc¼ ðkcAc@T c=@xcÞxc�Dxc
� ðkcAc@T c=@xcÞxcþDxcð7Þ
ðqiCp;i@T i=@tÞxi¼ ðkiAi@T i=@xiÞxi�Dxi
� ðkiAi@T i=@xiÞxiþDxið8Þ
At outside surface of insulation, natural convection is con-sidered for the heat loss to the ambient with the heat trans-fer coefficient calculated using Churchill and Chucorrelation (Churchill and Chu, 1975)
ðqiCp;i@T i=@tÞxi¼di¼ ðkiAi@T i=@xiÞdi�Dxi
� ½haAiðT i � T aÞ�xi¼dið9Þ
Finite difference method has been used to discretize Eqs.(7)–(9). The temperature profiles for each of the component– EPCM, HTF, T/S chamber and insulation can beobtained to determine the dynamic nature of the TESsystem. Especially for the EPCM capsules, it is of great val-ue to further calculate their energy storage and retrievalduring the thermal charging and discharging cycles. Theresults of the simulations will be compared against theexperimental data.
4. Results
4.1. Validation
As described previously, the energy storage and retrievalof the NaNO3 capsules can be determined from measureddata. The question followed is how reliable are thosefacilities for measuring the energy change of the EPCMcapsules using this methodology. To address this question,measurements have been conducted using solid copper cap-sules. The copper capsules are fabricated with the samedimensions and designs as EPCM capsules. There is a ther-mocouple well in the center of the capsule with a depth ofthe capsule radius for each of the copper capsule. Duringthe thermal tests, a thermocouple is inserted into the endof the well to measure the center temperature of the coppercapsule. Through simulations, it has been found that thetemperature variation is smaller than 0.1 �C in every
capsule with current operating conditions and capsulesizes. Therefore, the center temperature is well representa-tive of the average temperature of the copper for eachcapsule.
With known thermal properties of copper (Incroperaand DeWitt, 2001), the energy stored in the copper capsulesQCopper(t) can be determined by using measured tem-perature as
QCopperðtÞ ¼X
mcCp;cðT c;t � T c;t0Þ ð10Þ
The energy stored in the copper capsules can also be deter-mined from the energy balance described in Eqs. (1) and(2). Examining the difference in the energy storage deter-mined by these two approaches can help validating theexperimental techniques utilized here. The thermalresponses for each of the components in the test sectionhave been recorded, as shown in Fig. 3 for the key informa-tion in a typical charging process. It is seen that the inletair, with a mass flow rate of 0.038 kg/s, have been wellmaintained at high temperature 440 �C after a short tran-sient process due to the preheating of the piping and insu-lation between the furnace and TES system. Thetemperature drop of the air across the system, that is, thetemperature difference between the inlet air and outletair, decreases with the time when the test section is beingthermally charged. The #1 copper capsule near the inlethas been heated up quickly and its temperature is closeto the inlet air temperature within one hour. Comparedwith the #1 copper capsule, the #10 copper capsule locatednear the outlet is heated up slower since the air flow is cool-er on the outside surface of the capsule in the lower section.At the end of the testing, the temperatures of the ten cop-per capsules are in the range of �360 �C to 425 �C, andwith about 65 �C temperature difference between the cap-sules near the inlet and near the outlet. Besides the tem-perature history of the copper capsules and air flow,Fig. 3(c) also shows an example for a group of insulationtemperature from the outside surface of the T/S chamberto the outside surface of the insulation at the midway ofthe test section. It is seen that the temperatures of the insu-lation increase following the similar trend as the coppercapsule’s, with the surface of the chamber at �380 �Cand the outside surface of the insulation slightly higherthan room temperature at the end of this charging process.For the heat flux at the outside surface of the insulation, itis seen that it increases from �+2 W/m2 to �+12 W/m2,see Fig. 3(d). The positive sign means that the heat lossesare from the insulation surface to the ambient.
The air mass flow rates, and its temperature dropsacross the test section are integrated over the time to calcu-late the total energy from the air as indicated in Eq. (2).The temperatures at the outside surface of chamber areused to calculate the energy captured by the test sectionitself, with the assumption of a linear temperature changealong the elevation direction. The energy residue in eachlayer of the insulation has been calculated with the

0 0.2 0.4 0.6 0.8 1 1.20.02
0.03
0.04
0.05
Time (hr)
(a)
Air
Flow
rate
(kg/
s)
0 0.2 0.4 0.6 0.8 1 1.20
100
200
300
400450
Time (hr)
(b)
Tem
pera
ture
(o C
)0 0.2 0.4 0.6 0.8 1 1.2
0
100
200
300
400
Time (hr)
(c)
Tem
pera
ture
(o C
)
Chamber Surfacex=1"x=2"x=3.5"x=5"InsulationOutside Surface
0 0.5 10
5
10
15
Time (hr)
(d)
Hea
t Flu
x (W
/m2 )
#1 Copper#10 CopperInlet AirOutlet Air
Fig. 3. Key information for a verification test with copper capsules in a typical charging process. (a) Mass flow rate of HTF – air; (b) temperature historyof the copper capsules and air; (c) insulation temperatures from chamber surface to outside surface at midway of the test section; (d) heat flux on theoutside surface of the insulation at the midway of the storage system.
0 0.2 0.4 0.6 0.8 1 1.20
2
4
6
8
10
12
14
16
18
20
22
Time (hr)
(a)
Ener
gy (M
J)
0 0.2 0.4 0.6 0.8 1 1.20
2
4
6
8
10
12
14
16
18
20
22
Time (hr)
(b)
Ener
gy S
tore
d in
Cop
per C
apsu
les (
MJ)
HTF - AirCopper CapsulesChamberInsulationHeat Losses
Calcuated with TemperatureMeassurement of CopperCalcuated by Energy Balance
Fig. 4. Energy storage of the TES system in a charging test. (a) Energy storage by every component from measurements. (b) Energy stored in coppercapsules calculated in two ways.
Y. Zheng et al. / Solar Energy 115 (2015) 180–194 187
188 Y. Zheng et al. / Solar Energy 115 (2015) 180–194
assumptions of linear temperature change between themeasurements of the two layers and along the elevationsdirections. The heat losses at the outside surface are calcu-lated by integrating the heat flux over the experimentaltime for a certain surface area with the assumption that auniform heat flux (W/m2) in this area. The total energyfrom the air, the energy stored in the chamber and insula-tion, and the heat losses are shown in Fig. 4(a) in the charg-ing test with copper capsules. From this figure, it is seenthat at the end of the experiment, there is �22 MJ energytransferred from the air to the overall test section, of which�20% is stored into the chamber and insulation, and a neg-ligible part is the heat losses to the ambient.
The total energy stored in the copper capsules that is cal-culated with the measurements of the copper temperaturesis shown by purple solid squares in Fig. 4(a) and (b). Thestored energy that is calculated by the energy balance isdenoted by the blue1 crosses in Fig. 4(b). It is seen thatthe energy measurements of the copper capsules from thesetwo methods are in a very good agreement, with a �1% dis-crepancy at the end of this charging test. The verificationtests have been carefully conducted by testing the coppercapsules in multiple thermal cycles. The total energy storedin the charging process, and the total energy extracted inthe discharging process have been analyzed for the testedcopper capsules in different temperature ranges as tabulat-ed in Table 1. The energy change of the copper capsulesthat is calculated by two methods is listed in Table 1. Itis seen that the difference are within ±5% in various testranges, which is leading confidence to the experimentalmethod and measurements in determination of the energystorage of the capsules in the test section.
4.2. Performance tests of the NaNO3 capsules in thermal
cycles
The thermal energy storage and retrieval of the NaNO3
capsules are analyzed to demonstrate the viability of thestorage technology for thermal energy using encapsulatedphase change materials. As described previously, the ener-gy stored in the NaNO3 capsules is calculated by the energybalance with all the verified measurement facilities.Meanwhile it is also essential to monitor the thermalbehavior of the NaNO3 in the charging and dischargingprocess, therefore a thermocouple is placed in the last cap-sule to track the temperature of the NaNO3 near the outletof the test section. As indicated in Fig. 5, this thermocouplemeasures the temperature of the NaNO3 at the very bottomof the capsule, where the temperature indicates the possiblelowest temperature of the NaNO3 in a charging process,and the higher temperature in a cooling process in the cur-rent test section. Choosing this measurement point and thislength of the TC well is also based on the consideration to
1 For interpretation of color in Figs. 4 and 12, the reader is referred tothe web version of this article.
avoid the break-down of the TC well from the hanging ofthe solid NaNO3 when liquid phase NaNO3 is formed fromoutside shell of the capsule.
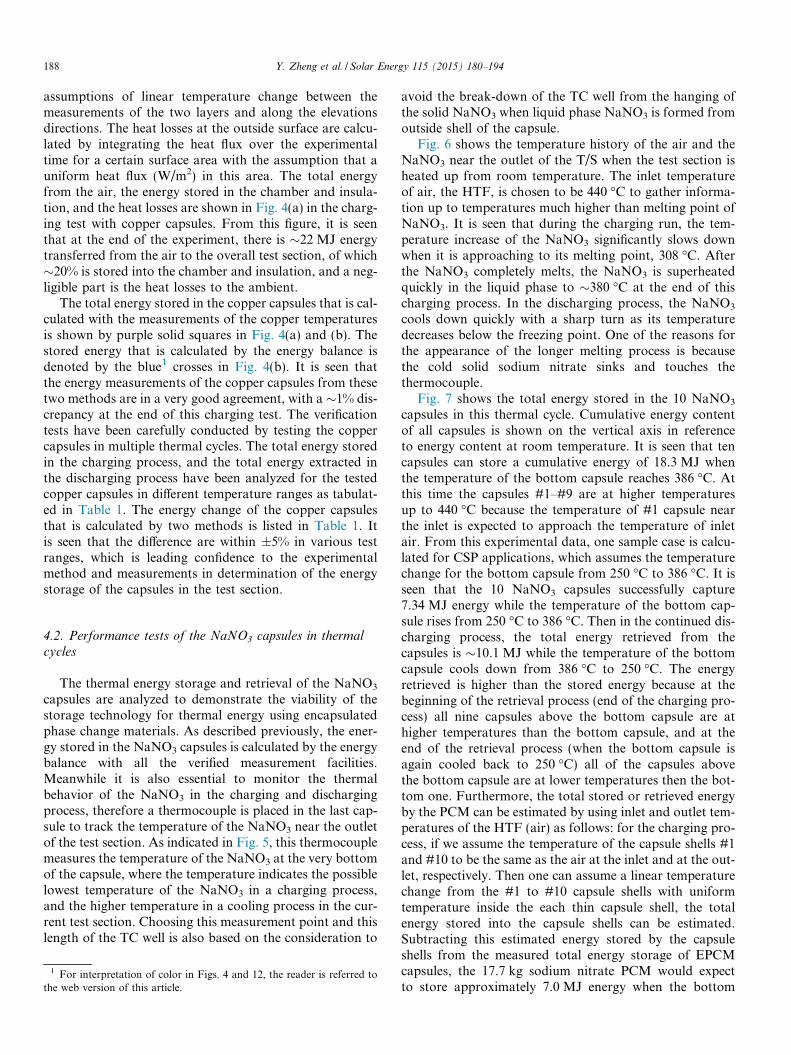
Fig. 6 shows the temperature history of the air and theNaNO3 near the outlet of the T/S when the test section isheated up from room temperature. The inlet temperatureof air, the HTF, is chosen to be 440 �C to gather informa-tion up to temperatures much higher than melting point ofNaNO3. It is seen that during the charging run, the tem-perature increase of the NaNO3 significantly slows downwhen it is approaching to its melting point, 308 �C. Afterthe NaNO3 completely melts, the NaNO3 is superheatedquickly in the liquid phase to �380 �C at the end of thischarging process. In the discharging process, the NaNO3
cools down quickly with a sharp turn as its temperaturedecreases below the freezing point. One of the reasons forthe appearance of the longer melting process is becausethe cold solid sodium nitrate sinks and touches thethermocouple.
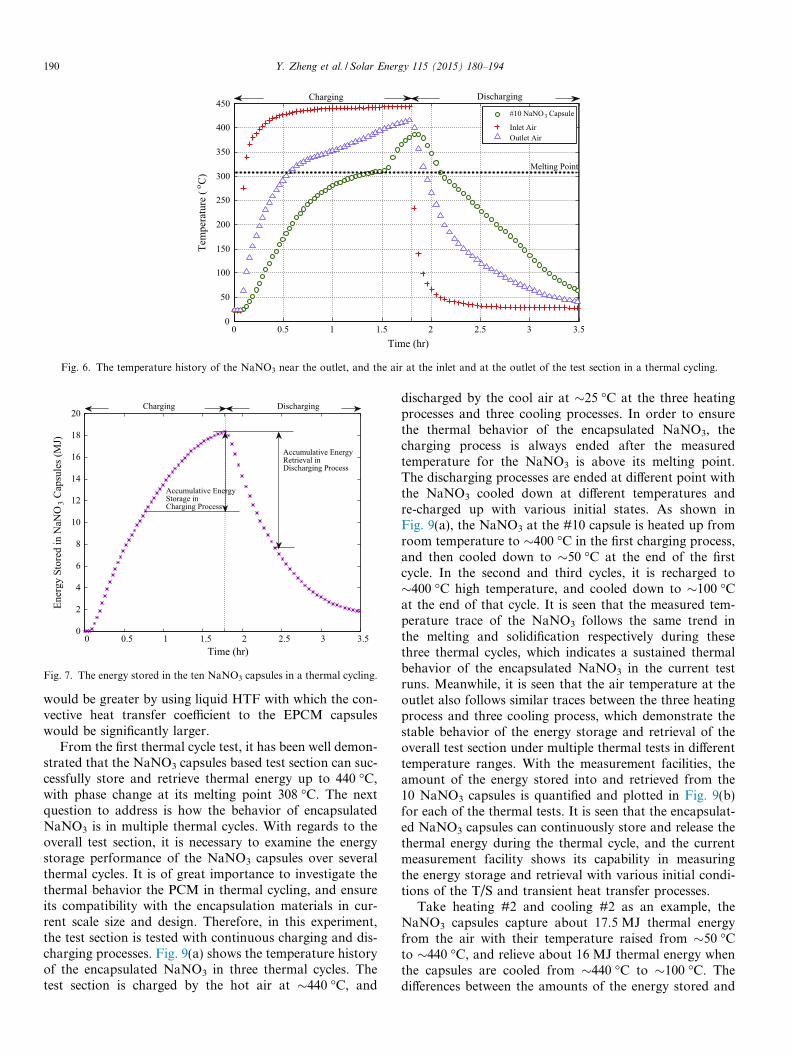
Fig. 7 shows the total energy stored in the 10 NaNO3
capsules in this thermal cycle. Cumulative energy contentof all capsules is shown on the vertical axis in referenceto energy content at room temperature. It is seen that tencapsules can store a cumulative energy of 18.3 MJ whenthe temperature of the bottom capsule reaches 386 �C. Atthis time the capsules #1–#9 are at higher temperaturesup to 440 �C because the temperature of #1 capsule nearthe inlet is expected to approach the temperature of inletair. From this experimental data, one sample case is calcu-lated for CSP applications, which assumes the temperaturechange for the bottom capsule from 250 �C to 386 �C. It isseen that the 10 NaNO3 capsules successfully capture7.34 MJ energy while the temperature of the bottom cap-sule rises from 250 �C to 386 �C. Then in the continued dis-charging process, the total energy retrieved from thecapsules is �10.1 MJ while the temperature of the bottomcapsule cools down from 386 �C to 250 �C. The energyretrieved is higher than the stored energy because at thebeginning of the retrieval process (end of the charging pro-cess) all nine capsules above the bottom capsule are athigher temperatures than the bottom capsule, and at theend of the retrieval process (when the bottom capsule isagain cooled back to 250 �C) all of the capsules abovethe bottom capsule are at lower temperatures then the bot-tom one. Furthermore, the total stored or retrieved energyby the PCM can be estimated by using inlet and outlet tem-peratures of the HTF (air) as follows: for the charging pro-cess, if we assume the temperature of the capsule shells #1and #10 to be the same as the air at the inlet and at the out-let, respectively. Then one can assume a linear temperaturechange from the #1 to #10 capsule shells with uniformtemperature inside the each thin capsule shell, the totalenergy stored into the capsule shells can be estimated.Subtracting this estimated energy stored by the capsuleshells from the measured total energy storage of EPCMcapsules, the 17.7 kg sodium nitrate PCM would expectto store approximately 7.0 MJ energy when the bottom

Table 1Measurements of energy storage and retrieval in the verification tests with multiple thermal cycles.
Verification test Temperature range of copper capsules(�C)
Energy stored in/retrieved from the copper capsules (MJ) Difference percentage(%)Calc. by energy
balanceCalc. by copper temperaturechange
Heating #1 27–425 16.54 16.38 1.0Cooling #2 425–65 13.37 13.26 0.8Heating #3 65–421 13.05 12.82 1.8Cooling #4 421–148 8.34 8.16 2.2Heating #5 148–421 9.04 8.62 4.9Cooling #6 421–53 14.25 14.05 1.4Heating #7 281–431 9.67 9.83 �1.6Cooling #8 431–47 15.82 15.79 0.2Heating #9 47–426 15.19 15.24 �0.3
Y. Zheng et al. / Solar Energy 115 (2015) 180–194 189
#10 capsule is heated from 250 �C to 386 �C, that is, anaverage of �395 kJ energy stored in per unit mass of theencapsulated NaNO3. With the measurement facilities,the ten NaNO3 capsules are found to store �211 kJ perkg of the capsules, of which the latent heat contributes tomore than 42% of the total energy stored in the capsules.The storage capacity [kJ/kg] of encapsulated NaNO3 isexpected to be even higher with a larger capsule or largerscale test section without the penalties associated with cur-rent limited test facility.
The storage capacity [kJ/kg] of encapsulated NaNO3 isexpected to be even higher with a larger capsule or largerscale test section without the penalties associated with cur-rent limited test facility.
Besides the storage capacity of the EPCM capsules, therate of energy storage and removal is another key para-meter for evaluation of the storage performance EPCMcapsules. The rate of storage is related to: the thermal prop-erties of the storage materials, the heat transfer rates fromthe HTF to the capsules, the properties of the heat transferfluid, and EPCM capsules and capsules’ geometry. In theexperiment, the rate of the energy storage and removal isobtained by calculating the derivative of the energy storedin the NaNO3 capsules over the time of thermal testing,which are shown in Fig. 8.
As shown in Fig. 8, the rate of the energy storageincreases quickly first and reaches to a maximum of
Fig. 5. The thermocouple location in the #10 NaN
6 kW, and then slows down and decreases to �1 kW atthe end of the charging process when the most of test sec-tion is cooled down to room temperature. In the discharg-ing process, since the energy left in the capsules decreasesthe rate of the energy storage for the capsules is negative,as depicted in Fig. 8. It is seen that the absolute value ofthe rate of the energy storage in the cooling process has asimilar trend. Within the temperature range of interestfor NaNO3 at �250 �C to 440 �C shown previously inFig. 6, it is seen that the rate of energy storage slowlydecreases from 3.4 kW to 0.8 kW with the NaNO3 cameacross its phase change in the charging process. In the dis-charging process, the absolute value of energy removaldecreases from its maximum �6 kW to �3.6 kW in the dis-charging process as the temperature of #10 NaNO3 dropsto 250 �C. In this figure, it is also shown that the maximumof the rate of the energy storage or removal does not occurat the very beginning of the process. The maximum tem-perature difference between the air and the capsules occursafter the transient as the air temperature settles. With thecurrent test facility, the average of the energy storage andremoval is about 2 kW, which corresponding to a �50 �Ctemperature difference between the air and capsules withthe capsules surface area �1 m2 and an estimated 40W/m2 �C for the convective heat transfer coefficient. Ithas been expected based on the simulation work (Zheng,2015) that the rate of the energy storage and removal
O3 (not at scale). (a) Side view; (b) front view.
0 0.5 1 1.5 2 2.5 3 3.50
50
100
150
200
250
300
350
400
450
Time (hr)
Tem
pera
ture
(o C
)
#10 NaNO3 Capsule
Inlet AirOutlet Air
Charging Discharging
Melting Point
Fig. 6. The temperature history of the NaNO3 near the outlet, and the air at the inlet and at the outlet of the test section in a thermal cycling.
0 0.5 1 1.5 2 2.5 3 3.50
2
4
6
8
10
12
14
16
18
20
Time (hr)
Ener
gy S
tore
d in
NaN
O3 C
apsu
les (
MJ)
Charging Discharging
Accumulative Energy Retrieval in Discharging Process
Accumulative EnergyStorage in Charging Process
Fig. 7. The energy stored in the ten NaNO3 capsules in a thermal cycling.
190 Y. Zheng et al. / Solar Energy 115 (2015) 180–194
would be greater by using liquid HTF with which the con-vective heat transfer coefficient to the EPCM capsuleswould be significantly larger.
From the first thermal cycle test, it has been well demon-strated that the NaNO3 capsules based test section can suc-cessfully store and retrieve thermal energy up to 440 �C,with phase change at its melting point 308 �C. The nextquestion to address is how the behavior of encapsulatedNaNO3 is in multiple thermal cycles. With regards to theoverall test section, it is necessary to examine the energystorage performance of the NaNO3 capsules over severalthermal cycles. It is of great importance to investigate thethermal behavior the PCM in thermal cycling, and ensureits compatibility with the encapsulation materials in cur-rent scale size and design. Therefore, in this experiment,the test section is tested with continuous charging and dis-charging processes. Fig. 9(a) shows the temperature historyof the encapsulated NaNO3 in three thermal cycles. Thetest section is charged by the hot air at �440 �C, and
discharged by the cool air at �25 �C at the three heatingprocesses and three cooling processes. In order to ensurethe thermal behavior of the encapsulated NaNO3, thecharging process is always ended after the measuredtemperature for the NaNO3 is above its melting point.The discharging processes are ended at different point withthe NaNO3 cooled down at different temperatures andre-charged up with various initial states. As shown inFig. 9(a), the NaNO3 at the #10 capsule is heated up fromroom temperature to �400 �C in the first charging process,and then cooled down to �50 �C at the end of the firstcycle. In the second and third cycles, it is recharged to�400 �C high temperature, and cooled down to �100 �Cat the end of that cycle. It is seen that the measured tem-perature trace of the NaNO3 follows the same trend inthe melting and solidification respectively during thesethree thermal cycles, which indicates a sustained thermalbehavior of the encapsulated NaNO3 in the current testruns. Meanwhile, it is seen that the air temperature at theoutlet also follows similar traces between the three heatingprocess and three cooling process, which demonstrate thestable behavior of the energy storage and retrieval of theoverall test section under multiple thermal tests in differenttemperature ranges. With the measurement facilities, theamount of the energy stored into and retrieved from the10 NaNO3 capsules is quantified and plotted in Fig. 9(b)for each of the thermal tests. It is seen that the encapsulat-ed NaNO3 capsules can continuously store and release thethermal energy during the thermal cycle, and the currentmeasurement facility shows its capability in measuringthe energy storage and retrieval with various initial condi-tions of the T/S and transient heat transfer processes.
Take heating #2 and cooling #2 as an example, theNaNO3 capsules capture about 17.5 MJ thermal energyfrom the air with their temperature raised from �50 �Cto �440 �C, and relieve about 16 MJ thermal energy whenthe capsules are cooled from �440 �C to �100 �C. Thedifferences between the amounts of the energy stored and

0 0.5 1 1.5 2 2.5 3 3.5-8
-6
-4
-2
0
2
4
6
8
Time (hr)
The
Rat
e of
Ene
rgy
Stor
age
or R
emov
al
for t
he N
aNO
3 Cap
sule
s (kW
)Charging Discharging
Fig. 8. The rates of energy storage and retrieval of the 10 NaNO3 capsulesin current test facility in a typical thermal charging and discharging cycle.
Y. Zheng et al. / Solar Energy 115 (2015) 180–194 191
retrieved are from the operating temperature change andthe progress of the phase change in the 10 NaNO3 capsules.Comparison of the cooling process in previous thermalcycle and the heat process in current thermal cycle, forexample cooling #2 and heating #3, through the measuredNaNO3 temperature shows that it is running at a quiteclose temperature range. The energy stored into thecapsules is slightly higher than the energy extracted fromthe capsules, which might due to a more uniform tem-perature distribution in each capsule with the progress ofthe continuous thermal cycles. In that case, the averagetemperature in each capsule at the end of the heating #3would be higher than the one at the end of the heating#2 (the beginning of the cooling #3).
This test section with 10 encapsulated NaNO3 has beentested four times in 45 days with �10 h of thermal cyclesevery time as shown in Fig. 9. After the 45 days, a chargingtest is conducted with the same operating conditions (inletair temperature and mass flow of the air) as its first charg-ing process for the NaNO3 capsules as shown in Fig. 10(a),to repeat the experiment and investigate whether or not theenergy storage is sustained after the NaNO3 is encapsulat-ed in the stainless steel capsule for 45 days and subject tooccasional thermal test with �40 h in thermal chargingand discharging. In Fig. 10, it has been found that the tem-perature trace and the energy storage performance of theNaNO3 capsules are consistent with ones in first chargingtest. And for the energy stored in the 10 NaNO3 capsules,the discrepancy between the two tests is �2.5% within theaccuracy of the measurements in current test facility. Itcan be concluded that the encapsulated NaNO3 capsuleshave sustained storage performance without the deteriora-tion in their storage performance in current test range.
4.3. Comparison of the experimental data with predicted
results for NaNO3 tests
Simulations have been conducted for charging and dis-charging processes with NaNO3 capsules. This is aimedto compare the experimental data with the simulation
results, to investigate the capability of the model, and toimprove performance the model if necessary for more accu-rate predictions. The mathematical model is also used toinvestigate the dynamics of the EPCM in the T/S duringthermal cycles.
The model uses the measured mass flow rates of the airand the temperature of the air at the inlet as inputs. Thetemperature profiles of the NaNO3 and insulation at var-ious locations and the air temperature at the outlet arepredicted.
Fig. 11 shows the predicted and measured air tem-perature and the temperature of NaNO3 in a typical ther-mal cycle. For the temperature of NaNO3 at the specificmeasurement point, there is a very good agreementbetween the experimental data and simulation resultsbefore the melting point of the NaNO3 in the chargingprocess, but a considerable difference is shown as the tem-perature is approaching the melting point. This difference isreasonable considering that in the experiment, thermocou-ple contacts with the colder solid NaNO3 which is sinkingto the TC location as PCM melts. The model makes theunrealistic but computationally efficient and practicalassumption that the solid NaNO3 stays in the center with-out sinking. Therefore, the simulation shows higher valuesthan the experimental measurements when the melting pro-cess starts.
This is confirmed with the temperature profiles at otherradial locations in the #10 NaNO3 capsule predicted by themodel, as shown in Fig. 12. The red dash line shows thetemperature history of the NaNO3 at the inside surfaceof the capsule r = RPCM. It is seen that the deviationbetween the experiment measurements and simulationresults for the measurement points appears at the time oft = t1 when the NaNO3 at the r = RPCM starts melting;while with the liquid NaNO3 formed at this time fromthe outside shell, the solid NaNO3 sink to the bottom inthe realistic operating system, therefore a lower tem-perature is sensed in the experiment. At the end of thecharging process t = t2, the measured temperature for theNaNO3 agrees with the predicted temperature at the insidesurface of the capsule. This implies that a well-mixedNaNO3 bulk is present during the melting process due tothe natural convection.
The temperature of the air at the outlet has been wellpredicted at the beginning of the charging process whenthe NaNO3 is in its solid phase, as shown in Fig. 11. Themodel overestimates the outlet temperature as NaNO3
approaches the melting point. In other words, the tem-perature drop of the air across the T/S is slightly underes-timated during this time. This may be due to theassumption of no natural convection in the liquid phaseof the NaNO3. For the discharging process with the solidNaNO3 solidified from the surface of the capsule, it is seenthat the outlet air temperature and the measured NaNO3
temperature have been both well predicted by the model.When summing up the energy stored in the each single
capsule, the total energy stored in the 10 NaNO3 capsules

0 1 2 3 4 5 6 7 8 9 10050
100150200250300350400450
Time (hr) (a)
Tem
pera
ture
( o C
)
0 1 2 3 4 5 6 7 8 9 100
4
8
12
16
20
Time (hr)(b)
Ener
gy S
tora
ge a
nd R
etrie
val
of N
aNO
3 Cap
sule
s (M
J)
Heating #2 Heating #3Cooling #2 Cooling #3Cooling #1Heating #1
Storage inHeating #2
Storage inHeating #3
Storage in Heating #1
NaNO3
Outlet Air
Inlet Air
Retrieval in Cooling #1
Retrieval in Cooling #2
Retrieval in Cooling #3
Fig. 9. Test of the NaNO3 capsules in three continuous thermal charging and discharging processes. (a) Temperature history of the #10 NaNO3 and air;(b) energy storage and retrieval of the encapsulated sodium nitrate capsules.
0 0.5 1 1.5 20
50
100
150
200
250
300
350
400
450
Time (hr)
(a)
Tem
pera
ture
(o C)
0 0.5 1 1.5 20
2
4
6
8
10
12
14
16
18
20
Time (hr)
(b)
Ener
gy S
tore
d in
NaN
O3 C
apsu
les (
MJ)
Repeated Test - NaNO 3
Repeated Test - Inlet AirFirst Test - NaNO3
Fist Test - Inlet AirRepeated Test after 45 DaysFirst Test
Fig. 10. Storage performance of the NaNO3 capsules with the same operating conditions as the first charging process after 45 days. (a) Temperatureprofiles of the NaNO3 and inlet air; (b) energy stored in the 10 NaNO3 capsules.
192 Y. Zheng et al. / Solar Energy 115 (2015) 180–194
can be obtained, as shown in Fig. 13. It is seen that theexperimental measurements for the energy stored inNaNO3 capsules have been well predicted at the beginningof the charging, when the NaNO3 is mostly in solid phase.The difference appears especially after time = �0.8 h whenthe encapsulated NaNO3 are undergoing melting process.
At the end of the charging process, the difference betweenthe prediction and experimental measurement isapproximately 7% for the energy stored in the 10 NaNO3
capsules. As discussed previously, one of the reasons forthe discrepancy is that the model neglects the natural con-vection and the sinking of the solid. It has been reported

0 0.5 1 1.5 2 2.5 3 3.50
50
100
150
200
250
300
350
400
450
Time (hr)
Tem
pera
ture
(o C)
Sim. - NaNO3
Sim. - Inlet AirSim. - Outlet AirExp. - NaNO3
Exp. - Inlet AirExp. - Outlet Air
t = t3t = t1 t = t2
m.p.
Fig. 11. The temperature of NaNO3 and air temperature in a typicalcharging and discharging process.
0 0.5 1 1.5 2 2.5 3 3.50
50
100
150
200
250
300
350
400
Time (hr)
NaN
O3 T
empe
ratu
re (o C
)
Sim. - r = RPCM
Sim. - r = RTC
Sim. - r = 0Exp. - r = RTC
t = t1 t = t2 t = t3
m.p.
Fig. 12. The temperature of NaNO3 in various radial locations in #10capsule.
0 0.5 1 1.5 2 2.5 3 3.50
2
4
6
8
10
12
14
16
18
20
Time (hr)
Ener
gy S
tore
d in
the
10 N
aNO
3 Cap
sule
s (M
J)
Simulation Experiment
t0 : the #1NaNO3 starts to melt
tc : the end of chargingprocess
Fig. 13. The energy stored in the 10 NaNO3 capsules in a thermal cycle.
Y. Zheng et al. / Solar Energy 115 (2015) 180–194 193
that for a single encapsulated NaNO3 capsule heating upby the 400 �C air, the time for the phase change would beshortened by �10% if the gravity and natural convectionis considered (Zhao, 2013). But our case is more complicat-ed with multiple EPCM capsules with the air flowing at dif-ferent temperatures along the T/S. The present authors areexploring the effects of gravity and the natural convectionson the performance of the EPCMs.
5. Conclusions and summary
In this research, a pilot-scale test section is designed andbuilt to demonstrate latent heat based thermal energy stor-age using EPCM in the temperature range of 250–386 �Cfor the bottom capsule. NaNO3 is selected as the storagemedium and is encapsulated in stainless steel. Multipleencapsulated NaNO3 capsules are installed in the test sec-tion for the demonstrations of the energy storage andretrieval with phase change in thermal cycles. The test sec-tion is initially qualified using solid copper capsules andthen loaded with encapsulated NaNO3 capsules for perfor-mance test. A numerical model is developed to investigatethe dynamic performance of the charging and dischargingof the test section with phase change in the NaNO3 capsule.
The experimental and the numerical investigations indi-cate that: (1) the test section with NaNO3 capsules success-fully demonstrated its ability to transfer thermal energy toand from a transport fluid, achieving energy storage andretrieval in multiple charging and discharging cycles. (2)In a given storage – retrieval cycle where the bottom cap-sule temperature varied from �250 �C to �386 �C, the testsection has been found to store significant amounts of ther-mal energy in the EPCM capsules (�211 kJ/kg), with theNaNO3 material (PCM) accounting for �95% of the ener-gy stored in the capsules. The latent heat of phase changeof the NaNO3 contributed significantly to �42% of theenergy stored in the capsules, providing high storage densi-ty. (3) A thermal energy storage test has been conductedafter the NaNO3 capsules have been tested �40 h in45 days. It has been found that the encapsulated NaNO3
capsules have sustained storage performance without dete-rioration in their storage capacity. (4) The results of thenumerical simulations of the energy storage are found toagree with experimental measurements within 7%. Thedynamic performance of charging and discharging rateswere also well predicted by the model, giving confidencefor engineering design capabilities in future applicationsusing encapsulated phase change materials for energy stor-age. Further research work in this area could include theeffects of multiple PCMs, the fluid temperature swingsand the importance of gravity and natural convection inlarge EPCM based thermoclines.
Acknowledgements
We thank Matthew Bernstein, John Caffrey, Paul N.Bader and William Maroun for their help during the

194 Y. Zheng et al. / Solar Energy 115 (2015) 180–194
fabrication of the test facility. We gratefully acknowledgethe support extended by U.S. DOE per award DE-FG36-08GO18050 for the present work.
References
Bauer, T., Laing, D., Kroner, U., Tamme, R., 2009. Sodium nitrate forhigh temperature latent heat storage. In: The 11th InternationalConference on Thermal Energy Storage - Effstock, 14–17 June 2009,Stockholm, Sweden.
Blaney, J.J., Neti, S., Misiolek, W.Z., Oztekin, A., 2013. Containmentcapsule stresses for encapsulated phase change materials. Appl. Therm.Eng. 50, 555–561.
Churchill, S.W., Chu, H.H.S., 1975. Correlating equations for laminarand turbulent free convection from a vertical plate. Int. J. Heat MassTransf. 18, 1323–1329.
Dinter, F., Geyer, M.A., Tamme, R., 1991. Thermal Energy Storage forCommercial Applications: A Feasibility Study on Economic StorageSystems, first ed. Springer-Verlag Berlin Heidelberg.
Dunn, R.I., Hearps, P.J., Wright, M.N., 2012. Molten-salt power towers:newly commercial concentrating solar storage. Proc. IEEE 100, 504–515.
Dutil, Y., Rousse, D.R., Ben Salah, N., Lassue, S., Zalewski, L., 2011. Areview on phase-change materials: mathematical modeling and simu-lations. Renew. Sust. Energy Rev. 15, 112–130.
Energy Information Administration, 2012a. Annual Energy Outlook2012.
Energy Information Administration, 2012b. Electric Power Monthly.Farid, M.M., Khudhair, A.M., Razack, S.A.K., Al-Hallaj, S., 2004. A
review on phase change energy storage: materials and applications.Energy Convers. Manage. 45, 1597–1615.
Incropera, F.P., DeWitt, D.P., 2001. Fundamentals of Heat and MassTransfer, fifth ed. John Wiley & Sons Inc..
IRENA, 2013. Thermal Energy Storage Technology Brief.Kuravi, S., Trahan, J., Goswami, D.Y., Rahman, M.M., Stefanakos,
E.K., 2013. Thermal energy storage technologies and systems forconcentrating solar power plants. Prog. Energy Combust. Sci. 39, 285–319.
Laing, D., Bauer, T., Breidenbach, N., Hachmann, B., Johnson, M., 2013.Development of high temperature phase-change-material storages.Appl. Energy 109, 497–504.
Lane, G.A., 1976. Macro encapsulation of heat storage phase changematerials for use in residential buildings. Dow Chemical Company,Final Report 1976.
Luz International Ltd., Solar Energy Research Institute, CBY Associates,I., 1988. Phase-Change Thermal Energy Storage. SERI/STR-250-3516.
Metz, B., Davidson, O., Coninck, H.D., Loos, M., Meyer, L., 2005. IPCCspecial report on carbon dioxide capture and storage. CambridgeUniversity Press, New York, United States of America.
Michels, H., Pitz-Paal, R., 2007. Cascaded latent heat storage forparabolic trough solar power plants. Sol. Energy 81, 829–837.
Nallusamy, N., Velraj, R., 2009. Numerical and experimental investiga-tion on a combined sensible and latent heat storage unit integratedwith solar water heating system. J. Solar Energy Eng. – Trans. ASME131, 041002-1–041002-8.
Pacheco, J.E., Showalter, S.K., Kolb, W.J., 2002. Development of amolten-salt thermocline thermal storage system for parabolic troughplants. J. Sol. Energy Eng. 124 (2), 153–159.
Regin, A.F., Solanki, S.C., Saini, J.S., 2008. Heat transfer characteristicsof thermal energy storage system using PCM capsules: a review.Renew. Sust. Energ. Rev. 12, 2438–2458.
Sharma, A., Tyagi, V.V., Chen, C.R., Buddhi, D., 2009. Review onthermal energy storage with phase change materials and applications.Renew. Sust. Energ. Rev. 13 (2), 318–345.
Steinmann, W., Laing, D., Tamme, R., 2010. Latent heat storage systemsfor solar thermal power plants and process heat applications. J. SolarEnergy Eng. – Trans. ASME 132, 021003.
Tufeu, R., Petitet, J., Deniellou, L., Leneindre, B., 1985. Experimentaldetermination of the thermal conductivity of molten pure salts and saltmixtures. Int. J. Thermophys. 6, 315–330.
Verma, P., Varun, Singal, S.K., 2008. Review of mathematical modelingon latent heat thermal energy storage systems using phase-changematerial. Renew. Sust. Energy Rev. 12, 999–1031.
Zhao, W., 2013. Characterization of Encapsulated Phase ChangeMaterials for Thermal Energy Storage. PhD Dissertation, LehighUniversity, Bethlehem PA, USA.
Zhao, W., Zheng, Y., Sabol, J.C., Oztekin, A., Neti, S., Tuzla, K.,Misiolek, W.M., Chen, J.C., 2012. Heat transfer analysis for thermalenergy storage using NaNO3 as encapsulated phase change Material.In: ASME 2012 Heat Transfer Summer Conference, July 8–12 2012,Puerto Rico, USA.
Zheng, Y., 2015. Thermal Energy Storage with Encapsulated PhaseChange Materials for High Temperature Applications. PhDDissertation, Lehigh University, Bethlehem PA, USA.
Zheng, Y., Zhao, W., Sabol, J.C., Tuzla, K., Neti, S., Oztekin, A., Chen,J.C., 2013. Encapsulated phase change materials for energy storage –characterization by calorimetry. Sol. Energy 87, 117–126.
Zhukauskas, A., 1972. Heat transfer from tubes in cross flow. In:Hartnett, J.P., Irvine, T.F. (Eds.), Advances in Heat Transfer.Academic Press, New York.