An experimental and computational investigation of flow past cacti

EXPERIMENTAL AND COMPUTATIONAL INVESTIGATION OF TRANSPORT PHENOMENA IN INITIATED CHEMICAL VAPOR DEPOSITION
(iCVD) PROCESS
A Thesis Submitted to The Graduate School of Engineering and Sciences of
Izmir Institute of Technology In Partial Fulfillment of the Requirements for the Degree of
DOCTOR OF PHILOSOPHY
in Chemical Engineering
by
December 2017


ACKNOWLEDGEMENTS
It has been almost ten years in IZTECH although sometimes I feel like it was just
yesterday. Through the years, I have met many people who influence me with their
thoughts and behavior, and the time that I shared with them was a great experience for
me that it makes a huge contribution to my personal development. During this journey,
and encourage me to do my best. He was always kind and thoughtful to me whenever I
needed help, and his enthusiasm about sharing his knowledge, and experiences during his
talks motivated me to look at things from new and different perspectives. Also, I would
like to thank for sharing open-minded ideas and
helpful suggestions.
for their friendships, caring, and for sharing beautiful time during my doctorate study.
for their endless support in solving problems with the best options.
Whenever I have to struggle in difficult times, I know that they are always ready
to share. So, I am indebted to my beautiful family, my mother Birsen A and my father
, Neslihan; thank you
all for your cares, suggestions and helps.
Lastly, I would like to express that all of those people, knowledge in years,
opportunities, happiness, struggles, and tears in eyes are precious gifts from Allah, and
all praise is to Allah, who let me to experience all these beautiful moments and who taught
man that which he knew not.

iv
ABSTRACT
EXPERIMENTAL AND COMPUTATIONAL INVESTIGATION OF TRANSPORT PHENOMENA IN INITIATED CHEMICAL VAPOR
DEPOSITION (iCVD) PROCESS
As a polymer thin-film deposition technique, initiated CVD (iCVD) is a
heterogeneous process involving gas phase precursors and solid film formation on a
solid/liquid substrates at different temperature regions. Obtaining fine-tuned film
properties over different substrate geometries at different process conditions is a
challenging tasks and requires experimental trials. The major goal of this study is to
develop a computational model which describes all relevant transport phenomena
occurring in iCVD process, and which is capable to predict the polymer film thickness at
different deposition conditions for flat and/or non-flat substrates in a 3D reactor
geometry.
A Finite Element Analysis (FEA)-based 3D computational model, which can be
applied to a variety number of iCVD reactor and substrate geometries, has been developed
in the study. To validate the model, reported experimental conditions of 1H,1H,2H,2H-
perfluorodecyl acrylate (PFDA) deposition with t-butyl peroxide (TBPO) initiator, and
butyl acrylate (BA) deposition with t-amyl peroxide (TAPO) initiator, are applied to the
model, respectively. The simulation results of both deposition processes show good
agreement with experimental results reported in literature. Presented model successfully
describes the relevant transport phenomena, and provides a priori predictions on
polymerization rate, and film thickness on complex substrate geometries for a
polymerization reaction with known kinetic data.
For further studies, presented model can be modified or used as an approach for
modeling of other types of CVD systems as well as facilitating process scale-up. The
model can also extract valuable polymerization kinetics data provided that a sufficient
number of experiments are performed at a specified substrate temperature, and process
parameters and measured final film thicknesses are entered to the model.

v
HESAPLAMALI
Polimer ince-
polimer
ve proses
-KBB prosesinde
olan,
Sonlu Elemanlar , 3 boyutlu model
-perfluorodecyl
t-butyl peroksit (TBPO) ile olan biriktirmesi
t-amyl peroksit (TAPO) ile olan biriktirmesinin
-KBB (iCVD)
kompleks
polimer lenebilmesine imkan
modifiye edilebilir ya da
bir
Bu model
e edilmesinde de

vi
TABLE OF CONTENTS
LIST OF FIGURES iii
...xi
CHAPTER
1.1. 2
1.1. Initiated Chemical 4
1.2. Reaction Me
CHAPTER 2. LITERATURE REVIEW
2.1. Modeling Studies in CVD system
2.2. Effect of Process Parameters and Kinetics on Film Growth in iCVD ...12
2.3. Modeling Studies of iCVD process 15
2.4. Kinetic Studies for Determination of Polymerization Rate Constants 16
CHAPTER 8
3.1. Model Requirements for iCVD Process ............................................... 18
3.2. Model Development .18
3.2.1. Model Simplifications and Transport Equations ........................... 20
3.2.2. Boundary Conditions ..................................................................... 24
3.2.2.1. Fluid Flow Boundary Conditions............................................... 25
3.2.2.2. Energy Boundary Conditions ..................................................... 26
3.2.2.3. Mass Transport Boundary Conditions ....................................... 27
3.2.2.4. Surface Polymerization Conditions ........................................... 28
3.2.2.5. Properties of Gas Mixtures ........................................................ 30
3.3. Numerical Solution Methods for Solving of Model Equations ............ 31
3.4. Implementation of the Model ............................................................... 32
3.4.1. Model Implementation in a Cylindrical Reactor Geometry ............ 32

vii
3.4.1.1. Poly (1H,1H,2H,2H-perfluorodecyl Acrylate) Deposition
Modeling ............................................................................................... 33
3.4.1.2. n-Butyl Acrylate Deposition Modeling ..................................... 36
3.4.2. Model Implementation in a Square Type Reactor Geometry ......... 39
3.4.2.1. iCVD Process ............................................................................. 41
CHAPTER 4. RESULTS AND DISCUSSION .............................................................. 43
4.1. Model Implementation in Cylindrical Type of Reactor Geometry ....... 43
4.1.1. Model Validation for PFDA polymerization ................................... 44
4.1.2. Model Validation for nBA polymerization ..................................... 57
4.2. Model Implementation in Square Type of Reactor Geometry .............. 68
4.3. The Effect of Process Parameters on Deposition Rate and Film
Uniformity ............................................................................................ 71
4.3.1. The Effect of PM/Psat ...................................................................... 71
4.3.2. The Effect of Reactor Pressure ....................................................... 72
4.3.3. The Effect of Initiator Type ............................................................ 74
4.3.4. The Effect of Filament Array .......................................................... 77
4.3.5. The Effect of Substrate Geometry .................................................. 79
CHAPTER 5. CONCLUSION ........................................................................................ 82
REFERENCES ........................................................................................................... 84
APPENDIX A. MODEL DETAILS ............................................................................... 87
viii
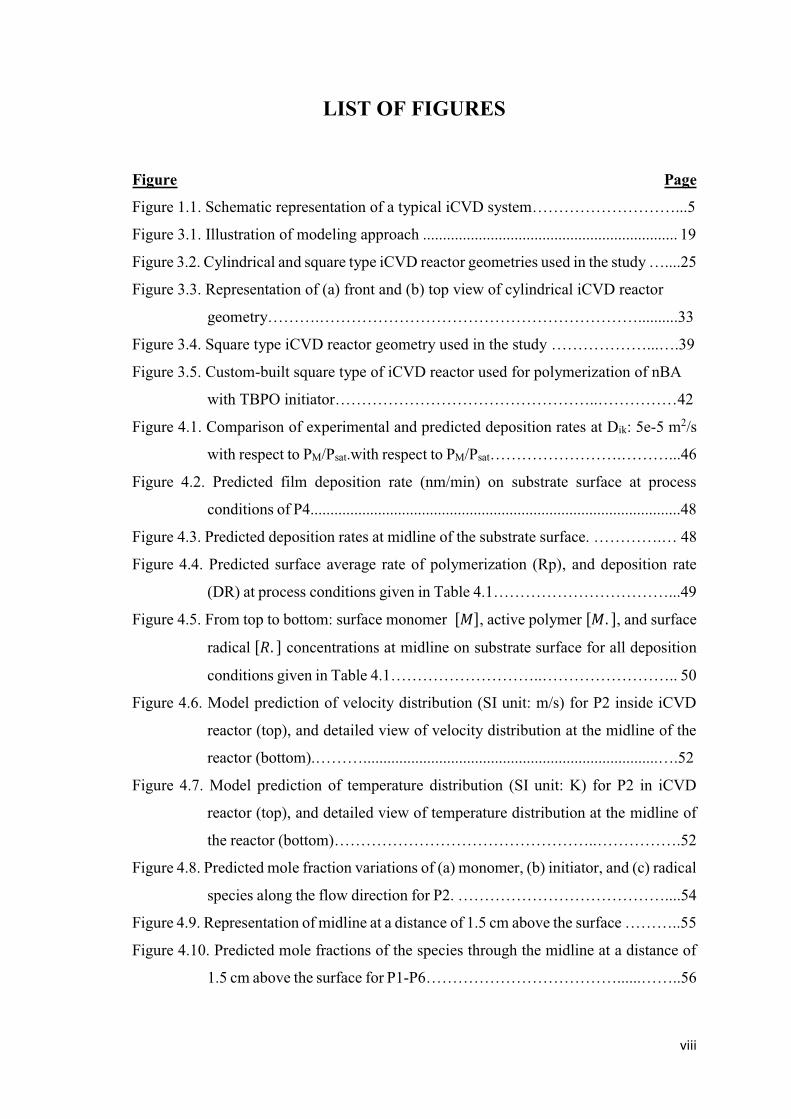
LIST OF FIGURES
Figure Page
Figure 1.1. Schematic representation of a typical iCVD system 5
Figure 3.1. Illustration of modeling approach ................................................................ 19
Figure 3.2. Cylindrical and square type iCVD reactor geometries used in the study .25
Figure 3.3. Representation of (a) front and (b) top view of cylindrical iCVD reactor
.33
Figure 3.4. Square type iCVD reactor geometry used in the study 9
Figure 3.5. Custom-built square type of iCVD reactor used for polymerization of nBA
with TBPO initiator 42
Figure 4.1. Comparison of experimental and predicted deposition rates at Dik: 5e-5 m2/s
with respect to PM/Psat.with respect to PM/Psat 46
Figure 4.2. Predicted film deposition rate (nm/min) on substrate surface at process
conditions of P4.............................................................................................48
Figure 4.3. Predicted deposition rates at midline of the substrate surface. . 48
Figure 4.4. Predicted surface average rate of polymerization (Rp), and deposition rate
(DR) at process conditio .49
Figure 4.5. From top to bottom: surface monomer , active polymer , and surface
radical concentrations at midline on substrate surface for all deposition
50
Figure 4.6. Model prediction of velocity distribution (SI unit: m/s) for P2 inside iCVD
reactor (top), and detailed view of velocity distribution at the midline of the
reactor (bottom). .......................................................................
Figure 4.7. Model prediction of temperature distribution (SI unit: K) for P2 in iCVD
reactor (top), and detailed view of temperature distribution at the midline of
52
Figure 4.8. Predicted mole fraction variations of (a) monomer, (b) initiator, and (c) radical
species along the flow direction for P2. ..54
Figure 4.9. Representation of midline at a distance of 1.5 cm above the surface
Figure 4.10. Predicted mole fractions of the species through the midline at a distance of
1.5 cm above the surface for P1- ... ..56

ix
Figure 4.11.Comparison of reported and calculated deposition rates for nBA
polymerization at different PM/Psat ...59
Figure 4.12. Model prediction of deposition rate (SI unit: nm/min) on substrate surface
for B4. ..59
Figure 4.13. Predicted deposition rates for B1-B7 through at midline on substrate
60
Figure 4.14. Surface-averaged values of predicted Rp and DR at different FM/FTotal for
.61
Figure 4.15. From top to bottom: adsorbed monomer concentration , polymer radical
concentration, , and primary radical concentration, , on substrate
surface for B1-B7
Figure 4.16. (a) Velocity (SI unit: m/s), and (b) temperature (SI unit: K) profiles along
the flow direction for B4 with bottom profiles representing the midline of
the reactor geometry. ...63
Figure 4.17. Predicted mole fraction distributions of (a) monomer, (b) initiator, (c)
radical, and (d) carrier gas along the flow direction for .
65
Figure 4.19. Predicted mole fractions of the species 1.5 cm above the substrate at the
midline for .....67
Figure 4.20. Model prediction of film deposition rate (nm/min) on substrate surface for
E3. . ..69
Figure 4.21. From left to right, velocity (SI unit: m/s) and temperature (SI unit: K) profiles
along flow direction for E3. .......69
Figure 4.22. Predicted mole fractions of monomer (top), initiator (middle), and radical
(bottom) species along the flow direction for E3.........................................70
Figure 4.23. Comparison of experimentally measured and predicted deposition rates with
respect to PM/Psat. ..................................................................72
Figure 4.24. Change of deposition rate in flow direction with respect to total pressure for
. 3
Figure 4.25. Partial pressures of monomer, initiator, radical, and argon through the
midline 1 cm above the substrate surface ...........................................74
Figure 4.26. Mole fraction distributions of radical species when a) TAPO, and b) TBPO
..76

x
Figure 4.27. Species mole fractions 1.5 cm above the bottom surface of the reactor when
a) TAPO b) TBPO initiators are used.
Figure 4.28. Comparison of deposition rate for nBA polymerization with different
..
Figure 4.29. Predicted mole fraction variation of radical species for 14 filaments (top), 4
filamen ....................................78
Figure 4.30. Comparison of deposition rates for nBA polymerization at different filament
.. 79
Figure 4.31. Three dimensional substrate geometries. a) rectangular shape b) ellipsoid
shape.
Figure 4.32. Deposition rates (nm/min) on substrates with (a) rectangular prism, and (b)
ellipsoidal geometries showing uniform film thickness can be achieved for
complex geometries.

xi
LIST OF TABLES
Table Page
Table 1.1. Thermally decomposing initiators and decomposition temperatures 3
Table 1.2. Free radical polymerization mechanism in iCVD process
Table 3.1. Selected parameters and variables for PFDA polymerization used in the model
. ... 4
Table 3.2. Flow rates of PFDA monomer at a fixed initiator flow rate of 0.82 sccm.
Table 3.3. Kinetic parameters for PFDA polymerization at 44 ..35
Table 3.4. Selected parameters and variables for nBA polymerization used in the
Table 3.5. Monomer (BA), initiator (TAPO) and carrier gas flow rates for nBA
polymerization................................................................................................38
.
Table 3.7. Selected parameters and variables for nBA polymerization with TBPO
initia
Table 3.8. Flow rates of monomer and initiator for nBA polymerization... ..
Table 4.1. Reported process conditions and experimental deposition rates of PFDA
polymerization in iCVD process at constant initiator flow rate of 0.82
... 4
Table 4.2. Comparison of experimental results of deposition rates with model predictions
at different Maxwell- 45
Table 4.3. Reported process conditions of nBA polymerization in iCVD process
Table 4.4. Comparison of experimentally found deposition rates with the model
predictions for nBA

1
CHAPTER 1
INTRODUCTION
Surface functionalization and thin film coatings of polymers have attracted a great
deal of attention in recent years due to their ability to modify the desired surface without
losing structural properties of bulk and easily integration into various size of flexible
devices. With the rapid change of technology, to fulfill the requirements, new products
and devices used in industry and households are getting smaller and become more
complex, which, therefore, make polymers an inevitable unit of producing features with
high-quality surface properties. With the advance of thin-film technology, polymer films
with different features have been widely used and become one of the major components
of biotechnology, medical, optical coatings, electronics, energy related and
semiconductor industries (Ozaydin-Ince et al., 2012). For fabricating polymer thin films,
liquid-based techniques, such as spraying, spin-coating, dip-coating, and ink-jet printing
have been predominantly applied in industry due to the ease of scaling up and low cost
of process. However, after polymer synthesis, these types of processes generally require
some additional treatment with solvents, which are toxic to environment and human
health. Solvent usage can also dissolve, make swell, and degrade fragile surfaces such as
textiles, papers and introduces impurities into the system leading defective film formation
(Alf et al., 2010). Additionally, challenges which are resulted from de-wetting and surface
tension can lead to non-uniform coatings in micro- and nanometer sized structures where
the coating solution accumulates at the bottom of the features and leaves the edges
uncoated. All these challenges limit the application of solvent in polymer film
manufacturing, in particular, high-purity electronic and noncytotoxic biomedical
applications. Therefore, vapor-phase process can be a reliable alternative method to avoid
difficulties arising from liquid-phase techniques in polymer film synthesis and it needs to
be employed when delicate substrates and/or complex geometries are required to be
coated.
Chemical vapor deposition (CVD) is a frequently employed, single-step, solvent-
free, and all-dry vacuum process where the precursors are introduced into the system in
vapor phase and conformal coating of complex geometries are achieved
2013). It has been commonly used deposition technique, particularly in semiconductor

2
industry in which high substrate temperature and high powers required to deposit
inorganic thin films. On the other hand, deposition of polymer films is a gentle process
that is; such deposition conditions of inorganics are not compatible with that of polymers
leading to formation of undesirable crosslinking and polymer film damaging. By
advancing in solution chemists, CVD reactants and reactor designs have been modified
to achieve low temperature and low energy input polymer depositions which, therefore,
make CVD commonly used technique for polymer thin film coatings.
1.1. Polymerization Methods
Polymers produced by CVD techniques can be classified according to the
polymerization mechanism as step-growth and chain-growth polymers. In step-growth
polymerization, increases in chain length are achieved sequentially through pairwise
reactions between monomers, dimers and higher oligomers. One of the common step-
growth polymerization technique is molecular layer deposition (MLD) in which the
reactants are molecular fragments and are introduced to the system alternately, allowing
the film to be grown layer by layer until the target thickness is reached. On the other hand,
chain-growth polymerization occurs fast with the breaking of double-bond through
various forms of initiation (David Dorschner, 2010). Free-radical polymerization is a
common polymerization method in which chains with reactive free-radical species are
successively added to form the polymer. The reaction mechanism consists of three main
steps. The first step of the polymerization is the initiation, which increases the number of
highly reactive free radicals. These radicals, which can be created using an initiator; light,
heat or redox reaction, then react with the monomers creating free-radical active sites.
The second step is the propagation, where the polymer chains grow by the addition of
monomer molecules to the free-radical active sites. The third and the final step is the
termination which can occur via several mechanisms. One possibility is that the active
sites of two chains or the active site of a chain and a free radical can meet and react which
terminates the chain growth. Another possibility is that the active chain site can react with
a non-reactive molecule (Ozaydin-Ince et al., 2012; Im and Gleason, 2011).
One of the common CVD techniques based on chain-growth polymerization is the
plasma-enhanced CVD (PECVD) in which energetic plasma electrons are used to break
down the monomer bonds and to create the active sites. However, electron bombardment

3
results in undesired bond dissociation and formation of unwanted side reactions such as
excessive crosslinking or fragmentation which lead to damage or loss of the functional
groups of the monomer (Sreenivasan and Gleason, 2009; Tenhaeff and Gleason, 2008).
Photo-initiated CVD (piCVD) is another CVD technique where the monomer radicals are
initiated using UV radiation (Baxamusa et al., 2008). Although polymerization rates are
significantly lower than the PECVD, it is a milder process which results in improved
functional retention. Instead of plasma or photons, thermal energy can also be used to
breakdown the monomer to initiate the polymerization mechanism. In Hot-wire CVD
(HWCVD), resistively heated filaments breakdown the monomer at a temperature of
to initiate the polymerization. As a subset of HWCVD,
initiated chemical vapor deposition (iCVD) also uses the thermal energy of hot filaments,
but, the key distinction of iCVD process is to employ initiating species, majority of which
decomposes thermally between 200-
within the vacuum chamber. Among the initiator chemicals, tert-butyl peroxide (TBPO),
tert-amyl peroxide (TAPO), perfluorooctane sulfonyl fluoride (PFOS), tert-butyl
peroxybenzoate (TBPOB), and triethylamine (TEA) are the most commonly employed,
and thermally decomposed initiators of which chemical structure and decomposition
conditions are presented in Table 1.1.
Table 1.1. Thermally decomposing initiators and decomposition temperatures. (Source: Tenhaeff and Gleason, 2008)
Initiator Type Chemical Structure Dissociation
Temperature
Tert amyl peroxide (TAPO) 150-
Tert-butyl peroxide (TBPO) 200-
Perfluorooctane sulfonyl fluoride
(PFOS) 450-
Triethylamine (TEA)
450-

4
1.2. Initiated Chemical Vapor Deposition (iCVD) Process
The iCVD is a versatile method and has extended capabilities to produce well-
defined polymers as thin films and coatings with high deposition rates through the use of
an initiator, and provides full functional retention of deposited polymers.
Typical iCVD process mainly involves precursors, vapor delivery equipment,
reaction chamber, temperature, pressure, and exhaust control units as shown in Figure
1.1. The iCVD is a solventless and all-dry vacuum process that uses the vapor pressures
of the liquid precursors for film deposition. Most of the cases, monomer(s) cannot meet
the required vapor pressure at room temperature. Therefore, they need to be vaporized for
delivery to the reaction chamber and this can be handled through the heating of the liquid
container to increase their vapor pressures. Flow of vaporized precursors are metered
accurately using mass flow controllers and delivered into the chamber through the heated
delivery lines of which temperature are controlled via PID temperature controllers.
Reaction chambers may have different configurations such as pancake and square type of
geometry, and they generally involve an array of filament which is positioned at a distance
from substrate surface to be coated. Inside the reaction chamber, there are two different
temperature regions which are the heated filament wires and the cooled substrate area.
Temperature of hot filament wires is maintained typically 200-
a power supply and the temperature of the substrate is maintained at 0-
recirculating chiller having backside contact with a stage in order to promote adsorption.
Inside the chamber, polymerization occurs under vacuum conditions, which is generally
kept at 0.1-1 Torr, and adjusted through the downstream throttle valve in a feedback loop
with a pressure gauge and controller, and manual valve.

5
Figure 1.1. Schematic representation of a typical iCVD system.
1.3. Reaction Mechanism for iCVD
iCVD is a versatile method that it combines the solution phase polymerization and
vapor phase film deposition in a single step. It is a common way to produce polymers
identical to those obtained from liquid-phase polymerization (Lau and Gleason, 2006a,
2006b; Im and Gleason, 2011). Thus, it enables to produce conformal coating of polymer
films at nanometer scale without using any solvent. The reaction mechanism and kinetics
of iCVD follow the free-radical polymerization which is a widely studied and translated
to the industrial applications due to their tolerance for low reactant purities, and its
capability to polymerize almost any chemical with a vinyl group. For traditional free-
radical polymerization, all of the mechanistic steps occur in a single temperature and
single solution phase. However, since iCVD involves both gas phase and heterogeneous
reactions taking place at different temperature regions, free radical polymerization occurs
in a heterogeneous and solventless environment, and approaches similar way with the
solution phase chain-growth polymerization stages involving initiation, propagation, and
termination reactions (Coclite et al., 2013). In brief explanation, vapor phase of monomer
and initiator species are first delivered into the reactor chamber which is held at mild

6
reactor pressure. Decomposition step, which involves the creation of a free-radical, occurs
in the vapor phase by thermal dissociation of initiators to form free radicals. These
radicals then transport to the surface and react with an adsorbed monomer molecule to
initiate the free-radical polymerization reaction by creating one-mer ready to grow into a
polymer chain (Tenhaeff and Gleason, 2008). By rapid addition of monomers to this
active polymer, propagation step occurs and active chain grows until the chain is
terminated by another free radical, whether it is another chain end or a dissociated initiator
molecule. Described reaction mechanism for iCVD process is shown in Table 1.2 where
the kd, ki, kp, kt, kt , kt are the reaction rate coefficients of decomposition, initiation,
propagation, termination, primary radical termination, and primary radical
recombination, respectively.
Table 1.2. Free radical polymerization mechanism in iCVD process. (Source: Lau and Gleason, 2006b)
Initiator decomposition
Primary radical adsorption
Monomer adsorption
Initiation
Propagation
Terminationand
Primary radical termination
Primary radical recombination
As stated earlier, polymerization on the surface is initiated by the radicals which
are formed by the thermal decomposition of the initiator species in iCVD process. Thus,
to increase the deposition rate on the surface, increasing filament temperature results in
an increase in the rate of radical formation in which the rate constant ( for the
decomposition of the initiator can be described as represented in Eq. (1.1).

7
(1.1)
In the equation above, is the activation energy for the decomposition reaction and
is the filament temperature (Ozaydin-Ince and Gleason, 2009). In iCVD process, surface
polymerization follows the Eley-Rideal adsorption mechanism in which the rate of
polymerization or deposition reaction depends on both the concentration of adsorbed
monomer species on the surface and gas phase radical concentration (Ozaydin-Ince et al.,
2012).
Monomer surface coverage depends on the vapor phase monomer concentration
ial pressure
to its saturation pressure through the limiting form of Brunauer-Emmett-Teller
(BET) adsorption isotherm;
(1.2)
where is the total adsorbed volume, is the monolayer adsorbed volume, and is
the constant which is typically used as a fitting parameter and can also be obtained using;
(1.3)
where is the heat of desorption of a monolayer, and the is the heat of
vaporization. According to adsorption isotherm studies of vinyl monomers, monolayer
coverage is reached for ~ 0.4, while condensation of a liquid corresponds to a
value of unity for (Asatekin et al., 2010). When is much less than unity,
monomer surface concentration becomes proportional to . Therefore,
becomes,
(1.4)
The surface adsorbed monomer concentration, therefore, can be described as represented
in Eq. (1.5) where is the density, and is the molecular weight of the monomer.

8
(1.5)
By inserting Eq. (1.4) to Eq. (1.5), the final equation which describes the surface
monomer concentration becomes;
(1.6)
Gas phase monomer partial pressure ( ) can be written in terms of flow rate of
precursors introduced to system as described in Eq. (1.7).
(1.7)
Therefore, Eq. (1.6) becomes as;
(1.8)
Eq. (1.8) states that adsorbed monomer concentration is a function of gas phase monomer
material properties, flow rates of precursors, reactor and monomer saturation pressures.
It is also related with c, the BET constant, which is a function of the surface temperature
where the deposition takes place.
There are many parameters affecting iCVD process conditions and
polymerization rate, and most of which are difficult to control externally. It is a complex
process that involves fluid flow of gaseous precursors delivering through different
temperature regions inside the chamber. As precursors moving along the reactor, their
velocity and fluid properties will also change spatially with respect to temperature, and
reactor pressure. In addition, monomer and initiator type will also affect the deposition
behavior and film uniformity since different materials have different fluid properties and
transport features. Moreover, in reactor chamber, initiator species thermally decompose
(as defined in Eq. (1.1)) to form active radical intermediates over the hot filament regions
which in turn leads to concentration gradient of species in reactor chamber. Mass
transport of multicomponent gaseous species to the substrate surface occurs according to

9
substrate surface. As a final step, over the surface, free radical polymerization reactions,
following the adsorption of monomer and radical species, will take place on the cooled
substrate surface with respect to reaction rate coefficient of free-radical polymerization
steps. Therefore, iCVD is multi-parameter process involving coupled momentum and
heat transfer, multi-component mass transfer, reaction, and adsorption phenomena
occurring inside the vacuum chamber. Thus, to understand the deposition characteristics
of a coated film, effect of all these parameters and transport phenomena need to be
investigated in a computational environment supported by experimental data.
In this thesis, our main goal is to develop a computational model to understand
the transport phenomena occurring inside the iCVD process and to determine optimum
deposition conditions for uniform film coatings. It is believed that developing such model
will assist to predict film thickness and uniformity without carrying out time-consuming
trial and error experiments which, in turn, minimize the expensive chemical usage and
waste of money. To be able to do this, a mathematical model is developed, then the
accuracy of the model is checked for 1H,1H,2H,2H- perfluorodecyl acrylate (PFDA) and
n- butyl acrylate (BA) monomers via comparing model outputs with the experimental
results reported in literature.
This thesis contains five chapters. In Chapter 2, both mathematical and
computational modeling studies on CVD and iCVD process, and deposition parameters
affecting the film thickness are investigated in detail. In Chapter 3, a mathematical model
for iCVD system is developed describing specific boundary conditions. Model
implementation is also used in different reactor geometries and different process
conditions. In Chapter 4, model accuracy is compared and confirmed with the
experimental results published in literature, and governing transport equations and the
reactions are investigated and discussed in detail. Finally, the conclusions and some
recommendations are listed in Chapter 5.

10
CHAPTER 2
LITERATURE REVIEW
2.1. Modeling Studies in CVD system
Chemical vapor deposition has been received broad attention both in industry and
academia since it enables to synthesis of high-purity, defect-free films with high growth
rates, and it offers good control of film structure, and excellent uniformity of wide variety
of materials. The deposition of thin films with CVD is a process of growing importance,
particularly in semiconductor industry due to the ability to be scaled-up and to meet the
requirements such as the quality of deposited film, thickness, and uniformity, e.g.,
although dimensions of microelectronic devices decreases and diameters of wafers
increases. Thus, to understand the effect of process parameters and to design the
equipment for obtaining their better performance, considerable amount of knowledge on
physical and chemical parameters on CVD of inorganics is available thanks to accurate
predictions of theoretical and numerical models, and many successful experimental
investigations. Among the inorganics, silicon carbide, silicon oxide, GaAs, and tungsten
have been widely studied through numerical and computational modeling and detailed
CVD models have been developed by studying multiple transport mechanisms in
different type of CVD reactors.
In the study carried out by Veneroni et al. (2005), epitaxial silicon carbide (SiC)
growth rate and stoichiometry were investigated as a function of various parameters in a
horizontal hot wall type reactor models (1D-3D) with different complexity using finite
element method. Since CVD processes involve material transport physics, gas phase and
surface chemical reactions, it can still be quite difficult to achieve an effective model,
such that, in the study they also stated that obtaining reliable kinetic data for both gas
phase and the surface were essential for the accurate prediction of growth rate.
In a different study carried out by Uzuafa et al. (1999), a comprehensive model
was developed for the deposition of hydrogenated amorphous silicon films (a-Si:H) in a
laser-induced chemical vapor deposition (LICVD) method. A simple surface reaction
mechanism considering gas-phase and solid surface reactions was proposed in the study.
11
Additionally, the model considered gas-phase flow, convective transport effect, and
reaction rates on the solid wafer and the boundary layer equations were used to calculate
flow and temperature profiles. For the concentration distribution of all important
intermediate species, finite-difference scheme was employed to solve two dimensional
concentration profiles and finally they noted that Si2H4 had a significant contribution to
the deposition rate while disilane not.
In addition to the studies focused on the reaction mechanism and kinetics, there
have been a lot of reports about modeling studies on CVD process used to simulate the
distribution of temperature, gas phase flow rate, and concentration distribution for
different type of CVD reactors. Among the studies, Li et al. (2015) investigated the
temperature, gas flow, and gas component factors which affect the final product in a self-
designed CVD process. They simulated and analyzed the influence of these factors on
SiC nanowires deposition on the substrate using Fluent software based on Computational
Fluid Dynamics (CFD) principle. Simulated results were also confirmed by the
experimental studies which therefore providing a useful theoretical basis for optimizing
process parameters and reactor design for the deposition of SiC nanowires. Similar study
was also carried out for the modeling of fiber-reinforced silicon carbide composites (B M
Allen, 2014). The study was objected to build a series of models that combine
macroscopic flow and chemistry with microscopic geometry changes using Comsol
Multiphysics simulation program based on the finite element methods. The resulting
simulations obtained from the model in which various parameters were given as input
indicated that fluid pressure was a major factor of determining how uniform film was. In
addition, they noted that even with laminar flow, vortices of low pressure could form
leading to uneven reaction rates and species concentration on the substrate which,
therefore, affect the uniformity of SiC deposition.
Most CVD processes are operated under reduced pressure environment to achieve
uniformity of the deposits. However, a type of CVD which is called as atmospheric
pressure CVD (APCVD) has also been used even though it does not meet the uniformity
requirements of some applications and growth rate is often small. In a study carried out
by Vanka et al. (2004), to overcome the negative effects of atmospheric pressure
operation, and to produce high growth rate of films, various effect of geometrical
parameters on growth rate and uniformity were investigated in a jet impingement
chemical vapor deposition reactor operated at atmospheric pressure. In the study, they
used previously validated two-dimensional model to numerically solve the governing

12
equations and the spatial terms in the governing equations were discretized using second-
order finite volume method. Their results showed that uniform deposits at atmospheric
pressure could be achieved for appropriate choice of substrate rotation rate, inlet flow
rate, and reactor dimensionless length.
Hot-wire chemical vapor deposition (HWCVD), on the other hand, is one of the
commonly employed CVD technique for the deposition of inorganics and various
mathematical models have been reported in the literature. A two-dimensional
computational model was reported by Olivas-Martinez et al. (2007) for HWCVD process
to produce diamond film. Since production of diamond film depends on many factors
including substrate material, temperature, and gas-phase compositions, a model enabling
to couple and solve the overall momentum, energy, and mass equations was presented.
The model also incorporated the simplified reaction mechanism which consists of twelve
chemical reactions involving nine species. In addition, they also investigated the shape
and dimensions of the reactor as well as the number of filaments, and substrate geometry.
They concluded that increasing the filament number increased both the CH3 concentration
and growth rate of diamond film.
As a sub-set of HWCVD, initiated chemical vapor deposition (iCVD) process also
involves fluid flow, heat transfer, multicomponent species transfer, and reactions
occurring in gas-phase and solid surfaces. It is a complex process that deposition kinetics
of polymers as well as the transport phenomena occurring inside the reactor chamber need
to be investigated in detail to understand the effect of process parameters on deposited
film thickness.
2.2. Effect of Process Parameters and Kinetics on Film Growth in iCVD
The effect of process parameters including precursor flow rates, substrate
temperature, reactor pressure, and filament temperature, on deposition kinetics have been
vastly investigated in literature for good control of film properties and understanding the
deposition kinetics. In industrial applications, analyzing the effect of these various factors
are essential, particularly, to have high deposition rates leading efficient consumption of
the precursors in the manufacturing process. Therefore, understanding the deposition
mechanism and the effects of the process parameters are necessary to obtain high film

13
growth rate and to optimize the iCVD process for producing desired film coating with
good conformality over the structure surface.
As stated before, iCVD uses free radical initiating species to start the
polymerization reaction over the surface. There are commonly used types of initiator
species in literature which are activated via heat, UV light, ion or electron beam to
decompose to form the active radicals (Im and Gleason, 2011). Therefore, selecting
suitable initiator type for iCVD reactor is essential to obtain the desired film deposition
with higher growth rate in the process. The effect of initiator type was studied by Xu and
Gleason (2011) for pCHMA thin film synthesis. In the study, they used tert-butyl
peroxybenzoate (TBPOB) as initiator, of which vapor pressure is only 0.00337 Torr at
room temperature, and compared the deposition results with that of the film synthesis
with TBPO. According to the study, using TBPOB instead of TBPO increased the film
growth rate by a factor of up to seven and lowered the filament temperature from 257 to
having higher sticking probability of benzoate radical, generated from thermal
decomposition of TBPOB, to the surface compared to the t-butoxy radical.
Since decomposition reaction of the initiator species occurs on the hot filament
wires, the choice of filament wire materials can also influence the deposition rate. In the
study carried out by Cruden et al. (2002), the effect of different filament types was
investigated and results showed that Nichrome (80% Ni/20% Cr) yields much higher
deposition rate compared to alumina. Additionally, filament temperature also plays a
critical role in iCVD deposition kinetics for thermally decomposed initiators due to the
type of radical formation depends on the filament temperature (Ozaydin-Ince and
Gleason, 2009). In the study carried out by Ozaydin-Ince and Gleason (2009), they
studied the effect of filament temperature on deposition rate using TBPO initiator. In
addition, they investigated the thermal decomposition of TBPO and radical formation at
different filament temperatures using gas phase FTIR. In the study, it is stated that
decomposition of TBPO leads to formation of methyl radicals as well as t-butoxy radical
in liquid phase polymerization (Ozaydin-Ince and Gleason, 2009). According to their
study, at filament temperatures below 250
primary type of radical that was formed was the t-butoxy species since methyl radicals
were much volatile which limits the surface concentration of radicals to participate in
starting polymerization on the surface. On the other hand, in the case of tert-amyl
peroxide (TAPO) initiator, Lau and Gleason (2006b) revealed that it initially forms the

14
tert-amyl peroxyl radical, but then, these peroxyl radical -scission to
yield acetone and ethyl radicals for TAPO initiator (Nakamura et al., 1996).
Filament temperature does not influence the PM/Psat, but it influences the
concentration of the radicals on the surface which in turn affects the deposition rate of the
film. In the study, they also investigated the effect of filament temperature on EDGA
deposition rate by changing filament temperature in the range of 170-
substrate temperature and observed two different regime for all flowrates. It was observed
that at lower filament temperature, the film growth rate strongly depends on the filament
temperature, which is the characteristic of a reaction-kinetics-limited process that
deposition kinetic is limited by the formation of the radical not by the monomer vapor
concentration. On the other hand, at high filament temperature, deposition rate less
dependent on the filament temperature, which is the characteristic of mass transfer-
regime, that is, filament temperature is high enough to decompose the initiators so the
deposition rate depends on the arrival of the formed radical species onto the substrate
surface from gas phase to the substrate. Therefore, in order to obtain the high growth rate,
et al. (2006) also searched for the effect of filament temperature as well as substrate
temperature on deposition kinetics of V3D3 polymerization with TBPO initiator, and they
observed similar two distinct regimes in the Arrhenius plot of deposition rate with
filament temperature in which high temperature region limited by mass transfer.
In iCVD process, initiator and monomer species are introduced into the chamber
as vapor phase and based on the knowledge of vapor pressure of the monomers, operating
conditions for desired film thickness can be predicted at a specified substrate temperature
(Im and Gleason, 2011). The saturation pressure of a monomer is used for the prediction
of monomer volatility, which means that at equal monomer gas pressures, heavier
monomer gets adsorbed onto the surface more than that of light monomer does. In the
study carried out by Lau and Gleason (2006a), they investigated the effect of monomer-
saturated vapor pressure using a homologous series of alkyl acrylate (ethyl to hexyl
acrylate) on the deposition rate. It was observed that at the same deposition conditions,
using heavier monomer lead to increase deposition rate due to more favorable monomer
adsorption. In the study, they also examined the effect of filament temperature for the
three set of PM/Psat ratio and observed closer activation energies suggesting that deposition
rate was limited by the mass transfer of the radical species.

15
Among the process parameters, substrate temperature has a strong influence on
deposition rate since adsorption-desorption mechanisms of the precursors and
polymerization reactions take place on the substrate surface. For most of the inorganics
and some CVD polymers, increasing substrate temperature accelerates kinetics of the
surface reactions which therefore results in enhanced deposition rates. On the other hand,
studies demonstrated that there is an inverse relationship between substrate temperature
and deposition rate for iCVD polymers indicating that an Arrhenius type relation exist
between the temperature and the deposition rate (Ozaydin-Ince et al., 2012). In the
experimental study of their investigation, Lau and Gleason (2006a) conducted a series of
experiments to see explicitly the effect of substrate temperature by choosing ethyl acrylate
as the monomer and fixing the other process parameters constant. The result of an
Arrhenius plot of deposition rate with substrate temperature yields an averaged apparent
Ea of -79.4 kJ mol-1 which means that decreasing substrate temperature leads to an
increase in deposition kinetics.
There are also other studies in literature investigating the mentioned parameters
for different monomer type and different reaction conditions. Among them, Chan and
Gleason (2006) studied the growth rate of glycidyl methacrylate (GMA) and cyclohexyl
investigated the effect of monomer surface concentration on deposition rate and the
number-average weights of polymers by changing precursors flow rate at different
substrate temperatures. Similar attempt was also carried out by Janakiraman et al. (2015)
for the deposition of poly (vinylpyrrolidone) (PVP) and poly (4-vinylpyridine) (P4VP) in
order to understand their kinetics and to provide a basis for their dye sensitized solar cells
applications. In the study, effect of PM/Psat, reactor pressure, and substrate temperature on
deposition rate were investigated for each type of monomer and it was found that
polymerization rate increased with increasing pressure and decreasing with increasing
substrate temperature.
2.3. Modeling Studies of iCVD process
Besides the externally controlled process parameters, both transport and reaction
rate knowledge are necessary for the successful scale-up of iCVD. Although Arrhenius
relationships of deposition rate are generally formed with various process parameters,

16
care must be given to understand the underlying factors such as gas phase and surface
concentrations of species, and rate coefficients of adsorption and decomposition
reactions. Therefore, modeling studies which are supported with kinetic studies will assist
to better understand of the iCVD deposition onto substrate with more complex geometries
and to optimize the reactor conditions for desired film thickness.
Although studies based on various numerical methods for solution-based free
radical polymerization exist, there are limited attempts for iCVD process due to the
presence of both gaseous and heterogeneous phase reactions in process, and the absence
of chemical kinetic data unlike well-studied inorganic materials commonly used in
established semiconductor industry.
An attempt on computational modeling of iCVD process was presented by Josef
Brcka (2009). In the study, ethylene glycol diacrylate (EGDA) film deposition with tert-
butyl peroxide (TBPO) was used to validate the computational model predictions with
experimental data. Presented model in the study was built under Comsol Multiphysics
computational software environment which enabled to couple fluid flow, heat transfer,
and species composition. Although transport phenomena occurring inside the iCVD
chamber was successfully simulated, the deposition rate on the substrate could not be
achieved in the model due to the unknown kinetic parameters of free radical
polymerization reactions of EGDA monomer. This study clearly indicates that to obtain
an accurate modeling of iCVD process, kinetic parameters obtained from experiments
and/or derived from modeling studies are extremely important.
2.4. Kinetic Studies for Determination of Polymerization Rate Constants
A detailed study on kinetic parameters of iCVD polymers were for the first time
studied by Lau and Gleason (2006b) in a two-part investigation. As mentioned before, in
the experimental part of the study, they carried out a series of experiments on deposition
of homologous series of n-alkyl acrylates (n=2-6) initiated with TAPO, and they
investigated the effects of surface monomer concentrations on deposition rate and
molecular weight of the polymer. Following up the experimental study, in the kinetic
study, the aim was to develop a mechanistic model for describing the kinetic behavior of
acrylate monomers. They proposed a reaction mechanism including a series of steps
involving decomposition, adsorption, and surface polymerization reactions as previously

17
shown in Table 1.2. In bulk-phase radical polymerization, primary radical and polymer
radical concentrations on the surface were assumed to be constant. Therefore, using
similar pseudo steady state approximation analogous to bulk phase, rate of polymerization
and also kinetic chain length were derived implicitly. Using n-BA as the monomer
together with TAPO initiator, they conducted a series of experiments to obtain deposition
rate and molecular weight as a function of PM/Psat at a fixed
Using argon patch flow, a constant total flow rate (3.7 sccm) was maintained to obtain
constant residence time, and also experiments were conducted at constant reactor
pressure, filament and surface temperature, that is, the experimental kinetic data would
solely affected by the adsorbed monomer concentration, not by the other parameters.
They obtained increasing deposition rate with increasing surface monomer concentration.
Then, assuming reactions occur within a monolayer thickness, they derived monolayer
volume and film thickness using QCM adsorption data together with fitting the data to
the BET equation. For the kinetic model, using a multi-response parameter estimation
procedure, experimental data were fitted to the model and they derived surface initiation,
propagation, and termination rate constants. According to the results, estimated
parameters matched well with experimental data and with the value obtained from liquid
phase free radical polymerization. Therefore, it is a strong evidence that iCVD
polymerization kinetics closely follows that of their liquid phase counterpart (Lau and
Gleason, 2006a, 2006b). Similar kinetic study based on the multi-response parameter
estimation procedure was applied for1H,1H,2H,2H- perfluorodecyl acrylate (PFDA)
polymerization with TBPO by Gupta and Gleason (2006). Surface polymerization rate
good agreement
between experimental and kinetic data was observed for the iCVD of PFDA at given
deposition conditions.

18
CHAPTER 3
MODELING OF iCVD
3.1. Model Requirements for iCVD Process
New developments in technology lead to growth in the necessary investment of
time and the money to fulfill the demands with required features particularly in
microelectronic industry to manufacture the integrated circuits. Most of the time, to meet
the demands on homogeneous and uniform film coating of devices, an empirical way,
which is mainly relying on the feelings of an experienced engineer, is used as an approach.
Such trial and error approaches are not capable to fine tuning of film properties associated
with the size and structure of the devices, and require experimental trials which, therefore,
consume time, sources, and money. Therefore, to understand the effects of process
parameters on final film properties, a comprehensive analysis should include fluid flow,
heat and multicomponent mass transport, gas phase and surface reaction kinetics, and
thermodynamics phenomena describing iCVD process. Although, a number of
computational models involving partial differential equations described above-mentioned
phenomena in details, the model accuracy depends on the availability of data related to
chemical and physical properties of species and reaction kinetics. A substantial
knowledge exists for commonly used CVD materials, especially thanks to mature
semiconductor industry. Unfortunately, such knowledge is rather weak for most iCVD
compatible materials. What is needed is a realistic computational model including all
these phenomena for accurate prediction of final film properties for a given set of process
parameters and conditions.
3.2. Model Development
In order to develop a successful model for iCVD, proposed model needs to be
capable of coupling and utilizing multidisciplinary approach such as transport physics of
ideal gases, gas phase and surface reaction, and computational fluid dynamics since iCVD
involves;

19
Fluid flow of gaseous species at different temperature regions,
Thermal decomposition of initiator molecules to produce reactive intermediates
at the vicinity of heated filaments,
Mass transport of multi-component gaseous species to the substrate,
Adsorption of species and polymerization reactions on the cooled surface.
Based on the knowledge, a general model describing the iCVD process can consist of
several blocks as illustrated in Figure 3.1. In the model, process parameters which
describes the iCVD process, generally involves details about the reactor geometry and its
dimensions as well as the process conditions, such as precursor flow rates, temperature
set points, reactor pressure, and kinetic coefficients of the reactions. With the help of
coupled conservation of mass, momentum, and energy equations with the appropriate
boundary conditions, transport of the species in the reactor can be described in the model.
According to the model predictions, one can able to obtain the gas flow, temperature and
composition distributions of the species at described reactor conditions, and determine
the deposition rate and uniformity of the deposited film over the substrate surface as the
model outputs. However, for the actual modeling of the deposition process, knowledge
of the chemical mechanisms and polymerization rate constants need to be defined.
Figure 3.1. Illustration of modeling approach.

20
3.2.1. Model Simplifications and Transport Equations
Reasonable assumptions are necessary to reduce the complexity of solving
coupled non-linear equations numerically and to reduce the effort and time in the
computational analyzing of the system. This assumptions generally justified for the CVD
process conditions which do not essentially limit the accuracy and the applicability of the
model.
The presented model here assumes that the iCVD process operates at steady-state
conditions and gases treat as ideal gases, behaving in accordance with ideal gas law and
temperature conditions. The gas
flow is assumed to be laminar. Therefore, single-phase, compressible fluid flow in iCVD
reactor is described by conservation of mass and conservation of momentum equations
through the following equations;
(3.1)
(3.2)
where (SI unit: kg/m3) is the density, (SI unit: m/s) is the velocity vector, (SI unit:
Pa) is the pressure, (SI unit: Pa.s) is the dynamic viscosity of ideal gas mixture and
(SI unit: N/m3) is the volume force vector. Since no large velocity gradient appears and
low Mach number flows in CVD processes, viscous heating and the effect of pressure
variations on the temperature can be neglected, respectively. Therefore, by ignoring these
terms, those equations are coupled to heat equation expressed by;
(3.3)
where (SI unit: J/ (kg.K)) is the specific heat capacity of the fluid at constant pressure,
T (SI unit: K) is the temperature, (SI unit: W/ (m.K)) is the thermal conductivity, and
defines heat sources other than viscous heating. The total heat flux vector is calculated
by Eq. (3.4),

21
(3.4)
where is the internal energy and is the radiative heat flux. To reduce the complexity
and due to relatively low temperatures, term is neglected in the model. term is
related to the enthalpy, H, and calculated by the following equation;
(3.5)
Fluid properties; , , , and , in above equations, are not only functions of the
temperature and pressure, but also function of the composition of the gas mixture.
Therefore, general flow and energy equations are coupled to the species concentration
equations to describe mixture properties as a function of velocity, temperature, and mass
fractions.
iCVD involves transport of multi-component gaseous species and Eq. (3.6) describes the
mass transport for an individual species in the model;
(3.6)
where (SI unit: kg/m3) denotes the mixture density and (SI unit: m/s) the mass
averaged velocity of the mixture. The remaining variables are specific for each of the
species, where is the mass fraction of the th species ( =1,.., ), (SI unit: kg/(m2.s))
is the mass flux relative to the mass averaged velocity vector, and (SI unit: kg/(m3.s))
is the rate expression describing production or consumption of the th species. Sum of the
transport equations of all species gives Eq. (3.7) for the conservation of mass;
(3.7)
assuming that;
(3.8)

22
Therefore, using mass conservation equations, the species transport for an individual
species, is solved in Eq. (3.6) described above. In a component gas mixture, there are
independent species concentration equations of the form of above equation. To
compute the mass fraction of the remaining species, model uses the definition that the
sum of the mass fractions is equal to 1:
(3.9)
Since the gas mixture consists of more than three species in iCVD process, model
employs the Maxwell-Stefan diffusion model in which mass flux relative to the mass
average velocity, , is described (Curtiss and Bird, 1999) as;
(3.10)
where (SI unit: m2/s) is the multicomponent Fick diffusivities, (SI unit: 1/m) is the
diffusional driving force acting on species k , is the mass fraction of each component,
T is the temperature, and is the thermal diffusion coefficient. For an ideal gas mixture,
diffusional driving force is defined by Eq. (3.11) (Curtiss and Bird, 1999) which is;
(3.11)
where (SI unit: mole/m3) is the total molar concentration, is the universal gas constant
(8.314 J/(mole.K)), (SI unit: Pa) is the total pressure, (SI unit: Pa) is the partial
pressure, (SI unit: kg/m3) is the density of species k, and (SI unit: m/s2) is an
external force (per unit mass) acting on species k. The last two term in Eq. (3.11) is
omitted due to the absence of external force (such as gravity) in the model. When we look
at the above equations, it can be seen that the total diffusive flux for the species depends
on the gradients of all species concentration, temperature, and pressure. Applying the
ideal gas law, , and the definition of the partial pressures, ,
diffusional driving force described in Eq. (3.11) can be written as;

23
(3.12)
The mole fraction, , is prescribed as;
(3.13)
and the mean molar mass, (SI unit: kg/mole) is expressed by;
(3.14)
Therefore, when Maxwell-Stefan diffusion model is applied, final form of
multicomponent mass transport equation becomes as expressed in Eq. (3.15).
(3.15)
Multicomponent Fick diffusivities, , in above equation are solved for each of the
components by applying multicomponent Fick diffusivity matrix (Bird et al., 2007). Eq.
(3.15) also involves the thermal diffusion coefficient, , but thermal diffusion effect (or
Soret effect) is generally applicable for the conditions of large temperature gradient exist,
and causes the large or heavy gas molecules to concentrate in the cold regions of the
reactor, while small or light molecules concentrate in the hottest region of the reactor
chamber (Kleijn and Werner, 1993). This effect may be a significant factor for some types
of CVD systems, but compared to the ordinary diffusion, thermal diffusion effect is
assumed to be very small and can be neglected for our iCVD conditions. Therefore,
thermal diffusion effect is neglected in the model by taking multicomponent thermal
diffusion coefficient, DiT, zero for each of the components.
Last thing about the mass conservation equation, represented by Eq. (3.6), is the
term which represents the creation and the destruction of the species. Consider a
general reaction belonging to a set of reactions and involving species. In iCVD process,

24
an irreversible decomposition reaction of initiator can be described at the vicinity of the
heated filaments by such a reaction;
(3.16)
where (SI unit: mole/(m3.s)) is the reaction rate, is the forward rate constant, which
is strongly depend on the temperature, is the molar concentration (SI unit:
mole/m3) of the th species, is the mole fraction of the th species, and is the total
pressure, is the stoichiometric coefficient which is defined as being negative for
reactants and positive for products. In addition to the concentration dependence, reaction
rate constant, , can also be defined in terms of Arrhenius expression as;
(3.17)
where is the pre-exponential factor, is the activation energy, and is the general gas
constant.
3.2.2. Boundary Conditions
Describing a set of boundary conditions for the transport equations given in
section 3.2.1 is necessary to develop a model for iCVD system. To determine the velocity,
heat transfer, and the concentration distribution of the species, defining accurate process
parameters for the reactor boundaries leads to successful coupling of complex physical
phenomena. Thus, it helps to define better predictions for the process optimization. Here,
Figure 3.2 represents the iCVD reactor schemes used in the study to check the validity of
the model with experimental studies. Boundary conditions involving inlet and outlet
openings, heated filament array, cooled surface area, and substrate surface are
demonstrated for each reactors to figure out the specified conditions for the boundaries.
For simplification, auxiliary side ports such as thermocouple and power feedthroughs

25
were ignored in the model. Details about the reactor geometry and dimensions will be
defined in the following sections.
Figure 3.2. Cylindrical and square type iCVD reactor geometries used in the study.
3.2.2.1. Fluid Flow Boundary Conditions
On the walls, remaining from the described boundaries, no-slip boundary
condition is applied where the fluid velocity is zero.
(no-slip wall) (3.18)
The reactor initial condition and outlet boundary condition are specified with respect to
the pressure where;
(reactor pressure) (3.19)
In iCVD system, flow rates are generally described in unit of which stands for the
unit of standard cubic of centimeters per minute. In our model, to describe the inflow
velocity, total flow rate of species, , which involves the flow of monomer, initiator,
radical, and inert gas (in the case of patch flow used conditions), is specified as a standard
volumetric flow rate in the inflow of the reactor according to the following equation.
(3.20)

26
In the equation, is the standard flow rate, and is the fluid density at a described
temperature. The standard density, , is defined by the following equation;
(3.21)
where is the mean molar mass of the fluid, is the standard pressure, R is the
universal gas constant and is the standard temperature. Therefore, the boundary
conditions for the velocity vector at the inlet boundary are given by;
- (3.22)
(3.23)
with , a unit vector normal to the inflow opening.
3.2.2.2. Energy Boundary Conditions
In most of the case, using fixed isothermal boundary condition for describing the
temperature boundary conditions is a practical way to solve the complexity of the problem
although it is not always possible to obtain isothermal conditions in the real experimental
studies as in the case of reactor side walls. Thus, as a result of heat transfer with their
surroundings, temperature distribution can be modeled in detail by taking consideration
of heat conduction with respect to material type; conductive, radiative and convective
heat transfer between reactor gases, walls and surroundings. Here, in this model, to
simplify the energy related equations, isothermal temperature ( ) boundary
condition is prescribed for the inflow, substrate surface, filaments, and the reactor walls
for a given geometry through the equations of (3.24)-(3.27). It is worth to mention that
substrate, which is placed on the actively cooled surface, is assumed to be contact well
with the cooled surface. Therefore, substrate temperature equals to temperature of
actively cooled surface area.

27
(3.24)
(3.25)
(3.26)
(3.27)
Thermal insulation, where the no heat flux across the boundary given by;
(3.28)
is applied for the top of reactor surface and for the bottom surface around the actively
cooled area. At outlet boundary, Eq. (3.29) is applied;
(3.29)
which states that the only heat transfer over a boundary is by convection.
3.2.2.3. Mass Transport Boundary Conditions
Initial and inlet boundary conditions are described using mass fractions of species.
In the model, inert gas (if exists) is used for the constraint element and mass fraction of
the remaining species is calculated by;
(3.30)
Inward mass flux is defined over the filaments for decomposition reactions of initiator
by;
(3.31)

28
Outflow boundary is defined by;
(3.32)
3.2.2.4. Surface Polymerization Conditions
Before describing the surface boundary conditions in the model, it is useful to
remember that surface reactions in iCVD polymerization are analogous to the radical
polymerization steps in bulk phase (Lau and Gleason, 2006a, 2006b) which makes kinetic
equations below applicable to the iCVD polymerization,
(3.33)
(3.34)
(3.35)
where the expressions of rate of polymerization, the rate of initiation, , and kinetic
chain length, , are specified in terms of monomer surface concentration, , the
polymer radical concentration, , and the primary radical concentration, on the
surface. In the equations above, , adsorbed monomer concentration term is calculated
using Eq. (3.36) of which derivation is demonstrated in previous chapter in detail. In the
equation, terms and are the density and the molecular weight of the monomer,
respectively; term is the BET constant, which is obtained from BET equation fitted to
QCM adsorption measurements; , is the saturation pressure of the monomer, and ,
is the monomer partial pressure varying through the reactor inlet and outlet boundaries as
a function of flow rate, composition, temperature, and pressure of the gas mixture.
(3.36)

29
In order to derive the overall rate of polymerization implicitly, making a pseudo
steady state approximation on the active radical intermediates is a common way used in
the literature since it is almost impossible to measure radical concentrations on the
substrate surface experimentally (Lau and Gleason, 2006b). In previous literature studies,
s the rate of
appearance of primary radical adsorbed on the surface that eventually get consumed by
surface initiation, primary radical termination, and primary radical recombination
reactions. Detailed reaction mechanism and underlying assumptions can be found in
literature (Lau and Gleason, 2006b; Odian, 2004).
Unlike the studies, in the presented model, the numerical value of any described
parameter and/or variable, which is evaluated in the coupled governing equations, can be
obtained at any point of x, y, z directions in reactor geometry and can be simulated using
a computational program. Since model gives the numerical value of gas phase monomer
and radical concentrations, it is assumed that all radical species, get diffused and just
present above the prescribed substrate surface are consumed by initiation, primary radical
termination and recombination surface reactions as expressed in Eq. (3.37). Therefore, to
find the unknown parameters of and , expressions for and represented
by Eq. (3.37) and Eq. (3.38) can be solved simultaneously for the surface boundary, which
is the cooled substrate surface placed in the middle of actively cooled surface area.
[R.] balance:
(3.37)
[M.] balance:
(3.38)
Calculated value is then substituted in Eq. (3.33) to obtain the rate of polymerization,
, or in other words, to find the rate of consumption of monomer the concentration on
the surface. Defining term also leads to find deposition rate (DR) over the surface as
expressed in Eq. (3.39).
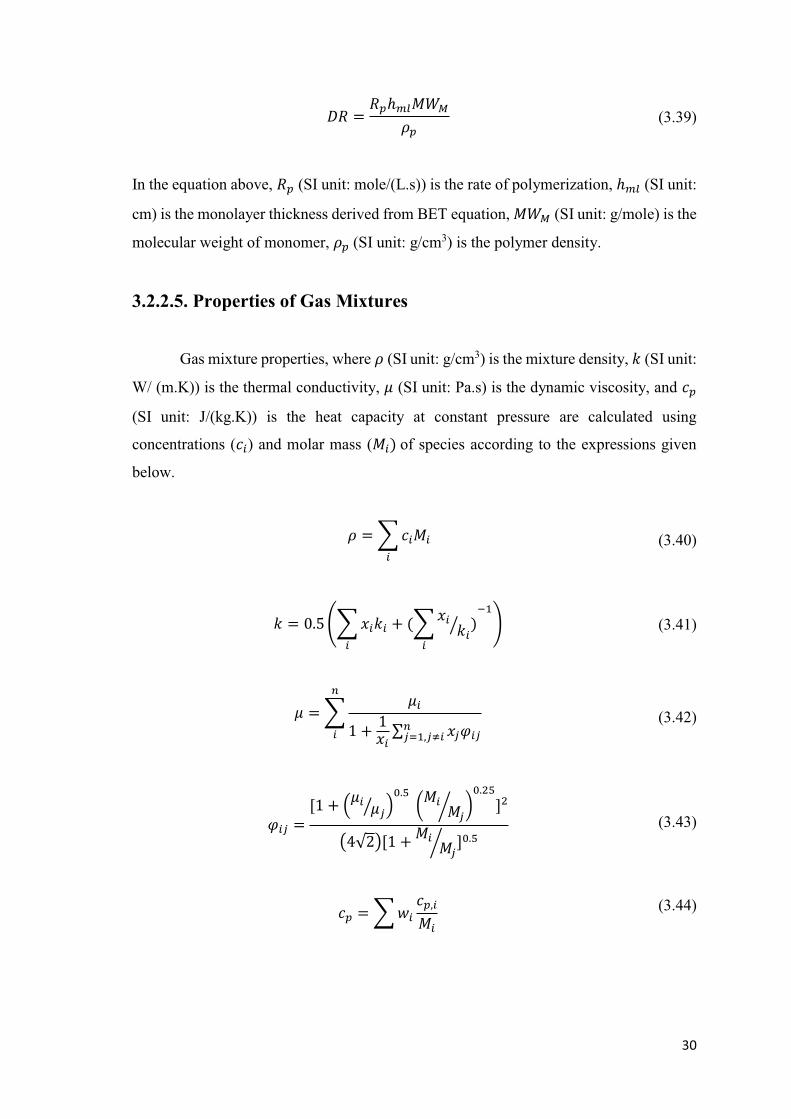
30
(3.39)
In the equation above, (SI unit: mole/(L.s)) is the rate of polymerization, (SI unit:
cm) is the monolayer thickness derived from BET equation, (SI unit: g/mole) is the
molecular weight of monomer, (SI unit: g/cm3) is the polymer density.
3.2.2.5. Properties of Gas Mixtures
Gas mixture properties, where (SI unit: g/cm3) is the mixture density, (SI unit:
W/ (m.K)) is the thermal conductivity, (SI unit: Pa.s) is the dynamic viscosity, and
(SI unit: J/(kg.K)) is the heat capacity at constant pressure are calculated using
concentrations ( ) and molar mass ( of species according to the expressions given
below.
(3.40)
(3.41)
(3.42)
(3.43)
(3.44)

31
3.3. Numerical Solution Methods for Solving of Model Equations
Model described in the previous sections consists of many coupled non-linear
equations with boundary conditions, which are very difficult to solve analytically in
general. In modeling and computational investigations, models are built to be solved with
either non-effective analytical methods as in the case of empirical models or with
numerical solutions. Fortunately, thanks to developing computational analysis, applying
numerical methods to find approximate solutions of the equations is approved as a
practical solution to solve the complex problems. Depending on the complexity of the
equations described for the boundaries and the number of iterations, solution time and the
accuracy of the prediction can be changed in the numerical solution. There are three
common classes of numerical methods which has been generally applied to solve
computational fluid dynamic problems appearing in CVD modeling. These are the: (1)
Finite Element Method (FEM), (2) Finite Difference Method (FDM), and (3) Finite
Volume Method (FVM). All these methods can be applied in a computational programs
by a code compiler as in the case of Matlab program, or by building a model via specifying
its domains, boundaries, parameters, and allowing to select physics as in the case of
Comsol Multiphysics simulation program. Such computational programs make modeling
simple for those of models involving complex equations and geometries by eliminating
code writing. In a computational program, model development generally begins with
forming a spatial dimensions of geometry to describe the boundary conditions, and then
improved by describing parameters and physics until the model reaches a sufficient
accurate predictions with experimental results.
Here presented model uses finite element analysis to solve the coupled non-linear
equations based on sub-division of the continuous domains into finite size, but not
necessarily to uniform elements. The entire geometry is divided into several regions; each
region having a different element size based on the complexity of the geometry, and the
boundary conditions used for that particular region. For every mesh of the elements,
integral form of described governing equations are solved together to give an
approximation.

32
3.4. Implementation of the Model
To validate the model, reported experimental conditions of 1H,1H,2H,2H-
perfluorodecyl acrylate (PFDA) deposition with t-butyl peroxide (TBPO) initiator (Gupta
and Gleason, 2006), and butyl acrylate (BA) deposition with t-amyl peroxide (TAPO)
initiator (Lau and Gleason, 2006b), are applied to the model, respectively. Both of the
studies involve rate coefficients of surface polymerization reactions at a constant
substrate temperature as well as confirmed deposition rate results at specified
experimental conditions. Thus, accuracy of the model is supposed to be proved by
comparing the model outputs with reported results for the same geometry and
experimental conditions. In addition, using different kind of iCVD reactor and applying
different experimental conditions, applicability of the model is also controlled in the
presented study.
3.4.1. Model Implementation in a Cylindrical Reactor Geometry
A three-dimensional cylindrical reactor geometry which has been typically used
in literature (Gupta and Gleason, 2006; Lau and Gleason, 2006a, 2006b), is
accommodated to validate the model as illustrated in Figure 3.3. Dimensions of reactor
geometry, filament number, and the distance between cooled surface and hot filaments
are prescribed in the model according to data given in the following subjected studies.
Since there is not any clear statement about the inlet and outlet boundaries; in the model,
the gas mixture is considered to flow into the reactor through a showerhead consisting of
an array of 32 circular openings with a radius of 0.1 cm, and leaves the reactor from a
semi-circle shape opening which is placed at the bottom of the reactor. In addition, for
simplification auxiliary side ports such as thermocouple and power feedthroughs are
neglected and not shown in the simulated geometry.

33
(a) (b)
Figure 3.3. Representation of (a) front and (b) top view of cylindrical iCVD reactorgeometry.
3.4.1.1. Poly (1H,1H,2H,2H-perfluorodecyl Acrylate) Deposition
Modeling
1H,1H,2H,2H-perfluorodecyl acrylate (PFDA) deposition modeling of iCVD
process is validated by using the same geometrical and experimental conditions of the
reported study (Gupta and Gleason, 2006). The cylindrical reactor geometry with a
diameter of 24 cm and height of 3.3 cm is used in the model. Although details are not
mentioned in the study, an array of filaments consisting of 14 filaments with a diameter
of 0.1 cm, spaced 1.5 cm apart and suspended over cooled surface at a distance of 2.9 cm
is used in the model. At the bottom of the reactor, a circular area with a diameter of 18
cm is actively cooled and a 100-mm-diameter of wafer to be coated is placed upon it
-
perfluorodecyl acrylate (PFDA) is used as a monomer together with tert-butyl peroxide
(TBPO) initiator. At filament -butoxy radical is prescribed as a
primary radical species as previously explained in Chapter 2. Table 3.1 represents the
process conditions and model parameters which are used in the simulations. The values
of monomer and polymer densities are assumed as in the table given below since there is
no clear statement about their exact values in the report.

34
Table 3.1. Selected parameters and variables for PFDA polymerization used in the model.
Parameters Value Description
F_monomer 0.67 (sccm) Monomer flow rate
F_initiator 0.82 (sccm) Initiator flow rate
MW_monomer 518.17 (g/mol) Molecular weight of monomer
MW_initiator 146.23 (g/mol) Molecular weight of initiator
MW_radical 76.115 (g/mol) Molecular weight of radical
1 (g/cm3) Monomer density
1.2 (g/cm3) Polymer density
P_total 0.10 (Torr) Reactor total pressure
P_sat Saturation pressure of monomer
T_substrate Substrate temperature
T_filament Filament temperature
T_inflow Inflow temperature
T_wall Reactor wall temperature
R_filament 0.05 (cm) Radius of a filament
R_surface 5 (cm) Radius of wafer
In order to compare the deposition rate results, flow rate combinations of monomer and
initiator species shown in Table 3.2, are used in the model. Deposition conditions were
fixed at 0.1 Torr reactor pressure, and 44 substrate temperature for each of
experimental runs of which kinetic data are represented in Table 3.3 for PFDA film
deposition.

35
Table 3.2. Flow rates of PFDA monomer at a fixed initiator flow rate of 0.82 sccm.
Runnumber
F_monomer (sccm)
P1 0.67
P2 0.52
P3 0.42
P4 0.35
P5 0.31
P6 0.26
P7 0.13
Table 3.3. Kinetic parameters for PFDA polymerization at 44 . (Source: Gupta and Gleason, 2006)
Parameters Value Description
7494 (L/mol.s) Initiation rate constant
11418 (L/mol.s) Propagation rate constant
2.3 x 10⁴ (L/mol.s) Termination rate constant
10.66 x 10⁷ (L/mol.s) Primary radical termination rate constant
1.5 x 10⁹ (L/mol.s) Primary radical recombination rate constant
113.0 (kJ/mol) Activation energy of decomposition reaction
3.3 BET constant
1.1755 x 10⁻⁷ (cm) Monolayer thickness

36
3.4.1.2. n-Butyl Acrylate Deposition Modeling
Modeling of n-butyl acrylate (n-BA) polymerization in iCVD process is validated
using the same geometrical and experimental conditions of the study reported by Lau and
Gleason (2006b). Proposed cylindrical reactor geometry is constructed with a diameter
of 25.4 cm (10 in.) and height of 3.175 cm (1.25 in) including an array of filaments
consisting of 14 filaments with a diameter of 0.1 cm, spaced 1.5 cm apart and suspended
over cooled surface at a distance of 2.5 cm. At the bottom of the reactor, a circular area
with a diameter of 18 cm is
100-mm-diameter of surface or wafer to be coated is placed upon the cooled substrate
area and the model assumes that the wafer is in good thermal contact with the actively
cooled surface. In the model, n-butyl acrylate (nBA) is used as a monomer together with
tert-amyl peroxide (TAPO) initiator. Argon gas is used when patch flow is required. At
filament temperature of 260
previously discussed in Chapter 2. Table 3.4 represents the process conditions and
parameters applied to the model.

37
Table 3.4. Selected parameters and variables for nBA polymerization used in the model.
Parameters Value Description
F_monomer 3 (sccm) Monomer flow rate
F_initiator 0.7 (sccm) Initiator flow rate
F_argon 0.0 (sccm) Inert gas flow rate
MW_monomer 128.17 (g/mol) Molecular weight of monomer
MW_initiator 174.28 (g/mol) Molecular weight of initiator
MW_argon 39.948 (g/mol) Molecular weight of inert gas
MW_radical 29.062 (g/mol) Molecular weight of radical
0.901 (g/cm3) Monomer density
1.08 (g/cm3) Polymer density
P_total 1 (Torr) Reactor total pressure
P_sat Saturation pressure of monomer
T_substrate Substrate temperature
T_filament 260 Filament temperature
T_inflow Inflow temperature
T_wall Reactor wall temperature
R_filament 0.05 (cm) Radius of a filament
R_surface 5 (cm) Radius of wafer
Flow rate of species was varied while keeping all other process parameters
constant to evaluate the effect of monomer surface concentration on polymer deposition
rate as represented in Table 3.5. Similar to experiments performed by Lau and Gleason
(2006b), total gas flow rate was kept constant at 3.70 sccm, and reactor pressure was fixed
at 1 Torr in the proposed model. Since kinetic data represented in Table 3.6 are available
for the substrate temperature of all calculations were performed at a fixed substrate
temperature for BA polymerization.

38
Table 3.5. Monomer (BA), initiator (TAPO) and carrier gas flow rates for nBA polymerization.
Runnumber
F_monomer (sccm)
F_initiator (sccm)
F_argon (sccm)
B1 3.00 0.70 0.00
B2 2.50 0.58 0.62
B3 2.00 0.47 1.23
B4 1.50 0.35 1.85
B5 1.00 0.23 2.47
B6 0.75 0.18 2.77
B7 0.50 0.12 3.08
Table 3.6. Kinetic parameters for nBA polymerization at 23 .(Source: Lau and Gleason, 2006b)
Parameters Value Description
4990 (L/mol.s) Initiation rate constant
15540 (L/mol.s) Propagation rate constant
0.98 x 10⁶ (L/mol.s) Termination rate constant
6.89 x 10⁷ (L/mol.s) Primary radical termination rate constant
7.41 x 10⁸ (L/mol.s) Primary radical recombination rate constant
74.6 kJ/mol Activation energy of decomposition reaction
2.536 BET constant
1.31775 x 10⁻⁷ (cm) Monolayer thickness

39
3.4.2. Model Implementation in a Square Type Reactor Geometry
Model accuracy is also validated by experiments, at different process conditions,
carried out using our custom-built, square type of iCVD reactor. This time iCVD
polymerization is performed using Butyl acrylate (nBA) monomer with tert-butyl
peroxide (TBPO) initiator. In order to use the same kinetic data exist for the BA
polymerization (which is shown in Table 3.3), substrate temperature is kept constant at
Details about the iCVD procedure for BA polymerization are given in the
following section.
Figure 3.4. Square type iCVD reactor geometry used in the study.
The square type of reactor geometry with 31.6 cm width and 4 cm height was used
in the computational model. The reactor geometry involves inlet and outlet slits 26.7 cm
in width and 0.5 cm in height. At the bottom of the reactor, there is an actively cooled
surface where a 100-mm- diameter of substrate is placed. The filament array, consists of
8 filaments with a diameter of 0.1 cm and spaced 2 cm apart, is suspended over substrate
at a distance of 2.5 cm. Table 3.7 represents the process conditions and model parameters
used in the computational simulations.
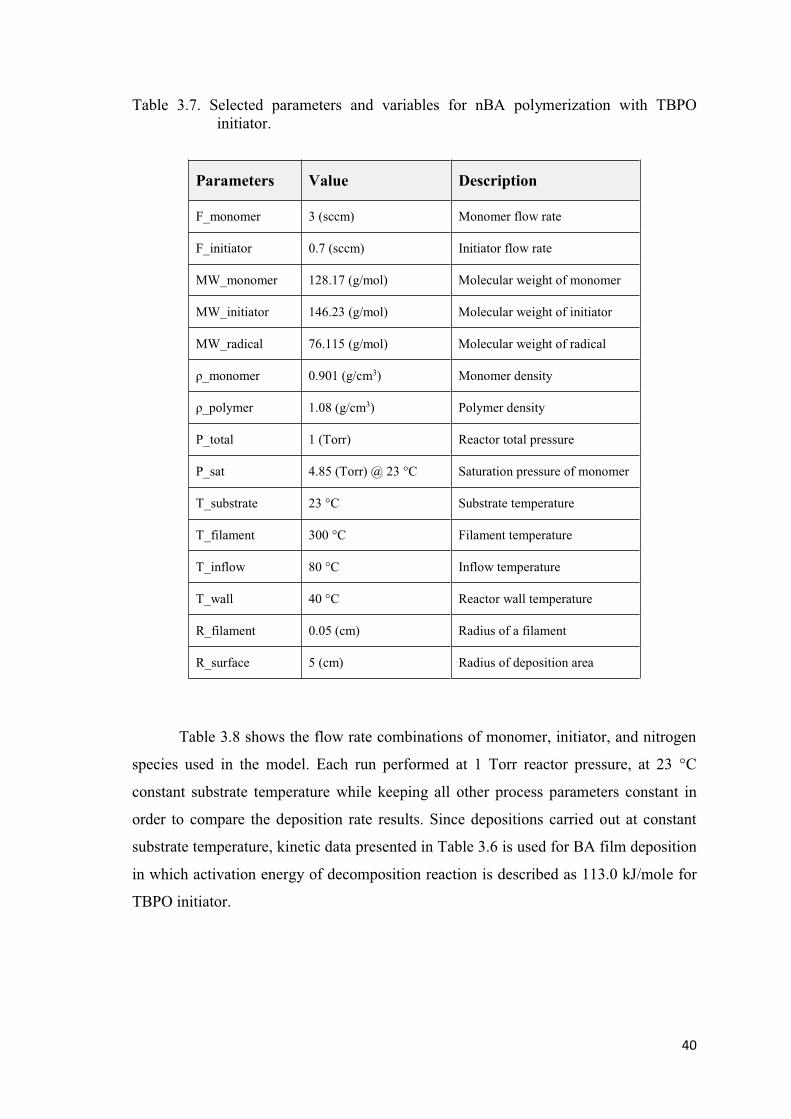
40
Table 3.7. Selected parameters and variables for nBA polymerization with TBPO initiator.
Parameters Value Description
F_monomer 3 (sccm) Monomer flow rate
F_initiator 0.7 (sccm) Initiator flow rate
MW_monomer 128.17 (g/mol) Molecular weight of monomer
MW_initiator 146.23 (g/mol) Molecular weight of initiator
MW_radical 76.115 (g/mol) Molecular weight of radical
0.901 (g/cm3) Monomer density
1.08 (g/cm3) Polymer density
P_total 1 (Torr) Reactor total pressure
P_sat 4.85 (Torr) @ Saturation pressure of monomer
T_substrate Substrate temperature
T_filament 300 Filament temperature
T_inflow Inflow temperature
T_wall Reactor wall temperature
R_filament 0.05 (cm) Radius of a filament
R_surface 5 (cm) Radius of deposition area
Table 3.8 shows the flow rate combinations of monomer, initiator, and nitrogen
species used in the model. Each run performed at 1 Torr reactor pressure, at 23
constant substrate temperature while keeping all other process parameters constant in
order to compare the deposition rate results. Since depositions carried out at constant
substrate temperature, kinetic data presented in Table 3.6 is used for BA film deposition
in which activation energy of decomposition reaction is described as 113.0 kJ/mole for
TBPO initiator.

41
Table 3.8. Flow rates of monomer and initiator for nBA polymerization.
Run
number
F_monomer
(sccm)
F_initiator
(sccm)
E1 4.00 0.5
E2 3.50 0.5
E3 3.00 0.7
E4 3.80 1.1
3.4.2.1. iCVD Process
To perform the butyl acrylate iCVD polymerization, n-Butyl acrylate (nBA)
monomer with >97% purity, and tert-butyl peroxide (TBPO) initiator with 97% purity
were purchased from Sigma-Aldrich and used as received without further purification.
Deposition studies carried out using our custom-built, square type of iCVD reactor, which
has 31.6 cm width and 4 cm height dimensions, and has a removable transparent quartz
top (2.5 cm thick) allowing visual inspection. At the bottom of the reactor, 100-mm-
diameter of silicon wafers to be coated placed on a backside cooled stage, with a radius
recirculating chiller (WiseCircu WCR-P8). Besides, reactor surrounding walls was heated
substrate surface. Inside the reactor, an array of NiCr (80% Ni/20% Cr) filaments,
consisting of 8 filaments spaced 2 cm apart and suspended over the silicon substrate at a
distance of 2.5 cm, was resistively heated to the required filament temperature using an
AC power supply in order to provide thermal energy for decomposition of initiator. The
actual temperature of the filaments was measured by a K-type thermocouple (Omega
Engineering) by carefully attaching it to the filament assembly, touching at one point.
Both nBA monomer and TBPO initiator were fed into the reactor at room temperature,
without further heating, through mass flow controllers, MKS Instrument-Model 1152C
and Model 1479A, respectively. Precursor gases were mixed in a separate chamber before

42
entering the reactor. All gas lines and mixing chamber was kept at 75 oC via silicon based
heating tapes controlled by PID controllers (TK4 series, Autonics). Reactor pressure was
kept constant at 1 Torr which was controlled by using a downstream throttle valve (MKS-
253B) together with a Baratron capacitance manometer (MKS- 627D) connected to a
pressure controller (MKS- 651C), and reactor vacuum was provided by rotary vane pump
(2XZ-Rotary Vacuum Pump). Figure 3.5 shows the setup of the custom-built iCVD
reactor.
Figure 3.5. Custom-built square type of iCVD reactor used for polymerization of nBA with TBPO initiator.

43
CHAPTER 4
RESULTS AND DISCUSSION
In previous chapter, a mathematical model, which includes the governing
transport equations with specified boundary conditions, is developed by making some
assumptions in order to simplify and to describe the transport phenomena occurring in
iCVD process. Here, in this chapter, by applying a computational program based on the
finite element analysis, it is first aimed to check the accuracy of the developed model by
comparing computational model predictions with the reported experimental results of
deposition rate; then to analyze the governing transport phenomena inside the reactor
geometry, and show the effects of process conditions on film deposition rate. To be able
to do this, two reported studies both of which involve experimental conditions, deposition
results, and confirmed kinetic data, which are presented in previous chapter, are used and
computed in a software platform to validate the model accuracy. In addition to this, model
applicability is also checked for different reactor shape and conditions of which
experiments are carried out in our home-made square type of reactor.
In order to better understand of underlying transport phenomena of deposition
process, in the representation of the figures; gas phase mixture velocity, heat, and species
concentration distribution are shown in a three-dimensional reactor geometry. It is worth
to note that in the figures, flow direction is from left to right unless otherwise indicated.
In addition, simulation results of deposition rates, which are given in tables in following
sections, represent the average film growth rate of a 100-mm-diameter of wafer.
4.1. Model Implementation in Cylindrical Type of Reactor Geometry
Since the two of reported studies, which were mentioned in previous chapter,
carried out in a typical cylindrical iCVD reactor, the model validation is simulated using
the reported dimensions of described reactor geometry for both 1H,1H,2H,2H-
perfluorodecyl acrylate (PFDA) and n-butyl acrylate (BA) film depositions.

44
4.1.1. Model Validation for PFDA Polymerization
In order to obtain a reliable model describing transport phenomena and film
deposition in iCVD process, it is first aimed to check the model accuracy for poly
(1H,1H,2H,2H-perfluorodecyl acrylate) p(PFDA) film deposition with TBPO initiator,
of which iCVD process conditions and kinetic data have already been given in previous
chapter in detail. Table 4.1 shows the deposition rate for each of reported experimental
run which are performed at constant reactor pressure (P_reactor: 0.10 Torr) and substrate
temperature (T_substrate:
and all of the experiments carried out at constant substrate temperature, the same
polymerization steps with the same rate of polymerization coefficients occur for the film
depositions. Therefore, according to the rate of deposition results given in table below, at
fixed process conditions, it can be concluded that the higher the monomer partial pressure
yields to higher film deposition rate.
Table 4.1. Reported process conditions and experimental deposition rates of PFDA polymerization in iCVD process at constant initiator flow rate of 0.82 sccm.
(Source: Gupta and Gleason, 2006)
Experimental Run
F_monomer (sccm) PM/Psat
DR_measured (nm/min)
P1 0.67 0.28 375
P2 0.52 0.24 259
P3 0.42 0.21 150
P4 0.35 0.18 88
P5 0.31 0.17 72
P6 0.26 0.15 55
P7 0.13 0.08 22
The developed model involves reactor geometry with defined boundaries, general
transport equations, prescribed process parameters, and kinetic data for describing the
PFDA film deposition in iCVD process. Details about the model geometry and boundary
conditions were explained in previous chapter. Using data given in Table 3.1-3.3, the

45
computational study was carried out in a cylindrical reactor geometry considering that
steady-state conditions exist.
As stated before, the presented model employs detailed diffusion mechanism to
describe the multicomponent gas phase diffusion. For multiple component systems,
Maxwell-Stefan diffusivity matrix is described in which Maxwell-Stefan diffusivities of
all component pairs are required to be known in the computational software to calculate
the multicomponent Fick diffusivities. For a gas mixture involving Q species, for
example, the Maxwell-Stefan diffusivity matrix is a Q-by-Q symmetric matrix, where the
diagonal components are unity. In the presented model, the gas mixture in the reactor
consists of PFDA, TBPO, and tert-butoxy radical species. Since data are not available in
literature for the diffusivities of gas pairs of prescribed species in the presented
conditions, it is assumed that each species have the same diffusional behavior in other gas
species environment. Therefore, in the Maxwell-Stefan diffusivity matrix, all species
diffusivities are taken as a constant value. It is obvious that this is not an accurate
approach for diffusivity predictions, but, it is preferred since it requires much less
computational effort and reduces the total number of iterations required to obtain a
converged solution.
Since diffusion coefficient of a gas molecules is typically in the range of 1e-6 and
1e-5 m2/s (Web1), predicted deposition rates of PFDA polymerization with TBPO
initiator are represented at Dik value of 1e-5, 5e-5, and 1e-6 m2/s at given experimental
conditions of iCVD process, as shown in Table 4.2. In the table, at given process
conditions, DR values, which were experimentally found and reported in literature, are
of those obtained from simulation outputs labeled as
In addition, predicted value of deposition rates represent the average film
growth rate over a 100-mm-diameter of substrate.

46
Table 4.2. Comparison of experimental results of deposition rates with model predictions at different Maxwell-Stefan diffusivities.
Run
number PM/Psat
DR_measured
(nm/min)
DR_predicted (nm/min)
Dik 1e-5
(m2/s)
Dik 5e-5
(m2/s)
Dik 1e-6
(m2/s)
P1 0.28 375 457.20 423.27 955.23
P2 0.24 259 282.89 266.75 568.17
P3 0.21 150 188.31 179.48 363.89
P4 0.18 88 132.79 127.41 248.16
P5 0.17 72 105.13 101.23 192.28
P6 0.15 55 74.84 72.364 132.91
P7 0.08 22 19.34 18.877 31.43
As experimental and predicted values of deposition rate are compared for each deposition
conditions, close prediction is obtained for predicted deposition rate at Dik value of 5e-5
m2/s rather than 1e-6 m2/s. Thus, for further analysis of the model simulation outputs, the
value of 5e-5 m2/s is selected and used for describing the diffusivities of species pairs in
the comparison of model predictions with experimental results. Figure 4.1 shows the
deposition rates obtained from simulation at Dik value of 5e-5 m2/s as well as reported
DR values at various .
Figure 4.1. Comparison of experimental and predicted deposition rates at Dik: 5e-5 m2/swith respect to PM/Psat.

47
As model predictions and experimental results are compared in detail, it can be seen that
model over-predicts the growth rate which may be possibly resulted from small errors
caused by the approaches and/or assumptions through the calculation of gas phase
mixture properties, such as assuming that all component pairs having equal mass
diffusivities to describe gas diffusion behavior. In addition, it is worth to note that in the
figure given above, fixed values of , which are given in Table 4.1, are used to
compare the predicted and measured deposition rates. However, in the study of Gupta and
Gleason (2006), these ratio are calculated according to the Eq. (1.7) assuming that
monomer flow rate is constant at every point of the reactor geometry. This approach can
be assumed to be practical; but not realistic, due to the bulk motion existence during the
film deposition which is also the reason of observed thickness variation on the substrate
in deposition experiments. For this reason, model prediction of is not expected
to be fixed as employed in the literature due to the change of precursor flow along the
reactor. This assumption, therefore, makes a difference in the calculation of experimental
and prediction values of DR. In the explanation of the differences, it is also worth to note
that no information exists for the substrate location and thickness measurement. It is
obvious that film thickness, and also deposition rate, strongly depend on substrate size
and location, and how the thickness measurements are taken i.e., number of measurement
points, calculation method etc. As a result, lack of knowledge about these issues will bring
some uncertainty in the comparison of deposition rates. In the model, to minimize the
uncertainty resulted from substrate location inside the geometry, a circular wafer which
has the maximum substrate size of 78.5 cm2 is assumed to be located at the center of the
reactor. Therefore, a reliable prediction of experimental thickness measurement can be
predicted more precisely by assuming that film thickness measurement could be taken at
any point of described surface area. In simulation results, deposition rate is averaged for
the entire substrate surface instead of a single location reading. It is obvious that averaging
deposition rate value for the substrate size of 78.5 cm2 leads to significant differences
instead of a single location measurement in the comparison of deposition rate. Although
some differences are present between model prediction and experimental results, the trend
of film growth rate is similar and the qualitative aspects are reflecting the process
correctly.
For a 100-mm-diameter of wafer, the simulation result of film deposition rate is
represented in Figure 4.2 for the process conditions of P4 of which deposition condition
was described in Table 4.1.
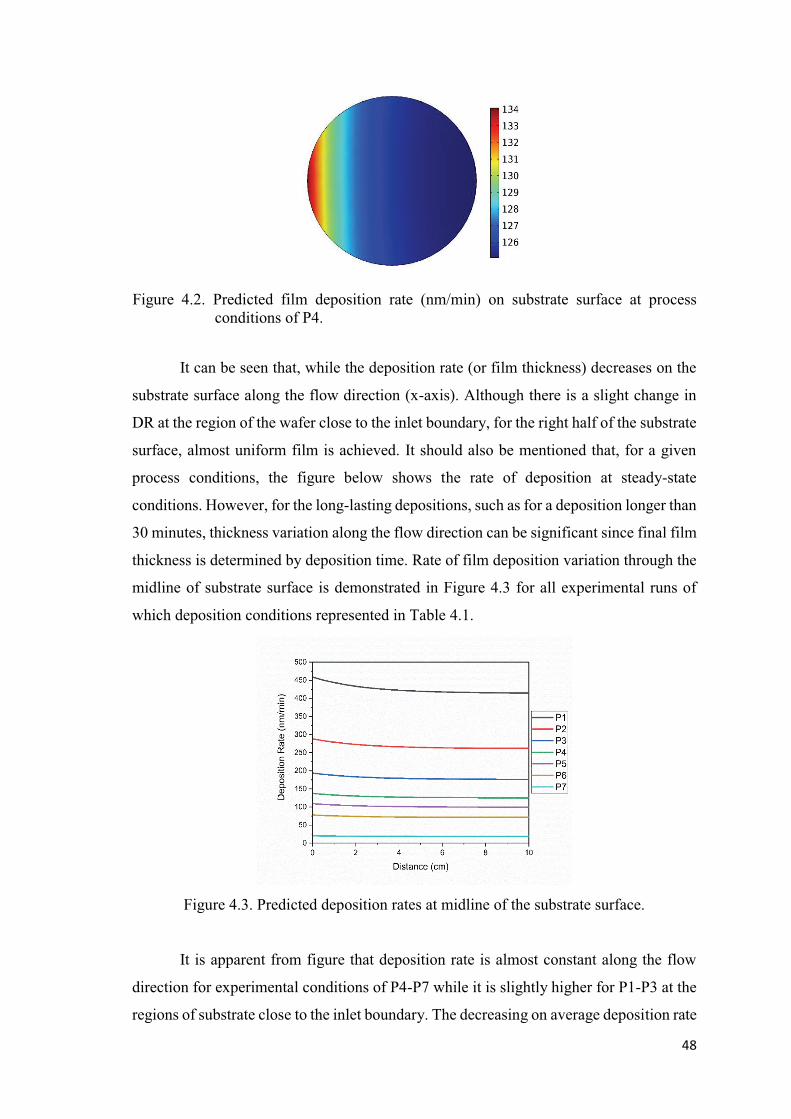
48
Figure 4.2. Predicted film deposition rate (nm/min) on substrate surface at processconditions of P4.
It can be seen that, while the deposition rate (or film thickness) decreases on the
substrate surface along the flow direction (x-axis). Although there is a slight change in
DR at the region of the wafer close to the inlet boundary, for the right half of the substrate
surface, almost uniform film is achieved. It should also be mentioned that, for a given
process conditions, the figure below shows the rate of deposition at steady-state
conditions. However, for the long-lasting depositions, such as for a deposition longer than
30 minutes, thickness variation along the flow direction can be significant since final film
thickness is determined by deposition time. Rate of film deposition variation through the
midline of substrate surface is demonstrated in Figure 4.3 for all experimental runs of
which deposition conditions represented in Table 4.1.
Figure 4.3. Predicted deposition rates at midline of the substrate surface.
It is apparent from figure that deposition rate is almost constant along the flow
direction for experimental conditions of P4-P7 while it is slightly higher for P1-P3 at the
regions of substrate close to the inlet boundary. The decreasing on average deposition rate

49
from P1 to P7 follows the trend of PM/Psat, i.e, monomer flow rate, since initiator flow
rate is fixed as indicated in Table 4.1. Both of Figures 4.2 and 4.3 indicate that for an
industrial standard of substrate, right half of the reactor will be appropriate for substrate
location to obtain uniform film thickness.
As described in previous chapter, deposition rate is a function of rate of
polymerization, Rp, which is directly related to monomer surface concentration, , and
the polymer radical concentration, , on the surface. In order to calculate Rp value,
both [M.] and the primary radical concentration, , are needed to be defined by solving
Eq. (3.37) and Eq. (3.38) together according to pseudo-steady state assumption on the
surface. Figure 4.4 shows the rate of polymerization (Rp), which is determined by
calculating those of non-linear equations applying finite element procedure, as well as
rate of deposition (DR). Since simulated results are represented for the average value of
whole substrate surface, Rp is not directly proportional with DR.
Figure 4.4. Predicted surface average rate of polymerization (Rp), and deposition rate (DR) at process conditions given in Table 4.1.
Figure 4.5 shows the surface monomer , surface radical , and active
polymer , concentrations through the midline of substrate surface. In the figure
adsorbed radical concentration increases along the midline of the substrate which may
possibly resulted from gas phase convective diffusion of the radical species present right
above the substrate surface. On the other hand, active polymer concentration slightly
decreases along the midline of the substrate due to its consumption in propagation and
termination steps during the polymerization.

50
Figure 4.5. From top to bottom: surface monomer , active polymer , and surface radical concentrations at midline on substrate surface for all deposition conditions given in Table 4.1.

51
It is obvious that obtaining a reasonable prediction of film thickness is strongly
related to the successful coupling of transport phenomena in the reactor as well as making
appropriate simplifications or assumptions to reduce the complexity of the model.
Because of the good agreement between model predictions and experimental thickness
measurements, underlying transport phenomena (gas phase fluid flow, heat and
concentration distributions) will be explained in detail.
Figure 4.6 shows the velocity profile in a three-dimensional cylindrical type of
iCVD geometry for the process conditions of P2 given in Table 4.1. In the figure, for the
entire volume of reactor, slices placed apart at a distance of 1.4 cm in y-axis. The mixture
of monomer (PFDA) and initiator (TBPO) species are delivered into the reactor through
an array of circular inlet openings, and leave the reactor at a semi-circular opening which
is placed at the bottom of the reactor. Apart from the inlet openings and outlet boundary,
as flow moves along the reactor, the mixture velocity does not change significantly at
given flow rates and vacuum conditions, and velocity is zero at the walls of the reactor
due to the no-slip condition.
As stated before, two-different temperature regions present in iCVD reactor. One
of which is heated filaments where the initiator molecules decompose to form radical
species, and the other one is the substrate surface of which temperature is kept cooled in
order to promote the adsorption of the species. Figure 4.7 shows the temperature
distribution for the deposition conditions of P2 given in Table 4.1. In the model, inlet
filament temperature is fixed the sub
(317 K). As expected, maximum temperature is seen at the top of the reactor which is
close to the heated filament array, and minimum temperature is observed at the cooled
surface. As flow moves between those regions, temperature varies as a result of bulk
motion and diffusion of the molecules. Since total flow rates are almost the same in the
experimental runs, and temperatures which are described for the boundaries are fixed,
similar temperature profiles are observed for other experimental conditions.

52
Figure 4.6. Model prediction of velocity distribution (SI unit: m/s) for P2 inside iCVDreactor (top), and detailed view of velocity distribution at the midline of thereactor (bottom).
Figure 4.7. Model prediction of temperature distribution (SI unit: K) for P2 in iCVD reactor (top), and detailed view of temperature distribution at the midline of the reactor (bottom).
Accurate predictions and/or well-coupling of flow, heat, and mass transport of all
species calculated through the governing equations will lead to better control of the
process, and final film properties. Inside the reactor geometry, chemical species
movement is not only resulted from the convection applied by fluid flow, but also resulted

53
represented in Eq. (3.6). For the Cartesian coordinate system, as flow moves along the
reactor, concentration of species will change in x, y, z directions with respect to species
flow rate, pressure, temperature, and reactions. Inside the reactor geometry, it is assumed
that one mole of initiator molecule decomposes to form two moles of radical species at
the vicinity of the filaments while monomer species do not involve in any chemical
reactions in the gas phase. It is important to highlight that at described filament
temperature, the primary radical that was formed by the decomposition of TBPO initiator
is t- butoxy radical addition to methyl radical existence as previously stated in Chapter
2.2. Since methyl radicals have high volatility, it was observed that methyl radical did not
involve in film deposition (Ozaydin-Ince, 2009). Therefore, in the presented study, TBPO
initiator is assumed to thermally decompose to form only t-butoxy radicals.
Figure 4.8 shows the concentration distribution of monomer (top), initiator
(middle), and primary radical (bottom) species as mole fractions for the deposition
conditions of P2 given in Table 4.1. In the figures, mole fraction distribution is shown by
multiple slices for the half of reactor geometry in which slices placed 3 cm apart from
each other in y- axis, and as a cross-sectional area which is placed at y=0.3 axis.
Visualizing the species concentration distribution in a three dimensional reactor geometry
enables to understand how introduced and formed species distribution change in reactor
chamber. Since deposition rate strongly depends on the gas phase monomer and radical
concentration and/or partial pressures of species right above the substrate surface,
concentration distribution also affect the film uniformity on the substrate surface.
It is expected that monomer species do not involve in any chemical reaction in the gas
phase, and its mole fraction is controlled by the mole fraction of other species inside the
vacuum chamber since sum of all species mole fraction should be equal to one. According
to the Figure 4.8 (a), gas phase monomer mole fraction is 0.12 at the inlet boundary and
slightly changes to 0.09 above the top of filament array and close to the outlet boundary
due to the fraction changes resulted from the thermal decomposition of initiator species.
In addition, as represented in Figure 4.8 (b), mole fraction of the initiator species is 0.5
and maximum at the inlet boundary, and goes to zero at the vicinity of filament array due
to fast thermal decomposition reaction. On the other hand, radical mole fraction, which
is shown in Figure 4.8 (c), follows the inverse trend of thermal decomposition of initiator,
and reaches maximum value on the filaments as expected. It is worth to note that, although
radical formation is zero at the inlet openings, presence of radical species is observed at

54
the inlet boundary wall as shown in the Figure 4.8 (c) which may possibly resulted from
fast decomposition reaction of TBPO.
Figure 4.8. Predicted mole fraction variations of (a) monomer, (b) initiator, and (c) radicalspecies along the flow direction for P2.
For the experiments given in Table 4.1, inlet monomer flow rates are changed
while initiator flow rates are fixed. In addition, due to the decomposition reaction of the
initiator, species mole fractions inside the reactor are expected to change along the flow
direction as a result of convective and diffusive transport of species. Figure 4.10 shows
(a)
(c)
(b)
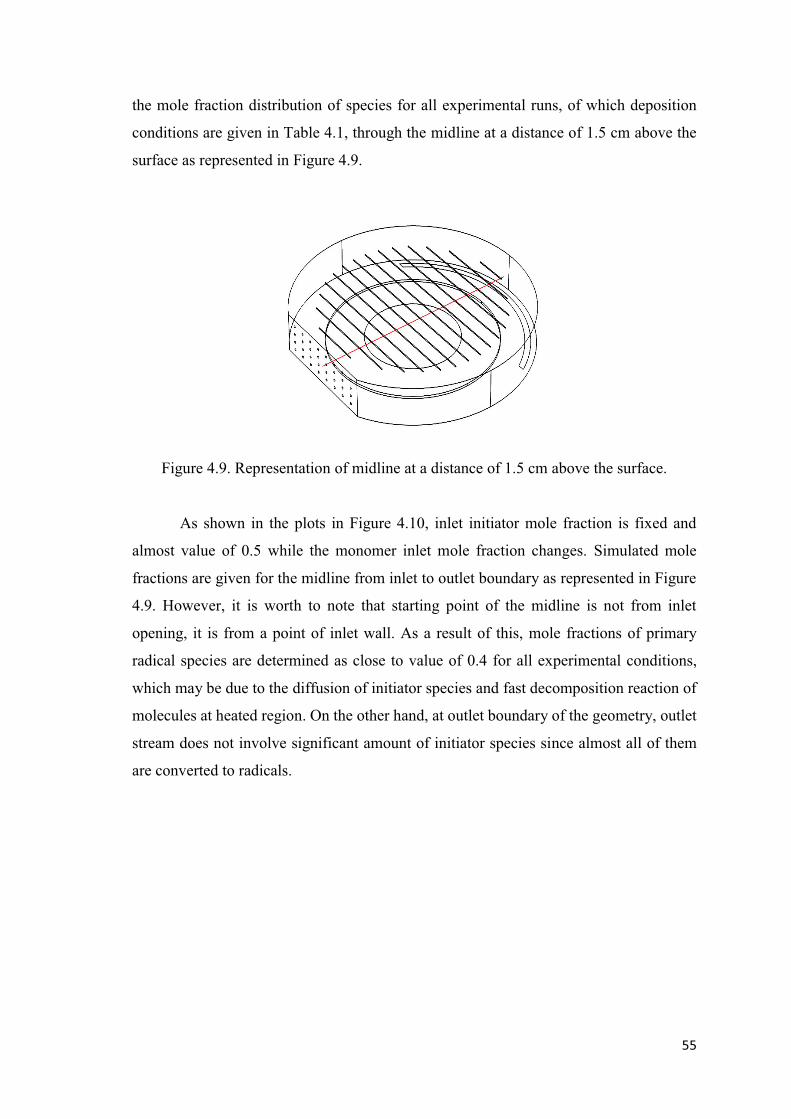
55
the mole fraction distribution of species for all experimental runs, of which deposition
conditions are given in Table 4.1, through the midline at a distance of 1.5 cm above the
surface as represented in Figure 4.9.
Figure 4.9. Representation of midline at a distance of 1.5 cm above the surface.
As shown in the plots in Figure 4.10, inlet initiator mole fraction is fixed and
almost value of 0.5 while the monomer inlet mole fraction changes. Simulated mole
fractions are given for the midline from inlet to outlet boundary as represented in Figure
4.9. However, it is worth to note that starting point of the midline is not from inlet
opening, it is from a point of inlet wall. As a result of this, mole fractions of primary
radical species are determined as close to value of 0.4 for all experimental conditions,
which may be due to the diffusion of initiator species and fast decomposition reaction of
molecules at heated region. On the other hand, at outlet boundary of the geometry, outlet
stream does not involve significant amount of initiator species since almost all of them
are converted to radicals.

56
Figure 4.10. Predicted mole fractions of the species through the midline at a distance of 1.5 cm above the surface for P1-P6.

57
All that has been mentioned so far provides that predictions of developed model are in
good agreement with reported experimental results for PFDA film deposition which
means that fluid flow, heat transfer, transport of species, and chemistry are successfully
coupled in simulation study of iCVD process. In order to validate the model applicability,
this time; different precursors having different thermodynamic and kinetic properties, are
used in the following section, and their polymerization kinetics employed to the
computational program to investigate film deposition aspects for a variety of
experimental conditions.
4.1.2. Model Validation for nBA Polymerization
Apart from successful computational modeling of PFDA, developed model is also
validated for different precursor type and iCVD process conditions based on the study
reported by Lau and Gleason (2006b). Using the same computational software program,
at steady-state conditions, iCVD polymerization of n-butyl acrylate monomer (BA) with
tert-amyl peroxide (TAPO) initiator is simulated in a cylindrical shape of iCVD reactor
at a given set of experimental data shown in Table 4.3.
Table 4.3. Reported process conditions of nBA polymerization in iCVD process. (Source: Lau and Gleason, 2006b)
RunNumber
F_monomer (sccm)
F_initiator(sccm)
F_argon (sccm) PM/Psat
DR_measured (nm/min)
DR_predicted (nm/min)
B1 3.0 0.7 0.0 0.1673 46.8 35.0
B2 2.5 0.58 0.62 0.1394 36.6 25.2
B3 2.0 0.47 1.23 0.1115 26.1 19.8
B4 1.5 0.35 1.85 0.0837 15.3 14.2
B5 1.0 0.23 2.47 0.0558 7.9 8.2
B6 0.75 0.18 2.77 0.0418 4.0 5.2
B7 0.5 0.12 3.08 0.0279 1.7 2.6
Table given above shows the experimental deposition rates at different monomer,
initiator, and carrier gas flow ratios, each of which are carried out at 1 Torr reactor

58
Argon is employed when patch flow is required
and total flow rate is fixed at 3.7 sccm to show the monomer partial pressure effect on
deposition rate as stated in the reported study. Process parameters, deposition conditions,
and kinetic parameters which were given in Table 3.4-3.6 are used in the simulation, and
solved in a described three-dimensional reactor for each of experimental conditions,
separately. As previously mentioned surface polymerization kinetics strongly depends on
the substrate temperature where the adsorption takes place. Because of the fixed substrate
temperature, for each of experimental run given in Table 4.3, the same kinetic data are
applied in the simulation studies. In the presented model, the gas mixture in the reactor
consists of BA monomer, TAPO initiator, Argon as carrier gas, and radical species. Since
data are not available for the diffusivities of gas pairs of prescribed species in the
presented conditions, it is assumed that each species have the same diffusional behavior
in other gas species environment. Therefore, in the Maxwell-Stefan diffusivity matrix, all
species diffusivities are taken as a constant value of 1e-5 m2/s in order to lessen the
computational effort and to reduce the total number of iterations in the solution.
Figure 4.11 shows the comparison of reported and predicted deposition rates, for
each of experimental runs and conditions given in Table 4.3.
Figure 4.11. Comparison of reported and calculated deposition rates for nBA polymerization at different PM/Psat .

59
It is obvious from the figure that model deposition rate predictions are in good agreement
with the experimental data at low PM/Psat, i.e., surface monomer concentration. Since total
flow rate is constant and saturation pressure is fixed at surface tempera
figure also indicates the effect of monomer flow rate on film deposition rate and/or
thickness. As early mentioned for the modeling of PFDA deposition, the differences may
resulted from assumptions, ignored process conditions, and also from finite element
solver used in the computational model. But, the main reason between the differences is
assumed to be resulted from the undefined substrate placement and data collection as film
thickness measurement in the reported study.
Although simulation results of deposition rates which are plotted in Figure 4.11
represent the surface-averaged film growth rate, for the entire surface area of a 100-mm-
diameter of wafer, simulation result of deposition rate is shown for the process conditions
of experimental run number of B4 in Figure 4.12.
Figure 4.12. Model prediction of deposition rate (SI unit: nm/min) on substrate surfacefor B4.
According to the figure above, deposition rate slightly decreases on the substrate
surface along the flow direction (x-axis). It should also be mentioned that, for a given
process conditions, the figure above shows the rate of deposition at steady state
conditions. However, for the long-lasting depositions, thickness variation along the flow
direction can be significant since final film thickness is determined by deposition time.
Variation in the predicted film deposition rate through the midline of substrate surface is
shown in Figure 4.13 for all experimental runs of which deposition conditions represented
in Table 4.3.

60
Figure 4.13. Predicted deposition rates for B1-B7 through at midline on substrate surface.
It can be seen from the figure that the deposition rate is slightly higher for B1-B3
at the region closer to the reactor inlet boundary while it is almost constant along the flow
direction for experimental conditions of B4-B7. Therefore, it can be deduced from the
figure that to obtain uniform film, where the film thickness variation is almost constant
at any point of the surface, can be achieved at lower PM/Psat, i.e., monomer flow rates as
in the conditions of B5-B7. Deposition rate is a direct function of rate of polymerization
which is calculated by determining surface monomer concentration and polymer radical
concentration on the surface. Figure 4.14 shows the averaged values of DR and Rp vs.
FM/FTotal, while Figure 4.15 represents the calculated surface monomer , polymer
radical , and primary radical concentrations through the midline of substrate
surface, respectively.

61
Figure 4.14. Surface-averaged values of predicted Rp and DR at different FM/FTotal for nBA polymerization.
As shown in the figure above, there is an increasing trend line for both of
deposition rate (DR) and rate of polymerization (Rp) versus FM/FTotal. Since total flow
rate is fixed at 3.7 sccm, Figure 4.14 also shows the same trend at increasing monomer
flow rates. As monomer flow rate increases, surface adsorbed monomer concentration
also increases as shown in Figure 4.15. Adsorbed radical concentration slightly increases
along the midline of the substrate due to the convective diffusion of the radical species
present right above the substrate surface while the polymer active concentration slightly
decreases due to its consumption during the polymerization.

62
Figure 4.15. From top to bottom: adsorbed monomer concentration , polymer radical concentration, , and primary radical concentration, , on substrate surface for B1-B7.

63
Since successful prediction of deposition rate on the surface is mainly resulted
from successful coupling of transport phenomena occurring inside the iCVD geometry,
simulation graphs of flow velocity and temperature distribution inside the vacuum
chamber are represented in Figure 4.14 (a) and (b), respectively, for the deposition
conditions of B4.
Figure 4.16. (a) Velocity (SI unit: m/s), and (b) temperature (SI unit: K) profiles along the flow direction for B4 with bottom profiles representing the midline of the reactor geometry.
(a)
(b)

64
At a given process conditions, inlet mixture includes BA monomer, TAPO
reactor box, flow is laminar for the entire volume. When a symmetrical substrate is placed
at the center of the reactor, velocity profile can also be assumed as symmetrical through
the midline in the flow direction. However, in most cases several substrates with different
geometries are placed on the reactor disrupting otherwise symmetrical flow profile.
antly along z-
direction, and velocity is assumed to zero at the walls of the reactor due to boundary layer
formation.
Inside the reactor geometry, it is expected that gas concentration of species change
with respect to flow rate ratios of species, pressure and temperature. At the vicinity of
heated filaments, one mole of initiator molecule decomposes to form two moles of radical
gas species, at a rate of reaction kinetics. For the TAPO decomposition, mean activation
energy is prescribed as -74.6 kJ/mole based on the study carried out by Lau and Gleason
(2006a) to show concentration distribution of decomposed species of initiator as well as
the formation of radical species. It is worth to note that, in literature, it is observed that
decomposition reaction of TAPO yields to form peroxy radical which rapidly undergoes
-scission to yield acetone and ethyl radicals (Lau and Gleason, 2006b). For the filament
polymerization reactions. Therefore, in the simulation of BA polymerization, to satisfy
the mass conservation, by-product generation is taken into the consideration since
initiator does not effectively decomposed to radical.
Figure 4.17 shows the mole fraction of the species along the flow direction for the
deposition conditions of B4. In the computational solving of the model, mole fractions of
each defined species are simulated using the idea of sum of mass fractions of species is
equal to 1. Therefore, mole fraction of species is expected to change inside the reactor
depending on the species flow ratio, gas phase mixture properties, and decomposition
reactions at the vicinity of the heated filaments. As shown in Figure 4.17, monomer and
carrier gas mole fractions, although they do not involve any chemical reaction, vary along
the flow direction due to by-product generation from thermal decomposition of initiator.
In addition, radical mole fraction increases at the vicinity of the first filament in the array
as a result of thermal decomposition of TAPO.
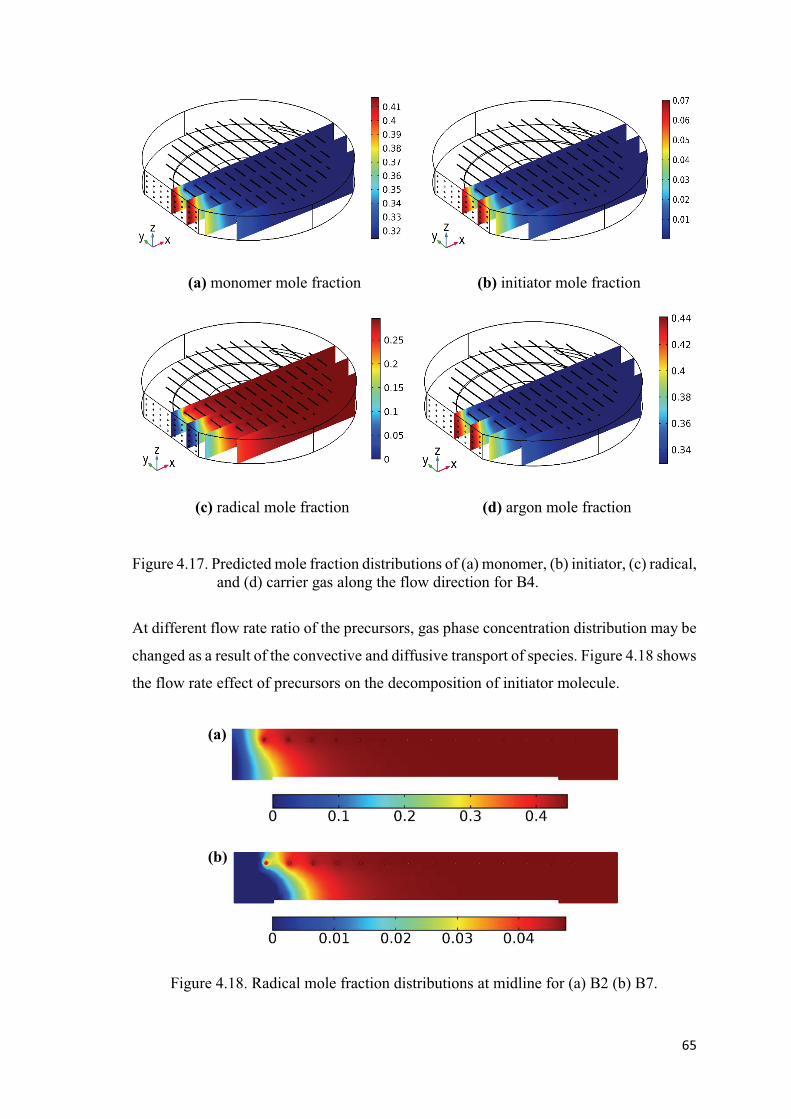
65
(a) monomer mole fraction (b) initiator mole fraction
(c) radical mole fraction (d) argon mole fraction
Figure 4.17. Predicted mole fraction distributions of (a) monomer, (b) initiator, (c) radical, and (d) carrier gas along the flow direction for B4.
At different flow rate ratio of the precursors, gas phase concentration distribution may be
changed as a result of the convective and diffusive transport of species. Figure 4.18 shows
the flow rate effect of precursors on the decomposition of initiator molecule.
Figure 4.18. Radical mole fraction distributions at midline for (a) B2 (b) B7.
(a)
(b)

66
Since total flow rate is constant for the experimental run of B1-B7, the differences in
decomposition may resulted from flow rate ratio of monomer: initiator: argon gases. In
Figure 4.18 (a) radical mole fraction at experimental conditions of B2 is simulated where
the F_monomer: 2.5 sccm, F_initiator: 0.58 sccm, and F_argon= 0.62 sccm. On the other
hand, in Figure 4.18 (b), radical mole fraction at experimental conditions of B7 is
simulated where, F_monomer: 0.5 sccm, F_initiator: 0.12 sccm, and F_argon= 3.08 sccm.
Since initiator flow rate is high at the conditions of (a), radical concentration is higher
than that of (b). Additionally, at higher initiator mole fraction, initiator decomposition is
observed around the inlet boundary close to the first filament, as radical formation takes
place right above the filament surface for the low initiator mole fraction.
In order to better understand of flow rate effect on species gas phase distribution,
Figure 4.19 shows the mole fraction change of species through the midline of reactor
geometry, above the surface at a distance of 1.5 cm for the conditions of B1-B6. Since
sum of mole fractions of species equals to 1, species mole fraction varies at different flow
conditions according to simulation results.

67
Figure 4.19. Predicted mole fractions of the species 1.5 cm above the substrate at themidline for deposition conditions listed in Table 4.3.

68
4.2. Model Implementation in Square Type of Reactor Geometry
To further validate the accuracy of the model, polymer thin film depositions were
carried out for nBA monomer with TBPO initiator in a custom-built iCVD reactor. The
details of the reactor geometry and the deposition conditions were given in Chapter 3. In
each depositions, a 100-mm-diameter silicon wafer substrate which is positioned in the
middle of actively cooled surface area was used. Substrate and filament temperatures
were . Table 4.4 shows the deposition
conditions of experiments carried out at 1 Torr in a square type of reactor, and comparison
with the predicted deposition rates.
Table 4.4. Comparison of experimentally found deposition rates with the model predictions for nBA.
Run
Number
F_monomer
(sccm)
F_initiator
(sccm) PM/Psat
DR_measured
(nm/min)
DR_predicted
(nm/min)
E1 4.00 0.5 0.183 55.2 102
E2 3.50 0.5 0.180 57 96
E3 3.00 0.7 0.167 36 75
E4 3.80 1.1 0.160 46 67
According to the results shown in Table 4.4, rates of deposition observed in experiments
are slightly different from model predictions due to the uncertain deposition conditions
present during the deposition. Although the difference between the predicted and
measured deposition rates is significant at given process conditions, model predictions
will be shown for the deposition condition of E3.
Figure 4.20 shows the simulation result of deposition rate on a 100-mm-diameter
of substrate surface for the process conditions of E3. Although there is a slight change in
DR at the region of the wafer close to the inlet boundary, film DR does not vary
significantly for the rest of the surface. It is important to note that for the long-lasting
depositions, thickness variation along the flow direction can be significant since final film
thickness is determined by deposition time.

69
Figure 4.20. Model prediction of film deposition rate (nm/min) on substrate surface for E3.
Underlying reason of good prediction of film thickness is related with the
successful coupling of gas phase momentum, heat and mass transfer of species with
polymerization reactions which takes place on the substrate surface. Therefore, presented
computational model not only predicts the deposition rate for a substrate of a particular
size and shape, but also give valuable insight about flow, heat and mass transport process
in the gas phase depending on the reactor geometry and process conditions. For square
reactor geometry and filament array, gas phase fluid flow and temperature distributions
are given in Figure 4.21. Due to no slip boundary, velocity is zero at reactor walls and
velocity does not change significantly inside the reactor. In addition, maximum
temperature is simulated above the filament array due to the very slow motion of the fluid
flow which is also observed experimentally as well.
Figure 4.21. From left to right, velocity (SI unit: m/s) and temperature (SI unit: K) profilesalong flow direction for E3.

70
Similarly, the model also couples heat, mass, and momentum transport with gas
phase chemical reactions and predicts concentration of species inside the reactor. Figure
4.22 shows the mole fractions of monomer (top), initiator (middle), and radical (bottom)
species along the flow direction for experimental conditions of E3. As expected mole
fraction of initiator decreases with thermal decomposition reaction over filament array,
and for every mole of TBPO fed into the reactor, two moles of primary radicals are
generated. Due to location of filament array, radical formation occurs at a distance away
from the inlet boundary, at the vicinity of the heated filaments where the appropriate
decomposition temperature exists. According to the simulation results, un-utilized
monomer and initiator, and un-used radical molecules are observed at the outlet boundary.
Figure 4.22. Predicted mole fractions of monomer (top), initiator (middle), and radical(bottom) species along the flow direction for E3.

71
4.3. The Effect of Process Parameters on Deposition Rate and Film
Uniformity
As discussed earlier, iCVD is a multi-parameter system involving specific
variables which are needed to be defined and controlled such as precursor types, flow
rates, substrate and filament temperature, reactor pressure, number of filaments, and
filament-to-substrate distance. All of these factors are of crucial importance which affect
the repeatability and uniformity of the growing polymer film in an experimental process.
To predict the effect of these factors without carrying further experiments are also crucial
due to the limited utilization of high-cost specialty chemicals particularly in a large-scale
coating industries. For small-scale research applications and proof-of-concept
demonstrations, on the other hand, such predictions provide better understanding of
physics occurring inside the chamber as well as obtaining effective and faster solutions
at lower cost.
Here, in this section the effect of selected iCVD process parameters on deposition
rate and uniformity will be examined in detail applying butyl acrylate process parameters
and polymerization rate constants to developed computational program.
4.3.1. The Effect of PM/Psat
Monomer surface concentration greatly affects the deposition rate, and is a direct
function of monomer partial pressure (PM) to the saturation pressure of said monomer
(Psat) at the temperature of the substrate. Representative plots of deposition rate versus
PM/Psat for PFDA and BA depositions have already been shown in Figure 4.1 and Figure
4.11, respectively. From the figures, it can be seen that deposition rate increases as PM/Psat
increases since surface monomer concentration increases as well. Therefore, PM/Psat is a
convenient way of assuming surface monomer concentration on the substrate before
doing experiment. It is important to note that at the reported studies, for both of PFDA
and BA depositions, monomer partial pressure is determined according to the below
relation by assuming that precursors flow rates are constant or not changed along the
reactor.

72
(4.1)
However, is not expected to be fixed as stated in literature because during
the film deposition experiments, as a result of flow distribution of precursors thickness
variation is commonly observed situation on the wafer. Since saturation pressure depends
on the substrate temperature, it does not change on the surface but monomer partial
pressure changes spatially through the reactor. Therefore, this can be the one of the reason
of differences between experimental and prediction values of as shown in Figure
4.23.
Figure 4.23. Comparison of experimentally measured and predicted deposition rateswith respect to PM/Psat.
4.3.2. The Effect of Reactor Pressure
To show the effect of pressure inside the cylindrical reactor chamber, process
conditions of experimental run of B4 in which F_monomer: 1.5 sccm, F_initiator: 0.35
reactor pressure of 0.5, 0.75, 1, 1.25, 1.5 Torr. The results are represented for the five
points which are placed at the midline of the surface as shown in Figure 4.24.

73
Figure 4.24. Change of deposition rate in flow direction with respect to total pressure for B4.
It can be seen from the figure that as reactor total pressure is increased from 0.5 Torr to
1.5 Torr, rate of deposition also increases from 2.4 nm/min to 18 nm/min, respectively.
Simulation results obtained are not experimentally proved due to the absence of reactor
type, but, model simulation shows an approach that how the increment in reactor pressure
affects the deposition rate on the substrate surface. However, it should be noted that
accurate prediction of diffusion coefficient contribute to accurate prediction of deposition
rates. Although species diffusion coefficient inversely proportional to pressure, in the
model it is not taken into the consideration since diffusion coefficients for coupled species
are given as a constant value at described process conditions. Thus, describing diffusion
coefficients in terms of pressure and temperature leads to obtain closer prediction of
model with experimental results.
Although species diffusion are taken as a constant value, increasing reactor total
pressure changes the partial pressure of the species inside the reactor geometry. Figure
4.25 shows the changes in partial pressure of species at different reactor pressure.

74
Figure 4.25. Partial pressures of monomer, initiator, radical, and argon through themidline 1 cm above the substrate surface.
As shown in the Figure 4.25, partial pressures of species vary with changing reactor total
pressure. In particular, increase in total pressure increases the monomer partial pressure,
therefore, it leads to increase in adsorbed monomer concentration on the surface which
also result in increasing of film thickness.
4.3.3. The Effect of Initiator Type
To explore the influence of initiator type, commonly used thermally decomposing
initiators, which are tert-butyl peroxide (TBPO), and tert-amyl peroxide (TAPO) are
employed to iCVD polymerization of n-butyl acrylate model. The previously described
cylindrical reactor geometry are used for the process conditions of B1 in which
F_monomer: 3.0 sccm, F_initiator: 0.70 sccm. Inside the reactor, total pressure is kept

75
respectively. Therefore, the effect of initiator type, i.e., radical, is to be investigated for
different types of initiators at the same deposition conditions and the same iCVD reactor
geometry by using activation energies of decomposition reactions of each initiator
species. Since primary radical types as well as the rate of decomposition are different for
each type of initiator, it affects the mole fractions of species inside the reactor. Table 4.5
shows the types of initiator used in the model, and their formed primary radicals at
Table 4.5. Initiator species and primary radicals.
Initiator
Type
MW_initiator
(g/mole)
Primary
Radical
MW_radical
(g/mole)
Ea_logarithmic
(kJ/mole) Reference
TBPO 146.23 t-butoxy
radical 76.115 113.0
Ozaydin-Ince and
Gleason (2006)
TAPO 174.28 ethyl
radical 29.06 74.6
Lau and Gleason
(2006)
Considering the data given above table, each type of initiator performed in the
computational model, separately. Figure 4.26 shows the volumetric distribution of radical
species which are formed by the decomposition of the initiator. In the figure, the top
represents the radical formation for the conditions of TAPO, while the bottom is of TBPO.
As seen from the figure, mole fractions of radical species are different for both of the
reactor volumes. For the TBPO-employed study, radical formation increases sharply and
reaches maximum while slow increment is observed for TAPO-employed study. For both
of the case, efficient decomposition of the initiator species, therefore formation of
radicals, is observed with the first filament and distribute to whole reactor volume along
the flow direction.

76
Figure 4.26. Mole fraction distributions of radical species when a) TAPO, and b) TBPOinitiators are used.
Figure 4.27 shows the mole fraction distribution of species through the midline which is
above the surface at a distance of 1.5 cm.
Figure 4.27. Species mole fractions 1.5 cm above the bottom surface of the reactor whena) TAPO b) TBPO initiators are used.
Since radical mole fraction therefore; partial pressures are changed in the implementation
of different type of initiator, it also affects the rate of deposition on the substrate. Figure

77
4.28 shows the rate of depositions for the 100-mm-diameter of substrate length. Although
the same deposition conditions (precursor flow rates, reactor pressure, temperature, etc.)
exist for both of the situations, using TBPO is almost doubled the deposition rate instead
of using TAPO due the initiator decomposition behavior and primary radical material
properties.
Figure 4.28. Comparison of deposition rate for nBA polymerization with differentinitiator species.
4.3.4. The Effect of Filament Array
Heated filaments have an important role in the thermal decomposition of initiator
in iCVD process. To explore the effect of filament array configuration on precursor
distribution, the computational model of polymerization with TAPO initiator at process
conditions of B6 in which F_monomer: 0.75 sccm, F_initiator: 0.18 sccm, and F_argon:
2.77 sccm is used. Inside the reactor, total pressure is kept constant at 1 Torr, filament
Addition to circular filament array which involves 14 filaments, two different
filament arrays, which are placed at a distance of 2.5 cm above the surface are also used
in the computational model as represented in Figure 4.29, and distribution of formed
radical species at given deposition conditions are represented for the entire reactor
geometry.

78
Figure 4.29. Predicted mole fraction variation of radical species for 14 filaments (top), 4 filaments (middle) and 1 filament (bottom).
According to the
to the heated filament surface where the initiator decomposition takes place. Since
initiation reaction is very fast and relatively low concentrations of radical are needed for
the polymerization, deposition rates should not change much with decreasing number of
filaments. One can argue that the presented model can be improved by taking into account
the energy per length of filament or number of filament in an array. However, it should
also be taken into account that due to filament aging, higher power is needed to achieve
the same filament temperature, so this approach is only valid if a new filament is used for
each deposition. Filament number and/or the distance between each filament affect the

79
species distribution inside the reactor, therefore, it affects the partial pressures and gas
phase concentration of species, and leads to different film depositions on the substrate.
Figure 4.30 shows the deposition rates at the midline of 100-mm-diameter of
substrate length for the filament arrays given in Figure 4.29. It is obvious that increase in
filament number leads to obtain more uniform film thickness on the surface due to the
presence of regular distribution of radical species.
Figure 4.30. Comparison of deposition rates for nBA polymerization at different filamentnumbers.
4.3.5. The Effect of Substrate Geometry
The iCVD process is capable of depositing polymer films on various substrates
such as micro- and nanostructured surfaces, trenches, curves, fibers, etc. This capability
results from vapor phase precursors that can easily achieve all angles of the non-planar
geometries. To show the polymer film deposition on different substrate surfaces, model
of BA polymerization is run for the process conditions of experimental run of B4 in which
trates, a substrate with a dimensions
of 3 cm of width, 4 cm of depth, and 2 cm of height, and a substrate with ellipsoidal
geometry (with a=4 cm, b= 2.5 cm and c=1 cm) positioned
of reactor bottom were used as shown in Figure 4.31 (a) and (b), respectively. Since
deposition is a strong function of substrate temperature, it is assumed that those three
dimensional substrates, which are placed in the middle of cooled surface area, thermally

80
contact-well with actively cooled surface area that all the lateral surfaces of geometries
have the same temperature with that of fixed surface area.
Figure 4.31. Three dimensional substrate geometries. a) rectangular shape b) ellipsoidshape.
Figure 4.32 shows the simulation results of deposition rate (nm/min) on 3-dimensional
substrate surface. Thanks to successful coupling of gas phase transport phenomena with
surface polymerization events, one can able to predict the deposition rate or polymer film
thickness at different substrate geometries provided that uniform temperature distribution
is achieved at every point of the surface.
(a) (b)
Figure 4.32. Deposition rates (nm/min) on substrates with (a) rectangular prism, and (b) ellipsoidal geometries showing uniform film thickness can be achieved for complex geometries.
(a) (b)
81
According to the deposition rate results which are shown in Figure 4.32, the differences
in film thicknesses are not significant and almost the same at different sides of geometries.
However, at different deposition conditions and long-lasting depositions, the spatial
differences can be significant. Therefore, using computational analysis, one can easily
predict film deposition rate and the substrate position to obtain desired film thickness.

82
CHAPTER 5
CONCLUSION
In this study, all relevant transport phenomena which describes the iCVD process,
and effect of process parameters on deposition rate were investigated by developing a
three-dimensional computational model based on the Finite Element Analysis (FEA)
approach.
In order to validate the model, reported experimental studies of BA and PFDA
depositions, of which process conditions and polymerization kinetics are known, were
simulated in a three dimensional cylindrical type of iCVD reactor. It was found that rate
of deposition results predicted in the model coincide well with that of results obtained
from the experiments reported in literature. Model captures good consistence with
experiments at lower Pm/Psat although small differences were observed between
predicted and measured deposition rates. The differences between experimental and
predicted value of deposition rate may resulted from approaches and/or assumptions
made through the calculation of gas mixture properties. In the explanation of the
differences, lack of data for the mass diffusivities of gas species, thickness measurement,
and wafer placement were assumed to be affect the DR. These are all having importance
in the determination of accurate and uniform film thickness predictions. Although some
differences are present between model prediction and experimental results, the trend of
film growth rate is similar and the qualitative aspects are reflecting the process correctly.
Additional iCVD deposition were also performed to validate model output for a
variety of process conditions in a custom-built square type of iCVD reactor. However,
due to the presence of uncertain conditions during the film depositions, film thickness
results for the square type of geometry did not show good agreement with those of
predicted. In order to make a reliable comparison of deposited film thickness with
prediction results, repeatability tests of the produced films and QCM adsorption
measurements are required to be considered.
Although not experimentally proved, model successfully predicts the effect of
process parameters, describes the rate of deposition (or film thickness) and species
surface concentration at different reactor geometries, filament assembly, and various film
deposition conditions for a polymerization reaction with known kinetics data.

83
This study is of importance in terms of describing all relevant phenomena for
different iCVD reactor geometries, prediction of film thickness with high precision on
complex substrate surface geometries, and also successful combining of gas phase and
surface deposition phenomena in a model simulation environment. The accurate
prediction of the effect of process parameters, in turn, leads to utilization of high-cost
specialty chemicals, save time and money. Additionally, it enables to extract
polymerization kinetic data for various substrate temperatures provided that a sufficient
number of experiments are performed, and process parameters and measured final film
thicknesses are entered to the model.

84
REFERENCES
Alf, M. E., Asatekin, A., Barr, M. C., Baxamusa, S. H., Chelawat, H., Ozaydin, G., Petruczok, C. D., Sreenivasan, R., Tenhaeff, W. E., Trujillo, N. J., Vaddiraju, S., Xu, J., Gleason, K. K. (2010). Chemical Vapor Deposition of Conformal, Functional, and Responsive Polymer Films. Advanced Materials, 22 (18), 1993-2027.
Allen, B. M. (2014). Finite Element Analysis Modeling of Chemical Vapor Deposition of Silicon Carbide. The Degree of Master of Science Thesis, Department of the Air Force Air University, Ohio, USA.
Asatekin, A., A., Barr, M. C., Baxamusa, S. H., Lau, K. K. S., Tenhaeff, W. E., Xu, J., Gleason, K. K. (2010). Designing polymer surfaces via vapor deposition. Materials Today, 13(5): 26-33.
Baxamusa, S. H., Montero, L., Dubach, J. M., Clark, H. A., Borros, S., Gleason, K. K. (2008). Protection of sensors for biological applications by photoinitiated chemical vapor deposition of hydrogel thin films. Biomacromolecules, 9, 2857.
Bird, R.B., Stewart, W. E., Lightfoot, E. N. (2007). Transport Phenomena. Revised Second Edition. WILEY
Brcka, J. (2009). Model of a filament assisted CVD reactor. Paper presented at COMSOL Conference, Boston, MA.
Chan, K., Gleason, K. K. (2006). A Mechanistic Study of Initiated Chemical Vapor tion Rate and Molecular Weight.
Macromolecules, 39(11): 3890-3894.
Coclite, A. M., HowdenUgur, A., Chen, N., Lee, S., Jo, W. J., Liu, A., Wang, X., Gleason, K. K. (2013). 25th Anniversary Article: CVD Polymers: A New Paradigm for Surface Modification and Device Fabrication. Advanced Materials, 25 (38), 5392-5423.
Cruden, B. A., Gleason, K. K., Sawin, H. H. (2002). Relationship of CF2 concentration to deposition rates in the pyrolytic chemical vapor deposition process. Journal of Vacuum Science & Technology B: Microelectronics and Nanometer Structures Processing, Measurement, and Phenomena, 20 (2): 690-695.
Curtiss, C. F., Bird, R. B. (1999). Multicomponent Diffusion. Industrial and Engineering Chemistry Research, 38 (7), 2515-2522.
Dorschner, D. (2010). Multicomponent Free Radical Polymerization Model Refinements and Extensions with Depropagation. The Degree of Master of Science Thesis, University of Waterloo, Waterloo, Ontario, Canada.

85
Gupta, M., Gleason, K. K. (2006). Initiated Chemical Vapor Deposition of Poly(1H,1H,2H,2H-perfluorodecyl Acrylate) Thin Films. Langmuir, 22 (24), 10047-10052.
Im, S. G., Gleason, K. K.The case for initiated and oxidative chemical vapor deposition (CVD). AIChE Journal, 57(2): 276-285.
Janakiraman, S., Farrell, S. L., Hsieh, C. Y., Smolin, Y. Y., Soroush, M., Lau, K. K. S. (2015). Kinetic analysis of the initiated chemical vapor deposition of poly(vinylpyrrolidone) and poly(4-vinylpyridine). Thin Solid Films, 595, Part B: 244-250.
Kleijn, C. R., Werner, C. (1993). Modeling of Chemical Vapor Deposition of Tungsten
Films. Springer Basel AG.
Lau, K. K. S., Gleason, K. K. (2006a). Initiated Chemical Vapor Deposition (iCVD) of Poly(alkyl acr Macromolecules 39 (10), 3688-3694.
Lau, K. K. S., Gleason, K. K. (2006b). Initiated Chemical Vapor Deposition (iCVD) of . Macromolecules, 39 (10), 3695-3703.
Li, Z., Liu, X., Zhang, M., Zhai, M. (2015). Simulation study on the influence of distribution of temperature, gas flow rate and gas component on SiC nanowires grew in self-designed CVD reaction chamber. Computational Materials Science, 96 (Part A): 63-68.
Nakamura, T., Busfield, W. K., Jenkins, I. D., Rizzardo, E., Thang, S. H., Suyama, S. (1996). Initiation Mechanisms for Radical Polymerization of Methyl Methacrylate with tert-Butyl Peroxypivalate. Journal of the American Chemical Society. 118(44): 10824-10828.
Odian, G. (2004). In Principles of Polymerization. 4th ed.; John Wiley and Sons: Hoboken, NJ, pp 198-349.
Olivas-Martinez, M., Perez-Tello, M., Cabanillas-Lopez, R., Contreras-Lopez, O., Soto-Herrera, G., Castillon-Barraza, F. (2007). A computational model for the hot-filament chemical vapour deposition process to produce diamond films. Modelling and Simulation in Materials Science and Engineering, 15 (3), 237.
O'Shaughnessy, W. S., Gao, M., Gleason, K. K. (2006). Initiated Chemical Vapor Deposition of Trivinyltrimethylcyclotrisiloxane for Biomaterial Coatings. Langmuir. 22(16): 7021-7026.
Ozaydin-Ince, G., Gleason, K. K. (2009). Transition between kinetic and mass transfer regimes in the initiated chemical vapor deposition from ethylene glycol diacrylate. Journal of Vacuum Science & Technology A: Vacuum, Surfaces, and Films, 27 (5), 1135-1143.

86
Ozaydin-Ince, G., Coclite, A.M., Gleason, K.K. (2012). CVD of polymeric thin films: applications in sensors, biotechnology, microelectronics/organic electronics, microfluidics, MEMS, composites and membranes. Reports on Progress in Physics, 75 (1), 016501.
Sreenivasan, R., Gleason, K. K. (2009). Overview of Strategies for the CVD of Organic Films and Functional Polymer Layers. Chemical Vapor Deposition, 15 -90.
Tenhaeff, W. E., Gleason, K. K. (2008). Initiated and Oxidative Chemical Vapor Deposition of Polymeric Thin Films: iCVD and oCVD, Advanced Functional Materials, 18 (7), 979-992.
Uzuafa, F., Lin, S., Gabitto J., Shuckla K. (1999). Modeling and Simulation of Photo-CVD Reactors. Industrial & Engineering Chemistry Research, 38 (12), 4579-4584.
Vanka, S. P., Luo, G., Glumac, N. G. (2004). Parametric effects on thin film growth and uniformity in an atmospheric pressure impinging jet CVD reactor. Journal of Crystal Growth, 267(1): 22-34.
Veneroni, A., Omarini, F., Moscatelli, D., Masi, M., Leone, S., Mauceri, M., Pistone, G., Abbondanza, G. (2005). Modeling of epitaxial silicon carbide deposition. Journal of Crystal Growth, 275(1): e295-e300.
Web1, https://www.comsol.com/multiphysics/diffusion-coefficient, Understanding the Diffusion Coefficient. Retrived: 15.11.2017.
Xu, J., Gleason, K. K. (2011). Conformal Polymeric Thin Films by Low-Temperature Rapid Initiated Chemical Vapor Deposition (iCVD) Using tert-Butyl Peroxybenzoate as an Initiator. ACS Applied Materials and Interfaces, 3 (7): 2410-2416.
Petruczok, C., Gleason, K. K. (2013). Chemical Vapor Deposition for Solvent-Free Polymerization at Surfaces. Macromolecular Chemistry and Physics, 214 (3), 302-312.

87
APPENDIX A
MODEL DETAILS
This part involves a brief report of model, which is obtained from computational
program, for nBA polymerization with TAPO initiator.
1. PARAMETERS
Name Expression Value Description
MW_monomer 128[g/mol] 0.128 kg/mol molecular weight of BA monomer MW_initiator 174.28[g/mol] 0.17428 kg/mol molecular weight of TAPO initiator MW_radical 29.06[g/mol] 0.02906 kg/mol molecular weight of radical MW_argon 39.948[g/mol] 0.039948 kg/mol molecular weight of Ar carrier gas MW_product 116.16[g/mol] 0.11616 kg/mol molecular weight of product F_monomer 2.5[cm^3/min] monomer flow rate F_initiator 0.58[cm^3/min] initiator flow rate F_argon 0.62[cm^3/min] inert gas flow rate P_total 1[Torr] 133.32 Pa total pressure P_sat 4.85[Torr] 646.61 Pa saturation pressure rho_monomer 0.901[g/cm^3] 901 monomer density rho_polymer 1.08[g/cm^3] 1080 polymer density ki 4990[L/(mol*s)] 4.99 rate coefficient of initiation kp 15540[L/(mol*s)] 15.54 rate coefficient of propagation kt 0.98*10^6[L/(mol*s)] 980 rate coefficient of termination
kt_x 6.89*10^7[L/(mol*s)] 68900 rate coefficient of primary radical termination
kt_xx 7.41*10^8[L/(mol*s)] 7.41E5 rate coefficient of primary radical recombination
bet_constant 2.536 2.536 BET constant h_ml 1.31775*10^ - 7[cm] m monolayer thickness T_heater 533.15[K] 533.15 K Filament temperature T_inlet 353.15[K] 353.15 K Inlet temperature T_surface 296.15[K] 296.15 K Surface temperature T_wall 313.15[K] 313.15 K Wall temperature
2. COMPONENT 1
2.1. DEFINITIONS
Variables 1
Name Expression Unit
F_total F_monomer + F_initiator + F_argon P_monomer tcs.x_w_monomer*P_total Pa P_initiator tcs.x_w_initiator*P_total Pa P_radical tcs.x_w_radical*P_total Pa P_argon tcs.x_w_argon*P_total Pa

88
Name Expression Unit
P_product tcs.x_w_product*P_total Pa
Variables 2
Name Expression Unit
c_monomer (rho_monomer/MW_monomer)*bet_constant*(P_monomer/P_sat)
Rp kp*c_monomer*c_Mactive Ri ki*c_monomer*c_radical DR Rp*h_ml*MW_monomer/(rho_polyme
r)m/s
R_initiation ki*c_monomer*c_radical R_primary_radical_termination kt_x*c_Mactive*c_radical R_primary_radical_recombination 2*kt_xx*(c_radical)^2 R_termination 2*kt*(c_Mactive)^2
2.2. GEOMETRY
Length unit cm Angular unit deg
GEOMETRY STATISTICS
Description Value
Space dimension 3 Number of domains 15 Number of boundaries 130 Number of edges 333 Number of vertices 268

89
2.3. LAMINAR FLOW
SELECTION
Geometric entity level Domain Selection Domain 1
EQUATIONS
FEATURES
Fluid Properties 1 Initial Values 1 Wall 1 Inlet 1 Outlet 1
2.3.1. FLUID PROPERTIES
EQUATIONS
2.3.2. WALL
2.3.3. INLET 1

90
2.3.4. OUTLET
2.4. HEAT TRANSFER IN FLUIDS
EQUATIONS
FEATURES
Heat Transfer in Fluids 1 Initial Values 1 Thermal Insulation 1
Temperature 2 Temperature 3 Temperature 4 Temperature 5 Outflow
2.4.1. HEAT TRANSFER IN FLUIDS
2.4.2. THERMAL INSULATION

91
2.4.3. TEMPERATURE 2
2.4.4. TEMPERATURE 3
2.4.5. TEMPERATURE 4
2.4.6. TEMPERATURE 5
2.4.6. OUTFLOW
2.5. TRANSPORT OF CONCENTRATED SPECIES
EQUATIONS
FEATURES
Transport Properties 1 Initial Values 1 No Flux 1 Inflow 1 Outflow 1 Flux 1
2.5.1. TRANSPORT PROPERTIES

92
2.5.2. INITIAL VALUES
2.5.3. NO FLUX
2.5.3. INFLOW
2.5.4. OUTFLOW
2.5.5.FLUX
2.5.6. CHEMISTRY
FEATURES
1: I=>2R+P Species: I Species: R Species: P

93
2.7. BOUNDARY ODES AND DAES
Distributed ODE 1 Initial Values 1
DISTRIBUTED ODE
EQUATIONS
2.8. MULTIPHYSICS
2.8.1. TEMPERATURE COUPLING
2.8.2. FLOW COUPLING
2.9. MESHES
COMPUTATIONAL INFORMATION
Computation time 3 h 57 min 26 s CPU Intel(R) Core(TM) i7-6700HQ CPU @ 2.60GHz, 4 cores Operating system Windows 10
2.10. PARAMETRIC SWEEP
Parameter name Parameter value list Parameter unit
F_monomer 2.5,2,1.5,1,0.75,0.5 cm^3/min F_initiator 0.58,0.47,0.35,0.23,0.18,0.12 cm^3/min F_argon 0.62,1.23,1.85,2.47,2.77,3.08 cm^3/min

94
STUDY SETTINGS
Description Value
Sweep type Specified combinations Parameter name {F_monomer, F_initiator, F_argon} Parameter value list {2.5, 2, 1.5, 1, 0.75, 0.5, 0.58, 0.47, 0.35, 0.23, 0.18, 0.12, 0.62, 1.23,
1.85, 2.47, 2.77, 3.08} Unit {cm^3/min, cm^3/min, cm^3/min}
2.11. STATIONARY
PHYSICS AND VARIABLES SELECTION
Physics interface Discretization
Laminar Flow (spf) physics Heat Transfer in Fluids (ht) physics Transport of Concentrated Species (tcs) physics Chemistry (chem) physics Boundary ODEs and DAEs (bode) physics
RESULTS
STUDY 1/ SOLUTION 1
Cutline 3D 1
Cut Plane 1

95
PLOT GROUPS
3D Plot
F_monomer=1.5 cm^3/min, F_initiator=0.35 cm^3/min, F_argon=1.85 cm^3/min Slice: Mole fraction
Surface Plot
F_monomer=2.5 cm^3/min, F_initiator=0.58 cm^3/min, F_argon=0.62 cm^3/min Surface: DR (nm/min)
1D Plot

RESEARCH EXPERIENCE Doctor of Philosophy in Chemical Engineering, Turkey, 2017. Master of Science
, 2011. Bachelor of Science in Chemical Engine Erzurum/ Turkey, 2008. PhD Dissertation 2012-2017Experimental and Computational Investigation of Transport Phenomena in Initiated
Chemical Vapor Deposition (iCVD) Process
MSc Dissertation 2009-2011Oxidation of Ethanol and Carbon Monoxide on Alumina-Supported Metal/Metal
Oxide Xerogel Catalysts
CONFERENCE PRESENTATIONS
S. Ates al Vapor Deposition (iCVD) for Polymeric Thin- , Material Research Society (MRS), November 30-December 5, Boston, USA, 2014.
S. Atesxerogels made using a sol-gel method against Escherichia coli and Staphylococcus aureus Nanomemwater Conference, October 8-