![SNIP 2[1].01.07-85 Loads and Effects](https://static.fdocuments.us/doc/165x107/563db808550346aa9a8fe535/snip-210107-85-loads-and-effects.jpg)
UNIPETROL Group – Financial Results for the period of 01.07- 30.09.2005 November 2005.
6
UNIPETROL Group – Financial Results for the period of 01.07- 30.09.2005 November 2005
-
Upload
toby-williams -
Category
Documents
-
view
215 -
download
0
Transcript of UNIPETROL Group – Financial Results for the period of 01.07- 30.09.2005 November 2005.
UNIPETROL Group – Financial Results
for the period of 01.07- 30.09.2005
November 2005
2
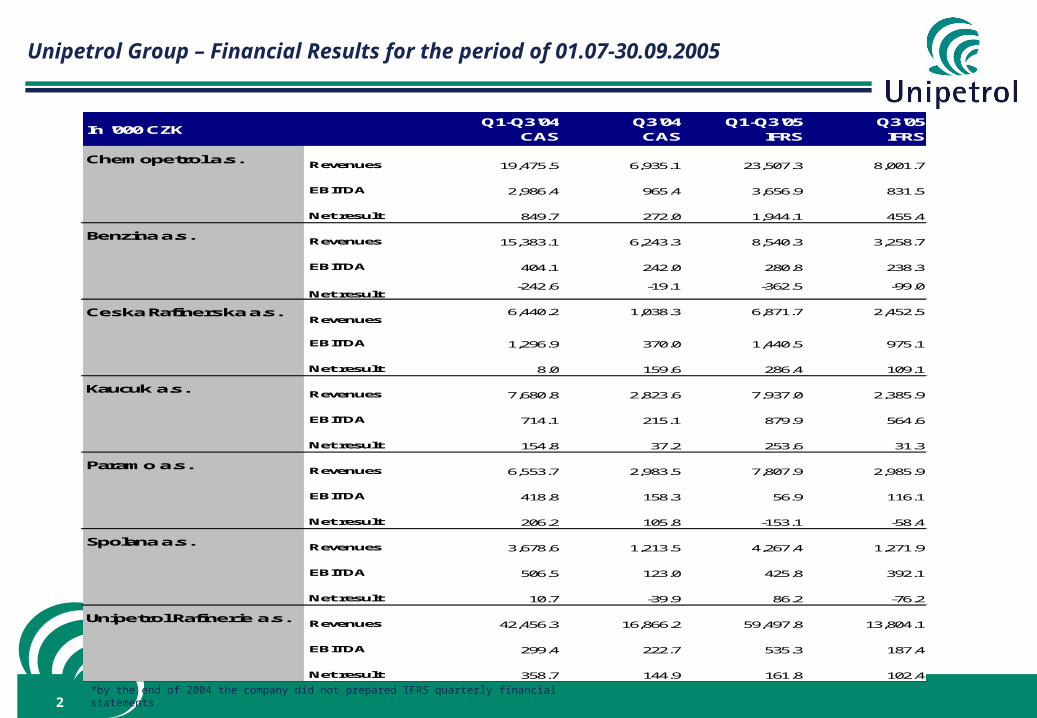
Unipetrol Group – Financial Results for the period of 01.07-30.09.2005
In '000 CZK Q1-Q3'04
CASQ3'04 CAS
Q1-Q3'05 IFRS
Q3'05 IFRS
Chemopetrol a.s.Revenues 19,475.5 6,935.1 23,507.3 8,001.7
EBITDA 2,986.4 965.4 3,656.9 831.5
Net result 849.7 272.0 1,944.1 455.4
Benzina a.s.Revenues 15,383.1 6,243.3 8,540.3 3,258.7
EBITDA 404.1 242.0 280.8 238.3
Net result-242.6 -19.1 -362.5 -99.0
Ceska Rafinerska a.s.Revenues
6,440.2 1,038.3 6,871.7 2,452.5
EBITDA 1,296.9 370.0 1,440.5 975.1
Net result 8.0 159.6 286.4 109.1
Kaucuk a.s.Revenues 7,680.8 2,823.6 7,937.0 2,385.9
EBITDA 714.1 215.1 879.9 564.6
Net result 154.8 37.2 253.6 31.3
Paramo a.s.Revenues 6,553.7 2,983.5 7,807.9 2,985.9
EBITDA 418.8 158.3 56.9 116.1
Net result 206.2 105.8 -153.1 -58.4
Spolana a.s.Revenues 3,678.6 1,213.5 4,267.4 1,271.9
EBITDA 506.5 123.0 425.8 392.1
Net result 10.7 -39.9 86.2 -76.2
Unipetrol Rafinerie a.s.Revenues 42,456.3 16,866.2 59,497.8 13,804.1
EBITDA 299.4 222.7 535.3 187.4
Net result 358.7 144.9 161.8 102.4
*by the end of 2004 the company did not prepared IFRS quarterly financial statements
3
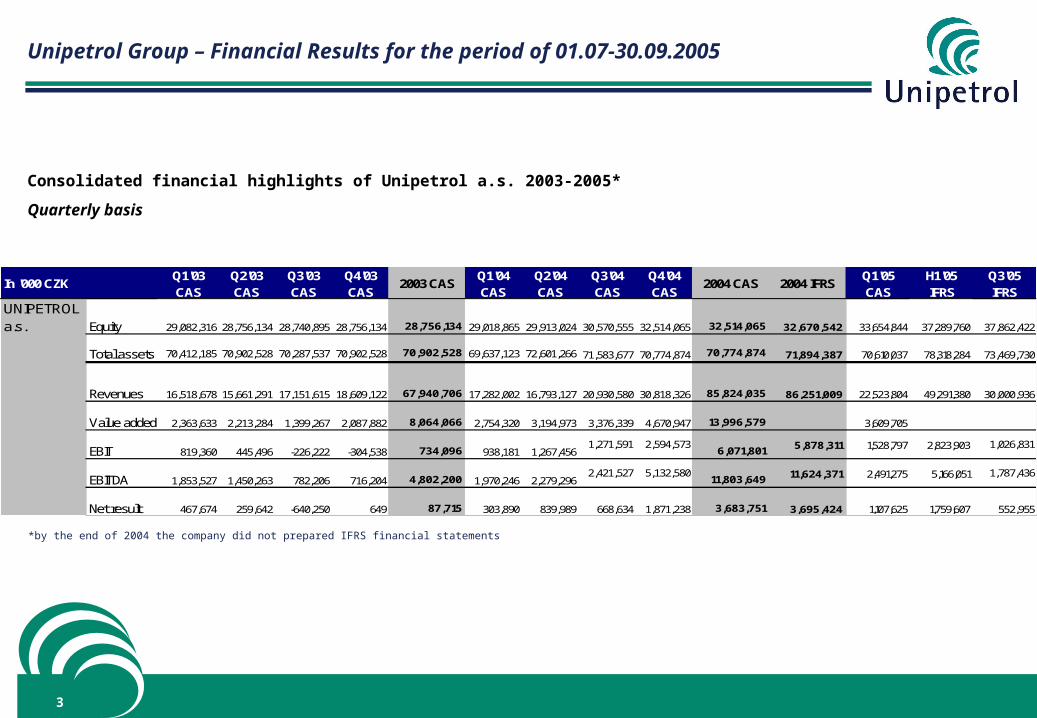
Unipetrol Group – Financial Results for the period of 01.07-30.09.2005
In '000 CZK Q1'03 CAS
Q2'03 CAS
Q3'03 CAS
Q4'03 CAS
2003 CASQ1'04 CAS
Q2'04 CAS
Q3'04 CAS
Q4'04 CAS
2004 CAS 2004 IFRSQ1'05 CAS
H1'05 IFRS
Q3'05 IFRS
UNIPETROL a.s. Equity 29,082,316 28,756,134 28,740,895 28,756,134 28,756,134 29,018,865 29,913,024 30,570,555 32,514,065 32,514,065 32,670,542 33,654,844 37,289,760 37,862,422
Total assets 70,412,185 70,902,528 70,287,537 70,902,528 70,902,528 69,637,123 72,601,266 71,583,677 70,774,874 70,774,874 71,894,387 70,610,037 78,318,284 73,469,730
Revenues 16,518,678 15,661,291 17,151,615 18,609,122 67,940,706 17,282,002 16,793,127 20,930,580 30,818,326 85,824,035 86,251,009 22,523,804 49,291,380 30,000,936
Value added 2,363,633 2,213,284 1,399,267 2,087,882 8,064,066 2,754,320 3,194,973 3,376,339 4,670,947 13,996,579 3,609,705
EBIT 819,360 445,496 -226,222 -304,538 734,096 938,181 1,267,4561,271,591 2,594,573
6,071,801 5,878,311 1,528,797 2,823,903 1,026,831
EBITDA 1,853,527 1,450,263 782,206 716,204 4,802,200 1,970,246 2,279,2962,421,527 5,132,580
11,803,649 11,624,371 2,491,275 5,166,051 1,787,436
Net result 467,674 259,642 -640,250 649 87,715 303,890 839,989 668,634 1,871,238 3,683,751 3,695,424 1,107,625 1,759,607 552,955
Consolidated financial highlights of Unipetrol a.s. 2003-2005*
Quarterly basis
*by the end of 2004 the company did not prepared IFRS financial statements
4
Unipetrol Group – Financial Results for the period of 01.07-30.09.2005
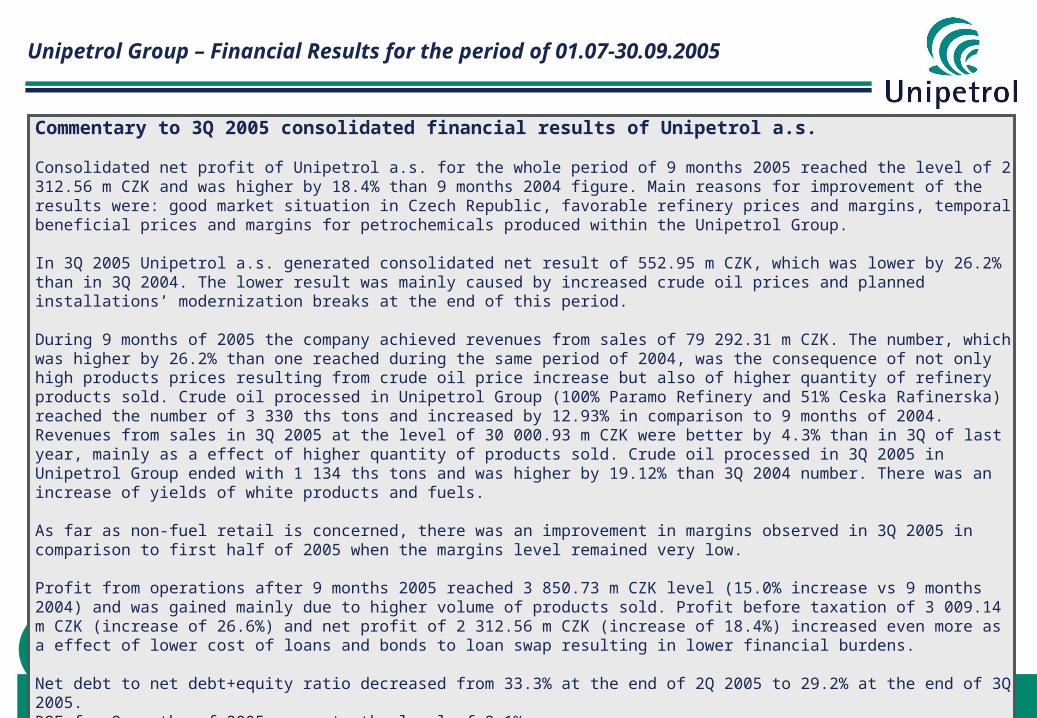
Commentary to 3Q 2005 consolidated financial results of Unipetrol a.s.
Consolidated net profit of Unipetrol a.s. for the whole period of 9 months 2005 reached the level of 2 312.56 m CZK and was higher by 18.4% than 9 months 2004 figure. Main reasons for improvement of the results were: good market situation in Czech Republic, favorable refinery prices and margins, temporal beneficial prices and margins for petrochemicals produced within the Unipetrol Group.
In 3Q 2005 Unipetrol a.s. generated consolidated net result of 552.95 m CZK, which was lower by 26.2% than in 3Q 2004. The lower result was mainly caused by increased crude oil prices and planned installations’ modernization breaks at the end of this period.
During 9 months of 2005 the company achieved revenues from sales of 79 292.31 m CZK. The number, which was higher by 26.2% than one reached during the same period of 2004, was the consequence of not only high products prices resulting from crude oil price increase but also of higher quantity of refinery products sold. Crude oil processed in Unipetrol Group (100% Paramo Refinery and 51% Ceska Rafinerska) reached the number of 3 330 ths tons and increased by 12.93% in comparison to 9 months of 2004. Revenues from sales in 3Q 2005 at the level of 30 000.93 m CZK were better by 4.3% than in 3Q of last year, mainly as a effect of higher quantity of products sold. Crude oil processed in 3Q 2005 in Unipetrol Group ended with 1 134 ths tons and was higher by 19.12% than 3Q 2004 number. There was an increase of yields of white products and fuels.
As far as non-fuel retail is concerned, there was an improvement in margins observed in 3Q 2005 in comparison to first half of 2005 when the margins level remained very low.
Profit from operations after 9 months 2005 reached 3 850.73 m CZK level (15.0% increase vs 9 months 2004) and was gained mainly due to higher volume of products sold. Profit before taxation of 3 009.14 m CZK (increase of 26.6%) and net profit of 2 312.56 m CZK (increase of 18.4%) increased even more as a effect of lower cost of loans and bonds to loan swap resulting in lower financial burdens.
Net debt to net debt+equity ratio decreased from 33.3% at the end of 2Q 2005 to 29.2% at the end of 3Q 2005. ROE for 9 months of 2005 presents the level of 8.1% p.a.
5
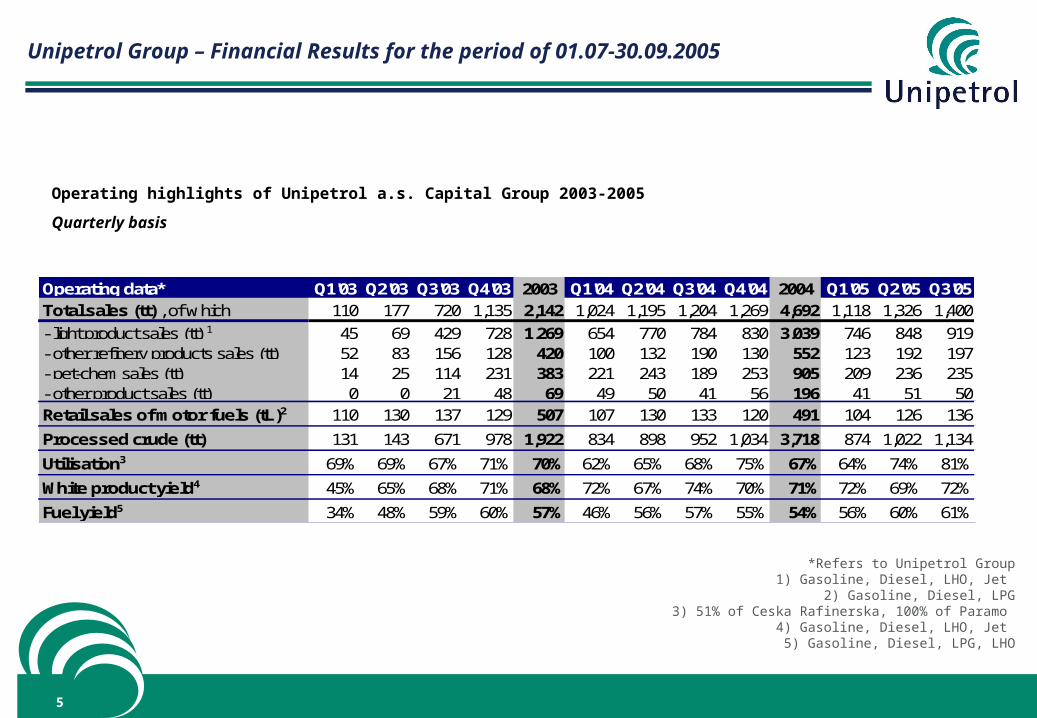
Unipetrol Group – Financial Results for the period of 01.07-30.09.2005
Operating highlights of Unipetrol a.s. Capital Group 2003-2005
Quarterly basis
Operating data* Q1'03 Q2'03 Q3'03 Q4'03 2003 Q1'04 Q2'04 Q3'04 Q4'04 2004 Q1'05 Q2'05 Q3'05Total sales (tt) , of which 110 177 720 1,135 2,142 1,024 1,195 1,204 1,269 4,692 1,118 1,326 1,400
- light product sales (tt) 1 45 69 429 728 1,269 654 770 784 830 3,039 746 848 919- other refinery products sales (tt) 52 83 156 128 420 100 132 190 130 552 123 192 197- pet-chem sales (tt) 14 25 114 231 383 221 243 189 253 905 209 236 235- other product sales (tt) 0 0 21 48 69 49 50 41 56 196 41 51 50Retail sales of motor fuels (tL)2 110 130 137 129 507 107 130 133 120 491 104 126 136
Processed crude (tt) 131 143 671 978 1,922 834 898 952 1,034 3,718 874 1,022 1,134
Utilisation3 69% 69% 67% 71% 70% 62% 65% 68% 75% 67% 64% 74% 81%
White product yield4 45% 65% 68% 71% 68% 72% 67% 74% 70% 71% 72% 69% 72%
Fuel yield5 34% 48% 59% 60% 57% 46% 56% 57% 55% 54% 56% 60% 61%
*Refers to Unipetrol Group1) Gasoline, Diesel, LHO, Jet
2) Gasoline, Diesel, LPG3) 51% of Ceska Rafinerska, 100% of Paramo
4) Gasoline, Diesel, LHO, Jet 5) Gasoline, Diesel, LPG, LHO
6
Unipetrol Group – Financial Results for the period of 01.07-30.09.2005
Refining activity:Crude oil processed in UniRaf in 3Q 2005 was higher by 26% in comparison with 3Q 2004 figures. Refinery margins in 3Q 2005 were higher than in previous year, 3Q2005 NRU=9.98 USD/bbl and 3Q2004 NRU=6.14 USD/bbl.In terms of volume UniRaf sold 32% more fuels in 3Q 2005 than year ago, in terms of value the change was even higher, by 41%.There was a revaluation of crude oil in IKL pipeline made with the effect of 150 m CZK due to crude oil price increase.Negative influence of exchange rates significantly decreased UniRaf net result in 3Q 2005. No positive correlation of crude oil price increase and lubs and bitumen prices – significantly lower margins achieved by Paramo
Retail activity:In 3Q 2005, a trend of purchase and sale prices increase continues. In 9 months of 2005 purchase price of fuel increased by 24.5%, sale price increased by 27%.Benzina commenced incorporation of Benzina Trade in 3Q 2005. Restructuring plan of Benzina operations started – operational and administrative cost cutting program and introduction of ORLEN standards of filling stations operations launched.
Petrochemical activity:Raw material (crude oil and naphtha) prices increased in 3Q 2005 due to non-market tensions – hurricanes, terrorists attacks, instability in crude oil producing countries.Sharp increase of prices and demand for monomers and plastics due to low supply from main world producers (production problems).In 3Q 2005 ammonia price increased as a result of natural gas price increase and higher demand for the product in USA.Modernization of Kaucuk installations in September resulted in shortage of some products. Modernizations of installations in Kaucuk’s competitors factories caused lower supply and resulted in price increase for company production. Higher demand for the company’s construction products noted.Opposite to the above there was lower demand for synthetic rubber observed from car producers due to high level of their inventories. Company also suffered low margins on polystyrenes as a result of high competition on the market.
Chemical activity:Increase of demand and prices for Spolana products noted in second part of 3Q 2005. Modernization of Spolana installations in September limited the possibility for better company’s results despite good market demand.Unfavorable EUR/USD exchange rate for Spolana and high prices of ethylene (main company’s raw material) negatively influenced the company results.