Underwater Robots - uni- · PDF fileComputer controlled robot travelling and operating underwater
Underwater Robot-Object Contact Perceptionusing Machine Learning on Force/Torque Sensor Feedback
Nawid Jamali1,2, Petar Kormushev1, Arnau C. Vinas3, Marc Carreras3, and Darwin G. Caldwell1
Abstract— Autonomous manipulation of objects requires re-liable information on robot-object contact state. Underwaterenvironments can adversely affect sensing modalities such asvision, making them unreliable. In this paper we investi-gate underwater robot-object contact perception between anautonomous underwater vehicle and a T-bar valve using aforce/torque sensor and the robot’s proprioceptive information.We present an approach in which machine learning is used tolearn a classifier for different contact states, namely, a contactaligned with the central axis of the valve, an edge contact andno contact. To distinguish between different contact states, therobot performs an exploratory behavior that produces distinctpatterns in the force/torque sensor. The sensor output formsa multidimensional time-series. A probabilistic clustering algo-rithm is used to analyze the time-series. The algorithm dissectsthe multidimensional time-series into clusters, producing a one-dimensional sequence of symbols. The symbols are used to traina hidden Markov model, which is subsequently used to predictnovel contact conditions. We show that the learned classifiercan successfully distinguish the three contact states with anaccuracy of 72% ± 12 %.
I. INTRODUCTION
Autonomous manipulation of objects in underwater envi-ronments is a challenging task. The turbidity in water makesvisual detection of objects unreliable. Thus, sensing a directcontact with an object is an important modality that can helpin successfully inspecting and/or manipulating the object.Applications of such a system is not limited to underwatermanipulation. For example, in disaster zones a burst pipemay reduce the quality of vision. It can also be appliedto a number of manipulations tasks including domesticrobots, search and rescue, and manipulation in hazardousenvironments such as decommissioning of a nuclear plant.
In this paper we investigate the problem of underwatercontact perception that relies only on direct contact. Withinthe framework of the PANDORA project [1], [2] we consideran object inspection problem, in which, an autonomousunderwater vehicle (AUV) inspects and manipulates a T-barvalve attached to a control panel. The AUV is free floating inthe water, that is, it is not allowed to dock during inspectionand manipulation. We propose a machine learning approach
This research has received funding from the European Unions SeventhFramework Programme under grant agreement no. ICT-288273.
1 Department of Advanced Robotics, Istituto Italiano di Tecnologia, viaMorego, 30, 16163 Genova, Italy.
2 iCub Facility, Istituto Italiano di Tecnologia, via Morego, 30, 16163Genova, Italy.
3 Computer Vision and Robotics Group (VICOROB), University ofGirona, 17071, Girona, Spain.
Email:{nawid.jamali, petar.kormushev,darwin.caldwell}@iit.it, {arnau.carrera,marc.carreras}@udg.edu
Fig. 1. Experimental setup for underwater experiments.
that predicts the location of a contact between a roboticgripper, attached to the AUV, and the T-bar valve. Such asystem is necessary to allow the AUV to safely manipulatethe valve.
We propose an exploratory behavior that can be used todetermine the contact location. At each contact location ofinterest, the exploratory behavior excites the force/torquesensor differently, producing a unique pattern. The sensordata forms a multidimensional time-series. Contact statessuch as no-contact/contact with the valve can be detectedby analyzing the temporal patterns that emerge in the time-series data. Our contribution is a robust underwater contactstate estimation that relies only on non-vision data, namely,the contact forces and torques.
We learn a classifier for predicting a contact state using ourpreviously developed method to analyze temporal patternsin a multidimensional time-series data [3]. In this paper weapply the learning method to a new problem, i.e., under-water robot-object contact state estimation. We modified themethod by adding the control signal in the feature space ofthe algorithm to correlate patterns that arise due to controlcommands. In Section III we provide the details of themethod and describe how it is applied to the current problem.
Fig. 1 shows the experimental setup for underwater exper-iments used to test the proposed method. A passive gripper isattached to a robotic arm (ECA robotics ARM 5E Micro). Awaterproofed ATI Mini-45 force/torque sensor is sandwiched
between the gripper and the arm’s end-effector. The arm isconnected to an autonomous underwater vehicle (AUV), theGirona 500 [4]. A T-bar valve is attached to a panel thatresembles a typical control panel found in underwater struc-tures. Under a teleoperator’s control, the robot approaches thepanel and performs the proposed exploratory behavior, whichas illustrated by the blue arrow in Fig. 1, is a rotary move-ment with a given angle-of-rotation. This action excites theforce/torque sensor differently at each contact location. Weshow that using the proposed exploratory behavior the robotis capable of learning a classifier to successfully predict thecontact state: no-contact, edge-contact, and center-contact.
II. RELATED WORK
Earlier research in valve detection and manipulation as-sumes a structured environment, where the robot stores de-tailed information about the environment [5], [6]. Non-visionsensors such as force/torque sensors, binary touch sensorsand inductive proximity sensors have been used to confirmcontact and monitor applied forces [5], and detect orientationof a valve handle and manipulate the valve without over-tightening/loosening [6]. However, these approaches havebeen limited to in-air applications. To facilitate underwatermanipulation, grippers instrumented with tactile sensors thatcan operate underwater have been developed [7], [8].
Anisi et al. [6] propose use of an inductive proximitysensor and a torque sensor to detect the orientation of ametallic T-bar valve handle and subsequently manipulatethe valve without over-tightening/over-loosening the valve.However, use of an inductive proximity sensor limits theapplication of the system to metallic objects.
Marani et al. [9] used vision to locate an underwater objectand hook a cable to it so that it can be lifted to surface.Recently, Prats et al. [10] used a laser scanner to build a 3Dpoint cloud of an underwater object, which is then used toplan and execute a grasp. However, in both cases an operatorhas to indicate the region of interest to the robot. Moreover,vision and laser are adversely affected by turbidity in water.
III. METHODOLOGY
The input to the algorithm consists of six-dimensionalforce/torque sensor data and robot’s proprioceptive informa-tion, namely, the AUV’s pitch, and the end-effector’s depth.The rational for the selected features will be discussed inSection IV-C, where we describe the exploratory behavior.We also include the control command, that is, the angle-of-rotation in our analysis, resulting in a nine-dimensional time-series data. To learn concepts from a multidimensional time-series we divide the problem into two stages: dimensionalityreduction using clustering and temporal pattern extraction.In the first stage, probabilistic clustering [11] is appliedto discover the intrinsic structure of the data. Clusteringtransforms the multidimensional time-series into a sequenceof symbols, each of which is an identifier for a cluster.Thus, an abstract contact condition such as the locationof a contact can be represented by a sequence of clusteridentifiers. In the second stage, using a supervised hidden
Training Data
Preprocessing
Test Data
F/T &Position
ControlCommand
PrincipalComponent
Analysis (PCA)
F/T &Position
ControlCommand
PCA Model
Clustering Mixture Model
Contact-Pattern ModelTemporal
Pattern Learning
Prediction
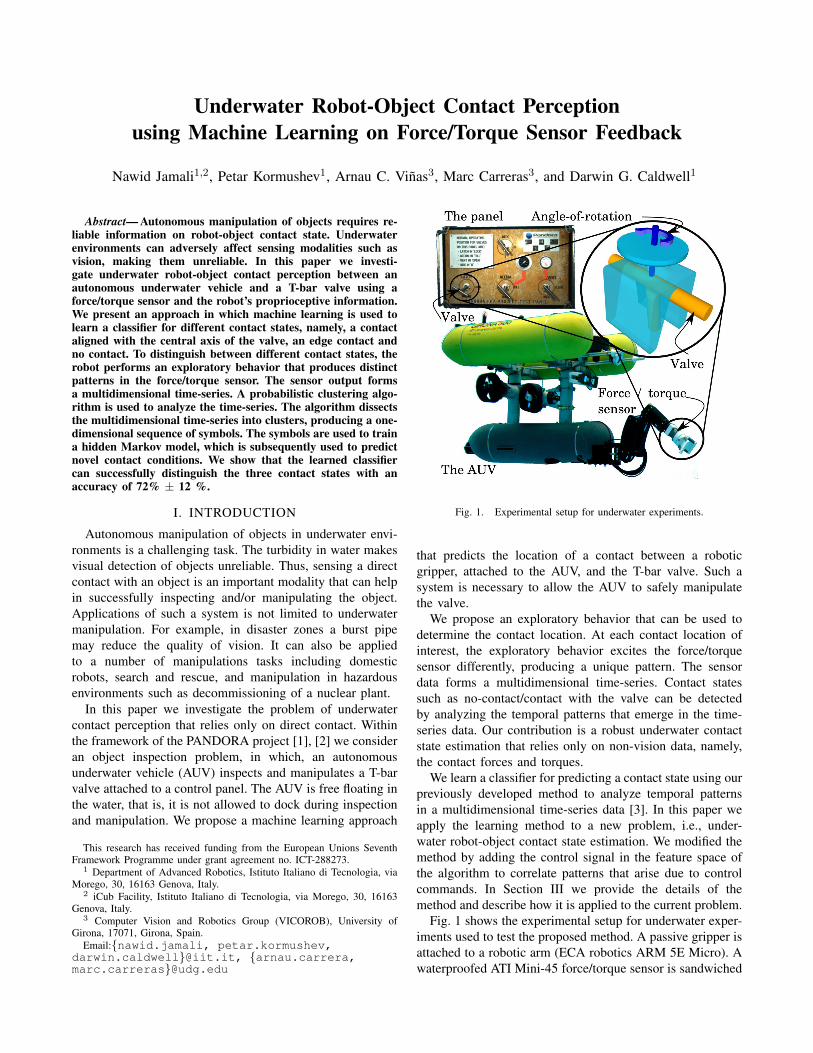
Fig. 2. Overview of the learning method.
Markov model (HMM), the algorithm analyzes the sequenceand builds a probabilistic model of temporal patterns thatcorrespond to different abstract contact conditions.
An overview of the learning algorithm is shown in Fig. 2.The first step of the analysis involves preprocessing thedata. The clustering method assumes that all of the vari-ables are independent [11]. Hence, in the first stage oftraining, the sensor data are projected onto a new basisusing principal component analysis (PCA). The principalcomponent coefficients from the training data are saved.Later, these coefficients are used to transform the test datato the new coordinate system. The control command alongwith the output of PCA are then used as an input to theclustering algorithm. Clustering plays two roles. Firstly,clustering is used to discover the intrinsic structure withinthe data. Secondly, it reduces the high dimensional time-series data into a one-dimensional sequence of clusters. Themixture model output by the clustering algorithm is alsosaved, which, is subsequently used to transform the test datainto a sequence of clusters. Each cluster is denoted by aletter. S = {BEDBCCACDDADECBCCAEBDA. . . } is anexample of a sequence of cluster memberships.
In the second stage, the output of the clustering algorithm,that is, the sequence of cluster memberships is analyzed todiscover and learn different patterns that represent differentcontact locations. We want to discover unique patterns thatemerge during each contact. For example, in the sequence S,BCCA is a recurring pattern that can be learned as a patternthat represents, say, a center-contact. The model for thesepatterns is also saved.
The algorithm is tested using an unseen test set. In thetesting phase, the models saved during training are usedto transform the data into a temporal sequence of clustermemberships. The models for the patterns discovered during
training is used to predict the state of a contact. For example,encountering the pattern BCCA will signify a center-contact.We use HMMs to discover the patterns for each contact con-dition. The following sections provide a detailed descriptionof each step.
A. Preprocessing
All signals are preprocessed before any further analysis isperformed. The preprocessing procedures are implementedin MATLAB.
1) Drift compensation: Force/toque sensors use straingauges to determine applied forces and torques. The outputsignal of strain gauges drift over time even if there is noapplied stimulus. Drift compensation is commonly used inindustrial and academic applications of strain gauge basedsensors. We use the force/torque data just before a contactto calculate a bias point. The bias point is subtracted fromthe force/torque output.
2) Filtering: The force/torque data are sampled at250 Hz. The signals are oversampled to avoid aliasing. Theforce/torque data is filtered using a digital filter with a 3 dBpoint of 2 Hz. After application of the digital filters, the datais downsampled by a factor of 25.
3) Scaling: The torque data is an order of magnitudesmaller than the forces. We scale the torques by a factor of 10to make the torques comparable to the forces. Similarly, theAUV’s pitch and the angle-of-rotation, which are measuredin radians, are scaled by a factor of 10.
B. Principal Component Analysis
Principal component analysis (PCA) is a mathematicaltransformation that converts a set of variables to a new basis,called the principal components. Each principal componentis a linear combination of the original variables. In thisspace, all variables are orthogonal to each other, i.e, they areuncorrelated. Moreover, in the principal component space,the first component explains the greatest variance in thedata, every subsequent component captures lower varianceas compared to the preceding component. A consequence ofthis property is that PCA can also be used as a dimensionalityreduction tool.
Dimensionality reduction is achieved by only keeping thelower components. A rule of thumb is to drop componentsonce the ratio of cumulative-variance1 to total-variance hasexceeded a predetermined threshold, we used a ratio of 0.9.Hence, in the subsequent analysis we only consider thecomponents that have not exceeded the cumulative-variancethreshold. In our experiments, this threshold was exceededat the 5th component. In the subsequent analysis, we onlyconsider 5 components.
C. Control Command
The control command plays an important role in inducingthe sensors. The control signal for our experiments is thecommanded angle-of-rotation. We feed the control command
1Cumulative-variance is calculated by summing the variance of allcomponents up to the component of interest.
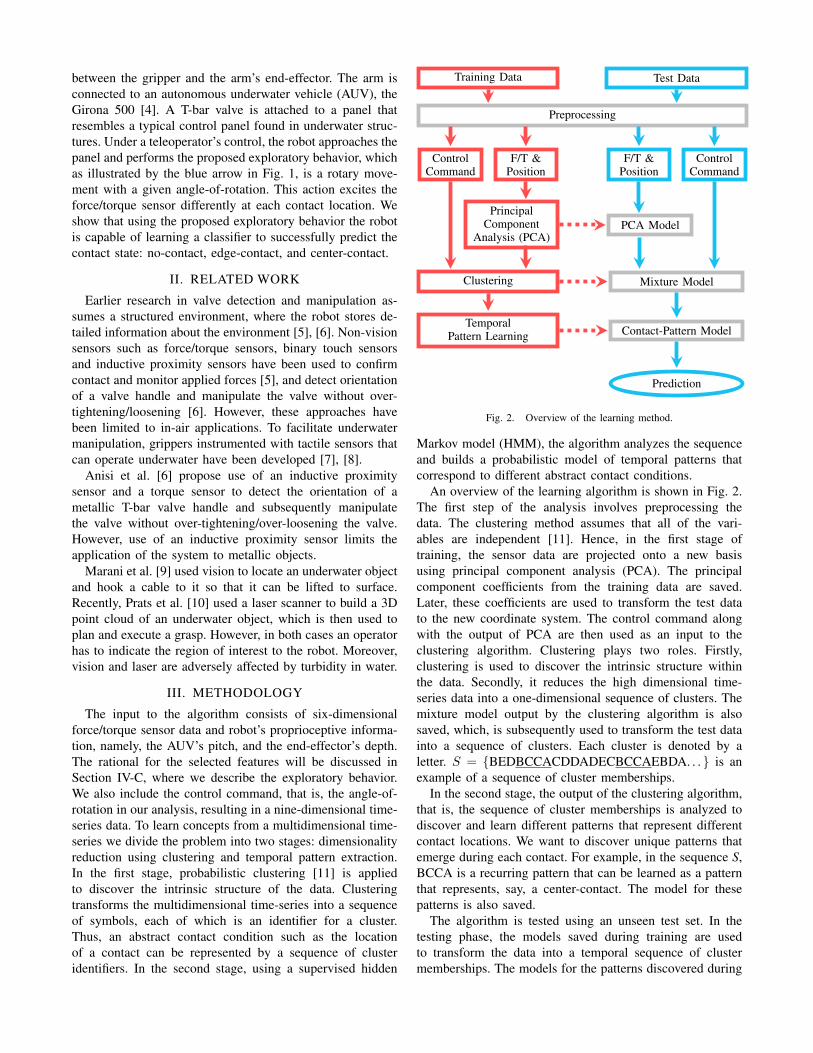
Soriginal = {BCCDDCAAAABAABB. . . }Slabelled =
{(B,N )(C,N )(C,N )(D,N )(D,N )(C, E)(A, E)(A, E)(A, E)(A, E)(B, C)(A, C)(A, C)(B, C)(B, C) . . .
}(a) Example of a feature vector.
N E C
BA C D
(b) A three state hidden Markov model.
Fig. 3. A feature vector and a hidden Markov model. The letters A, B, Cand D indicate membership to the corresponding cluster. The letters N , E ,and C represent contact states: no-contact, an edge-contact, and a center-contact, respectively.
directly to the clustering algorithm to allow the algorithm tocorrelate the control with the sensor data.
D. Clustering
We apply probabilistic clustering [11], which uses theminimum message length (MML) principle as the optimiza-tion criterion, to build a Gaussian mixture model of thedata. We use MML as an optimization criterion to stop theclustering algorithm. Any other method such as the minimumdescription length [12] will also work.
E. Learning
Once the multidimensional signals from the robot aretransformed into a temporal sequence of clusters, we useHMMs to discover the patterns for each contact condition.The training examples are generated by allowing the robotto perform an action. In this case, the action is to performan exploratory behavior at a contact point. The trainingsequence is labeled with the contact location, which isrecorded during data collection. This allows the algorithmto learn a mapping from the temporal sequence of clustersto a classification of the contact state: no-contact, an edge-contact, and a center-contact. The accuracy of the classifier istested by applying it to a novel sequence, where the contactstate is unknown to the robot.
Fig. 3(a) shows an example of a sequence generated afterthe application of the clustering algorithm. The correspond-ing feature vector is also shown and consists of temporal se-quence of couples of the form (cluster-membership, contact-state). Fig. 3(b) shows the topology of the HMM used tolearn a representation for the emerging temporal patterns.The topology of the HMM is determined by the numberof contact states. It has three states, one for each contactlocation, which will be explained in Section IV-B. The HMMis trained using the sequence of clusters as the observation.When the robot is presented with a novel pattern, the robotuses the model to make a prediction.
IV. EXPERIMENTAL SETUP
The experimental setup illustrated in Fig. 1, described inSection I, was used to test the method underwater in a pool.In this section we will describe the waterproof force/torquesensor that was developed to facilitate underwater experi-ments. We will also define the contact locations, which isfollowed by a description of the exploratory behavior and adetailed description of the experiments.
A. Waterproof force/torque sensor
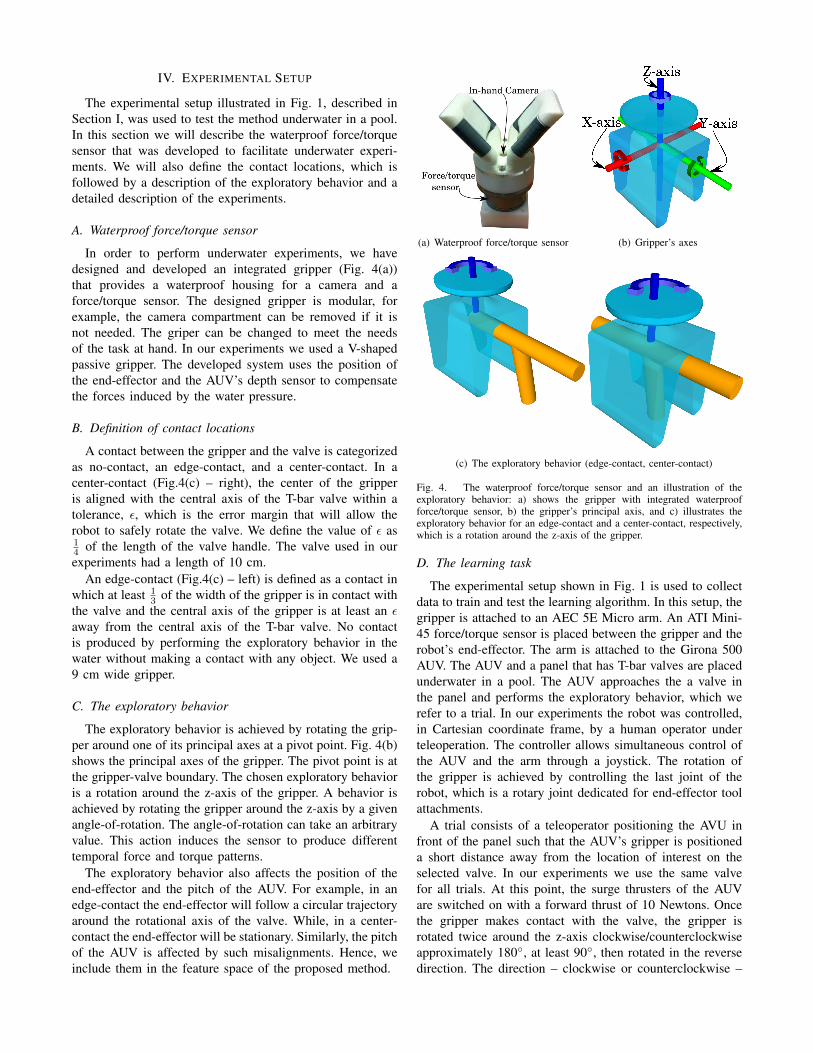
In order to perform underwater experiments, we havedesigned and developed an integrated gripper (Fig. 4(a))that provides a waterproof housing for a camera and aforce/torque sensor. The designed gripper is modular, forexample, the camera compartment can be removed if it isnot needed. The griper can be changed to meet the needsof the task at hand. In our experiments we used a V-shapedpassive gripper. The developed system uses the position ofthe end-effector and the AUV’s depth sensor to compensatethe forces induced by the water pressure.
B. Definition of contact locations
A contact between the gripper and the valve is categorizedas no-contact, an edge-contact, and a center-contact. In acenter-contact (Fig.4(c) – right), the center of the gripperis aligned with the central axis of the T-bar valve within atolerance, ε, which is the error margin that will allow therobot to safely rotate the valve. We define the value of ε as14 of the length of the valve handle. The valve used in ourexperiments had a length of 10 cm.
An edge-contact (Fig.4(c) – left) is defined as a contact inwhich at least 1
3 of the width of the gripper is in contact withthe valve and the central axis of the gripper is at least an εaway from the central axis of the T-bar valve. No contactis produced by performing the exploratory behavior in thewater without making a contact with any object. We used a9 cm wide gripper.
C. The exploratory behavior
The exploratory behavior is achieved by rotating the grip-per around one of its principal axes at a pivot point. Fig. 4(b)shows the principal axes of the gripper. The pivot point is atthe gripper-valve boundary. The chosen exploratory behavioris a rotation around the z-axis of the gripper. A behavior isachieved by rotating the gripper around the z-axis by a givenangle-of-rotation. The angle-of-rotation can take an arbitraryvalue. This action induces the sensor to produce differenttemporal force and torque patterns.
The exploratory behavior also affects the position of theend-effector and the pitch of the AUV. For example, in anedge-contact the end-effector will follow a circular trajectoryaround the rotational axis of the valve. While, in a center-contact the end-effector will be stationary. Similarly, the pitchof the AUV is affected by such misalignments. Hence, weinclude them in the feature space of the proposed method.
(a) Waterproof force/torque sensor (b) Gripper’s axes
(c) The exploratory behavior (edge-contact, center-contact)
Fig. 4. The waterproof force/torque sensor and an illustration of theexploratory behavior: a) shows the gripper with integrated waterproofforce/torque sensor, b) the gripper’s principal axis, and c) illustrates theexploratory behavior for an edge-contact and a center-contact, respectively,which is a rotation around the z-axis of the gripper.
D. The learning task
The experimental setup shown in Fig. 1 is used to collectdata to train and test the learning algorithm. In this setup, thegripper is attached to an AEC 5E Micro arm. An ATI Mini-45 force/torque sensor is placed between the gripper and therobot’s end-effector. The arm is attached to the Girona 500AUV. The AUV and a panel that has T-bar valves are placedunderwater in a pool. The AUV approaches the a valve inthe panel and performs the exploratory behavior, which werefer to a trial. In our experiments the robot was controlled,in Cartesian coordinate frame, by a human operator underteleoperation. The controller allows simultaneous control ofthe AUV and the arm through a joystick. The rotation ofthe gripper is achieved by controlling the last joint of therobot, which is a rotary joint dedicated for end-effector toolattachments.
A trial consists of a teleoperator positioning the AVU infront of the panel such that the AUV’s gripper is positioneda short distance away from the location of interest on theselected valve. In our experiments we use the same valvefor all trials. At this point, the surge thrusters of the AUVare switched on with a forward thrust of 10 Newtons. Oncethe gripper makes contact with the valve, the gripper isrotated twice around the z-axis clockwise/counterclockwiseapproximately 180◦, at least 90◦, then rotated in the reversedirection. The direction – clockwise or counterclockwise –
depended on the direction that would produce a 180◦ rotationwithout exceeding the software limits of the joint. Note, sincewe use the control command in our learning method, thedirection of the rotation has no adverse effect.
To expose the algorithm to variations in the gripper-valvecontact, each location of interest is sampled three times. Wesampled both edges, namely, left edge and right edge of thevalve for the edge-contact, hence the dataset has twice asmany samples for the edge-contact as the center-contact. Theattached video visualizes a trial, described in this section, atdifferent locations of interest.
Three separate datasets were collected resulting in a largedatabase consisting of nine samples for each location. Forthe no-contact scenario we collected one sample per set.
V. RESULTS
The feature vector for the learning algorithm is a nine-dimensional time-series that consists of the six-dimensionalforce/torque sensor data, the AUV’s pitch, the end-effector’sposition and the commanded angle-of-rotation. As describedin Section III-E, a three state HMM was trained for theexploratory behavior.
A. Evaluation method
1) Threefold cross-validation: To evaluate the proposedapproach an HMM model was learned using two of thethree dataset while the third dataset was used to evaluatethe accuracy of the learned model. We repeat this processto get a threefold cross-validation of the performance of theproposed method.
2) Classification point: As described earlier in Section IV-D, in each sample the gripper was rotated twice, that is, fromthe starting position to a final position of at least 90◦ awayfrom the starting position, then back, twice. This results intofour starting points sample of a contact location. Since weare interested in assessing the state of the contact for safemanipulation, we take the prediction of the classifier at thesepoints as the prediction of the contact state to evaluate theaccuracy of the proposed method. We wait n samples afterthe gripper starts rotating to allow the HMMs to converge.The value of n is arbitrary. Smaller values will increase thesafety margin, but the prediction may not be reliable. In ourexperiments, we took a sample halfway between the startingpoint and the stopping point, at this point the HMM shouldhave enough evidence to converge.
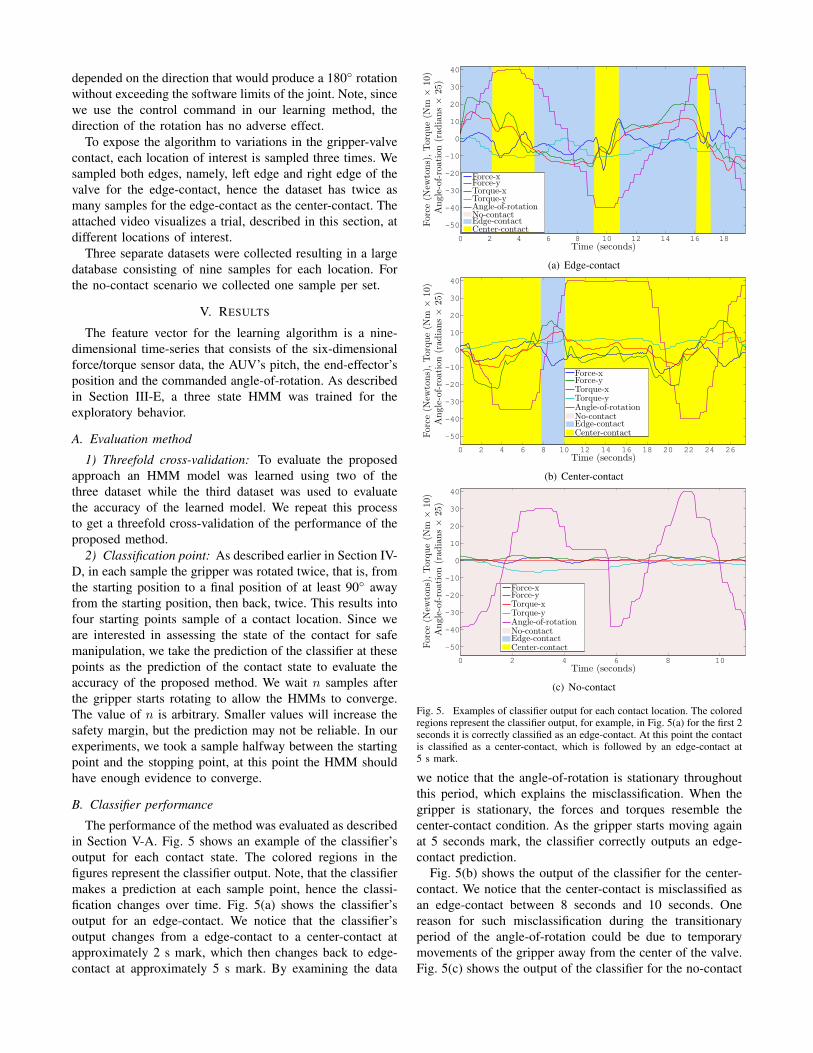
B. Classifier performance
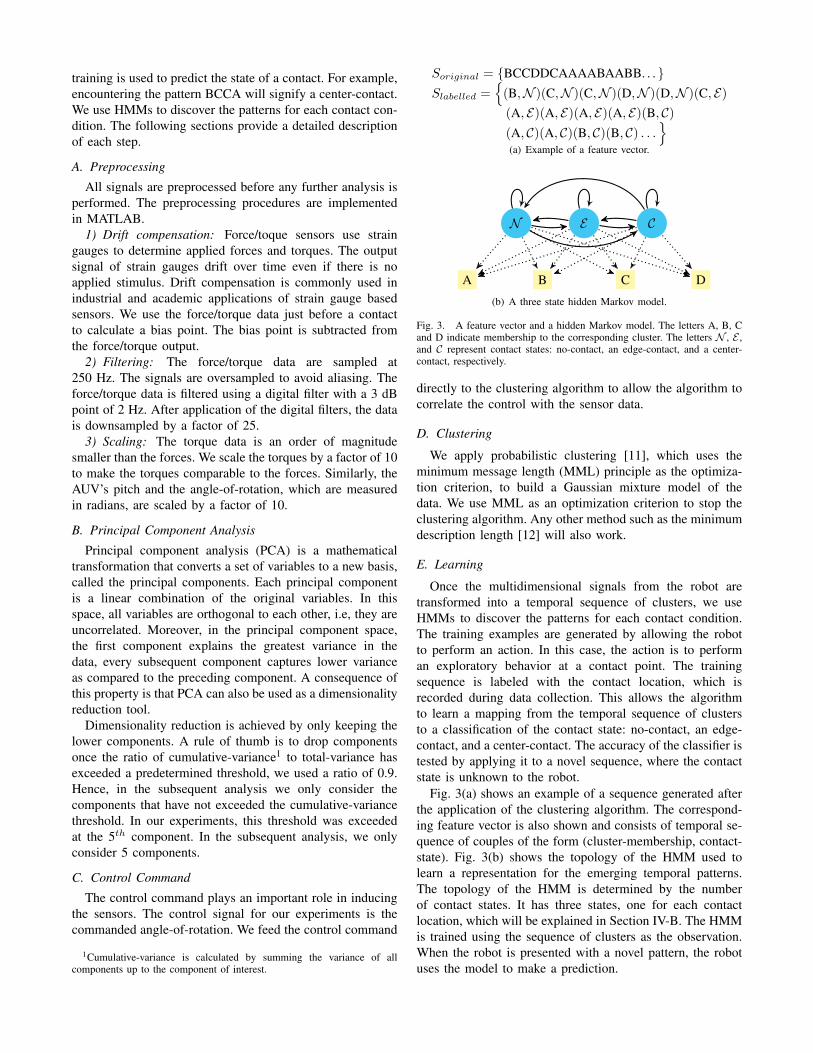
The performance of the method was evaluated as describedin Section V-A. Fig. 5 shows an example of the classifier’soutput for each contact state. The colored regions in thefigures represent the classifier output. Note, that the classifiermakes a prediction at each sample point, hence the classi-fication changes over time. Fig. 5(a) shows the classifier’soutput for an edge-contact. We notice that the classifier’soutput changes from a edge-contact to a center-contact atapproximately 2 s mark, which then changes back to edge-contact at approximately 5 s mark. By examining the data
Time (seconds)
Force(N
ewtons),Torque(N
m×
10)
Angle-of-roation(radians×
25)
0 2 4 6 8 10 12 14 16 18
−50
−40
−30
−20
−10
0
10
20
30
40
Force-xForce-yTorque-xTorque-yAngle-of-rotationNo-contactEdge-contactCenter-contact
(a) Edge-contact
Time (seconds)
Force(N
ewtons),Torque(N
m×
10)
Angle-of-roation(radians×
25)
0 2 4 6 8 10 12 14 16 18 20 22 24 26
−50
−40
−30
−20
−10
0
10
20
30
40
Force-xForce-yTorque-xTorque-yAngle-of-rotationNo-contactEdge-contactCenter-contact
(b) Center-contact
Time (seconds)
Force(N
ewtons),Torque(N
m×
10)
Angle-of-roation(radians×
25)
0 2 4 6 8 10
−50
−40
−30
−20
−10
0
10
20
30
40
Force-xForce-yTorque-xTorque-yAngle-of-rotationNo-contactEdge-contactCenter-contact
(c) No-contact
Fig. 5. Examples of classifier output for each contact location. The coloredregions represent the classifier output, for example, in Fig. 5(a) for the first 2seconds it is correctly classified as an edge-contact. At this point the contactis classified as a center-contact, which is followed by an edge-contact at5 s mark.
we notice that the angle-of-rotation is stationary throughoutthis period, which explains the misclassification. When thegripper is stationary, the forces and torques resemble thecenter-contact condition. As the gripper starts moving againat 5 seconds mark, the classifier correctly outputs an edge-contact prediction.
Fig. 5(b) shows the output of the classifier for the center-contact. We notice that the center-contact is misclassified asan edge-contact between 8 seconds and 10 seconds. Onereason for such misclassification during the transitionaryperiod of the angle-of-rotation could be due to temporarymovements of the gripper away from the center of the valve.Fig. 5(c) shows the output of the classifier for the no-contact
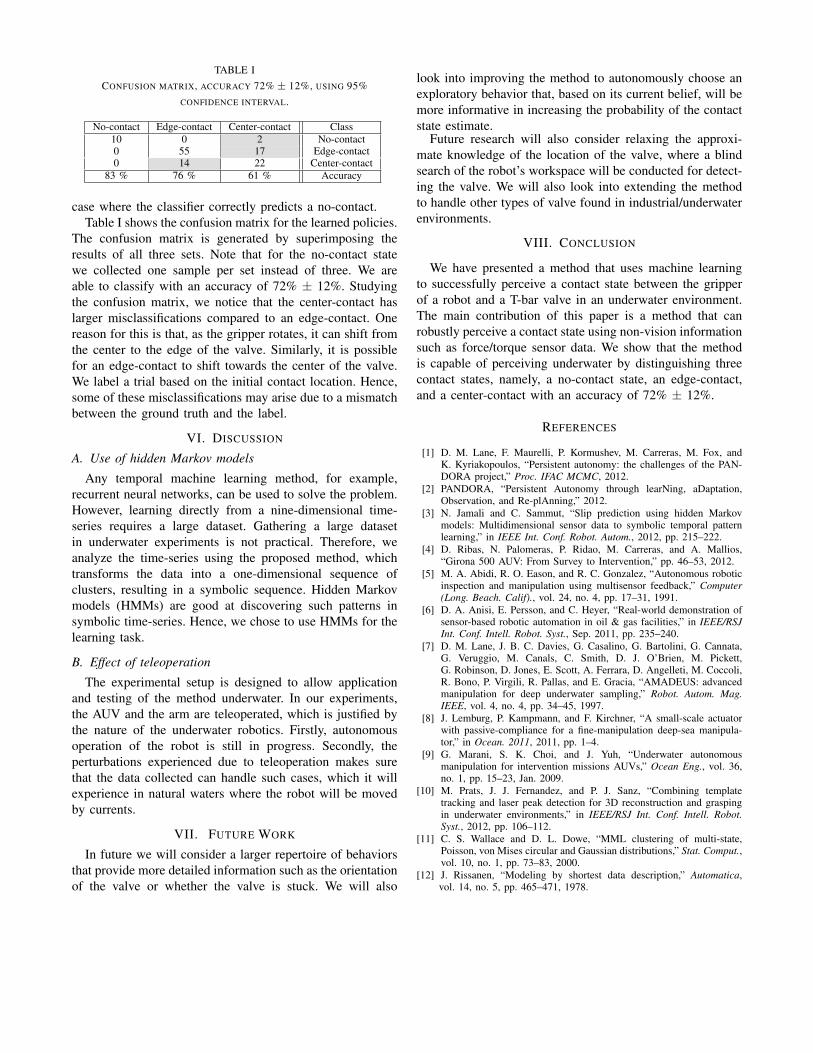
TABLE ICONFUSION MATRIX, ACCURACY 72% ± 12%, USING 95%
CONFIDENCE INTERVAL.
No-contact Edge-contact Center-contact Class10 0 2 No-contact0 55 17 Edge-contact0 14 22 Center-contact
83 % 76 % 61 % Accuracy
case where the classifier correctly predicts a no-contact.Table I shows the confusion matrix for the learned policies.
The confusion matrix is generated by superimposing theresults of all three sets. Note that for the no-contact statewe collected one sample per set instead of three. We areable to classify with an accuracy of 72% ± 12%. Studyingthe confusion matrix, we notice that the center-contact haslarger misclassifications compared to an edge-contact. Onereason for this is that, as the gripper rotates, it can shift fromthe center to the edge of the valve. Similarly, it is possiblefor an edge-contact to shift towards the center of the valve.We label a trial based on the initial contact location. Hence,some of these misclassifications may arise due to a mismatchbetween the ground truth and the label.
VI. DISCUSSION
A. Use of hidden Markov models
Any temporal machine learning method, for example,recurrent neural networks, can be used to solve the problem.However, learning directly from a nine-dimensional time-series requires a large dataset. Gathering a large datasetin underwater experiments is not practical. Therefore, weanalyze the time-series using the proposed method, whichtransforms the data into a one-dimensional sequence ofclusters, resulting in a symbolic sequence. Hidden Markovmodels (HMMs) are good at discovering such patterns insymbolic time-series. Hence, we chose to use HMMs for thelearning task.
B. Effect of teleoperation
The experimental setup is designed to allow applicationand testing of the method underwater. In our experiments,the AUV and the arm are teleoperated, which is justified bythe nature of the underwater robotics. Firstly, autonomousoperation of the robot is still in progress. Secondly, theperturbations experienced due to teleoperation makes surethat the data collected can handle such cases, which it willexperience in natural waters where the robot will be movedby currents.
VII. FUTURE WORK
In future we will consider a larger repertoire of behaviorsthat provide more detailed information such as the orientationof the valve or whether the valve is stuck. We will also
look into improving the method to autonomously choose anexploratory behavior that, based on its current belief, will bemore informative in increasing the probability of the contactstate estimate.
Future research will also consider relaxing the approxi-mate knowledge of the location of the valve, where a blindsearch of the robot’s workspace will be conducted for detect-ing the valve. We will also look into extending the methodto handle other types of valve found in industrial/underwaterenvironments.
VIII. CONCLUSION
We have presented a method that uses machine learningto successfully perceive a contact state between the gripperof a robot and a T-bar valve in an underwater environment.The main contribution of this paper is a method that canrobustly perceive a contact state using non-vision informationsuch as force/torque sensor data. We show that the methodis capable of perceiving underwater by distinguishing threecontact states, namely, a no-contact state, an edge-contact,and a center-contact with an accuracy of 72% ± 12%.
REFERENCES
[1] D. M. Lane, F. Maurelli, P. Kormushev, M. Carreras, M. Fox, andK. Kyriakopoulos, “Persistent autonomy: the challenges of the PAN-DORA project,” Proc. IFAC MCMC, 2012.
[2] PANDORA, “Persistent Autonomy through learNing, aDaptation,Observation, and Re-plAnning,” 2012.
[3] N. Jamali and C. Sammut, “Slip prediction using hidden Markovmodels: Multidimensional sensor data to symbolic temporal patternlearning,” in IEEE Int. Conf. Robot. Autom., 2012, pp. 215–222.
[4] D. Ribas, N. Palomeras, P. Ridao, M. Carreras, and A. Mallios,“Girona 500 AUV: From Survey to Intervention,” pp. 46–53, 2012.
[5] M. A. Abidi, R. O. Eason, and R. C. Gonzalez, “Autonomous roboticinspection and manipulation using multisensor feedback,” Computer(Long. Beach. Calif)., vol. 24, no. 4, pp. 17–31, 1991.
[6] D. A. Anisi, E. Persson, and C. Heyer, “Real-world demonstration ofsensor-based robotic automation in oil & gas facilities,” in IEEE/RSJInt. Conf. Intell. Robot. Syst., Sep. 2011, pp. 235–240.
[7] D. M. Lane, J. B. C. Davies, G. Casalino, G. Bartolini, G. Cannata,G. Veruggio, M. Canals, C. Smith, D. J. O’Brien, M. Pickett,G. Robinson, D. Jones, E. Scott, A. Ferrara, D. Angelleti, M. Coccoli,R. Bono, P. Virgili, R. Pallas, and E. Gracia, “AMADEUS: advancedmanipulation for deep underwater sampling,” Robot. Autom. Mag.IEEE, vol. 4, no. 4, pp. 34–45, 1997.
[8] J. Lemburg, P. Kampmann, and F. Kirchner, “A small-scale actuatorwith passive-compliance for a fine-manipulation deep-sea manipula-tor,” in Ocean. 2011, 2011, pp. 1–4.
[9] G. Marani, S. K. Choi, and J. Yuh, “Underwater autonomousmanipulation for intervention missions AUVs,” Ocean Eng., vol. 36,no. 1, pp. 15–23, Jan. 2009.
[10] M. Prats, J. J. Fernandez, and P. J. Sanz, “Combining templatetracking and laser peak detection for 3D reconstruction and graspingin underwater environments,” in IEEE/RSJ Int. Conf. Intell. Robot.Syst., 2012, pp. 106–112.
[11] C. S. Wallace and D. L. Dowe, “MML clustering of multi-state,Poisson, von Mises circular and Gaussian distributions,” Stat. Comput.,vol. 10, no. 1, pp. 73–83, 2000.
[12] J. Rissanen, “Modeling by shortest data description,” Automatica,vol. 14, no. 5, pp. 465–471, 1978.