Understanding’Performance’of’Parallel’Codes’’ Using … · "...
24
04/03/2013 04/03/2013 Understanding Performance of Parallel Codes Using Open|SpeedShop SEA@UCAR – Boulder, CO April 3, 2013 Jim Galarowicz : Krell InsNtute MarNn Schulz : LLNL SEA@UCAR Boulder, CO
Transcript of Understanding’Performance’of’Parallel’Codes’’ Using … · "...

04/03/2013
04/03/2013
Understanding Performance of Parallel Codes Using Open|SpeedShop
SEA@UCAR – Boulder, CO -‐ April 3, 2013 Jim Galarowicz : Krell InsNtute
MarNn Schulz : LLNL
SEA@UCAR -‐ Boulder, CO

04/03/2013
04/03/2013
Open|SpeedShop Overview v Open Source Performance Analysis Tool Framework
Ø Most common performance analysis steps all in one tool Ø Gathers and displays several types of performance informaNon
• Profiling opNons to get iniNal overview • Detailed analysis views to drill down to locate boWlenecks • Event tracing opNons to capture performance details
Ø Various analysis opNons for comparisons, load balance, …
v Flexible and Easy to use Ø User access through GUI, Command Line, Python Scrip7ng, and convenience scripts.
Ø Gather performance data from unmodified applica7on binaries
v Supports a wide range of systems Ø Extensively used and tested on a variety of Linux clusters
• In preparaNon for SEA adapted to IBM’s cluster so]ware Ø Cray XT/XE/XK and Blue Gene P/Q support
SEA@UCAR -‐ Boulder, CO 2

04/03/2013
v Jim Galarowicz, Krell v MarDn Schulz, LLNL v Larger team
Ø Don Maghrak, Krell Ø William Hachfeld,Dave Whitney, Krell Ø Dane Gardner, Argo Navis/Krell Ø MaW Legendre, LLNL Ø Jennifer Green, Philip Romero, LANL Ø David Montoya, David Gunther, Michael Mason, LANL Ø Mahesh Rajan, Anthony Agelastos, SNLs Ø Dyninst group (Bart Miller, UW & Jeff Hollingsworth, UMD) Ø Phil Roth, Michael Brim, ORNL
v Project history: Ø Started at SGI in 2004 Ø 6-‐8 developers for two years at SGI Ø Krell and Tri-‐labs agreement and funding since late 2006 Ø Office of Science and DOE STTR and SBIR funding over the Nme period since 2006 Ø Tool available as open source, support through maintenance contracts with Krell
SEA@UCAR -‐ Boulder, CO 3
O|SS Team and History

04/03/2013
Open|SpeedShop Workflow
4
Experiment Workflow
View
Results
Run
Application
“Experiment”
Results can be displayed using several “Views”
convenience Scripts osspcsamp, etc.
or osslink –c pcsamp ossutil <raw data>
Consists of one or more data “Collectors”
Stored in SQL database
SEA@UCAR -‐ Boulder, CO

04/03/2013
v Using PC Sampling experiments Ø Good iniNal experiment that shows where Nme is spent
SEA@UCAR -‐ Boulder, CO 5
A First Simple Example
>> mpirun –np 2 smg2000 –n 65 65 65 >> osspcsamp “mpirun –np 2 smg2000 –n 65 65 65” MPI ApplicaNon
Post-‐mortem O|SS

04/03/2013
04/03/2013
InstallaNon / Usage on Yellowstone v Installed in central locaDon
Ø Use: • module use /glade/u/home/galaro/privatemodules • module load openss
Ø Adds GUI and all scripts into the path
v StarDng an MPI job through LSF Ø Using mpirun.lsf <binary> from within a batch script
v A few things to consider Ø LocaNon of raw data files
• Environment variable: OPENSS_RAWDATA_DIR • On yellowstone by default set to: /glade/scratch/${USER}
Ø AddiNonal environment variables or arguments to convenience scripts can control each experiment
• Sampling rates, types of counters, subsets of funcNons to be traced • More on environment variables in the tutorial
6 SEA@UCAR -‐ Boulder, CO

04/03/2013
04/03/2013
Example Run with Output (Startup)
v osspcsamp “mpirun –np 2 smg2000 –n 65 65 65”
7
osspcsamp "mpirun -‐np 2 ./smg2000 -‐n 65 65 65" [openss]: pcsamp experiment using the pcsamp experiment default sampling rate: "100". [openss]: Using OPENSS_PREFIX installed in /opt/OSS-‐mrnet [openss]: Se{ng up offline raw data directory in /opt/shared/jeg/offline-‐oss [openss]: Running offline pcsamp experiment using the command: "mpirun -‐np 2 /opt/OSS-‐mrnet/bin/ossrun "./smg2000 -‐n 65 65 65" pcsamp" Running with these driver parameters: (nx, ny, nz) = (65, 65, 65) (Px, Py, Pz) = (2, 1, 1) (bx, by, bz) = (1, 1, 1) (cx, cy, cz) = (1.000000, 1.000000, 1.000000) (n_pre, n_post) = (1, 1) dim = 3 solver ID = 0 ============================================= Struct Interface: ============================================= Struct Interface: wall clock Nme = 0.049847 seconds cpu clock Nme = 0.050000 seconds
SEA@UCAR -‐ Boulder, CO

04/03/2013
04/03/2013
Example Run with Output (App. term.)
v osspcsamp “mpirun –np 2 smg2000 –n 65 65 65”
8
============================================= Setup phase Nmes: ============================================= SMG Setup: wall clock Nme = 0.635208 seconds cpu clock Nme = 0.630000 seconds ============================================= Solve phase Nmes: ============================================= SMG Solve: wall clock Nme = 3.987212 seconds cpu clock Nme = 3.970000 seconds IteraNons = 7 Final RelaNve Residual Norm = 1.774415e-‐07 [openss]: ConverNng raw data from /opt/shared/jeg/offline-‐oss into temp file X.0.openss Processing raw data for smg2000 Processing processes and threads ... Processing performance data ... Processing funcNons and statements ...
SEA@UCAR -‐ Boulder, CO

04/03/2013
04/03/2013
Example Run with Output (Results)
v osspcsamp “mpirun –np 2 smg2000 –n 65 65 65”
9
[openss]: Restoring and displaying default view for: /home/jeg/DEMOS/demos/mpi/openmpi-‐1.4.2/smg2000/test/smg2000-‐pcsamp-‐1.openss
[openss]: The restored experiment idenNfier is: -‐x 1 Exclusive CPU Nme % of CPU Time FuncNon (defining locaNon) in seconds. 3.630000000 43.060498221 hypre_SMGResidual (smg2000: smg_residual.c,152) 2.860000000 33.926453144 hypre_CyclicReducNon (smg2000: cyclic_reducNon.c,757) 0.280000000 3.321470937 hypre_SemiRestrict (smg2000: semi_restrict.c,125) 0.210000000 2.491103203 hypre_SemiInterp (smg2000: semi_interp.c,126) 0.150000000 1.779359431 opal_progress (libopen-‐pal.so.0.0.0) 0.100000000 1.186239620 mca_btl_sm_component_progress (libmpi.so.0.0.2) 0.090000000 1.067615658 hypre_SMGAxpy (smg2000: smg_axpy.c,27) 0.080000000 0.948991696 ompi_generic_simple_pack (libmpi.so.0.0.2) 0.070000000 0.830367734 __GI_memcpy (libc-‐2.10.2.so) 0.070000000 0.830367734 hypre_StructVectorSetConstantValues (smg2000: struct_vector.c,537) 0.060000000 0.711743772 hypre_SMG3BuildRAPSym (smg2000: smg3_setup_rap.c,233) v View with GUI: openss –f smg2000-‐pcsamp-‐1.openss
SEA@UCAR -‐ Boulder, CO

04/03/2013
04/03/2013
Default Output Report View
10
Performance Data Default view: by Function
(Data is sum from all processes and threads)
Select “Functions”, click D-icon
Toolbar to switch Views
Graphical Representation
SEA@UCAR -‐ Boulder, CO
04/03/2013
04/03/2013
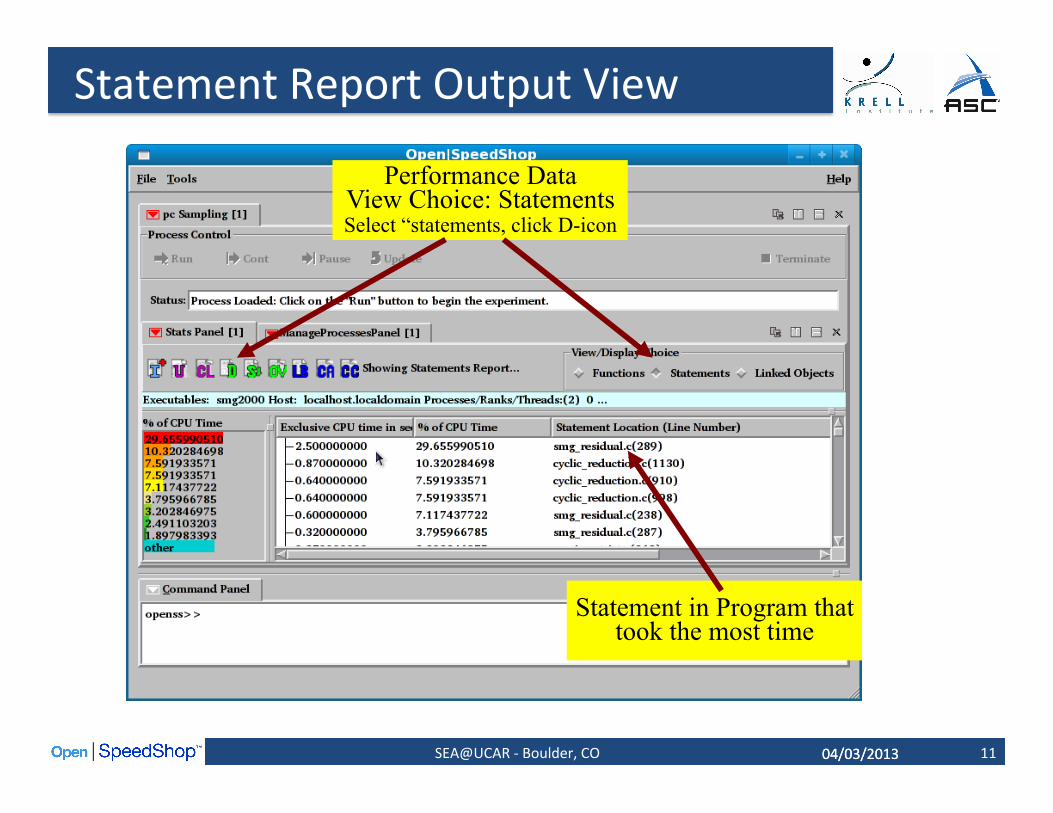
Statement Report Output View
11
Performance Data
View Choice: Statements Select “statements, click D-icon
Statement in Program that took the most time
SEA@UCAR -‐ Boulder, CO

04/03/2013
04/03/2013
Associate Source & Performance Data
12
Double click to open
source window Use window controls to split/arrange windows
Selected performance data point
SEA@UCAR -‐ Boulder, CO

04/03/2013
04/03/2013
Available Experiments I (Profiling) v PC Sampling (pcsamp)
Ø Record PC in user defined Nme intervals Ø Low overhead overview of Nme distribuNon Ø Good first step, lightweight overview
v Call Path Profiling (userDme) Ø PC Sampling and Call stacks for each sample Ø Provides inclusive and exclusive Nming data Ø Use to find hot call paths, whom is calling who
v Hardware Counters (hwcsamp, hwc, hwcDme) Ø Access to data like cache and TLB misses Ø hwcsamp:
• Sample up to six events based on a sample Nme (hwcsamp) • Default events are PAPI_FP_OPS and PAPI_TOT_CYC • Good overview of hardware counter event counts
Ø hwc, hwcNme: • Sample a HWC event based on an event threshold • Default event is PAPI_TOT_CYC overflows
13 SEA@UCAR -‐ Boulder, CO
A
B C
D
E

04/03/2013
04/03/2013
Available Experiments II (Tracing) v Input/Output Tracing (io, iot)
Ø Record invocaNon of all POSIX I/O events Ø Provides aggregate and individual Nmings Ø Provide argument informaNon for each call (iot)
v MPI Tracing (mpi, mpit) Ø Record invocaNon of all MPI rouNnes Ø Provides aggregate and individual Nmings Ø Provide argument informaNon for each call (mpit) Ø OpNonal experiments to create OTF/Vampir files
v FloaDng Point ExcepDon Tracing (fpe) Ø Triggered by any FPE caused by the applicaNon Ø Helps pinpoint numerical problem areas
More details and examples on all experiments during the O|SS tutorial in the coming days
14 SEA@UCAR -‐ Boulder, CO

04/03/2013
04/03/2013
Future Experiments by End of 2013 v New Open|SpeedShop experiments under construcDon
Ø Lightweight I/O experiment (iop) • Profile I/O funcNons by recording individual call paths
– Rather than every individual event with the event call path, (io and iot). – More opportunity for aggregaNon and smaller database files
• Map performance informaNon back to the applicaNon source code. Ø Memory analysis experiment (mem)
• Record and track memory consumpNon informaNon – How much memory was used – high water mark – Map performance informaNon back to the applicaNon source code
Ø Threading analysis experiment (thread) • Report staNsNcs about pthread wait Nmes • Report OpenMP (OMP) blocking Nmes • AWribute gathered performance informaNon to proper threads • Thread idenNficaNon improvements
– Use a simple integer alias for POSIX thread idenNfier • Report synchronizaNon overhead mapped to proper thread • Map performance informaNon back to the applicaNon source code
15 SEA@UCAR -‐ Boulder, CO

04/03/2013
04/03/2013
Analysis of Parallel Codes v By default experiment collectors are run on all tasks
Ø AutomaNcally detect all processes and threads Ø Gathers and stores per thread data
v Viewing data from parallel codes Ø By default all values aggregated (summed) across all ranks Ø Manually include/exclude individual ranks/processes/threads Ø Ability to compare ranks/threads
v AddiDonal analysis opDons Ø Load Balance (min, max, average) across parallel execuNons
• Across ranks for hybrid openMP/MPI codes • Focus on a single rank to see load balance across OpenMP threads
Ø Cluster analysis (finding outliers) • AutomaNcally creates groups of similar performing ranks or threads • Available from the Stats Panel toolbar or context menu
16 SEA@UCAR -‐ Boulder, CO

04/03/2013
04/03/2013
AlternaNve Interfaces v ScripDng language
Ø Immediate command interface Ø O|SS interacNve command line (CLI)
v Python module
17
Experiment Commands expAttach expCreate expDetach expGo expView List Commands list –v exp list –v hosts list –v src Session Commands setBreak openGui
import openss
my_filename=openss.FileList("myprog.a.out") my_exptype=openss.ExpTypeList("pcsamp") my_id=openss.expCreate(my_filename,my_exptype)
openss.expGo()
My_metric_list = openss.MetricList("exclusive") my_viewtype = openss.ViewTypeList("pcsamp”) result = openss.expView(my_id,my_viewtype,my_metric_list)
SEA@UCAR -‐ Boulder, CO

04/03/2013
04/03/2013
CLI Example: sweep3d I/O Experiment
18
openss –cli –f sweep3d-‐io.openss openss>>expview Exclusive % of Number FuncNon (defining locaNon) I/O Call Total of Time(ms) Calls 18.01600 77.255575 36 write (sweep3d-‐io) 2.364000 10.137221 2 open64 (sweep3d-‐io) 1.307000 5.604631 2 read (sweep3d-‐io) 1.040000 4.459691 72 __lseek64 (sweep3d-‐io) 0.593000 2.542882 2 __close (sweep3d-‐io)
openss>>expview -‐vcalltrees,fullstack io1 Exclusive % of Number Call Stack FuncNon (defining locaNon) I/O Call Total of Time(ms) Calls
__libc_start_main (sweep3d-‐io: libc-‐start.c,118) > @ 226 in generic_start_main (sweep3d-‐io: libc-‐start.c,96) >>__wrap_main (sweep3d-‐io) >>>monitor_main (sweep3d-‐io) >>>> @ 21 in main (sweep3d-‐io: fmain.c,11) >>>>> @ 184 in MAIN_ (sweep3d-‐io: driver.f,1) >>>>>> @ 66 in inner_auto (sweep3d-‐io: inner_auto.f,2) >>>>>>> @ 164 in inner (sweep3d-‐io: inner.f,2) >>>>>>>> @ 3339 in _gfortran_st_write_done (sweep3d-‐io: transfer.c,3333) >>>>>>>>> @ 3228 in finalize_transfer (sweep3d-‐io: transfer.c,3142) >>>>>>>>>> @ 3132 in _gfortrani_next_record (sweep3d-‐io: transfer.c,3100) >>>>>>>>>>> @ 70 in _gfortrani_�uf_flush (sweep3d-‐io: �uf.c,143) >>>>>>>>>>>> @ 261 in raw_write (sweep3d-‐io: unix.c,250)
5.588000 23.962264 1 >>>>>>>>>>>>>write (sweep3d-‐io)
SEA@UCAR -‐ Boulder, CO

04/03/2013
04/03/2013
Comparing Performance Data v Comparisons: basic operaDon for performance analysis
Ø Compare performance before/a]er opNmizaNon Ø Track performance during code history Ø Compare ranks to each other
v Open|SpeedShop enables flexible comparisons Ø Within databases and across mulNple databases Ø Within the same experiment and across experiments
v Convenience Script: osscompare Ø Compares Open|SpeedShop databases to each other Ø Compare up to 8 at one Nme Ø Produces side-‐by-‐side comparison lisNng Ø OpNonally create "csv" output for input into spreadsheet (Excel,..)
• export OPENSS_CREATE_CSV=1
19 SEA@UCAR -‐ Boulder, CO

04/03/2013
04/03/2013
Example: Comparison Results osscompare "smg2000-‐pcsamp.openss,smg2000-‐pcsamp-‐1.openss” openss]: Legend: -‐c 2 represents smg2000-‐pcsamp.openss
[openss]: Legend: -‐c 4 represents smg2000-‐pcsamp-‐1.openss
-‐c 2, Exclusive CPU -‐c 4, Exclusive CPU FuncNon (defining locaNon)
Nme in seconds. Nme in seconds.
3.870000000 3.630000000 hypre_SMGResidual (smg2000: smg_residual.c,152)
2.610000000 2.860000000 hypre_CyclicReducNon (smg2000: cyclic_reducNon.c,757)
2.030000000 0.150000000 opal_progress (libopen-‐pal.so.0.0.0)
1.330000000 0.100000000 mca_btl_sm_component_progress (libmpi.so.0.0.2: topo_unity_component.c,0)
0.280000000 0.210000000 hypre_SemiInterp (smg2000: semi_interp.c,126)
0.280000000 0.040000000 mca_pml_ob1_progress (libmpi.so.0.0.2: topo_unity_component.c,0)
20 SEA@UCAR -‐ Boulder, CO

04/03/2013
04/03/2013
Scaling Open|SpeedShop v Open|SpeedShop designed for tradiNonal clusters
Ø Tested and works well up to 1,000-‐10,000 cores Ø Scalability concerns on machines with 100,000+ cores Ø Target: ASC capability machines like LLNL’s Sequoia (20 Pflop/s BG/Q)
v Component Based Tool Framework (CBTF) Ø hWp://].ornl.gov/doku/cb�w/start Ø Based on tree based communicaNon infrastructure Ø PorNng O|SS on top of CBTF
v Improvements: Ø Direct streaming of performance data to tool without temp. I/O Ø Data will be filtered (reduced or combined) on the fly Ø Emphasis on scalable analysis techniques
v IniNal prototype exists, working version: Mid-‐2013 Ø LiWle changes for users of Open|SpeedShop Ø CBTF can be used to quickly create new tools Ø AddiNonal opNon: use of CBTF in applicaNons to collect data
21 SEA@UCAR -‐ Boulder, CO
04/03/2013
04/03/2013
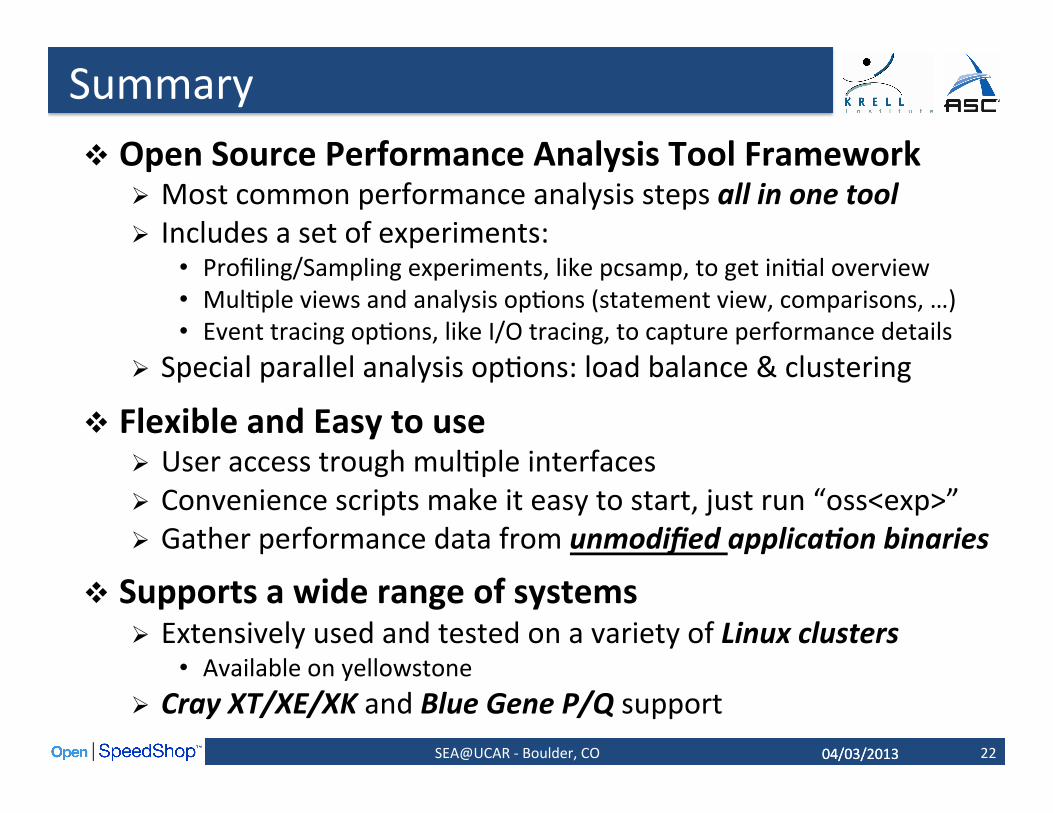
Summary v Open Source Performance Analysis Tool Framework
Ø Most common performance analysis steps all in one tool Ø Includes a set of experiments:
• Profiling/Sampling experiments, like pcsamp, to get iniNal overview • MulNple views and analysis opNons (statement view, comparisons, …) • Event tracing opNons, like I/O tracing, to capture performance details
Ø Special parallel analysis opNons: load balance & clustering
v Flexible and Easy to use Ø User access trough mulNple interfaces Ø Convenience scripts make it easy to start, just run “oss<exp>” Ø Gather performance data from unmodified applica7on binaries
v Supports a wide range of systems Ø Extensively used and tested on a variety of Linux clusters
• Available on yellowstone Ø Cray XT/XE/XK and Blue Gene P/Q support
22 SEA@UCAR -‐ Boulder, CO

04/03/2013
04/03/2013
Open|SpeedShop Tutorial v Thursday
Ø Guided tutorial with hands-‐on exercises • Bring your own code or use one of our demos
Ø Covers sequenNal and parallel codes • Basic profiling experiments, incl. hardware counters • MPI and I/O experiments • GUI and command line access
Ø Access to yellowstone required (preferably with X connecNon)
v Friday Ø Open discussion and “bring your own code clinic”
• General Q&A • Working on advanced features • ExperimentaNon on and analysis of your own codes
Ø If people are interested: • Help with installing O|SS on other systems beyond yellowstone • IntroducNon into CBTF
23 SEA@UCAR -‐ Boulder, CO

04/03/2013
04/03/2013
Availability and Contact v Current version: 2.0.2 update 8
Ø On yellowstone: • module use /glade/u/home/galaro/privatemodules • module load openss
v Open|SpeedShop Website Ø hWp://www.openspeedshop.org/
v Open|SpeedShop Quick Start Guide: Ø hWp://www.openspeedshop.org/wp/wp-‐content/uploads/2013/03/OSSQuickStartGuide2012.pdf.
v Feedback Ø Bug tracking available from website Ø Contact informaNon on website Ø oss-‐[email protected] Ø Open|SpeedShop Forum
• hWp://www.openspeedshop.org/forums/
24 SEA@UCAR -‐ Boulder, CO