
Modelling and Managing Supply Chain Forecast Uncertainty ...

Uncertainty and risk modelling
Week 10
MÓNICA OLIVEIRA
12nd SEMESTER, 2020/2021DECISION ANALYSIS MODELS AND APPLICATIONS
DEPARTMENT OF ENGINEERING AND MANAGEMENT

Agenda
❑What is Uncertainty and Risk Analysis?
❑ Value of Information and Control
❑ Bayesian Belief Networks
2nd SEMESTER, 2020/2021DECISION ANALYSIS MODELS AND APPLICATIONS
DEPARTMENT OF ENGINEERING AND MANAGEMENT2

Uncertainty and Risk AnalysisMAIN TEXTBOOK:
CLEM EN , R . T. , R E I LLY, T. (2014) M A K I N G HA R D DECI S ION S WI T H DECI S ION TOOLS , T H I R D EDI T I ON, SOUT H - WEST ER N , CEN GAGE LEA R N ING .
2nd SEMESTER, 2020/2021DECISION ANALYSIS MODELS AND APPLICATIONS
DEPARTMENT OF ENGINEERING AND MANAGEMENT3

2nd SEMESTER, 2020/2021DECISION ANALYSIS MODELS AND APPLICATIONS
DEPARTMENT OF ENGINEERING AND MANAGEMENT4
Uncertainty encompasses a Multiplicity of Concepts…
• The term ‘risk’ has a variety of meanings
• In popular speech, hazard and risk might be used interchangeably
• Hazards or threats may be physical entities, conditions, substances, activities or behaviours which are capable of causing harm
• Earlier influential book (Luce and Raiffa, 1957)◦ Risk: knowable probabilities
◦ Uncertainty: unknowable probabilities
→ This definition cannot be applied to situations without games

2nd SEMESTER, 2020/2021DECISION ANALYSIS MODELS AND APPLICATIONS
DEPARTMENT OF ENGINEERING AND MANAGEMENT5
“risk is the quantifiable likelihood of loss or lower-than-expected returns”
Investing glossary definition, http://www.investorwords.com/
‘‘risk is associated with the lack of certainty of an outcome and how sensitive one is to that outcome and thus to the uncertainty’’
Anders, G., Entriken, R., Nitu, P., 1999. RiskAssessment and financial management. IEEE PES Tutorial, IEEE Winter Meeting, Singapore.
Risk “should take account of the likely scale of consequences, the frequency, durationand extent of hazard exposure, the probability that an unwanted/desired event will
occur and the time-scale over which consequences might be manifested and probabilities assigned”
Waring, A., Glendon, A. I. (1998) Managing Risk: Critical Issues for Survival and Success into the 21st Century, Cornwall, Thomson.
Risk ≠ Source of Uncertainty

2nd SEMESTER, 2020/2021DECISION ANALYSIS MODELS AND APPLICATIONS
DEPARTMENT OF ENGINEERING AND MANAGEMENT6
UNCERTAINTIES
• Things that are not known, or known only imprecisely.
• May be characteristics of the universe (e.g. statistical processes) or characteristics of the design process (e.g. information not yet collected); in either case they are factual.
• Many are measurable, although some are not (e.g. future events).
• Are value neutral.
• Not necessarily bad.
• Numerous causes.
RISKS
• Pathologies created by the uncertainties that are specific to the program in question.
• They are often quantified as (probability of uncertain event)*(severity of consequences).
• In addition to technical failure, cost, schedule, political, market, and user need shift risks need to be considered.
• Have a negative connotation.
Source: Hastings and McManus (2006)

2nd SEMESTER, 2020/2021DECISION ANALYSIS MODELS AND APPLICATIONS
DEPARTMENT OF ENGINEERING AND MANAGEMENT7
❖ Due to incomplete information◦ What will be the defence budget in Portugal in 2020?
❖ Disagreement between information sources and between experts◦ How much was the Government spending in 2019?
❖ Linguistic imprecision◦ What does exactly mean “Unemployment is increasing?”
❖ Statistical variation (random error) and subjective judgement (systematic error)◦ What is the flow rate of the Tagus river?
❖ Approximations◦ Company bookvalue generation
❖ About a quantity or about the structure of a model◦ Slope of a linear dose-response function, or the shape of a dose-response function
❖ Uncertainty about the degree of uncertainty...
Uncertainty encompasses a Multiplicity of Concepts…
2nd SEMESTER, 2020/2021DECISION ANALYSIS MODELS AND APPLICATIONS
DEPARTMENT OF ENGINEERING AND MANAGEMENT8
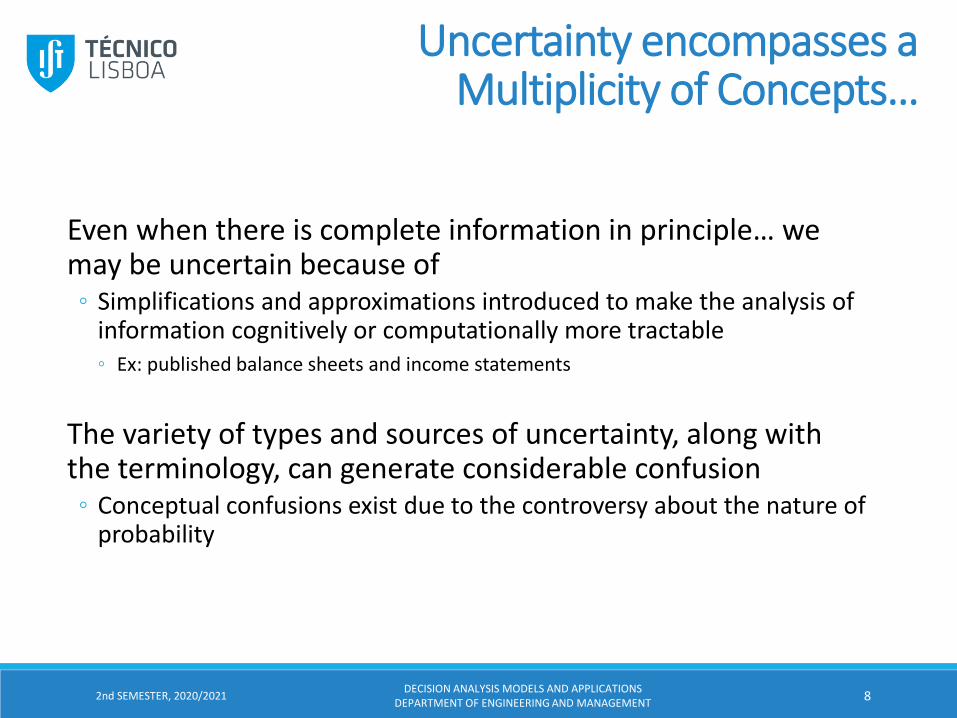
Uncertainty encompasses a Multiplicity of Concepts…
Even when there is complete information in principle… we may be uncertain because of ◦ Simplifications and approximations introduced to make the analysis of
information cognitively or computationally more tractable ◦ Ex: published balance sheets and income statements
The variety of types and sources of uncertainty, along with the terminology, can generate considerable confusion◦ Conceptual confusions exist due to the controversy about the nature of
probability

Opinions may differ…
Opinions of athmospheric scientistsAssessment, in the form of cumulative distribution functions, of the average annualhealth impact in excess deaths from exposure to sulfate air pollution from a new 1 GweFGD-eqquiped, coal-fired plant in Pittsburgh.
Source: Morgan and Henrion (2006)
2nd SEMESTER, 2020/2021DECISION ANALYSIS MODELS AND APPLICATIONS
DEPARTMENT OF ENGINEERING AND MANAGEMENT9

Experimental measurements of the speed of light between 1875 and 1960. Vertical bars show reported uncertainty as standard error. Horizontal dashed line represents currently accepted value. Less than 50% of the error bars enclose the accepted value.
Source: Morgan and Henrion
(2006)
Systematic Errors…
2nd SEMESTER, 2020/2021DECISION ANALYSIS MODELS AND APPLICATIONS
DEPARTMENT OF ENGINEERING AND MANAGEMENT10

2nd SEMESTER, 2020/2021DECISION ANALYSIS MODELS AND APPLICATIONS
DEPARTMENT OF ENGINEERING AND MANAGEMENT11
Source: Hastings and McManus (2006)
System causes harm
System does not work
Program (to produce system) gets in one of several kinds of trouble
System works, but function desired from the system has changed from that for which it was designed.
Facts that are not known, or are known only imprecisely, that are needed to complete the system architecture in a rational way.
Things about the system in question that have not been decided or specified.
Things that cannotalways be known precisely, but which can be statistically characterized, or atleast bounded.
Things that it is known are not known.
……………………….
Uncertainties vs. Risks

2nd SEMESTER, 2020/2021DECISION ANALYSIS MODELS AND APPLICATIONS
DEPARTMENT OF ENGINEERING AND MANAGEMENT12
Source: Hastings and McManus (2006)

2nd SEMESTER, 2020/2021DECISION ANALYSIS MODELS AND APPLICATIONS
DEPARTMENT OF ENGINEERING AND MANAGEMENT13
Source: Hastings and McManus (2006)
Within a model, which quantities should be dealt with as uncertain?
Type of quantity Examples Treatment of uncertainty
Empirical parameter or chance variable
Thermal efficiency, occupation rate, fuel price
Probabilistic, parametric, or switchover
Defined constant Atomic weight, joules per kilowatt-hr
Certain by definition
Decision variable Plant size (utility), emissions cap (EPA)
Parametric or switchover
Value parameter Discount rate, ‘value of life’, risk tolerance
Parametric or switchover
Index variable Longitude and latitude, height, time period
Certain by definition
Model domain parameter Geographic region, time horizon, time increment
Parametric or switchover
Outcome criteria Net present value, utility Determined by treatment of its inputs

Value of Information and ControlBASIC INFORMATION:
CLEMEN, R . T. , RE ILLY, T. (2014) MAKING HARD DECIS IONS WITH DECIS ION TOOLS, THIRD EDIT ION, SOUTH -WESTERN, CENGAGE LEARNING. (CHAPTER 12)
2nd SEMESTER, 2020/2021DECISION ANALYSIS MODELS AND APPLICATIONS
DEPARTMENT OF ENGINEERING AND MANAGEMENT14

A Taxonomy of Decision Models in Decision Analysis
Problem dominated by
REVISE opinion
•Bayesian nets
EXTEND conversation
•Event tree•Fault tree•Influence diagram
SEPARATE into components
•Credence decomposition•Risk analysis
EVALUATE options
•Multi-criteria decision analysis
ALLOCATE resources
•Multi-criteria commons dilemma
NEGOTIATE
•Multi-criteria bargaining analysis
CHOOSE option
•Payoff matrix
•Decision tree
Uncertainty Multiple Objectives
2nd SEMESTER, 2020/2021DECISION ANALYSIS MODELS AND APPLICATIONS
DEPARTMENT OF ENGINEERING AND MANAGEMENT15

2nd SEMESTER, 2020/2021DECISION ANALYSIS MODELS AND APPLICATIONS
DEPARTMENT OF ENGINEERING AND MANAGEMENT16
Often you pay for information. You are asking:
Investment Advice
Management Consultants
Market Investigation
Palm Reading
You need this information to make a decision in the future:
To invest in a particular stock or not
To restructure the organization of your company or not
To introduce a product or not
To marry this person or notInformation gathering includes:
Consulting experts
Conducting surveys
Performing mathematical and statistical analysis
Doing research
Reading books, journals and newspapers
INFORMATION TO REDUCE UNCERTAINTY

2nd SEMESTER, 2020/2021DECISION ANALYSIS MODELS AND APPLICATIONS
DEPARTMENT OF ENGINEERING AND MANAGEMENT17
To answer this question you might attempt to compute the value (in €€€€€€€) of information.
We will first discuss a method for determining the value of perfect information, and next for the value of imperfect information, and next for the value of control.
WHICH ONE DO YOU VALUE MORE?
Given your decision problem, how much shouldyou be willing to pay for this information?
17

2nd SEMESTER, 2020/2021DECISION ANALYSIS MODELS AND APPLICATIONS
DEPARTMENT OF ENGINEERING AND MANAGEMENT18
18
Definition: Clairvoyant Expert on event A
If event A is about to occur, the expert says, it will. If event A is not to occur, the expert says, it will not. The expert is NEVER wrong. His information is PERFECT.
You are considering investing in a company, but before you want to make sure that the Dow Jones index will go up as this
increases your chances of making a good investment. Therefore, you decide to consult a clairvoyant expert on the event A.
A = {Dow Jones index goes up}
"A" = {Expert Says Dow Jones index goes up}
What does it mean to be clairvoyant in probabilistic terms?
Probability and Perfect Information

2nd SEMESTER, 2020/2021DECISION ANALYSIS MODELS AND APPLICATIONS
DEPARTMENT OF ENGINEERING AND MANAGEMENT19
19
Probability and Perfect Information
Pr( { Expert Says Dow Jones ↑ } | { Dow Jones ↑ } ) =
=Pr(“A”| A) = 1
Similarly:
Perhaps more importantly, what about?
Pr({ Dow Jones ↑ } | { Expert Says Dow Jones ↑ } ) =
=Pr(A| "A")?
0A)|”APr(“A)|”APr(“-1A)|Pr(“A” ==
1)A|”APr(“0)A|”APr(“-1 0)A|Pr(“A” ===

2nd SEMESTER, 2020/2021DECISION ANALYSIS MODELS AND APPLICATIONS
DEPARTMENT OF ENGINEERING AND MANAGEMENT20
20
Probability and Perfect Information
Conclusion:
Pr(A|"A") equals 1 no matter what the value of Pr(A) is!
==)"Pr("
A)Pr(A)|A"Pr(")A"|"Pr(A
A
=+
=)A)Pr(A|A"Pr("A)Pr(A)|A"Pr("
A)Pr(A)|A"Pr("
1)APr(*0Pr(A)*1
Pr(A)*1=
+=

2nd SEMESTER, 2020/2021DECISION ANALYSIS MODELS AND APPLICATIONS
DEPARTMENT OF ENGINEERING AND MANAGEMENT21
21
Probability and Perfect Information
What about the probability Pr({Expert Says Dow Jones ↑} )?
Pr("A") = Pr( {Expert Says Dow Jones ↑} ) =
This is true in general: if we consult a clairvoyant expert about an event a with possible outcomes then:
After consulting the clairvoyant expert about event a, no uncertainty remains about that event.
=+ )Pr()|"Pr(")Pr()|"Pr(" AAAAAA
},...,{ 1 nAA
niAA ii ,...,1),Pr()"Pr(" ==
})Pr({)Pr()Pr(*0)Pr(*1 ==+= DowJonesAAA

Expected Value of Information: Stock market example
2nd SEMESTER, 2020/2021DECISION ANALYSIS MODELS AND APPLICATIONS
DEPARTMENT OF ENGINEERING AND MANAGEMENT22
22

Rollback procedure
2nd SEMESTER, 2020/2021DECISION ANALYSIS MODELS AND APPLICATIONS
DEPARTMENT OF ENGINEERING AND MANAGEMENT23
23
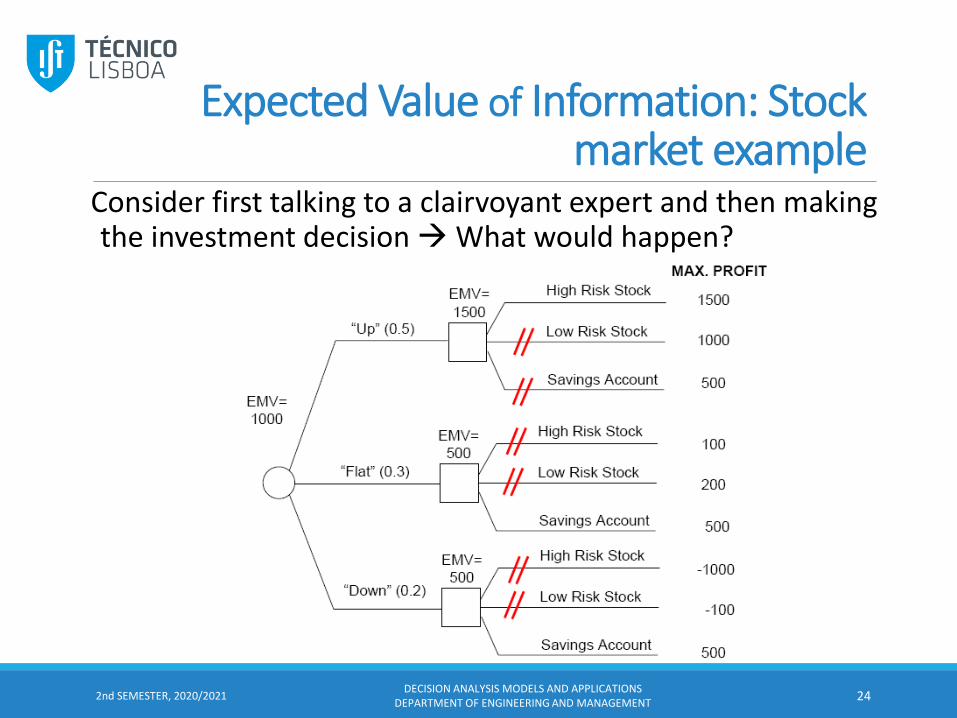
Consider first talking to a clairvoyant expert and then making the investment decision →What would happen?
2nd SEMESTER, 2020/2021DECISION ANALYSIS MODELS AND APPLICATIONS
DEPARTMENT OF ENGINEERING AND MANAGEMENT24
24
Expected Value of Information: Stock market example

Of course, the clairvoyant expert will charge a fee and you would like to know how much you would be willing to pay before using his services…
Conclusion:
You would be willing to consult the clairvoyant expert if:
1000 - X ≥ 580 ⇔ X ≤ 1000 - 580 = 420 (=EVPI)
Expected Value of Information: Stock market example
2nd SEMESTER, 2020/2021DECISION ANALYSIS MODELS AND APPLICATIONS
DEPARTMENT OF ENGINEERING AND MANAGEMENT25

Perfect Information in the Investor’s Problem
2nd SEMESTER, 2020/2021DECISION ANALYSIS MODELS AND APPLICATIONS
DEPARTMENT OF ENGINEERING AND MANAGEMENT26

2nd SEMESTER, 2020/2021DECISION ANALYSIS MODELS AND APPLICATIONS
DEPARTMENT OF ENGINEERING AND MANAGEMENT27
27
Expected Value of Perfect Information
EVPI = Expected Value of Perfect Information
Interpretation:
EVPI is the maximum amount of money you would be willing to pay for the services of the clairvoyant expert. If he charges more than €420 you would not consult the expert.
(Value of information in a prior sense)
A = { Dow Jones index goes up}
"A" = {Expert Says Dow Jones index goes up}
Consider now an expert about event A, who is not clairvoyant, but is considered to be an expert. What does it mean for an expert not to be perfect in his assessment about event A?

2nd SEMESTER, 2020/2021DECISION ANALYSIS MODELS AND APPLICATIONS
DEPARTMENT OF ENGINEERING AND MANAGEMENT28
28
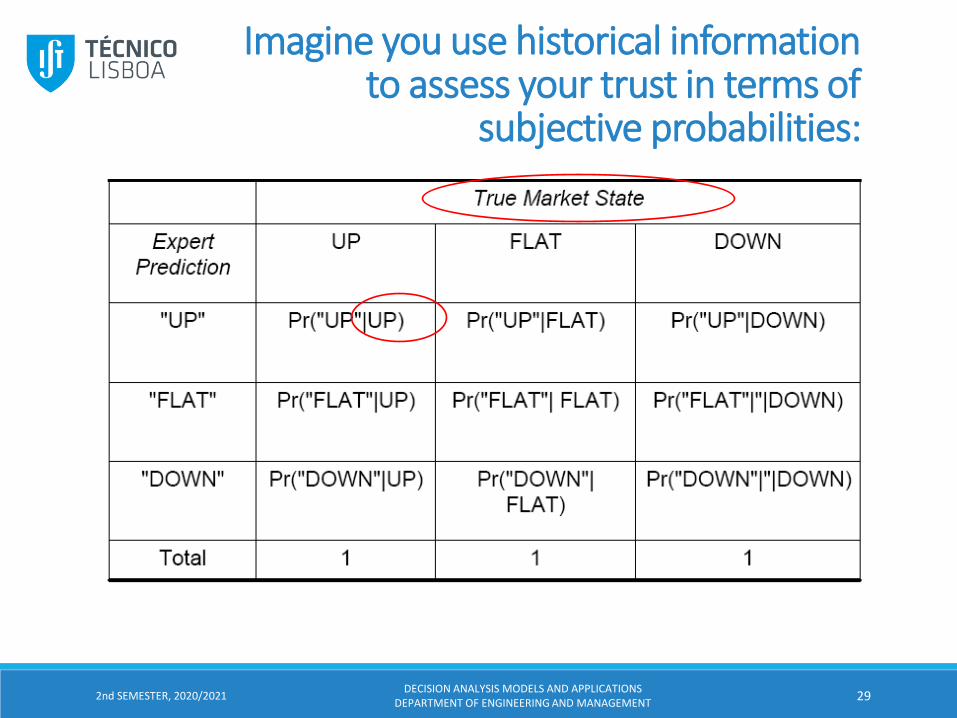
Pr( {Expert Says Dow Jones ↑} | {Dow Jones ↑} ) = Pr("A"|A)<1
→ Hopefully, the probability above is close to 1 (otherwise why consider him/her an Expert?)
Pr( {Expert Says Dow Jones ↑ } | {Dow Jones ↓} ) = Pr("A" |notA) > 0
→ Hopefully, the probability above is close to 0 (otherwise why consider him/her an Expert?)
When an expert is not clairvoyant about an event, you need to express your trust in his assessment by for example,
checking his past performances and interviewing references.
2nd SEMESTER, 2020/2021DECISION ANALYSIS MODELS AND APPLICATIONS
DEPARTMENT OF ENGINEERING AND MANAGEMENT29
29
Imagine you use historical information to assess your trust in terms of
subjective probabilities:

2nd SEMESTER, 2020/2021DECISION ANALYSIS MODELS AND APPLICATIONS
DEPARTMENT OF ENGINEERING AND MANAGEMENT30
30
Actual assessment of the expert
Conditional probabilities characterizing the economist forecasting ability

Imperfect Information in the Investor’s Problem
Expected value = 580 Expected value = 822
2nd SEMESTER, 2020/2021DECISION ANALYSIS MODELS AND APPLICATIONS
DEPARTMENT OF ENGINEERING AND MANAGEMENT31
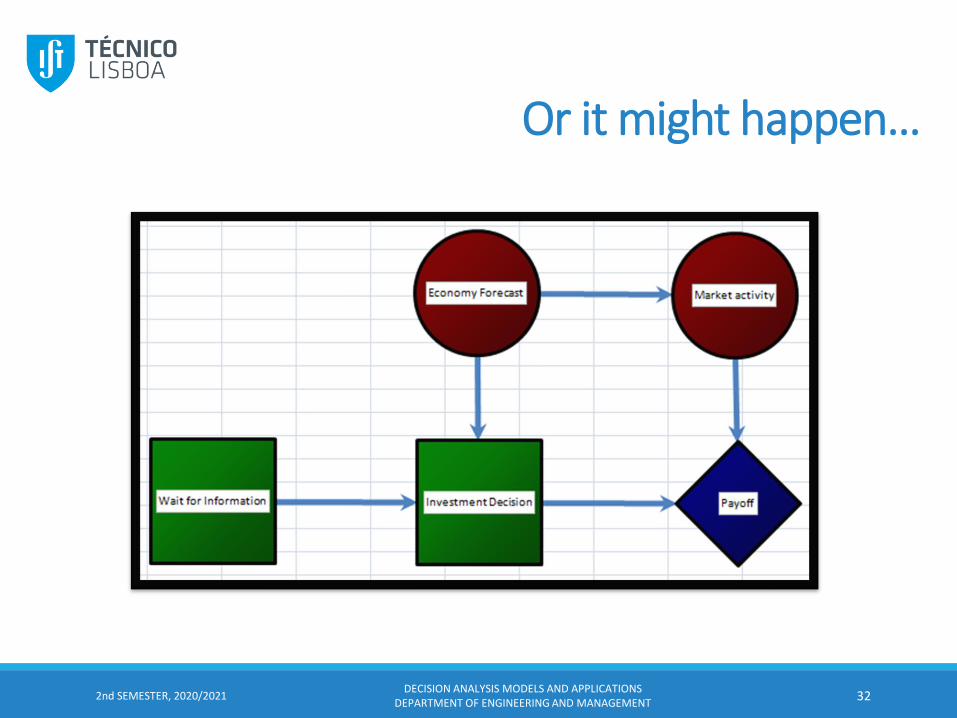
Or it might happen…
2nd SEMESTER, 2020/2021DECISION ANALYSIS MODELS AND APPLICATIONS
DEPARTMENT OF ENGINEERING AND MANAGEMENT32

Extra branch on whether to consult an expert is added &...
2nd SEMESTER, 2020/2021DECISION ANALYSIS MODELS AND APPLICATIONS
DEPARTMENT OF ENGINEERING AND MANAGEMENT33

2nd SEMESTER, 2020/2021DECISION ANALYSIS MODELS AND APPLICATIONS
DEPARTMENT OF ENGINEERING AND MANAGEMENT34
...you consider first talking to an "Imperfect expert” and then making the original investment decision:

• Suppose the Imperfect expert said Dow Jones will go UP
2nd SEMESTER, 2020/2021DECISION ANALYSIS MODELS AND APPLICATIONS
DEPARTMENT OF ENGINEERING AND MANAGEMENT35

• Suppose the Imperfect expert said Dow Jones will go FLAT
2nd SEMESTER, 2020/2021DECISION ANALYSIS MODELS AND APPLICATIONS
DEPARTMENT OF ENGINEERING AND MANAGEMENT36

2nd SEMESTER, 2020/2021DECISION ANALYSIS MODELS AND APPLICATIONS
DEPARTMENT OF ENGINEERING AND MANAGEMENT37
• Suppose the Imperfect expert said Dow Jones will go DOWN

Note that:
After consulting the expert the uncertainty remains.
After consulting an imperfect expert, the original decision problem still remains. ◦ The only difference is that probabilities of the original decision problem have
changed to reflect the additional information, i.e. the expert's advise.
→ To calculate the EMV of the decision problem after consulting the imperfect expert we have to solve for the probabilities in the decision tree with an added branch.
→ Calculating these probabilities is equivalent to FLIPPING the order of the uncertainty nodes.
2nd SEMESTER, 2020/2021DECISION ANALYSIS MODELS AND APPLICATIONS
DEPARTMENT OF ENGINEERING AND MANAGEMENT38

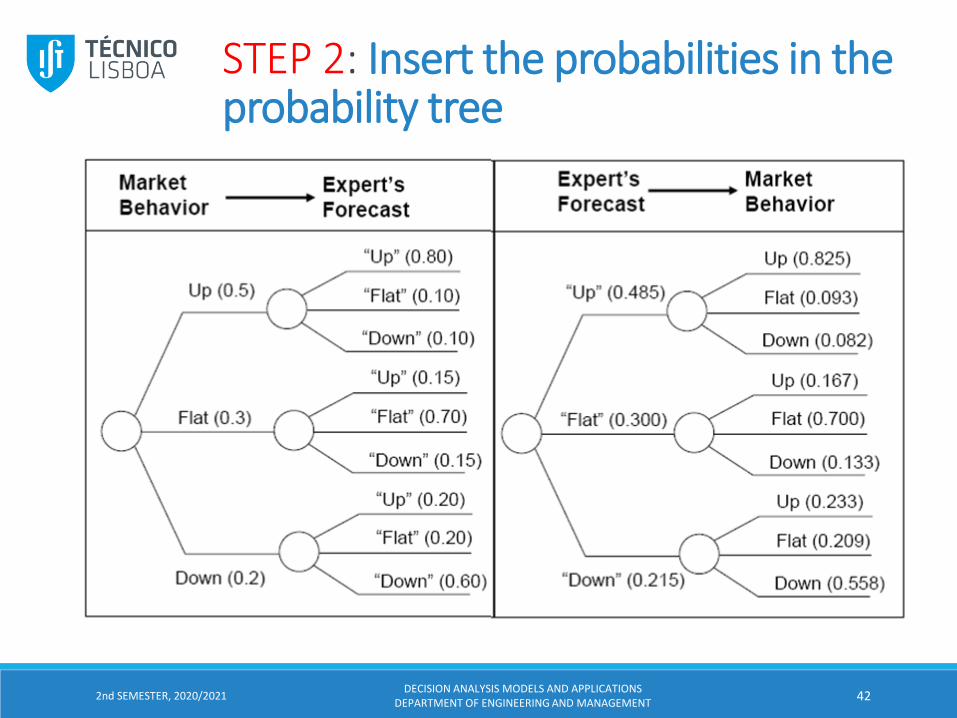
How can we solve for these probabilities?Via Bayes theorem using a probability table
392nd SEMESTER, 2020/2021DECISION ANALYSIS MODELS AND APPLICATIONS
DEPARTMENT OF ENGINEERING AND MANAGEMENT

Which equals to doing this:
2nd SEMESTER, 2020/2021DECISION ANALYSIS MODELS AND APPLICATIONS
DEPARTMENT OF ENGINEERING AND MANAGEMENT40

2nd SEMESTER, 2020/2021DECISION ANALYSIS MODELS AND APPLICATIONS
DEPARTMENT OF ENGINEERING AND MANAGEMENT41
41
STEP 1: Construct a probability table
Posterior probability
2nd SEMESTER, 2020/2021DECISION ANALYSIS MODELS AND APPLICATIONS
DEPARTMENT OF ENGINEERING AND MANAGEMENT42
42
STEP 2: Insert the probabilities in the probability tree

2nd SEMESTER, 2020/2021DECISION ANALYSIS MODELS AND APPLICATIONS
DEPARTMENT OF ENGINEERING AND MANAGEMENT43
43
STEP 3: Calculate EMV after consulting the expert
STEP 3A
STEP 3B
STEP 3C

2nd SEMESTER, 2020/2021DECISION ANALYSIS MODELS AND APPLICATIONS
DEPARTMENT OF ENGINEERING AND MANAGEMENT44
44
STEP 3D: Calculate EMV after consulting the expert

2nd SEMESTER, 2020/2021DECISION ANALYSIS MODELS AND APPLICATIONS
DEPARTMENT OF ENGINEERING AND MANAGEMENT45
45
STEP 4: Calculate EVII for consulting the expert
Conclusion:
You would be willing to consult the expert if:
822 - X ≥ 580 ⇔ X ≤ 822 - 580 = 242 (=EVII)
EVII = Expected Value of Imperfect Information

2nd SEMESTER, 2020/2021DECISION ANALYSIS MODELS AND APPLICATIONS
DEPARTMENT OF ENGINEERING AND MANAGEMENT46
46
Interpretation of the Expected Value of Imperfect Information
EVII is the maximum amount of money you would be willing to pay for the services of the imperfect expert.
If he charges more than €242 you would not consult the expert.
Note:
• EVPI ≥ EVII→ Interpretation: Perfect Information is always better than imperfect information.
• When performing sensitivity analysis, EVPI calculation of every uncertain event should be considered (upper bound). →When EVPIis high for a particular uncertain event, investment to reduce uncertainty may be warranted.
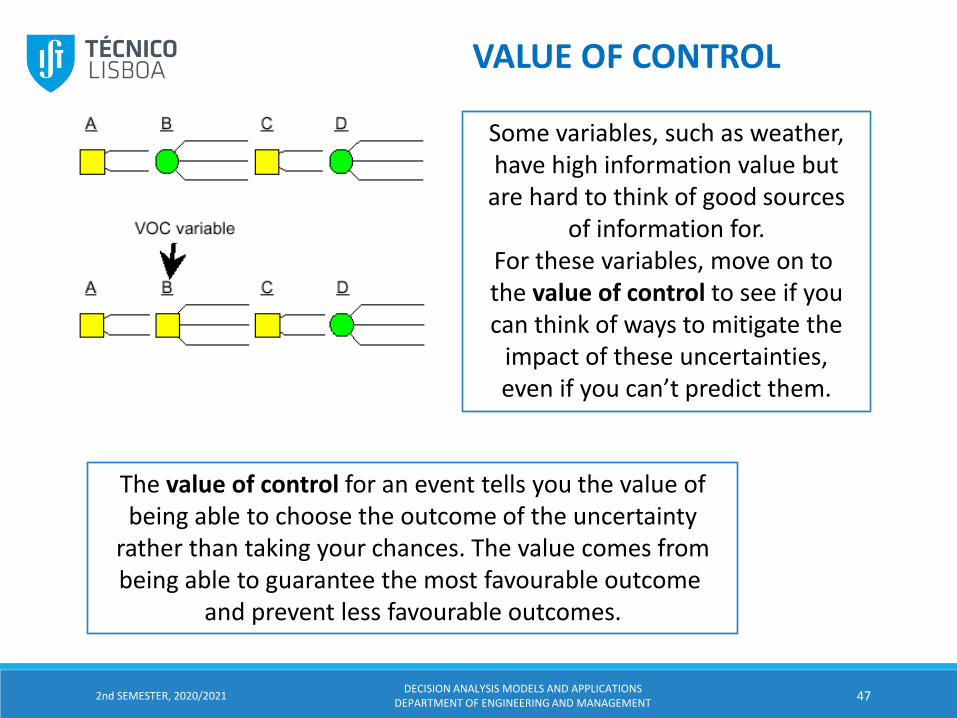
VALUE OF CONTROL
The value of control for an event tells you the value ofbeing able to choose the outcome of the uncertainty
rather than taking your chances. The value comes frombeing able to guarantee the most favourable outcome
and prevent less favourable outcomes.
Some variables, such as weather,have high information value but
are hard to think of good sourcesof information for.
For these variables, move on to the value of control to see if youcan think of ways to mitigate the
impact of these uncertainties,even if you can’t predict them.
2nd SEMESTER, 2020/2021DECISION ANALYSIS MODELS AND APPLICATIONS
DEPARTMENT OF ENGINEERING AND MANAGEMENT47
47

Value of control =1500-580 = 920
Most favourableoutcome
2nd SEMESTER, 2020/2021DECISION ANALYSIS MODELS AND APPLICATIONS
DEPARTMENT OF ENGINEERING AND MANAGEMENT48
48

The value of information tells you the value of finding out the state of a chance event before you have to make a decision.
Chance events with high values for information present the best opportunities to improve your expected value by thinking of creative new alternatives.
Chance events with low values for information are probably not worth further efforts at research, testing, or delay.
Important things to remember: • Information has no value if it doesn’t change your actions,• its value is limited to the improvement it provides
over what you would get without it.
2nd SEMESTER, 2020/2021DECISION ANALYSIS MODELS AND APPLICATIONS
DEPARTMENT OF ENGINEERING AND MANAGEMENT50
VALUE OF CONTROL

2nd SEMESTER, 2020/2021DECISION ANALYSIS MODELS AND APPLICATIONS
DEPARTMENT OF ENGINEERING AND MANAGEMENT51
Value of Information in Complex Problems
• What happens if there are multiple uncertain events and information is available for some or all of them?
Same principle...
• Decision trees: move chance nodes for which information is to be obtained so that they precede the decision node
• What if there are nonmonetary objectives?
• Apply the same logic...
• Market example: one uncertain event, behaviour of the market, uncertainty modelled with a simple discrete distribution. How can we handle continuous probability distributions? Other approaches
• Same principle, but... Some difficulties
• Construct a Monte Carlo simulation model
• Find theoretical probability models

2nd SEMESTER, 2020/2021DECISION ANALYSIS MODELS AND APPLICATIONS
DEPARTMENT OF ENGINEERING AND MANAGEMENT52
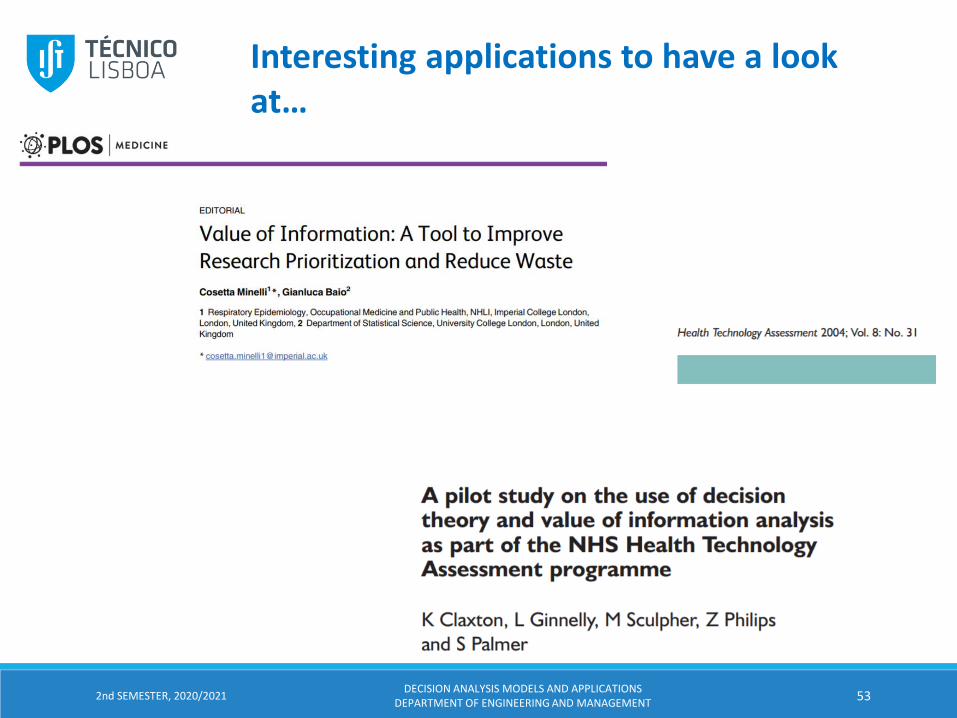
Interesting applications to have a look at…
2nd SEMESTER, 2020/2021DECISION ANALYSIS MODELS AND APPLICATIONS
DEPARTMENT OF ENGINEERING AND MANAGEMENT53
Interesting applications to have a look at…

Handout for using the Precision Tree software will be made available for your own use!
2nd SEMESTER, 2020/2021DECISION ANALYSIS MODELS AND APPLICATIONS
DEPARTMENT OF ENGINEERING AND MANAGEMENT54

2nd SEMESTER, 2020/2021DECISION ANALYSIS MODELS AND APPLICATIONS
DEPARTMENT OF ENGINEERING AND MANAGEMENT55
COMPLEMENTARY FEATURES for uncertainty analysis using decision trees
One Way Sensitivity Analysis

2nd SEMESTER, 2020/2021DECISION ANALYSIS MODELS AND APPLICATIONS
DEPARTMENT OF ENGINEERING AND MANAGEMENT56
Tornado Graph

2nd SEMESTER, 2020/2021DECISION ANALYSIS MODELS AND APPLICATIONS
DEPARTMENT OF ENGINEERING AND MANAGEMENT57
Spider Graph

2nd SEMESTER, 2020/2021DECISION ANALYSIS MODELS AND APPLICATIONS
DEPARTMENT OF ENGINEERING AND MANAGEMENT58
Two way sensitivity analysis

Bayesian Belief NetworksHOLMES & WATSON EXAMPLE
SOFTWARE FOR IMPLEMENTING BELIEF NETWORKS
CASE STUDY: CHEST CLINIC
2nd SEMESTER, 2020/2021DECISION ANALYSIS MODELS AND APPLICATIONS
DEPARTMENT OF ENGINEERING AND MANAGEMENT59

A Taxonomy of Decision Models in Decision Analysis
Problem dominated by
REVISE opinion
•Bayesian nets
EXTEND conversation
•Event tree•Fault tree•Influence diagram
SEPARATE into components
•Credence decomposition•Risk analysis
EVALUATE options
•Multi-criteria decision analysis
ALLOCATE resources
•Multi-criteria commons dilemma
NEGOTIATE
•Multi-criteria bargaining analysis
CHOOSE option
•Payoff matrix
•Decision tree
Uncertainty Multiple Objectives
2nd SEMESTER, 2020/2021DECISION ANALYSIS MODELS AND APPLICATIONS
DEPARTMENT OF ENGINEERING AND MANAGEMENT60

where P(H\E) denotes theprobability of hypothesis Hconditioned on the evidence E.
P(E)P(H\E) =
P(E\H).P(H)
The cornerstone of Bayesianprobability theory is theinversion formula:
Bayes’ rule provides an explicit relation for the degree of believe we accord a hypothesis H, in light of evidence E.
Bayes’ Rule is useful in contextswhere probabilities are more easily obtained in one inferential directionthan another.
Remember: Rules of Probability
2nd SEMESTER, 2020/2021DECISION ANALYSIS MODELS AND APPLICATIONS
DEPARTMENT OF ENGINEERING AND MANAGEMENT61

By providing the flexibility to reason probabilistically in either the causal or the diagnostic directions, Bayes’ Rule allows agents to
assert beliefs in forms that are compatible with the way they actually reason about the process(es) or phenomena of interest.
A bayesian network
Collins Case (Edwards, 1991)
A particular type of Influence Diagram. It contains only chance (and deterministic) nodes.
2nd SEMESTER, 2020/2021DECISION ANALYSIS MODELS AND APPLICATIONS
DEPARTMENT OF ENGINEERING AND MANAGEMENT62
2nd SEMESTER, 2020/2021DECISION ANALYSIS MODELS AND APPLICATIONS
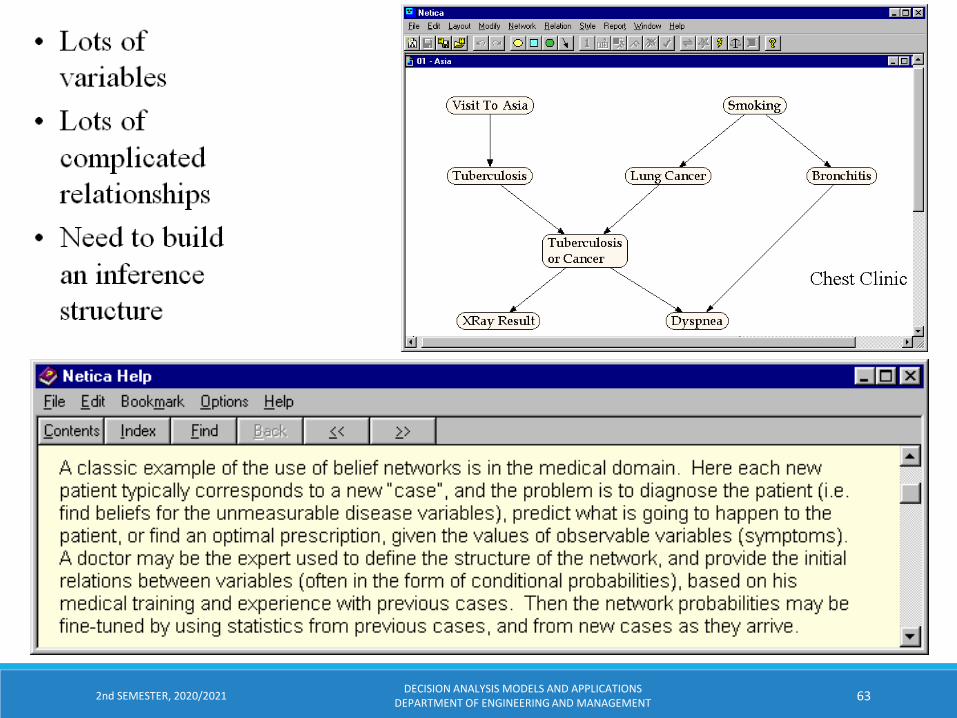
DEPARTMENT OF ENGINEERING AND MANAGEMENT63
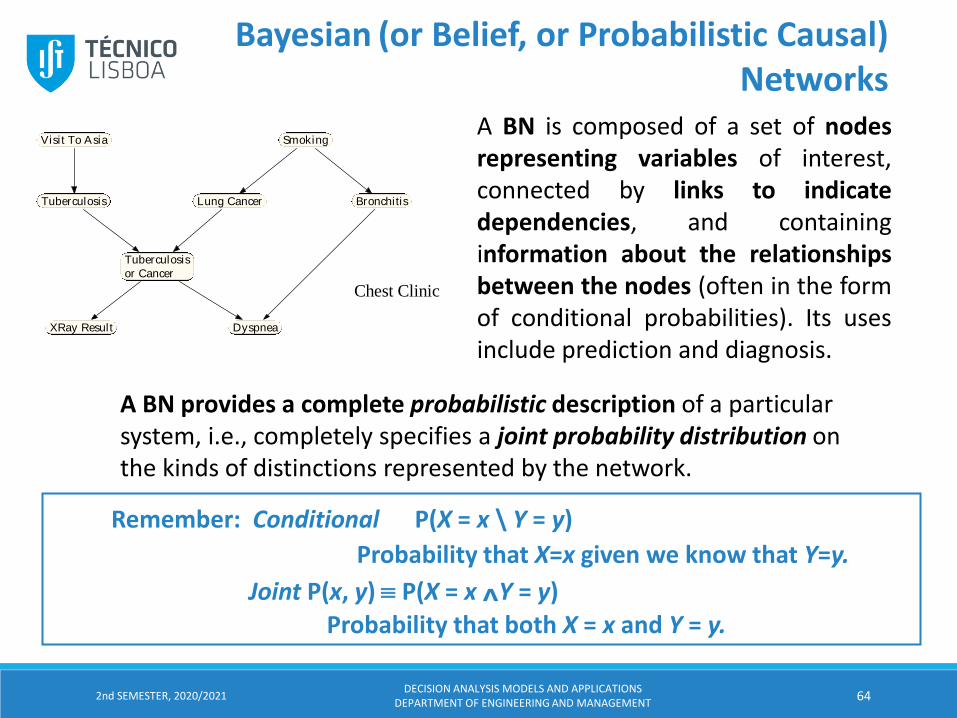
Bayesian (or Belief, or Probabilistic Causal) Networks
A BN is composed of a set of nodesrepresenting variables of interest,connected by links to indicatedependencies, and containinginformation about the relationshipsbetween the nodes (often in the formof conditional probabilities). Its usesinclude prediction and diagnosis.
Remember: Conditional P(X = x \ Y = y)
Probability that X=x given we know that Y=y.
Joint P(x, y) P(X = x ^Y = y)
Probability that both X = x and Y = y.
Tuberculosis
XRay Result
Tuberculosis
or Cancer
Lung Cancer
Dyspnea
Bronchitis
Visi t To Asia Smoking
Chest Clinic
A BN provides a complete probabilistic description of a particularsystem, i.e., completely specifies a joint probability distribution onthe kinds of distinctions represented by the network.
2nd SEMESTER, 2020/2021DECISION ANALYSIS MODELS AND APPLICATIONS
DEPARTMENT OF ENGINEERING AND MANAGEMENT64

Tuberculosis
XRay Result
Tuberculosis
or Cancer
Lung Cancer
Dyspnea
Bronchitis
Visi t To Asia Smoking
Chest Clinic
A BN consists of the following:
• A set of variables and a set ofdirected edges between variables.
• Each variable has a finite set of
states.
• The variables together with the directed
edges form a directed acyclic graph.
Tuberculosis
PresentAbsent
1.0499.0
XRay Result
AbnormalNormal
11.089.0
Tuberculosis or Cancer
TrueFalse
6.4893.5
Lung Cancer
PresentAbsent
5.5094.5
Dyspnea
PresentAbsent
43.656.4
Bronchitis
PresentAbsent
45.055.0
Visit To Asia
Visi tNo Visi t
1.099.0
Smoking
SmokerNonSmoker
50.050.0
Chest Clinic
(FORMAL) DEFINITION OF A BN (Jansen, 1996)
• To each variable A with
parents B1, …, Bn there is
attached a conditional
probability table
P(A \ B1, …, Bn).
2nd SEMESTER, 2020/2021DECISION ANALYSIS MODELS AND APPLICATIONS
DEPARTMENT OF ENGINEERING AND MANAGEMENT65

Belief updating is the process of finding new beliefs for the nodes of a BN toaccount for the findings that are currently known. It is a form of probabilisticinference. During belief updating the BN model (in particular, the conditionalprobability relations between the nodes) is not modified at all; for thatprobability revision is used.
Probability revision is the process of adjusting the conditional probabilityrelations of a belief network to account for a new case (i.e. set of findings), ormore often, for a new set of cases. It is a form of parameter learning.
Parameter learning is the automatic learning of the specific relationships nodeshave with their parents using case data, once it has already been determinedwhich nodes are the parents of each node. These relationships are usually in theform of conditional probabilities, or the parameters of a conditional probabilityequation.
PERSPECTIVE IN COMPUTATIONAL BIOLOGY
2nd SEMESTER, 2020/2021DECISION ANALYSIS MODELS AND APPLICATIONS
DEPARTMENT OF ENGINEERING AND MANAGEMENT66
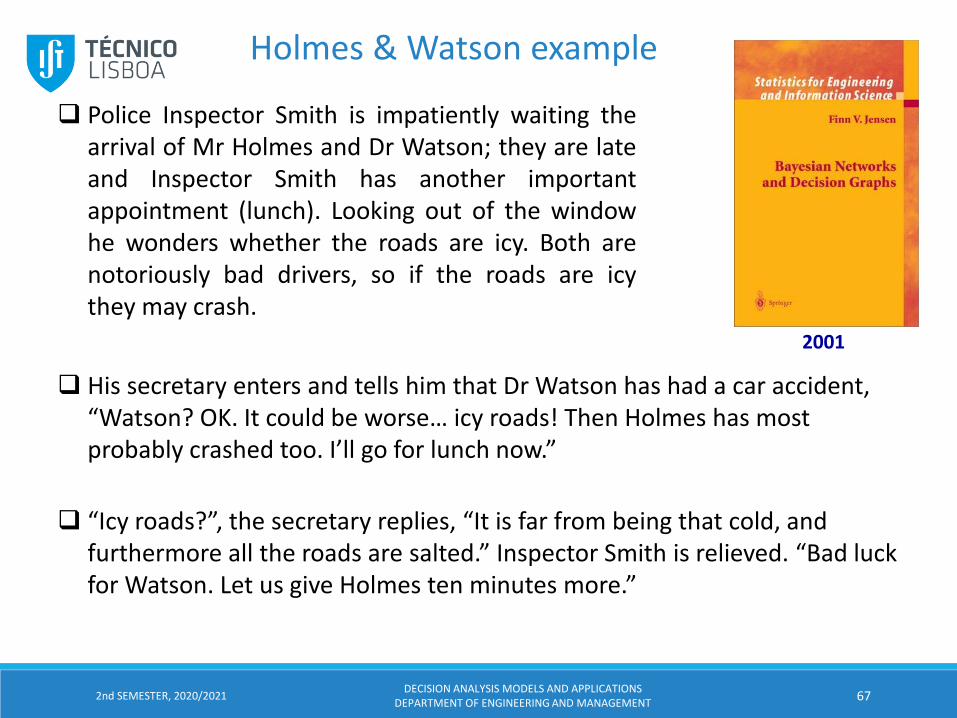
❑ Police Inspector Smith is impatiently waiting thearrival of Mr Holmes and Dr Watson; they are lateand Inspector Smith has another importantappointment (lunch). Looking out of the windowhe wonders whether the roads are icy. Both arenotoriously bad drivers, so if the roads are icythey may crash.
2001
❑ His secretary enters and tells him that Dr Watson has had a car accident, “Watson? OK. It could be worse… icy roads! Then Holmes has most probably crashed too. I’ll go for lunch now.”
❑ “Icy roads?”, the secretary replies, “It is far from being that cold, and furthermore all the roads are salted.” Inspector Smith is relieved. “Bad luck for Watson. Let us give Holmes ten minutes more.”
Holmes & Watson example
2nd SEMESTER, 2020/2021DECISION ANALYSIS MODELS AND APPLICATIONS
DEPARTMENT OF ENGINEERING AND MANAGEMENT67
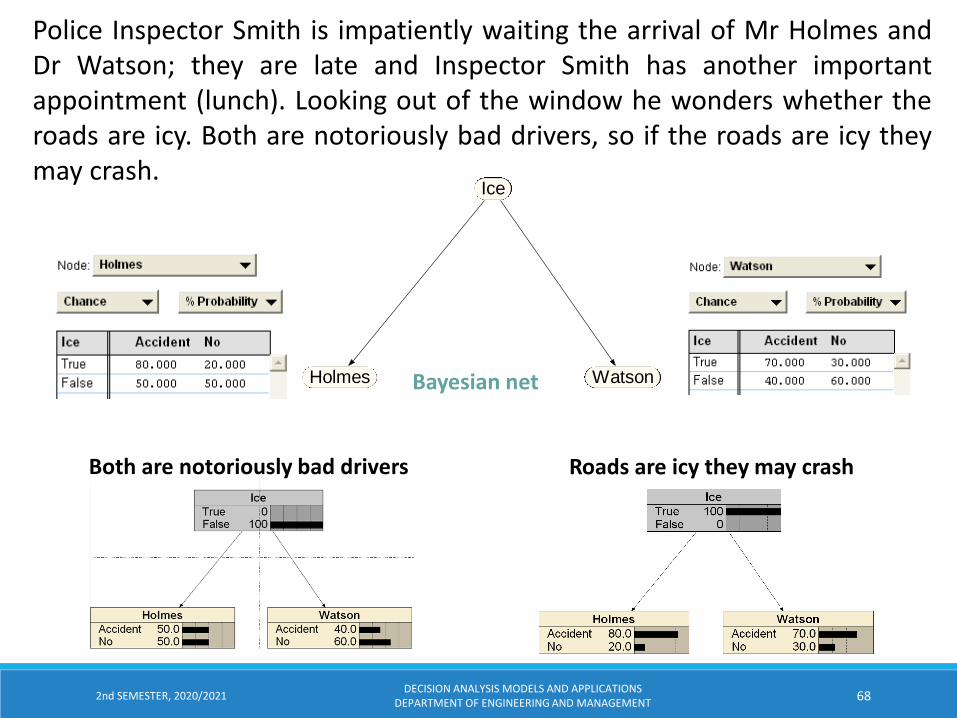
Police Inspector Smith is impatiently waiting the arrival of Mr Holmes andDr Watson; they are late and Inspector Smith has another importantappointment (lunch). Looking out of the window he wonders whether theroads are icy. Both are notoriously bad drivers, so if the roads are icy theymay crash.
Holmes Watson
Ice
Both are notoriously bad drivers Roads are icy they may crash
Bayesian net
2nd SEMESTER, 2020/2021DECISION ANALYSIS MODELS AND APPLICATIONS
DEPARTMENT OF ENGINEERING AND MANAGEMENT68

if the roads are icy they may crash
Holmes Watson
Ice
2nd SEMESTER, 2020/2021DECISION ANALYSIS MODELS AND APPLICATIONS
DEPARTMENT OF ENGINEERING AND MANAGEMENT69

His secretary enters and tells him that Dr Watson has had a car accident,“Watson? OK. It could be worse… icy roads! Then Holmes has most probablycrashed too. I’ll go for lunch now.”
if the roads are icy they may crash
2nd SEMESTER, 2020/2021DECISION ANALYSIS MODELS AND APPLICATIONS
DEPARTMENT OF ENGINEERING AND MANAGEMENT70

“Icy roads?”, the secretary replies, “It is far from being that cold, and furthermore all the roads are salted.” Inspector Smith is relieved. “Bad luck for Watson. Let us give Holmes ten minutes more.”
Then Holmes has most probably crashed too
2nd SEMESTER, 2020/2021DECISION ANALYSIS MODELS AND APPLICATIONS
DEPARTMENT OF ENGINEERING AND MANAGEMENT71

Qualitative properties of Bayes nets
Inference can follow arrow direction• Knowing T tells you something about H
via I
Inference can run against arrow direction• Knowing H tells you something about T
via I
Both patterns of inference are broken if I know I
Temperatu-re below
freezing (T)
Roads icy (I)
Holmes crashes car
(H)
© Alec Morton OR425 Seminar 8: Bayes Nets and Influence Diagrams
2nd SEMESTER, 2020/2021DECISION ANALYSIS MODELS AND APPLICATIONS
DEPARTMENT OF ENGINEERING AND MANAGEMENT72

Qualitative properties of Bayes nets
Watson crashes car
(W)
Holmes crashes car
(H)
Roads icy (I)Inference can also work up along an arrow and then back down • Knowing H can tell me
something about W, supposing I don’t know I
This is known as conditional independence
• H and W (or H and T) are independent if I know the state of I (otherwise they are dependent)
© Alec Morton OR425 Seminar 8: Bayes Nets and Influence Diagrams
2nd SEMESTER, 2020/2021DECISION ANALYSIS MODELS AND APPLICATIONS
DEPARTMENT OF ENGINEERING AND MANAGEMENT73

Qualitative properties of Bayes nets
74
Sprinkler was left on
(S)
It rained (R)
Holmes lawn is wet
(L)
• If I don’t know the state of L, R and S are independent
• But if I know L is the case, R and S become dependent
- Knowing S can explain away L and thus make R less likely
• This pattern of inference is enabled rather than broken by knowledge of intermediate variable
© Alec Morton OR425 Seminar 8: Bayes Nets and Influence Diagrams
2nd SEMESTER, 2020/2021DECISION ANALYSIS MODELS AND APPLICATIONS
DEPARTMENT OF ENGINEERING AND MANAGEMENT

D-separation
© Alec Morton OR425 Seminar 8: Bayes Nets and Influence Diagrams
Definition. Two variables A and B in a Bayes net are d-separated if for all paths between A and B there is an intermediate variable V such that:
▪ the connection is serial or diverging and the state of V is known
▪ the connection is converging and neither V nor any of V’s descendants have received evidence
Serial connection
Diverging connection
VConverging connection
V
V
2nd SEMESTER, 2020/2021DECISION ANALYSIS MODELS AND APPLICATIONS
DEPARTMENT OF ENGINEERING AND MANAGEMENT75

Example of d-separation
762nd SEMESTER, 2020/2021 DECISION SUPPORT MODELS, DEPARTMENT OF ENGINEERING AND MANAGEMENT
A B C
D E F
H
G
I J
K L
M
© Alec Morton OR425 Seminar 8: Bayes Nets and Influence Diagrams

Example of d-separation
772nd SEMESTER, 2020/2021 DECISION SUPPORT MODELS, DEPARTMENT OF ENGINEERING AND MANAGEMENT
A B C
D E F
H
G
I J
K L
M
Are A and C are d-separated?◦ blue path✓
© Alec Morton OR425 Seminar 8: Bayes Nets and Influence Diagrams

Example of d-separation
782nd SEMESTER, 2020/2021 DECISION SUPPORT MODELS, DEPARTMENT OF ENGINEERING AND MANAGEMENT
A B C
D E F
H
G
I J
K L
M
Are A and C are d-separated?◦ blue path✓
◦ green path ✓
© Alec Morton OR425 Seminar 8: Bayes Nets and Influence Diagrams

Example of d-separation
792nd SEMESTER, 2020/2021 DECISION SUPPORT MODELS, DEPARTMENT OF ENGINEERING AND MANAGEMENT
A B C
D E F
H
G
I J
K L
M
Are A and C are d-separated?◦ blue path✓
◦ green path ✓
◦ gold path ✓
© Alec Morton OR425 Seminar 8: Bayes Nets and Influence Diagrams

Example of d-separation
802nd SEMESTER, 2020/2021 DECISION SUPPORT MODELS, DEPARTMENT OF ENGINEERING AND MANAGEMENT
A B C
D E F
H
G
I J
K L
M
Are A and C are d-separated?◦ blue path✓
◦ green path ✓
◦ gold path ✓
◦ purple path ✓
So A and C are d-separated
© Alec Morton OR425 Seminar 8: Bayes Nets and Influence Diagrams

But…
812nd SEMESTER, 2020/2021 DECISION SUPPORT MODELS, DEPARTMENT OF ENGINEERING AND MANAGEMENT
• Suppose we learn something about M
• A and B are still d-separated
• The green path is now a d-connecting path
• A and C are not d-separated, i.e. they are d-connected
See Jensen (1996) or Lauritzen and Spiegelhalter (1988) for more technical details
A B C
D E F
H
G
I J
K L
M
e
© Alec Morton OR425 Seminar 8: Bayes Nets and Influence Diagrams

Significance of d-separation
❑ It’s been suggested that d-separation represents abasic property which any automation of reasoningunder uncertainty must obey
❑ Equally, it could be argued that this is such a non-intuitive property that it’s further evidence thatevolution hasn’t equipped us with great natural toolsfor probabilistic inference
2nd SEMESTER, 2020/2021DECISION ANALYSIS MODELS AND APPLICATIONS
DEPARTMENT OF ENGINEERING AND MANAGEMENT82

Ex: combining Bayesian networks with MCDA
2nd SEMESTER, 2020/2021DECISION ANALAYSIS MODELS AND APPLICATIONS
DEPARTMENT OF ENGINEERING AND MANAGEMENT

Chest Clinic Copyright 1998 Norsys Software Corp.This belief network is also known as "Asia”. It is a toy medical diagnosisexample from:Lauritzen, Steffen L. and David J. Spiegelhalter (1988), “Local computations withprobabilities on graphical structures and their application to expert systems”, J.Royal Statistics Society B, 50(2), 157-194.
2nd SEMESTER, 2020/2021DECISION ANALYSIS MODELS AND APPLICATIONS
DEPARTMENT OF ENGINEERING AND MANAGEMENT84

It is a simplified version of a network that could be used to diagnose patientsarriving at a clinic. Each node in the network corresponds to some condition ofthe patient, for example, "Visit to Asia" indicates whether the patient recentlyvisited Asia. To diagnose a patient, values are entered for nodes when they areknown. Netica then automatically re-calculates the probabilities for all the othernodes, based on the relationships between them. The links between the nodesindicate how he relationships between the nodes are structured.
2nd SEMESTER, 2020/2021DECISION ANALYSIS MODELS AND APPLICATIONS
DEPARTMENT OF ENGINEERING AND MANAGEMENT85

The two top nodes are for predispositions which influence the likelihood of thediseases. Those diseases appear in the row below them. At the bottom aresymptoms of the diseases. To a large degree, the links of the network correspondto causation. This is a common structure for diagnostic networks: predispositionnodes at the top, with links to nodes representing internal conditions and failurestates, which in turn have links to nodes for observables. Often there are manylayers of nodes representing internal conditions, with links between themrepresenting their complex inter-relationships.
2nd SEMESTER, 2020/2021DECISION ANALYSIS MODELS AND APPLICATIONS
DEPARTMENT OF ENGINEERING AND MANAGEMENT86
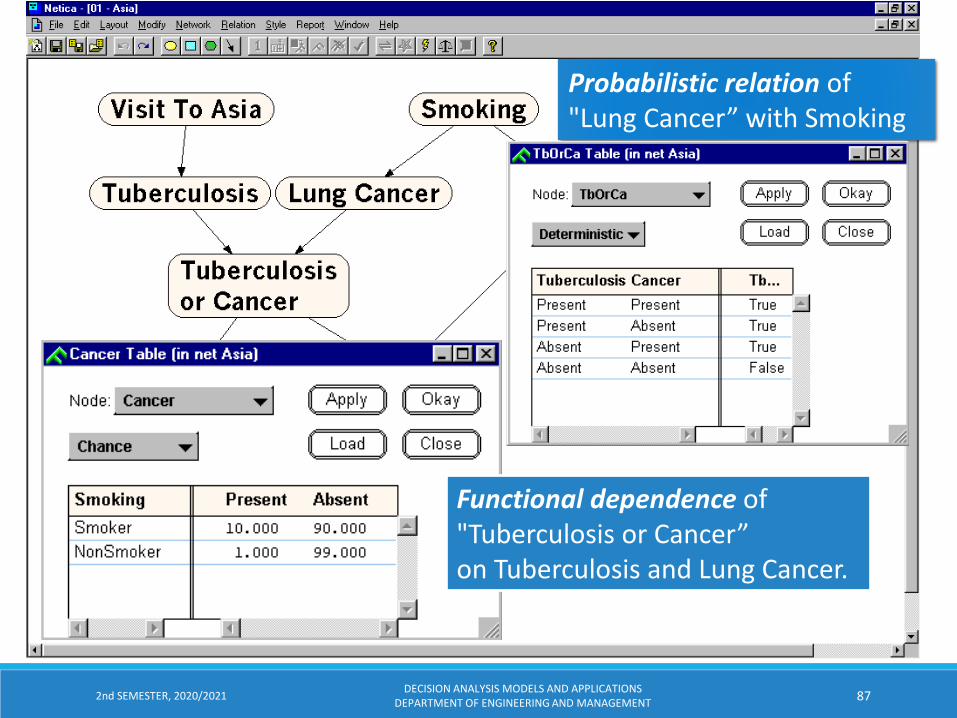
Probabilistic relation of "Lung Cancer” with Smoking
Functional dependence of "Tuberculosis or Cancer”on Tuberculosis and Lung Cancer.
2nd SEMESTER, 2020/2021DECISION ANALYSIS MODELS AND APPLICATIONS
DEPARTMENT OF ENGINEERING AND MANAGEMENT87

Probabilitiesof each stateof the node“Bronchitis”
Suppose we want to "diagnose" a new patient. When she first enters the clinic,without having any information about her, we believe she has lung cancer witha probability of 5.5% (the number may be higher than that for the generalpopulation, because something has led her to the chest clinic).
2nd SEMESTER, 2020/2021DECISION ANALYSIS MODELS AND APPLICATIONS
DEPARTMENT OF ENGINEERING AND MANAGEMENT88

Finding - She has anabnormal x-ray
All the probability numbers and barschanged to take into account the finding.
Now the probability that she haslung cancer has increased from 5.5%
to 48.9%.
2nd SEMESTER, 2020/2021DECISION ANALYSIS MODELS AND APPLICATIONS
DEPARTMENT OF ENGINEERING AND MANAGEMENT89
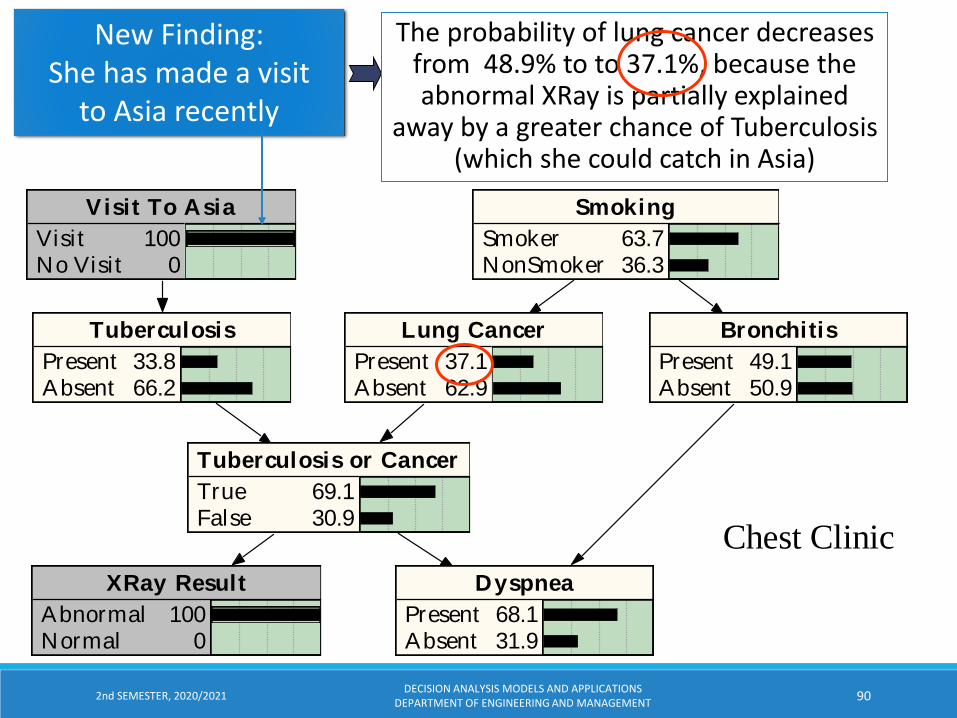
Tuberculosis
PresentAbsent
33.866.2
XRay Result
AbnormalNormal
100 0
Tuberculosis or Cancer
TrueFalse
69.130.9
Lung Cancer
PresentAbsent
37.162.9
Dyspnea
PresentAbsent
68.131.9
Bronchitis
PresentAbsent
49.150.9
Visit To Asia
Visi tNo Visi t
100 0
Smoking
SmokerNonSmoker
63.736.3
Chest Clinic
New Finding:She has made a visit
to Asia recently
The probability of lung cancer decreasesfrom 48.9% to to 37.1%, because theabnormal XRay is partially explained
away by a greater chance of Tuberculosis(which she could catch in Asia)
2nd SEMESTER, 2020/2021DECISION ANALYSIS MODELS AND APPLICATIONS
DEPARTMENT OF ENGINEERING AND MANAGEMENT90

A new patient has just walked in: remove all the findings
2nd SEMESTER, 2020/2021DECISION ANALYSIS MODELS AND APPLICATIONS
DEPARTMENT OF ENGINEERING AND MANAGEMENT91