Modeling Variability and Uncertainty in Risk … Variability and Uncertainty in Risk ... –...
44
All opinions and statements are those of the individual making the presentation and not necessarily the opinion or view of IAFP Modeling Variability and Uncertainty in Risk Assessment: a Case Study of Salmonella in Low a w Foods and its Use in Decision Making Organized by: Microbial Modelling and Risk Analysis PDG
-
Upload
hoangtuong -
Category
Documents
-
view
217 -
download
0
Transcript of Modeling Variability and Uncertainty in Risk … Variability and Uncertainty in Risk ... –...
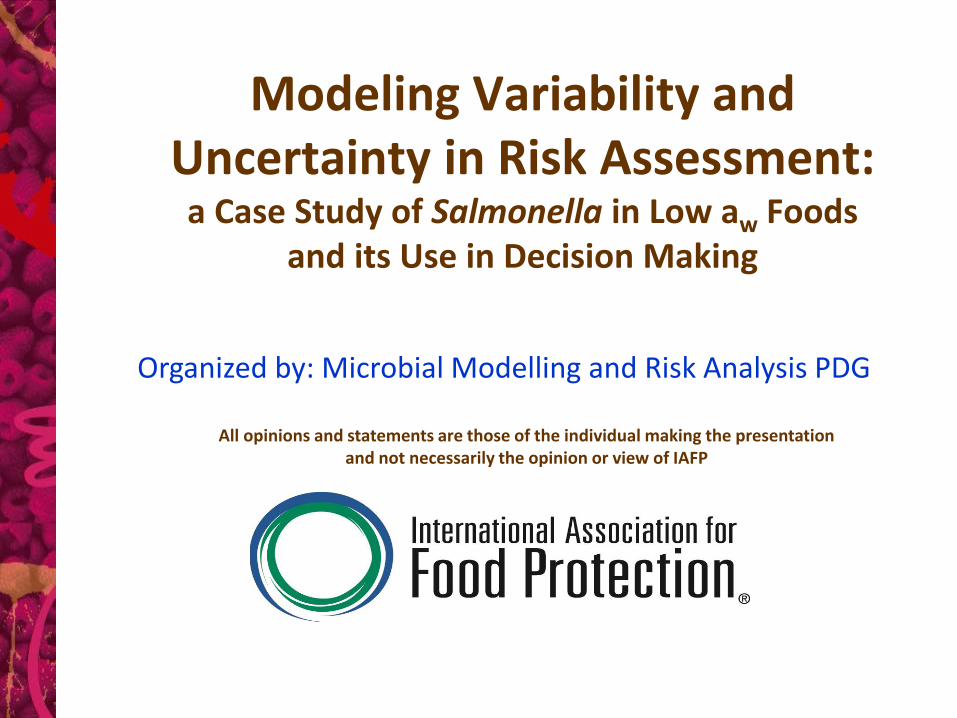
All opinions and statements are those of the individual making the presentation and not necessarily the opinion or view of IAFP
Modeling Variability and Uncertainty in Risk Assessment:
a Case Study of Salmonella in Low aw Foods and its Use in Decision Making
Organized by: Microbial Modelling and Risk Analysis PDG

Speakers: FDA Center for Food Safety and Applied Nutrition
• Dr. Sofia Santillana Farakos OAO/DRDA/Risk Analysis Branch
• Dr. Régis Pouillot OAO/DRDA/Risk Analysis Branch
• Jenny Scott Senior Advisor, the Office of Food Safety
Moderator: • Dr. Yuhuan Chen
FDA CFSAN/OAO/DRDA/Risk Analysis Branch Chair of MMRA PDG (2014-2016)

Questions should be submitted via the Text Chat section at the bottom of the screen.
Q&A’s to be held at the end of presentation
Facilitated Discussion

Modeling Variability and
Uncertainty in Risk Assessment: a Case Study of Salmonella in Low aw Foods
and its Use in Decision Making
Sofia Santillana Farakos
Régis Pouillot
Jenny Scott
IAFP WEBINAR June 8th 2016

Before we start…
The information and conclusions presented
in this webinar do not necessarily represent
new Agency policy nor do they imply an
imminent change in existing policy
5

Outline of today’s webinar
• Introduction
• Salmonella in low water activity foods
– Prevalence and levels of contamination
– Survival
– Predictive modelling
• Modelling uncertainty and variability when assessing risk
– The inference process
– Simulation
– Challenges
• Variability and uncertainty in risk management
– Usefulness when making decisions
6

Uncertainty
The unknown
• Reduced by additional
data
• Dose response,
storage times, serving
size, …
In many cases, factors are both variable
and uncertain
Variability
Heterogeneity
• Not reduced by additional
data
• May be better characterized
• Growth, inactivation, serving
size, …
Variability and Uncertainty
• Initial contamination
• Initial concentration
• Process
characteristics
• Storage conditions
• Serving size
• Dose
• Dose Response
• Etc.
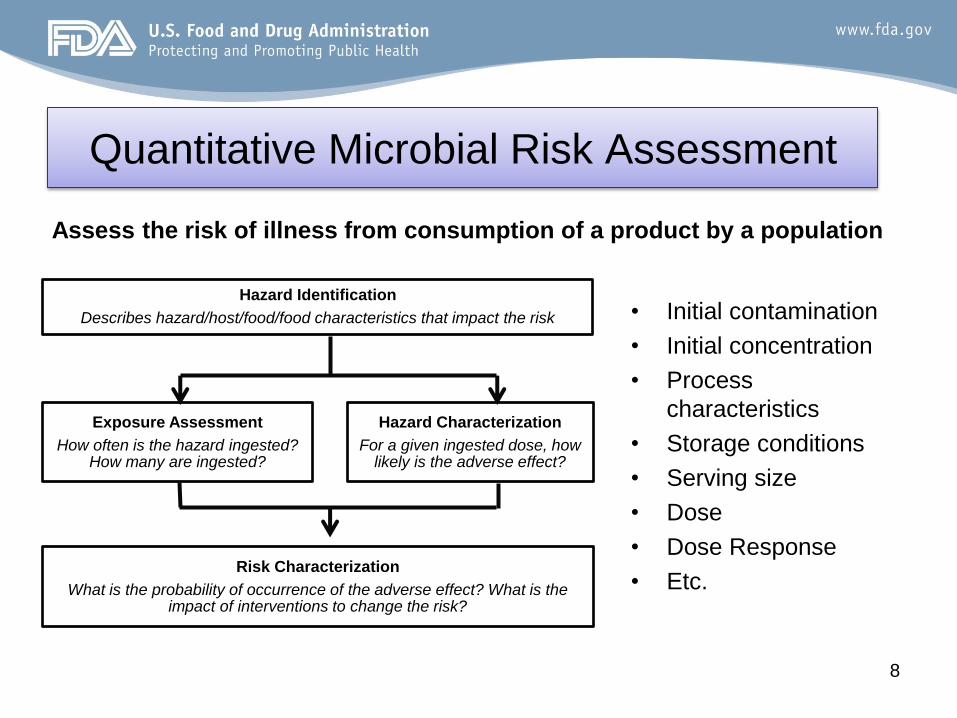
8
Hazard Identification
Describes hazard/host/food/food characteristics that impact the risk
Exposure Assessment
How often is the hazard ingested? How many are ingested?
Hazard Characterization
For a given ingested dose, how likely is the adverse effect?
Risk Characterization
What is the probability of occurrence of the adverse effect? What is the impact of interventions to change the risk?
Assess the risk of illness from consumption of a product by a population
Quantitative Microbial Risk Assessment

9
Understanding extremes
CAN HELP RISK
MANAGEMENT
Log Risk Per Serving FAO/WHO (2002). Risk Assessment of Salmonella in eggs and broiler
chickens. Technical report. Microbiological Risk Assessment Series, no 2.
Rome, Food and Agriculture Organization of the United Nations and World
Health Organization: 327
Quantitative Microbial Risk Assessment:
An example

10
FDA/FSIS (2003).
Quantitative assessment
of the relative risk to
public health from
foodborne Listeria
monocytogenes among
selected categories of
ready-to-eat foods.
http://www.fda.gov/Food/
FoodScienceResearch/Ri
skSafetyAssessment/uc
m183966.htm
Variability and Uncertainty in Risk
Assessment

Salmonella in low aw foods
11

• Prevalence
• Contamination
level • Survival
• Growth
• Dose-Response
• Consumption
12
Salmonella in low aw foods: Contamination level
• Variability and uncertainty
• From year to year, from lot to lot, intra lot
Hazard Identification
Describes hazard/host/food/food characteristics that impact the risk
Exposure Assessment
How often is the hazard ingested? How many are ingested?
Hazard Characterization
For a given ingested dose, how likely is the adverse effect?
Risk Characterization
What is the probability of occurrence of the adverse effect? What is the impact of interventions to change the risk?

Van Doren, J.M., Blodgett, R.J., Pouillot, R., Westerman, A., Kleinmeier, D., Ziobro, G.C., Ma, Y., Hammack, T.S., Gill, V.,
Muckenfuss, M.F., Fabbri, L., 2013. Prevalence, level and distribution of Salmonella in shipments of imported capsicum and
sesame seed spice offered for entry to the United States: Observations and modeling results. Food Microbiology 36, 149-160.
Salmonella in sesame seeds; Variability
95% confidence limits for
observed values
Observed between
shipment distribution

Probability density functions of Salmonella contamination as predicted by the model.
Intra Lot: Poisson distribution
Inter Lot: Log normal distribution
Year to year: same mean of the log, varying standard deviation
Salmonella in almonds; Variability
Data: Unpublished data submitted to Federal Docket through Federal Register Notice FDA-2013_N-0747
https://www.federalregister.gov/articles/2013/07/18/2013-17211/assessment-of-the-risk-of-human-salmonellosis-associated-with-the-consumption-of-tree-nuts-request

• Prevalence
• Contamination level
• Survival • Growth
• Dose-Response
• Consumption
15
Variability and Uncertainty in survival:
• Experimental conditions
• Strain
• Temperature
• aw
• Food composition
• Survival model parameters
Salmonella in low aw foods- Survival Data
Hazard Identification
Describes hazard/host/food/food characteristics that impact the risk
Exposure Assessment
How often is the hazard ingested? How many are ingested?
Hazard Characterization
For a given ingested dose, how likely is the adverse effect?
Risk Characterization
What is the probability of occurrence of the adverse effect? What is the impact of interventions to change the risk?

5.7
0.4
-4
-3
-2
-1
0
1
2
3
4
5
6
7
-40 -20 0 20 40 60 80 100 120
log
δ
T °C
Seeds
Cereal
Dairy
Eggs
Meat
Chocolate
Feed
Halva
Mixes
Nuts
Peanut Butter
-2.2
5.7
-4
-3
-2
-1
0
1
2
3
4
5
6
7
0 0.1 0.2 0.3 0.4 0.5 0.6 0.7 0.8
log
δ
aw
16
Santillana Farakos, S.M., Schaffner, D.W., Frank, J.F., 2014. Predicting Survival of Salmonella in Low
Water Activity Foods: An Analysis of Literature Data. J Food Prot 77, 1448-1461.
Nuts ~46 weeks
PB ~3 minutes
Seeds ~46 weeks
PB ~0.4 seconds

17
Salmonella spp. survival at various T and aw on whey protein powder
21 °C 50 °C
Santillana Farakos, S.M., Frank, J.F., Schaffner, D.W., 2013.
Modeling the influence of temperature, water activity and
water mobility on the persistence of Salmonella in low-
moisture foods. Int J Food Microbiol 166, 280-293.

18 Santillana Farakos, S.M., Pouillot, R., Anderson, N., Johnson, R., Son, I., Van Doren, J., 2016. Modeling
the survival kinetics of Salmonella in tree nuts for use in risk assessment. International Journal of
Food Microbiology 227, 41-50.
~ 0.5 log
~ 1.5 log
6X Strain, 2X Media, 3X Replicate

19
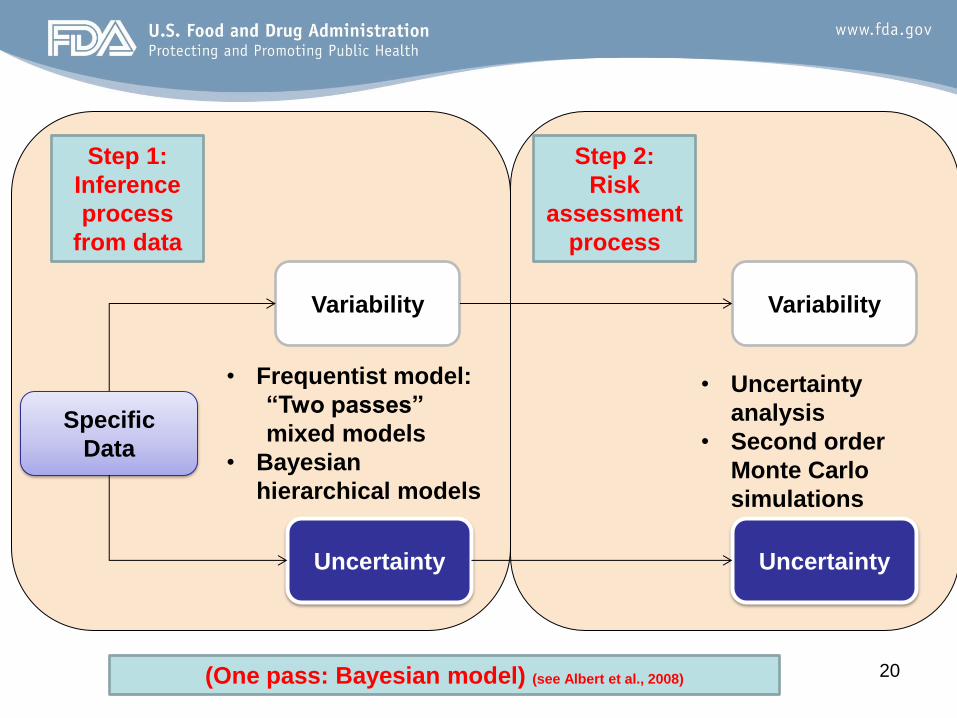
How do we model this variability and
uncertainty for use in risk assessment?
20
Specific
Data
Uncertainty
Variability
Step 1:
Inference
process
from data
Uncertainty
Variability
Step 2:
Risk
assessment
process
• Uncertainty
analysis
• Second order
Monte Carlo
simulations
(One pass: Bayesian model) (see Albert et al., 2008)
• Frequentist model:
“Two passes”
mixed models
• Bayesian
hierarchical models

Inference: Frequentist
• Two passes (example: inactivation data)
– Obtain data from representative situations (strain, stress, …)
– Model individual datasets for each strains/conditions get a set of parameters
– Parameter variability distribution derived from this set of model parameters
21
Slope ~Normal(−0.0078388, 0.00178)
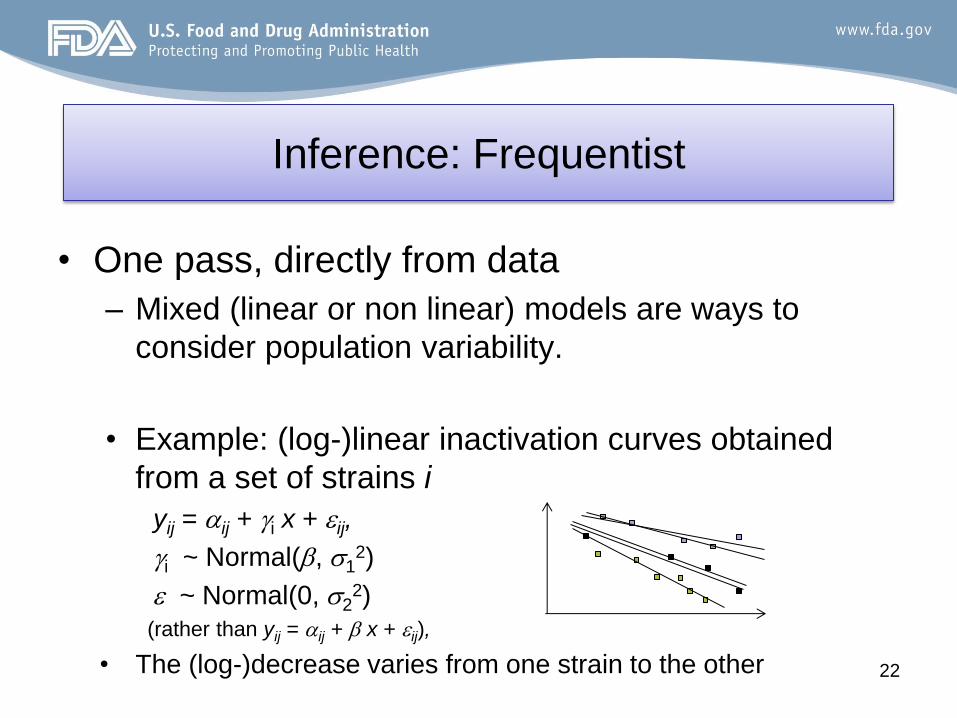
• One pass, directly from data
– Mixed (linear or non linear) models are ways to
consider population variability.
• Example: (log-)linear inactivation curves obtained
from a set of strains i
yij = ij + i x + ij,
i ~ Normal(, 12)
~ Normal(0, 22)
(rather than yij = ij + x + ij),
• The (log-)decrease varies from one strain to the other 22
Inference: Frequentist
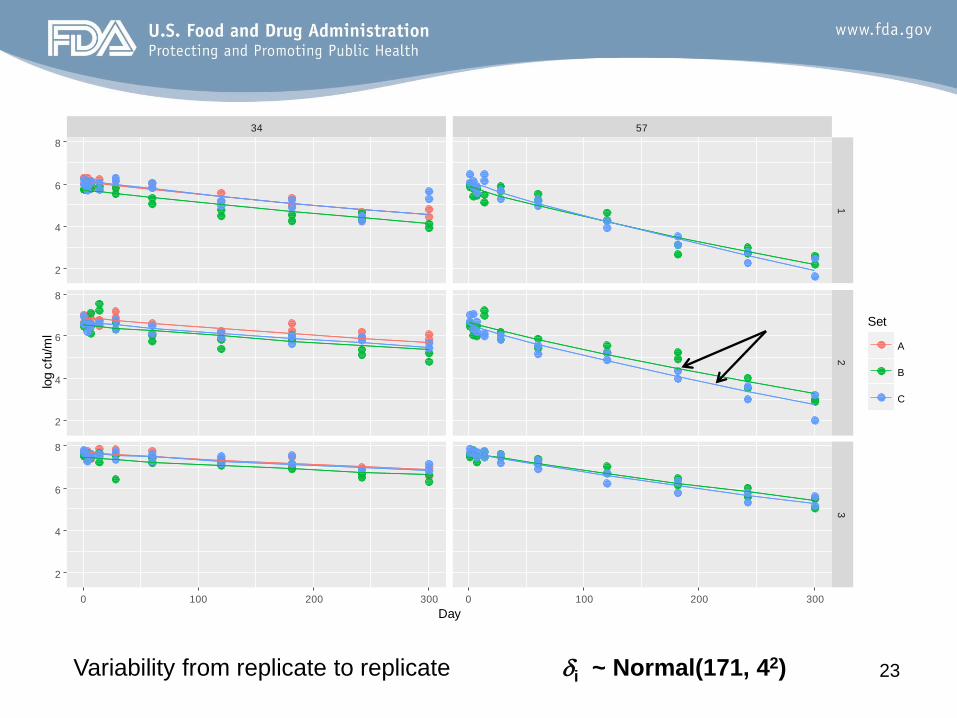
23
34 57
2
4
6
8
2
4
6
8
2
4
6
8
12
3
0 100 200 300 0 100 200 300
Day
log c
fu/m
l
Set
A
B
C
Variability from replicate to replicate i ~ Normal(171, 42)

• Uncertainty
• Asymptotic distribution of estimators
– Usually: normal
– Difficulty to consider correlations
– (sample size?)
• Bootstrap
– Pros: set of parameters that can be incorporated in the risk
assessment model
24
Inference: Frequentist

tt
Replicates: r
Media: m
Product: p
Point: t
p,r
1
Nmodeled
Nt
N0r,m
2
p
pp
𝑵𝒕 = 𝑵𝟎 −𝒕
𝜹
𝒑
Inference: Bayesian
Santillana Farakos, S.M., Pouillot, R., Anderson, N., Johnson, R., Son, I., Van Doren, J., 2016. Modeling the survival
kinetics of Salmonella in tree nuts for use in risk assessment. International Journal of Food Microbiology 227, 41-50.

Issue: Ad-hoc experimental design
• Variability
– From population to population (strain-to-strain)
– From day-to-day
– From cell-to-cell within a population
• Need specific experimental design
– No “cocktail” of strains, no “average” over replicates
– Control of strain-to-strain, day-to-day conditions
– See, e.g. den Besten et al., 2016
• Experimental < Reproduction < Strain = Growth History =
Population for L. monocytogenes inactivation
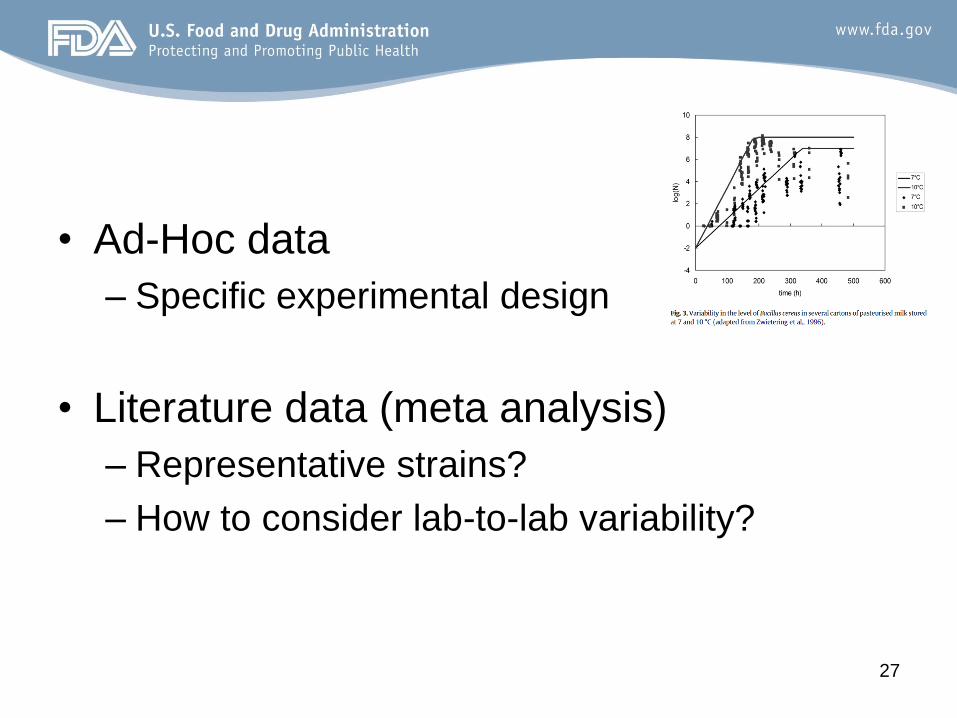
• Ad-Hoc data
– Specific experimental design
• Literature data (meta analysis)
– Representative strains?
– How to consider lab-to-lab variability?
27

28
Study reference Almond Pecan Pistachio Walnut
Abd et al. (2012) 6 - - -
Beuchat and Mann (2010) - 3 - -
Blessington, Theofel and Harris (2013) 24 - - 18
Blessington, Theofel, Mitcham, et al. (2013) - - - 6
Brar et al. (2015) - 4 - -
Kimber et al. (2012) 6 - 6 -
Uesugi et al. (2006) 38 - - -
Santillana Farakos, S.M., Pouillot, R., Anderson, N., Johnson, R., Son, I., Van Doren, J., 2016. Modeling the survival
kinetics of Salmonella in tree nuts for use in risk assessment. International Journal of Food Microbiology 227, 41-50.
Example:
Salmonella
survival on
tree nuts

29 Santillana Farakos, S.M., Pouillot, R., Anderson, N., Johnson, R., Son, I., Van Doren, J., 2016. Modeling
the survival kinetics of Salmonella in tree nuts for use in risk assessment. International Journal of
Food Microbiology 227, 41-50.
Pistachios
Pecans
Almonds
Walnuts
Log Reduction
1 week 4 weeks 12 weeks 52 weeks

30
Specific
Data
Uncertainty
Variability
Step 1:
Inference
process
from data
Uncertainty
Variability
Step 2:
Risk
assessment
process
• Frequentist model:
“Two passes”
mixed models
• Bayesian
hierarchical models
• Uncertainty
analysis
• Second order
Monte Carlo
simulations
(One pass: Bayesian model)

Test alternative values for uncertain
parameters / model
• Baseline
• Alternative #1: little impact
• Alternative #2: high impact
31 -16 -14 -12 -10 -8
0.0
0.2
0.4
0.6
0.8
Risk per serving
De
nsity
-16 -14 -12 -10 -8
0.0
0.2
0.4
0.6
0.8
Risk per serving
De
nsity
-16 -14 -12 -10 -8
0.0
0.2
0.4
0.6
0.8
Risk per serving
De
nsity
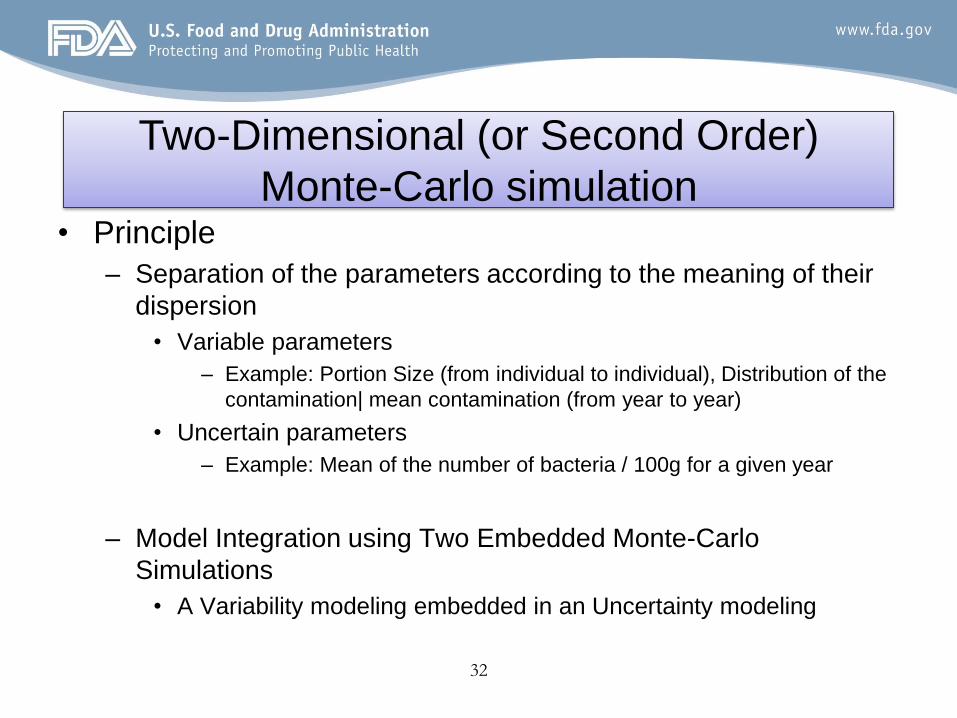
Two-Dimensional (or Second Order)
Monte-Carlo simulation • Principle
– Separation of the parameters according to the meaning of their
dispersion
• Variable parameters
– Example: Portion Size (from individual to individual), Distribution of the
contamination| mean contamination (from year to year)
• Uncertain parameters
– Example: Mean of the number of bacteria / 100g for a given year
– Model Integration using Two Embedded Monte-Carlo
Simulations
• A Variability modeling embedded in an Uncertainty modeling
32

Second-Order Monte Carlo Simulation
Nu times…
… …
QRA Model (variable parameters)
Uncertain parameter X (example: mean
log10 decrease / week)
Fixed to a given random sample
issued from the uncertainty
distribution a
l / day
De
nsity
0.0 0.5 1.0 1.5 2.0 2.5 3.0
0.0
0.5
1.0
1.5
2.0
b
l / year
De
nsity
0 200 400 600 800
0.0
00
0.0
02
0.0
04
0.0 0.2 0.4 0.6 0.8 1.0
0.0
0.2
0.4
0.6
0.8
1.0
x = prob(effet néfaste)
Fn(x
)
Mean: 2.6
Mean: 3.2
Nu Means: median 3.3, 2.5 and 97.5th percentiles [.2, 6.9]

In practice
• Separation of uncertainty and
variability is not explicitly
considered in most MC
software used in QMRA
• Can be done in classical MC
software using large matrices
or use other tools
• 2D-MC simulation to be
implemented in
FDA-iRISK® 3.0
• R package mc2d “Ease the development
of MC and 2D-MC in R”
– (you specify if the distributions
represent Uncertainty or Variability,
then mc2d do the math for you)
34
0.0 0.2 0.4 0.6 0.8 1.0
0.0
0.2
0.4
0.6
0.8
1.0
HUSrisk
Fn
(x)
Variability cumulative distribution plots of the
output of an E. coli model in ground beef
model
Mean Risk Median Risk
median 0.15 0.01
CI Inf 0.04 0.00
CI Sup 0.27 0.06

-25 -20 -15 -10 -5
0.0
0.2
0.4
0.6
0.8
1.0
log10(extractvar(RiskCoreRaw, 1))
Fn
(x)
35 Log10 risk per serving
Results

Warning
• In this talk, we considered only data uncertainty
within a given model
• Need to consider other sources of uncertainty
– Scenario uncertainty
– Model uncertainty
• May be much more important than the data
uncertainty
36

Salmonella in almonds
37
0 2 4 6 8 10
0.0
0.2
0.4
0.6
0.8
MPN/100 g
de
nsity
• The “outbreak situation” is not simply an extreme of the “usual
situation”.
• Needed to consider separately “usual situation” and “outbreak
situation”, as was done in this paper
Worst case (0.1%): 5.4 MPN/100g
Samples from the 2001 outbreak
4 samples
7.9 MPN/100g
1 sample
5.6 MPN/100g
21 samples
3.4 MPN/100g
Lambertini, E., M. D. Danyluk, D. W. Schaffner, C. K. Winter, and L. J. Harris. 2012. Risk of salmonellosis from consumption of almonds in the North
American market. Food Research International. 45:1166-1174.
Conclusions
• Don’t mix variability and uncertainty
– Easiest way: consider variability only and test uncertainty for
some major parameters
– More complex methods available
– Need carefully designed data collection for risk assessment
purpose to consider proper variability
• Don’t forget Scenario and Model uncertainty
– Need to model “exceptional events” that are not the extreme of
the usual distribution
• May lead your whole risk
• Frequency? Magnitude?

39
How can we use the modeled variability
and uncertainty for decision making?

40
Risk Management

41
How to make a decision?
Log reduction treatment (log10)
Estimated mean number of cases
Estimate CI 95%
0 100,000 10,000 1,000,000
1 10,000 1,000 100,000
2 1,000 100 10,000
3 100 10 1000
4 10 1 100
5 1 <1 10
6 <1 <1 <1

Overall challenges in considering
uncertainty and variability in risk analysis
• Risk assessors
– Complicated process/ Not well understood
– Feasibility
– Lack of “easy-to-use” tools
• Risk managers
– More difficult to handle
– The uncertainty may be considered as “too large”
– How to “draw a line”?
• Risk communication
– More difficult to communicate • “So you are not certain?”
42

References used – Albert, I., E. Grenier, J. B. Denis and J. Rousseau (2008). "Quantitative risk assessment from farm to fork and beyond: a global
Bayesian approach concerning food-borne diseases." Risk Anal 28(2): 557-571.
– den Besten, H. M., D. C. Aryani, K. I. Metselaar and M. H. Zwietering (2016). "Microbial variability in growth and heat resistance of
a pathogen and a spoiler: All variabilities are equal but some are more equal than others." Int J Food Microbiol.
– FAO/WHO (2002). Risk Assessment of Salmonella in eggs and broiler chickens. Technical report. Microbiological Risk
Assessment Series, no 2. Rome, Food and Agriculture Organization of the United Nations and World Health Organization: 327
– Food and Drug Administration / Food Safety and Inspection Service (2003). Quantitative assessment of relative risk to public
health from foodborne Listeria monocytogenes among selected categories of ready-to-eat foods, Food and Drug Administration,
United States Department of Agriculture, Centers for Disease Control and Prevention: 541.
http://www.fda.gov/Food/FoodScienceResearch/RiskSafetyAssessment/ucm183966.htm.
– Kimber, M. A., H. Kaur, L. Wang, M. D. Danyluk and L. J. Harris (2012). "Survival of Salmonella, Escherichia coli O157:H7, and
Listeria monocytogenes on Inoculated Almonds and Pistachios Stored at 19, 4, and 24 C." J Food Prot 75(8): 1394-1403.
– Lambertini, E., M. D. Danyluk, D. W. Schaffner, C. K. Winter and L. J. Harris (2012). "Risk of salmonellosis from consumption of
almonds in the North American market." Food Research International 45(2): 1166-1174.
– Pouillot, R., M.-L. Delignette-Muller, D. L. Kelly and J.-B. Denis (2015). The mc2d package. https://cran.r-
project.org/web/packages/mc2d/vignettes/docmcEnglish.pdf.
– Santillana Farakos, S. M., R. Pouillot, N. Anderson, R. Johnson, I. Son and J. Van Doren (2016). "Modeling the survival kinetics of
Salmonella in tree nuts for use in risk assessment." Int J Food Microbiol 227: 41-50.
– Santillana Farakos, S. M., D. W. Schaffner and J. F. Frank (2014). "Predicting survival of Salmonella in low-water activity foods: an
analysis of literature data." J Food Prot 77(9): 1448-1461.
– Santillana Farakos, S.M., J.F., Frank, D.W., Schaffner (2013). “Modeling the influence of temperature, water activity and water
mobility on the persistence of Salmonella in low-moisture foods.” Int J Food Microbiol 166: 280-293.
– Van Doren, J. M., R. J. Blodgett, R. Pouillot, A. Westerman, D. Kleinmeier, G. C. Ziobro, Y. Ma, T. S. Hammack, V. Gill, M. F.
Muckenfuss and L. Fabbri (2013). "Prevalence, level and distribution of Salmonella in shipments of imported capsicum and
sesame seed spice offered for entry to the United States: Observations and modeling results." Food Microbiology 36(2): 149-160.
– Zwietering, M. H. (2015). "Risk assessment and risk management for safe foods: Assessment needs inclusion of variability and
uncertainty, management needs discrete decisions." Int J Food Microbiol 213: 118-123.
43

Contact information for speakers
FDA Center for Food Safety and Applied Nutrition