Ultimate Strength of Steel-Concrete Composite Beams ... ULTIMATE STRENGTH OF STEEL-CONCRETE...
90
i University of Southern Queensland Faculty of Engineering and Surveying Ultimate Strength of Steel-Concrete Composite Beams under Combined Bending and Torsion A dissertation submitted by Mr. Matthew Neil Kronk in fulfillment of the requirements of Courses ENG4111 and 4112 Research Project towards the degree of Bachelor of Engineering (Civil) Title Page Submitted: November, 2006
Transcript of Ultimate Strength of Steel-Concrete Composite Beams ... ULTIMATE STRENGTH OF STEEL-CONCRETE...

i
University of Southern Queensland
Faculty of Engineering and Surveying
Ultimate Strength of Steel-Concrete Composite Beams
under Combined Bending and Torsion
A dissertation submitted by
Mr. Matthew Neil Kronk
in fulfillment of the requirements of
Courses ENG4111 and 4112 Research Project
towards the degree of
Bachelor of Engineering (Civil)
Title Page
Submitted: November, 2006
ii
ULTIMATE STRENGTH OF STEEL-CONCRETE COMPOSITE BEAMS UNDER COMBINED BENDING AND TORSION
Abstract
Sponsorship: The University of Southern Queensland
Matthew KRONK Degree: Bachelor of Engineering, Civil
Supervisor: Dr. Qing Quan (Stephen) Liang 1. INTRODUCTION
This dissertation seeks to further understand the combined effects of flexure and torsion on composite steel-concrete beams, beams often used in construction today. This will be done using the finite element analysis method, eliminating the need for high-cost, laboratory work. 2. BACKGROUND
Steel-concrete composite beams consist of a Universal Beam with a concrete slab lying on the upper flange of the Universal Beam. Composite action is achieved through a series of steel studs, which are welded to the upper flange of the steel beam, which are concreted within the concrete slab up to the middle layer. This connection is referred to as ‘shear connection’ and the number of steel studs used determines if full or partial shear connection exists. Under combined torsion and flexure, there is very little information regarding to the ultimate loads of steel-concrete composite beams. In the late 70’s and early 80’s, a series of experiments was conducted in order to investigate the combined effect of flexure and torsion by R.K. Singh, S.K. Mallick (1977), B. Ghosh, S.K. Mallick (1979) and M. Basu Ray, S.K. Mallick (1980).
3. OBJECTIVES
This project aims to investigate the ultimate load behaviour of steel-concrete composite beams under the combined actions of bending and torsion using the finite element analysis program ABAQUS. The results obtained will then be used to develop design formulas for the design of composite beams under bending and torsion. 4. METHODOLOGY
For the modelling of a non-linear steel-concrete composite beam, research into existing experiments needed to be made in order to verify the developed model. The model developed was 3-dimensional to help stimulate geometric and material non-linear behaviour. The steel beam was modelled using shell elements, as was the concrete slab. The stud shear connectors were modelled using both beam and truss elements. The model is then verified for accuracy before the generation of torque / moment interaction diagrams to display behaviour and for the derivation of design formulas relating to the ultimate torque and moment capacity of the member. 5. CONCLUSION
After the model was successfully verified, obtaining an ultimate strength within 10% of that achieved in the researched experiment, the model was tested under loading conditions of flexure and torsion. The results obtained were not deemed to be suitable for the development of a moment/torque interaction equation due to the unusual behaviour observed. 6. ACKNOWLEDGEMENTS
I would like to thank my supervisor, Stephen Liang for his invaluable assistance during this project

ENG 4111/4112 Project Dissertation Matthew Kronk
0050011657
iii
University of Southern Queensland
Faculty of Engineering and Surveying
ENG4111 Research Project Part 1 &
ENG4112 Research Project Part 2
Limitations of Use
The Council of the University of Southern Queensland, its Faculty of
Engineering and Surveying, and the staff of the University of Southern
Queensland, do not accept any responsibility for the truth, accuracy or
completeness of material contained within or associated with this
dissertation.
Persons using all or any part of this material do so at their own risk, and
not at the risk of the Council of the University of Southern Queensland,
its Faculty of Engineering and Surveying or the staff of the University of
Southern Queensland.
This dissertation reports an educational exercise and has no purpose or
validity beyond this exercise. The sole purpose of the course pair entitled
"Research Project" is to contribute to the overall education within the
student’s chosen degree program. This document, the associated
hardware, software, drawings, and other material set out in the associated
appendices should not be used for any other purpose: if they are so used,
it is entirely at the risk of the user.
Professor R Smith
Dean
Faculty of Engineering and Surveying

ENG 4111/4112 Project Dissertation Matthew Kronk
0050011657
iv
CERTIFICATION
I certify that the ideas, designs and experimental work, results, analysis and
conclusions set out in this dissertation are entirely my own efforts, except where
otherwise indicated and acknowledged.
I further certify that the work is original and has not been previously submitted for
assessment in any other course or institution, except where specifically stated.
Matthew Neil Kronk
Student Number: 0050011657
_____________________________
Signature
30/10/2006____________________
Date

ENG 4111/4112 Project Dissertation Matthew Kronk
0050011657
v
ACKNOWLEDGEMENTS
This project was carried out under the principle supervision of Dr. Qing Quan
Liang and I would like to formally acknowledge the valuable assistance he
provided me and for always having an open door.
Appreciation is also due to my friends and family for their encouragement and
support provided throughout the year.

ENG 4111/4112 Project Dissertation Matthew Kronk
0050011657
1
Table of Contents
Title Page........................................................................................................................... i
Abstract ............................................................................................................................ ii
Limitations of Use ........................................................................................................... iii
Candidates Certification .................................................................................................. iv
Acknowledgements ...........................................................................................................v
List of Figures ...................................................................................................................4
List of Tables.....................................................................................................................6
Chapter 1. Introduction ..................................................................................................7
1.1 General ....................................................................................................................7
1.2 Background Information .......................................................................................10
1.2.1 Singh & Mallick (1977) .................................................................................10
1.2.2 Ghosh & Mallick (1979) ................................................................................13
1.2.3 Basu Ray & Mallick (1980) ...........................................................................14
1.3 Aims ......................................................................................................................16
1.4 Layout of this Dissertation ....................................................................................17
Chapter 2. Literature Review.......................................................................................19
2.1 Introduction ...........................................................................................................19
2.2 Nonlinear Analysis of Composite Beams..............................................................19
2.3 Experiments on Steel-Concrete Composite Beams...............................................26
2.4 Composite Beams under Combined Bending and Shear.......................................28
2.5 Conclusions ...........................................................................................................31
Chapter 3. Methodology ...............................................................................................32
3.1 Introduction ...........................................................................................................32

ENG 4111/4112 Project Dissertation Matthew Kronk
0050011657
2
3.2 Information Gathering ...........................................................................................32
3.3 Finite Element Analysis ........................................................................................33
3.4 Model Validation...................................................................................................35
3.5 Moment-Torque Interaction Curves ......................................................................36
3.6 Formula Development ...........................................................................................36
3.7 Conclusions ...........................................................................................................37
Chapter 4. Finite Element Analysis .............................................................................38
4.1 Introduction ...........................................................................................................38
4.2 The Finite Element Model.....................................................................................38
4.2.1 Concrete Slab .................................................................................................40
4.2.2 Steel Beam......................................................................................................40
4.2.3 Shear Connectors............................................................................................40
4.2.4 Solution Method.............................................................................................41
4.3 Stress-Strain Curves for Steels ..............................................................................41
4.3.1 Steel Beam......................................................................................................42
4.3.2 Reinforcing Bars.............................................................................................43
4.3.3 Shear Connectors............................................................................................44
4.4 Stress-Strain Curves for Concrete .........................................................................44
4.4.1 Concrete in Compression ...............................................................................44
4.4.2 Concrete in Tension........................................................................................46
4.5 Shear Retention .....................................................................................................47
4.6 Conclusions ...........................................................................................................48
Chapter 5. Results & Discussion ..................................................................................50
5.1 Introduction ...........................................................................................................50

ENG 4111/4112 Project Dissertation Matthew Kronk
0050011657
3
5.2 Model Validation...................................................................................................50
5.3 Moment-Torque Interaction ..................................................................................54
5.3.1 Boundary Conditions......................................................................................55
5.3.2 Load-Deflection Curves .................................................................................56
5.3.3 Moment-Torque Curves .................................................................................59
5.3.4 Model Behaviour............................................................................................61
5.4 Model Inadequacies...............................................................................................65
5.4.1 Rebar Layers...................................................................................................65
5.4.2 Material Properties and Modelling Techniques .............................................66
5.5 Conclusions ...........................................................................................................66
Chapter 6. Conclusions .................................................................................................67
6.1 Summary................................................................................................................67
6.2 Further Research....................................................................................................68
Appendices ......................................................................................................................70
Appendix A, Project Specification ..............................................................................70
Appendix B, Load/Deflection Tables..........................................................................72
References .......................................................................................................................83

ENG 4111/4112 Project Dissertation Matthew Kronk
0050011657
4
List of Figures Number Title Page
1.1 Steel-concrete Composite Beams 9
1.2 Loading Scheme 12
1.3 Ultimate moment-torque Interaction Diagram 12
1.4 Ultimate Strength Interaction Diagram 14
1.5 Ultimate Strength Interaction Diagram 15
3.1 Eccentric Load, Cross-section 34
3.2 Eccentric Load, Side View 35
4.1 Model Mesh 39
4.2 Cross-section of Composite Beam 39
4.3 Stress-Strain Curve, Steel 43
4.4 Stress-Strain Curve for Concrete 45
4.5 Stress-Strain Curve for Concrete in Tension 47
5.1 Comparison of Load/Deflection Results 53
5.2 Steel-Concrete Composite Beam under Pure Flexure 53
5.3 Simply Supported Composite Beam 55
5.4 Adopted Boundary Conditions for the Composite Beam 56
5.5 Load/Deflection Curve 1 57
5.6 Load/Deflection Curve 2 57
5.7 Load/Deflection Curve 3 58
5.8 Load/Deflection Curve 4 58
5.9 Load/Deflection Curve 5 58
5.10 Initial Moment/Torque Diagram 60

ENG 4111/4112 Project Dissertation Matthew Kronk
0050011657
5
Number Title Page
5.11 Moment/Torque Diagram 61
5.12 Steel-Concrete Composite Beam under 120mm eccentric load 62
5.13 Steel-Concrete Composite Beam under 360mm eccentric load 62
5.14 Steel-Concrete Composite Beam under 400mm eccentric load 63
5.15 Cantilever Arrangement 64
6.1 Suggested Loading Scheme 68
6.2 Alternative Loading Scheme 69

ENG 4111/4112 Project Dissertation Matthew Kronk
0050011657
6
List of Tables
Number Title Page
4.1 Material Properties Summary 48
5.1 Load/Deflection Data 51

ENG 4111/4112 Project Dissertation Matthew Kronk
0050011657
7
Chapter 1. Introduction
1.1 General
Throughout the history of mankind, man has used and has experimented
with numerous types of building materials. From the use of timbers, to sandstone
bricks, man has sort to use many different sorts of materials to address issues such
as strength, availability, cost and aesthetics. Today, the same issues apply.
Back in the days when stone was still a commonly used material,
architects and engineers of the time were able to overcome the materials tensional
limitations. Through the use of arches, most forces within a structure were
effectively transformed into predominately compressive ones, allowing the
structure to work to the materials advantage. This use of arches can be seen in
Roman structures that still stand around the world today. This example not only
teaches us how early architects and engineers were able to extend their current
building “repertoire”, but it is also an example of how human ingenuity was able
to solve a problem, was able to recognise how a material acts and works, and thus,
design to exploit those properties.
Concrete is a modern day example. Today, it is one of the most widely
used construction materials in the world, thanks in due to its mouldable shape,
compressive strength and its economic attributes. But it really came into its own
when concrete was started to be used as a composite structure. With internal steel
reinforcement, the tensional limitations of concrete were able to be overcome,
whilst maintaining its mouldable, economic properties. This discovery allowed
concrete to become one of the most used materials in modern construction. This is

ENG 4111/4112 Project Dissertation Matthew Kronk
0050011657
8
another example of overcoming a problem, of recognising a materials weakness
and thus accommodating for it. Through composite action, concrete was enabled
to be used in much broader scenarios.
What both these examples show is that through investigation of material
behaviour, man has been able to extend the applications of that particular material.
Steel-concrete composite beams have been widely used in building and
bridge construction. A composite beam is constructed by casting a reinforced
concrete slab on the top of a steel beam. Composite action between the steel and
the concrete is achieved by means of mechanical connectors. These connectors are
generally dubbed as ‘shear connectors’. They are typically connected by welding
to the top flange of a steel beam and cast within the concrete slab. It is only
through this connection that composite action is achieved, without these
connectors, the concrete and the slab act independently and analysis is relatively
simple. Shear connection significantly increases the strength and stiffness
performance of composite beams. The amount of connectors provided designates
what the composite beams shear connection is. A composite beam can be
considered to have full shear connection or partial shear connection, proportional
to the amount of shear connections. Shear connectors, according to AS 2327.1,
can take the form of either headed studs, channels or high strength structural bolts.
Similarly, the steel beam in a composite beam can take various shapes, as per AS
2327.1. The design code states that the steel must be structural steel, located
below the concrete slab but connected, and must be symmetrical about its vertical
axis. Figure 1.1 shows alternate beam types used in composite construction.

ENG 4111/4112 Project Dissertation Matthew Kronk
0050011657
9
Figure 1.1 Steel-concrete composite beams
(Source: AS 2327.1 – 2003, p7)
AS2327.1 does not provide design rules for the design of composite beams
under combined bending and torsion. This project seeks to investigate the
behaviour of steel-concrete composite beams under the combined actions of
bending and torsion. It is expected that this research will provide a better
understanding of the behaviour of composite beams under combined flexure and
ENG 4111/4112 Project Dissertation Matthew Kronk
0050011657
10
torsion and the proposed design formulas in this research project will be suitable
for inclusion in AS2327.1 for the design of composite beams.
1.2 Background Information
Very little work on composite beams under combined flexure and torsion
has been done. Singh and Mallick (1977) conducted experiments on steel-concrete
composite beams subjected to torsion and combined flexure and torsion. In this
paper, the authors also recognise the lack of work done in this area. Mallick and
Ghosh (1979) studied the strength of steel-concrete composite beams under
combined flexure and torsion. The interaction strength of composite beams under
combined flexure and torsion was investigated by Ray and Mallick (1980). Since
then, there has been very little research work conducted on this topic. The
following sections summarise the results of the above papers.
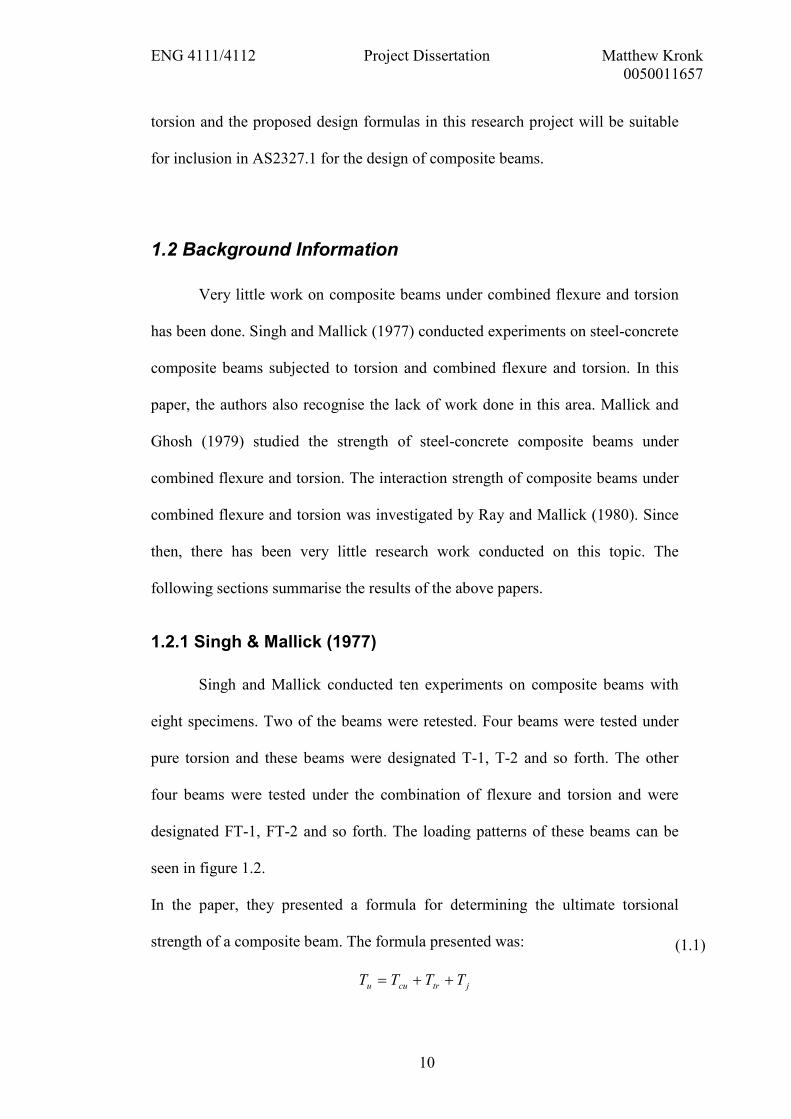
1.2.1 Singh & Mallick (1977)
Singh and Mallick conducted ten experiments on composite beams with
eight specimens. Two of the beams were retested. Four beams were tested under
pure torsion and these beams were designated T-1, T-2 and so forth. The other
four beams were tested under the combination of flexure and torsion and were
designated FT-1, FT-2 and so forth. The loading patterns of these beams can be
seen in figure 1.2.
In the paper, they presented a formula for determining the ultimate torsional
strength of a composite beam. The formula presented was:
jtrcuu TTTT ++=
(1.1)

ENG 4111/4112 Project Dissertation Matthew Kronk
0050011657
11
where Tu was the ultimate torsional strength, Tcu was the contribution by the
concrete, Ttr is the contribution of the reinforcement and Tj is the contribution
from the joist. In the paper, two methods of calculating the contribution of
concrete were presented. They came from Hsu (1968) and Colville (1972, 1973).
In the experiments, the authors found that using Hsu’s expression came to an
ultimate torsional strength that was 7% less than the test results. Hsu’s formula is
as follows:
3 53.14 cycu yfxT = in FPS units
Hsu also presented the following expression for calculating the
contribution from the reinforcement:
s
fAyxT
sys
tr 112.1= in FPS units
The results interestingly showed that some beams under both flexure and
torsion, were able to withstand a higher ultimate moment than that given by
theory. It is thought that strength was added through combined action. The
following interaction diagram of T/Tu and M/Mu was then developed in an attempt
to visually represent this relationship (see figure 1.3).
In conclusion, they said that the shear connection principles outlined by
Colville was satisfactory and that the formula presented above provides a
reasonably close estimate of the torsional capacity. They also noted an increase in
torsional capacity in the presence of flexure and vice versa.
(1.2)
(1.3)

ENG 4111/4112 Project Dissertation Matthew Kronk
0050011657
12
Figure 1.2 (dimensions neglected)
Figure 1.3 Ultimate moment-torque interaction diagram
(Source: R.K. Singh & S.K. Mallick, 1977, Indian Concrete Journal, p29)
ENG 4111/4112 Project Dissertation Matthew Kronk
0050011657
13
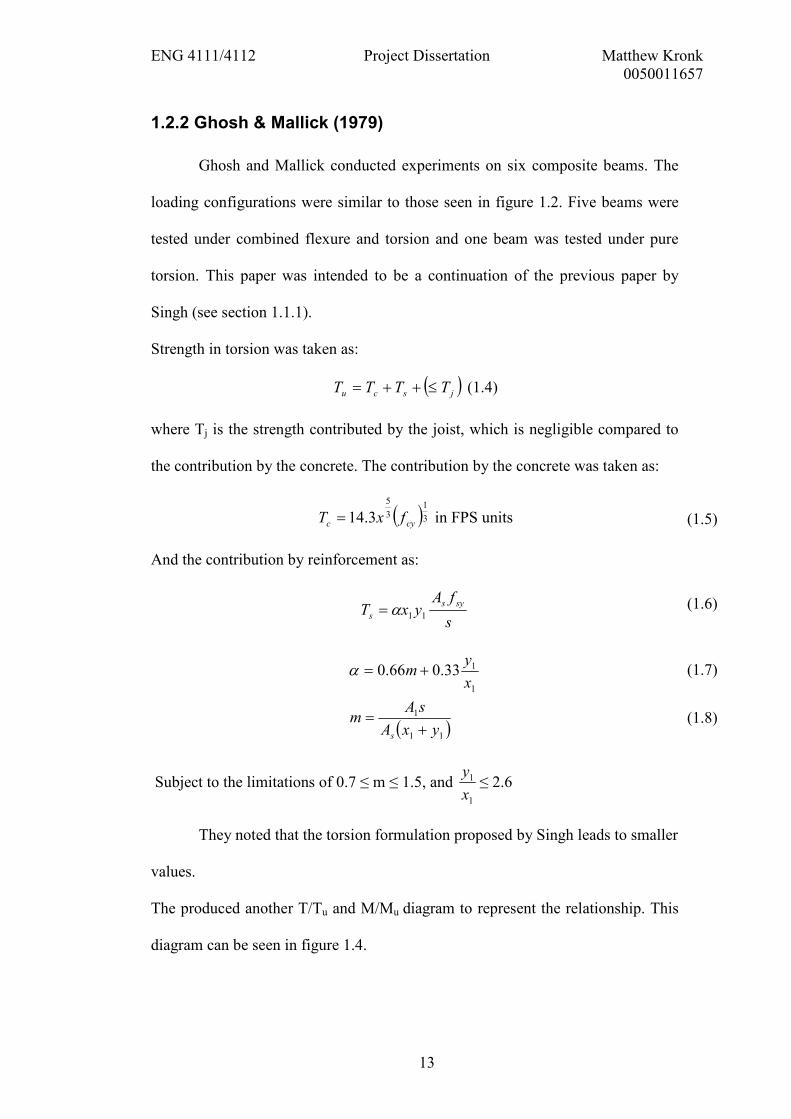
1.2.2 Ghosh & Mallick (1979)
Ghosh and Mallick conducted experiments on six composite beams. The
loading configurations were similar to those seen in figure 1.2. Five beams were
tested under combined flexure and torsion and one beam was tested under pure
torsion. This paper was intended to be a continuation of the previous paper by
Singh (see section 1.1.1).
Strength in torsion was taken as:
( )jscu TTTT ≤++= (1.4)
where Tj is the strength contributed by the joist, which is negligible compared to
the contribution by the concrete. The contribution by the concrete was taken as:
( )313
5
3.14 cyc fxT = in FPS units
And the contribution by reinforcement as:
s
fAyxT
sys
s 11α=
( )11
1
1
133.066.0
yxA
sAm
x
ym
s +=
+=α
Subject to the limitations of 0.7 ≤ m ≤ 1.5, and 1
1
x
y≤ 2.6
They noted that the torsion formulation proposed by Singh leads to smaller
values.
The produced another T/Tu and M/Mu diagram to represent the relationship. This
diagram can be seen in figure 1.4.
(1.5)
(1.6)
(1.7)
(1.8)

ENG 4111/4112 Project Dissertation Matthew Kronk
0050011657
14
The authors found it difficult to draw any conclusions on the behaviour of
composite beams under flexure and torsion. They do however consider that the
loading history of the beams may alter their general behaviour.
Figure 1.4 Ultimate strength interaction diagram
(Source: Ghosh, B. & Mallick S.K. 1979, Indian Concrete Journal, p52)
1.2.3 Basu Ray & Mallick (1980)
Basu Ray and Mallick continued on from the previous work of Singh and
Ghosh. They noted that in Singh and Ghosh’s experiments, they did not maintain
a fixed flexure torsion ratio. The objective of Basu Ray and Mallick’s tests was to
observe the effects of maintaining a fixed ratio.

ENG 4111/4112 Project Dissertation Matthew Kronk
0050011657
15
The experiment consisted of the testing of seven beams. One composite
beam was under pure torsion, one sole concrete slab was under pure torsion and
the remaining composite beams were under combined loading.
Again for the theoretical estimation of ultimate torsional load, the authors
used the formula presented by Hsu, as in the previous study.
The T/Tu and M/Mu curve formulated can be seen in figure 1.5. From the
experiments, Basu Ray and Mallick noted that torsional capacity increases with
applied moment up to a certain point. This is an induced compressive force is
applied to the top of the member in the presence of flexure. In conclusion, Basu
Ray and Mallick said that the loading history, in this case the loading of flexure
and torsion to a fixed ratio, doesn’t have an appreciable effect on the behaviour of
composite sections, under torsion and flexure.
Figure 1.5 Ultimate strength interaction diagram
(Source: Basu Ray, M. & Mallick, S.K. 1980, Indian Concrete Journal, p83)

ENG 4111/4112 Project Dissertation Matthew Kronk
0050011657
16
1.3 Aims
This project aims to investigate the ultimate load behaviour of steel-concrete
composite beams, with full shear connection, under the combined actions of
bending and torsion using the finite element analysis program ABAQUS (v6.5).
The results obtained will then be used to develop design formulas for the design
of composite beams under bending and torsion. It is envisioned that these aims be
completed by meeting the following steps:
• Conduct a literature review on the experimental behaviour of composite
beams and on the nonlinear finite element analysis of composite beams.
• Research into any experiments conducted on composite beams,
particularly on similar loading conditions to obtain data for verification.
• Study the nonlinear finite element analysis method and develop a three-
dimensional finite element model for the nonlinear analysis of composite
beams under combined bending and torsion.
• Conduct nonlinear finite element analyses on composite beams with full
shear connections under combined bending and torsion.
• Generate the ultimate moment-torque interaction diagram to display the
interaction strengths of composite beams under combined actions.
• Based on the results obtained from the finite element analyses, develop
design formulas that can be used for designing composite beams under
similar loading conditions.

ENG 4111/4112 Project Dissertation Matthew Kronk
0050011657
17
Should these steps be completed before schedule, the following step may be
added:
• Modify the finite element models for composite beams with partial shear
connections and conduct nonlinear analyses.
1.4 Layout of this Dissertation
Chapter 2 presents a literature review of experiments and new studies conducted
on composite beams. It is broken down into three sections, “Nonlinear Analysis of
Composite Beams”, “Experiments on Composite Beams” and “Composite Beams
under Combined Bending and Shear”.
Chapter 3 presents the methodology of this project, detailing the method of
analysis used and discussing the loading schemes, the model validation procedure
and the expected results.
Chapter 4 discusses various subjects relating to the finite element analysis
method. This section details the finite element model created and discusses the
material properties and models utilised in the developed model
Chapter 5 presents the results obtained from the finite element analysis. It
presents the results of the model validation test, a loading scheme inducing pure
flexure, and presents the results obtained from loading schemes inducing flexure

ENG 4111/4112 Project Dissertation Matthew Kronk
0050011657
18
and torsion. The slight modelling differences between the model validation phase
and the moment-torques phase are discussed.
Also discussed are the limitations of the developed model and there effects on the
estimated ultimate loads.
Chapter 6 summarises and concludes the current study and identifies areas of
further research.

ENG 4111/4112 Project Dissertation Matthew Kronk
0050011657
19
Chapter 2. Literature Review
2.1 Introduction
The aim of the literature review is to investigate the current level of the
state of the art of the research topic. In the case of this project, the following
review covers topics of experiments on steel-concrete composite beams, finite
element analysis of composite beams and research into combined effects.
2.2 Nonlinear Analysis of Composite Beams
Thevendran et al. (1999) investigated ultimate load behaviour of curved
composite beams. The authors created a three-dimensional finite element model,
using ABAQUS, to predict the load-deflection behaviour of curved composite
beams. They then compared the computed results with experimental results
obtained by the authors in a previous study.
The concrete slab, in the finite element model, was modelled using four-
node isoparametric thick shell elements with the coupling of bending and
membrane stiffness. The concrete in compression was modelled as an elastic-
plastic material with strain hardening. The uniaxial stress-strain curve was used
for compressive concrete, which is expressed by
−=
2
00
2'
εε
εε cc
c ff (2.1)

ENG 4111/4112 Project Dissertation Matthew Kronk
0050011657
20
where f’ is the cylinder compressive strength of concrete in MPa, ε0 is the strain
corresponding to the maximum compressive stress, taken as 0.002 and εcu is the
strain at which concrete crushes, taken as 0.0038.
The stress-strain behaviour of concrete in tension was expressed by a
bilinear curve, where stress increases linearly with strain up to the maximum
tensile stress and then falls linearly back to zero stress with increasing strain. This
constitutes a strain softening model. Steel was modelled as a strain hardening
material in both compression and tension. They also adopted a shear retention
model which assumes that the shear stiffness of open cracks reduces linearly to
zero as the crack widens.
The results obtained by Thevendran et al. (1999) show that their adopted
finite element model could be used for the prediction of ultimate strength. The
maximum deviation obtained was 14%. The model did however have trouble
predicting crack loads, with deviations lying between -29% and 23%.
Hirst and Yeo (1980) developed a method of creating 2-dimensional finite
element models to represent composite beam behaviour using standard elements.
They demonstrated that standard finite element programs could be used to analyse
the elastic range and the full load deflection of composite beams and thus, that the
proposed method could therefore be available to use by the design engineer in the
office.
Hirst and Yeo (1980) presented a method of modelling slip interaction
without the use of special slip elements. These elements are then given
appropriate properties to behave correctly.

ENG 4111/4112 Project Dissertation Matthew Kronk
0050011657
21
The models developed were then tested and compared to existing
published results. They analysed a concrete rectangular beam and a composite
steel-concrete beam in the elastic range.
A non-linear analysis was also undertaken to predict the load-deflection
curves of composite beams. The results obtained were then compared to
experimental results obtained from Yam and Chapman (1968). Comparisons
showed that the model predicts values within 5% of those obtained from the
mentioned experimental values. The model was then used with 75, 50 and 25% of
the studs needed for full interaction. Hirst and Yeo (1980) then concluded that the
method outlined can be used for the finite element analysis of composite beams.
Yam and Chapman conducted a series of numerical tests, accompanied by
experimental tests, to investigate the inelastic behaviour of composite beams. This
investigation arose out of short comings seen in The Code of Practice for
Composite Construction (CP117, Part 1, Simple Beams in Buildings) as of 1968.
The numerical analysis employed was the predictor-corrector method of
step by step numerical integration. The analysis ran under a couple of
assumptions. These assumptions included: linear distribution of strain over the
depth of the slab and the beam, that the shear connection, over the length of the
beam, acts as a continuous medium, the stress/strain curves for steel are the same
in tension and compression and that the concrete and the steel have equal
curvature at all points along the beam and that uplift forces are entirely resisted by
the shear connectors without separation. These assumptions were proved to be
adequate, as the numerical analysis developed, yielded results that satisfactorily
correlated with test results.

ENG 4111/4112 Project Dissertation Matthew Kronk
0050011657
22
The experiments produced a wide variety of results. A number of the
beams were designed with shear connection complying with Part 1 of CP 117.
This was done to test the validity of the design codes. It was found that for a point
load located mid-span, the ultimate load of a standard beam was found to be 6%
lower than the value obtained through the CP 117 procedure. Low rigidity shear
connections were also found to result in point load ultimate moments to fall 10%
short of the value obtained by CP 117.
In all relevant results, strain hardening resulted in ultimate moments 17-
33% higher than those obtained through CP 117. Strain hardening does however
increase the likelihood of shear failure.
Shear connection was also investigated and it was found that a 10%
reduction in the number of shear connectors resulted in shear failure for uniformly
distributed beams, whereas beams with point loads required a 65% reduction
before shear failure.
Yam and Chapman came to the conclusion that CP 117 provides adequate
methods for the calculation of ultimate moment, and for the distribution of shear
connection.
Razaqpur and Nofal developed a new method of representing stud shear
connectors in finite element analysis. Previous to this paper, stud connectors were
represented as rigid or elastic springs, a smeared layer, or simply it is assumed
that there is full interaction. The element proposed by Razaqpur and Nofal is a
three dimensional bar with two end nodes and three translational degrees of
freedom at either end. The elemental formulation came forth from the empirical
equation of Yam and Chapman (1968).

ENG 4111/4112 Project Dissertation Matthew Kronk
0050011657
23
The model was compared with experimental results from Yam and
Chapman (1968) with favourable outcomes. The experimental and the finite
element models closely compared, with major deviations being brought down to
normal experimental abnormalities. The finite element models were only partially
modelled, due to symmetry, and it is in this symmetry that the differences are
noted. In general, the finite element model responded in a stiffer manner, though
the ultimate load was accurately predicted.
In conclusion, Razaqpur and Nofal reported that the three dimensional bar
element was both simple and effective in finite element analysis, though they did
conclude that further experimentation should be done in more general loading
conditions, i.e. torsion and two dimensional shear.
Razaqpur and Nofal developed a finite element program to account for the
nonlinear behaviour of steel-concrete structures. This program was dubbed
NONLACS, for NONLinear Analysis of Concrete and Steel.
Concrete in the program was modelled in two parts. In compression,
concrete was modelled according to the equation proposed by Saenz (1964) and in
tension concrete was modelled following the Smith-Young model. Steel was
modelled as a strain hardening material, both in tension and compression.
The shear connectors were modelled using bar elements, utilising an
empirical equation, developed by Yam and Chapman (1968), to account for the
shear force/slip relationship. This same method of shear connection modelling
was used and described by the authors in their previous paper (1989).
The developed program was then used to compare computed results with
published experimental results of differing origin.

ENG 4111/4112 Project Dissertation Matthew Kronk
0050011657
24
The first validation test was compared with results obtained by the
developers of the empirical shear force/slip equation, Yam and Chapman (1968,
1972). The program resulted in an ultimate shear load which was within 1.20% of
the experimental result. The following test was with results obtained from
Hamada and Longworth (1976), to test the robustness and the accuracy of both the
program and the shear force/slip equation. Maximum differences in this test were
less than 3%. The final analysis was of a multi-girder bridge, which was tested to
destruction by investigators from the University of Tennessee. The results
obtained showed maximum differences of about 4%. The examples showed that
their program can be considered reliable for the analysis of inelastic response,
load distribution and ultimate strength of complex multi-girder and multi-span
bridges, though the authors recognised that the program is currently incapable of
accurate results when failure is initiated by large deformations and/or buckling.
Sebastian and McConnel (2000) developed a finite element program with
the ability to model steel-concrete composite beams with profiled steel sheeting.
The program developed was then tested against a series of experimental tests to
check the validity of the program code.
Concrete was modelled nonlinearly as an elastic isotropic material, as
proposed by Cedolin (1977), and the formulated stress-strain relationships follow
Cedolin’s proposal. Post cracked or crushed concrete was modelled as an
orthotropic material. This modelling required new constitutive equations, which
are discussed by the authors. Steel was modelled as an elasto-plastic material with
strain hardening. For verification, the program was used to analyse a reinforced
concrete slab tested by McNeice, a continuous composite beam tested by

ENG 4111/4112 Project Dissertation Matthew Kronk
0050011657
25
Teraskiewicz, a model composite bridge tested by Newmark et al and a composite
space truss bridge tested by Sebastian and McConnel. The continuous composite
beam that was analysed against that tested by Teraskiewicz, was modelled with
the shear force/slip empirical equation proposed by Yam and Chapman (1972).
The Finite Element program developed showed to be a very robust tool for
predicting the failure behaviour of steel-concrete composite structures. The
program also showed to be accurate in predicting internal deformations, shear
connector actions and crack patterns. The program’s capabilities could be
extended to account for in-depth shear and to handle nonlinear geometric effects.
Baskar, Shanmugam and Thevendran (2002) conducted a series of finite
element analyses on steel-concrete composite plate girders. Their analyses used
negative bending and the results obtained were compared to experimental results
obtained from Allison et al. (1982).
A number of finite element models were developed in an attempt to find
the most appropriate method. The changes between the models differ in the
modelling of concrete. Because composite plate girders reach failure after the
tensional failure of concrete, the Baskar, Shanmugam and Thevendran presented
several different models.
Concrete was modelled as a linear elastic plastic strain hardening material. In the
model, the uniaxial compressive stress-strain curve is assumed to be linear up to
0.3f’c and then follows the expression suggested by Carreira and Chu (1985). In
tension, concrete was modelled to be linear up to a maximum tensional stress,
followed by a linear decrease in stress with strain, a strain softening model. Steel
was modelled as a strain hardening material.

ENG 4111/4112 Project Dissertation Matthew Kronk
0050011657
26
The deck slab when modelled using 3D solid elements, used different
material models, such as: CONCRETE MODEL, CAST IRON MODEL and the
ELASTIC-PLASTIC MODEL. Of the models, the cast iron model was found to
predict the ultimate load closer to the experimental value.
The deck slab was also modelled using thick shell elements. This method
was found to be the most effective. Although all models predicted the ultimate
load to a reasonable accuracy, it is the thick shell element model that can be used
to extend the analysis to failure. The model was found to be the best for predicting
the behaviour of a composite plate girder in both the elastic and plastic regions.
2.3 Experiments on Steel-Concrete Composite Beams
Chapman and Balakrishnan (1964) conducted a series of experiments on
simply-supported steel-concrete composite beams. They investigated the effects
of shear connectors on the ultimate strength of composite beams, as well as slip.
In all, they conducted 17 live tests, with each beam having a different shear
connection or loading pattern. They came to various conclusions about stud
action, slip and the affect they have on attaining perfect composite action between
the concrete and the steel section. Their results showed that current design
methods were appropriate, in that flexural failure occurred before shear
connection failure. They also suggested that shear connectors need to be properly
anchored within the compression zone of the slab and that studs with smaller
diameters are slightly more efficient for a given cross-sectional area.
Ansourian (1981) carried out experiments on six continuous composite
beams all 9m long and having a compact steel section. The major variables were

ENG 4111/4112 Project Dissertation Matthew Kronk
0050011657
27
loading configuration, slab width and geometry of steel joist. Ansourian had
differing ductility parameter values. Ansourian was particularly interested in
investigating hogging hinges (beams 3-6) and beams 1-2 were to provide more
insight into problems of sagging rotation.
Ansourian proposed that beams with a ductility parameter χ greater than
1.4 could be designed using simple plastic theory.
Experiments showed that an increase in slab width increased capacity as
well as ductility parameter χ (beams 1 and 2) and that greater sagging rotation and
strain-hardening capacity increase with slab width.
Ansourian’s results concluded that sections design with a ductility
parameter χ greater than 1.4 can be designed according to simple plastic theory.
The expression for ductility parameter χ is given in the paper.
Yam and Chapman (1968) conducted a series of experiments on
continuous composite steel-concrete beams. Their analysis method was a
numerical method, which was presented in an earlier paper by Yam and Chapman
(1968). They had two simultaneous non-linear ordinary differential equations of
the first order.
Different loading scenarios were analysed, including point loads and uniformly
distributed loads.
They concluded that for symmetrical two-span continuous beams, with
either symmetrical point loads or a uniformly distributed load, the simple plastic
method can be used to calculate the collapse load. Their other conclusions gave
advice to spacing of shear connectors with regard to sections of maximum
ENG 4111/4112 Project Dissertation Matthew Kronk
0050011657
28
moment, and for the calculation of the position of maximum moment of uniformly
distributed loads.
2.4 Composite Beams under Combined Bending and Shear
Baskar and Shanmugam (2003) conducted some experiments and finite
element analysis on steel-concrete composite plate girders subject to the effects of
combined shear and bending.
A number of experiments were conducted with varying depth to thickness
ratios, flange dimensions, spans, moment/shear ratios and loading types. Both
positive and negative bending was investigated.
The experiments showed that through composite action, the shear capacity
of the web increased therefore increasing the capacity. This combined action
effect was more pronounced in the beams subject to positive bending. The axial
tension, induced by bending, stabilized the shear buckling behaviour of the web.
The authors came to the conclusion that composite action is more effective
for girders with slender webs, as the percentage increase in capacity is more
significant.
The finite element analysis conducted was able to predict the ultimate load
and behaviour with reasonable accuracy, they did however have trouble with
convergence post ultimate failure load.
Liang et al. (2005) conducted a series of finite element analyses to
investigate the behaviour of composite beams combined bending and shear. The
model developed was then validated by existing experimental results presented by
Chapman and Balakrishnan (1964).

ENG 4111/4112 Project Dissertation Matthew Kronk
0050011657
29
Doubly curved thick/thin shell elements were used to model the concrete
slab, the web and the steel flanges. The shear connectors were modelled using 3D
beam elements.
Concrete was modelled using the stress-strain relationship defined by
Carreira and Chu (1985). In compression, concrete was assumed to behave
linearly in the elastic region up to 0.4f’c. In tension, it was assumed that tensile
stress increases linearly with increases in tensional strain up to cracking, where it
linearly decreases as the crack opens. The shear retention model was used was
that suggested by Thevendran et al. (1999) and Liang et al. (2004). Steel was
modelled as a strain hardening material with an assumption of 0.25 for the
ultimate strain. This material property was applied to all steel members.
The model was validated by comparing results of a beam tested by
Chapman and Balakrishnan (1964). The model predicted an ultimate load of
95.3% of the experimental load, which suggests that it is conservative.
Liang et al. found that with an increase in the moment/shear ratio, the
ultimate load decreases. They also found that the concrete slab increases the
maximum shear strength of the beam by 85%, through composite action, which is
significant considering that design codes consider that the steel web resists the
entire vertical shear.
The authors then present a design model for strength interaction, which
mimics the numerical results well. They concluded that their model is a consistent
and economical design procedure for the design of simply supported composite
beams.

ENG 4111/4112 Project Dissertation Matthew Kronk
0050011657
30
Liang et al. (2004) developed a 3D finite element model for predicting the
behaviour of continuous steel-concrete composite beams under combined bending
and shear.
Concrete was modelled as a four node doubly curved shell element with
reduced integration. It was assumed to behave linearly up to 0.4f’c and then
follow the expression presented by Carreira and Chu (1985). Concrete in tension
was assumed to be a strain softening material. It was assumed that concrete tensile
stress linearly reaches its maximum value and cracks, after which, the tensile
stress linearly decreases to zero as the crack widens.
Steel was modelled as a four node doubly curved shell element. It was
given a trilinear stress-strain curve, representing the nonlinear behaviour of strain
hardening. Reinforcing bars were modelled as Rebar layers within the concrete
slab.
The finite element model was tested for validation against an experiment
conducted by Ansourian. The validation test yielded an ultimate load which was
97.2% of the experimental value, which lead to the conclusion that the model
developed was both conservative and reliable.
The model was then used to test composite beams with various
moment/shear ratios and shear connection values. The tests indicated that the
concrete contributes a significant amount of shear strength to the ultimate shear
strength of the composite beam and that shear strength generally increases with an
increase in shear connection. With the obtained results, a series of design formulas
were developed which defines the relationship between ultimate strength and
shear strength, with proposals that take shear connection, stud pullout failure and

ENG 4111/4112 Project Dissertation Matthew Kronk
0050011657
31
shear capacity of the steel web into account. The models were verified against
existing experimental data obtained from Ansourian (1981) and were found to be
accurate and economical and were therefore found to be suitable for inclusion in
design codes.
2.5 Conclusions
The area of steel-concrete composite beams has had quite a good amount
of work conducted on it over the years. Various studies have gone into
investigating the effects of combined forces, shear connection, shear connectors,
geometric effects, finite element analysis and modelling. In particular, various
attempts have been made at modelling concrete, a very non-homogenous,
nonlinear material in a finite element package. A mixture of empirical and
theoretical equations has been developed for the analysis of composite beams.
The literature review, in particular, highlighted the need for further studies
on the effects of combined torsion and flexure on composite beams, due to the
small amount of information available.

ENG 4111/4112 Project Dissertation Matthew Kronk
0050011657
32
Chapter 3. Methodology
3.1 Introduction
This project will investigate the following important aspects of composite
steel-concrete beams under combined bending and torsion:
• Information gathering;
• Finite element analysis of composite beams under combined bending and
torsion;
• Develop moment-torque interaction curves for composite beams;
• Finite element model validation; and
• Formula development.
These parts are presented and explained separately below in order of sequence.
3.2 Information Gathering
This section involved research to gather information relevant to this
project. This included the material gathered and collated in the literature review
above. The project however, as mentioned above, calls for validation and
comparison of results with existing results. This meant that there was need to find
existing, published information on composite beams under the combined effects
of bending and torsion.

ENG 4111/4112 Project Dissertation Matthew Kronk
0050011657
33
These results were found in three journal articles in particular, from the
Indian Concrete Journal. A brief overview of the contents of these articles is
provided in the section above, Background Information.
3.3 Finite Element Analysis
The finite element analysis method will be used to investigate the ultimate
strength and behaviour of steel-concrete composite beams under combined
bending and torsion. A three-dimensional finite element model will be developed
to simulate the geometric and material nonlinear behaviour of composite beams
under combined actions of bending and torsion. Shell elements will be employed
to model the steel beam and concrete slabs. Stud shear connectors will be
simulated using beam elements. Rebar Option in ABAQUS will be used in the
finite element model to include the reinforcement in concrete slabs. The finite
element model developed will be employed to analyse composite beams under
combined bending and torsion. The model needs to be modelled to conform to
pre-existing experimental data, for accurate comparison. Beyond the modelling
stage there is a pre-validation stage and a post-validation stage (see section on
validation). Pre-validation involves a finite element analysis of the model under a
more simplistic loading case, e.g. simple bending. Beyond this initial analysis is
post-validation where the model is put under the combined loads relevant to this
project.
Bending moment and torque will be applied by eccentrically loading the
point load applied to the developed composite beam model. This loading scheme
will apply a moment and torque that is proportional to each other. Figure 3.1

ENG 4111/4112 Project Dissertation Matthew Kronk
0050011657
34
displays, in cross-section, how an eccentric load applies torque acting around the
length of the beam.
Figure 3.1 Eccentric load, Cross-section
Figure 3.1 displays the load, “P” and the eccentricity from the centre, “l”.
The result is a moment or torque acting down the depth of the beam. That torque
is calculated by:
lPT uu ×= (3.1)
where, “Tu” is the ultimate torque, “Pu” is the ultimate applied load and “l” is the
eccentric length.
The Ultimate moment is calculated in a similar fashion. Figure 3.2 depicts
the loading case looking from the side.

ENG 4111/4112 Project Dissertation Matthew Kronk
0050011657
35
Figure 3.2 Eccentric load, Side view
The ultimate moment is given by:
4
lPM u
u
×= (3.2)
where, “Mu” is the ultimate moment, “Pu” is the ultimate point load and “l” is the
overall length of the beam.
3.4 Model Validation
Existing experimental data will be used to validate the finite element
models developed for composite beams under combined bending and torsion. The
results obtained from the nonlinear finite element analysis will be compared with
experiments on composite beams under bending and then under combined actions
of bending and torsion. Validation is important to establish the reliability of the
models performance, and ultimately, the results of the project itself.

ENG 4111/4112 Project Dissertation Matthew Kronk
0050011657
36
3.5 Moment-Torque Interaction Curves
The finite element analyses on composite beams under various
combinations of bending and torsion will be carried out in order to generate the
ultimate moment-torque interaction diagrams. Curve analysis is done after post-
validation finite element analyses. With the gathered data, obtained from the
computer results, a series of curves can be drawn. The most important of these
curves is the torque/moment interaction diagram. Examples of experimentally
based torque/moment diagrams can be seen in Background Information. A curve
will then be fitted to the diagram, in an effort to define the relationship between
ultimate torque capacity and ultimate moment capacity.
3.6 Formula Development
This section leads on from the curve analysis. With the fitted curve,
formulas pertaining to that curve are derived to form an expression which relates
the moment capacity and torque capacity of steel-concrete composite beams. A
lower bound torque/moment interaction expression has been suggested. It can be
found in Singh and Mallick (1977). It is expressed as follows:
1
22
=
+
u
F
u
F
T
T
M
M (3.3)
where: MF is the failure moment, Mu is the theoretical ultimate moment, TF is the
failure torsion and Tu is the theoretical ultimate torsion.

ENG 4111/4112 Project Dissertation Matthew Kronk
0050011657
37
The above interaction equation is too conservative. A design formula for
predicting the ultimate strengths of composite beams under combined bending and
torsion will be proposed in this research based on the results obtained from the
nonlinear finite element analysis of composite beams. Analytical methods as
presented by Liang et al. (2004, 2005) will be employed to develop the design
formula.
3.7 Conclusions
This project involves both computational analysis and data analysis. The
results’ accuracy obtained from the methods outlined above, relies heavily on the
accuracy and reliability of the results obtained from the computational analysis.
Therefore, caution must be used in determining the reliability of any obtained
results.

ENG 4111/4112 Project Dissertation Matthew Kronk
0050011657
38
Chapter 4. Finite Element Analysis
4.1 Introduction
The Finite element method was used for the analysis of steel-concrete
composite beams. Various load combinations had to be employed both for results
and for model validation. The following sections detail the finite element model
itself, as well as document the material properties employed in the hopes of
achieving an accurate, reliable finite element model.
4.2 The Finite Element Model
The 3D finite element model developed accounts for material and
geometric non-linear behaviour to study the effects of flexure and torsion on steel-
concrete composite beams. Figure 4.1 displays the model mesh. The rectangular
section on the top of the model represents the concrete slab, it was modelled with
shell elements and measures 13 x 61 elements. The steel joist was also modelled
using shell elements and measures 60 elements in length, with widths of 3
elements for the web and 2 elements for the flanges. The shear connectors were
modelled using both beam and truss elements. The finite element package utilised
was ABAQUS version 6.5.
The model composition can be seen in Figure 4.2, which displays the
dimensions and overall layout of the composite beam.

ENG 4111/4112 Project Dissertation Matthew Kronk
0050011657
39
Figure 4.1 Model Mesh
Figure 4.2 Cross Section of Composite Beam

ENG 4111/4112 Project Dissertation Matthew Kronk
0050011657
40
4.2.1 Concrete Slab
The concrete slab was modelled using the element type S4R, which is a
four node, doubly curved shell element with reduced integration. Five integration
points were taken through the depth of the slab. The slab was given concrete
properties that made account for the reinforcement. The reinforcement is included
via rebar layers. For further information regarding concrete material modelling,
refer to section, 4.4 Stress-Strain Curves for Concrete.
The concrete slab was given a mesh density that resulted in the slab having
elemental lengths of 61 elements (long) by 13 elements wide.
4.2.2 Steel Beam
The steel beam was modelled using four node, doubly curved shell
elements with reduced integration, as with the concrete slab. Both the flanges and
the web were analysed with five integration points throughout their respective
thicknesses.
The steel beam was given a mesh density which resulted in the flange having
2X60 elements and the web with 3X60 elements.
4.2.3 Shear Connectors
Shear connectors were modelled using two elemental types. The first type
of element used was B31, which is a two node linear beam. With this element
type, a pair of studs was modelled and then given multiple instances within the
model assembly. This elemental type is used for providing the shear and stiffness

ENG 4111/4112 Project Dissertation Matthew Kronk
0050011657
41
of the actual shear connectors. The second element used was T3D2, which is a
two node linear 3D truss. This element type was also used by creating a pair of
studs, which was given multiple instances within the model assembly. The truss
and beam elements are arranged to occupy the same space. The pin jointed truss
elements are used to transfer direct stress from the concrete slab to the steel beam.
In all cases, the shear connectors were assumed to connect from the upper steel
flange to the inner centroid of the concrete slab. This method of shear connector
modelling was proposed and used successfully by Liang et al. (2004, 2005).
4.2.4 Solution Method
The solution method adopted was the modified Riks method. The
additional control, “analysis=discontinuous”, was used to help prevent the
discontinuities present due to concrete cracking. The beam was monitored
additionally for deflection at mid-span and the load application was applied
automatically.
4.3 Stress-Strain Curves for Steels
The composite beam is constructed from several parts which combine to
make the composite structure. Three of those parts are made of steel with varying
material properties between them. These differing properties have to be specified

ENG 4111/4112 Project Dissertation Matthew Kronk
0050011657
42
within ABAQUS to ensure that individual parts exhibit behaviour that is
consistent with the material they are trying to mimic.
Material properties need to be specified for the steel beam itself, the
concrete reinforcement or “reo”, and the shear connectors or “studs”. This means
that property values need to be generated in order for the program to mimic the
behaviour of the materials. With steel, modelling is fairly straightforward because
it is homogonous and because there is little variation in strength, from member to
member.
4.3.1 Steel Beam
The steel beam was modelled within ABAQUS as an isotropic material
that exhibits both the elastic and plastic behaviour of steel as well as the non-
linear effect of strain hardening. A typical Stress-Strain curve for steel displaying
properties of strain hardening can be seen in figure 4.3.
The steel in this case, was modelled with a Young’s modulus of 205350
MPa and a Poisson’s ratio of 0.3. The yield strength was designated as 265 kN
and the ultimate strength was set at 410 kN.

ENG 4111/4112 Project Dissertation Matthew Kronk
0050011657
43
Figure 4.3 Stress-Strain Curve Steel
4.3.2 Reinforcing Bars
The reinforcing bars were modelled using the “rebar layer” option. Using
this option, the reinforcing bars are not individually input by the user but are
generated. When the reinforcing is generated, ABAQUS asks for material
properties to apply to the rebar layer (For reinforcing layout details, see the
previous section, 4.2 The Finite Element Model.).
The reinforcing was modelled as an isotropic material with elastic and
plastic behaviour. The yield stress of the steel was 250 MPa, in Australia this is
designated as “R-type” reinforcing. The Young’s modulus was designated as
200,000 MPa with a Poisson’s ratio of 0.3. The Stress-Strain curve for the
reinforcing follows the same pattern as displayed in figure 4.3 above.
Strain εs εsu
fsu
fsy
εsy εst 0
Stress σ
s

ENG 4111/4112 Project Dissertation Matthew Kronk
0050011657
44
4.3.3 Shear Connectors
The shear connectors were modelled using the same tri-linear stress-strain
relationship as presented in figure 4.3 above. They were given a yield strength of
410 kN and an ultimate strength of 580 kN.
4.4 Stress-Strain Curves for Concrete
Concrete is a lot more difficult to model in a finite element package.
Numerous people have come up with different methods and formulae in an
attempt to make a thorough algorithm to mimic the behaviour of concrete, both in
compression and tension. Unlike steel, concrete does not have a homogonous
makeup. Concrete itself is a composite structure. It is consists an aggregate
material that is interlocked together and bound with cement. Aggregate interlock
is complex and inconsistent, adding complexity to the theoretical modelling of
concrete. Adding to the complexity is the difference that concrete curing or
vibration makes to the strength of the concrete. Therefore, an adequate concrete
model needs to be utilised to ensure that the required reliability is obtained.
4.4.1 Concrete in Compression
Concrete was modelled under the “Concrete smeared cracking” option,
when creating a new material. As with the steels, a stress strain curve needs to be
generated to define the compressive behaviour of concrete. The following figure,
figure 4.4 displays the compressive strength of the concrete used in this model.

ENG 4111/4112 Project Dissertation Matthew Kronk
0050011657
45
The above representation was calculated using the uniaxial compression
relationship proposed by Carreira and Chu (1985), and used with success by
Liang et al (2005). This relationship is expressed by:
(4.1)
where: σc is the compressive stress, f’c is the cylinder compressive strength of
concrete, εc is the strain in concrete, ε’c is the strain in the concrete corresponding
to the value f’c and γ is represents:
Strain εc
Stress σ
c (MPa)
Figure 4.4 Stress-Strain Curve for Concrete
( )( )γεεγ
εεγσ
cc
cccc
f
'1
''
+−=

ENG 4111/4112 Project Dissertation Matthew Kronk
0050011657
46
(4.2)
In this case, the value of ε’c was taken as 0.002. The behaviour up to 0.4f’c
was assumed to be linear elastic. Within ABAQUS, the failure ratio option was
utilised. This allows the input of failure ratios for ultimate biaxial stress to
ultimate uniaxial stress, as well as uniaxial tensile stress to the uniaxial
compressive stress at failure. These values were taken as 1.16 and 0.0836
respectively. Within the elastic region, the Young’s modulus was taken as 35,709
MPa and the Poisson’s ratio was taken to be 0.15.
4.4.2 Concrete in Tension
Concrete in tension was modelled by using the tension stiffening model.
This model assumes that as a crack opens, the direct stress linearly decreases to
zero. A representation of the model used can be seen in figure 4.5.
55.14.32
'3
+= cfγ
ENG 4111/4112 Project Dissertation Matthew Kronk
0050011657
47
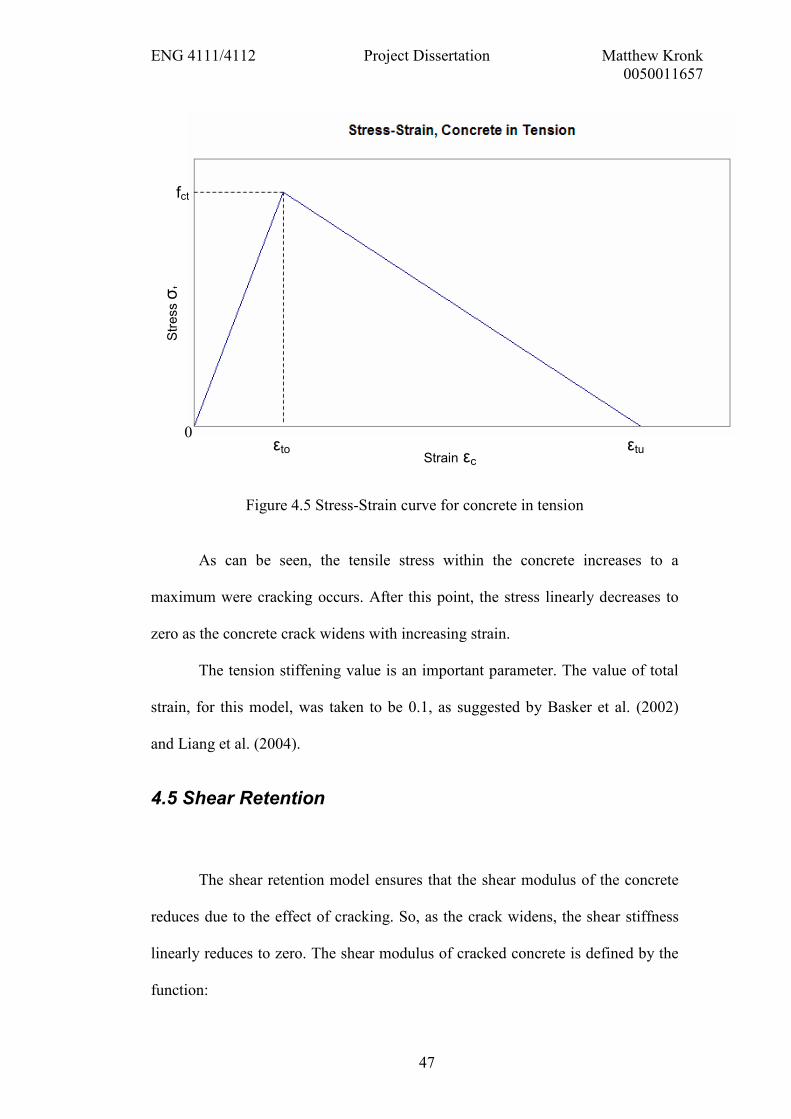
Figure 4.5 Stress-Strain curve for concrete in tension
As can be seen, the tensile stress within the concrete increases to a
maximum were cracking occurs. After this point, the stress linearly decreases to
zero as the concrete crack widens with increasing strain.
The tension stiffening value is an important parameter. The value of total
strain, for this model, was taken to be 0.1, as suggested by Basker et al. (2002)
and Liang et al. (2004).
4.5 Shear Retention
The shear retention model ensures that the shear modulus of the concrete
reduces due to the effect of cracking. So, as the crack widens, the shear stiffness
linearly reduces to zero. The shear modulus of cracked concrete is defined by the
function:
Strain εc εto εtu
fct
Stress σ
t
0

ENG 4111/4112 Project Dissertation Matthew Kronk
0050011657
48
(4.3)
where, Gc is the elastic shear modulus of uncracked concrete and φ is a reduction
factor. The reduction factor is defined further by:
(4.4)
The parameters of εmax and φ were taken as 0.005 and 0.95, respectively, as
suggested by Thevendran (1999) and Liang et al. (2004, 2005).
4.6 Conclusions
The composite beam model developed, using the material properties and
theories outlined above, should adequately model the behaviour of steel-concrete
composite beams. The material properties and theories, as mentioned above, have
been used with success by numerous academics in their subsequent experiments,
and as such, they should be adequate for use in the present study. Table 4.1 below,
summarises the material properties adopted in the current study.
Table 4.1 Material Property Summary
Material Property Value
Structural Steel Yield Stress, fsy (MPa) 265
Ultimate Strength, fsu (MPa) 410
cGG ϕ=
( ) −
=0
/1 maxεεϕ c For ε < εmax
For ε ≥ εmax

ENG 4111/4112 Project Dissertation Matthew Kronk
0050011657
49
Young’s Modulus, Es (MPa) 205,350
Poisson’s ratio, v 0.3
Ultimate Strain, εsu 0.2
Reinforcing Bars Yield Stress, fsy (MPa) 250
Ultimate Strength, fsu (MPa) 350
Young’s Modulus, Es (MPa) 200,000
Poisson’s ratio, v 0.3
Ultimate Strain, εsu 0.2
Shear Connectors Spacing (mm) 110
Number of rows 2
Yield Stress, fsy (MPa) 410
Ultimate Strength, fsu (MPa) 580
Young’s Modulus, Es (MPa) 200,000
Poisson’s ratio, v 0.3
Ultimate Strain, εsu 0.2
Concrete Compressive strength, f’c (MPa) 42.5
Tensile Strength, fct (MPa) 3.553
Young’s Modulus, Ec (MPa) 35,709
Poisson’s ratio, v 0.15
Ultimate compressive strain, εcu 0.0045

ENG 4111/4112 Project Dissertation Matthew Kronk
0050011657
50
Chapter 5. Results & Discussion
5.1 Introduction
All results were obtained using the finite element analysis method through
the use of the program, ABAQUS. The model generated was used to create input
files that are used by ABAQUS for analysis. The input files, once generated, were
further edited to apply additional controls, as previously mentioned. The results
obtained were then transported to a spreadsheet for further minor computations
and for result presentation.
5.2 Model Validation
The model validation step is an important procedure. It ensures that the
model generated can be relied upon when further analysis is conducted.
The model validation was done by the comparison of existing
load/deflection data by Chapman and Balakrishnan (1964). The model was
intentionally modelled to the geometry of the beam tested by Chapman and
Balakrishnan. The shear connectors’ cross-sectional area was altered to make
them behave in accordance with the shear connectors used in the experiment.
The model was loaded as a simply supported steel-concrete composite
beam with a single point load at mid-span. The point load in the model was
modelled as an equivalent pressure over an area of 120 mm x 120 mm. Deflection
was monitored at the bottom of the joist at mid-span and the load applied was
automatically stepped up until the point of failure.
ENG 4111/4112 Project Dissertation Matthew Kronk
0050011657
51
Table 5.1 summarises the load/deflection data obtained from the model.
Table 5.1 Load/deflection data
Deflection
Load
factor Load
0.994 0.049993 25.91637
1.99 0.099969 51.82393
3.48 0.1749 90.66816
5.47 0.2745 142.3008
7.46 0.3738 193.7779
9.46 0.4728 245.0995
11.5 0.5711 296.0582
13.5 0.6604 342.3514
15.6 0.7116 368.8934
17.8 0.7467 387.0893
19.9 0.7732 400.8269
22.1 0.797 413.1648
24.2 0.8174 423.7402
26.4 0.8344 432.553
28.5 0.8507 441.0029
29.1 0.854 442.7136
29.6 0.8578 444.6835
30.1 0.8615 446.6016
30.9 0.8669 449.401
32.1 0.8748 453.4963
34 0.8865 459.5616
34.6 0.8904 461.5834
34.9 0.8926 462.7238
35.5 0.8959 464.4346

ENG 4111/4112 Project Dissertation Matthew Kronk
0050011657
52
36.3 0.9005 466.8192
37.5 0.9065 469.9296
39.3 0.914 473.8176
40.3 0.9172 475.4765
40.9 0.9176 475.6838
41.8 0.9164 475.0618
43.1 0.9116 472.5734
43.8 0.9081 470.759
44.9 0.9024 467.8042
45.5 0.8996 466.3526
46.4 0.8963 464.6419
47.8 0.8929 462.8794
48.6 0.8917 462.2573
49.7 0.8903 461.5315
51.4 0.8895 461.1168
54 0.8887 460.7021
57.9 0.888 460.3392
60.1 0.8878 460.2355
63.4 0.8875 460.08
65.2 0.8873 459.9763
68 0.8872 459.9245
72.2 0.8872 459.9245
74.5 0.8872 459.9245
78.1 0.8871 459.8726
80.1 0.8871 459.8726

ENG 4111/4112 Project Dissertation Matthew Kronk
0050011657
53
Figure 5.1 graphically compares the results above with those obtained by
Chapman and Balakrishnan. Figure 5.2 shows the graphical results obtained from
ABAQUS.
0
100
200
300
400
500
600
0 10 20 30 40 50 60 70 80 90
Deflection mm
Load kN
Experiment
Finite Element Analysis
Figure 5.1 Comparison of Load/Deflection Results
Figure 5.2 Steel-Concrete Composite Beam Under Pure Flexure

ENG 4111/4112 Project Dissertation Matthew Kronk
0050011657
54
The beam tested by Chapman and Balakrishnan obtained an ultimate load
of 517.1316 kN and the ultimate load obtained from the finite element model was
475.6838 kN. Comparing those values:
( ) %015.81001316.517
6838.4751% =×
−=Difference (5.1)
Therefore, the finite element model estimated an ultimate load that is
8.015 % lower than that achieved by Chapman and Balakrishnan. Therefore it can
be concluded that the model created is reliable and conservative in predicting the
ultimate load.
5.3 Moment-Torque Interaction
A further 15 different loading schemes were tested to explore the
behaviour of steel-concrete composite beams under both flexure and torsion. Each
load case had the simulated point load’s eccentricity increased up to the maximum
eccentricity, as defined by the slab geometry. The eccentricity stated in each
model, refers to the eccentric length “l” as described in figure 3.1.

ENG 4111/4112 Project Dissertation Matthew Kronk
0050011657
55
5.3.1 Boundary Conditions
For analysing both flexure and torsion, a different boundary condition
scheme is required than that used in the case of simple flexure. As mentioned in
the literature, the contribution to total torsional strength added by the steel joist is
negligible when compared to the torsional strength supplied by the concrete slab.
As a result of this, any torsional forces induced in the beam needs to be
transferred to boundary conditions not directly associated with the steel joist,
otherwise all torsional forces generated needs to reach the boundary conditions
through the steel joist, neglecting the torsional strength the concrete supplies.
Figure 5.3 graphically represents the boundary conditions used in the simple
flexure case.
Figure 5.3 Simply Supported Composite Beam
If the above support conditions were employed, the concrete slab would
offer no resistance to torsion. Any torsion imposed on the beam above would be
solely resisted by the steel joist. As the torsion increases, the concrete slab would

ENG 4111/4112 Project Dissertation Matthew Kronk
0050011657
56
just rotate with the upper flange, as the lower flange-web connection operates as a
pivot point. Figure 5.4 graphically represents the boundary conditions adopted in
the current study.
Figure 5.4 Adopted Boundary Conditions for the Composite Beam
The adopted support conditions, displayed above, allow the concrete slab
to resist torsional forces. Subsequently, the above support conditions also
increases the beams capacity to resist pure flexure, therefore any results obtained
in the model validation phase, are not able to be included within the analysis of
flexure and torsion.
5.3.2 Load-Deflection Curves
Load-deflection curves were generated for each load scheme. ABAQUS
monitored and recorded the load scale factors and the deflections at mid-span. The
subsequent results were then graphed. Figures 5.5 to 5.9, display the load-
deflection results for the fifteen loading schemes.
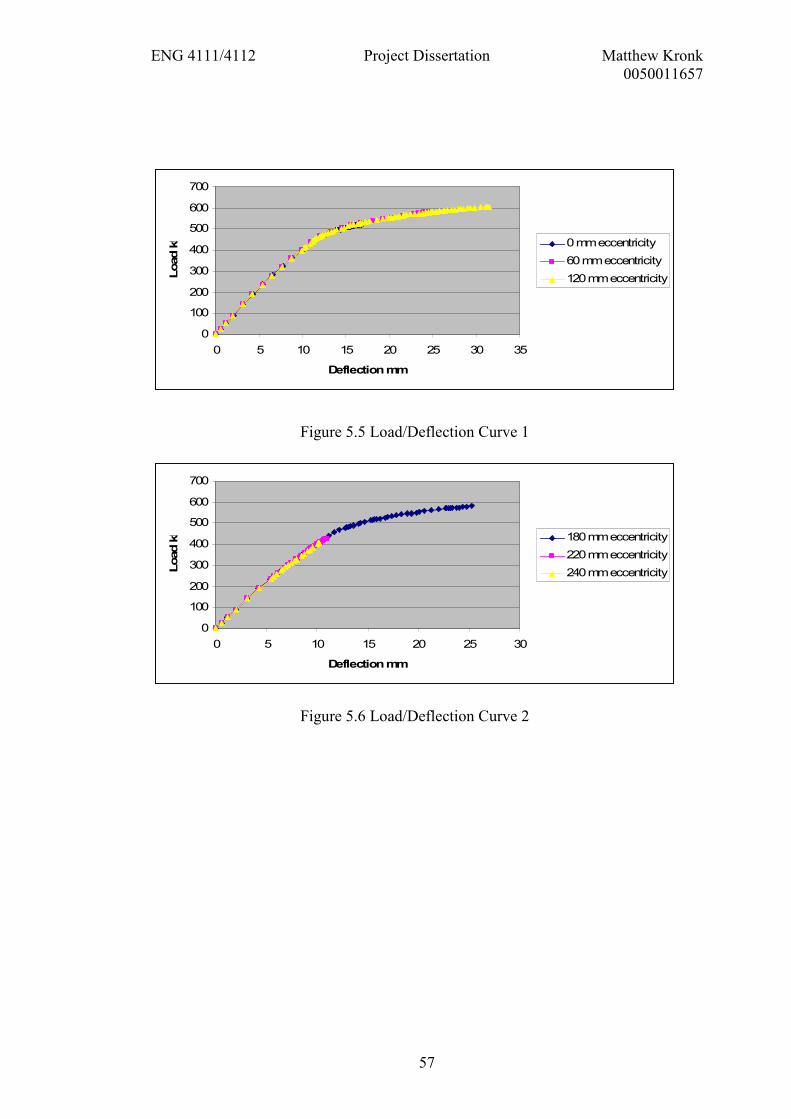
ENG 4111/4112 Project Dissertation Matthew Kronk
0050011657
57
0
100
200
300
400
500
600
700
0 5 10 15 20 25 30 35
Deflection mm
Load kN 0 mm eccentricity
60 mm eccentricity
120 mm eccentricity
Figure 5.5 Load/Deflection Curve 1
0
100
200
300
400
500
600
700
0 5 10 15 20 25 30
Deflection mm
Load kN 180 mm eccentricity
220 mm eccentricity
240 mm eccentricity
Figure 5.6 Load/Deflection Curve 2

ENG 4111/4112 Project Dissertation Matthew Kronk
0050011657
58
0
100
200
300
400
500
600
0 5 10 15
Deflection mm
Load kN 260 mm eccentricity
300 mm eccentricity
360 mm eccentricity
Figure 5.7 Load/Deflection Curve 3
0
100
200
300
400
500
600
0 5 10 15 20
Deflection mm
Load kN 400 mm eccentricity
420 mm eccentricity
430 mm eccentricity
Figure 5.8 Load Deflection Curve 4
0
50
100
150
200
250
300
350
400
450
500
0 2 4 6 8 10 12 14
Deflection mm
Load kN 440 mm eccentricity
480 mm eccentricity
540 mm eccentricity
Figure 5.9 Load/Deflection Curve 5

ENG 4111/4112 Project Dissertation Matthew Kronk
0050011657
59
From the above curves, it can be noted that as the eccentricity increases,
the deflection increases at a greater rate. This is because as the eccentricity
increases, the imposed torque greatly increases and because the loading scheme
becomes further removed from the optimum loading arrangement. It can also be
seen that the load schemes have a non-consistent termination point, the point
where the analysis ended. This anomaly will be discussed later. Appendix 1
contains the Load/Deflection tables for the loading schemes plotted in figures 5.5
to 5.9 above.
5.3.3 Moment-Torque Curves
From the Load/Deflection data, contained in Appendix 1, values of
moment and torque were calculated using formulas 3.1 and 3.2. The results for
each load case was then plotted to define a relationship between moment and
torque. Initially, ten load cases were analysed, each time with the eccentricity
increasing by 60 mm. Figure 5.6 describes the initial moment/torque diagram
obtained from the first ten results.

ENG 4111/4112 Project Dissertation Matthew Kronk
0050011657
60
0
50
100
150
200
250
0 200 400 600 800 1000
Moment kNm
Torque kNm
Figure 5.10 Initial Moment/Torque Diagram
Starting from the point of zero torque, the conceding points represent the
ultimate moment and torque achieved with increasing eccentricity. Again, these
points represent an eccentricity that is increasing by 60 mm.
This initial diagram, in figure 5.10, looked as though to be making a nice
curve, neglecting the point marked yellow as a triangle (eccentricity of 240 mm),
and the point marked red as a circle (eccentricity of 420 mm). It was thought that
those two points, being so far removed from the general pattern, may be incorrect
and it was decided to check the two input files that generated that data and run
further analysis at eccentricities similar to those points. This led to the analyses of
load cases with eccentricities of 220, 260, 400, 430 and 440 mm eccentricities. At
the conclusion of these analyses, their data was also plotted, creating the curve as
seen in figure 5.11.

ENG 4111/4112 Project Dissertation Matthew Kronk
0050011657
61
Moment/Torque
0
50
100
150
200
250
0.000 100.000 200.000 300.000 400.000 500.000 600.000 700.000 800.000 900.000
Moment kNm
Torque kNm
Figure 5.11 Moment/Torque Diagram
The new points, plotted in green as squares, work to confirm those initial
outlying results. The input files that generated the red circle and the yellow square
were also re-tested with new input files, both of which confirmed the results
obtained in the initial analysis. From this figure it can be gathered that the model
itself is not reliable in testing beams under both bending and torsion.
5.3.4 Model Behaviour
From the ultimate load behaviour, displayed in figure 5.11 above, it can be
concluded that the predictions of ultimate load made by the model are inaccurate.
The model does however behave in a way that would suggest that it is acting true.
The problem seems to lie in the estimation of ultimate behaviour. Figure 5.12

ENG 4111/4112 Project Dissertation Matthew Kronk
0050011657
62
below, shows the composite beam under an eccentric load at a distance of 120
mm.
Figure 5.12 Steel-Concrete Composite Beam under 120 mm eccentric load
The arrow indicates the approximate location of the force. It can be seen
that an area of high tensional stress exists at the bottom of the joist at mid-span
and at the boundary condition location where movement is restricted in every
dimension. Figure 5.13 represents the same beam but with the eccentricity
increased to 360 mm.
Figure 5.13 Steel-Concrete Composite Beam under 360 mm eccentric load

ENG 4111/4112 Project Dissertation Matthew Kronk
0050011657
63
The arrow displays the approximate location of the eccentric load. From
this image, it can be noted that the tensional stress pattern is similar to that
represented in figure 5.12, but with lower values of stress. This figure also
represents an area of tensional stress developing in the top layer of the concrete
slab, perpendicular to the joist location. Figure 5.14 represents the beam under an
eccentric load of 400 mm. It has a better representation of the tensional stress area
in the concrete slab.
Figure 5.14 Steel-Concrete Composite Beam under 400 mm eccentric load
As can be seen from this figure, a “c” shaped area of tensional stress is
developing in the concrete slab. This is because, as the load eccentricity is
increased, the concrete slab increasingly acts as a cantilever to resist the load. The
development of tensional stress within this region speaks of that. Figure 5.15
describes the cantilever geometry.

ENG 4111/4112 Project Dissertation Matthew Kronk
0050011657
64
Figure 5.15 Cantilever Arrangement
The circle in red typically describes the area of crack formation in a
cantilever orientation. This area is what is being represented as a tensional zone in
the concrete slab in figure 5.14. Since the concrete slab and its reinforcement is
not designed for a cantilever orientation, the slab has a low ability to resist tension
within this area, therefore, greater eccentricities experience failure in this region
earlier due to the cantilever effect increasing, i.e. the moment around that axis
increasing. So from this behaviour, it can be assumed that the beam is behaving in
an appropriate manner and that the problem exists in the estimation of ultimate
load.

ENG 4111/4112 Project Dissertation Matthew Kronk
0050011657
65
5.4 Model Inadequacies
The model generated makes use of several material property models,
interaction models and geometric configurations in an effort to make a robust,
reliable model. Some of these models are simplifications or estimates to the
effects seen in practice. These simplifications may have an active part in the
ultimate behaviour of the model, as displayed earlier.
5.4.1 Rebar Layers
As mentioned earlier, the steel reinforcing within the concrete slab was
modelled using the rebar layers option. This in effect, creates a smeared layer of
equivalent area to the reinforcing provided, with the material properties to match.
In a simple pure bending arrangement, this is an effective and simple method for
modelling reinforcing bars because the moment applied is acting primarily in one
direction. In the load case used within this study, bending moment is being
applied in around two different axes so in this scenario, a steel reinforcing bar is
going to act quite differently to an equivalent area rectangular prism of reinforcing
spread across the concrete cross-section at the appropriate depth. So, in a scenario
involving axial torsion, the location “x” is just as important as the depth location
“y” in a concrete cross-section. In the cantilever arrangement, as described in
figure 5.15, longitudinal reinforcement will do little to resist the axial moment
created, whereas a rectangular prism of reinforcement will provide much more
resistance to that axial moment.

ENG 4111/4112 Project Dissertation Matthew Kronk
0050011657
66
5.4.2 Material Properties and Modelling Techniques
Additional errors could arise out of the material property models and the
modelling techniques used. For example, the concrete model may be inadequate
for use within this application of bending and torsion or perhaps it is the concrete
tension model that is inadequate for use in this application. The model generated
may estimate inaccurate ultimate loads as a result of this problem or a
combination of them.
5.5 Conclusions
As a result of the uncharacteristic moment-torque curve generated, no
design formulas have been prepared to mimic the behaviour of that curve. It can
be concluded that though the model is adequate for use in pure flexure load cases,
its reliability in moment-torque load cases is not adequate for use. It has been
identified that the model has inherent inadequacies which limit the reliability of
the results obtained from any moment-torque load case, primarily from the use of
rebar layers, a simplification of reinforcement modelling. It has also been
identified that the material property models, namely the concrete model, may be
inadequate for use under this loading scheme.

ENG 4111/4112 Project Dissertation Matthew Kronk
0050011657
67
Chapter 6. Conclusions
6.1 Summary
This project aimed to study the relationship between moment and torque in
steel-concrete composite beams. This relationship was to be studied using the
finite element method of analysis, which requires the generation of a model to
predict the behaviour of steel-concrete composite beams. The general purpose
finite element program ABAQUS was used to conduct the non-linear finite
element analysis. Using ABAQUS, a model was created, as described in this
paper, to predict steel-concrete composite beam loading behaviour. The created
model was compared with existing results for a pure bending case to vilify the
reliability of the generated model. From this step, it was found that the model
generated was able to accurately predict the ultimate load to within 10% of that
achieved in the published experiment. It was hence concluded that the model was
reliable and accurate to use.
The model created was then altered to the new loading conditions that
induce both flexure and torsion within the beam. This involved changing the
boundary conditions to something more appropriate to the loading scheme
adopted. In total, fifteen different loading schemes were analysed and graphed.
The graphed results indicating the relationship between moment and
torque were considered incorrect and therefore inappropriate for the development
of design formulas. It was identified that the use of rebar layers, for modelling the
reinforcement, was inappropriate for use in the case of flexure and torsion, and it

ENG 4111/4112 Project Dissertation Matthew Kronk
0050011657
68
was considered that perhaps the concrete model was inappropriate for use in the
analysed loading scheme of flexure and torsion.
6.2 Further Research
Several areas of further research exist, both experimentally and
computationally. Further research should be conducted in testing steel-concrete
composite beams under flexure and torsion in a similar loading scheme to that
used within this study. That is similar to that shown in figure 6.1, as opposed to
that shown in figure 6.2. Where “F” is the applied force and “M” is the torque.
Figure 6.1 Suggested Loading Scheme

ENG 4111/4112 Project Dissertation Matthew Kronk
0050011657
69
Figure 6.2 Alternative Loading Scheme
From this experimental study, appropriate load/deflection graphs and
moment/torque interaction graphs should be generated to provide information for
subsequent computational analysis and for the generation of appropriate design
formulas for designing steel-concrete composite beams under both flexure and
torsion.

ENG 4111/4112 Project Dissertation Matthew Kronk
0050011657
70
Appendices
Appendix A, Project Specification

ENG 4111/4112 Project Dissertation Matthew Kronk
0050011657
71
University of Southern Queensland
FACULTY OF ENGINEERING AND SURVEYING
ENG 4111/4112 Research Project
PROJECT SPECIFICATION
FOR: Matthew KRONK
TOPIC: ULTIMATE STRENGTH OF STEEL-CONCRETE
COMPOSITE BEAMS UNDER COMBINED BENDING
AND TORSION (Project No. 06-217)
SUPERVISOR: Dr. Qing Quan (Stephen) Liang
PROJECT AIM: This project aims to investigate the ultimate load behaviour
of steel-concrete composite beams under the combined
actions of bending and torsion using the finite element
analysis programs. The results obtained will then be used to
develop design formulas for the design of composite beams
under bending and torsion.
PROGRAMME: Issue A, 21st March 2006
1. Conduct a literature review on the experimental behaviour of composite
beams and on the nonlinear finite element analysis of composite beams.
2. Research into any experiments conducted on composite beams,
particularly on similar loading conditions to obtain data for verification.
3. Study the nonlinear finite element analysis method and develop a three-
dimensional finite element model for the nonlinear analysis of composite
beams under combined bending and torsion.
4. Conduct nonlinear finite element analyses on composite beams with full
shear connections under combined bending and torsion.
5. Generate the ultimate moment-torque interaction diagram to display the
interaction strengths of composite beams under combined actions.
6. Develop design formulas from the results that can be used for designing
composite beams under similar loading conditions.
Time permitting:
7. Modify the finite element models for composite beams with partial shear
connections and conduct nonlinear analyses.
AGREED: _________________ (Student) _________________ (Supervisor)

ENG 4111/4112 Project Dissertation Matthew Kronk
0050011657
72
Appendix B, Load/Deflection Tables
0 mm eccentricity
Deflection load factor load
0 0 0
0.573 5.00E-02 25.9194816
1.15 0.1 51.84
2.01 0.175 90.72
3.15 0.2741 142.09344
4.3 0.3691 191.34144
5.44 0.4582 237.53088
6.58 0.5433 281.64672
7.72 0.624 323.4816
8.86 0.7019 363.86496
9.99 0.7755 402.0192
11.1 0.8445 437.7888
12.3 0.9016 467.38944
12.6 0.9118 472.67712
13 0.9254 479.72736
13.7 0.9439 489.31776
13.7 0.9449 489.83616
13.8 0.9463 490.56192
13.8 0.9485 491.7024
14 0.9517 493.36128
14.1 0.9565 495.8496
14.2 0.9592 497.24928
14.4 0.9631 499.27104
14.6 0.9687 502.17408
14.7 0.9718 503.78112
14.9 0.976 505.9584
15 0.9781 507.04704
15.2 0.9813 508.70592
15.3 0.983 509.5872
15.4 0.9857 510.98688
15.5 0.9871 511.71264
15.6 0.9892 512.80128
15.8 0.9923 514.40832
15.9 0.9939 515.23776
16 0.9964 516.53376
16.1 0.9978 517.25952
16.2 0.9999 518.34816
16.3 1.001 518.9184
16.4 1.003 519.9552
16.5 1.005 520.992
16.6 1.006 521.5104
16.8 1.008 522.5472
16.8 1.01 523.584
16.9 1.011 524.1024
17 1.012 524.6208
17 1.013 525.1392
60 mm eccentricity
Deflection load factor load
0 0 0
0.566 5.00E-02 25.9314048
1.13 0.1001 51.89184
1.98 0.1752 90.82368
3.12 0.2739 141.98976
4.25 0.3653 189.37152
5.37 0.4516 234.10944
6.5 0.5342 276.92928
7.62 0.6145 318.5568
8.75 0.6935 359.5104
9.87 0.7697 399.01248
11 0.8418 436.38912
12.1 0.9008 466.97472
13.3 0.9396 487.08864
14.5 0.9723 504.04032
15.6 0.9997 518.24448
16.8 1.021 529.2864
18 1.04 539.136
19.2 1.057 547.9488
20.3 1.073 556.2432
21.5 1.088 564.0192
22.7 1.101 570.7584
23 1.104 572.3136
23.4 1.108 574.3872
23.7 1.111 575.9424
24 1.114 577.4976
24.1 1.115 578.016
24.2 1.116 578.5344
24.4 1.117 579.0528
24.4 1.117 579.0528
24.4 1.117 579.0528
24.4 1.117 579.0528
24.4 1.117 579.0528
24.4 1.118 579.5712
24.4 1.117 579.0528
24.4 1.117 579.0528
24.4 1.117 579.0528
24.4 1.117 579.0528
24.4 1.117 579.0528

ENG 4111/4112 Project Dissertation Matthew Kronk
0050011657
73
17 1.013 525.1392 120 mm eccentricity
Deflection load factor load
0 0 0
0.566 5.00E-02 25.9314048
1.13 0.1001 51.89184
1.98 0.1752 90.82368
3.12 0.2736 141.83424
4.25 0.3646 189.00864
5.38 0.4509 233.74656
6.5 0.5336 276.61824
7.63 0.6138 318.19392
8.75 0.6924 358.94016
9.88 0.7682 398.23488
10.2 0.7866 407.77344
10.4 0.8044 417.00096
10.9 0.8307 430.63488
11.1 0.8454 438.25536
11.2 0.8536 442.50624
11.4 0.8653 448.57152
11.5 0.8716 451.83744
11.7 0.8804 456.39936
12 0.8925 462.672
12.1 0.8988 465.93792
12.3 0.9079 470.65536
12.4 0.9125 473.04
12.6 0.9188 476.30592
12.9 0.9277 480.91968
13.3 0.94 487.296
13.6 0.9468 490.82112
13.9 0.9568 496.00512
14.5 0.9712 503.47008
14.8 0.9789 507.46176
15.2 0.9901 513.26784
15.5 0.9956 516.11904
15.9 1.003 519.9552
16.4 1.014 525.6576
16.6 1.017 527.2128
16.7 1.019 528.2496
16.9 1.023 530.3232
17.3 1.028 532.9152
17.7 1.036 537.0624
18.5 1.047 542.7648
19.2 1.058 548.4672
19.9 1.068 553.6512
20.1 1.07 554.688
20.3 1.072 555.7248
20.6 1.076 557.7984
21 1.081 560.3904
180 mm eccentricity
Deflection load factor load
0 0 0
0.565 5.00E-02 25.9314048
1.13 0.1001 51.89184
1.98 0.1751 90.77184
3.11 0.2731 141.57504
4.24 0.3635 188.4384
5.37 0.4496 233.07264
6.5 0.532 275.7888
7.62 0.6118 317.15712
7.91 0.6315 327.3696
8.19 0.651 337.4784
8.61 0.68 352.512
9.23 0.7231 374.85504
9.59 0.7469 387.19296
10.1 0.7815 405.1296
10.6 0.8152 422.59968
11.2 0.848 439.6032
11.7 0.8781 455.20704
12.2 0.9033 468.27072
12.8 0.9227 478.32768
12.9 0.9268 480.45312
13.1 0.9309 482.57856
13.3 0.9368 485.63712
13.6 0.9456 490.19904
14.1 0.9585 496.8864
14.3 0.9655 500.5152
14.7 0.9758 505.85472
15.3 0.9904 513.42336
15.5 0.994 515.2896
15.6 0.9972 516.94848
15.9 1.002 519.4368
16.2 1.008 522.5472
16.7 1.017 527.2128
17 1.022 529.8048
17.4 1.029 533.4336
17.8 1.036 537.0624
18.3 1.043 540.6912
18.9 1.052 545.3568
19.3 1.057 547.9488
19.8 1.065 552.096
20.1 1.069 554.1696
20.6 1.075 557.28
21.3 1.083 561.4272
22 1.091 565.5744
22.7 1.099 569.7216
22.8 1.1 570.24

ENG 4111/4112 Project Dissertation Matthew Kronk
0050011657
74
21.2 1.084 561.9456
21.6 1.088 564.0192
21.7 1.09 565.056
22 1.093 566.6112
22.5 1.098 569.2032
22.9 1.103 571.7952
23.4 1.107 573.8688
23.8 1.111 575.9424
24.2 1.115 578.016
24.5 1.118 579.5712
24.8 1.121 581.1264
25 1.123 582.1632
25.4 1.126 583.7184
25.5 1.127 584.2368
25.8 1.129 585.2736
26.2 1.132 586.8288
26.4 1.134 587.8656
26.7 1.136 588.9024
27.2 1.14 590.976
27.5 1.142 592.0128
27.9 1.145 593.568
28.2 1.147 594.6048
28.5 1.15 596.16
29 1.153 597.7152
29.3 1.155 598.752
29.8 1.158 600.3072
30.5 1.163 602.8992
31.1 1.167 604.9728
31.3 1.168 605.4912
31.5 1.169 606.0096
23 1.102 571.2768
23.2 1.104 572.3136
23.4 1.107 573.8688
23.8 1.11 575.424
24 1.112 576.4608
24.4 1.115 578.016
24.8 1.12 580.608
25.3 1.124 582.6816
220 mm eccentricity
Deflection load factor load
0 0 0
0.573 5.00E-02 25.9194816
1.15 0.1 51.84
2 0.1749 90.66816
3.15 0.2733 141.67872
4.3 0.3664 189.94176
5.45 0.4544 235.56096
5.73 0.476 246.7584
6.16 0.5079 263.29536
6.8 0.5539 287.14176
7.16 0.5792 300.25728
7.52 0.6041 313.16544
7.88 0.6286 325.86624
8.08 0.6422 332.91648
8.38 0.6624 343.38816
8.83 0.6923 358.88832
9.08 0.709 367.5456
240 mm eccentricity
Deflection load factor load
0 0 0
0.572 5.00E-02 25.9194816
1.14 1.00E-01 51.837408
2 0.1748 90.61632
3.15 0.2731 141.57504
4.3 0.3658 189.63072
5.44 0.4535 235.0944
5.73 0.475 246.24
6.01 0.4961 257.17824
6.44 0.5271 273.24864
6.68 0.5441 282.06144
6.92 0.5609 290.77056
7.16 0.5775 299.376
7.52 0.6021 312.12864
7.72 0.6158 319.23072
8.01 0.6361 329.75424
8.46 0.6662 345.35808

ENG 4111/4112 Project Dissertation Matthew Kronk
0050011657
75
9.22 0.7183 372.36672
9.3 0.7235 375.0624
9.42 0.7313 379.10592
9.6 0.7428 385.06752
9.87 0.76 393.984
10 0.7697 399.01248
10.2 0.7839 406.37376
10.3 0.7875 408.24
10.4 0.791 410.0544
10.4 0.7962 412.75008
10.6 0.804 416.7936
10.7 0.8113 420.57792
10.8 0.819 424.5696
10.9 0.8209 425.55456
10.9 0.8228 426.53952
10.9 0.8229 426.59136
10.9 0.8229 426.59136
8.71 0.6828 353.96352
9.09 0.7075 366.768
9.3 0.7213 373.92192
9.62 0.7416 384.44544
10.1 0.7716 399.99744
10.2 0.7791 403.88544
10.2 0.7792 403.93728
10.2 0.7794 404.04096
10.2 0.7796 404.14464
10.2 0.78 404.352
10.2 0.7806 404.66304
10.2 0.7807 404.71488
10.2 0.7807 404.71488
10.2 0.7807 404.71488
260 mm eccentricity
Deflection load factor load
0 0 0
0.572 5.00E-02 25.9194816
1.14 1.00E-01 51.8363712
2 0.1748 90.61632
3.15 0.2729 141.47136
4.3 0.3652 189.31968
5.44 0.4525 234.576
5.73 0.4738 245.61792
6.15 0.5052 261.89568
6.39 0.5223 270.76032
6.75 0.5476 283.87584
7.1 0.5724 296.73216
7.46 0.5968 309.38112
7.99 0.6326 327.93984
8.51 0.6677 346.13568
9.04 0.702 363.9168
9.33 0.7211 373.81824
9.49 0.7317 379.31328
9.59 0.7376 382.37184
9.73 0.7465 386.9856
9.8 0.7515 389.5776
9.92 0.7588 393.36192
10.1 0.7699 399.11616
10.4 0.7863 407.61792
10.6 0.8024 415.96416
10.9 0.8176 423.84384
10.9 0.8214 425.81376
11 0.8224 426.33216
11 0.8238 427.05792
11 0.8246 427.47264
300 mm eccentricity
Deflection load factor load
0 0 0
0.572 5.00E-02 25.9194816
1.14 1.00E-01 51.834816
2 0.1748 90.61632
3.15 0.2725 141.264
4.3 0.3639 188.64576
4.58 0.3858 199.99872
5.01 0.4183 216.84672
5.25 0.4363 226.17792
5.61 0.463 240.0192
6.14 0.5021 260.28864
6.44 0.5233 271.27872
6.74 0.544 282.0096
7.04 0.5643 292.53312
7.2 0.5756 298.39104
7.37 0.5869 304.24896
7.53 0.5981 310.05504
7.78 0.6146 318.60864
8.15 0.639 331.2576
8.36 0.6527 338.35968
8.66 0.6729 348.83136
8.84 0.6843 354.74112
9.1 0.701 363.3984
9.24 0.7104 368.27136
9.46 0.7243 375.47712
9.78 0.7449 386.15616
9.96 0.7563 392.06592
10.2 0.773 400.7232
10.3 0.777 402.7968
10.4 0.7812 404.97408

ENG 4111/4112 Project Dissertation Matthew Kronk
0050011657
76
11 0.8246 427.47264
11 0.8247 427.52448
11 0.8247 427.52448
10.4 0.7854 407.15136
10.5 0.7895 409.2768
10.6 0.7955 412.3872
10.7 0.7989 414.14976
10.7 0.799 414.2016
10.7 0.8011 415.29024
10.8 0.8031 416.32704
10.8 0.806 417.8304
10.9 0.8103 420.05952
11 0.8164 423.22176
11.1 0.8252 427.78368
11.2 0.8301 430.32384
11.4 0.8373 434.05632
11.6 0.8481 439.65504
11.7 0.8541 442.76544
11.8 0.8574 444.47616
11.9 0.8623 447.01632
12 0.8696 450.80064
12.2 0.8766 454.42944
12.3 0.8826 457.53984
12.5 0.888 460.3392
12.6 0.8932 463.03488
12.8 0.8983 465.67872
12.9 0.903 468.1152
13.1 0.9077 470.55168
13.3 0.9117 472.62528
13.4 0.9163 475.00992
13.5 0.9175 475.632
13.5 0.9187 476.25408
13.5 0.919 476.4096 360 mm eccentricity
Deflection load factor load
0 0 0
0.572 5.00E-02 25.9194816
1.14 1.00E-01 51.8306688
2 0.1747 90.56448
3.15 0.2717 140.84928
4.29 0.3617 187.50528
5.42 0.4462 231.31008
5.7 0.4666 241.88544
6.12 0.496 257.1264
6.35 0.512 265.4208
6.58 0.5277 273.55968
6.81 0.5431 281.54304
6.93 0.5517 286.00128
7.12 0.5645 292.6368
7.41 0.5835 302.4864
7.57 0.5941 307.98144
7.81 0.6097 316.06848
400 mm eccentricity
Deflection load factor load
0 0 0
0.572 5.00E-02 25.91948
1.14 1.00E-01 51.82393
2 0.1746 90.51264
3.15 0.271 140.4864
4.29 0.3598 186.5203
4.57 0.381 197.5104
4.99 0.4123 213.7363
5.22 0.4296 222.7046
5.36 0.4391 227.6294
5.55 0.4531 234.887
5.66 0.4608 238.8787
5.82 0.4722 244.7885
6.07 0.489 253.4976
6.2 0.4983 258.3187
6.4 0.512 265.4208
6.52 0.5197 269.4125

ENG 4111/4112 Project Dissertation Matthew Kronk
0050011657
77
7.94 0.6184 320.57856
8.14 0.6315 327.3696
8.25 0.6387 331.10208
8.41 0.6493 336.59712
8.58 0.66 342.144
8.74 0.6702 347.43168
8.9 0.6807 352.87488
9.06 0.6912 358.31808
9.22 0.7015 363.6576
9.31 0.7073 366.66432
9.45 0.7158 371.07072
9.52 0.7207 373.61088
9.63 0.7279 377.34336
9.7 0.7318 379.36512
9.79 0.7377 382.42368
9.93 0.7467 387.08928
10.1 0.7555 391.6512
10.2 0.7642 396.16128
10.4 0.7727 400.56768
10.4 0.7775 403.056
10.5 0.7842 406.52928
10.7 0.7942 411.71328
10.8 0.7995 414.4608
10.9 0.8023 415.91232
11 0.8067 418.19328
11.1 0.8132 421.56288
11.3 0.8229 426.59136
11.4 0.8324 431.51616
11.5 0.8348 432.76032
11.5 0.8371 433.95264
11.6 0.8406 435.76704
11.7 0.8439 437.47776
11.7 0.8473 439.24032
11.8 0.8507 441.00288
11.9 0.8557 443.59488
12 0.8605 446.0832
12.1 0.8651 448.46784
12.2 0.8692 450.59328
12.4 0.873 452.5632
12.5 0.8768 454.53312
12.5 0.8778 455.05152
12.5 0.8788 455.56992
12.5 0.8791 455.72544
12.5 0.8795 455.9328
6.68 0.531 275.2704
6.85 0.5422 281.0765
7.02 0.5533 286.8307
7.26 0.5695 295.2288
7.4 0.5787 299.9981
7.6 0.5921 306.9446
7.72 0.5997 310.8845
7.89 0.6105 316.4832
8.05 0.6215 322.1856
8.22 0.6323 327.7843
8.47 0.648 335.9232
8.53 0.652 337.9968
8.59 0.656 340.0704
8.68 0.6619 343.129
8.77 0.6678 346.1875
8.86 0.6737 349.2461
8.95 0.6795 352.2528
9.04 0.6852 355.2077
9.13 0.6909 358.1626
9.21 0.6964 361.0138
9.3 0.702 363.9168
9.39 0.7075 366.768
9.47 0.713 369.6192
9.56 0.7185 372.4704
9.64 0.7238 375.2179
9.72 0.7291 377.9654
9.8 0.7344 380.713
9.89 0.7395 383.3568
9.97 0.7447 386.0525
10 0.7498 388.6963
10.1 0.7548 391.2883
10.2 0.7598 393.8803
10.3 0.7646 396.3686
10.4 0.7695 398.9088
10.4 0.7742 401.3453
10.5 0.7788 403.7299
10.6 0.7832 406.0109
10.7 0.7877 408.3437
10.8 0.792 410.5728
10.9 0.7964 412.8538
11 0.8028 416.1715
11.1 0.8091 419.4374
11.1 0.8107 420.2669
11.2 0.8123 421.0963
11.2 0.8132 421.5629
11.2 0.8137 421.8221
11.2 0.814 421.9776
11.2 0.8144 422.185 420 mm eccentricity
Deflection load load
430 mm eccentricity
Deflection load load

ENG 4111/4112 Project Dissertation Matthew Kronk
0050011657
78
factor
0 0 0
0.572 5.00E-02 25.91948
1.14 1.00E-01 51.82082
2 0.1745 90.4608
3.15 0.2707 140.3309
4.29 0.359 186.1056
4.57 0.3803 197.1475
4.73 0.392 203.2128
4.97 0.4095 212.2848
5.32 0.4349 225.4522
5.51 0.4487 232.6061
5.62 0.4563 236.5459
5.78 0.4675 242.352
5.87 0.4738 245.6179
6.01 0.4831 250.439
6.21 0.4969 257.593
6.32 0.5046 261.5846
6.49 0.5161 267.5462
6.59 0.5224 270.8122
6.73 0.5319 275.737
6.94 0.5458 282.9427
7.05 0.5535 286.9344
7.17 0.561 290.8224
7.28 0.5687 294.8141
7.46 0.58 300.672
7.55 0.5862 303.8861
7.65 0.5924 307.1002
7.74 0.5986 310.3142
7.88 0.6078 315.0835
8.09 0.6214 322.1338
8.21 0.629 326.0736
8.38 0.6404 331.9834
8.55 0.6513 337.6339
8.72 0.6621 343.2326
8.76 0.6649 344.6842
8.8 0.6675 346.032
8.86 0.6716 348.1574
8.92 0.6755 350.1792
8.98 0.6795 352.2528
9.04 0.6834 354.2746
9.1 0.6874 356.3482
9.16 0.6912 358.3181
9.25 0.6969 361.273
9.34 0.7027 364.2797
9.43 0.7084 367.2346
9.51 0.714 370.1376
9.6 0.7195 372.9888
9.69 0.7249 375.7882
9.77 0.7304 378.6394
factor
0 0 0
0.572 0.049999 25.91948
1.14 0.09996 51.81926
2 0.1745 90.4608
3.15 0.2705 140.2272
4.29 0.3585 185.8464
4.57 0.3797 196.8365
4.72 0.3914 202.9018
4.96 0.4087 211.8701
5.19 0.4256 220.631
5.42 0.4419 229.081
5.55 0.4509 233.7466
5.74 0.4641 240.5894
5.85 0.4714 244.3738
6.01 0.4823 250.0243
6.1 0.4884 253.1866
6.23 0.4975 257.904
6.43 0.511 264.9024
6.54 0.5184 268.7386
6.71 0.5295 274.4928
6.8 0.5357 277.7069
6.93 0.5448 282.4243
7.01 0.5497 284.9645
7.13 0.5572 288.8525
7.3 0.5684 294.6586
7.39 0.5747 297.9245
7.53 0.5839 302.6938
7.74 0.5975 309.744
7.86 0.6051 313.6838
8.03 0.6165 319.5936
8.28 0.6333 328.3027
8.53 0.6493 336.5971
8.77 0.6651 344.7878
8.83 0.669 346.8096
8.89 0.6728 348.7795
8.98 0.6785 351.7344
9.06 0.6841 354.6374
9.15 0.6898 357.5923
9.28 0.698 361.8432
9.4 0.7062 366.0941
9.53 0.7142 370.2413
9.65 0.7222 374.3885
9.78 0.7301 378.4838
9.9 0.7379 382.5274
9.93 0.7399 383.5642
9.96 0.7418 384.5491
10 0.7447 386.0525
10.1 0.749 388.2816
10.1 0.753 390.3552

ENG 4111/4112 Project Dissertation Matthew Kronk
0050011657
79
9.86 0.7358 381.4387
9.94 0.7411 384.1862
10 0.7465 386.9856
10.1 0.7516 389.6294
10.2 0.7568 392.3251
10.3 0.7618 394.9171
10.4 0.7667 397.4573
10.4 0.7714 399.8938
10.5 0.776 402.2784
10.5 0.7772 402.9005
10.6 0.779 403.8336
10.6 0.7816 405.1814
10.7 0.7854 407.1514
10.8 0.7911 410.1062
10.9 0.7967 413.0093
11 0.8023 415.9123
11.1 0.8079 418.8154
11.2 0.8134 421.6666
11.3 0.8166 423.3254
11.4 0.8211 425.6582
11.4 0.8238 427.0579
11.5 0.8276 429.0278
11.6 0.8331 431.879
11.7 0.8386 434.7302
11.8 0.8438 437.4259
11.9 0.8468 438.9811
12 0.8509 441.1066
12.2 0.8565 444.0096
12.3 0.8621 446.9126
12.5 0.8675 449.712
12.7 0.8727 452.4077
12.8 0.8779 455.1034
13 0.8829 457.6954
13.2 0.8879 460.2874
13.3 0.8928 462.8275
13.5 0.8976 465.3158
13.7 0.9024 467.8042
13.8 0.9051 469.2038
13.9 0.9091 471.2774
14 0.9113 472.4179
14.1 0.9145 474.0768
14.3 0.9175 475.632
14.4 0.9203 477.0835
14.5 0.9229 478.4314
14.6 0.9256 479.831
14.8 0.9283 481.2307
14.8 0.929 481.5936
10.2 0.7572 392.5325
10.3 0.7612 394.6061
10.4 0.767 397.6128
10.5 0.7755 402.0192
10.7 0.7839 406.3738
10.7 0.7861 407.5142
10.8 0.7883 408.6547
10.8 0.7914 410.2618
10.9 0.7959 412.5946
11 0.8028 416.1715
11.2 0.8095 419.6448
11.3 0.8163 423.1699
11.4 0.823 426.6432
11.5 0.8294 429.961
11.6 0.8331 431.879
11.7 0.838 434.4192
11.8 0.843 437.0112
12 0.8477 439.4477
12.1 0.8521 441.7286
12.2 0.8565 444.0096
12.4 0.8628 447.2755
12.6 0.869 450.4896
12.8 0.8749 453.5482
13 0.8808 456.6067
13.2 0.8866 459.6134
13.4 0.8922 462.5165
440 mm eccentricity
Deflection load factor load
480 mm eccentricity
Deflection load factor load

ENG 4111/4112 Project Dissertation Matthew Kronk
0050011657
80
0 0 0
0.572 0.049999 25.91948
1.14 0.099958 51.81823
2 0.1745 90.4608
3.15 0.2703 140.1235
4.28 0.3579 185.5354
4.56 0.3791 196.5254
4.98 0.4098 212.4403
5 0.4114 213.2698
5.04 0.4138 214.5139
5.08 0.4173 216.3283
5.16 0.4225 219.024
5.27 0.4302 223.0157
5.43 0.4416 228.9254
5.67 0.4583 237.5827
5.8 0.4674 242.3002
5.94 0.4766 247.0694
6.07 0.4857 251.7869
6.27 0.4991 258.7334
6.38 0.5066 262.6214
6.54 0.5176 268.3238
6.63 0.5238 271.5379
6.77 0.5328 276.2035
6.85 0.5378 278.7955
6.96 0.5454 282.7354
7.02 0.5495 284.8608
7.08 0.5537 287.0381
7.15 0.5578 289.1635
7.24 0.5639 292.3258
7.38 0.5731 297.095
7.59 0.5866 304.0934
7.7 0.5942 308.0333
7.87 0.6054 313.8394
7.97 0.6118 317.1571
8.11 0.621 321.9264
8.31 0.6345 328.9248
8.51 0.6476 335.7158
8.71 0.6604 342.3514
8.9 0.6729 348.8314
8.95 0.6761 350.4902
9 0.6792 352.0973
9.07 0.6838 354.4819
9.11 0.6864 355.8298
9.17 0.6902 357.7997
9.25 0.6958 360.7027
9.34 0.7015 363.6576
9.43 0.7071 366.5606
9.45 0.7086 367.3382
9.47 0.71 368.064
9.5 0.712 369.1008
0 0 0
0.572 5.00E-02 25.91896
1.14 9.99E-02 51.81304
2 0.1744 90.40896
3.15 0.2693 139.6051
4.27 0.3554 184.2394
4.55 0.3761 194.9702
4.95 0.4055 210.2112
5.18 0.4212 218.3501
5.51 0.4439 230.1178
5.69 0.4563 236.5459
5.79 0.4632 240.1229
5.94 0.4734 245.4106
6.16 0.4884 253.1866
6.29 0.4967 257.4893
6.47 0.5088 263.7619
6.57 0.5156 267.287
6.72 0.5255 272.4192
6.8 0.5311 275.3222
6.93 0.5394 279.625
7.11 0.5513 285.7939
7.21 0.5581 289.319
7.31 0.5648 292.7923
7.4 0.5713 296.1619
7.55 0.5809 301.1386
7.63 0.5863 303.9379
7.75 0.5942 308.0333
7.81 0.5986 310.3142
7.91 0.6049 313.5802
8 0.6113 316.8979
8.1 0.6175 320.112
8.19 0.6237 323.3261
8.28 0.6295 326.3328
8.37 0.6356 329.495
8.46 0.6416 332.6054
8.55 0.6474 335.6122
8.68 0.6559 340.0186
8.8 0.6644 344.425
8.93 0.6728 348.7795
9.05 0.6809 352.9786
9.17 0.6891 357.2294
9.29 0.6973 361.4803
9.41 0.7053 365.6275
9.44 0.7075 366.768
9.47 0.7095 367.8048
9.52 0.7125 369.36
9.58 0.7168 371.5891
9.65 0.7212 373.8701
9.71 0.7256 376.151
9.78 0.7299 378.3802

ENG 4111/4112 Project Dissertation Matthew Kronk
0050011657
81
9.53 0.7141 370.1894
9.57 0.7162 371.2781
9.61 0.7192 372.8333
9.68 0.7237 375.1661
9.75 0.7283 377.5507
9.82 0.7328 379.8835
9.89 0.7373 382.2163
9.96 0.7417 384.4973
10 0.7462 386.8301
10.1 0.7506 389.111
10.2 0.7566 392.2214
10.4 0.7655 396.8352
10.5 0.7744 401.449
10.7 0.7831 405.959
10.8 0.7916 410.3654
11 0.8001 414.7718
11.1 0.8086 419.1782
11.3 0.8168 423.4291
11.5 0.8246 427.4726
11.6 0.8322 431.4125 540 mm eccentricity
Deflection load factor load
0 0 0
0.572 5.00E-02 25.91896
1.14 9.99E-02 51.80734
2.01 0.1741 90.25344
3.14 0.2675 138.672
3.42 0.2893 149.9731
3.58 0.3013 156.1939
3.81 0.319 165.3696
4.16 0.3447 178.6925
4.35 0.3587 185.9501
4.63 0.3784 196.1626
4.78 0.3892 201.7613
4.86 0.3952 204.8717
4.99 0.404 209.4336
5.06 0.4089 211.9738
5.17 0.4161 215.7062
5.32 0.4268 221.2531
5.41 0.4328 224.3635
5.53 0.4414 228.8218
5.6 0.4462 231.3101
5.7 0.4532 234.9389
5.76 0.4572 237.0125
5.85 0.463 240.0192
5.89 0.4662 241.6781
5.96 0.471 244.1664
6.07 0.4782 247.8989
6.13 0.4821 249.9206
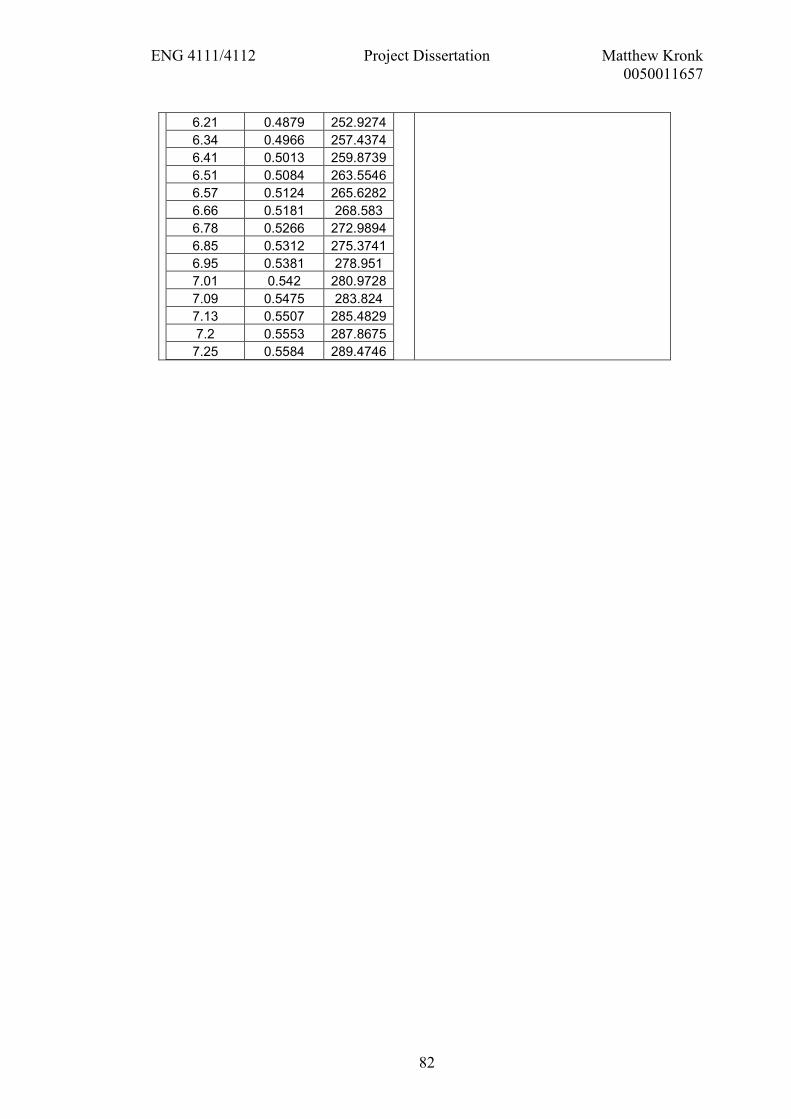
ENG 4111/4112 Project Dissertation Matthew Kronk
0050011657
82
6.21 0.4879 252.9274
6.34 0.4966 257.4374
6.41 0.5013 259.8739
6.51 0.5084 263.5546
6.57 0.5124 265.6282
6.66 0.5181 268.583
6.78 0.5266 272.9894
6.85 0.5312 275.3741
6.95 0.5381 278.951
7.01 0.542 280.9728
7.09 0.5475 283.824
7.13 0.5507 285.4829
7.2 0.5553 287.8675
7.25 0.5584 289.4746

ENG 4111/4112 Project Dissertation Matthew Kronk
0050011657
83
References
Ansourian, P. (1981). “Experiments on continuous composite beams” Proc. Instn
Civ. Engrs, Part 2 1981;71 25-51.
Baskar, K., Shanmugam, N.E., and Thevendran, V. (2002). “Finite-element
analysis of steel-concrete composite plate girder.” J. Struct. Eng., 128(9), 1158-
1168.
Baskar, K., Shanmugam, N.E. (2003). “Steel-concrete composite plate girders
subject to combined shear and bending” J. Constr. Steel Res., 59: 531-557.
Chapman, J.C., and Balakrishnan, S. (1964). “Experiments on Composite
Beams.” Struct. Eng., 42(11), 369-383.
Ghosh, B., and Mallick, S.K. (1979). “Strength of steel-concrete composite beams
under combined flexure and torsion.” The Indian Concrete Journal, 53, 48-53.
Hirst, M.J.S., Yeo, M.F. (1980). “The analysis of composite beams using standard
finite element programs.” Comput. Struct., 11(3), 233-237.
Liang, Q.Q., Uy, B., Bradford, M.A., Ronagh, H.R. (2005), “Strength Analysis of
Steel-Concrete Composite Beams in Combined Bending and Shear.” J. Struct.
Eng., ASCE, 131(10), 1593-1600.

ENG 4111/4112 Project Dissertation Matthew Kronk
0050011657
84
Liang, Q.Q., Uy, B., Bradford, M.A., Ronagh, H.R. (2004). “Ultimate strength of
continuous composite beams in combined bending and shear.” J. Constr. Steel
Res., 60(8), 1109-1128.
Ray, M.B., and Mallick, S.K. (1980). “Interaction of flexure and torsion in steel-
concrete composite beams.” The Indian Concrete Journal, 54, 80-83.
Razaqpur, A.G., Nofal, M. (1990). “Analytical modeling of nonlinear behaviour
of composite bridges.” J. Struct. Eng., ASCE, 116(6), 1715-1733.
Razaqpur, A.G., Nofal, M. (1989). “A finite element for modelling the nonlinear
behaviour of shear connectors in composite structures.” Comput. Struct., 32(1),
169-174.
Standards Australia (2003). “Composite Structures, part I: Simply supported
beams.” AS 2327.1, Sydney.
Sebastian, W., and McConnel, R.E. (2000). “Nonlinear FE Analysis of Steel-
Concrete Composite Structures.” J. Struct. Eng., 126(6), 662-674.
Singh, R.K., and Mallick, S.K. (1977). “Experiments on steel-concrete composite
beams subjected to torsion and combined flexure and torsion.” The Indian
Concrete Journal, 51, 24-30.

ENG 4111/4112 Project Dissertation Matthew Kronk
0050011657
85
Thevendran, V., Chen, S., Shanmugam, N.E., and Liew, J.Y.R. (1999).
“Nonlinear analysis of steel-concrete composite beams curved in plan.” Finite
Elem. Anal. Design, 32(3), 125-139.
Yam, L.C.P., Chapman, J.C. (1968) “The inelastic behaviour of continuous
composite beams of steel and concrete” Proc. Inst. Civ. Eng. Part 2, 53, 487-501.
Yam, L.C.P., Chapman, J.C. (1968) “The inelastic behaviour of simply supported
composite beams of steel and concrete.” Proc. Inst. Civ. Eng., 41(1), 651-683.