
UK jobs in the bioenergy sectors by 2020 · was assumed that in the biomass power and heat sectors,...
43
NNFCC The Bioeconomy Consultants Report Title: UK jobs in the bioenergy sectors by 2020 Project Number: 11-025 April 2012 A report for DECC URN: 12D/080
Transcript of UK jobs in the bioenergy sectors by 2020 · was assumed that in the biomass power and heat sectors,...

NNFCC The Bioeconomy Consultants
Report Title: UK jobs in the bioenergy sectors by 2020
Project Number: 11-025
April 2012
A report for DECC
URN: 12D/080

UK jobs in the bioenergy sectors by 2020, Page 2 of 43
Author(s)
Fiona McDermott, NNFCC Consultant
Reviewer(s)
Lucy Hopwood, NNFCC Head of Biomass and Biogas
Disclaimer
While NNFCC considers that the information and opinions given in this work are
sound, all parties must rely on their own skill and judgement when making use of it.
NNFCC does not make any representation or warranty, expressed or implied, as to
the accuracy or completeness of the information contained in this report and
assumes no responsibility for the accuracy or completeness of such information.
NNFCC will not assume any liability to anyone for any loss or damage arising out of
the provision of this report.
NNFCC
NNFCC is a leading international consultancy with expertise on the conversion of
biomass to bioenergy, biofuels and bio-based products.
NNFCC, Biocentre, Phone: +44 (0)1904 435182
York Science Park, Fax: +44 (0)1904 435345
Innovation Way, E: [email protected]
Heslington, York, Web: www.nnfcc.co.uk
YO10 5DG.

UK jobs in the bioenergy sectors by 2020, Page 3 of 43
1 Executive Summary
Biomass is seen as a major contributor to the delivery of the 2020 targets for
electricity, heat and transport fuels. However there has been a lack of reliable data
on what wider benefits this potentially significant industry could bring to the UK
economy.
Despite this, employment potential in the bioenergy sector is expected to exceed
that in other renewable energy technologies due to the additional element of
feedstock production, supply, handling and logistics. This is an added benefit that
appears underestimated at present but offers a valuable opportunity for UK
economic growth and job creation.
This study estimated the possible number of UK jobs in the biomass combustion (for
heat and power) and anaerobic digestion sectors by 2020, based on deployment
projections taken from DECC’s ‘UK Renewable Energy Roadmap’ (July 2011).
These estimates of employment were derived using data from previous studies
alongside new modelling, and were broken down by jobs in: feedstock supply, plant
design and construction, and plant operation. However due to the lack of available
data and difficulty in projecting the market for plant components, jobs in the
manufacturing sector were not included.
The study found that if bioenergy deployment reached the levels predicted in the
Renewables Roadmap (see section 5.3.1), then there may be somewhere in the
region of 35-50,000 UK jobs in bioenergy by 2020, see Figure 1.

UK jobs in the bioenergy sectors by 2020, Page 4 of 43
Figure 1: Approximate UK employment in biomass electricity, heat and AD sectors
by 2020
This highlights that there are significant employment opportunities for the UK, and
that the economy could benefit considerably from deployment of bioenergy.
However the actual number of people employed in the sector will be highly
dependent upon the level of uptake of the technologies, whether it is new
dedicated biomass plant, conversion of an existing fossil fuel station to dedicated
biomass or co-firing of biomass with fossil fuel, and the supply chain structures used.
These employment figures should therefore be viewed as maximum levels.
The study also estimated the contributions to overall bioenergy employment from
each of the three sectors considered of heat, electricity and anaerobic digestion.
Figure 2 below shows the possible job prospects in each of these technologies, with
estimations ranging from 1,000 jobs in AD to almost 30,000 at the very upper range
for biomass heat.
Figure 2: Approximate number of jobs in each sector
Jobs, FTE
Scenario Installed
capacity MWth
Development Construction Operation &
maintenance
UK feedstock
supply
TOTAL
Biomass
power
2,740-4,621 513-866 6,753-11,390 2,377-4,008 1,320-2,139 10,964-
18,403
AD 320-579 68-123 379-868 752-1,360 160-289 1,358-
2,457
Biomass
heat
6,327-8,304 1,263-1,658 9,427-12,373 8,408-11,035 3,498-4,591 22,596-
29,657
The majority of jobs are likely to be technical roles, primarily in the engineering and
construction sectors, required during both the construction and operation phase of
new bioenergy plant.
0
10,000
20,000
30,000
40,000
50,000
Low Medium High
1,845 2,244 2,647
16,560 20,481
24,448
11,536
13,961
16,403 4,978
5,998
7,019
Ap
pro
xim
ate
nu
mb
er
of
job
s UK Feedstock supply
Operation &
maintenance
Construction &
installation
Development

UK jobs in the bioenergy sectors by 2020, Page 5 of 43
In addition to this there are clear employment opportunities for the UK biomass
supply sector; including roles in feedstock production, harvesting, processing and
haulage. However the size of this industry is highly dependent upon the origin of
feedstocks used, most notably whether the industry uses predominantly UK
indigenous resources or imported material. Hence for the purposes of this study it
was assumed that in the biomass power and heat sectors, 10% and 50% respectively
of the feedstock used was sourced from within the UK. Further to this, there is also
significant uncertainty in the labour intensity of this sector as supply chain structures
can vary considerably. For example, if a feedstock is used in its raw form within 10
miles of where it is grown then fewer people will be employed than if it was
processed intensively and/or transported 200 miles to the end user.
Similar calculation uncertainties are inherent in the estimation of employment in
designing, building and operating new plant. Therefore although the figures derived
in this study can give a useful indication of the level of employment opportunities in
the UK bioenergy sectors, the discrete figures quoted have a considerable degree
of uncertainty attached to them and hence should be used cautiously.
Finally, the methodology used in this study was partially dependent upon the outputs
of an industry survey, which gathered real employment data from a range of
planned and operational biomass plant. It is worth observing that this survey was
modest in size and although a relatively good response rate of 28% was achieved,
the biomass heat industry was underrepresented in the final dataset. As a result the
conclusions for potential employment in this sector will be less robust than those for
the other technology groups.

UK jobs in the bioenergy sectors by 2020, Page 6 of 43
Contents
1 Executive Summary ......................................................................................................... 3
2 Acknowledgements ...................................................................................................... 10
3 Introduction .................................................................................................................... 11
3.1 Rationale ...................................................................................................................... 11
3.2 Objective ..................................................................................................................... 11
4 Methodology ................................................................................................................. 12
5 Biomass employment research ................................................................................... 13
5.1 Review of existing resources ..................................................................................... 13
5.1.1 Employment Statistics from The Directory of UK Biomass Generation Plants
2010 – Enagri, September 2010 (1) ...................................................................................... 13
5.1.2 Quantification of employment from biomass power plants - Patricia Thornley
et al., November 2007 (2) ..................................................................................................... 14
5.1.3 Biosynergy Integrated project, led by ECN in the Netherlands 2010 (3). ....... 14
5.1.4 The economic value of the woodfuel industry to the UK economy by 2020,
Centre for Economics and Business Research commissioned by Forestry Commission
June 2010 (4). ......................................................................................................................... 15
5.1.5 An economic evaluation of current and prospective value to the north east
of England from biomass-related activities, Northwoods August 2008 (5).................... 17
5.1.6 Scoping study on the review of the manufacturing and engineering
capabilities for manufacture and supply of key plant components and services for
the biomass industry, Energy Institute, April 2009 (6). ....................................................... 17
5.2 Survey of bioenergy industry stakeholders .............................................................. 18
5.3 Data analysis and modelling .................................................................................... 18
5.3.1 Technology deployment by 2020 ......................................................................... 19
6 Bioenergy jobs by technology type ............................................................................ 21
6.1 Biomass electricity ...................................................................................................... 21
6.1.1 Employment coefficients ....................................................................................... 22
6.1.2 Level of deployment in 2020 ................................................................................. 25
6.1.3 Jobs in biomass electricity ..................................................................................... 26
6.2 Anaerobic digestion .................................................................................................. 26
6.2.1 Employment coefficients ....................................................................................... 28
6.2.2 Level of deployment in 2020 ................................................................................. 30
6.2.3 Jobs in anaerobic digestion .................................................................................. 30
6.3 Biomass heat ............................................................................................................... 31

UK jobs in the bioenergy sectors by 2020, Page 7 of 43
6.3.1 Employment coefficients ....................................................................................... 32
6.3.2 Level of deployment in 2020 ................................................................................. 34
6.3.3 Jobs in biomass heat .............................................................................................. 34
7 Summary of findings ...................................................................................................... 35
7.1 Total UK jobs in bioenergy ......................................................................................... 35
7.2 UK jobs in biomass electricity .................................................................................... 35
7.3 UK jobs in anaerobic digestion ................................................................................. 35
7.4 UK jobs in biomass heat ............................................................................................. 36
8 Conclusions .................................................................................................................... 36
9 Annex 1 - Questionnaire for biomass plant developers ........................................... 39
10 Annex 2 - Questionnaire for biomass fuel suppliers .................................................. 40
11 Annex 3 - Questionnaire for biomass boiler installers ................................................ 41
12 References ..................................................................................................................... 42

UK jobs in the bioenergy sectors by 2020, Page 8 of 43
Table of Figures
Figure 1: Approximate UK employment in biomass electricity, heat and AD sectors by
2020 ........................................................................................................................................... 4
Figure 2: Approximate number of jobs in each sector ...................................................... 4
Figure 3: Project development activity categories to be used ...................................... 12
Figure 4: Outputs from CEBR research on woodfuel industry jobs in the UK (4) ........... 16
Figure 5: CEBR Woodfuel supply chain model (4) ............................................................ 16
Figure 6: Possible biomass electricity deployment by 2020 (7) ....................................... 19
Figure 7: Possible biomass heat deployment by 2020 (7) ................................................ 20
Figure 8: DECC technology categories .............................................................................. 20
Figure 9: Employment sectors in biomass electricity plant development ..................... 22
Figure 10: Survey results from biomass electricity plant developers ............................... 23
Figure 11: Employment coefficients allowing for reduced contract terms ................... 24
Figure 12: Employment associated with biomass feedstock production & processing
.................................................................................................................................................. 24
Figure 13: Summary of employment coefficients used in final calculations ................. 25
Figure 14: Biomass electricity - range of projected operational capacity (including
CHP)......................................................................................................................................... 25
Figure 15: Findings for UK jobs in biomass electricity by 2020 .......................................... 26
Figure 16: Approximate UK employment in biomass electricity by 2020 ....................... 26
Figure 17: Employment sectors in anaerobic digestion plant development ................ 27
Figure 18: Survey results from anaerobic digestion plant developers............................ 28
Figure 19: Employment coefficients allowing for reduced contract terms ................... 29
Figure 20: Summary of employment coefficients used in final calculations ................. 30
Figure 21: Anaerobic digestion - range of projected operational capacity ............... 30
Figure 22: Findings for UK jobs in anaerobic digestion by 2020 ....................................... 30
Figure 23: Approximate UK employment in anaerobic digestion by 2020 .................... 31
Figure 24: Employment sectors in biomass heat plant development ............................ 31
Figure 25: Survey results from biomass heat plant developers ........................................ 32
Figure 26: Employment coefficients allowing for reduced contract terms ................... 33
Figure 27: Summary of employment coefficients used in final calculations ................. 33
Figure 28: Biomass heat - range of projected operational capacity (including CHP
heat) ........................................................................................................................................ 34
Figure 29: Findings for UK jobs in biomass heat by 2020 ................................................... 34

UK jobs in the bioenergy sectors by 2020, Page 9 of 43
Figure 30: Approximate UK employment in biomass heat by 2020 ................................ 34
Figure 31: Estimation of total UK jobs in the bioenergy sectors by 2020 ........................ 35
Figure 32: Estimation of total UK jobs in the biomass electricity sector by 2020 ........... 35
Figure 33: Estimation of total UK jobs in the anaerobic digestion sector by 2020 ........ 35
Figure 34: Estimation of total UK jobs in the biomass heat sector by 2020 .................... 36
Figure 35: Approximate UK employment in biomass electricity, heat and AD sectors
by 2020 .................................................................................................................................... 36
Figure 36: Summary of UK employment in biomass electricity, heat and AD sectors by
2020 ......................................................................................................................................... 38

UK jobs in the bioenergy sectors by 2020, Page 10 of 43
2 Acknowledgements
The author of this report would like to acknowledge the assistance of the following
stakeholders in providing information and comments on the work:
AHS Energy Forever Fuels
A-Consult Ltd Fre-Energy
Add Energy Future Biogas
Anglia Biofuels Gaia
Aspect Forestry GWE Biogas Ltd
AW Jenkinson Forest Products Hadfield Wood Recyclers
Barden Biomass Helius
Biogas Nord Job Earnshaw & Bros Ltd
Biogen Greenfinch KIRK Environmental
Biomass Power Marches Biogas
Bioplex MGT
Biowayste Midlands Bio Energy Ltd
Boomeco MT-Energie
Bowland Bioenergy NG Bailey
CLS Civil Engineering Ltd PBE Fuels Ltd.
Dalkia Bio Energy Ltd PlanET Biogastechnik
Drax PREL
Duffield Wood Pellets RES New Ventures Ltd
Eco2 RWE
EDF Energy Schmack Biogas
English Wood Fuels Ltd Sembcorp
Enpure Silvapower
Entech Biogas Gmbh Silvigen
EnviTec South East Woodfuels Ltd
Eon UPM Tilhill
EPRL UTS Biogas Ltd
Estover Energy WELtec
Farmatic WISE UK Engineering Ltd
FLI-Energy Xergi
UK jobs in the bioenergy sectors by 2020, Page 11 of 43
3 Introduction
The Renewable Energy Directive (RED) has set ambitious targets for renewable
energy generation by 2020. The UK is starting from a particularly low level of
renewable energy generation and will need to deploy all of its resources if these
targets are to be achieved. Biomass is seen as a major contributor to the delivery of
the 2020 targets for electricity and particularly for heat and transport fuels. However
there is a lack of reliable data on what benefits this potentially significant industry
could bring to the UK economy, and employment prospects in particular.
Similar studies have been undertaken in other renewables sectors, for example
offshore-wind, where numbers of jobs likely in this sector by 2020 have been
mapped, broken down by supply chain activity. A comparable analysis is required
for the bioenergy sector, to help understand the wider benefits to the economy,
over and above the energy generating potential and environmental impact.
3.1 Rationale
Although there are some relevant sources of such information, the data is yet to be
compiled and co-ordinated and the relevant data gaps filled. A more detailed
review was necessary to understand the employment opportunities the bioenergy
industry could offer the UK by 2020. This required a desk based study to research and
collate available statistics on the employment opportunities associated with a range
of different bioenergy plant. The data from this research could then be used
alongside modelling of the potential size of the industry in 2020 to quantify the
possible level of employment in bioenergy.
3.2 Objective
The primary objective of this study was to estimate the total number of jobs in the
biomass heat, biomass electricity, and anaerobic digestion sectors by 2020. These
technology groups were defined as follows:
Biomass heat = combustion of biomass feedstock to generate heat either
through stand-alone heat plant, combined heat and power, or district
heating.
Biomass electricity = combustion of biomass feedstock to generate electricity
either in dedicated biomass plant or in existing coal fired stations (co-firing or
conversion).
Anaerobic digestion = digestion of biomass feedstock with the final aim of
generating electricity, heat or producing biomethane to be injected into the
gas grid.

UK jobs in the bioenergy sectors by 2020, Page 12 of 43
NB: Advanced conversion technologies (gasification/pyrolysis) were excluded from
this study due to the lack of operational plants and hence unavailability of real
world data. (See 6.1)
Furthermore the study sought to disaggregate these total employment figures into
types of development activity, using the categories in Figure 3 below.
Figure 3: Project development activity categories to be used
4 Methodology
In order to achieve the objective of the study as set out in section 3.2, a
combination of the following three approaches was used:
1. Review existing research
2. Direct stakeholder engagement
3. Data analysis and modelling
1. Review existing research
Identify all previous studies and understand the methodology used and
scope
Highlight any gaps in the data collected
Obtain Excel versions of datasets where possible so that figures can be
extracted
2. Direct stakeholder engagement
Identify a list of biomass plant developers which could be consulted to gain
data on real-world projects, ideally covering plants of :
o range of scales,
o variety of feedstocks,
o both operating and in development.
Identify any consultants/trade bodies which could be consulted (these may
be involved in a number of projects with different developers and hence
could have more balanced and representative views)
Identify key questions to be answered by the developers and any relevant
contractors or consultants. These questions may include:
o Number of jobs in plant design/development
o Number of jobs in feedstock procurement and sourcing
o Number of jobs in plant manufacture and construction
Feedstock supply
Plant design and
development
Construction & commissioning
Plant operation

UK jobs in the bioenergy sectors by 2020, Page 13 of 43
o Number of permanent and/or contract jobs in operation
Contact the identified developers and trade bodies to obtain data on their
projects.
Clarify any unusual data through further contact and additional investigations
with the relevant project developer.
3. Data analysis and modelling
Analyse the data collected from previous studies and translate to a form
which can be compared with other data sources.
Collate all data from each developer and analyse to identify key trends,
and/or any anomalies in the results.
Derive employment coefficients for each project development activity.
Calculate total levels of employment for each technology.
5 Biomass employment research
This section details the findings from the research methodology outlined in section 4.
5.1 Review of existing resources
Web-based research was conducted in order to identify previous research into the
employment associated with bioenergy plant development and operation. Six key
studies were identified on this topic:
The Directory of UK Biomass Generation Plants 2010 – Enagri, September 2010
Quantification of employment from biomass power plants - Patricia Thornley
et a.l, November 2007
Biosynergy Integrated project, led by ECN in the Netherlands 2010
The economic value of the woodfuel industry to the UK economy by 2020,
Centre for Economics and Business Research, June 2010
An economic evaluation of current and prospective value to the north east
of England from biomass-related activities, Northwoods August 2008
Scoping study on the review of the manufacturing and engineering
capabilities for manufacture and supply of key plant components and
services for the biomass industry, Energy Institute, April 2009
The scope of each of these studies and their relevance to the objective of this
research are now outlined in turn.
5.1.1 Employment Statistics from The Directory of UK Biomass Generation
Plants 2010 – Enagri, September 2010 (1)
This database includes details of all the planned and operational biomass
plant in the UK, along with statistics on size, feedstock and estimates of the

UK jobs in the bioenergy sectors by 2020, Page 14 of 43
number of construction/operation/indirect jobs associated with each of the
plants.
The data relevant to this study (i.e. on jobs) has been extracted into a
spreadsheet and categorised by phase of development and UK region.
Figures are presented as total number of jobs and disaggregated into
construction, operation and indirect opportunities.
Limitations:
The data is incomplete and offers varying levels of detail for each installation. It is
difficult to break down by supply chain stage, so does not allow for data on number
of jobs involved in feedstock supply, for example, to be determined. It is also difficult
to extrapolate figures for ‘typical’ biomass installations.
5.1.2 Quantification of employment from biomass power plants - Patricia
Thornley et al., November 2007 (2)
This paper sought to quantify the expected employment impacts of individual
bioenergy developments.
The assessment includes agricultural labour growing energy crops (SRC and
Miscanthus), transport and processing of the feedstock, staffing at the
thermal conversion plant, employment within the equipment supply chain
and the induced employment impact.
Power only bioenergy systems were shown to typically create 1.27 man years
of employment per GWh electricity produced, regardless of technology or
scale of implementation.
CHP systems can create more than 2 man years of employment per GWh
electricity produced, although most of this enhanced economic impact can
be attributed to the fact that a comparative analysis per unit of electricity
produced ignores the heat output of the system.
Limitations:
The report highlights the fact that job displacement is not accounted for, in the
example of supplying feedstock, growing wheat involves more labour than growing
energy crops, therefore a number of jobs will be displaced if arable land is utilised.
The displacement factor is not included.
5.1.3 Biosynergy Integrated project, led by ECN in the Netherlands 2010 (3).
A set of spreadsheets based on statistical data from UN FAO and Eurostats
that dealt with wheat straw and forestry production.
Considered different biorefinery configurations fuelled by varying quantities of
either wheat straw and wood chips.

UK jobs in the bioenergy sectors by 2020, Page 15 of 43
Developed these for five contrasting European countries (UK, Spain, Poland,
Netherlands, Germany) and for each country the spreadsheets give figures
for total employment based on supply of a quantity of either of the
feedstocks specified by the user.
This includes figures for direct agricultural labour, feedstock processing,
transport (taking into account distances for increasing quantities of feedstock
demand and likely geographical location of feedstock production based on
existing agricultural patterns and previous work completed by JRC), staffing
patterns at a typical biorefinery facility (including unloading and dispatch
logistics for feedstocks and products), supply chain employment and induced
economic activity due to facility development.
Limitations:
This study is dealing with two specific feedstocks and supply chain routes, with
varying data from 5 EU countries; although the methodology is likely to be
transferable.
5.1.4 The economic value of the woodfuel industry to the UK economy by
2020, Centre for Economics and Business Research commissioned by
Forestry Commission June 2010 (4).
CEBR was appointed by the Forestry Commission to undertake a study to
determine the economic value of the woodfuel industry to the UK economy
by 2020 and how this will be divided between England, Wales, Scotland and
Northern Ireland.
Direct and indirect employment opportunities and GVA were established,
split by two levels of the supply chain; production and supply of wood fuels,
and the production and supply of woodfuel energy.
Study estimated that the woodfuel industry could generate over £1 billion of
gross value added (GVA) to the UK economy by 2020 through both direct
and indirect effects, which equates to: GVA / MW of installed capacity of
£200,000, which increases from £194,000 in 2010; and GVA / MWh of demand
for energy output of £97.20, which falls from £102.30 in 2010.
It also concluded that the industry could create or support 15,300 jobs in the
UK economy by 2020 also through direct and indirect effects, which equates
to: 2.9 jobs / MW of installed capacity in 2020, which increases from 4.0 in
2010; and 0.0014 jobs / MWh in 2020, which falls from 0.0021 in 2010.

UK jobs in the bioenergy sectors by 2020, Page 16 of 43
Figure 4: Outputs from CEBR research on woodfuel industry jobs in the UK (4)
2020 England Scotland Wales Northern
Ireland
GVA / MW of installed capacity £191,293 £282,841 £235,312 £193,862
Jobs / MW of installed capacity
(FTEs)
2.6 4.1 3.6 2.8
GVA / MWh of energy demand £86.50 £266.30 £100.30 £77.30
Jobs / MWh of energy demand
(FTEs)
0.0012 0.0039 0.0015 0.0011
A useful output from the study was the example woodfuel supply chain,
which can be found in Figure 5.
Figure 5: CEBR Woodfuel supply chain model (4)
Limitations:
The report excludes biofuels and biogas opportunities. The report only covers
biomass from standing forest sources, sawmill and other processing residues, and
arboricultural arisings. Energy crops, waste wood and imported biomass are
UK jobs in the bioenergy sectors by 2020, Page 17 of 43
excluded from the calculations, although the methodology is thought to be
transferable between feedstocks.
The potential loss of employment opportunities from other fuel supply sectors has not
been included; however the majority of fossil fuel is imported into the UK so this loss is
not expected to impact significantly on the UK domestic market.
5.1.5 An economic evaluation of current and prospective value to the north
east of England from biomass-related activities, Northwoods August
2008 (5).
Northwoods were commissioned to undertake a study of the value to the
north east economy from biomass related activities, and to attempt to
quantify predicted levels of activity and value at a future date, set as 2015.
This research was partly a contribution to the marketing activities of the
NEWHeat project.
This report aimed to highlight that current activity contributes a significant
amount to regional economic activity, and to demonstrate the potential
levels of economic activity which could be achieved – given the necessary
support – by 2015.
Showed that there are significant gaps in knowledge about how much
biomass from the region is supplied to the three largest users – Egger, Alcan
and Sembcorp – and this means that the value ascribed to the biomass
material itself may be an order of magnitude less than the true figure.
Therefore the figures in the report should be viewed as a conservative
estimate.
Limitations:
Have not attempted to quantify the employment benefits which arise as a result of a
thriving biomass sector, but existing studies indicate that in the region of 2,000 full
time jobs could be created in the region by 2015 if a strong level of support is
maintained.
Data only extrapolated to 2015, although methodology could be extended to
derive data to 2020.
5.1.6 Scoping study on the review of the manufacturing and engineering
capabilities for manufacture and supply of key plant components and
services for the biomass industry, Energy Institute, April 2009 (6).
The Energy Institute was asked by the Renewables Advisory Board to provide
a scoping study on the review of manufacturing and engineering capabilities
for manufacture and supply of key components and services for the biomass
industry.

UK jobs in the bioenergy sectors by 2020, Page 18 of 43
The report was written in the context of the UK plans for renewable
deployment by 2020 and in particular the substantial growth in biomass heat
and electricity production required to meet those targets.
This report was primarily a desk based review and covered the following
elements relevant to this jobs research:
Supply chain mapping and analysis of the main end uses of biomass
identified areas where there are currently UK based manufacturing and
engineering capabilities.
Drew conclusions on where there are gaps in current UK provision; including
manufacturing capability, skills shortages and management expertise.
Limitations:
The report only covers issues associated with solid biomass fuels; it does not cover
the production of liquid biomass for transportation (or power) or gaseous bioenergy
for input into the National Grid.
5.2 Survey of bioenergy industry stakeholders
In order to validate the data collected and conclusions drawn in the previous
studies outlined in section 5.1, a survey of relevant industry stakeholders was
conducted. The aim of this survey was to gather real-world data on the number of
full time positions required to develop and operate AD and solid biomass
combustion (for heat and/or power) plant.
Of the 87 stakeholders emailed, 24 responses were received; constituting a 28%
response rate. These stakeholder respondents comprised:
7 anaerobic digestion plant developers
8 biomass power developers
6 biomass fuel suppliers
3 biomass boiler installers
Details of the questions asked can be found in Annexes 1-3 and the outputs of the
survey are summarised in Section 6.
5.3 Data analysis and modelling
Once all survey responses had been received, the results were amalgamated and
averages calculated for the number of jobs associated with each of the
development activities i.e. plant development, construction, operation etc.
These average employment levels were then divided by the installed capacity of
the plant in question, in order to derive an ‘employment coefficient’ of full time
equivalent positions (FTE) per MWe. These employment coefficients could then be

UK jobs in the bioenergy sectors by 2020, Page 19 of 43
used alongside a theoretical total installed capacity to calculate total employment
in each of the technology sectors in 2020.
5.3.1 Technology deployment by 2020
As described above, one of the key assumptions used in the study was the level of
technology deployment by 2020. In order to prevent duplication NNFCC did not
attempt to model this level of deployment, but instead utilised projections provided
by DECC. These figures were extracted from analysis conducted for the UK
Renewable Energy Roadmap and are summarised in figures below.
Please note that only the ‘low’ and ‘high’ figures were provided by DECC; the
medium figures stated are simply the median of these two scenarios and were
extrapolated by NNFCC for the purpose of this report.
Figure 6: Possible biomass electricity deployment by 2020 (7)
Technology Installed capacity MWe Estimated generation
TWh (incl. CHP
where
appropriate)
LOW MED HIGH LOW MED HIGH
ACT 19 21 22 0.13 0.14 0.15
Bioliquids - - - - - -
Biomass
conversion
1,146 1,587 2,028 8.03 12.01 15.99
Biomass
dedicated
1,048 1,551 2,054 7.70 11.47 15.25
Co-firing 44 44 44 6.29 6.29 6.29
EfW 483 489 495 3.08 3.12 3.16
Landfill gas 708 708 708 4.09 4.09 4.09
Sewage gas 162 171 180 0.53 0.58 0.64
AD 320 450 579 2.09 3.04 3.99
Figure 6 shows the DECC projections for biomass electricity technology uptake by
2020. Clearly the most significant contribution, to both installed capacity and
generation, is predicted to come from solid biomass combustion either in new
dedicated plant, or in existing coal fired power stations.

UK jobs in the bioenergy sectors by 2020, Page 20 of 43
Figure 7: Possible biomass heat deployment by 2020 (7)
Technology Estimated generation
TWh (incl. CHP where
appropriate)
LOW MED HIGH
Liquid biofuels - - -
Biogas injection 3.00 4.64 6.28
Biomass boilers 23.30 28.06 32.82
Biomass DH 3.89 4.33 4.76
CHP 6.07 6.07 6.07
Figure 7 above shows the DECC projections for generation from biomass heat
technologies by 2020. Biomass boilers are seen to be the most significant contributor
to total heat generation, with much less generation expected from CHP, biomass
district heating and biogas injection.
It can be seen in the figures above that the data provided by DECC was split
between bioenergy heat and electricity technologies, using the categories outlined
in Figure 8 below.
Figure 8: DECC technology categories
Heat technologies Electricity
technologies
Liquid biofuels ACT
Biogas injection Bioliquids
Biomass boilers Biomass conversion
Biomass DH Biomass dedicated
CHP Co-firing
EfW
Landfill gas
Sewage gas
AD
For the purpose of this study it was deemed preferable to evaluate anaerobic
digestion separately from the other bioenergy technologies, to enable the
employment contributions from this sector to be calculated discretely.
The DECC deployment data relating to anaerobic digestion was disaggregated into
plant generating electricity and those injecting biogas to the grid for heat
generation. However in the timeframe for this study it was not possible to calculate
employment figures for biomethane injection separately. So the AD jobs were
calculated assuming that all AD plant generate electricity, whereas in reality some
will inject biomethane into the grid. Hence any additional jobs in this type of plant

UK jobs in the bioenergy sectors by 2020, Page 21 of 43
which exceed the number associated with electricity generation will not
be accounted for.
6 Bioenergy jobs by technology type
This section of the report outlines the number of jobs estimated to exist in each
bioenergy sector by 2020. It gives overall figures for each technology, a breakdown
for those in the heat and power sectors, and an indication of whereabouts in the
project development timeline they occur i.e.:
1. Feedstock production and supply
2. Project design, planning and development
3. Plant construction and commissioning
4. Plant operation
6.1 Biomass electricity
This section outlines the estimates for number of full time jobs that could exist in the
biomass electricity sector by 2020. For the purpose of this study this is defined as only
plant combusting solid biomass e.g. dedicated biomass plant, co-firing or
conversion (see section 3.2). Therefore the estimation of jobs derived here excludes
potential employment associated with liquid biomass combustion plant and
advanced conversion technologies1.
A key aim of the study was to separate the jobs into the project development
activity which they relate to. An indication of what these activity categories may
include for a biomass power project can be found in
Figure 9 below.
1NB: Although it was out of the scope of this study to estimate the number of jobs associated
with these technologies, the methodology and employment coefficients derived could
equally be applied to an estimated installed capacity from these technologies to calculate
a comparable number of jobs.

UK jobs in the bioenergy sectors by 2020, Page 22 of 43
Figure 9: Employment sectors in biomass electricity plant development
6.1.1 Employment coefficients
In order to estimate the labour requirement for each category of activity associated
with biomass plant deployment, a survey of biomass project developers was
conducted, as outlined in section section 5.2. Each developer was asked to provide
employment information based on one particular plant which they had recently
developed. A copy of the questions asked can be found in Annex 1.
The results from this survey were then amalgamated and averaged, in order to
derive approximate employment requirements per MWe of plant installed capacity.
A summary of these findings can be found in Figure 10.
These findings show that on average a biomass plant will require in the order of 290
full-time equivalent (FTE) employees, or an average of 14 FTE/MWe, with a large
Feedstock supply
Feedstock planting &
management
Feedstock harvesting
Feedstock processing
Feedstock haulage
Plant design and development
Selection of technology
provider
Site selection & planning
Plant design
Component procurement
Construction & commissioning
Site preparation
Plant construction
Plant commissioning
Handover
Plant operation
Feedstock procurement &
contracting
Plant maintenance
Health & safety
Staff and site management

UK jobs in the bioenergy sectors by 2020, Page 23 of 43
proportion of this employment occurring during the construction and commissioning
phase of plant development. It is worth noting however that the scale of the plant
will have an impact on the FTE per MWe. For example, doubling the scale of a plant
will not necessarily double the number of people employed, as efficiencies of
operation may reduce the number of FTE/MWe.
Figure 10: Survey results from biomass electricity plant developers
Sector TOTAL FTE during
relevant phase,
per project2
Average FTE
during
relevant
phase, per
MWe
Number of jobs in plant
design/development
11.00 0.94
Number of jobs in plant construction
and commissioning
224.50 12.32
Number of permanent jobs whilst in
operation
31.13 0.59
Number of contract jobs in operation
(e.g. periodic maintenance)
18.25 0.42
Number of jobs in feedstock
procurement and sourcing
2.08 0.20
TOTAL jobs 286.96 14.46
In order to check that the figures obtained were consistent with findings from
previous research, the FTE needed to operate the plant were compared to that
calculated by Patricia Thornley et al. in the research described in section 5.1.2. This
study concluded that 0.8FTE/MWe would be needed, compared to 0.59FTE/MWe
resulting from the industry survey. Clearly there is some difference in these two
figures, but due to the variables that have to be taken account of (combustion
technology used, scale of operation etc) the two figures can be said to be in broad
agreement and at the very least are the same order of magnitude.
2 i.e. how many full-time equivalent employees the plant will require during each phase of
development. These full time employees may not be required for the lifetime of the plant. For
example, 224.5 FTE employees may be needed during the construction phase, but this will
only cover approx 1-5 years.

UK jobs in the bioenergy sectors by 2020, Page 24 of 43
One important finding to note is that an average biomass electricity plant may
require approximately 200 FTE employees to construct and commission the plant.
However this level of employment will not be necessary throughout the lifetime of
the plant, rather it will peak during the initial construction phase and last up to a
maximum of 5 years (for large scale generation). As well as those in the construction
phase, employees associated with plant design and development are also unlikely
to be involved during the lifetime of the project, but instead for a shorter period
leading up to the commissioning of the plant.
Hence the contribution from these sectors to the figure for total jobs has been
reduced by a factor of 5, to account for the fact that these employees are likely to
move on to work on new projects roughly every 5 years (less for smaller scale plant)
assuming the lifetime of the plant to be approximately 25 years.
By reducing the average levels of employment to account for short development
and construction periods, the employment coefficients to be used in the total
employment in biomass electricity by 2020 analysis were calculated, see Figure 11.
Figure 11: Employment coefficients allowing for reduced contract terms
Sector Average FTE per
MWe
Number of jobs in plant design/development 0.19
Number of jobs in plant construction and
commissioning
2.46
Number of permanent jobs whilst in operation 0.59
Number of contract jobs in operation (e.g.
periodic maintenance)
0.08
Number of jobs in feedstock procurement and
sourcing
0.20
TOTAL jobs 3.52
In addition to the findings sourced from the industry survey regarding biomass
electricity plant, further data was needed to estimate the employment associated
with feedstock production. This was sourced from previous research carried out as
part of the Biosynergy Integrated project and CEBR’s study ‘The economic value of
the woodfuel industry to the UK economy by 2020’, as described in sections 5.1.3
and 5.1.4.
Data extracted from both of these studies was used to derive figures for the average
levels of employment needed to produce 1 oven dry tonne of biomass feedstock.
The findings from these calculations are summarised in Figure 12 below.
Figure 12: Employment associated with biomass feedstock production & processing
Feedstock FTE/odt

UK jobs in the bioenergy sectors by 2020, Page 25 of 43
SRC 0.000945
Miscanthus 0.000852
Straw 0.000438
Forestry 0.001341
Average 0.000894
By combining the coefficients derived in Figures 11 and 12, the final employment
coefficients to be used for calculating employment in 2020 were derived. These are
summarized in Figure 13.
Figure 13: Summary of employment coefficients used in final calculations
Development activity Employment
coefficient
Unit
Plant design/development 0.19 FTE/MWe
Construction and
commissioning
2.46 FTE/MWe
Operation & maintenance 0.87 FTE/MWe
Feedstock supply 0.000894 FTE/odt
6.1.2 Level of deployment in 2020
Once the employment coefficients for each activity had been calculated, these
could then be applied to the predicted installed capacity of biomass electricity
generation in 2020. These predictions of deployment of biomass electricity by 2020
were taken from DECC analysis as described in section 5.3.1 and are summarised in
Figure 14.
Figure 14: Biomass electricity - range of projected operational capacity (including
CHP)3
Low estimate MW 2,721
TWh 25.11
Central estimate MW 3,671
TWh 32.90
Upper estimate MW 4,621
TWh 40.68
3 Extracted from analysis for DECC’s ‘UK Renewable Energy Roadmap’, July 2011

UK jobs in the bioenergy sectors by 2020, Page 26 of 43
6.1.3 Jobs in biomass electricity
Finally, by using the employment coefficients and level of deployment, the total
number of UK jobs that may exist in the biomass electricity sector by 2020 were
calculated.
Figure 15: Findings for UK jobs in biomass electricity by 2020
Jobs, FTE
Scenario Installed
capacity MWe
Development Construction Operation &
maintenance
UK feedstock
supply4
TOTAL
Low 2,740 513 6,753 2,377 1,320 10,964
Medium 3,671 688 9,048 3,184 1,730 14,650
High 4,621 866 11,390 4,008 2,139 18,403
The results in Figure 15 and Figure 16 show that in the high uptake scenario the
biomass electricity sector has the potential to employ over 18,000 people by 2020,
with over half of these in the construction and engineering industry alone.
Figure 16: Approximate UK employment in biomass electricity by 2020
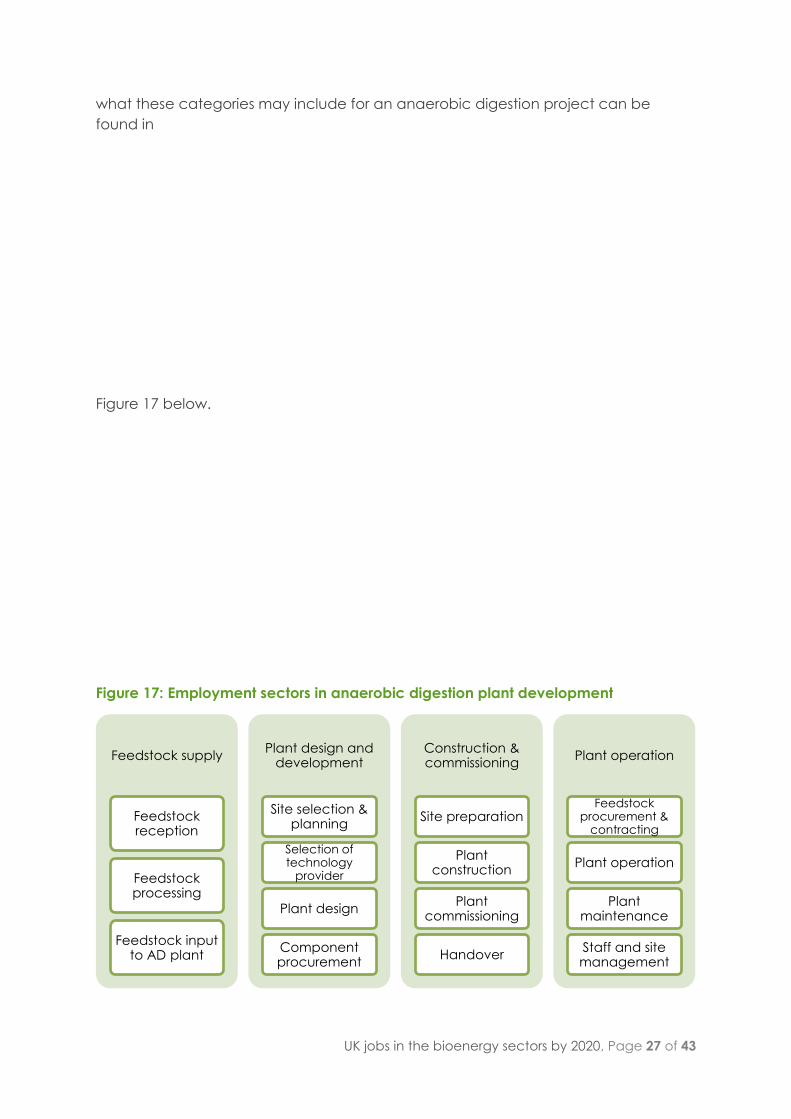
6.2 Anaerobic digestion
This section estimates the number of full time UK jobs that could exist in the
anaerobic digestion sector by 2020. A key aim of the study was to separate these
jobs into the project development activity which they relate to. An indication of
4 Note that these jobs are based on the biomass electricity sector using 90% imported fuel, 10% UK sourced.
0
5,000
10,000
15,000
20,000
Low Medium High
Ap
pro
xim
ate
nu
mb
er
of
job
s UK Feedstock
production/supply
Operation &
maintenance
Construction
Development
UK jobs in the bioenergy sectors by 2020, Page 27 of 43
what these categories may include for an anaerobic digestion project can be
found in
Figure 17 below.
Figure 17: Employment sectors in anaerobic digestion plant development
Feedstock supply
Feedstock reception
Feedstock processing
Feedstock input to AD plant
Plant design and development
Site selection & planning
Selection of technology
provider
Plant design
Component procurement
Construction & commissioning
Site preparation
Plant construction
Plant commissioning
Handover
Plant operation
Feedstock procurement &
contracting
Plant operation
Plant maintenance
Staff and site management

UK jobs in the bioenergy sectors by 2020, Page 28 of 43
6.2.1 Employment coefficients
In order to estimate the labour requirement in each section of AD plant deployment,
a survey of project developers was conducted. Each developer was asked to
provide employment information based on one particular plant which they had
recently developed. A copy of the questions asked can be found in Annex 1.
The results of these surveys were then amalgamated and averaged, in order to
derive approximate employment requirements per MWe of plant installed capacity.
A summary of these findings can be found in Figure 18.
Figure 18: Survey results from anaerobic digestion plant developers
Sector TOTAL FTE
during relevant
phase,
per project5
Average FTE
during
relevant
phase, per
MWe
Number of jobs in plant
design/development
3.00 2.12
Number of jobs in plant construction and
commissioning
12.83 11.84
Number of permanent jobs whilst in 1.61 2.21
5 i.e. how many full-time equivalent employees will the plant require during each phase of
development. These full time employees may not be required for the lifetime of the plant. For
example, 224.5 FTE employees may be needed during the construction phase, but this will
only cover approx 1-5 years.

UK jobs in the bioenergy sectors by 2020, Page 29 of 43
operation
Number of contract jobs in operation
(e.g. periodic maintenance)
3.49 1.43
Number of jobs in feedstock procurement
and sourcing
1.14 0.50
TOTAL jobs 22.07 18.10
These findings show that on average an AD plant will require in the order of 22 full-
time equivalent (FTE) employees, or an average of 18 FTE/MWe. This ratio is clearly
quite high, and demonstrates the relatively small scale (<1 MWe) of an average AD
plant.
As explained for the calculations for biomass electricity plant, it is important to note
that the level of employment necessary for the construction and commissioning of
the plant will not be sustained throughout the lifetime of the plant. Rather it will peak
during the initial construction phase, which for AD has been assumed to be up to a
maximum of 2 years. Similarly, employees associated with plant design and
development are also unlikely to be involved during the lifetime of the project, but
instead for a shorter period leading up to the commissioning of the plant.
Hence the contribution from these sectors to the figure for total jobs has been
reduced to account for the fact that these employees are likely to move on to work
on new projects roughly every 2 years (less for smaller scale plant).
By reducing the average levels of employment to account for short development
and construction periods, the employment coefficients to be used in the total
employment in biomass electricity by 2020 analysis were calculated, see Figure 19.
NB: The survey requested developers to estimate the number of contract jobs
associated with periodic maintenance of the plant as ‘full time equivalent’ posts.
However most respondents did not use these units and so the figures have been
reduced using the assumption that each full time contract worker can be
responsible for maintaining the equivalent of 10 AD plants.
Figure 19: Employment coefficients allowing for reduced contract terms
Sector Average FTE per
MWe
Number of jobs in plant design/development 0.21
Number of jobs in plant construction and
commissioning
1.18
Number of permanent jobs whilst in operation 2.21
Number of contract jobs in operation (e.g.
periodic maintenance)
0.14
Number of jobs in feedstock procurement and
sourcing
0.50

UK jobs in the bioenergy sectors by 2020, Page 30 of 43
TOTAL jobs 4.24
The final employment coefficients to be used for calculating employment in 2020
were then derived, these are summarised in Figure 20.
Figure 20: Summary of employment coefficients used in final calculations
Development activity Employment
coefficient
Unit
Plant design/development 0.21 FTE/MWe
Construction and
commissioning
1.18 FTE/MWe
Operation & maintenance 2.35 FTE/MWe
Feedstock supply 0.50 FTE/MWe
6.2.2 Level of deployment in 2020
In order to estimate the number of jobs, the likely level of installed capacity first had
to be estimated. As before this was taken from DECC analysis as described in
section 5.3.1. However the raw figures from the DECC work had to be adjusted to
be comparable with the technology categories used in this study. The adjusted
figures used for AD deployment in 2020 are shown below.
Figure 21: Anaerobic digestion - range of projected operational capacity
Low estimate 320 MWe
Central estimate 450 MWe
Upper estimate 579 MWe
6.2.3 Jobs in anaerobic digestion
Finally, by using the employment coefficients and level of deployment, the total
number of jobs that may exist in the sector by 2020 were calculated.
Figure 22: Findings for UK jobs in anaerobic digestion by 2020
Jobs, FTE
Scenario Installed
capacity MWe
Development Construction Operation &
maintenance
UK feedstock
supply
TOTAL
Low 320 68 379 752 160 1,358
Medium 450 95 532 1,056 224 1,908
High 579 123 686 1,360 289 2,457

UK jobs in the bioenergy sectors by 2020, Page 31 of 43
The results in Figure 22 and Figure 23 show that the anaerobic digestion sector has
the potential to employ up to 2,500 people by 2020, with over half of these in regard
to operation and maintenance of the plant.
Figure 23: Approximate UK employment in anaerobic digestion by 2020
6.3 Biomass heat
This section estimates the number of full time UK jobs that could exist in the biomass
heat sector by 2020; including stand alone biomass boilers, biomass district heating
and CHP. A key aim of the study was to separate these jobs into the project
development activity which they relate to. An indication of what these categories
may include for a biomass heat project can be found in Figure 24 below.
Figure 24: Employment sectors in biomass heat plant development
0
500
1,000
1,500
2,000
2,500
Low Medium High
Ap
pro
xim
ate
nu
mb
er
of
job
s
UK Feedstock
production/supply
Operation &
maintenance
Construction
Development

UK jobs in the bioenergy sectors by 2020, Page 32 of 43
6.3.1 Employment coefficients
In order to estimate the labour requirement in each section of biomass heat plant
deployment, a survey of project developers was conducted, as outlined in section
5.2. Each boiler installer was asked to provide employment information based on
one particular plant which they had recently developed. A copy of the questions
asked can be found in Annex 1.
The results of these surveys were then amalgamated and averaged, in order to
derive approximate employment requirements per MWth of plant installed capacity.
A summary of these findings can be found in Figure 25.
Figure 25: Survey results from biomass heat plant developers
Sector TOTAL FTE during
relevant phase, per
project
Number of jobs in plant design/development 2.00
Number of jobs in feedstock procurement and sourcing 1.49
Number of jobs in plant construction and
commissioning
1.28
Number of contract jobs in operation (e.g. periodic
maintenance)
0.50
Number of jobs in feedstock procurement and sourcing 0.10
TOTAL jobs 5.36
These findings show that on average a biomass heat plant will require 5 FTE/MWth,
with a high proportion of these jobs being in plant design and development.
However, it should be noted that the survey was relatively modest in size (87
Feedstock supply
Feedstock planting &
management
Feedstock harvesting
Feedstock processing
Feedstock haulage
Plant design and development
Heat demand assessment
Site assessment (spatial and
logistics)
Boiler system design
Boiler procurement
Construction & commissioning
Boiler house and/or site
preparation
Boiler house construction
Boiler installation and commissioning
Handover and training of operatives
Plant operation
Feedstock procurement &
contracting
Boiler maintenance
Health & safety
Staff and site management
UK jobs in the bioenergy sectors by 2020, Page 33 of 43
stakeholders were contacted; with 24 responses received) and although a relatively
good response rate of 28% was achieved, the biomass heat industry was
underrepresented in the final dataset obtained. As a result the conclusions for
potential employment in this sector will be less robust than those for the other
technology groups.
As explained for the calculations for the previous technologies, it is important to note
that the level of employment necessary for the construction and commissioning of
the plant will not be sustained throughout the lifetime of the plant. Rather it will peak
during the initial construction phase, which for biomass heat has been assumed to
be up to a maximum of 2 years but in most cases will be much less. Similarly,
employees associated with plant design and development are also unlikely to be
involved during the lifetime of the project, but instead for a shorter period leading up
to the commissioning of the plant.
Hence the contribution from these sectors to the figure for total jobs has been
reduced to account for the fact that these employees are likely to move on to work
on new projects roughly every 2 years (less often for larger scale plant).
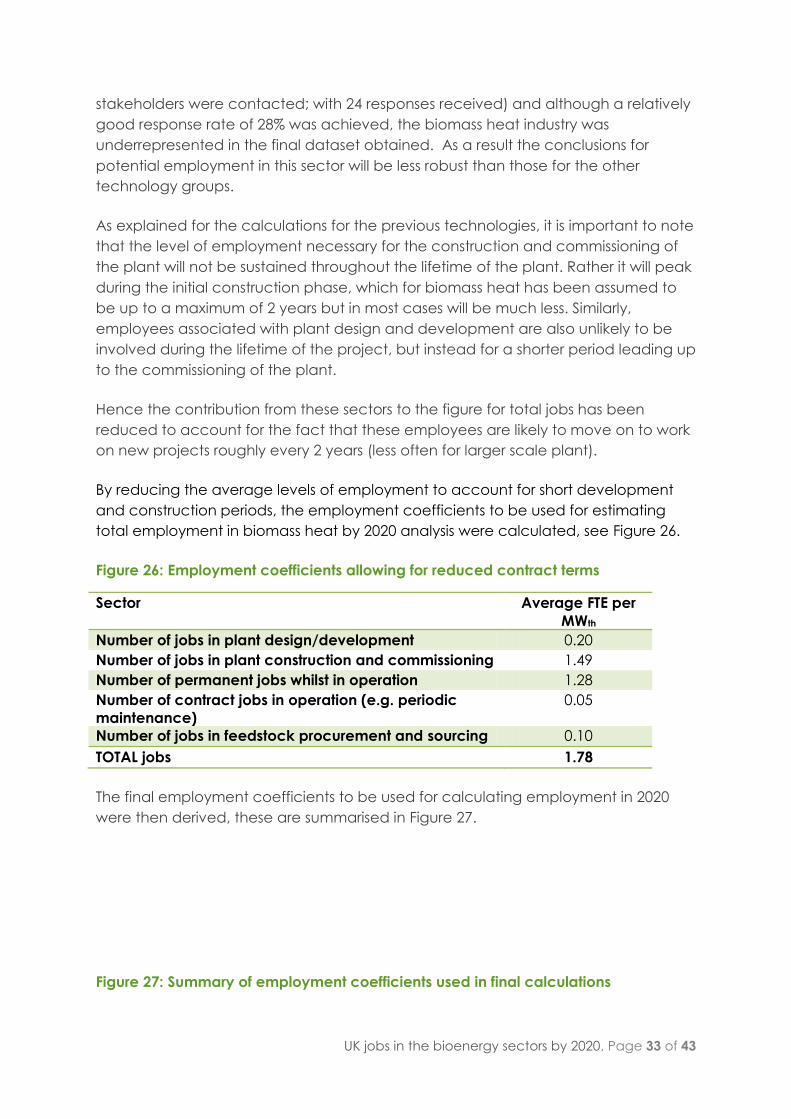
By reducing the average levels of employment to account for short development
and construction periods, the employment coefficients to be used for estimating
total employment in biomass heat by 2020 analysis were calculated, see Figure 26.
Figure 26: Employment coefficients allowing for reduced contract terms
Sector Average FTE per
MWth
Number of jobs in plant design/development 0.20
Number of jobs in plant construction and commissioning 1.49
Number of permanent jobs whilst in operation 1.28
Number of contract jobs in operation (e.g. periodic
maintenance)
0.05
Number of jobs in feedstock procurement and sourcing 0.10
TOTAL jobs 1.78
The final employment coefficients to be used for calculating employment in 2020
were then derived, these are summarised in Figure 27.
Figure 27: Summary of employment coefficients used in final calculations

UK jobs in the bioenergy sectors by 2020, Page 34 of 43
Development activity Employment
coefficient
Unit
Plant design/development 0.20 FTE/MWth
Construction and
commissioning
1.49 FTE/MWth
Operation & maintenance 1.33 FTE/MWth
Feedstock supply 0.000984 FTE/odt
6.3.2 Level of deployment in 2020
In order to estimate the number of jobs, the likely level of installed capacity first had
to be estimated. As before this was taken from DECC analysis. However the raw
figures from this work had to be adjusted to be comparable with the technology
categories used in this study. The adjusted figures used for biomass heat
deployment in 2020 are shown below.
Figure 28: Biomass heat - range of projected operational capacity (including CHP
heat)
Low estimate 6,327 MW
33.26 TWh
Central estimate 7,316 MW
38.45 TWh
Upper estimate 8,304 MW
43.65 TWh
6.3.3 Jobs in biomass heat
Finally, by using the employment coefficients and level of deployment, the total
number of jobs that may exist in the sector by 2020 were calculated.
Figure 29: Findings for UK jobs in biomass heat by 2020
Jobs, FTE
Scenario Installed capacity
MWth
Development Construction Operation &
maintenance
UK feedstock
supply6
TOTAL
Low 6,327 1,263 9,427 8,408 3,498 22,596
Medium 7,316 1,461 10,900 9,721 4,044 26,126
High 8,304 1,658 12,373 11,035 4,591 29,657
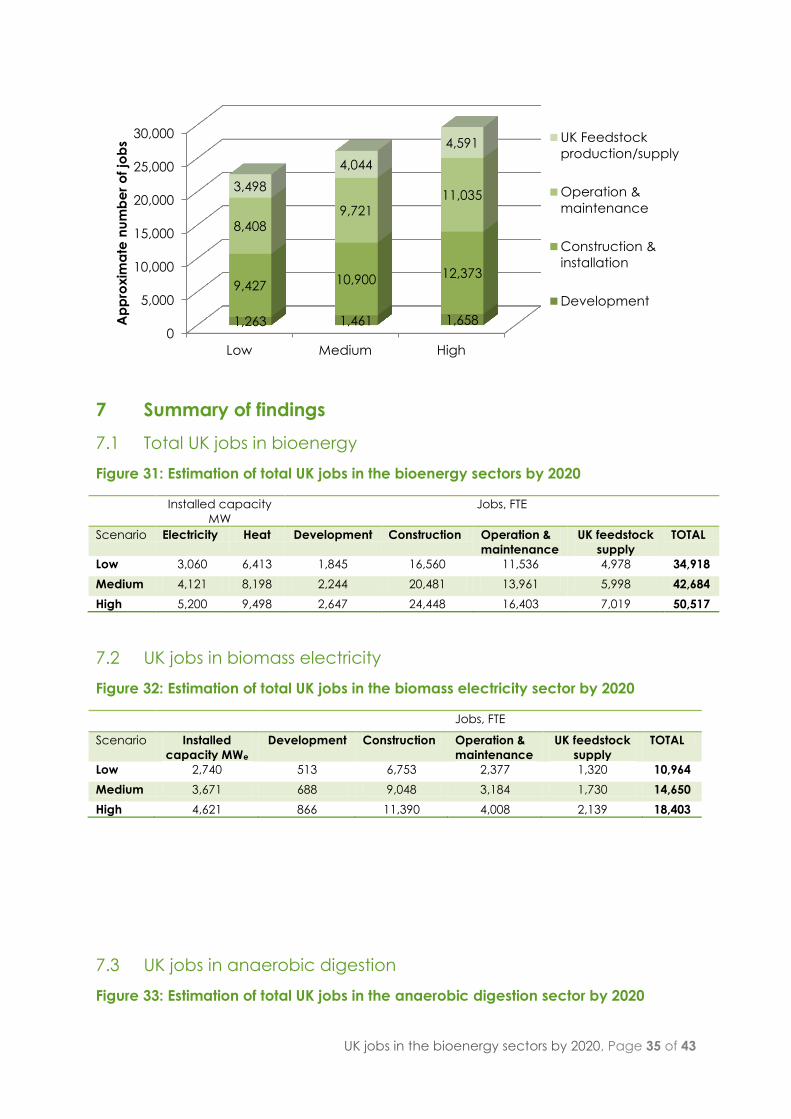
The results in Figures 29 and 30 show that the biomass heat sector has the potential
to employ up to 30,000 people by 2020, with the largest proportion of these roles
relating to construction (installation) and commissioning of the plant.
Figure 30: Approximate UK employment in biomass heat by 2020
6 Note that these jobs are based on the biomass heat sector using 50% imported fuel, 50% UK sourced.
UK jobs in the bioenergy sectors by 2020, Page 35 of 43
7 Summary of findings
7.1 Total UK jobs in bioenergy
Figure 31: Estimation of total UK jobs in the bioenergy sectors by 2020
Installed capacity
MW
Jobs, FTE
Scenario Electricity Heat Development Construction Operation &
maintenance
UK feedstock
supply
TOTAL
Low 3,060 6,413 1,845 16,560 11,536 4,978 34,918
Medium 4,121 8,198 2,244 20,481 13,961 5,998 42,684
High 5,200 9,498 2,647 24,448 16,403 7,019 50,517
7.2 UK jobs in biomass electricity
Figure 32: Estimation of total UK jobs in the biomass electricity sector by 2020
Jobs, FTE
Scenario Installed
capacity MWe
Development Construction Operation &
maintenance
UK feedstock
supply
TOTAL
Low 2,740 513 6,753 2,377 1,320 10,964
Medium 3,671 688 9,048 3,184 1,730 14,650
High 4,621 866 11,390 4,008 2,139 18,403
7.3 UK jobs in anaerobic digestion
Figure 33: Estimation of total UK jobs in the anaerobic digestion sector by 2020
0
5,000
10,000
15,000
20,000
25,000
30,000
Low Medium High
1,263 1,461 1,658
9,427 10,900 12,373
8,408 9,721
11,035 3,498
4,044
4,591
Ap
pro
xim
ate
nu
mb
er
of
job
s UK Feedstock
production/supply
Operation &
maintenance
Construction &
installation
Development

UK jobs in the bioenergy sectors by 2020, Page 36 of 43
Jobs, FTE
Scenario Installed
capacity MWe
Development Construction Operation &
maintenance
UK feedstock
supply
TOTAL
Low 320 68 379 752 160 1,358
Medium 450 95 532 1,056 224 1,908
High 579 123 686 1,360 289 2,457
7.4 UK jobs in biomass heat
Figure 34: Estimation of total UK jobs in the biomass heat sector by 2020
Jobs, FTE
Scenario Installed
capacity MWth
Development Construction Operation &
maintenance
UK feedstock
supply
TOTAL
Low 6,327 1,263 9,427 8,408 3,498 22,596
Medium 7,316 1,461 10,900 9,721 4,044 26,126
High 8,304 1,658 12,373 11,035 4,591 29,657
8 Conclusions
The evaluation of potential levels of UK employment in the bioenergy sectors in this
report highlights that there are significant opportunities for the UK, and that the
economy is likely to benefit considerably from deployment of bioenergy. However
the finite number of people employed in the sector will be highly dependent upon
the level of uptake of the technologies and the supply chain structures used.
The methodology used in this study was partially dependent upon the outputs of an
industry survey, which gathered real employment data from a range of planned
and operational biomass plant. It is worth observing that this survey was relatively
modest in size (87 stakeholders were contacted; with 24 responses received) and
although a relatively good response rate of 28% was achieved, the biomass heat
industry was underrepresented in the final dataset obtained. As a result the
conclusions for potential employment in this sector will be less robust than those for
the other technology groups.
Figure 35: Approximate UK employment in biomass electricity, heat and AD sectors
by 2020

UK jobs in the bioenergy sectors by 2020, Page 37 of 43
Figure 35 above shows that the majority of jobs in bioenergy are likely to be
technical roles, primarily in the engineering and construction sectors, required during
both the construction and operation phase of new bioenergy plant.
In addition to this there are clear employment opportunities for the UK biomass
supply sector; including roles in feedstock production, harvesting, processing and
haulage. However the size of this industry is highly dependent upon the origin of
feedstocks used, most notably whether the industry uses predominantly UK
indigenous resources or imported material. Coupled with this, there is also significant
uncertainty in the labour intensity of this sector as supply chain structures can vary
considerably. For example, if a feedstock is used in its raw form within 20 miles of
where it is grown then far fewer people will be employed than if it was processed
intensively and/or transported 200 miles to the end user.
Therefore although the figures derived in this study can give a useful indication of
the level of employment opportunities in the UK bioenergy sectors, the discrete
figures quoted have a considerable degree of uncertainty attached to them and
hence should be used cautiously.
0
10,000
20,000
30,000
40,000
50,000
Low Medium High
1,845 2,244 2,647
16,560 20,481
24,448
11,536
13,961
16,403
4,978
5,998
7,019
Ap
pro
xim
ate
nu
mb
er
of
job
s
UK Feedstock supply
Operation &
maintenance
Construction &
installation
Development

UK jobs in the bioenergy sectors by 2020, Page 38 of 43
To further improve the accuracy of the employment projections, NNFCC would
recommend the following additional work:
Conduct a wider industry survey covering a range of technologies,
feedstocks and scales in order to test and hopefully validate the employment
coefficients used in the model.
Perform more detailed analysis of likely supply chain structures, projections of
feedstock types used and actual efficiencies of operational plant in order to
refine the deployment scenarios in the model and increase the sophistication
of the calculations.
Figure 36: Summary of UK employment in biomass electricity, heat and AD sectors
by 2020
Installed capacity
MW
Jobs, FTE
Scenario Electricity Heat Development Construction Operation &
maintenance
UK feedstock
supply
TOTAL
Low 3,060 6,413 1,845 16,560 11,536 4,978 34,918
Medium 4,121 8,198 2,244 20,481 13,961 5,998 42,684
High 5,200 9,498 2,647 24,448 16,403 7,019 50,517

UK jobs in the bioenergy sectors by 2020, Page 39 of 43
9 Annex 1 - Questionnaire for biomass plant developers
For one specific project you are developing, please answer the following
1. Plant information
i What is the name and/or location of the plant?
ii What technology option(s) will be used (e.g. boiler, steam turbine, engine, gasifier, gas turbine, AD)
iii What size is the plant (MWe and/or MWth)
iv What is its predicted output (MWh/GWh)
v Typical overall efficiency % (either to elec only or CHP, depending upon technology)
vi What feedstock does it use and where do you source it from (UK region/import)?
vii How much feedstock will be used per annum (odt)?
For the same project specified above, estimate the employees as follows
2. Plant specific employment information, quote in FTE (full time equivalent) or in full 'man-days'
i Number of jobs in plant design/development
ii Number of jobs in feedstock procurement and sourcing
iii Number of jobs in plant construction and commissioning
iv Number of permanent jobs whilst in operation
v Number of contract jobs in operation (e.g. periodic maintenance)
vi Other
Please estimate the number of employees required on an average plant per MWe
3. General employment requirements
i Number of jobs in plant design/development per MWe
ii Number of jobs in feedstock procurement and sourcing per MWe
iii Number of jobs in plant construction and commissioning per MWe
iv Number of permanent jobs whilst in operation per MWe
v Number of contract jobs in operation (e.g. periodic maintenance) per MWe
vi Other per MWe

UK jobs in the bioenergy sectors by 2020, Page 40 of 43
10 Annex 2 - Questionnaire for biomass fuel suppliers
For your business please answer the following
1. Company information
i What is the name and location of your company?
ii What feedstock(s) do you take in? e.g. small roundwood, SRC, waste wood
Feedstock 1:
Feedstock 2:
Feedstock 3:
iii
What quantity of each fuel do you produce per year? e.g. woodchip, pellet, SRC (specify
moisture content)
Feedstock 1:
Feedstock 2:
Feedstock 3:
iv
What sector do you sell this fuel into? e.g. local heat market, power station, other (please
specify)
v How long have you been involved in the sector?
vi
What is the labour required (in man-days) within your operations to process 1 tonne (state MC)
of fuel?
For your business, please estimate the number of people you employ
2. Employment information, please quote in FTE (full time equivalent) or in full 'man-days'
i Total number of people employed
ii Number of jobs in equipment operation
iii Number of jobs in feedstock procurement and sourcing
iv Number of jobs in office management/administration
v Number of contract jobs in operation (e.g. periodic maintenance)
vi Other

UK jobs in the bioenergy sectors by 2020, Page 41 of 43
11 Annex 3 - Questionnaire for biomass boiler installers
For one specific project you are developing, please answer the following
1. Plant information
i What is the name and/or location of the boiler?
ii. What size is the boiler (MWth)
iii. What is its predicted output (MWh) or load factor (XX%)
iv. Typical overall efficiency %
v. What feedstock does it use and where do you source it from (UK region/import)?
vi. How much feedstock will be used per annum (odt)?
For the same project specified above, please estimate the employees required in its design
and operation as follows
2.
Plant specific employment information, please quote in FTE (full time equivalent) or in full
'man-days'
i Number of jobs in project development and design
ii Number of jobs in boiler installation and commissioning
iii Number of permanent jobs whilst in operation (e.g. any full-time boiler operatives)
iv Number of contract jobs in operation (e.g. periodic maintenance)
v Other
For your business, please estimate the number of people you employ
3. Employment information, please quote in FTE (full time equivalent) or in full 'man-days'
i Total number of people employed
ii Number of jobs in project development and design
iii Number of jobs in boiler installation and commissioning
iv Number of jobs in boiler operation and maintenance
v Total capacity of all boilers installed by company in the last year (MWth)
v Other

UK jobs in the bioenergy sectors by 2020, Page 42 of 43
12 References
1. EnAgri. UK Biomass Directory. 2012. www.ukbiomassdirectory.enagri.info.
2. Quantification of employment from biomass power plants. Thornley, P, Rogers, J
and Huang, Ye. Renewable Energy, 2008, Vol. 33 (8), pp. 1922-1927.
3. Thornley, P. Personal Communication. 2011.
4. CEBR. Report for the Forestry Commission. The economic value of the woodfuel
industry to the UK economy by 2020. 2010.
5. Northwoods. A study for the Forestry Commission, north east region, and for the
NEWHeat programme of One NorthEast. An economic evaluation of current and
prospective value to the north east of England from biomass-related activities. 2008.
http://www.ruraldevelopment.org.uk/files/rdi/BiomassValue_northeast_1.pdf.
6. The Energy Institute. Scoping Study on the review of the manufacturing and
engineering capabilities for manufacture and supply of key plant components and
services for the biomass industry. 2009. www.energyinst.org/home.
7. Department of Energy and Climate Change. UK's Renewable Energy Roadmap.
2011.
www.decc.gov.uk/en/content/cms/meeting_energy/renewable_ener/re_roadmap
/re_roadmap.aspx .

NNFCC
NNFCC is a leading international consultancy with expertise on the conversion of
biomass to bioenergy, biofuels and bio-based products.
NNFCC, Biocentre, Phone: +44 (0)1904 435182
York Science Park, Fax: +44 (0)1904 435345
Innovation Way, E: [email protected]
Heslington, York, Web: www.nnfcc.co.uk
YO10 5DG.