Drax Group plc Annual report and accounts 2012...02 Drax Group plc Annual report and accounts 2012...
140
Our transformation continues… Drax Group plc Annual report and accounts 2012
Transcript of Drax Group plc Annual report and accounts 2012...02 Drax Group plc Annual report and accounts 2012...
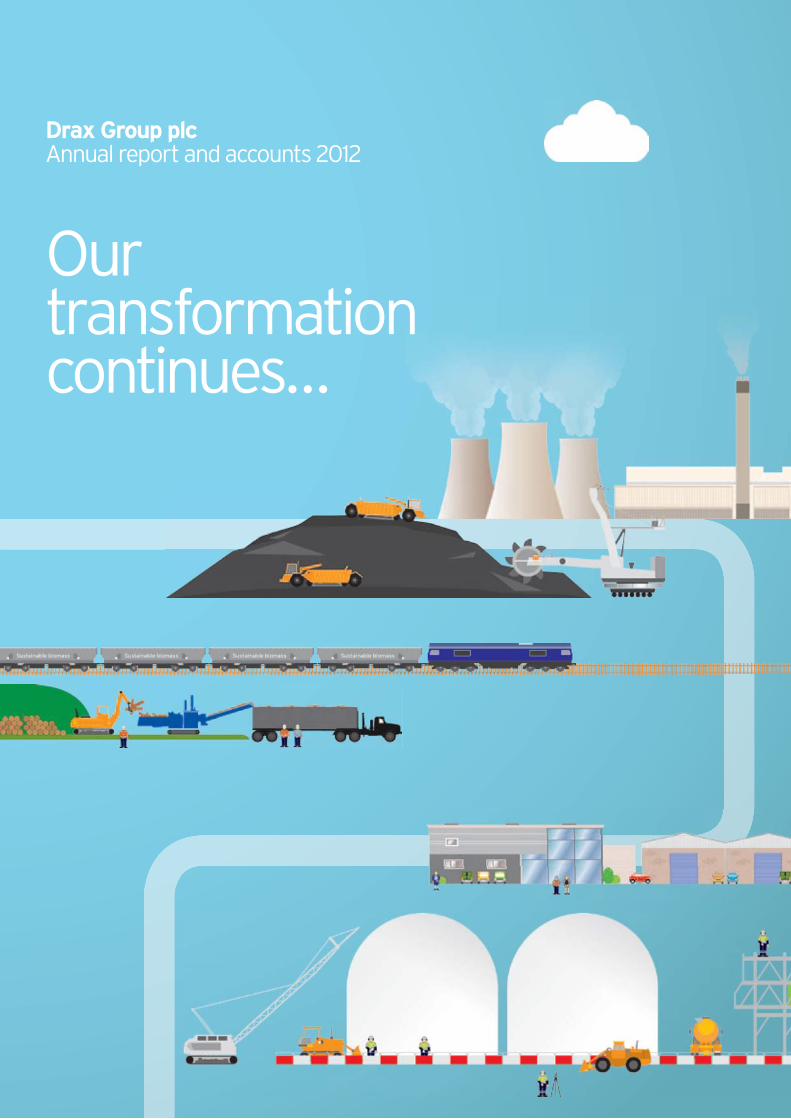
Our transformation continues…
Drax Group plc Annual report and accounts 2012
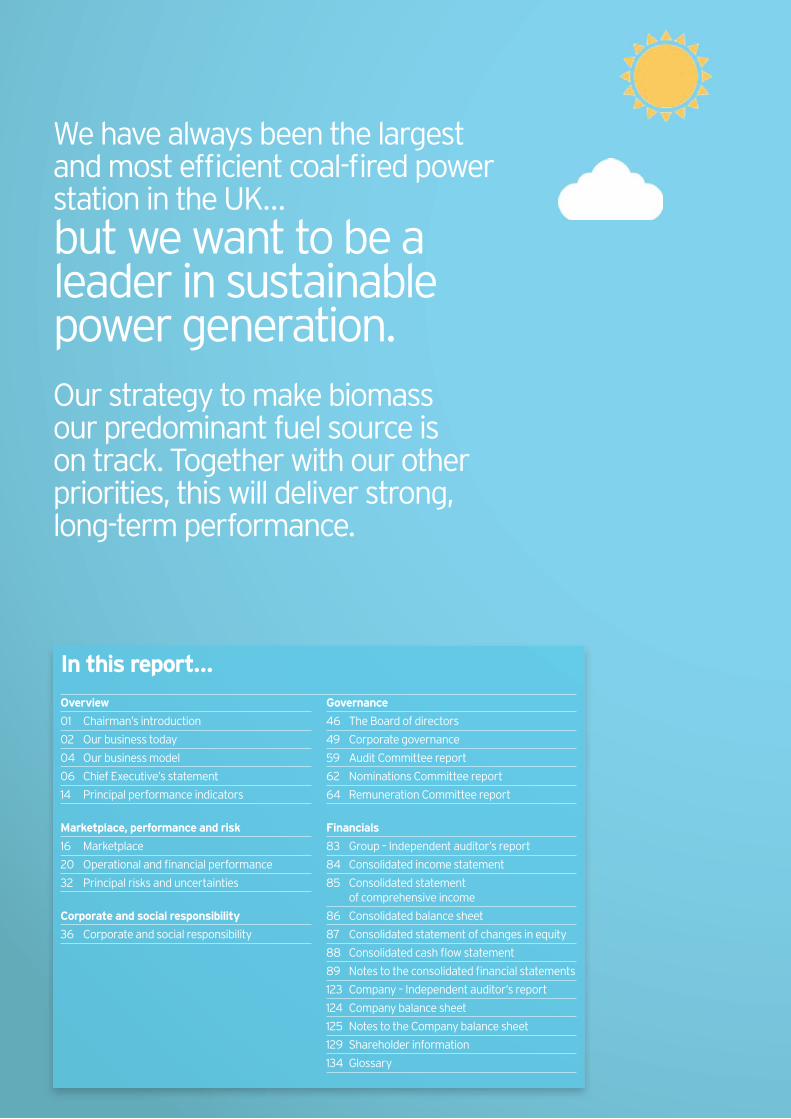
We have always been the largest and most efficient coal-fired power station in the UK… but we want to be a leader in sustainable power generation. Our strategy to make biomass our predominant fuel source is on track. Together with our other priorities, this will deliver strong, long-term performance.
Overview
01 Chairman’s introduction
02 Our business today
04 Our business model
06 Chief Executive’s statement
14 Principal performance indicators
Marketplace, performance and risk
16 Marketplace
20 Operational and financial performance
32 Principal risks and uncertainties
Corporate and social responsibility
36 Corporate and social responsibility
Governance
46 The Board of directors
49 Corporate governance
59 Audit Committee report
62 Nominations Committee report
64 Remuneration Committee report
Financials
83 Group – Independent auditor’s report
84 Consolidated income statement
85 Consolidated statement of comprehensive income
86 Consolidated balance sheet
87 Consolidated statement of changes in equity
88 Consolidated cash flow statement
89 Notes to the consolidated financial statements
123 Company – Independent auditor’s report
124 Company balance sheet
125 Notes to the Company balance sheet
129 Shareholder information
134 Glossary
In this report…
01Drax Group plcAnnual report and
accounts 2012
Ove
rvie
wM
arke
tpla
ce, p
erfo
rman
ce a
nd r
isk
Cor
pora
te a
nd s
ocia
l res
pons
ibili
tyG
over
nanc
eFi
nanc
ials
We have long believed that generating electricity from sustainable biomass has great potential and that it should have an important role as a low carbon, cost-effective and reliable renewable technology in the future energy mix of the UK. We are determined that Drax should be a leading provider of this attractive renewable power for the UK.
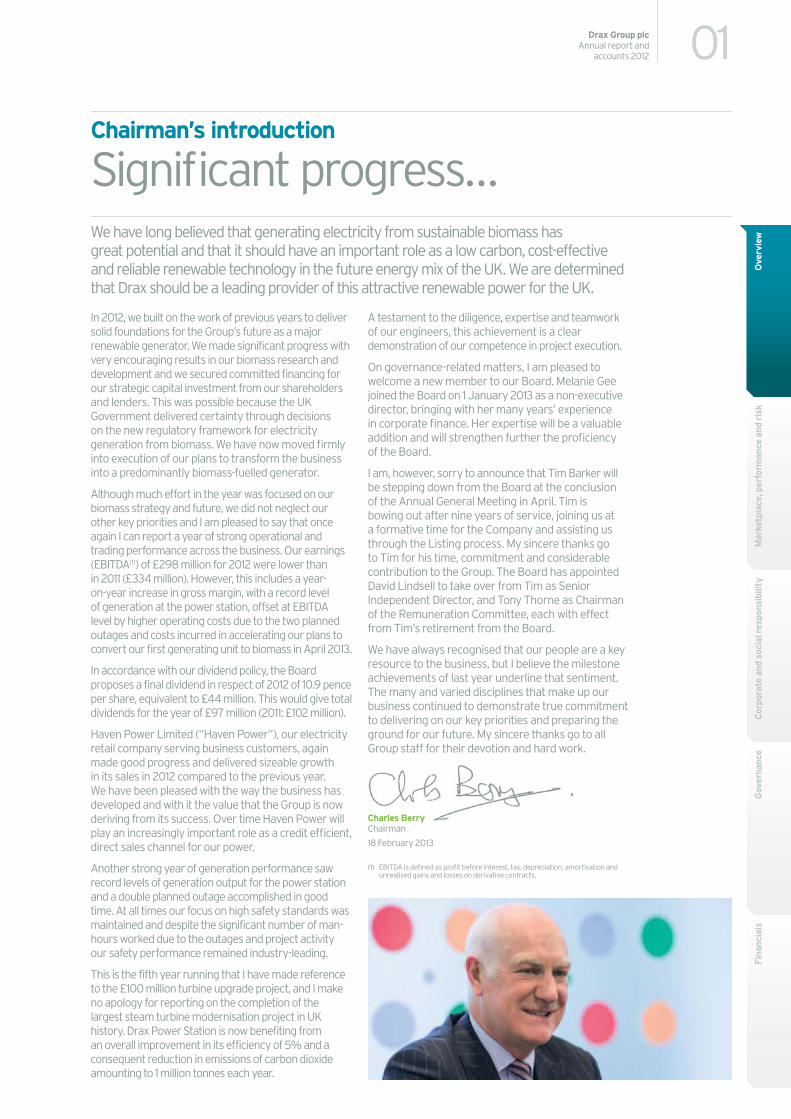
Chairman’s introduction
Significant progress…
In 2012, we built on the work of previous years to deliver solid foundations for the Group’s future as a major renewable generator. We made significant progress with very encouraging results in our biomass research and development and we secured committed financing for our strategic capital investment from our shareholders and lenders. This was possible because the UK Government delivered certainty through decisions on the new regulatory framework for electricity generation from biomass. We have now moved firmly into execution of our plans to transform the business into a predominantly biomass-fuelled generator.
Although much effort in the year was focused on our biomass strategy and future, we did not neglect our other key priorities and I am pleased to say that once again I can report a year of strong operational and trading performance across the business. Our earnings (EBITDA(1)) of £298 million for 2012 were lower than in 2011 (£334 million). However, this includes a year-on-year increase in gross margin, with a record level of generation at the power station, offset at EBITDA level by higher operating costs due to the two planned outages and costs incurred in accelerating our plans to convert our first generating unit to biomass in April 2013.
In accordance with our dividend policy, the Board proposes a final dividend in respect of 2012 of 10.9 pence per share, equivalent to £44 million. This would give total dividends for the year of £97 million (2011: £102 million).
Haven Power Limited (“Haven Power”), our electricity retail company serving business customers, again made good progress and delivered sizeable growth in its sales in 2012 compared to the previous year. We have been pleased with the way the business has developed and with it the value that the Group is now deriving from its success. Over time Haven Power will play an increasingly important role as a credit efficient, direct sales channel for our power.
Another strong year of generation performance saw record levels of generation output for the power station and a double planned outage accomplished in good time. At all times our focus on high safety standards was maintained and despite the significant number of man-hours worked due to the outages and project activity our safety performance remained industry-leading.
This is the fifth year running that I have made reference to the £100 million turbine upgrade project, and I make no apology for reporting on the completion of the largest steam turbine modernisation project in UK history. Drax Power Station is now benefiting from an overall improvement in its efficiency of 5% and a consequent reduction in emissions of carbon dioxide amounting to 1 million tonnes each year.
A testament to the diligence, expertise and teamwork of our engineers, this achievement is a clear demonstration of our competence in project execution.
On governance-related matters, I am pleased to welcome a new member to our Board. Melanie Gee joined the Board on 1 January 2013 as a non-executive director, bringing with her many years’ experience in corporate finance. Her expertise will be a valuable addition and will strengthen further the proficiency of the Board.
I am, however, sorry to announce that Tim Barker will be stepping down from the Board at the conclusion of the Annual General Meeting in April. Tim is bowing out after nine years of service, joining us at a formative time for the Company and assisting us through the Listing process. My sincere thanks go to Tim for his time, commitment and considerable contribution to the Group. The Board has appointed David Lindsell to take over from Tim as Senior Independent Director, and Tony Thorne as Chairman of the Remuneration Committee, each with effect from Tim’s retirement from the Board.
We have always recognised that our people are a key resource to the business, but I believe the milestone achievements of last year underline that sentiment. The many and varied disciplines that make up our business continued to demonstrate true commitment to delivering on our key priorities and preparing the ground for our future. My sincere thanks go to all Group staff for their devotion and hard work.
Charles Berry Chairman
18 February 2013
(1) EBITDA is defined as profit before interest, tax, depreciation, amortisation and unrealised gains and losses on derivative contracts.
02 Drax Group plcAnnual report and accounts 2012
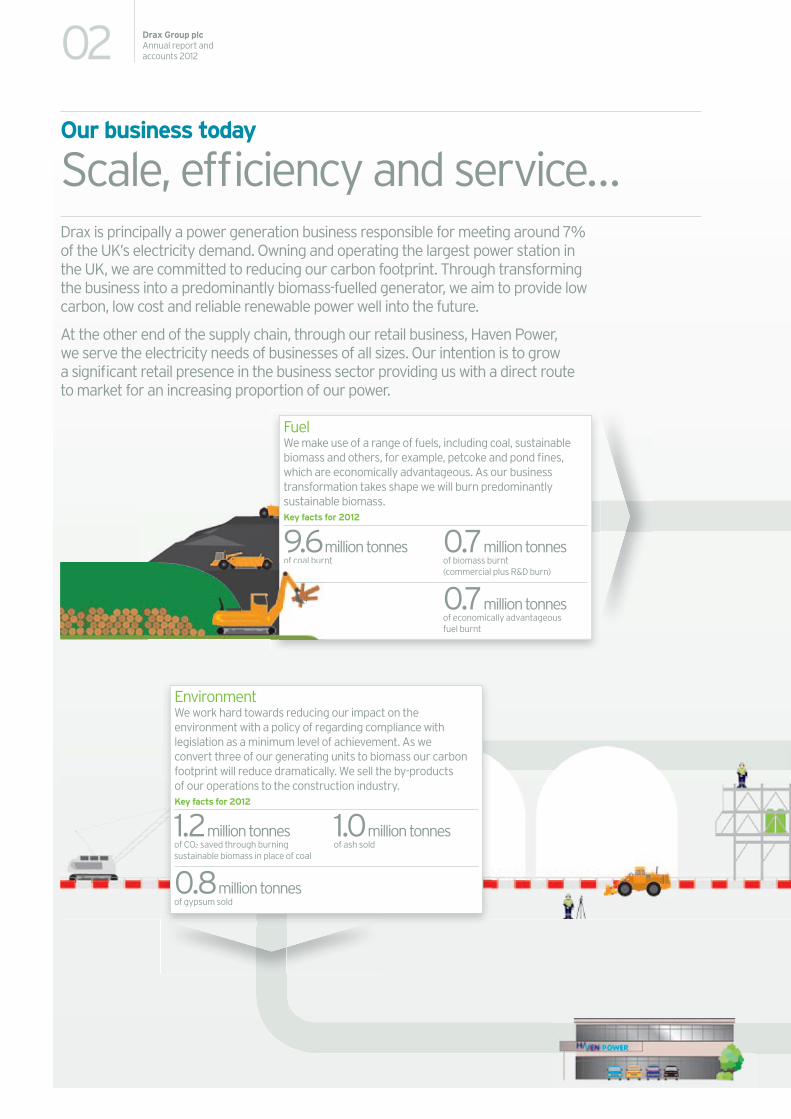
Drax is principally a power generation business responsible for meeting around 7% of the UK’s electricity demand. Owning and operating the largest power station in the UK, we are committed to reducing our carbon footprint. Through transforming the business into a predominantly biomass-fuelled generator, we aim to provide low carbon, low cost and reliable renewable power well into the future.
At the other end of the supply chain, through our retail business, Haven Power, we serve the electricity needs of businesses of all sizes. Our intention is to grow a significant retail presence in the business sector providing us with a direct route to market for an increasing proportion of our power.
Our business today
Scale, efficiency and service…
FuelWe make use of a range of fuels, including coal, sustainable biomass and others, for example, petcoke and pond fines, which are economically advantageous. As our business transformation takes shape we will burn predominantly sustainable biomass.Key facts for 2012
9.6 million tonnesof coal burnt
0.7 million tonnes of biomass burnt (commercial plus R&D burn)
0.7 million tonnes of economically advantageous fuel burnt
1.15 million tonnesof CO2 saved through burning sustainable biomass in place of coal
0.8 million tonnes of gypsum sold
1.0 million tonnes of ash sold
of coal bur
11.15million tonnestonne5oof CO2 saved through burningburningsustainable biomass in place of coaln place o
00.8million tonnes n tonn8oof gypsum sold
1.0million tonnes 0of ash sold
EnvironmentWe work hard towards reducing our impact on the environment with a policy of regarding compliance with legislation as a minimum level of achievement. As we convert three of our generating units to biomass our carbon footprint will reduce dramatically. We sell the by-products of our operations to the construction industry.Key facts for 2012
1.2 million tonnesof CO2 saved through burning sustainable biomass in place of coal
0.8 million tonnes of gypsum sold
1.0 million tonnes of ash sold
03Drax Group plcAnnual report and
accounts 2012
Ove
rvie
wM
arke
tpla
ce, p
erfo
rman
ce a
nd r
isk
Cor
pora
te a
nd s
ocia
l res
pons
ibili
tyG
over
nanc
eFi
nanc
ials
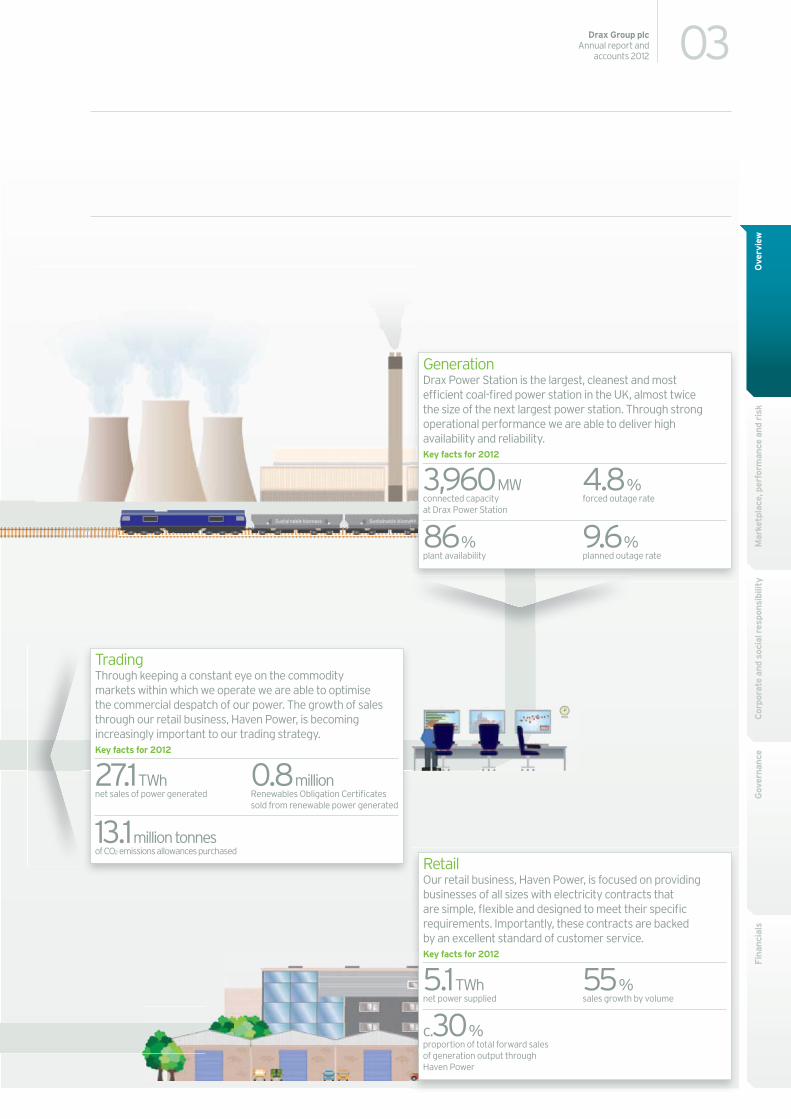
RetailOur retail business, Haven Power, is focused on providing businesses of all sizes with electricity contracts that are simple, flexible and designed to meet their specific requirements. Importantly, these contracts are backed by an excellent standard of customer service.Key facts for 2012
5.1 TWhnet power supplied
c.30 %proportion of total forward sales of generation output through Haven Power
55 % sales growth by volume
TradingThrough keeping a constant eye on the commodity markets within which we operate we are able to optimise the commercial despatch of our power. The growth of sales through our retail business, Haven Power, is becoming increasingly important to our trading strategy.Key facts for 2012
27.1 TWhnet sales of power generated
13.1 million tonnesof CO2 emissions allowances purchased
0.8 million Renewables Obligation Certificates sold from renewable power generated
GenerationDrax Power Station is the largest, cleanest and most efficient coal-fired power station in the UK, almost twice the size of the next largest power station. Through strong operational performance we are able to deliver high availability and reliability. Key facts for 2012
3,960 MWconnected capacity at Drax Power Station
86 % plant availability
4.8 % forced outage rate
9.6 % planned outage rate
04 Drax Group plcAnnual report and accounts 2012
Our business model
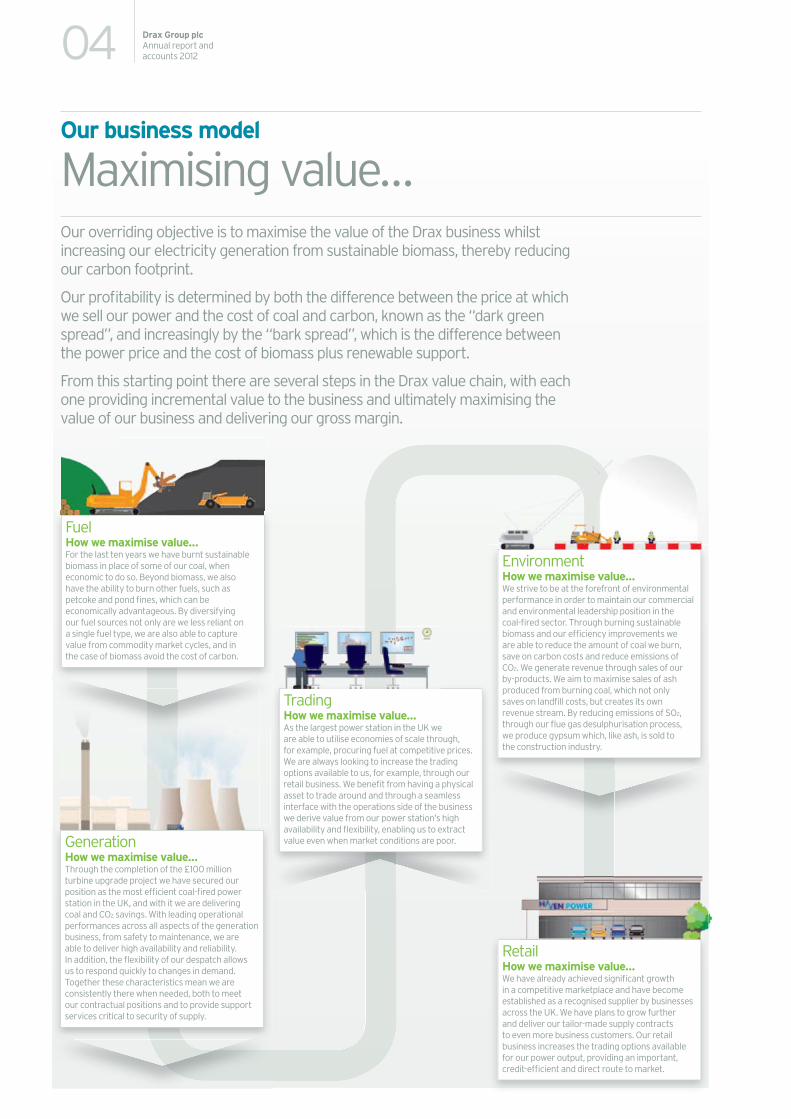
Maximising value…Our overriding objective is to maximise the value of the Drax business whilst increasing our electricity generation from sustainable biomass, thereby reducing our carbon footprint.
Our profitability is determined by both the difference between the price at which we sell our power and the cost of coal and carbon, known as the “dark green spread”, and increasingly by the “bark spread”, which is the difference between the power price and the cost of biomass plus renewable support.
From this starting point there are several steps in the Drax value chain, with each one providing incremental value to the business and ultimately maximising the value of our business and delivering our gross margin.
TradingHow we maximise value…As the largest power station in the UK we are able to utilise economies of scale through, for example, procuring fuel at competitive prices. We are always looking to increase the trading options available to us, for example, through our retail business. We benefit from having a physical asset to trade around and through a seamless interface with the operations side of the business we derive value from our power station’s high availability and flexibility, enabling us to extract value even when market conditions are poor.
RetailHow we maximise value…We have already achieved significant growth in a competitive marketplace and have become established as a recognised supplier by businesses across the UK. We have plans to grow further and deliver our tailor-made supply contracts to even more business customers. Our retail business increases the trading options available for our power output, providing an important, credit-efficient and direct route to market.
EnvironmentHow we maximise value…We strive to be at the forefront of environmental performance in order to maintain our commercial and environmental leadership position in the coal-fired sector. Through burning sustainable biomass and our efficiency improvements we are able to reduce the amount of coal we burn, save on carbon costs and reduce emissions of CO2. We generate revenue through sales of our by-products. We aim to maximise sales of ash produced from burning coal, which not only saves on landfill costs, but creates its own revenue stream. By reducing emissions of SO2, through our flue gas desulphurisation process, we produce gypsum which, like ash, is sold to the construction industry.
GenerationHow we maximise value…Through the completion of the £100 million turbine upgrade project we have secured our position as the most efficient coal-fired power station in the UK, and with it we are delivering coal and CO2 savings. With leading operational performances across all aspects of the generation business, from safety to maintenance, we are able to deliver high availability and reliability. In addition, the flexibility of our despatch allows us to respond quickly to changes in demand. Together these characteristics mean we are consistently there when needed, both to meet our contractual positions and to provide support services critical to security of supply.
FuelHow we maximise value…For the last ten years we have burnt sustainable biomass in place of some of our coal, when economic to do so. Beyond biomass, we also have the ability to burn other fuels, such as petcoke and pond fines, which can be economically advantageous. By diversifying our fuel sources not only are we less reliant on a single fuel type, we are also able to capture value from commodity market cycles, and in the case of biomass avoid the cost of carbon.
05Drax Group plcAnnual report and
accounts 2012
Ove
rvie
wM
arke
tpla
ce, p
erfo
rman
ce a
nd r
isk
Cor
pora
te a
nd s
ocia
l res
pons
ibili
tyG
over
nanc
eFi
nanc
ials
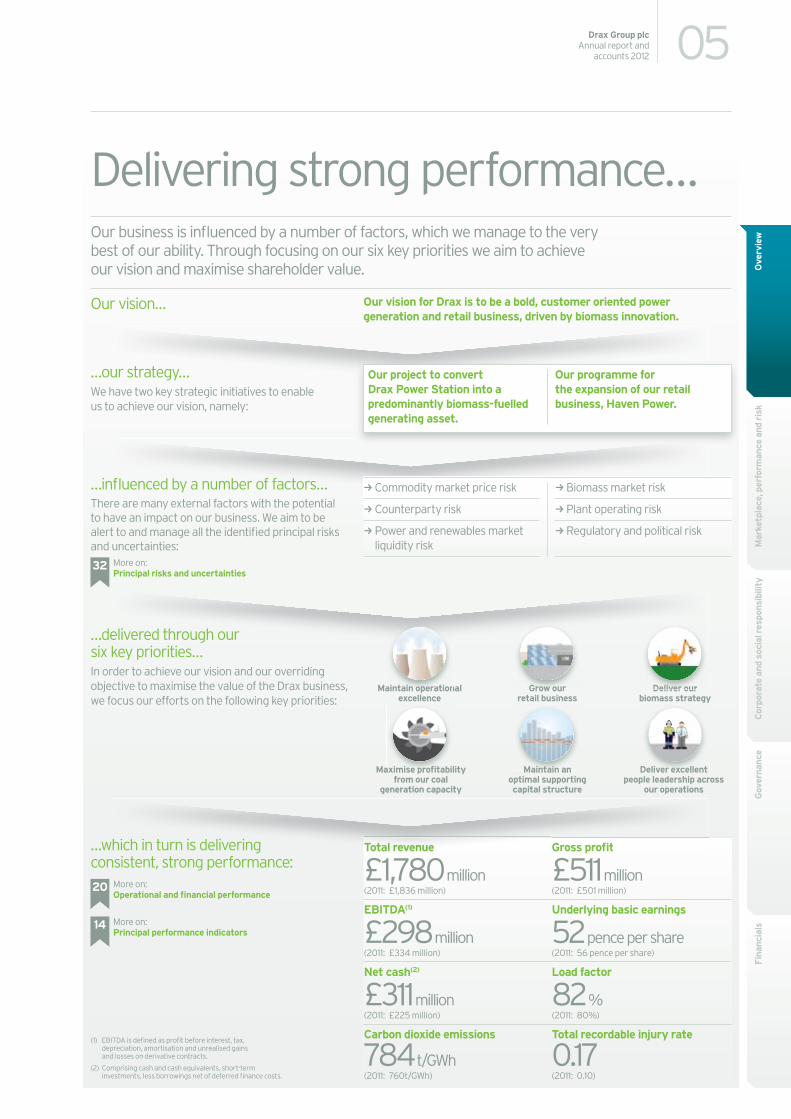
Delivering strong performance…Our business is influenced by a number of factors, which we manage to the very best of our ability. Through focusing on our six key priorities we aim to achieve our vision and maximise shareholder value.
…influenced by a number of factors…There are many external factors with the potential to have an impact on our business. We aim to be alert to and manage all the identified principal risks and uncertainties:
…which in turn is delivering consistent, strong performance:
Total revenue Gross profit
£1,780 million £511 million(2011: £1,836 million) (2011: £501 million)
EBITDA(1) Underlying basic earnings
£298 million 52 pence per share(2011: £334 million) (2011: 56 pence per share)
Net cash(2) Load factor
£311 million 82 %(2011: £225 million) (2011: 80%)
Carbon dioxide emissions Total recordable injury rate
784 t/GWh 0.17(2011: 760t/GWh) (2011: 0.10)
20 More on: Operational and financial performance
14 More on: Principal performance indicators
Our vision… Our vision for Drax is to be a bold, customer oriented power generation and retail business, driven by biomass innovation.
Our project to convert Drax Power Station into a predominantly biomass-fuelled generating asset.
Our programme for the expansion of our retail business, Haven Power.
…our strategy…We have two key strategic initiatives to enable us to achieve our vision, namely:
fluenced by a number of factors…
32 More on: Principal risks and uncertainties
(1) EBITDA is defined as profit before interest, tax, depreciation, amortisation and unrealised gains and losses on derivative contracts.
(2) Comprising cash and cash equivalents, short-term investments, less borrowings net of deferred finance costs.
hich in turn is delivering Total revenue Gross profit
…delivered through our six key priorities…In order to achieve our vision and our overriding objective to maximise the value of the Drax business, we focus our efforts on the following key priorities:
Maintain operational excellence
Grow our retail business
Deliver our biomass strategy
Maximise profitability from our coal
generation capacity
Maintain an optimal supporting capital structure
Deliver excellent people leadership across
our operations
Grow our Deliver ouraintain operation
kCommodity market price risk kBiomass market risk
kCounterparty risk kPlant operating risk
kPower and renewables market liquidity risk
kRegulatory and political risk
06 Drax Group plcAnnual report and accounts 2012
Introduction
I am very pleased to say that 2012 was a good and extremely important year for the Group. Good in the sense that the business performed well delivering profits in line with expectations underpinned by continued strength in operations, and important in that we now have the clear mandate, means and expertise to transform Drax into a predominantly biomass-fuelled generator.
Through the year we made excellent progress with our biomass research and development work. We demonstrated that we could operate a single generating unit on a fully converted basis for a sustained period and we delivered very encouraging results from our engineering optimisation work. As a result we gained full confidence in our ability to deliver reliable and flexible renewable power through converted units at attractive rates of efficiency and output.
The much needed regulatory clarity and certainty was delivered in the Government’s conclusions on the future support levels for biomass electricity and proposals for sustainability criteria, which saw clear recognition of the true benefits of biomass and its potential to play a strategically important role in the UK’s future energy mix.
The final piece of the jigsaw, securing the means to finance our biomass strategy, was achieved through raising a mixture of equity and debt. Equity of £190 million was raised through a share placing, and we secured new debt of £200 million through term loan facilities with M&G UK Companies Financing Fund and the UK Green Investment Bank, at £100 million each. In addition, our working capital/letter of credit facility was increased to £400 million and the maturity extended to April 2016.
All in all, 2012 was a positive and pivotal year marking real progress in our journey to transform the business, whilst maintaining our focus on excellence in operations, and disciplined capital project execution across our generation and retail businesses.
Chief Executive’s statement
Driving our strategy forward…
07Drax Group plcAnnual report and
accounts 2012
Ove
rvie
wM
arke
tpla
ce, p
erfo
rman
ce a
nd r
isk
Cor
pora
te a
nd s
ocia
l res
pons
ibili
tyG
over
nanc
eFi
nanc
ials
StrategyOur vision for Drax is to be a bold, customer oriented power generation and retail business, driven by biomass innovation. We have two key strategic initiatives to enable us to achieve our vision, namely, our project to convert Drax Power Station into a predominantly biomass-fuelled generating asset and our programme for the expansion of our retail business, Haven Power Limited (“Haven Power”) through growing our sales to businesses.
Commodity marketsThe gas market continued to be the dominant factor in driving power prices. The impact of the incident at one of Japan’s nuclear power stations continued to be felt through the country’s increased demand for liquefied natural gas (“LNG”) and consequent increasing Asian LNG prices. As a result the UK saw reduced LNG imports and gas prices remained strong. Accordingly, some gas-fired plant capacity was withdrawn from the market and in some cases considered for closure.
International coal prices were weak as a result of excess supply. Exports from the US to Europe, in particular, increased significantly. A combination of low prices and high stocks put pressure on the UK’s domestic coal producers.
Carbon prices remained at their lowest point for over three years driven by over-supply of carbon emissions allowances in Phase II of the EU Emissions Trading System (“EU ETS”). As of 1 January 2013, we entered into Phase III of the EU ETS, which introduced 100% auctioning of allowances to the power sector – a departure from receiving allowances in the previous Phases.
With Phase II surplus bankable in Phase III a range of interventions is being considered by the European Commission to rectify the over-supply, but these are by no means certain to proceed.
Dark green spreads, the difference between the price of power and the cost of coal and carbon, have been relatively good for coal-fired generators.
The introduction to the UK of the carbon price support mechanism from April 2013 is likely to erode the competitive position in the market of our coal-fired generation business, but at the same time it strengthens the case for biomass generation.
During 2012, bark spreads for co-firing, the difference between power price and renewable support and the cost of biomass, remained weak with most traded biomass commanding lower margins than coal. Consequently, the amount of commercial biomass burnt during the year was much lower than previous years. Substantially all of the biomass burnt during the period was at a loss, but in support of critical research and development work.
The Government’s new support levels for biomass electricity through conversion and co-firing come into effect in April 2013. We expect co-firing at low levels to remain uneconomic, but generation through converted units will become economic and yield attractive rates of return on the required capital investment.
Over the following pages we highlight some of the progress we’re making across our key priorities…
08 Drax Group plcAnnual report and accounts 2012
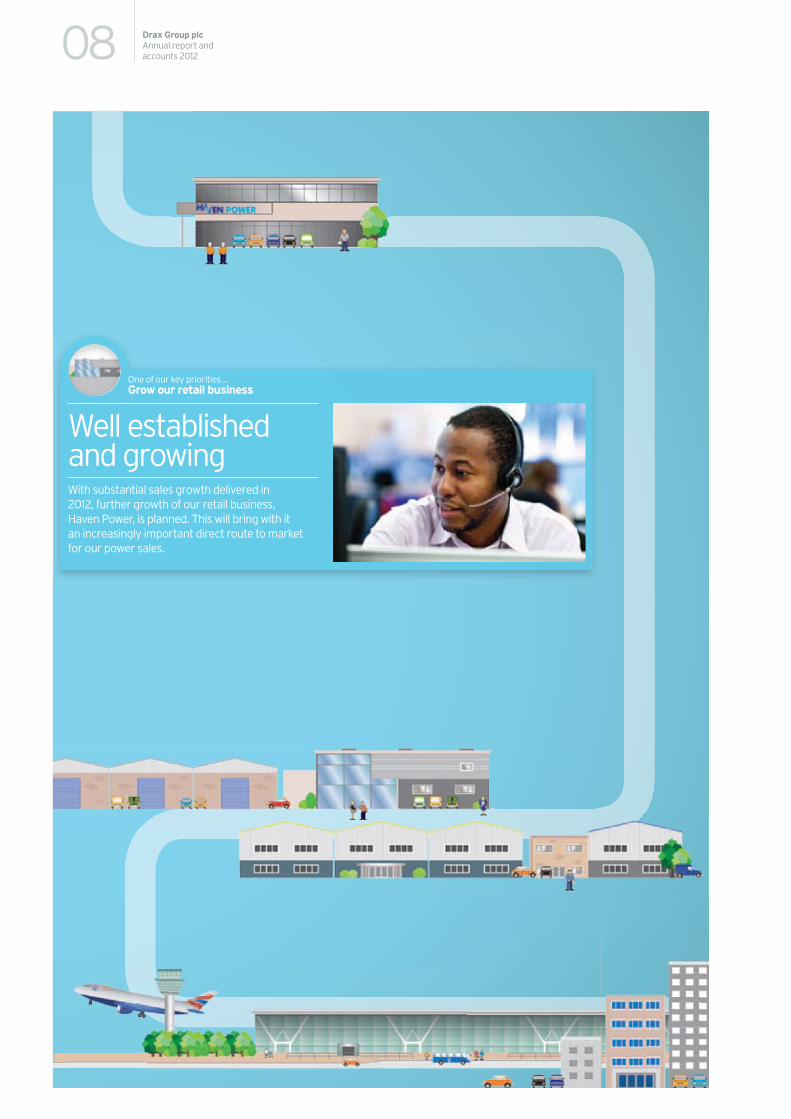
Well established and growingWith substantial sales growth delivered in 2012, further growth of our retail business, Haven Power, is planned. This will bring with it an increasingly important direct route to market for our power sales.
One of our key priorities… Grow our retail business
09Drax Group plcAnnual report and
accounts 2012
Ove
rvie
wM
arke
tpla
ce, p
erfo
rman
ce a
nd r
isk
Cor
pora
te a
nd s
ocia
l res
pons
ibili
tyG
over
nanc
eFi
nanc
ials
Chief Executive’s statement
Retail performanceDuring 2012 our retail business, Haven Power, delivered substantial growth in a highly competitive market with retail sales over 60% higher than in 2011. Sales growth remains a key priority for the business, targeting the industrial and commercial (“I&C”), and small and medium enterprise (“SME”) markets. Due to our continued drive for growth across these markets we expect Haven Power to make a modest loss up to 2015.
An excellent standard of customer service is central to our proposition for this business, and we were pleased to see recognition of that through being ranked No. 1 for customer satisfaction in the SME market in the 2012 Datamonitor Survey.
Selling our output through Haven Power continues to provide us with a credit-efficient route to market for our power sales compared to the wholesale electricity market, as well as a route to market for the Renewables Obligation Certificates and Levy Exemption Certificates associated with our renewable power generation.
Generation performance We continued to deliver industry-leading performance in 2012 amid higher than ever output levels, and significant project and construction activity.
As in previous years, our load factor was high compared to other thermal capacity on the system and we recorded our highest ever generation out-turn level. With high availability and reliability throughout 2012 we were able to continue to deliver additional value to the business through providing flexible generation output and balancing services to the System Operator, National Grid, in support of system stability and security.
Two planned unit outages were undertaken during 2012, and both were completed in good time. With two outages and considerable biomass project work activity, the number of engineering man-hours worked throughout the year was significant. Yet against this backdrop our safety statistics continued to be industry-leading, reflecting the emphasis we place on safety.
For the year, our forced outage rate, which measures any reduction in plant availability excluding planned outages, was close to our long-term target of 5%, which has been set through extensive benchmarking with UK and international coal-fired plants to determine the optimum balance between performance and cost.
We continued to work on increasing our burn of fuels which have a higher margin or lower carbon footprint over the standard bituminous coal which we burn. These advantaged fuels – petcoke, pond fines and commercial or economic biomass – accounted for 7% of the total fuel burnt during the year.
Assessment of the technical solutions available to us for compliance with the more stringent emissions standards of the Industrial Emissions Directive from 2016 is well advanced. The key factors in determining the optimal solution for compliance are plant flexibility and fuel mix. Hence, the level of biomass burn is an important consideration. The legislative arrangements in place afford us some flexibility in the timing and the extent of the required modifications which fits well with our biomass conversion programme.
Biomass transformationDuring the year we completed our engineering designs of the plant modifications and new facilities required for unit conversion. We made good progress on the time critical construction of the receipt, storage and delivery systems for biomass, including the erection of the first two biomass storage domes. Building on the early work undertaken in 2012 and making use of the existing biomass co-firing infrastructure we believe it will be technically feasible to convert single units in 2013, 2014 and 2015. However, the actual timing is dependent on biomass fuel sourcing.
We have made good progress towards securing sufficient biomass to run two converted units and we plan to convert the first unit in April 2013 and the second unit in 2014. We are now in advanced negotiations for a large proportion of the biomass necessary to fuel the third unit. Established North American suppliers, Enviva, Green Circle, Pinnacle and Plum Creek are amongst those with whom we have entered into term contracts for the supply of wood pellets and sustainable forest fibre.
10 Drax Group plcAnnual report and accounts 2012
Chief Executive’s statement
Elsewhere in the supply chain, at the end of 2012 the final investment decision was taken to develop two US-based pellet plants, one in each of the states of Mississippi and Louisiana, with a combined capacity of 900,000 tonnes a year, and to invest in a port facility in Louisiana with an export capacity of 3 million tonnes a year. We are now finalising the construction arrangements for these facilities.
In addition, terms have been agreed with UK port operators to provide us with biomass import facilities. This will involve the development of new facilities and the expansion of existing ones. Finally, the fabrication of bespoke rail wagons to transport biomass from the ports to the power station is underway.
Biomass sustainability All our biomass is procured against our own robust sustainability criteria, which include greenhouse gas emission reduction requirements, and habitats and biodiversity protection, as well as socio-economic considerations in the source areas. A programme of independent audits ensures all our suppliers comply with our sustainability criteria.
We firmly believe that robust, mandatory sustainability criteria are vital to maintain and enhance public acceptance, and ensure that sustainable practices are implemented. Assessment of the full life cycle carbon footprint of biomass, that is, from field or forest-to-furnace, is now well developed, especially in the UK where a mandatory life cycle standard is scheduled to come into effect later this year.
With a number of years’ experience of calculating the life cycle carbon footprint of all the biomass we procure, we are confident that our sustainable biomass fuel sources will meet the UK’s new mandatory standard which will ensure we continue to earn regulatory support.
Our calculations show that the range of sustainable biomass materials we have burnt over the last few years has a far lower carbon footprint than that of fossil fuel-fired generating plant. In 2012, the average greenhouse gas saving, over the full life cycle, resulting from burning sustainable biomass in place of coal was above 80%.
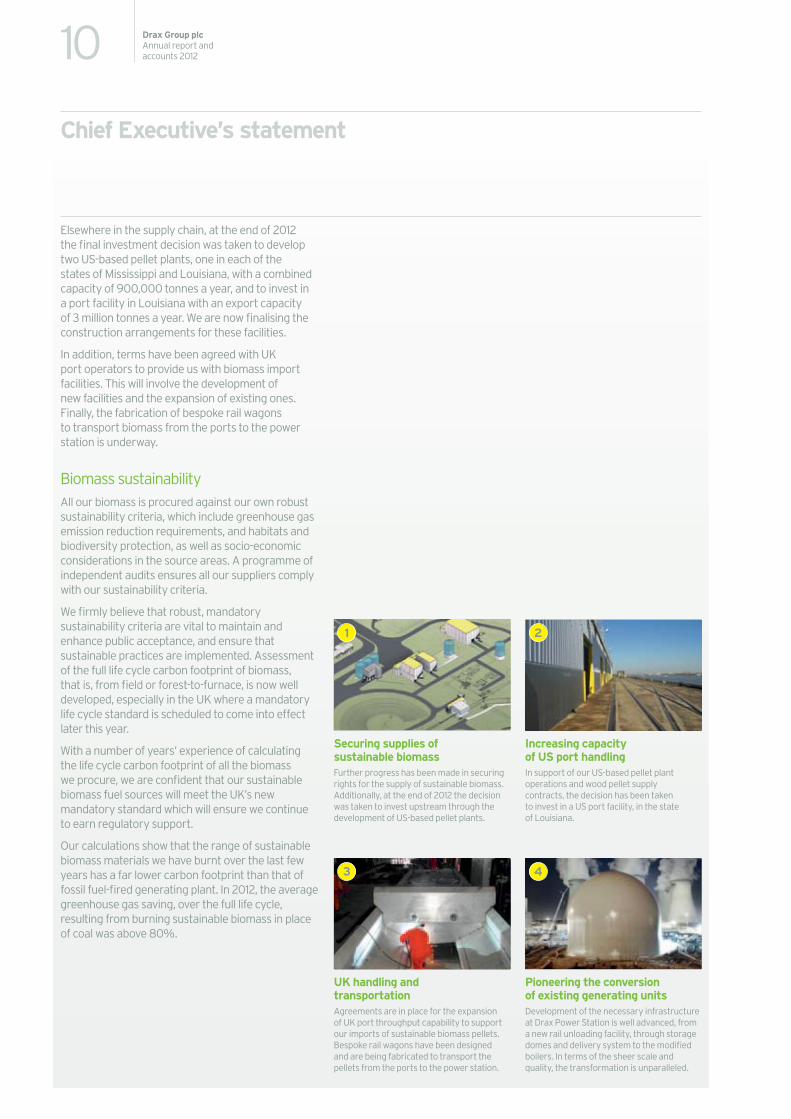
Pioneering the conversion of existing generating unitsDevelopment of the necessary infrastructure at Drax Power Station is well advanced, from a new rail unloading facility, through storage domes and delivery system to the modified boilers. In terms of the sheer scale and quality, the transformation is unparalleled.
Increasing capacity of US port handlingIn support of our US-based pellet plant operations and wood pellet supply contracts, the decision has been taken to invest in a US port facility, in the state of Louisiana.
UK handling and transportationAgreements are in place for the expansion of UK port throughput capability to support our imports of sustainable biomass pellets. Bespoke rail wagons have been designed and are being fabricated to transport the pellets from the ports to the power station.
Securing supplies of sustainable biomassFurther progress has been made in securing rights for the supply of sustainable biomass. Additionally, at the end of 2012 the decision was taken to invest upstream through the development of US-based pellet plants.
1
3
2
4
11Drax Group plcAnnual report and
accounts 2012
Ove
rvie
wM
arke
tpla
ce, p
erfo
rman
ce a
nd r
isk
Cor
pora
te a
nd s
ocia
l res
pons
ibili
tyG
over
nanc
eFi
nanc
ials
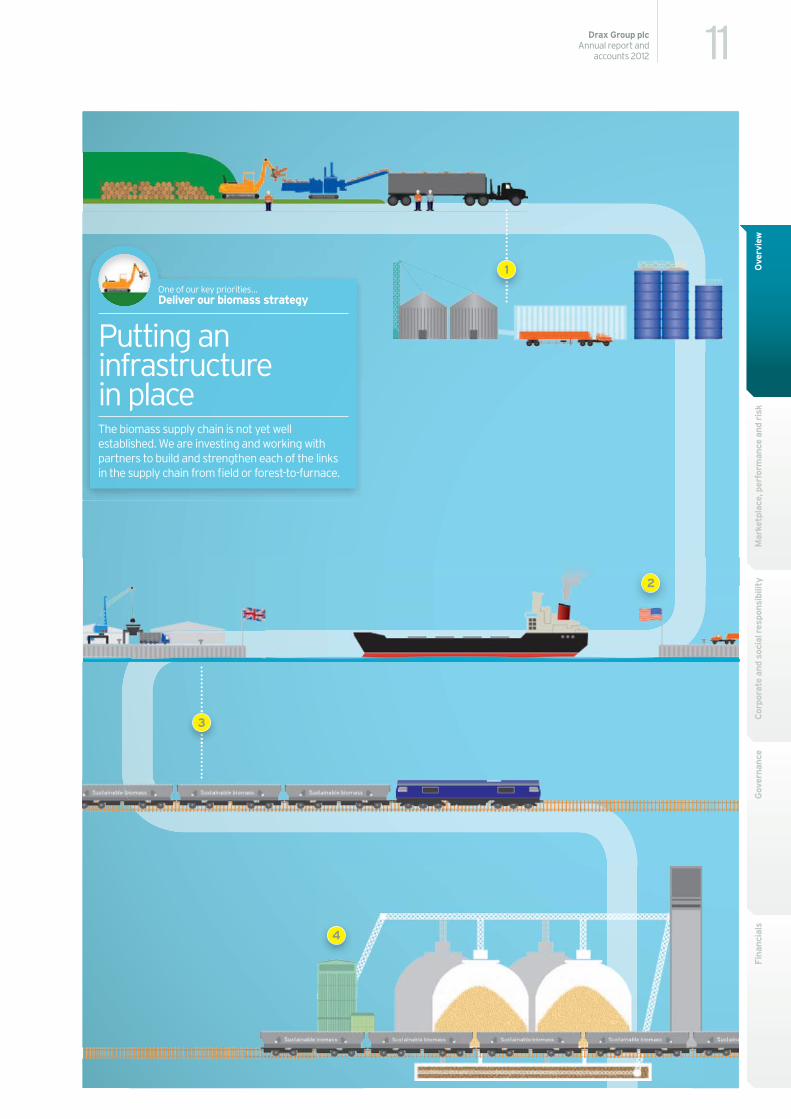
Putting an infrastructure in placeThe biomass supply chain is not yet well established. We are investing and working with partners to build and strengthen each of the links in the supply chain from field or forest-to-furnace.
One of our key priorities… Deliver our biomass strategy
4
2
3
1
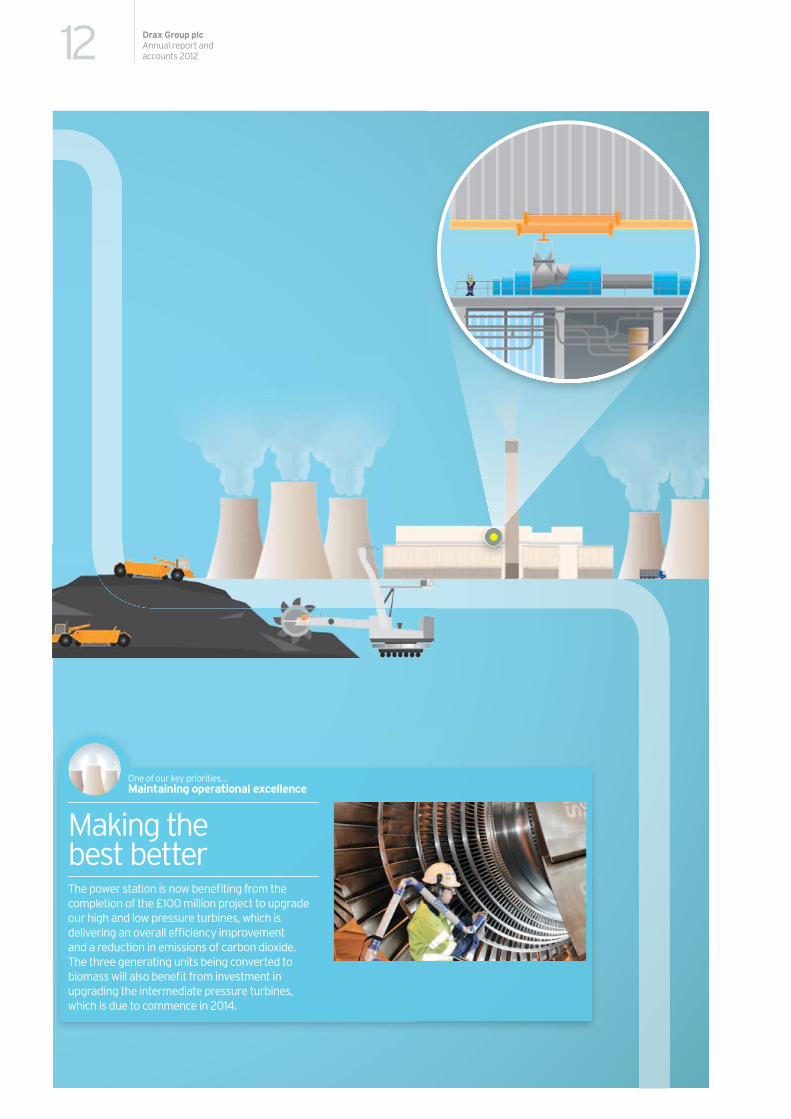
Making the best betterThe power station is now benefiting from the completion of the £100 million project to upgrade our high and low pressure turbines, which is delivering an overall efficiency improvement and a reduction in emissions of carbon dioxide. The three generating units being converted to biomass will also benefit from investment in upgrading the intermediate pressure turbines, which is due to commence in 2014.
One of our key priorities… Maintaining operational excellence
12 Drax Group plcAnnual report and accounts 2012
13Drax Group plcAnnual report and
accounts 2012
Ove
rvie
wM
arke
tpla
ce, p
erfo
rman
ce a
nd r
isk
Cor
pora
te a
nd s
ocia
l res
pons
ibili
tyG
over
nanc
eFi
nanc
ials
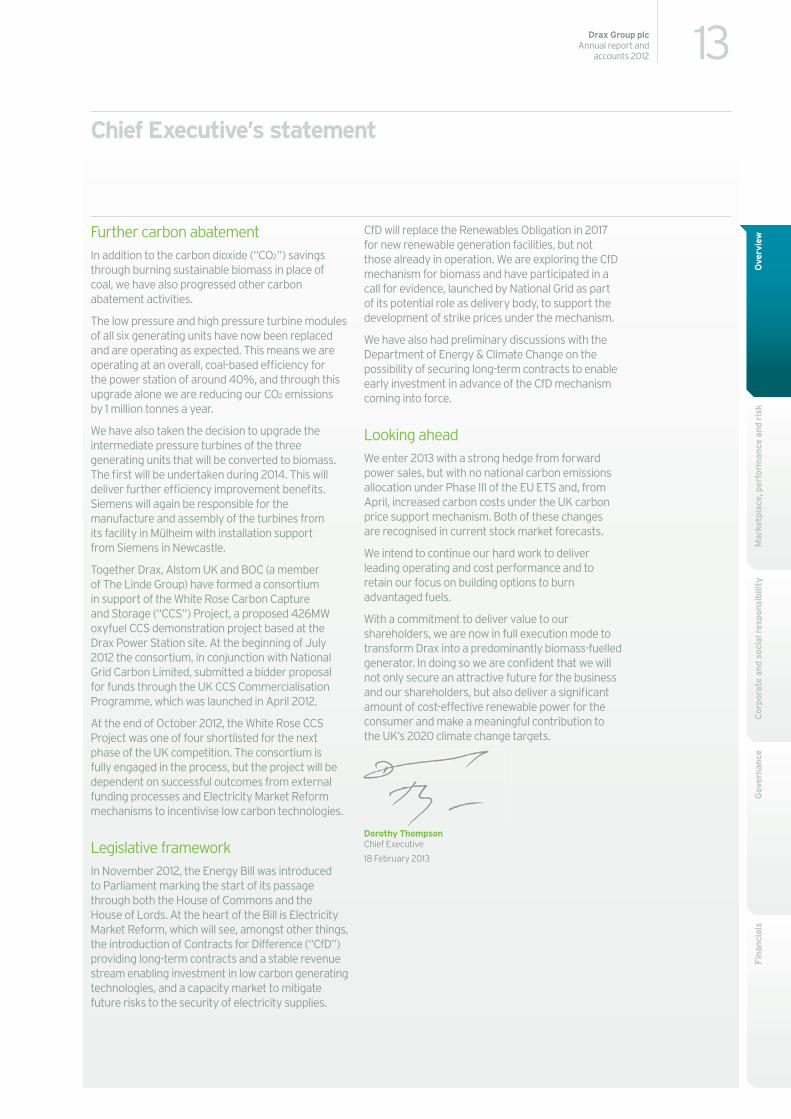
Further carbon abatement In addition to the carbon dioxide (“CO2”) savings through burning sustainable biomass in place of coal, we have also progressed other carbon abatement activities.
The low pressure and high pressure turbine modules of all six generating units have now been replaced and are operating as expected. This means we are operating at an overall, coal-based efficiency for the power station of around 40%, and through this upgrade alone we are reducing our CO2 emissions by 1 million tonnes a year.
We have also taken the decision to upgrade the intermediate pressure turbines of the three generating units that will be converted to biomass. The first will be undertaken during 2014. This will deliver further efficiency improvement benefits. Siemens will again be responsible for the manufacture and assembly of the turbines from its facility in Mülheim with installation support from Siemens in Newcastle.
Together Drax, Alstom UK and BOC (a member of The Linde Group) have formed a consortium in support of the White Rose Carbon Capture and Storage (“CCS”) Project, a proposed 426MW oxyfuel CCS demonstration project based at the Drax Power Station site. At the beginning of July 2012 the consortium, in conjunction with National Grid Carbon Limited, submitted a bidder proposal for funds through the UK CCS Commercialisation Programme, which was launched in April 2012.
At the end of October 2012, the White Rose CCS Project was one of four shortlisted for the next phase of the UK competition. The consortium is fully engaged in the process, but the project will be dependent on successful outcomes from external funding processes and Electricity Market Reform mechanisms to incentivise low carbon technologies.
Legislative frameworkIn November 2012, the Energy Bill was introduced to Parliament marking the start of its passage through both the House of Commons and the House of Lords. At the heart of the Bill is Electricity Market Reform, which will see, amongst other things, the introduction of Contracts for Difference (“CfD”)providing long-term contracts and a stable revenue stream enabling investment in low carbon generating technologies, and a capacity market to mitigate future risks to the security of electricity supplies.
CfD will replace the Renewables Obligation in 2017 for new renewable generation facilities, but not those already in operation. We are exploring the CfD mechanism for biomass and have participated in a call for evidence, launched by National Grid as part of its potential role as delivery body, to support the development of strike prices under the mechanism.
We have also had preliminary discussions with the Department of Energy & Climate Change on the possibility of securing long-term contracts to enable early investment in advance of the CfD mechanism coming into force.
Looking aheadWe enter 2013 with a strong hedge from forward power sales, but with no national carbon emissions allocation under Phase III of the EU ETS and, from April, increased carbon costs under the UK carbon price support mechanism. Both of these changes are recognised in current stock market forecasts.
We intend to continue our hard work to deliver leading operating and cost performance and to retain our focus on building options to burn advantaged fuels.
With a commitment to deliver value to our shareholders, we are now in full execution mode to transform Drax into a predominantly biomass-fuelled generator. In doing so we are confident that we will not only secure an attractive future for the business and our shareholders, but also deliver a significant amount of cost-effective renewable power for the consumer and make a meaningful contribution to the UK’s 2020 climate change targets.
Dorothy Thompson Chief Executive
18 February 2013
Chief Executive’s statement
Net sales TWh
26.4
2010
26.4
2011
27.1
2012
Average achieved price of electricity
£/MWh
2010 2011
51.3
2012
51.655.6
Sustainable biomass burnt tonnes
2010 2011 2012
907,000
565,000R&D 475,000
R&D
228,000
700,000
Average cost of fuelexcluding carbon
£/MWh
2010 2011
30.6
2012
25.7
33.3
Average cost of carbon £/tonne
2010 2011
6.3
2012
12.6 12.0
Carbon dioxide emissions t/GWh
2010 2011
784
2012
784
760
14 Drax Group plcAnnual report and accounts 2012
Principal performance indicators
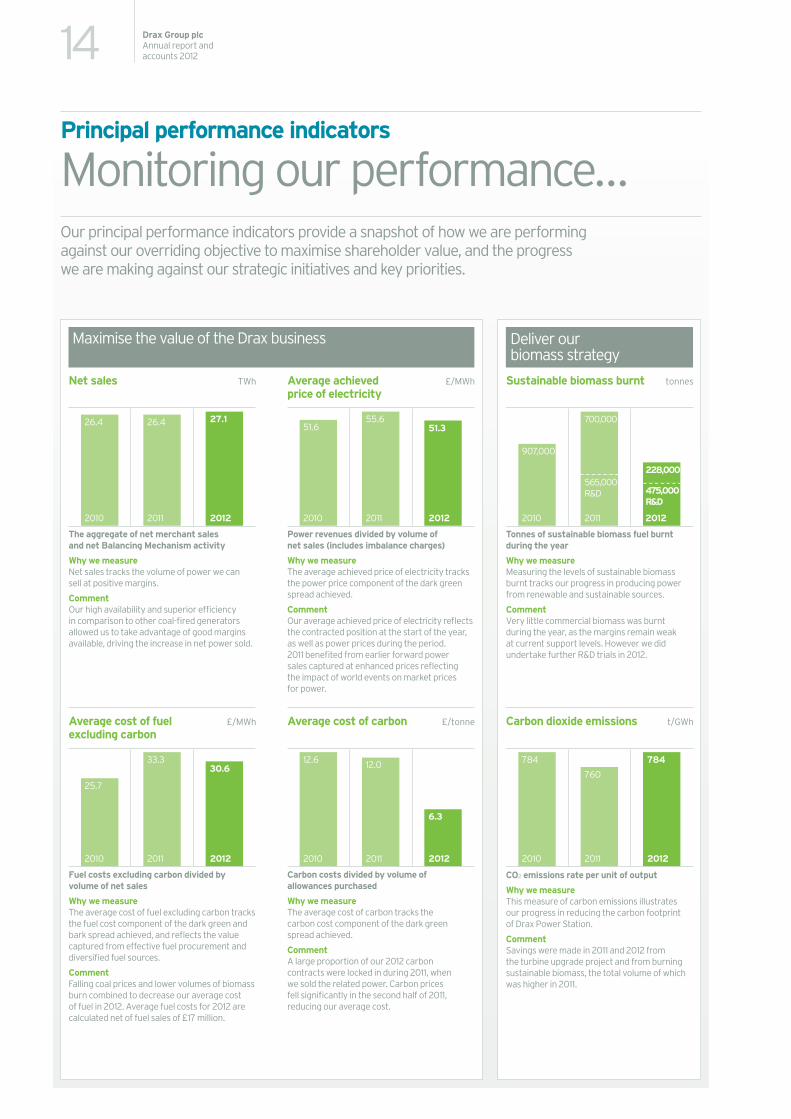
Monitoring our performance…Our principal performance indicators provide a snapshot of how we are performing against our overriding objective to maximise shareholder value, and the progress we are making against our strategic initiatives and key priorities.
Deliver our biomass strategy
Maximise the value of the Drax business
Tonnes of sustainable biomass fuel burnt during the year
Why we measureMeasuring the levels of sustainable biomass burnt tracks our progress in producing power from renewable and sustainable sources.
CommentVery little commercial biomass was burnt during the year, as the margins remain weak at current support levels. However we did undertake further R&D trials in 2012.
CO2 emissions rate per unit of output
Why we measureThis measure of carbon emissions illustrates our progress in reducing the carbon footprint of Drax Power Station.
CommentSavings were made in 2011 and 2012 from the turbine upgrade project and from burning sustainable biomass, the total volume of which was higher in 2011.
The aggregate of net merchant sales and net Balancing Mechanism activity
Why we measureNet sales tracks the volume of power we can sell at positive margins.
CommentOur high availability and superior efficiency in comparison to other coal-fired generators allowed us to take advantage of good margins available, driving the increase in net power sold.
Power revenues divided by volume of net sales (includes imbalance charges)
Why we measureThe average achieved price of electricity tracks the power price component of the dark green spread achieved.
CommentOur average achieved price of electricity reflects the contracted position at the start of the year, as well as power prices during the period. 2011 benefited from earlier forward power sales captured at enhanced prices reflecting the impact of world events on market prices for power.
Fuel costs excluding carbon divided by volume of net sales
Why we measureThe average cost of fuel excluding carbon tracks the fuel cost component of the dark green and bark spread achieved, and reflects the value captured from effective fuel procurement and diversified fuel sources.
CommentFalling coal prices and lower volumes of biomass burn combined to decrease our average cost of fuel in 2012. Average fuel costs for 2012 are calculated net of fuel sales of £17 million.
Carbon costs divided by volume of allowances purchased
Why we measureThe average cost of carbon tracks the carbon cost component of the dark green spread achieved.
CommentA large proportion of our 2012 carbon contracts were locked in during 2011, when we sold the related power. Carbon prices fell significantly in the second half of 2011, reducing our average cost.
Plant availability %
2010 2011
86
2012
92 88
Lost time injury rate (“LTIR”)
2010 2011
0.06
2012
0.13
0.08
Load factor %
2010 2011
82
2012
80 80
Total recordable injury rate (“TRIR”)
2010 2011
0.17
2012
0.26
0.10
Retail customer volumes TWh
2010 2011
5.1
2012
1.4
3.3
Net cash £m
2010 2011
311
2012
204225
15Drax Group plcAnnual report and
accounts 2012
Ove
rvie
wM
arke
tpla
ce, p
erfo
rman
ce a
nd r
isk
Cor
pora
te a
nd s
ocia
l res
pons
ibili
tyG
over
nanc
eFi
nanc
ials
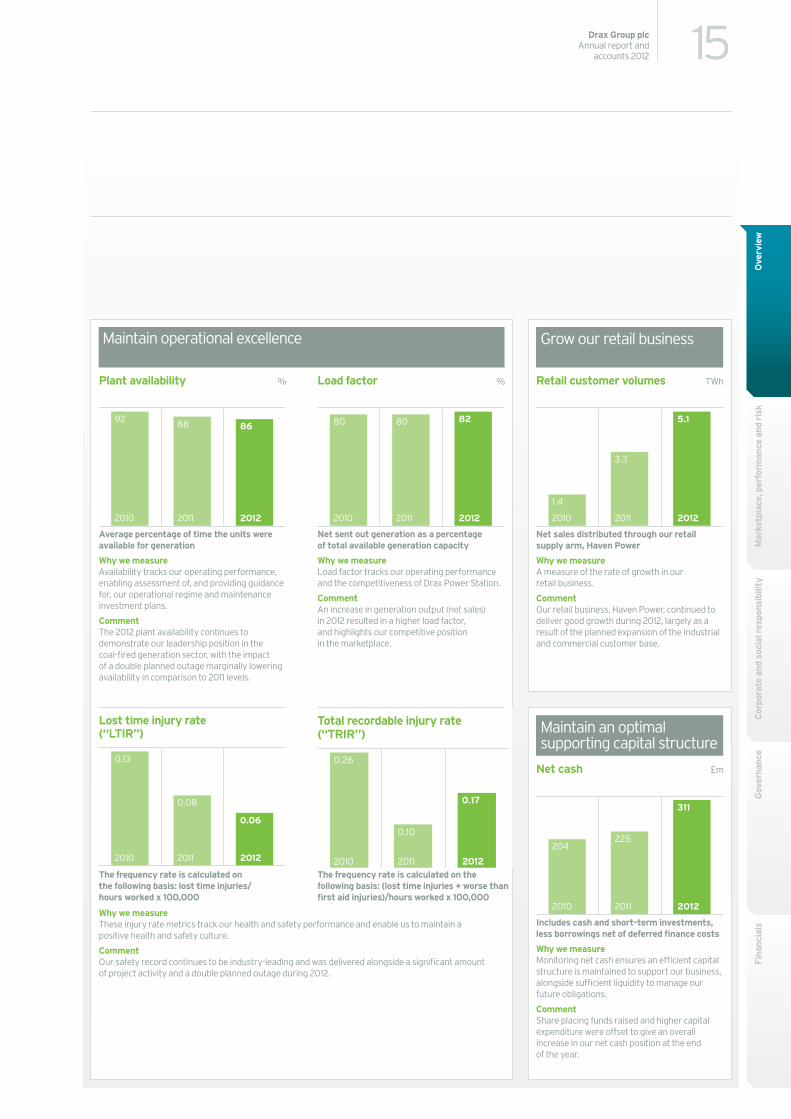
Grow our retail business
Maintain an optimal supporting capital structure
Maintain operational excellence
Net sales distributed through our retail supply arm, Haven Power
Why we measureA measure of the rate of growth in our retail business.
CommentOur retail business, Haven Power, continued to deliver good growth during 2012, largely as a result of the planned expansion of the industrial and commercial customer base.
Includes cash and short-term investments, less borrowings net of deferred finance costs
Why we measureMonitoring net cash ensures an efficient capital structure is maintained to support our business, alongside sufficient liquidity to manage our future obligations.
CommentShare placing funds raised and higher capital expenditure were offset to give an overall increase in our net cash position at the end of the year.
Average percentage of time the units were available for generation
Why we measureAvailability tracks our operating performance, enabling assessment of, and providing guidance for, our operational regime and maintenance investment plans.
CommentThe 2012 plant availability continues to demonstrate our leadership position in the coal-fired generation sector, with the impact of a double planned outage marginally lowering availability in comparison to 2011 levels.
Net sent out generation as a percentage of total available generation capacity
Why we measureLoad factor tracks our operating performance and the competitiveness of Drax Power Station.
CommentAn increase in generation output (net sales) in 2012 resulted in a higher load factor, and highlights our competitive position in the marketplace.
The frequency rate is calculated on the following basis: lost time injuries/hours worked x 100,000
Why we measureThese injury rate metrics track our health and safety performance and enable us to maintain a positive health and safety culture.
CommentOur safety record continues to be industry-leading and was delivered alongside a significant amount of project activity and a double planned outage during 2012.
The frequency rate is calculated on the following basis: (lost time injuries + worse than first aid injuries)/hours worked x 100,000
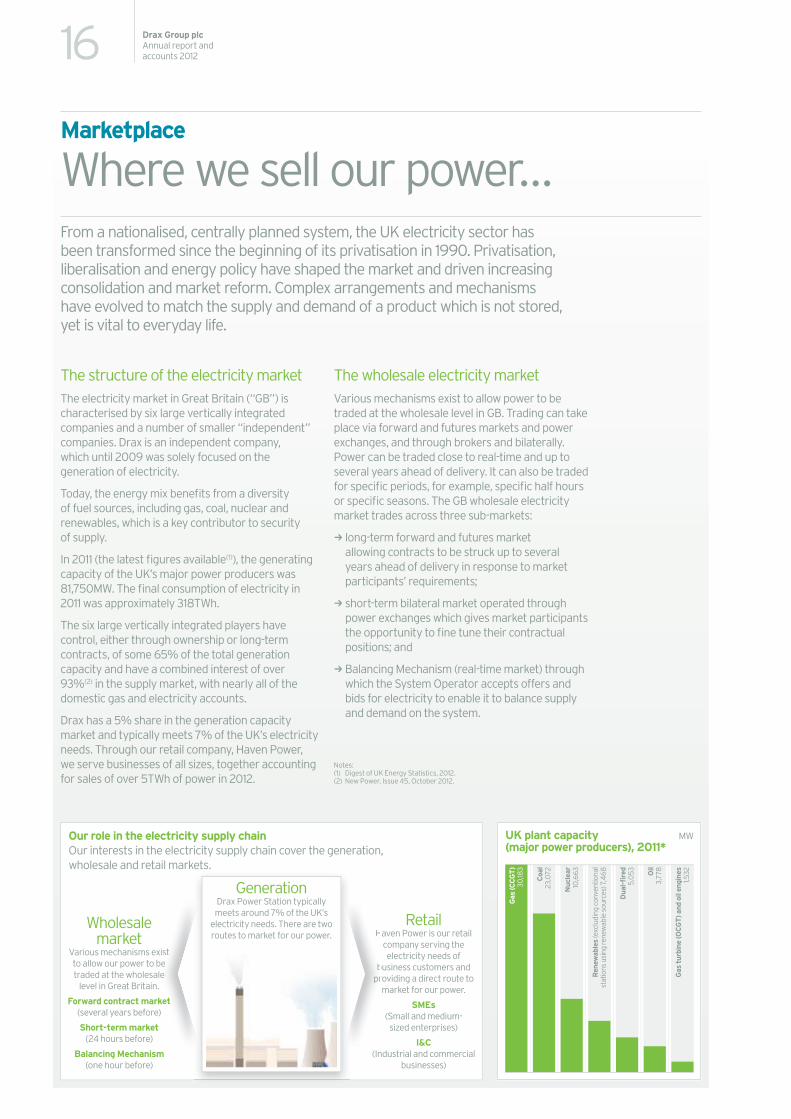
UK plant capacity (major power producers), 2011*
MW
Gas
(CC
GT
)30
,183
Coa
l23
,072
Nuc
lear
10,6
63
Ren
ewab
les
(exc
ludi
ng c
onve
ntio
nal
sta
tions
usi
ng re
new
able
sou
rces
) 7,4
68
Dua
l-fi
red
5,0
53 Oil
3,77
8
Gas
tur
bine
(OC
GT
) and
oil
engi
nes
1,532
16 Drax Group plcAnnual report and accounts 2012
Marketplace
Where we sell our power…
The structure of the electricity marketThe electricity market in Great Britain (“GB”) is characterised by six large vertically integrated companies and a number of smaller “independent” companies. Drax is an independent company, which until 2009 was solely focused on the generation of electricity.
Today, the energy mix benefits from a diversity of fuel sources, including gas, coal, nuclear and renewables, which is a key contributor to security of supply.
In 2011 (the latest figures available(1)), the generating capacity of the UK’s major power producers was 81,750MW. The final consumption of electricity in 2011 was approximately 318TWh.
The six large vertically integrated players have control, either through ownership or long-term contracts, of some 65% of the total generation capacity and have a combined interest of over 93%(2) in the supply market, with nearly all of the domestic gas and electricity accounts.
Drax has a 5% share in the generation capacity market and typically meets 7% of the UK’s electricity needs. Through our retail company, Haven Power, we serve businesses of all sizes, together accounting for sales of over 5TWh of power in 2012.
The wholesale electricity market Various mechanisms exist to allow power to be traded at the wholesale level in GB. Trading can take place via forward and futures markets and power exchanges, and through brokers and bilaterally. Power can be traded close to real-time and up to several years ahead of delivery. It can also be traded for specific periods, for example, specific half hours or specific seasons. The GB wholesale electricity market trades across three sub-markets:
k long-term forward and futures market allowing contracts to be struck up to several years ahead of delivery in response to market participants’ requirements;
k short-term bilateral market operated through power exchanges which gives market participants the opportunity to fine tune their contractual positions; and
kBalancing Mechanism (real-time market) through which the System Operator accepts offers and bids for electricity to enable it to balance supply and demand on the system.
From a nationalised, centrally planned system, the UK electricity sector has been transformed since the beginning of its privatisation in 1990. Privatisation, liberalisation and energy policy have shaped the market and driven increasing consolidation and market reform. Complex arrangements and mechanisms have evolved to match the supply and demand of a product which is not stored, yet is vital to everyday life.
Our role in the electricity supply chainOur interests in the electricity supply chain cover the generation, wholesale and retail markets.
RetailHaven Power is our retail
company serving the electricity needs of
business customers and providing a direct route to
market for our power.
SMEs (Small and medium- sized enterprises)
I&C (Industrial and commercial
businesses)
GenerationDrax Power Station typically meets around 7% of the UK’s
electricity needs. There are two routes to market for our power.
Wholesale market
Various mechanisms exist to allow our power to be traded at the wholesale
level in Great Britain.
Forward contract market (several years before)
Short-term market (24 hours before)
Balancing Mechanism (one hour before)
H
bppr
st e e
et
Notes: (1) Digest of UK Energy Statistics, 2012. (2) New Power, Issue 45, October 2012.
Mar
ketp
lace
, per
form
ance
and
ris
kO
verv
iew
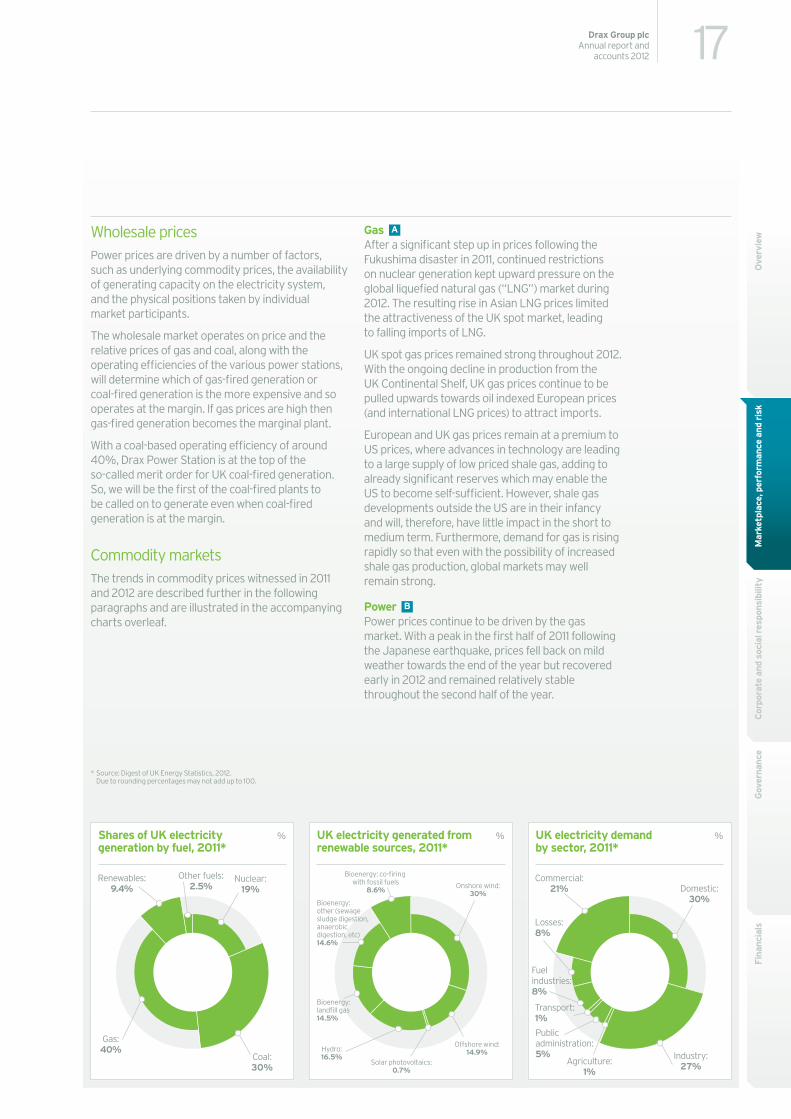
Shares of UK electricity %generation by fuel, 2011*
Other fuels:2.5%
Renewables:9.4%
Gas:40%
Nuclear:19%
Coal:30%
UK electricity demand %by sector, 2011*
Losses:8%
Transport:1%
Fuel industries:8%
Commercial:21%
Agriculture:1%
Public administration:5%
Domestic:30%
Industry:27%
UK electricity generated from %renewable sources, 2011*
Bioenergy: landfill gas14.5%
Bioenergy: co-firing with fossil fuels
8.6%
Bioenergy: other (sewage sludge digestion, anaerobic digestion, etc)14.6%
Hydro:16.5%
Solar photovoltaics:0.7%
Onshore wind:30%
Offshore wind:14.9%
17Drax Group plcAnnual report and
accounts 2012
Fina
ncia
lsG
over
nanc
eC
orpo
rate
and
soc
ial r
espo
nsib
ility
Wholesale pricesPower prices are driven by a number of factors, such as underlying commodity prices, the availability of generating capacity on the electricity system, and the physical positions taken by individual market participants.
The wholesale market operates on price and the relative prices of gas and coal, along with the operating efficiencies of the various power stations, will determine which of gas-fired generation or coal-fired generation is the more expensive and so operates at the margin. If gas prices are high then gas-fired generation becomes the marginal plant.
With a coal-based operating efficiency of around 40%, Drax Power Station is at the top of the so-called merit order for UK coal-fired generation. So, we will be the first of the coal-fired plants to be called on to generate even when coal-fired generation is at the margin.
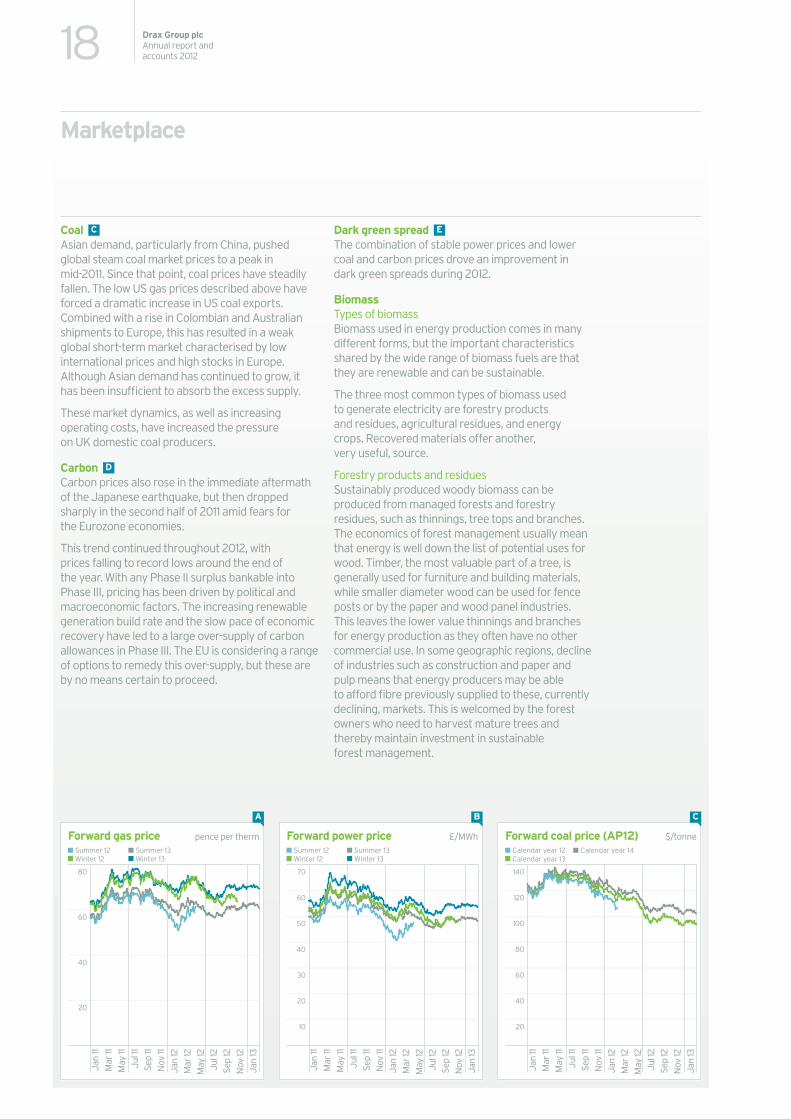
Commodity markets The trends in commodity prices witnessed in 2011 and 2012 are described further in the following paragraphs and are illustrated in the accompanying charts overleaf.
Gas After a significant step up in prices following the Fukushima disaster in 2011, continued restrictions on nuclear generation kept upward pressure on the global liquefied natural gas (“LNG”) market during 2012. The resulting rise in Asian LNG prices limited the attractiveness of the UK spot market, leading to falling imports of LNG.
UK spot gas prices remained strong throughout 2012. With the ongoing decline in production from the UK Continental Shelf, UK gas prices continue to be pulled upwards towards oil indexed European prices (and international LNG prices) to attract imports.
European and UK gas prices remain at a premium to US prices, where advances in technology are leading to a large supply of low priced shale gas, adding to already significant reserves which may enable the US to become self-sufficient. However, shale gas developments outside the US are in their infancy and will, therefore, have little impact in the short to medium term. Furthermore, demand for gas is rising rapidly so that even with the possibility of increased shale gas production, global markets may well remain strong.
Power Power prices continue to be driven by the gas market. With a peak in the first half of 2011 following the Japanese earthquake, prices fell back on mild weather towards the end of the year but recovered early in 2012 and remained relatively stable throughout the second half of the year.
A
B
* Source: Digest of UK Energy Statistics, 2012. Due to rounding percentages may not add up to 100.
Forward gas price pence per therm
80
60
40
20
Jan
11M
ar 11
May
11Ju
l 11
Sep
11N
ov 11
Jan
12M
ar 12
May
12Ju
l 12
Sep
12N
ov 12
Jan
13
Summer 12Winter 12
Summer 13Winter 13
Forward power price £/MWh
70
60
50
40
30
20
10
Jan
11M
ar 11
May
11Ju
l 11
Sep
11N
ov 11
Jan
12M
ar 12
May
12Ju
l 12
Sep
12N
ov 12
Jan
13
Summer 12Winter 12
Summer 13Winter 13
Forward coal price (AP12) $/tonne
140
120
100
80
60
40
20
Jan
11M
ar 11
May
11Ju
l 11
Sep
11N
ov 11
Jan
12M
ar 12
May
12Ju
l 12
Sep
12N
ov 12
Jan
13
Calendar year 12Calendar year 13
Calendar year 14
A B C
18 Drax Group plcAnnual report and accounts 2012
Marketplace
Coal Asian demand, particularly from China, pushed global steam coal market prices to a peak in mid-2011. Since that point, coal prices have steadily fallen. The low US gas prices described above have forced a dramatic increase in US coal exports. Combined with a rise in Colombian and Australian shipments to Europe, this has resulted in a weak global short-term market characterised by low international prices and high stocks in Europe. Although Asian demand has continued to grow, it has been insufficient to absorb the excess supply.
These market dynamics, as well as increasing operating costs, have increased the pressure on UK domestic coal producers.
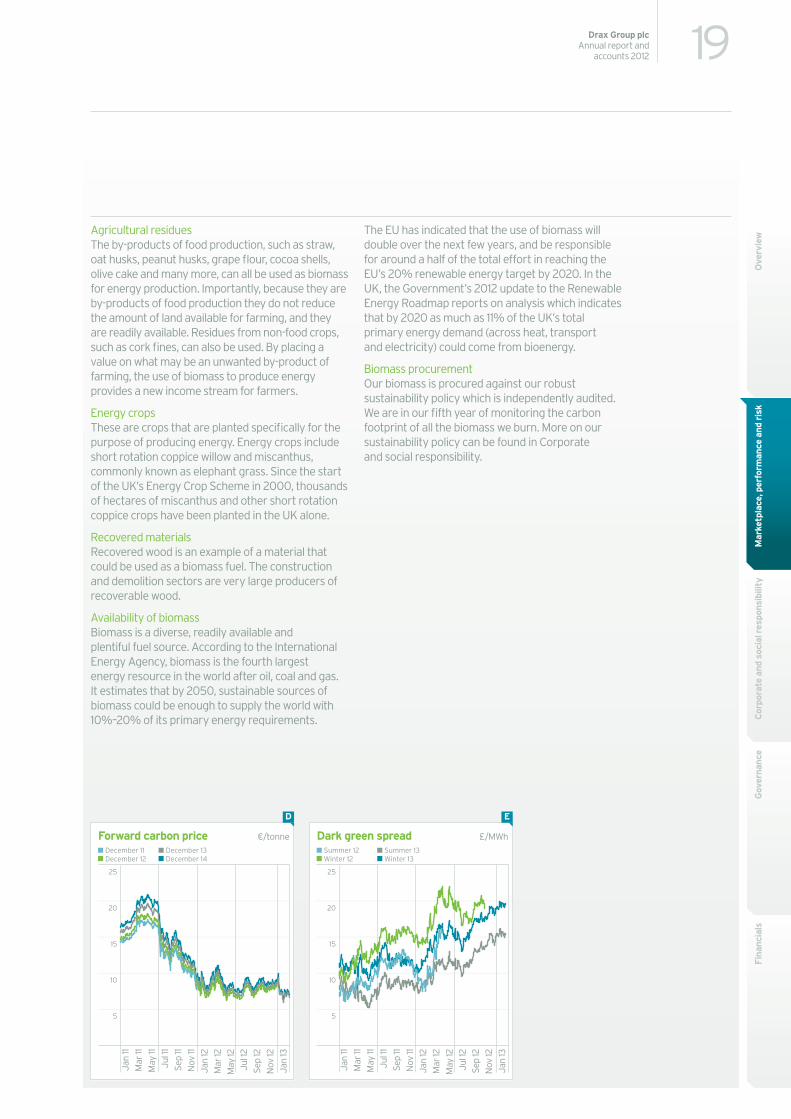
Carbon Carbon prices also rose in the immediate aftermath of the Japanese earthquake, but then dropped sharply in the second half of 2011 amid fears for the Eurozone economies.
This trend continued throughout 2012, with prices falling to record lows around the end of the year. With any Phase II surplus bankable into Phase III, pricing has been driven by political and macroeconomic factors. The increasing renewable generation build rate and the slow pace of economic recovery have led to a large over-supply of carbon allowances in Phase III. The EU is considering a range of options to remedy this over-supply, but these are by no means certain to proceed.
Dark green spread The combination of stable power prices and lower coal and carbon prices drove an improvement in dark green spreads during 2012.
BiomassTypes of biomassBiomass used in energy production comes in many different forms, but the important characteristics shared by the wide range of biomass fuels are that they are renewable and can be sustainable.
The three most common types of biomass used to generate electricity are forestry products and residues, agricultural residues, and energy crops. Recovered materials offer another, very useful, source.
Forestry products and residues Sustainably produced woody biomass can be produced from managed forests and forestry residues, such as thinnings, tree tops and branches. The economics of forest management usually mean that energy is well down the list of potential uses for wood. Timber, the most valuable part of a tree, is generally used for furniture and building materials, while smaller diameter wood can be used for fence posts or by the paper and wood panel industries. This leaves the lower value thinnings and branches for energy production as they often have no other commercial use. In some geographic regions, decline of industries such as construction and paper and pulp means that energy producers may be able to afford fibre previously supplied to these, currently declining, markets. This is welcomed by the forest owners who need to harvest mature trees and thereby maintain investment in sustainable forest management.
C
D
E
Mar
ketp
lace
, per
form
ance
and
ris
kO
verv
iew
Forward carbon price ¤/tonne
25
20
15
10
5
Jan
11M
ar 11
May
11Ju
l 11
Sep
11N
ov 11
Jan
12M
ar 12
May
12Ju
l 12
Sep
12N
ov 12
Jan
13
December 11December 12
December 13December 14
Dark green spread £/MWh
25
20
15
10
5
Jan
11M
ar 11
May
11Ju
l 11
Sep
11N
ov 11
Jan
12M
ar 12
May
12Ju
l 12
Sep
12N
ov 12
Jan
13
Summer 12Winter 12
Summer 13Winter 13
D E
19Drax Group plcAnnual report and
accounts 2012
Fina
ncia
lsG
over
nanc
eC
orpo
rate
and
soc
ial r
espo
nsib
ility
Agricultural residues The by-products of food production, such as straw, oat husks, peanut husks, grape flour, cocoa shells, olive cake and many more, can all be used as biomass for energy production. Importantly, because they are by-products of food production they do not reduce the amount of land available for farming, and they are readily available. Residues from non-food crops, such as cork fines, can also be used. By placing a value on what may be an unwanted by-product of farming, the use of biomass to produce energy provides a new income stream for farmers.
Energy crops These are crops that are planted specifically for the purpose of producing energy. Energy crops include short rotation coppice willow and miscanthus, commonly known as elephant grass. Since the start of the UK’s Energy Crop Scheme in 2000, thousands of hectares of miscanthus and other short rotation coppice crops have been planted in the UK alone.
Recovered materials Recovered wood is an example of a material that could be used as a biomass fuel. The construction and demolition sectors are very large producers of recoverable wood.
Availability of biomassBiomass is a diverse, readily available and plentiful fuel source. According to the International Energy Agency, biomass is the fourth largest energy resource in the world after oil, coal and gas. It estimates that by 2050, sustainable sources of biomass could be enough to supply the world with 10%–20% of its primary energy requirements.
The EU has indicated that the use of biomass will double over the next few years, and be responsible for around a half of the total effort in reaching the EU’s 20% renewable energy target by 2020. In the UK, the Government’s 2012 update to the Renewable Energy Roadmap reports on analysis which indicates that by 2020 as much as 11% of the UK’s total primary energy demand (across heat, transport and electricity) could come from bioenergy.
Biomass procurementOur biomass is procured against our robust sustainability policy which is independently audited. We are in our fifth year of monitoring the carbon footprint of all the biomass we burn. More on our sustainability policy can be found in Corporate and social responsibility.
20 Drax Group plcAnnual report and accounts 2012
Operational and financial performance
Strength across our operations…Introduction
Our 2012 profit reflects continued strength in our operations. We also delivered another year of industry-leading safety statistics, against a backdrop of significant project activity at the Drax site, including a planned double outage and commencement of construction on our new biomass storage and handling facilities.
EBITDA was £298 million for the year ended 31 December 2012 compared to £334 million in 2011 and underlying basic earnings per share were 52 pence compared to 56 pence last year.
A year-on-year increase in gross margin reflects a record level of generation at the power station. This was offset at EBITDA level by higher operating costs of the planned double outage and costs we incurred, following the Government’s confirmation of regulatory support for biomass, as we accelerated our plans to put ourselves in the best possible position to convert a first unit to biomass in April 2013.
Our retail business, Haven Power Limited (“Haven Power”) continued to deliver good growth during 2012. Sales increased from 3.3TWh in 2011 to 5.1TWh in 2012, largely as a result of the planned growth of the industrial and commercial customer base.
Towards the end of the year we secured the financing required to support our biomass transformation plans, with the successful completion of a share placing, agreement of new term loan facilities, and the refinancing of our working capital and letter of credit facilities. With net cash of £311 million at the year end, we have in place a strong financial platform from which to realise our ambitions.
At the upcoming Annual General Meeting, the Board will recommend a final dividend for 2012 of 10.9 pence per share, taking total dividends for the year to £97 million.
This review includes further explanation and commentary in relation to our principal performance indicators and the results for the year.
14 More on: Principal performance indicators
Mar
ketp
lace
, per
form
ance
and
ris
kO
verv
iew
21Drax Group plcAnnual report and
accounts 2012
Fina
ncia
lsG
over
nanc
eC
orpo
rate
and
soc
ial r
espo
nsib
ility
Results of businessYear ended
31 December 2012 £m
Year ended 31 December 2011
£m
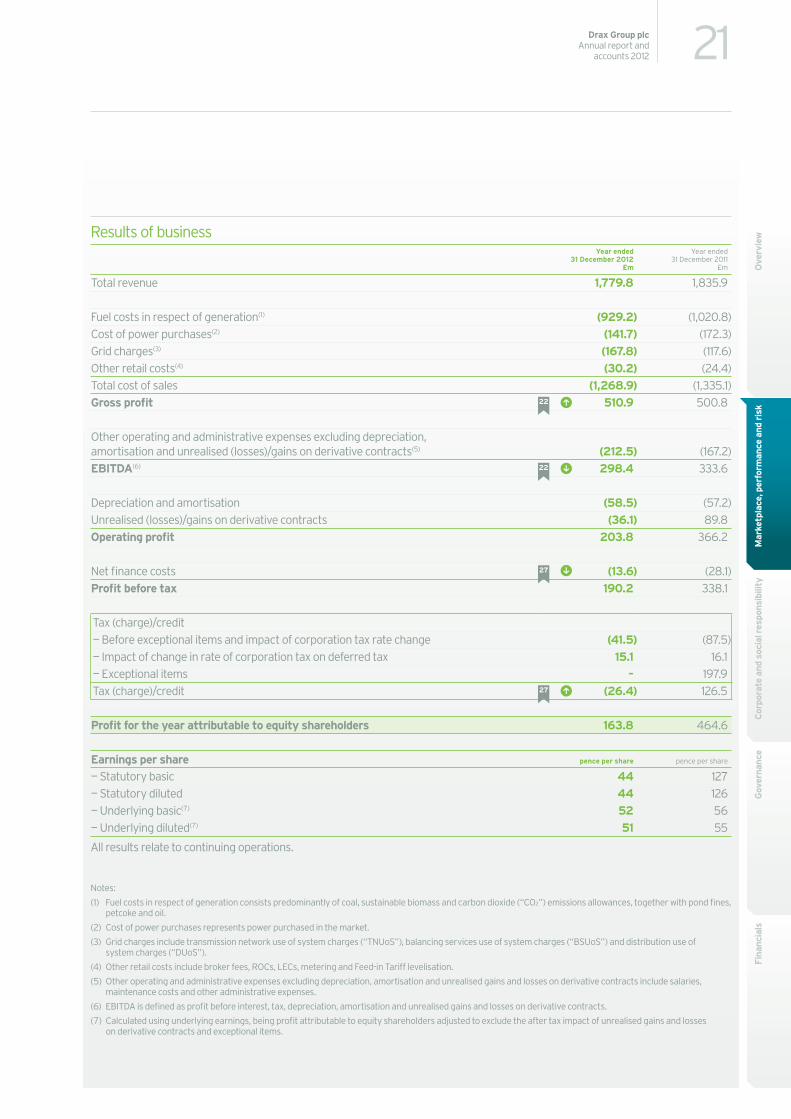
Total revenue 1,779.8 1,835.9
Fuel costs in respect of generation(1) (929.2) (1,020.8)Cost of power purchases(2) (141.7) (172.3)Grid charges(3) (167.8) (117.6)Other retail costs(4) (30.2) (24.4)Total cost of sales (1,268.9) (1,335.1)Gross profit 510.9 500.8
Other operating and administrative expenses excluding depreciation, amortisation and unrealised (losses)/gains on derivative contracts(5) (212.5) (167.2)EBITDA(6) 298.4 333.6
Depreciation and amortisation (58.5) (57.2)Unrealised (losses)/gains on derivative contracts (36.1) 89.8Operating profit 203.8 366.2
Net finance costs (13.6) (28.1)Profit before tax 190.2 338.1
Tax (charge)/credit— Before exceptional items and impact of corporation tax rate change (41.5) (87.5)— Impact of change in rate of corporation tax on deferred tax 15.1 16.1— Exceptional items – 197.9Tax (charge)/credit (26.4) 126.5
Profit for the year attributable to equity shareholders 163.8 464.6
Earnings per share pence per share pence per share
— Statutory basic 44 127— Statutory diluted 44 126— Underlying basic(7) 52 56— Underlying diluted(7) 51 55
All results relate to continuing operations.
Notes:
(1) Fuel costs in respect of generation consists predominantly of coal, sustainable biomass and carbon dioxide (“CO2”) emissions allowances, together with pond fines, petcoke and oil.
(2) Cost of power purchases represents power purchased in the market.
(3) Grid charges include transmission network use of system charges (“TNUoS”), balancing services use of system charges (“BSUoS”) and distribution use of system charges (“DUoS”).
(4) Other retail costs include broker fees, ROCs, LECs, metering and Feed-in Tariff levelisation.
(5) Other operating and administrative expenses excluding depreciation, amortisation and unrealised gains and losses on derivative contracts include salaries, maintenance costs and other administrative expenses.
(6) EBITDA is defined as profit before interest, tax, depreciation, amortisation and unrealised gains and losses on derivative contracts.
(7) Calculated using underlying earnings, being profit attributable to equity shareholders adjusted to exclude the after tax impact of unrealised gains and losses on derivative contracts and exceptional items.
22
22
27
27
Revenue bridge £m
2,100
2,000
1,900
1,800
1,700
1,600
1,500
1,400
1,300
1,200
1,100
Generation Retail Intercompany Group
2,100
2,000
1,900
1,800
1,700
1,600
1,500
1,400
1,300
1,200
1,100
Generation Retail Intercompany Group
2012 2011
A
22 Drax Group plcAnnual report and accounts 2012
Operational and financial performance
Segmental information Year ended
31 December 2012 £m
Year ended 31 December 2011
£m
Revenue A
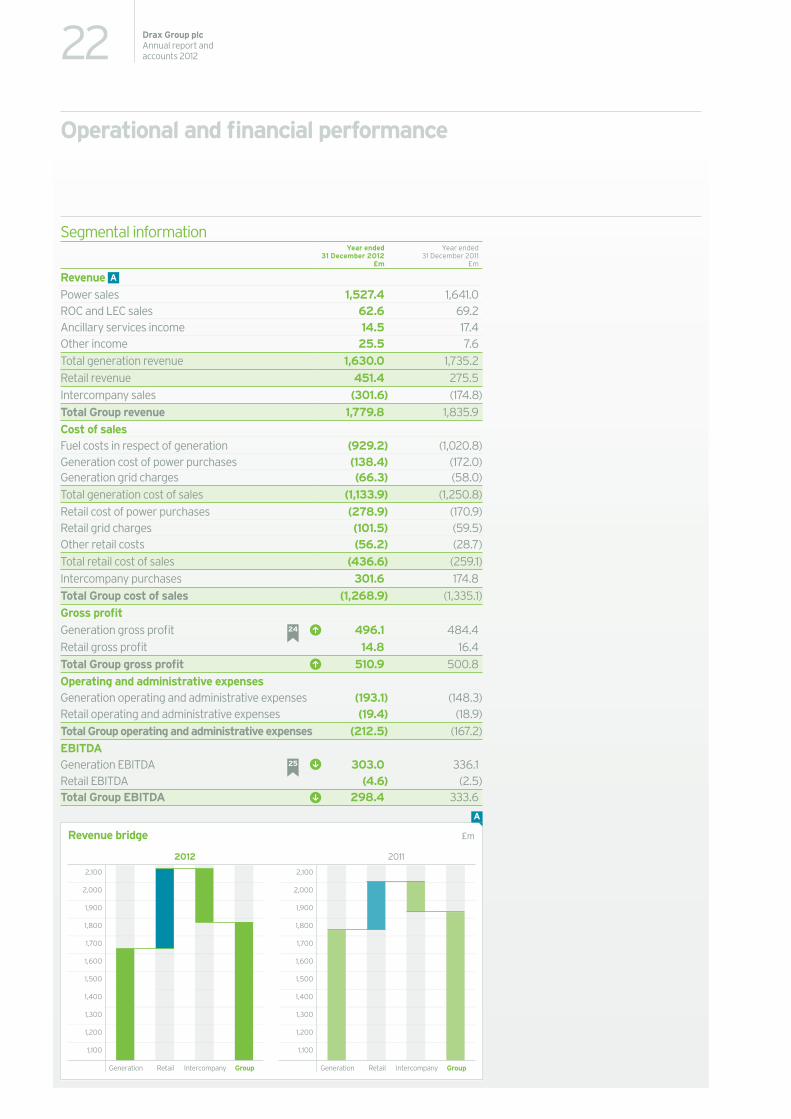
Power sales 1,527.4 1,641.0ROC and LEC sales 62.6 69.2Ancillary services income 14.5 17.4Other income 25.5 7.6Total generation revenue 1,630.0 1,735.2Retail revenue 451.4 275.5Intercompany sales (301.6) (174.8)Total Group revenue 1,779.8 1,835.9Cost of salesFuel costs in respect of generation (929.2) (1,020.8)Generation cost of power purchases (138.4) (172.0)Generation grid charges (66.3) (58.0)Total generation cost of sales (1,133.9) (1,250.8)Retail cost of power purchases (278.9) (170.9)Retail grid charges (101.5) (59.5)Other retail costs (56.2) (28.7)Total retail cost of sales (436.6) (259.1)Intercompany purchases 301.6 174.8Total Group cost of sales (1,268.9) (1,335.1)Gross profit Generation gross profit 496.1 484.4Retail gross profit 14.8 16.4Total Group gross profit 510.9 500.8Operating and administrative expensesGeneration operating and administrative expenses (193.1) (148.3)Retail operating and administrative expenses (19.4) (18.9)Total Group operating and administrative expenses (212.5) (167.2)EBITDAGeneration EBITDA 303.0 336.1Retail EBITDA (4.6) (2.5)Total Group EBITDA 298.4 333.6
24
25
Mar
ketp
lace
, per
form
ance
and
ris
kO
verv
iew
Generation revenue analysis Power sales (£m)Other income (£m)
Net power sold (TWh)Average achieved price (£/MWh)
£103m
2012
£68m
£1,528m
2011
£1,527m
£94m
£1,641m
2010
£51.3/MWh
£55.6/MWh
£51.6/MWh
26.4TWh 26.4TWh27.1TWh
Fuel burn composition (heat) %
2012 2011
Pond fines:3%
Petcoke:1%Biomass:
5%Pond fines:4%
Petcoke:1%
Biomass:2%
BiomassR&D:4%
Biomass R&D:3%
Coal:87%
Coal:90%
B C
23Drax Group plcAnnual report and
accounts 2012
Fina
ncia
lsG
over
nanc
eC
orpo
rate
and
soc
ial r
espo
nsib
ility
Generation results
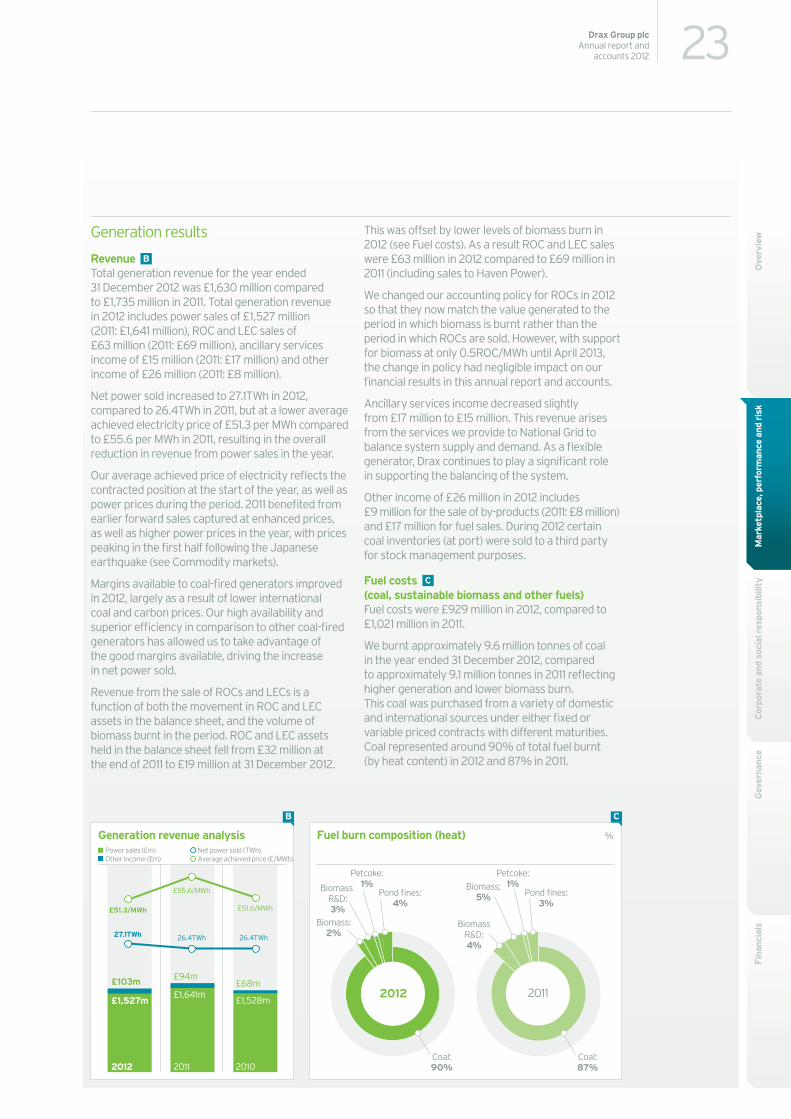
Revenue Total generation revenue for the year ended 31 December 2012 was £1,630 million compared to £1,735 million in 2011. Total generation revenue in 2012 includes power sales of £1,527 million (2011: £1,641 million), ROC and LEC sales of £63 million (2011: £69 million), ancillary services income of £15 million (2011: £17 million) and other income of £26 million (2011: £8 million).
Net power sold increased to 27.1TWh in 2012, compared to 26.4TWh in 2011, but at a lower average achieved electricity price of £51.3 per MWh compared to £55.6 per MWh in 2011, resulting in the overall reduction in revenue from power sales in the year.
Our average achieved price of electricity reflects the contracted position at the start of the year, as well as power prices during the period. 2011 benefited from earlier forward sales captured at enhanced prices, as well as higher power prices in the year, with prices peaking in the first half following the Japanese earthquake (see Commodity markets).
Margins available to coal-fired generators improved in 2012, largely as a result of lower international coal and carbon prices. Our high availability and superior efficiency in comparison to other coal-fired generators has allowed us to take advantage of the good margins available, driving the increase in net power sold.
Revenue from the sale of ROCs and LECs is a function of both the movement in ROC and LEC assets in the balance sheet, and the volume of biomass burnt in the period. ROC and LEC assets held in the balance sheet fell from £32 million at the end of 2011 to £19 million at 31 December 2012.
B
This was offset by lower levels of biomass burn in 2012 (see Fuel costs). As a result ROC and LEC sales were £63 million in 2012 compared to £69 million in 2011 (including sales to Haven Power).
We changed our accounting policy for ROCs in 2012 so that they now match the value generated to the period in which biomass is burnt rather than the period in which ROCs are sold. However, with support for biomass at only 0.5ROC/MWh until April 2013, the change in policy had negligible impact on our financial results in this annual report and accounts.
Ancillary services income decreased slightly from £17 million to £15 million. This revenue arises from the services we provide to National Grid to balance system supply and demand. As a flexible generator, Drax continues to play a significant role in supporting the balancing of the system.
Other income of £26 million in 2012 includes £9 million for the sale of by-products (2011: £8 million) and £17 million for fuel sales. During 2012 certain coal inventories (at port) were sold to a third party for stock management purposes.
Fuel costs (coal, sustainable biomass and other fuels)Fuel costs were £929 million in 2012, compared to £1,021 million in 2011.
We burnt approximately 9.6 million tonnes of coal in the year ended 31 December 2012, compared to approximately 9.1 million tonnes in 2011 reflecting higher generation and lower biomass burn. This coal was purchased from a variety of domestic and international sources under either fixed or variable priced contracts with different maturities. Coal represented around 90% of total fuel burnt (by heat content) in 2012 and 87% in 2011.
C
Group operating and administrative expenses £m
220
200
180
160
2011 costs InflationDouble outageand rates
Investmentin growth
Plan acceleration
2012 costs
D
24 Drax Group plcAnnual report and accounts 2012
We also burnt 0.1 million tonnes of petcoke and 0.6 million tonnes of pond fines in both years. Our petcoke burn volume is driven by its pricing relative to coal. Pond fines is a coal mining residue, which trades at a significant discount to coal, and requires specific blending and handling techniques to burn in large volumes.
In 2012, we burnt 0.7 million tonnes of biomass (2011: 1.3 million tonnes) representing 5% of total fuel burnt by heat content (2011: 9%). The majority of the biomass we burnt in 2012 related to our research and development (“R&D”) trial work. Very little commercial biomass was burnt during the year, as the margins remain weak at current support levels.
The average cost of fuel per MWh (excluding CO2 emissions allowances) was £30.6 for the year ended 31 December 2012 (net of £17 million fuel sales described above), compared to £33.3 in 2011. The decrease in average fuel prices was driven by the falling price of international coal (see Commodity markets) and the fuel mix, with much lower biomass burn in 2012.
Fuel costs (CO2 emissions allowances)For Phase II of the EU ETS (2008–2012), Drax had an allocation of 9.5 million tonnes of CO2 emissions allowances per annum under the UK NAP. We purchase CO2 emissions allowances under fixed price contracts with different maturity dates from a variety of domestic and international sources.
Our CO2 emissions allowances requirement for the year ended 31 December 2012, in excess of those allocated under the UK NAP, was approximately 13.1 million tonnes compared to approximately 11.6 million tonnes in 2011. This was a result of higher generation and the change in fuel mix described above.
Our average price of carbon is a function of the timing of purchases under fixed price contracts in the forward and near-term markets. The average price expensed for purchased CO2 emissions allowances during the year ended 31 December 2012 was £6.3 per tonne compared to £12.0 per tonne in 2011. This reflects the significant fall in carbon prices since mid-2011 (see Commodity markets).
Cost of power purchasesWe purchase power in the market when the cost of power in the market is below our marginal cost of production in respect of power previously contracted for generation and delivery by us, and to cover any shortfall in generation. For the year ended 31 December 2012, the cost of purchased power for the generation business was £138 million, compared to £172 million incurred in 2011, reflecting lower average power prices in 2012 (see Commodity markets).
Grid chargesGrid charges for generation for the year ended 31 December 2012 were £66 million, compared to £58 million in 2011. The increase resulted from higher generation and an increase in the rate charged by National Grid to reflect the impact of increased intermittent generation on system balancing costs.
Higher net power sold and improved dark green spreads resulted in generation gross profit for the year ended 31 December 2012 of £496 million compared to £484 million in 2011.
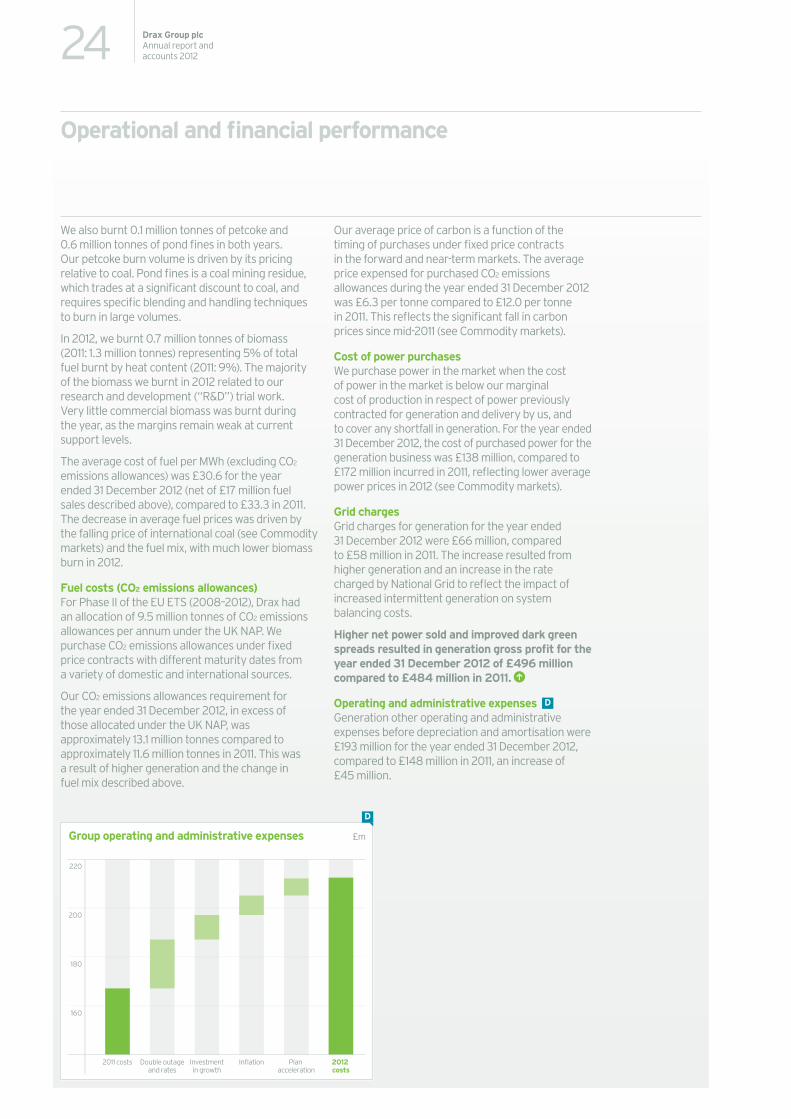
Operating and administrative expenses Generation other operating and administrative expenses before depreciation and amortisation were £193 million for the year ended 31 December 2012, compared to £148 million in 2011, an increase of £45 million.
D
Operational and financial performance
Mar
ketp
lace
, per
form
ance
and
ris
kO
verv
iew
Net generation split by customer (1)
2012 2011
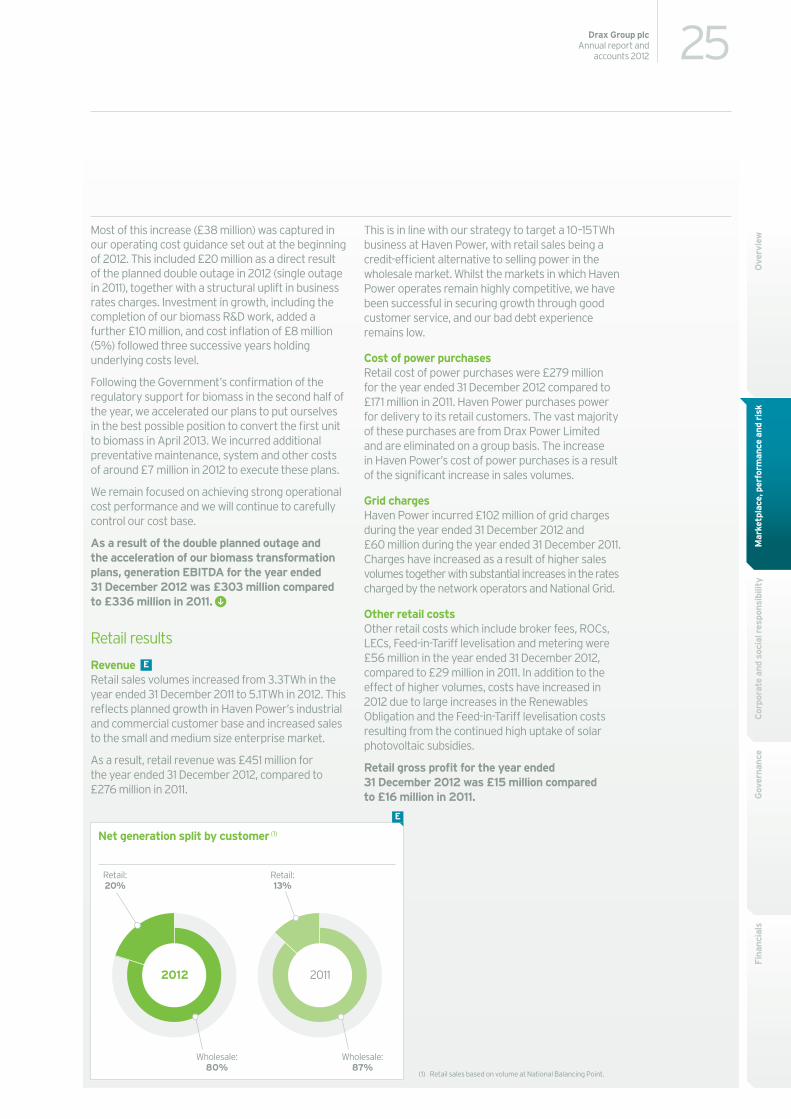
Retail:13%
Retail:20%
Wholesale:87%
Wholesale:80%
E
(1) Retail sales based on volume at National Balancing Point.
25Drax Group plcAnnual report and
accounts 2012
Fina
ncia
lsG
over
nanc
eC
orpo
rate
and
soc
ial r
espo
nsib
ility
Most of this increase (£38 million) was captured in our operating cost guidance set out at the beginning of 2012. This included £20 million as a direct result of the planned double outage in 2012 (single outage in 2011), together with a structural uplift in business rates charges. Investment in growth, including the completion of our biomass R&D work, added a further £10 million, and cost inflation of £8 million (5%) followed three successive years holding underlying costs level.
Following the Government’s confirmation of the regulatory support for biomass in the second half of the year, we accelerated our plans to put ourselves in the best possible position to convert the first unit to biomass in April 2013. We incurred additional preventative maintenance, system and other costs of around £7 million in 2012 to execute these plans.
We remain focused on achieving strong operational cost performance and we will continue to carefully control our cost base.
As a result of the double planned outage and the acceleration of our biomass transformation plans, generation EBITDA for the year ended 31 December 2012 was £303 million compared to £336 million in 2011.
Retail results
Revenue Retail sales volumes increased from 3.3TWh in the year ended 31 December 2011 to 5.1TWh in 2012. This reflects planned growth in Haven Power’s industrial and commercial customer base and increased sales to the small and medium size enterprise market.
As a result, retail revenue was £451 million for the year ended 31 December 2012, compared to £276 million in 2011.
E
This is in line with our strategy to target a 10–15TWh business at Haven Power, with retail sales being a credit-efficient alternative to selling power in the wholesale market. Whilst the markets in which Haven Power operates remain highly competitive, we have been successful in securing growth through good customer service, and our bad debt experience remains low.
Cost of power purchasesRetail cost of power purchases were £279 million for the year ended 31 December 2012 compared to £171 million in 2011. Haven Power purchases power for delivery to its retail customers. The vast majority of these purchases are from Drax Power Limited and are eliminated on a group basis. The increase in Haven Power’s cost of power purchases is a result of the significant increase in sales volumes.
Grid chargesHaven Power incurred £102 million of grid charges during the year ended 31 December 2012 and £60 million during the year ended 31 December 2011. Charges have increased as a result of higher sales volumes together with substantial increases in the rates charged by the network operators and National Grid.
Other retail costsOther retail costs which include broker fees, ROCs, LECs, Feed-in-Tariff levelisation and metering were £56 million in the year ended 31 December 2012, compared to £29 million in 2011. In addition to the effect of higher volumes, costs have increased in 2012 due to large increases in the Renewables Obligation and the Feed-in-Tariff levelisation costs resulting from the continued high uptake of solar photovoltaic subsidies.
Retail gross profit for the year ended 31 December 2012 was £15 million compared to £16 million in 2011.
26 Drax Group plcAnnual report and accounts 2012
Operating and administrative expensesRetail operating and administrative expenses excluding depreciation and amortisation were £19 million for the year ended 31 December 2012, consistent with 2011. Higher staff costs to support the continued growth in the business have been offset by a reduction in other operating and administrative expenses.
Retail EBITDA for the year ended 31 December 2012 was a loss of £5 million compared to a loss of £3 million in 2011.
Central costs
Depreciation and amortisationDepreciation and amortisation was £59 million for the year ended 31 December 2012 and £57 million for the year ended 31 December 2011.
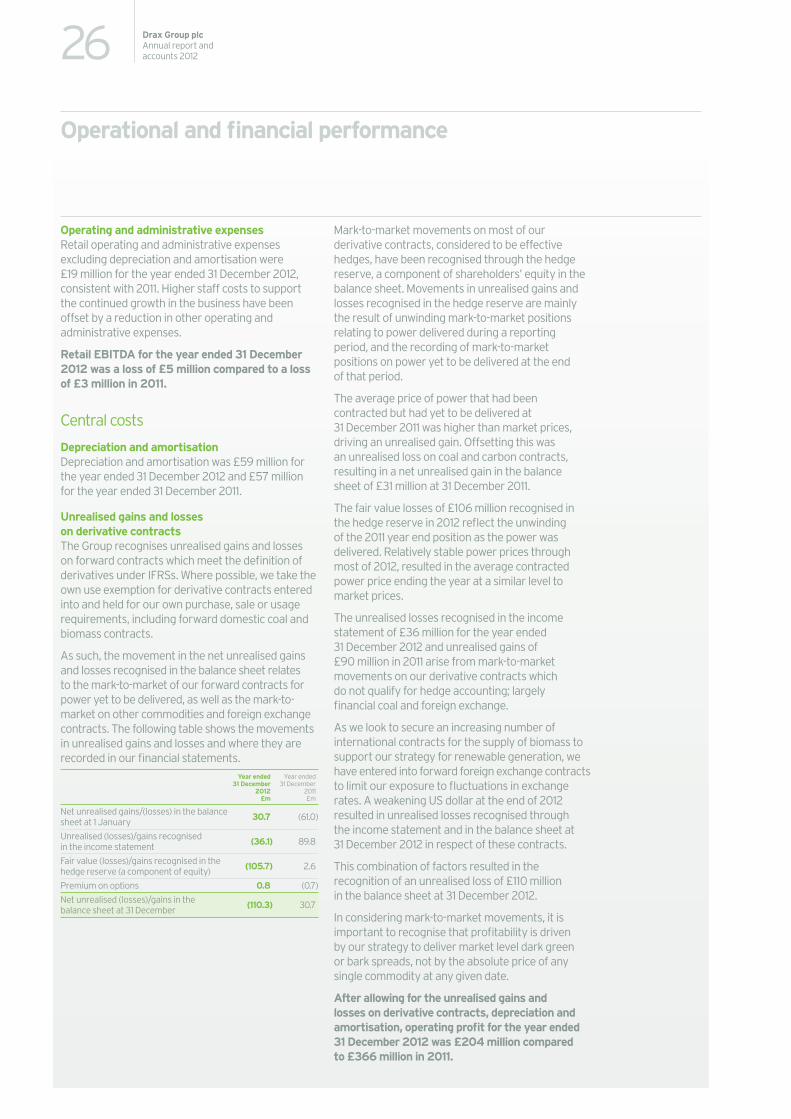
Unrealised gains and losses on derivative contractsThe Group recognises unrealised gains and losses on forward contracts which meet the definition of derivatives under IFRSs. Where possible, we take the own use exemption for derivative contracts entered into and held for our own purchase, sale or usage requirements, including forward domestic coal and biomass contracts.
As such, the movement in the net unrealised gains and losses recognised in the balance sheet relates to the mark-to-market of our forward contracts for power yet to be delivered, as well as the mark-to-market on other commodities and foreign exchange contracts. The following table shows the movements in unrealised gains and losses and where they are recorded in our financial statements.
Year ended 31 December
2012 £m
Year ended 31 December
2011 £m
Net unrealised gains/(losses) in the balance sheet at 1 January 30.7 (61.0)
Unrealised (losses)/gains recognised in the income statement (36.1) 89.8
Fair value (losses)/gains recognised in the hedge reserve (a component of equity) (105.7) 2.6
Premium on options 0.8 (0.7)
Net unrealised (losses)/gains in the balance sheet at 31 December (110.3) 30.7
Mark-to-market movements on most of our derivative contracts, considered to be effective hedges, have been recognised through the hedge reserve, a component of shareholders’ equity in the balance sheet. Movements in unrealised gains and losses recognised in the hedge reserve are mainly the result of unwinding mark-to-market positions relating to power delivered during a reporting period, and the recording of mark-to-market positions on power yet to be delivered at the end of that period.
The average price of power that had been contracted but had yet to be delivered at 31 December 2011 was higher than market prices, driving an unrealised gain. Offsetting this was an unrealised loss on coal and carbon contracts, resulting in a net unrealised gain in the balance sheet of £31 million at 31 December 2011.
The fair value losses of £106 million recognised in the hedge reserve in 2012 reflect the unwinding of the 2011 year end position as the power was delivered. Relatively stable power prices through most of 2012, resulted in the average contracted power price ending the year at a similar level to market prices.
The unrealised losses recognised in the income statement of £36 million for the year ended 31 December 2012 and unrealised gains of £90 million in 2011 arise from mark-to-market movements on our derivative contracts which do not qualify for hedge accounting; largely financial coal and foreign exchange.
As we look to secure an increasing number of international contracts for the supply of biomass to support our strategy for renewable generation, we have entered into forward foreign exchange contracts to limit our exposure to fluctuations in exchange rates. A weakening US dollar at the end of 2012 resulted in unrealised losses recognised through the income statement and in the balance sheet at 31 December 2012 in respect of these contracts.
This combination of factors resulted in the recognition of an unrealised loss of £110 million in the balance sheet at 31 December 2012.
In considering mark-to-market movements, it is important to recognise that profitability is driven by our strategy to deliver market level dark green or bark spreads, not by the absolute price of any single commodity at any given date.
After allowing for the unrealised gains and losses on derivative contracts, depreciation and amortisation, operating profit for the year ended 31 December 2012 was £204 million compared to £366 million in 2011.
Operational and financial performance
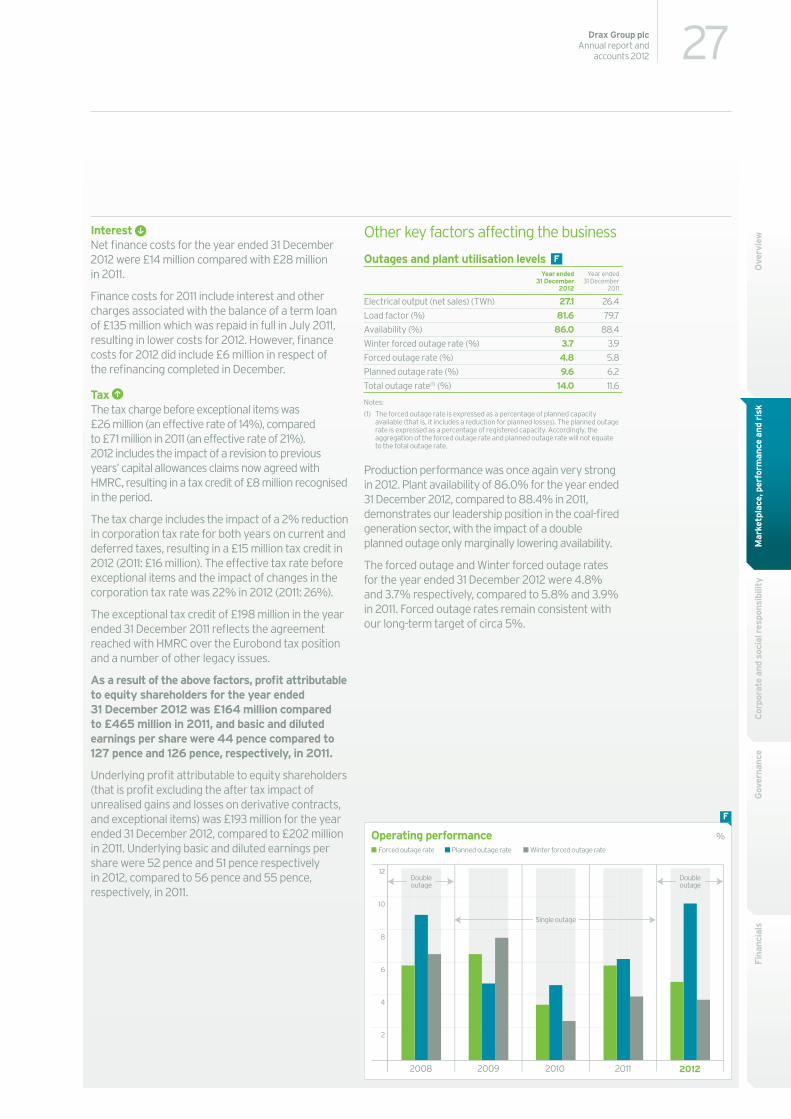
Mar
ketp
lace
, per
form
ance
and
ris
kO
verv
iew
Operating performance %
20122011201020092008
12
10
8
6
4
2
Planned outage rate
Doubleoutage
Doubleoutage
Forced outage rate Winter forced outage rate
Single outage
F
27Drax Group plcAnnual report and
accounts 2012
Fina
ncia
lsG
over
nanc
eC
orpo
rate
and
soc
ial r
espo
nsib
ility
Interest Net finance costs for the year ended 31 December 2012 were £14 million compared with £28 million in 2011.
Finance costs for 2011 include interest and other charges associated with the balance of a term loan of £135 million which was repaid in full in July 2011, resulting in lower costs for 2012. However, finance costs for 2012 did include £6 million in respect of the refinancing completed in December.
Tax The tax charge before exceptional items was £26 million (an effective rate of 14%), compared to £71 million in 2011 (an effective rate of 21%). 2012 includes the impact of a revision to previous years’ capital allowances claims now agreed with HMRC, resulting in a tax credit of £8 million recognised in the period.
The tax charge includes the impact of a 2% reduction in corporation tax rate for both years on current and deferred taxes, resulting in a £15 million tax credit in 2012 (2011: £16 million). The effective tax rate before exceptional items and the impact of changes in the corporation tax rate was 22% in 2012 (2011: 26%).
The exceptional tax credit of £198 million in the year ended 31 December 2011 reflects the agreement reached with HMRC over the Eurobond tax position and a number of other legacy issues.
As a result of the above factors, profit attributable to equity shareholders for the year ended 31 December 2012 was £164 million compared to £465 million in 2011, and basic and diluted earnings per share were 44 pence compared to 127 pence and 126 pence, respectively, in 2011.
Underlying profit attributable to equity shareholders (that is profit excluding the after tax impact of unrealised gains and losses on derivative contracts, and exceptional items) was £193 million for the year ended 31 December 2012, compared to £202 million in 2011. Underlying basic and diluted earnings per share were 52 pence and 51 pence respectively in 2012, compared to 56 pence and 55 pence, respectively, in 2011.
Other key factors affecting the business
Outages and plant utilisation levels Year ended
31 December 2012
Year ended 31 December
2011
Electrical output (net sales) (TWh) 27.1 26.4
Load factor (%) 81.6 79.7
Availability (%) 86.0 88.4
Winter forced outage rate (%) 3.7 3.9
Forced outage rate (%) 4.8 5.8
Planned outage rate (%) 9.6 6.2
Total outage rate(1) (%) 14.0 11.6
Notes:
(1) The forced outage rate is expressed as a percentage of planned capacity available (that is, it includes a reduction for planned losses). The planned outage rate is expressed as a percentage of registered capacity. Accordingly, the aggregation of the forced outage rate and planned outage rate will not equate to the total outage rate.
Production performance was once again very strong in 2012. Plant availability of 86.0% for the year ended 31 December 2012, compared to 88.4% in 2011, demonstrates our leadership position in the coal-fired generation sector, with the impact of a double planned outage only marginally lowering availability.
The forced outage and Winter forced outage rates for the year ended 31 December 2012 were 4.8% and 3.7% respectively, compared to 5.8% and 3.9% in 2011. Forced outage rates remain consistent with our long-term target of circa 5%.
F
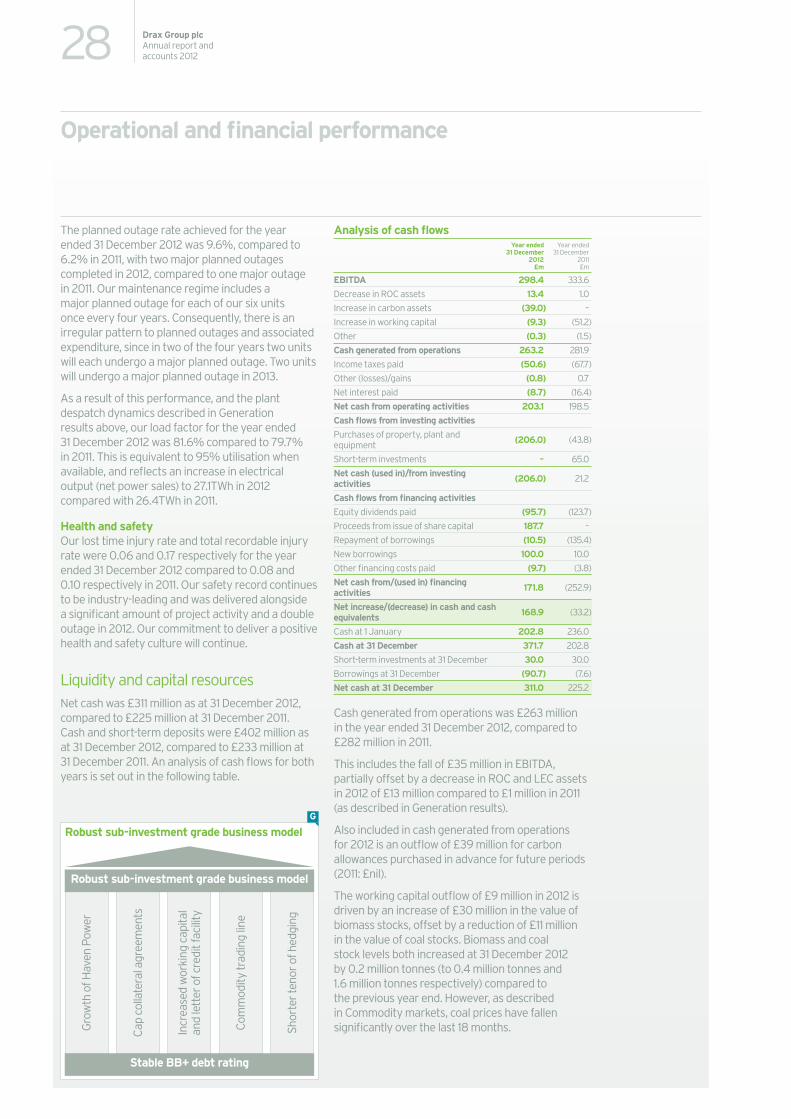
Robust sub-investment grade business model
Gro
wth
of H
aven
Pow
er
Cap
colla
tera
l agr
eem
ents
Incr
ease
d w
orki
ng c
apita
l an
d le
tter
of c
redi
t fac
ility
Com
mod
ity tr
adin
g lin
e
Shor
ter t
enor
of h
edgi
ng
Stable BB+ debt rating
Robust sub-investment grade business model
G
28 Drax Group plcAnnual report and accounts 2012
The planned outage rate achieved for the year ended 31 December 2012 was 9.6%, compared to 6.2% in 2011, with two major planned outages completed in 2012, compared to one major outage in 2011. Our maintenance regime includes a major planned outage for each of our six units once every four years. Consequently, there is an irregular pattern to planned outages and associated expenditure, since in two of the four years two units will each undergo a major planned outage. Two units will undergo a major planned outage in 2013.
As a result of this performance, and the plant despatch dynamics described in Generation results above, our load factor for the year ended 31 December 2012 was 81.6% compared to 79.7% in 2011. This is equivalent to 95% utilisation when available, and reflects an increase in electrical output (net power sales) to 27.1TWh in 2012 compared with 26.4TWh in 2011.
Health and safetyOur lost time injury rate and total recordable injury rate were 0.06 and 0.17 respectively for the year ended 31 December 2012 compared to 0.08 and 0.10 respectively in 2011. Our safety record continues to be industry-leading and was delivered alongside a significant amount of project activity and a double outage in 2012. Our commitment to deliver a positive health and safety culture will continue.
Liquidity and capital resourcesNet cash was £311 million as at 31 December 2012, compared to £225 million at 31 December 2011. Cash and short-term deposits were £402 million as at 31 December 2012, compared to £233 million at 31 December 2011. An analysis of cash flows for both years is set out in the following table.
Analysis of cash flowsYear ended
31 December 2012
£m
Year ended 31 December
2011 £m
EBITDA 298.4 333.6
Decrease in ROC assets 13.4 1.0
Increase in carbon assets (39.0) –
Increase in working capital (9.3) (51.2)
Other (0.3) (1.5)
Cash generated from operations 263.2 281.9
Income taxes paid (50.6) (67.7)
Other (losses)/gains (0.8) 0.7
Net interest paid (8.7) (16.4)
Net cash from operating activities 203.1 198.5
Cash flows from investing activities
Purchases of property, plant and equipment (206.0) (43.8)
Short-term investments – 65.0
Net cash (used in)/from investing activities (206.0) 21.2
Cash flows from financing activities
Equity dividends paid (95.7) (123.7)
Proceeds from issue of share capital 187.7 –
Repayment of borrowings (10.5) (135.4)
New borrowings 100.0 10.0
Other financing costs paid (9.7) (3.8)
Net cash from/(used in) financing activities 171.8 (252.9)
Net increase/(decrease) in cash and cash equivalents 168.9 (33.2)
Cash at 1 January 202.8 236.0
Cash at 31 December 371.7 202.8
Short-term investments at 31 December 30.0 30.0
Borrowings at 31 December (90.7) (7.6)
Net cash at 31 December 311.0 225.2
Cash generated from operations was £263 million in the year ended 31 December 2012, compared to £282 million in 2011.
This includes the fall of £35 million in EBITDA, partially offset by a decrease in ROC and LEC assets in 2012 of £13 million compared to £1 million in 2011 (as described in Generation results).
Also included in cash generated from operations for 2012 is an outflow of £39 million for carbon allowances purchased in advance for future periods (2011: £nil).
The working capital outflow of £9 million in 2012 is driven by an increase of £30 million in the value of biomass stocks, offset by a reduction of £11 million in the value of coal stocks. Biomass and coal stock levels both increased at 31 December 2012 by 0.2 million tonnes (to 0.4 million tonnes and 1.6 million tonnes respectively) compared to the previous year end. However, as described in Commodity markets, coal prices have fallen significantly over the last 18 months.
Operational and financial performance
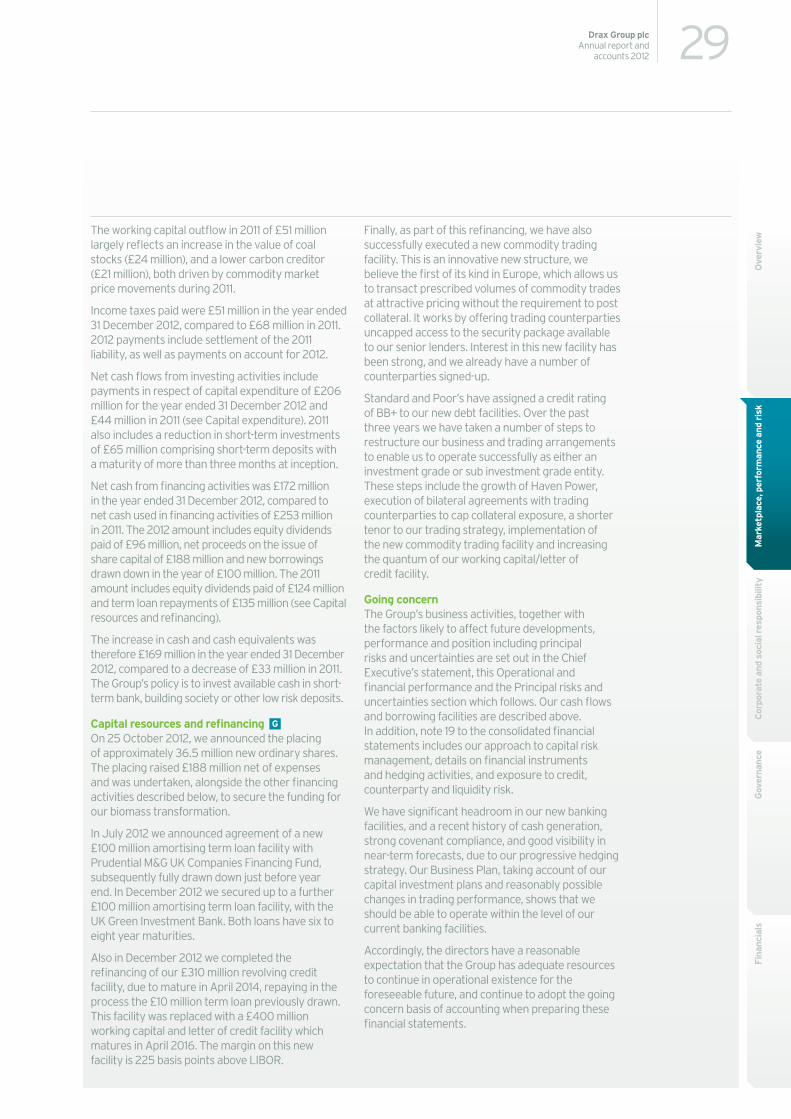
Mar
ketp
lace
, per
form
ance
and
ris
kO
verv
iew
29Drax Group plcAnnual report and
accounts 2012
Fina
ncia
lsG
over
nanc
eC
orpo
rate
and
soc
ial r
espo
nsib
ility
The working capital outflow in 2011 of £51 million largely reflects an increase in the value of coal stocks (£24 million), and a lower carbon creditor (£21 million), both driven by commodity market price movements during 2011.
Income taxes paid were £51 million in the year ended 31 December 2012, compared to £68 million in 2011. 2012 payments include settlement of the 2011 liability, as well as payments on account for 2012.
Net cash flows from investing activities include payments in respect of capital expenditure of £206 million for the year ended 31 December 2012 and £44 million in 2011 (see Capital expenditure). 2011 also includes a reduction in short-term investments of £65 million comprising short-term deposits with a maturity of more than three months at inception.
Net cash from financing activities was £172 million in the year ended 31 December 2012, compared to net cash used in financing activities of £253 million in 2011. The 2012 amount includes equity dividends paid of £96 million, net proceeds on the issue of share capital of £188 million and new borrowings drawn down in the year of £100 million. The 2011 amount includes equity dividends paid of £124 million and term loan repayments of £135 million (see Capital resources and refinancing).
The increase in cash and cash equivalents was therefore £169 million in the year ended 31 December 2012, compared to a decrease of £33 million in 2011. The Group’s policy is to invest available cash in short-term bank, building society or other low risk deposits.
Capital resources and refinancing On 25 October 2012, we announced the placing of approximately 36.5 million new ordinary shares. The placing raised £188 million net of expenses and was undertaken, alongside the other financing activities described below, to secure the funding for our biomass transformation.
In July 2012 we announced agreement of a new £100 million amortising term loan facility with Prudential M&G UK Companies Financing Fund, subsequently fully drawn down just before year end. In December 2012 we secured up to a further £100 million amortising term loan facility, with the UK Green Investment Bank. Both loans have six to eight year maturities.
Also in December 2012 we completed the refinancing of our £310 million revolving credit facility, due to mature in April 2014, repaying in the process the £10 million term loan previously drawn. This facility was replaced with a £400 million working capital and letter of credit facility which matures in April 2016. The margin on this new facility is 225 basis points above LIBOR.
G
Finally, as part of this refinancing, we have also successfully executed a new commodity trading facility. This is an innovative new structure, we believe the first of its kind in Europe, which allows us to transact prescribed volumes of commodity trades at attractive pricing without the requirement to post collateral. It works by offering trading counterparties uncapped access to the security package available to our senior lenders. Interest in this new facility has been strong, and we already have a number of counterparties signed-up.
Standard and Poor’s have assigned a credit rating of BB+ to our new debt facilities. Over the past three years we have taken a number of steps to restructure our business and trading arrangements to enable us to operate successfully as either an investment grade or sub investment grade entity. These steps include the growth of Haven Power, execution of bilateral agreements with trading counterparties to cap collateral exposure, a shorter tenor to our trading strategy, implementation of the new commodity trading facility and increasing the quantum of our working capital/letter of credit facility.
Going concernThe Group’s business activities, together with the factors likely to affect future developments, performance and position including principal risks and uncertainties are set out in the Chief Executive’s statement, this Operational and financial performance and the Principal risks and uncertainties section which follows. Our cash flows and borrowing facilities are described above. In addition, note 19 to the consolidated financial statements includes our approach to capital risk management, details on financial instruments and hedging activities, and exposure to credit, counterparty and liquidity risk.
We have significant headroom in our new banking facilities, and a recent history of cash generation, strong covenant compliance, and good visibility in near-term forecasts, due to our progressive hedging strategy. Our Business Plan, taking account of our capital investment plans and reasonably possible changes in trading performance, shows that we should be able to operate within the level of our current banking facilities.
Accordingly, the directors have a reasonable expectation that the Group has adequate resources to continue in operational existence for the foreseeable future, and continue to adopt the going concern basis of accounting when preparing these financial statements.
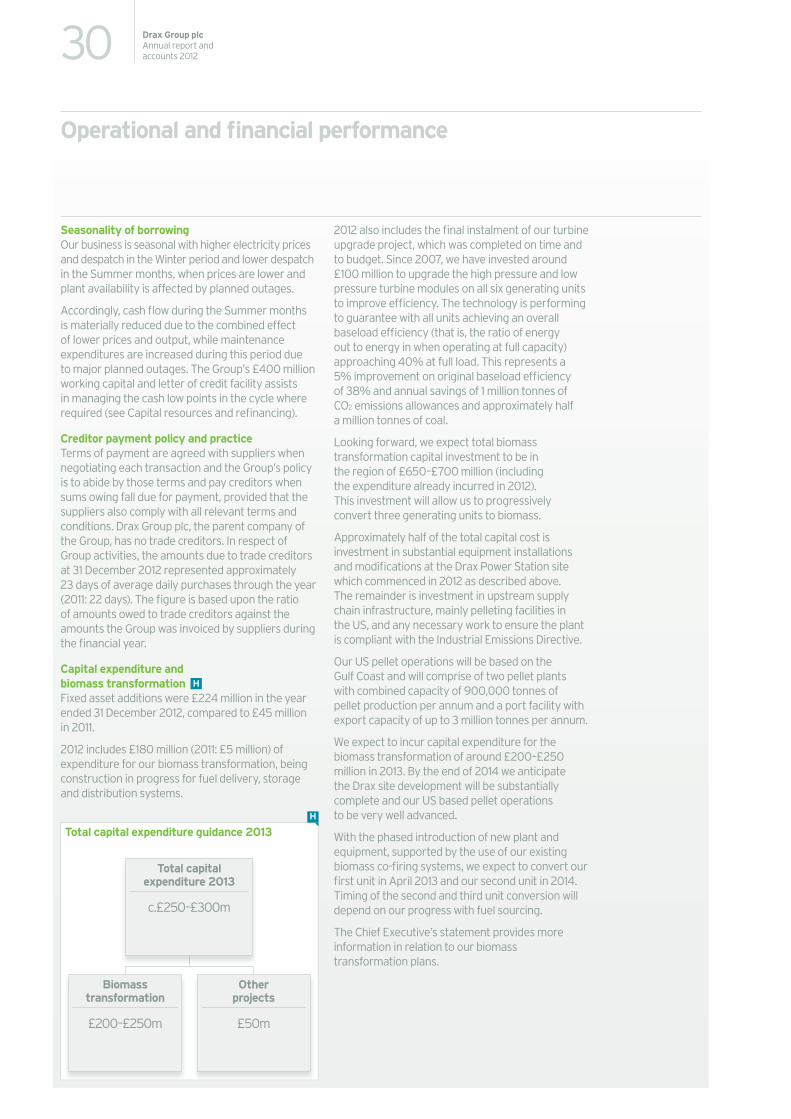
Total capital expenditure guidance 2013H
Total capital expenditure 2013
c.£250–£300m
Biomass transformation
£200–£250m
Other projects
£50m
30 Drax Group plcAnnual report and accounts 2012
Seasonality of borrowingOur business is seasonal with higher electricity prices and despatch in the Winter period and lower despatch in the Summer months, when prices are lower and plant availability is affected by planned outages.
Accordingly, cash flow during the Summer months is materially reduced due to the combined effect of lower prices and output, while maintenance expenditures are increased during this period due to major planned outages. The Group’s £400 million working capital and letter of credit facility assists in managing the cash low points in the cycle where required (see Capital resources and refinancing).
Creditor payment policy and practiceTerms of payment are agreed with suppliers when negotiating each transaction and the Group’s policy is to abide by those terms and pay creditors when sums owing fall due for payment, provided that the suppliers also comply with all relevant terms and conditions. Drax Group plc, the parent company of the Group, has no trade creditors. In respect of Group activities, the amounts due to trade creditors at 31 December 2012 represented approximately 23 days of average daily purchases through the year (2011: 22 days). The figure is based upon the ratio of amounts owed to trade creditors against the amounts the Group was invoiced by suppliers during the financial year.
Capital expenditure and biomass transformation Fixed asset additions were £224 million in the year ended 31 December 2012, compared to £45 million in 2011.
2012 includes £180 million (2011: £5 million) of expenditure for our biomass transformation, being construction in progress for fuel delivery, storage and distribution systems.
H
2012 also includes the final instalment of our turbine upgrade project, which was completed on time and to budget. Since 2007, we have invested around £100 million to upgrade the high pressure and low pressure turbine modules on all six generating units to improve efficiency. The technology is performing to guarantee with all units achieving an overall baseload efficiency (that is, the ratio of energy out to energy in when operating at full capacity) approaching 40% at full load. This represents a 5% improvement on original baseload efficiency of 38% and annual savings of 1 million tonnes of CO2 emissions allowances and approximately half a million tonnes of coal.
Looking forward, we expect total biomass transformation capital investment to be in the region of £650–£700 million (including the expenditure already incurred in 2012). This investment will allow us to progressively convert three generating units to biomass.
Approximately half of the total capital cost is investment in substantial equipment installations and modifications at the Drax Power Station site which commenced in 2012 as described above. The remainder is investment in upstream supply chain infrastructure, mainly pelleting facilities in the US, and any necessary work to ensure the plant is compliant with the Industrial Emissions Directive.
Our US pellet operations will be based on the Gulf Coast and will comprise of two pellet plants with combined capacity of 900,000 tonnes of pellet production per annum and a port facility with export capacity of up to 3 million tonnes per annum.
We expect to incur capital expenditure for the biomass transformation of around £200–£250 million in 2013. By the end of 2014 we anticipate the Drax site development will be substantially complete and our US based pellet operations to be very well advanced.
With the phased introduction of new plant and equipment, supported by the use of our existing biomass co-firing systems, we expect to convert our first unit in April 2013 and our second unit in 2014. Timing of the second and third unit conversion will depend on our progress with fuel sourcing.
The Chief Executive’s statement provides more information in relation to our biomass transformation plans.
Operational and financial performance
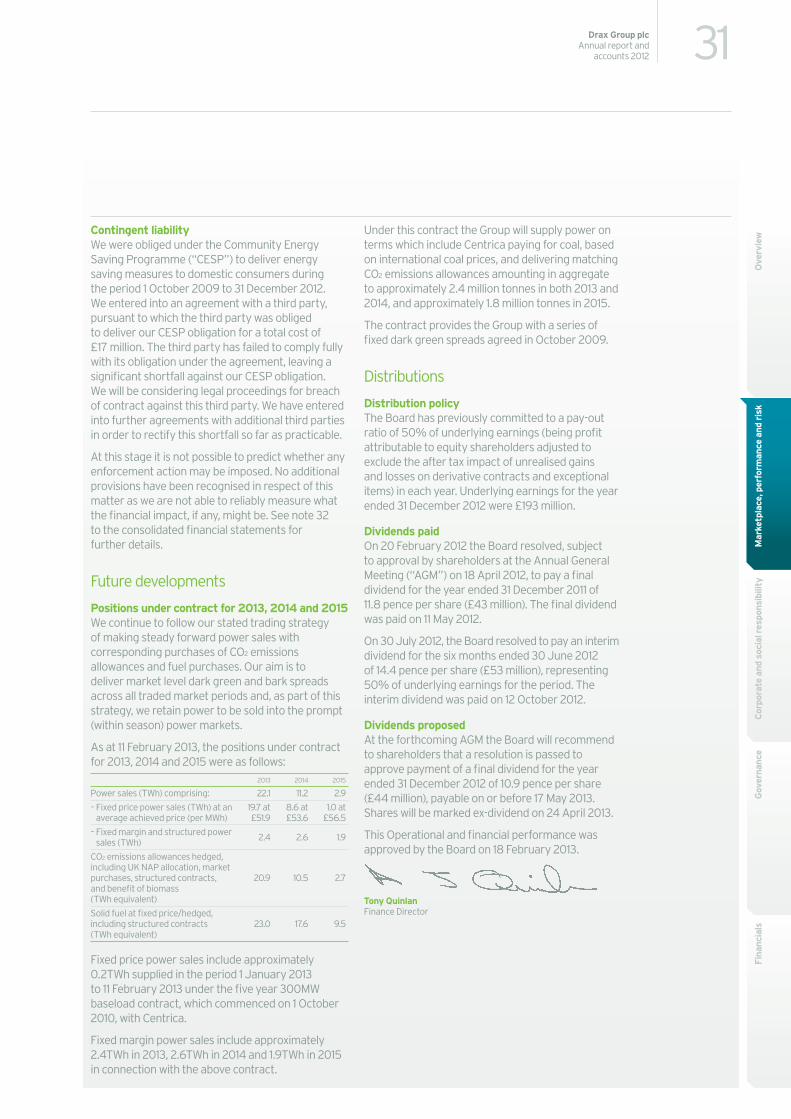
Mar
ketp
lace
, per
form
ance
and
ris
kO
verv
iew
31Drax Group plcAnnual report and
accounts 2012
Fina
ncia
lsG
over
nanc
eC
orpo
rate
and
soc
ial r
espo
nsib
ility
Contingent liabilityWe were obliged under the Community Energy Saving Programme (“CESP”) to deliver energy saving measures to domestic consumers during the period 1 October 2009 to 31 December 2012. We entered into an agreement with a third party, pursuant to which the third party was obliged to deliver our CESP obligation for a total cost of £17 million. The third party has failed to comply fully with its obligation under the agreement, leaving a significant shortfall against our CESP obligation. We will be considering legal proceedings for breach of contract against this third party. We have entered into further agreements with additional third parties in order to rectify this shortfall so far as practicable.
At this stage it is not possible to predict whether any enforcement action may be imposed. No additional provisions have been recognised in respect of this matter as we are not able to reliably measure what the financial impact, if any, might be. See note 32 to the consolidated financial statements for further details.
Future developments
Positions under contract for 2013, 2014 and 2015We continue to follow our stated trading strategy of making steady forward power sales with corresponding purchases of CO2 emissions allowances and fuel purchases. Our aim is to deliver market level dark green and bark spreads across all traded market periods and, as part of this strategy, we retain power to be sold into the prompt (within season) power markets.
As at 11 February 2013, the positions under contract for 2013, 2014 and 2015 were as follows:
2013 2014 2015
Power sales (TWh) comprising: 22.1 11.2 2.9
– Fixed price power sales (TWh) at an average achieved price (per MWh)
19.7 at £51.9
8.6 at £53.6
1.0 at £56.5
– Fixed margin and structured power sales (TWh) 2.4 2.6 1.9
CO2 emissions allowances hedged, including UK NAP allocation, market purchases, structured contracts, and benefit of biomass (TWh equivalent)
20.9 10.5 2.7
Solid fuel at fixed price/hedged, including structured contracts (TWh equivalent)
23.0 17.6 9.5
Fixed price power sales include approximately 0.2TWh supplied in the period 1 January 2013 to 11 February 2013 under the five year 300MW baseload contract, which commenced on 1 October 2010, with Centrica.
Fixed margin power sales include approximately 2.4TWh in 2013, 2.6TWh in 2014 and 1.9TWh in 2015 in connection with the above contract.
Under this contract the Group will supply power on terms which include Centrica paying for coal, based on international coal prices, and delivering matching CO2 emissions allowances amounting in aggregate to approximately 2.4 million tonnes in both 2013 and 2014, and approximately 1.8 million tonnes in 2015.
The contract provides the Group with a series of fixed dark green spreads agreed in October 2009.
Distributions
Distribution policyThe Board has previously committed to a pay-out ratio of 50% of underlying earnings (being profit attributable to equity shareholders adjusted to exclude the after tax impact of unrealised gains and losses on derivative contracts and exceptional items) in each year. Underlying earnings for the year ended 31 December 2012 were £193 million.
Dividends paid On 20 February 2012 the Board resolved, subject to approval by shareholders at the Annual General Meeting (“AGM”) on 18 April 2012, to pay a final dividend for the year ended 31 December 2011 of 11.8 pence per share (£43 million). The final dividend was paid on 11 May 2012.
On 30 July 2012, the Board resolved to pay an interim dividend for the six months ended 30 June 2012 of 14.4 pence per share (£53 million), representing 50% of underlying earnings for the period. The interim dividend was paid on 12 October 2012.
Dividends proposedAt the forthcoming AGM the Board will recommend to shareholders that a resolution is passed to approve payment of a final dividend for the year ended 31 December 2012 of 10.9 pence per share (£44 million), payable on or before 17 May 2013. Shares will be marked ex-dividend on 24 April 2013.
This Operational and financial performance was approved by the Board on 18 February 2013.
Tony Quinlan Finance Director
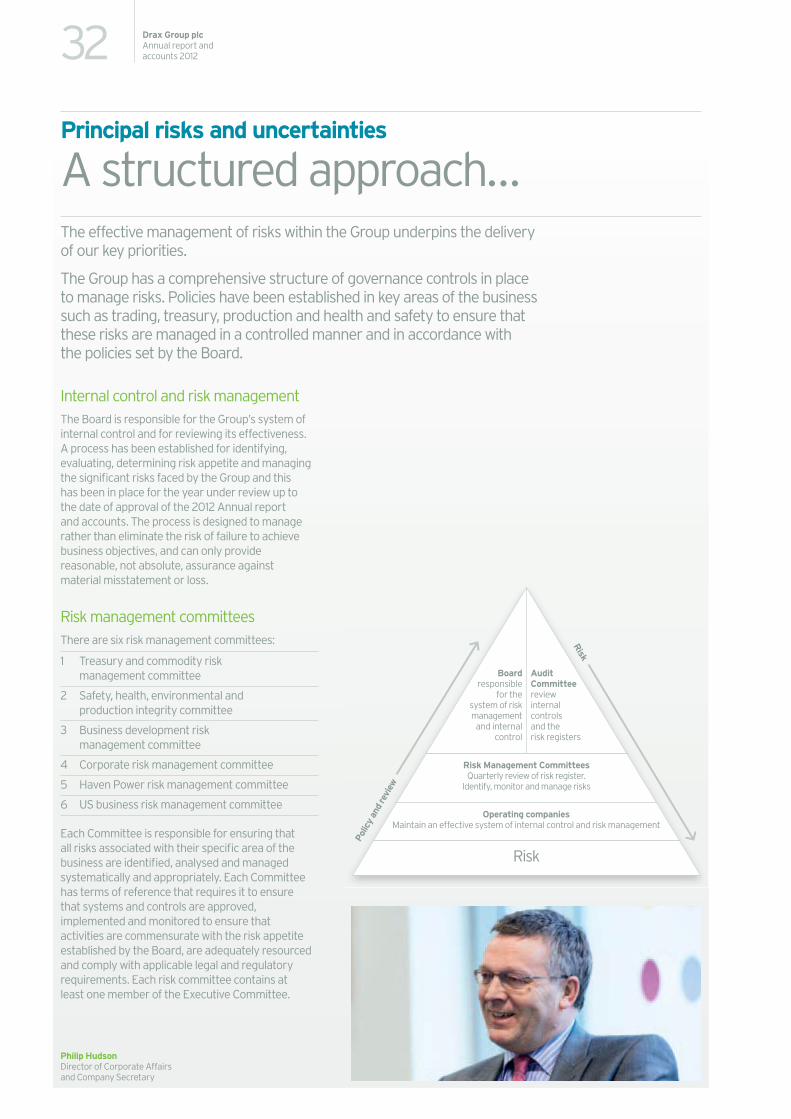
Audit Committee review internal controls and the risk registers
Board responsible
for the system of risk management and internal
control
Operating companies Maintain an effective system of internal control and risk management
Risk
Risk Management CommitteesQuarterly review of risk register.
Identify, monitor and manage risks
Risk
Polic
y an
d re
view
32 Drax Group plcAnnual report and accounts 2012
Internal control and risk management The Board is responsible for the Group’s system of internal control and for reviewing its effectiveness. A process has been established for identifying, evaluating, determining risk appetite and managing the significant risks faced by the Group and this has been in place for the year under review up to the date of approval of the 2012 Annual report and accounts. The process is designed to manage rather than eliminate the risk of failure to achieve business objectives, and can only provide reasonable, not absolute, assurance against material misstatement or loss.
Risk management committeesThere are six risk management committees:
1 Treasury and commodity risk management committee
2 Safety, health, environmental and production integrity committee
3 Business development risk management committee
4 Corporate risk management committee
5 Haven Power risk management committee
6 US business risk management committee
Each Committee is responsible for ensuring that all risks associated with their specific area of the business are identified, analysed and managed systematically and appropriately. Each Committee has terms of reference that requires it to ensure that systems and controls are approved, implemented and monitored to ensure that activities are commensurate with the risk appetite established by the Board, are adequately resourced and comply with applicable legal and regulatory requirements. Each risk committee contains at least one member of the Executive Committee.
Principal risks and uncertainties
A structured approach…The effective management of risks within the Group underpins the delivery of our key priorities.
The Group has a comprehensive structure of governance controls in place to manage risks. Policies have been established in key areas of the business such as trading, treasury, production and health and safety to ensure that these risks are managed in a controlled manner and in accordance with the policies set by the Board.
Philip Hudson Director of Corporate Affairs and Company Secretary
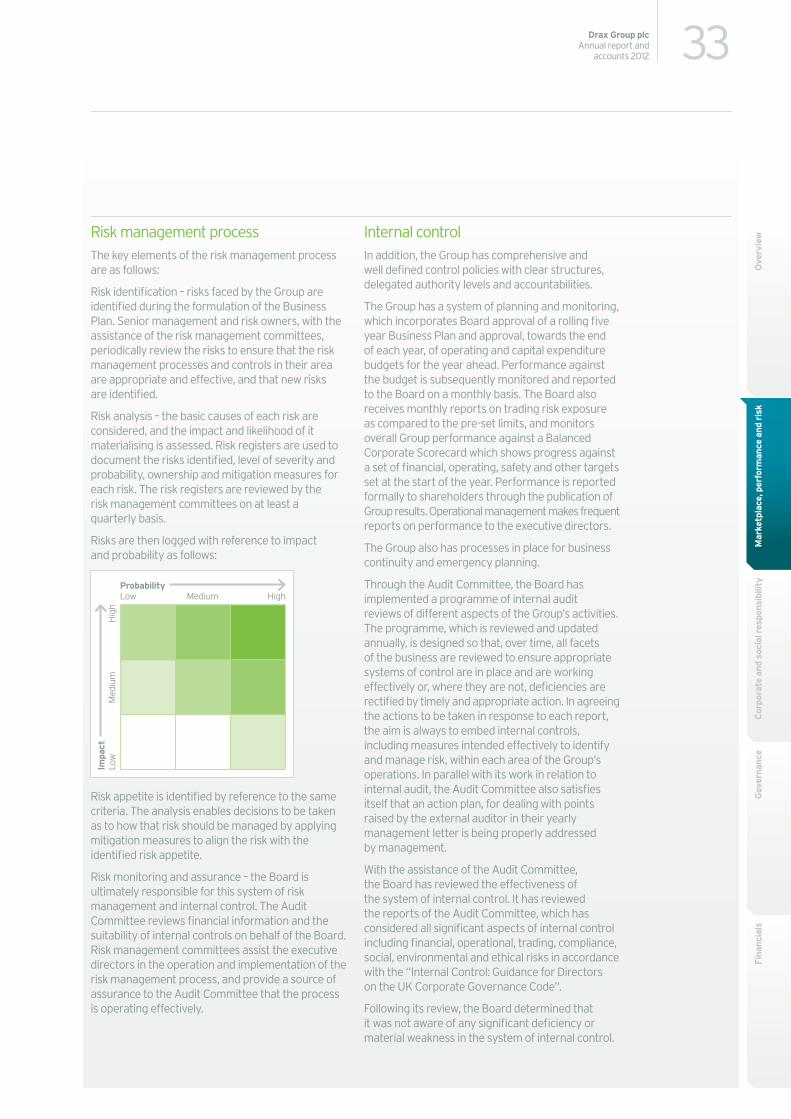
ProbabilityLow Medium High
Impa
ctLo
w
Med
ium
H
igh
33Drax Group plcAnnual report and
accounts 2012
Fina
ncia
lsG
over
nanc
eC
orpo
rate
and
soc
ial r
espo
nsib
ility
Mar
ketp
lace
, per
form
ance
and
ris
kO
verv
iewRisk management process
The key elements of the risk management process are as follows:
Risk identification – risks faced by the Group are identified during the formulation of the Business Plan. Senior management and risk owners, with the assistance of the risk management committees, periodically review the risks to ensure that the risk management processes and controls in their area are appropriate and effective, and that new risks are identified.
Risk analysis – the basic causes of each risk are considered, and the impact and likelihood of it materialising is assessed. Risk registers are used to document the risks identified, level of severity and probability, ownership and mitigation measures for each risk. The risk registers are reviewed by the risk management committees on at least a quarterly basis.
Risks are then logged with reference to impact and probability as follows:
Risk appetite is identified by reference to the same criteria. The analysis enables decisions to be taken as to how that risk should be managed by applying mitigation measures to align the risk with the identified risk appetite.
Risk monitoring and assurance – the Board is ultimately responsible for this system of risk management and internal control. The Audit Committee reviews financial information and the suitability of internal controls on behalf of the Board. Risk management committees assist the executive directors in the operation and implementation of the risk management process, and provide a source of assurance to the Audit Committee that the process is operating effectively.
Internal controlIn addition, the Group has comprehensive and well defined control policies with clear structures, delegated authority levels and accountabilities.
The Group has a system of planning and monitoring, which incorporates Board approval of a rolling five year Business Plan and approval, towards the end of each year, of operating and capital expenditure budgets for the year ahead. Performance against the budget is subsequently monitored and reported to the Board on a monthly basis. The Board also receives monthly reports on trading risk exposure as compared to the pre-set limits, and monitors overall Group performance against a Balanced Corporate Scorecard which shows progress against a set of financial, operating, safety and other targets set at the start of the year. Performance is reported formally to shareholders through the publication of Group results. Operational management makes frequent reports on performance to the executive directors.
The Group also has processes in place for business continuity and emergency planning.
Through the Audit Committee, the Board has implemented a programme of internal audit reviews of different aspects of the Group’s activities. The programme, which is reviewed and updated annually, is designed so that, over time, all facets of the business are reviewed to ensure appropriate systems of control are in place and are working effectively or, where they are not, deficiencies are rectified by timely and appropriate action. In agreeing the actions to be taken in response to each report, the aim is always to embed internal controls, including measures intended effectively to identify and manage risk, within each area of the Group’s operations. In parallel with its work in relation to internal audit, the Audit Committee also satisfies itself that an action plan, for dealing with points raised by the external auditor in their yearly management letter is being properly addressed by management.
With the assistance of the Audit Committee, the Board has reviewed the effectiveness of the system of internal control. It has reviewed the reports of the Audit Committee, which has considered all significant aspects of internal control including financial, operational, trading, compliance, social, environmental and ethical risks in accordance with the “Internal Control: Guidance for Directors on the UK Corporate Governance Code”.
Following its review, the Board determined that it was not aware of any significant deficiency or material weakness in the system of internal control.
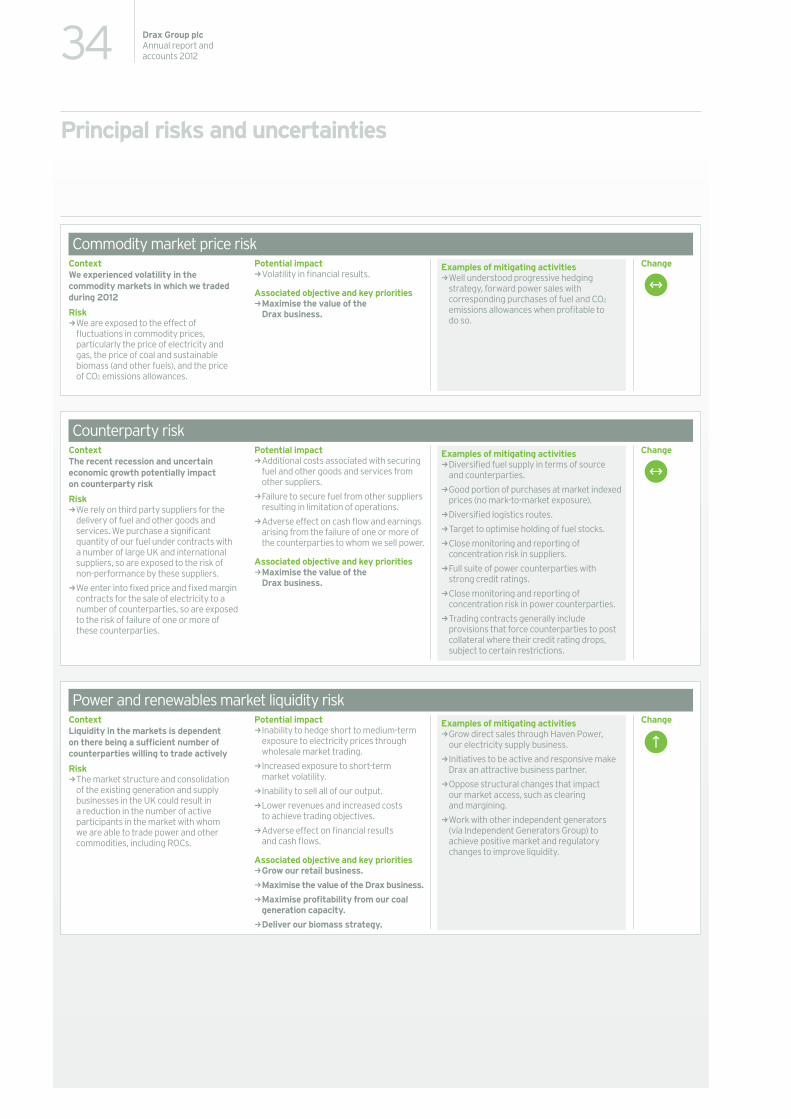
34 Drax Group plcAnnual report and accounts 2012
Principal risks and uncertainties
Commodity market price risk
Counterparty risk
Power and renewables market liquidity risk
ContextWe experienced volatility in the commodity markets in which we traded during 2012
Risk kWe are exposed to the effect of fluctuations in commodity prices, particularly the price of electricity and gas, the price of coal and sustainable biomass (and other fuels), and the price of CO2 emissions allowances.
Potential impact kVolatility in financial results.
Associated objective and key priorities kMaximise the value of the Drax business.
ContextThe recent recession and uncertain economic growth potentially impact on counterparty risk
Risk kWe rely on third party suppliers for the delivery of fuel and other goods and services. We purchase a significant quantity of our fuel under contracts with a number of large UK and international suppliers, so are exposed to the risk of non-performance by these suppliers.
kWe enter into fixed price and fixed margin contracts for the sale of electricity to a number of counterparties, so are exposed to the risk of failure of one or more of these counterparties.
Potential impact kAdditional costs associated with securing fuel and other goods and services from other suppliers.
kFailure to secure fuel from other suppliers resulting in limitation of operations.
kAdverse effect on cash flow and earnings arising from the failure of one or more of the counterparties to whom we sell power.
Associated objective and key priorities kMaximise the value of the Drax business.
ContextLiquidity in the markets is dependent on there being a sufficient number of counterparties willing to trade actively
Risk kThe market structure and consolidation of the existing generation and supply businesses in the UK could result in a reduction in the number of active participants in the market with whom we are able to trade power and other commodities, including ROCs.
Potential impact kInability to hedge short to medium-term exposure to electricity prices through wholesale market trading.
kIncreased exposure to short-term market volatility.
kInability to sell all of our output.
kLower revenues and increased costs to achieve trading objectives.
kAdverse effect on financial results and cash flows.
Associated objective and key priorities kGrow our retail business.
kMaximise the value of the Drax business.
kMaximise profitability from our coal generation capacity.
kDeliver our biomass strategy.
Examples of mitigating activities kWell understood progressive hedging strategy, forward power sales with corresponding purchases of fuel and CO2 emissions allowances when profitable to do so.
Examples of mitigating activities kDiversified fuel supply in terms of source and counterparties.
kGood portion of purchases at market indexed prices (no mark-to-market exposure).
kDiversified logistics routes.
kTarget to optimise holding of fuel stocks.
kClose monitoring and reporting of concentration risk in suppliers.
kFull suite of power counterparties with strong credit ratings.
kClose monitoring and reporting of concentration risk in power counterparties.
kTrading contracts generally include provisions that force counterparties to post collateral where their credit rating drops, subject to certain restrictions.
Examples of mitigating activities kGrow direct sales through Haven Power, our electricity supply business.
kInitiatives to be active and responsive make Drax an attractive business partner.
kOppose structural changes that impact our market access, such as clearing and margining.
kWork with other independent generators (via Independent Generators Group) to achieve positive market and regulatory changes to improve liquidity.
Change
Change
Change
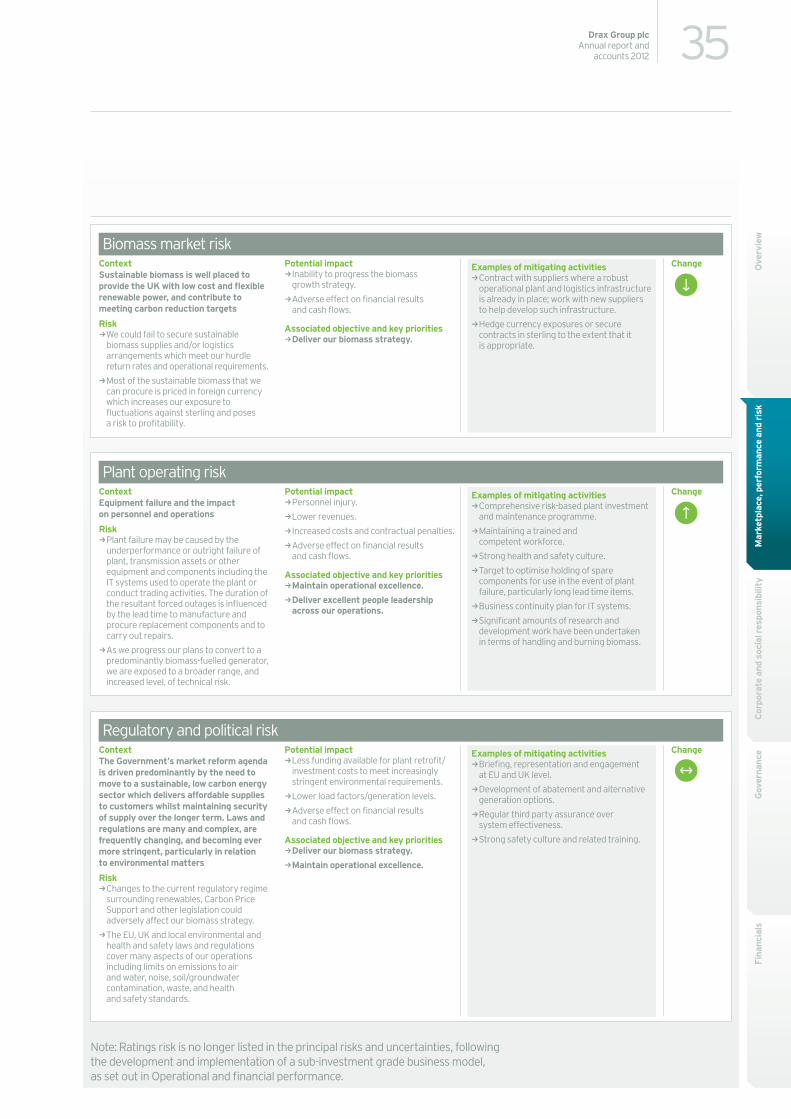
35Drax Group plcAnnual report and
accounts 2012
Fina
ncia
lsG
over
nanc
eC
orpo
rate
and
soc
ial r
espo
nsib
ility
Mar
ketp
lace
, per
form
ance
and
ris
kO
verv
iew
Biomass market risk
Plant operating risk
Regulatory and political risk
ContextSustainable biomass is well placed to provide the UK with low cost and flexible renewable power, and contribute to meeting carbon reduction targets
Risk kWe could fail to secure sustainable biomass supplies and/or logistics arrangements which meet our hurdle return rates and operational requirements.
kMost of the sustainable biomass that we can procure is priced in foreign currency which increases our exposure to fluctuations against sterling and poses a risk to profitability.
Potential impact kInability to progress the biomass growth strategy.
kAdverse effect on financial results and cash flows.
Associated objective and key priorities kDeliver our biomass strategy.
ContextEquipment failure and the impact on personnel and operations
Risk kPlant failure may be caused by the underperformance or outright failure of plant, transmission assets or other equipment and components including the IT systems used to operate the plant or conduct trading activities. The duration of the resultant forced outages is influenced by the lead time to manufacture and procure replacement components and to carry out repairs.
kAs we progress our plans to convert to a predominantly biomass-fuelled generator, we are exposed to a broader range, and increased level, of technical risk.
Potential impact kPersonnel injury.
kLower revenues.
kIncreased costs and contractual penalties.
kAdverse effect on financial results and cash flows.
Associated objective and key priorities kMaintain operational excellence.
kDeliver excellent people leadership across our operations.
ContextThe Government’s market reform agenda is driven predominantly by the need to move to a sustainable, low carbon energy sector which delivers affordable supplies to customers whilst maintaining security of supply over the longer term. Laws and regulations are many and complex, are frequently changing, and becoming ever more stringent, particularly in relation to environmental matters
Risk kChanges to the current regulatory regime surrounding renewables, Carbon Price Support and other legislation could adversely affect our biomass strategy.
kThe EU, UK and local environmental and health and safety laws and regulations cover many aspects of our operations including limits on emissions to air and water, noise, soil/groundwater contamination, waste, and health and safety standards.
Potential impact kLess funding available for plant retrofit/investment costs to meet increasingly stringent environmental requirements.
kLower load factors/generation levels.
kAdverse effect on financial results and cash flows.
Associated objective and key priorities kDeliver our biomass strategy.
kMaintain operational excellence.
Examples of mitigating activities kContract with suppliers where a robust operational plant and logistics infrastructure is already in place; work with new suppliers to help develop such infrastructure.
kHedge currency exposures or secure contracts in sterling to the extent that it is appropriate.
Examples of mitigating activities kComprehensive risk-based plant investment and maintenance programme.
kMaintaining a trained and competent workforce.
kStrong health and safety culture.
kTarget to optimise holding of spare components for use in the event of plant failure, particularly long lead time items.
kBusiness continuity plan for IT systems.
kSignificant amounts of research and development work have been undertaken in terms of handling and burning biomass.
Examples of mitigating activities kBriefing, representation and engagement at EU and UK level.
kDevelopment of abatement and alternative generation options.
kRegular third party assurance over system effectiveness.
kStrong safety culture and related training.
Change
Change
Change
Note: Ratings risk is no longer listed in the principal risks and uncertainties, following the development and implementation of a sub-investment grade business model, as set out in Operational and financial performance.
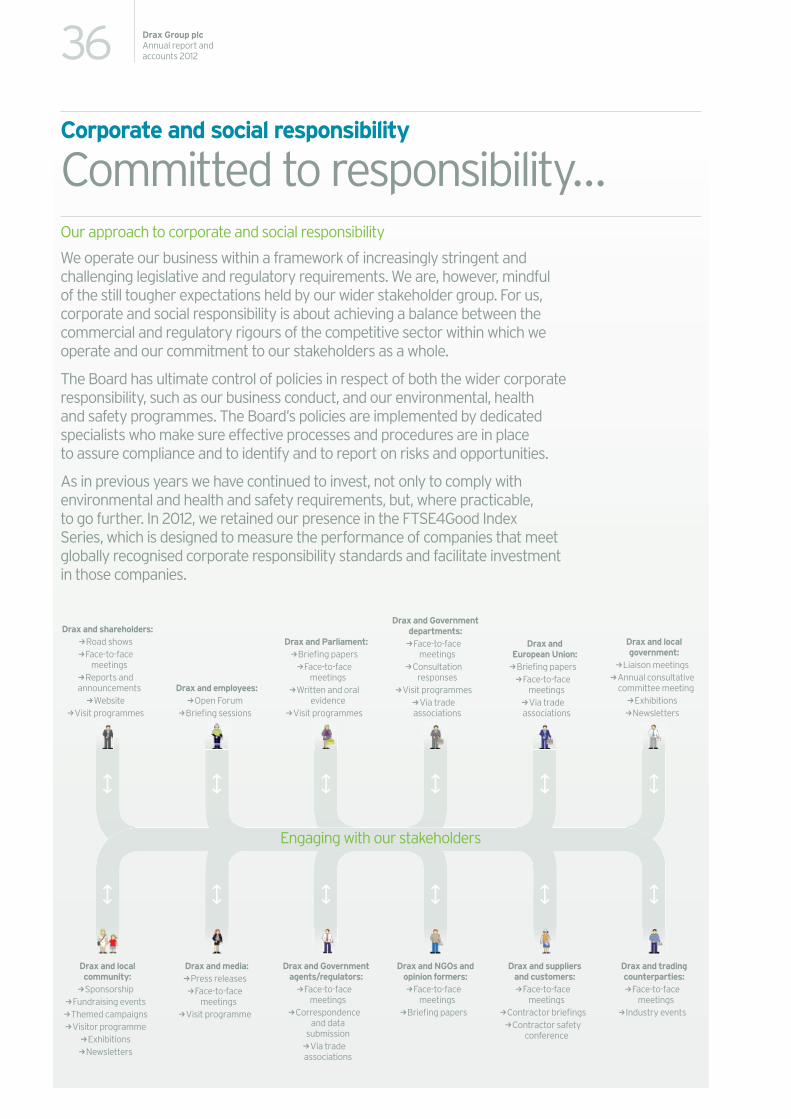
36 Drax Group plcAnnual report and accounts 2012
Corporate and social responsibility
Committed to responsibility…Our approach to corporate and social responsibility
We operate our business within a framework of increasingly stringent and challenging legislative and regulatory requirements. We are, however, mindful of the still tougher expectations held by our wider stakeholder group. For us, corporate and social responsibility is about achieving a balance between the commercial and regulatory rigours of the competitive sector within which we operate and our commitment to our stakeholders as a whole.
The Board has ultimate control of policies in respect of both the wider corporate responsibility, such as our business conduct, and our environmental, health and safety programmes. The Board’s policies are implemented by dedicated specialists who make sure effective processes and procedures are in place to assure compliance and to identify and to report on risks and opportunities.
As in previous years we have continued to invest, not only to comply with environmental and health and safety requirements, but, where practicable, to go further. In 2012, we retained our presence in the FTSE4Good Index Series, which is designed to measure the performance of companies that meet globally recognised corporate responsibility standards and facilitate investment in those companies.
Drax and local community: kSponsorship
kFundraising events kThemed campaigns kVisitor programme
kExhibitions kNewsletters
Drax and media: kPress releases kFace-to-face
meetings kVisit programme
Drax and Government agents/regulators:
kFace-to-face meetings
kCorrespondence and data
submission kVia trade
associations
Drax and NGOs and opinion formers:
kFace-to-face meetings
kBriefing papers
Drax and suppliers and customers:
kFace-to-face meetings
kContractor briefings kContractor safety
conference
Drax and trading counterparties:
kFace-to-face meetings
kIndustry events
Drax and shareholders: kRoad shows kFace-to-face
meetings kReports and
announcements kWebsite
kVisit programmes
Drax and employees: kOpen Forum
kBriefing sessions
Drax and Parliament: kBriefing papers
kFace-to-face meetings
kWritten and oral evidence
kVisit programmes
Drax and European Union: kBriefing papers
kFace-to-face meetings kVia trade
associations
Drax and local government:
kLiaison meetings kAnnual consultative committee meeting
kExhibitions kNewsletters
Drax and Government departments: kFace-to-face
meetings kConsultation
responses kVisit programmes
kVia trade associations
Engaging with our stakeholders
37Drax Group plcAnnual report and
accounts 2012
Fina
ncia
lsG
over
nanc
eM
arke
tpla
ce, p
erfo
rman
ce a
nd r
isk
Cor
pora
te a
nd s
ocia
l res
pons
ibili
tyO
verv
iewMateriality
Given the diversity of our stakeholders there are a wide range of topics and performance measures on which we could report. In determining which to report we consider their materiality in terms of their relevance to the Company and their importance to stakeholders.
Throughout this Annual report and accounts we aim to report on topics and performance measures that represent our significant economic, environmental, and social impacts and those that would substantively influence the assessments and decisions of stakeholders. Further reporting is undertaken in accordance with the Global Reporting Initiative framework and is available on our website at: www.draxgroup.plc.uk/corporate_responsibility/gri/
Business conduct
Our commitment to integrityWe have a commitment to high ethical standards and to conduct our business with honesty, integrity and in accordance with applicable laws and regulations.
Our reputation for acting with integrity plays a critical role in our success. Integrity not only underpins how we do business, but how we expect our suppliers, agents, partners, contractors and consultants to do business, whether in the UK, US or beyond. We are committed to preventing bribery and corruption and take responsibility for maintaining a culture within the Group in which bribery is never acceptable.
We ensure that all third parties we deal with are reputable, by means of carrying out “Know Your Customer” due diligence checks and searches, and have formed an Ethics and Business Conduct committee to escalate problematic counterparty requests.
Code of Business EthicsThe Group’s Code of Business Ethics establishes the rules and framework under which employees should base their decision making. Employees are expected to follow not only the letter of the Code, but the spirit.
WhistleblowingThe Group’s whistleblowing policy provides a confidential means for our employees to speak up with confidence. The policy provides guidance on how to make a disclosure of information, in good faith, relating to some danger, fraud or other illegal or unethical conduct that they may have witnessed or are concerned about.
Climate change and the environment
Tackling climate changeWe believe we have an important role to play in the transition of the UK towards a low carbon economy whilst maintaining secure and affordable supplies of electricity. For us, a sustainable business principally implies delivering on our commitment to generating electricity from sustainable biomass and continuing to improve thermal efficiency as the major, strategic carbon abatement initiatives.
The centre of our improved thermal efficiency programme at the power station over the last five years has been the £100 million upgrade of the high pressure and low pressure steam turbines of each of our six generating units. In 2012 we saw the completion of the programme, which was the largest steam turbine modernisation programme in UK history. The project was delivered within budget and planned timescale, and the plant is benefiting from an increase in overall efficiency and a reduction in CO2 emissions.
The biomass future for the Group is now more certain, with clarity on the support level for the technology provided by the Government, the committed financing and the expertise gained from our extensive research and development in this area. Major works were undertaken in 2012 towards the construction of dedicated biomass receipt, handling and storage facilities. This work will continue in 2013 and 2014 as we press ahead to become a predominantly biomass-fuelled generator.
Through increasing the amount of sustainable biomass burnt in place of coal we will significantly reduce our carbon footprint on today’s levels. The average greenhouse gas saving across the range of sustainable biomass materials burnt in place of coal in 2012 was above 80% using the life cycle emissions of coal burnt at Drax Power Station as the baseline.
In addition to our thermal efficiency and biomass development work, in partnership with Alstom UK Limited and National Grid Carbon Limited, we continued to develop plans to build a 426MW oxyfuel carbon capture and storage demonstration plant at the Drax Power Station site. In January 2012, we were joined by industrial gas provider, BOC (a member of The Linde Group) as a co-sponsor of the project. Viability of the project is dependent on external funding and the introduction of a market mechanism to support low carbon technology uptake. To that end we are participating in UK and EU funding programmes.
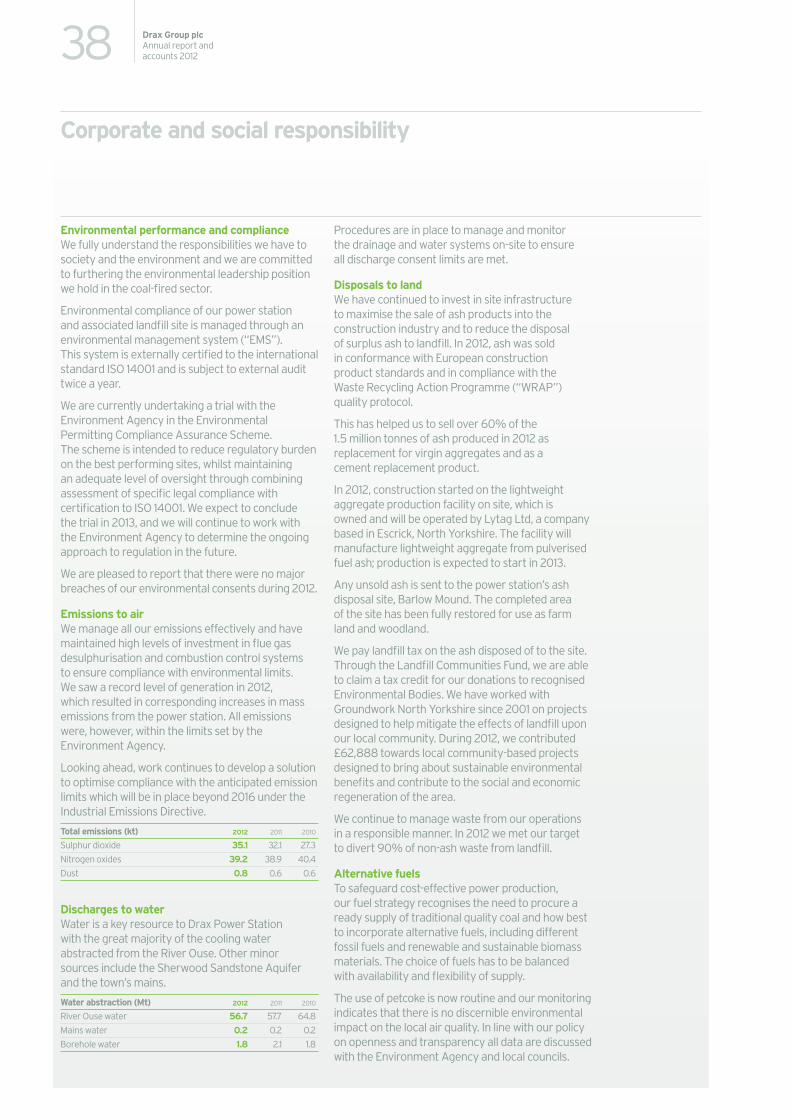
38 Drax Group plcAnnual report and accounts 2012
Corporate and social responsibility
Environmental performance and complianceWe fully understand the responsibilities we have to society and the environment and we are committed to furthering the environmental leadership position we hold in the coal-fired sector.
Environmental compliance of our power station and associated landfill site is managed through an environmental management system (“EMS”). This system is externally certified to the international standard ISO 14001 and is subject to external audit twice a year.
We are currently undertaking a trial with the Environment Agency in the Environmental Permitting Compliance Assurance Scheme. The scheme is intended to reduce regulatory burden on the best performing sites, whilst maintaining an adequate level of oversight through combining assessment of specific legal compliance with certification to ISO 14001. We expect to conclude the trial in 2013, and we will continue to work with the Environment Agency to determine the ongoing approach to regulation in the future.
We are pleased to report that there were no major breaches of our environmental consents during 2012.
Emissions to airWe manage all our emissions effectively and have maintained high levels of investment in flue gas desulphurisation and combustion control systems to ensure compliance with environmental limits. We saw a record level of generation in 2012, which resulted in corresponding increases in mass emissions from the power station. All emissions were, however, within the limits set by the Environment Agency.
Looking ahead, work continues to develop a solution to optimise compliance with the anticipated emission limits which will be in place beyond 2016 under the Industrial Emissions Directive.
Total emissions (kt) 2012 2011 2010
Sulphur dioxide 35.1 32.1 27.3
Nitrogen oxides 39.2 38.9 40.4
Dust 0.8 0.6 0.6
Discharges to waterWater is a key resource to Drax Power Station with the great majority of the cooling water abstracted from the River Ouse. Other minor sources include the Sherwood Sandstone Aquifer and the town’s mains.
Water abstraction (Mt) 2012 2011 2010
River Ouse water 56.7 57.7 64.8
Mains water 0.2 0.2 0.2
Borehole water 1.8 2.1 1.8
Procedures are in place to manage and monitor the drainage and water systems on-site to ensure all discharge consent limits are met.
Disposals to landWe have continued to invest in site infrastructure to maximise the sale of ash products into the construction industry and to reduce the disposal of surplus ash to landfill. In 2012, ash was sold in conformance with European construction product standards and in compliance with the Waste Recycling Action Programme (“WRAP”) quality protocol.
This has helped us to sell over 60% of the 1.5 million tonnes of ash produced in 2012 as replacement for virgin aggregates and as a cement replacement product.
In 2012, construction started on the lightweight aggregate production facility on site, which is owned and will be operated by Lytag Ltd, a company based in Escrick, North Yorkshire. The facility will manufacture lightweight aggregate from pulverised fuel ash; production is expected to start in 2013.
Any unsold ash is sent to the power station’s ash disposal site, Barlow Mound. The completed area of the site has been fully restored for use as farm land and woodland.
We pay landfill tax on the ash disposed of to the site. Through the Landfill Communities Fund, we are able to claim a tax credit for our donations to recognised Environmental Bodies. We have worked with Groundwork North Yorkshire since 2001 on projects designed to help mitigate the effects of landfill upon our local community. During 2012, we contributed £62,888 towards local community-based projects designed to bring about sustainable environmental benefits and contribute to the social and economic regeneration of the area.
We continue to manage waste from our operations in a responsible manner. In 2012 we met our target to divert 90% of non-ash waste from landfill.
Alternative fuelsTo safeguard cost-effective power production, our fuel strategy recognises the need to procure a ready supply of traditional quality coal and how best to incorporate alternative fuels, including different fossil fuels and renewable and sustainable biomass materials. The choice of fuels has to be balanced with availability and flexibility of supply.
The use of petcoke is now routine and our monitoring indicates that there is no discernible environmental impact on the local air quality. In line with our policy on openness and transparency all data are discussed with the Environment Agency and local councils.
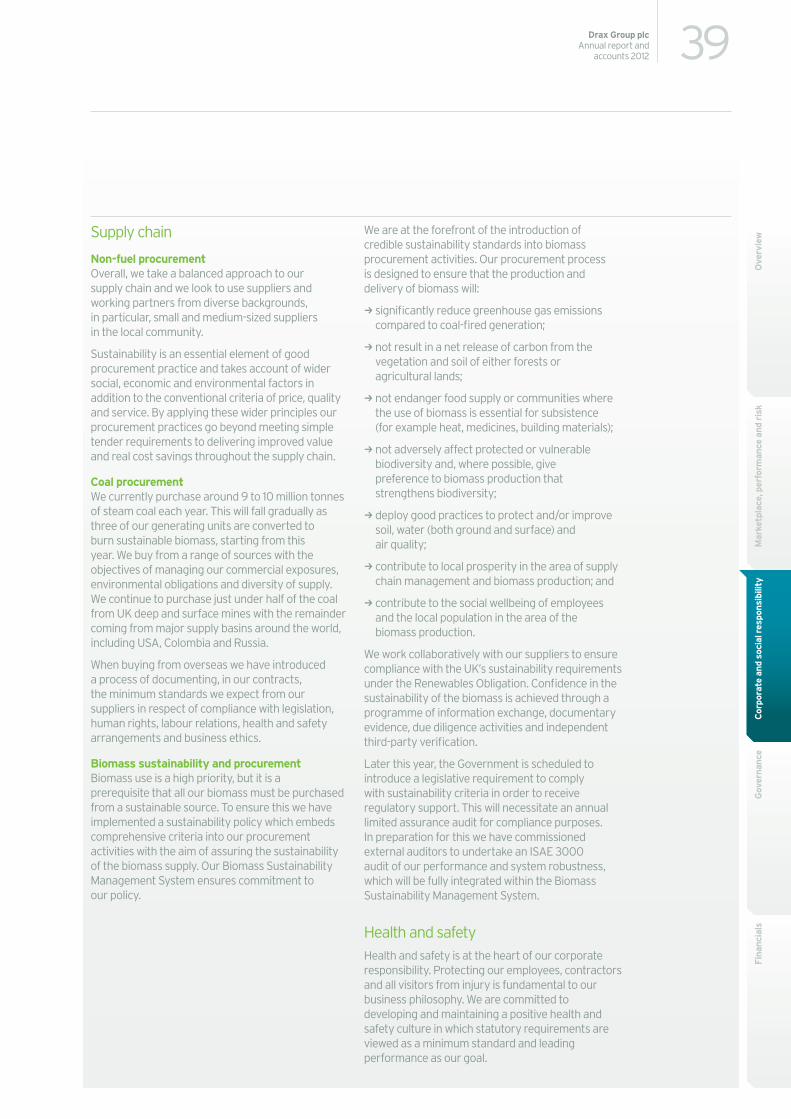
39Drax Group plcAnnual report and
accounts 2012
Fina
ncia
lsG
over
nanc
eM
arke
tpla
ce, p
erfo
rman
ce a
nd r
isk
Cor
pora
te a
nd s
ocia
l res
pons
ibili
tyO
verv
iewSupply chain
Non-fuel procurementOverall, we take a balanced approach to our supply chain and we look to use suppliers and working partners from diverse backgrounds, in particular, small and medium-sized suppliers in the local community.
Sustainability is an essential element of good procurement practice and takes account of wider social, economic and environmental factors in addition to the conventional criteria of price, quality and service. By applying these wider principles our procurement practices go beyond meeting simple tender requirements to delivering improved value and real cost savings throughout the supply chain.
Coal procurementWe currently purchase around 9 to 10 million tonnes of steam coal each year. This will fall gradually as three of our generating units are converted to burn sustainable biomass, starting from this year. We buy from a range of sources with the objectives of managing our commercial exposures, environmental obligations and diversity of supply. We continue to purchase just under half of the coal from UK deep and surface mines with the remainder coming from major supply basins around the world, including USA, Colombia and Russia.
When buying from overseas we have introduced a process of documenting, in our contracts, the minimum standards we expect from our suppliers in respect of compliance with legislation, human rights, labour relations, health and safety arrangements and business ethics.
Biomass sustainability and procurementBiomass use is a high priority, but it is a prerequisite that all our biomass must be purchased from a sustainable source. To ensure this we have implemented a sustainability policy which embeds comprehensive criteria into our procurement activities with the aim of assuring the sustainability of the biomass supply. Our Biomass Sustainability Management System ensures commitment to our policy.
We are at the forefront of the introduction of credible sustainability standards into biomass procurement activities. Our procurement process is designed to ensure that the production and delivery of biomass will:
k significantly reduce greenhouse gas emissions compared to coal-fired generation;
knot result in a net release of carbon from the vegetation and soil of either forests or agricultural lands;
knot endanger food supply or communities where the use of biomass is essential for subsistence (for example heat, medicines, building materials);
knot adversely affect protected or vulnerable biodiversity and, where possible, give preference to biomass production that strengthens biodiversity;
kdeploy good practices to protect and/or improve soil, water (both ground and surface) and air quality;
k contribute to local prosperity in the area of supply chain management and biomass production; and
k contribute to the social wellbeing of employees and the local population in the area of the biomass production.
We work collaboratively with our suppliers to ensure compliance with the UK’s sustainability requirements under the Renewables Obligation. Confidence in the sustainability of the biomass is achieved through a programme of information exchange, documentary evidence, due diligence activities and independent third-party verification.
Later this year, the Government is scheduled to introduce a legislative requirement to comply with sustainability criteria in order to receive regulatory support. This will necessitate an annual limited assurance audit for compliance purposes. In preparation for this we have commissioned external auditors to undertake an ISAE 3000 audit of our performance and system robustness, which will be fully integrated within the Biomass Sustainability Management System.
Health and safetyHealth and safety is at the heart of our corporate responsibility. Protecting our employees, contractors and all visitors from injury is fundamental to our business philosophy. We are committed to developing and maintaining a positive health and safety culture in which statutory requirements are viewed as a minimum standard and leading performance as our goal.
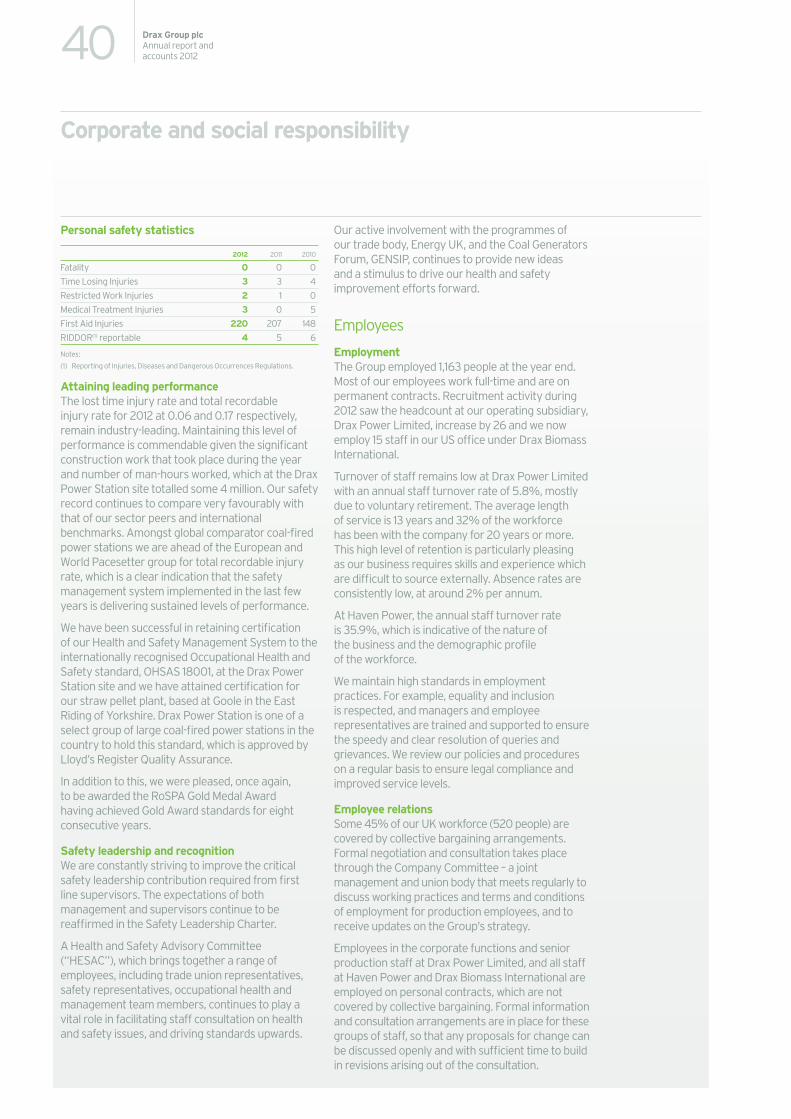
40 Drax Group plcAnnual report and accounts 2012
Corporate and social responsibility
Personal safety statistics
2012 2011 2010
Fatality 0 0 0
Time Losing Injuries 3 3 4
Restricted Work Injuries 2 1 0
Medical Treatment Injuries 3 0 5
First Aid Injuries 220 207 148
RIDDOR(1) reportable 4 5 6
Notes:
(1) Reporting of Injuries, Diseases and Dangerous Occurrences Regulations.
Attaining leading performanceThe lost time injury rate and total recordable injury rate for 2012 at 0.06 and 0.17 respectively, remain industry-leading. Maintaining this level of performance is commendable given the significant construction work that took place during the year and number of man-hours worked, which at the Drax Power Station site totalled some 4 million. Our safety record continues to compare very favourably with that of our sector peers and international benchmarks. Amongst global comparator coal-fired power stations we are ahead of the European and World Pacesetter group for total recordable injury rate, which is a clear indication that the safety management system implemented in the last few years is delivering sustained levels of performance.
We have been successful in retaining certification of our Health and Safety Management System to the internationally recognised Occupational Health and Safety standard, OHSAS 18001, at the Drax Power Station site and we have attained certification for our straw pellet plant, based at Goole in the East Riding of Yorkshire. Drax Power Station is one of a select group of large coal-fired power stations in the country to hold this standard, which is approved by Lloyd’s Register Quality Assurance.
In addition to this, we were pleased, once again, to be awarded the RoSPA Gold Medal Award having achieved Gold Award standards for eight consecutive years.
Safety leadership and recognitionWe are constantly striving to improve the critical safety leadership contribution required from first line supervisors. The expectations of both management and supervisors continue to be reaffirmed in the Safety Leadership Charter.
A Health and Safety Advisory Committee (“HESAC”), which brings together a range of employees, including trade union representatives, safety representatives, occupational health and management team members, continues to play a vital role in facilitating staff consultation on health and safety issues, and driving standards upwards.
Our active involvement with the programmes of our trade body, Energy UK, and the Coal Generators Forum, GENSIP, continues to provide new ideas and a stimulus to drive our health and safety improvement efforts forward.
Employees
EmploymentThe Group employed 1,163 people at the year end. Most of our employees work full-time and are on permanent contracts. Recruitment activity during 2012 saw the headcount at our operating subsidiary, Drax Power Limited, increase by 26 and we now employ 15 staff in our US office under Drax Biomass International.
Turnover of staff remains low at Drax Power Limited with an annual staff turnover rate of 5.8%, mostly due to voluntary retirement. The average length of service is 13 years and 32% of the workforce has been with the company for 20 years or more. This high level of retention is particularly pleasing as our business requires skills and experience which are difficult to source externally. Absence rates are consistently low, at around 2% per annum.
At Haven Power, the annual staff turnover rate is 35.9%, which is indicative of the nature of the business and the demographic profile of the workforce.
We maintain high standards in employment practices. For example, equality and inclusion is respected, and managers and employee representatives are trained and supported to ensure the speedy and clear resolution of queries and grievances. We review our policies and procedures on a regular basis to ensure legal compliance and improved service levels.
Employee relationsSome 45% of our UK workforce (520 people) are covered by collective bargaining arrangements. Formal negotiation and consultation takes place through the Company Committee – a joint management and union body that meets regularly to discuss working practices and terms and conditions of employment for production employees, and to receive updates on the Group’s strategy.
Employees in the corporate functions and senior production staff at Drax Power Limited, and all staff at Haven Power and Drax Biomass International are employed on personal contracts, which are not covered by collective bargaining. Formal information and consultation arrangements are in place for these groups of staff, so that any proposals for change can be discussed openly and with sufficient time to build in revisions arising out of the consultation.
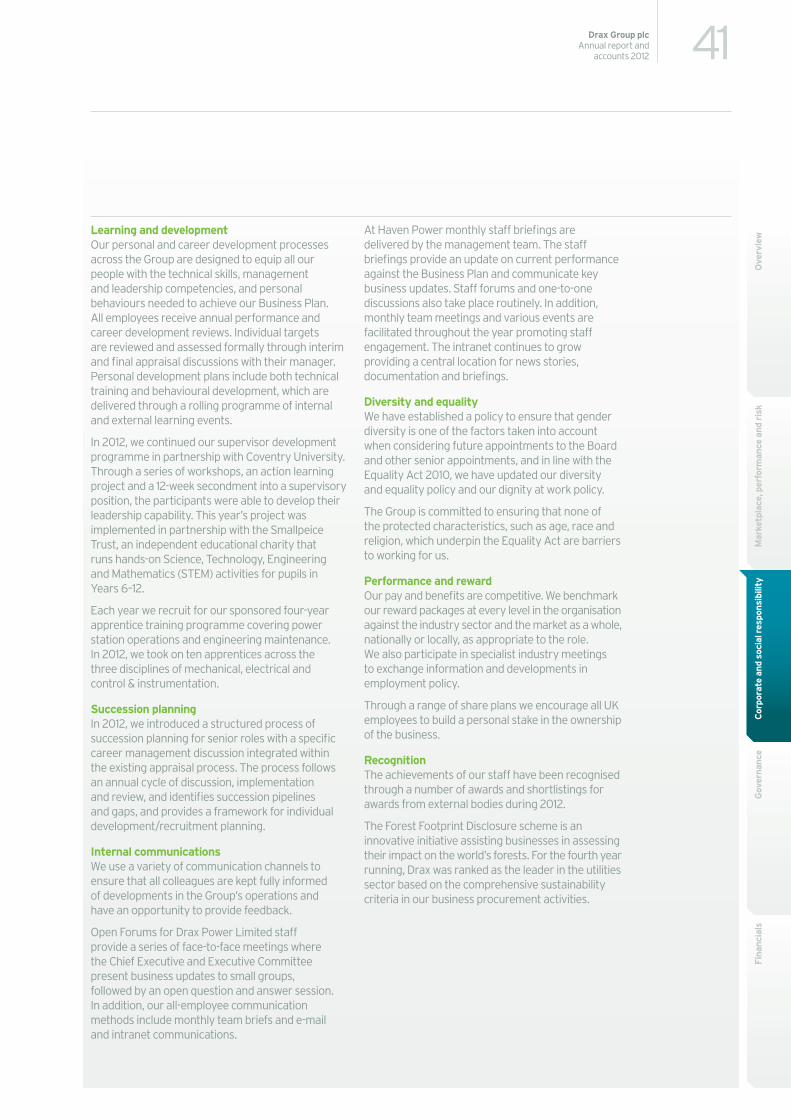
41Drax Group plcAnnual report and
accounts 2012
Fina
ncia
lsG
over
nanc
eM
arke
tpla
ce, p
erfo
rman
ce a
nd r
isk
Cor
pora
te a
nd s
ocia
l res
pons
ibili
tyO
verv
iewLearning and development
Our personal and career development processes across the Group are designed to equip all our people with the technical skills, management and leadership competencies, and personal behaviours needed to achieve our Business Plan. All employees receive annual performance and career development reviews. Individual targets are reviewed and assessed formally through interim and final appraisal discussions with their manager. Personal development plans include both technical training and behavioural development, which are delivered through a rolling programme of internal and external learning events.
In 2012, we continued our supervisor development programme in partnership with Coventry University. Through a series of workshops, an action learning project and a 12-week secondment into a supervisory position, the participants were able to develop their leadership capability. This year’s project was implemented in partnership with the Smallpeice Trust, an independent educational charity that runs hands-on Science, Technology, Engineering and Mathematics (STEM) activities for pupils in Years 6–12.
Each year we recruit for our sponsored four-year apprentice training programme covering power station operations and engineering maintenance. In 2012, we took on ten apprentices across the three disciplines of mechanical, electrical and control & instrumentation.
Succession planningIn 2012, we introduced a structured process of succession planning for senior roles with a specific career management discussion integrated within the existing appraisal process. The process follows an annual cycle of discussion, implementation and review, and identifies succession pipelines and gaps, and provides a framework for individual development/recruitment planning.
Internal communicationsWe use a variety of communication channels to ensure that all colleagues are kept fully informed of developments in the Group’s operations and have an opportunity to provide feedback.
Open Forums for Drax Power Limited staff provide a series of face-to-face meetings where the Chief Executive and Executive Committee present business updates to small groups, followed by an open question and answer session. In addition, our all-employee communication methods include monthly team briefs and e-mail and intranet communications.
At Haven Power monthly staff briefings are delivered by the management team. The staff briefings provide an update on current performance against the Business Plan and communicate key business updates. Staff forums and one-to-one discussions also take place routinely. In addition, monthly team meetings and various events are facilitated throughout the year promoting staff engagement. The intranet continues to grow providing a central location for news stories, documentation and briefings.
Diversity and equalityWe have established a policy to ensure that gender diversity is one of the factors taken into account when considering future appointments to the Board and other senior appointments, and in line with the Equality Act 2010, we have updated our diversity and equality policy and our dignity at work policy.
The Group is committed to ensuring that none of the protected characteristics, such as age, race and religion, which underpin the Equality Act are barriers to working for us.
Performance and rewardOur pay and benefits are competitive. We benchmark our reward packages at every level in the organisation against the industry sector and the market as a whole, nationally or locally, as appropriate to the role. We also participate in specialist industry meetings to exchange information and developments in employment policy.
Through a range of share plans we encourage all UK employees to build a personal stake in the ownership of the business.
RecognitionThe achievements of our staff have been recognised through a number of awards and shortlistings for awards from external bodies during 2012.
The Forest Footprint Disclosure scheme is an innovative initiative assisting businesses in assessing their impact on the world’s forests. For the fourth year running, Drax was ranked as the leader in the utilities sector based on the comprehensive sustainability criteria in our business procurement activities.
42 Drax Group plcAnnual report and accounts 2012
Corporate and social responsibility
This year staff at Haven Power helped the company to achieve the accolade of No. 1 for customer satisfaction in the small and medium enterprise (“SME”) market in the external 2012 Datamonitor Survey.
We were among the finalists for the Capital Project Management Award of the Utility Industry Achievements Awards 2012 for our turbine upgrade project, a five-year-long project which was completed in 2012.
For the second time in the past three years we were acknowledged for upholding good governance and professional standards at the ICSA (Institute of Chartered Secretaries and Administrators) Hermes Transparency in Governance Awards 2012, through winning the “Best sustainability and stakeholder disclosure – FTSE250”.
Health and wellbeingWe are committed to promoting the health and wellbeing of all our staff and ensuring a professional response to all first aid and emergency situations that occur.
We have published occupational health policies which address industrial disease risks, and our occupational health team undertakes regular programmes to screen colleagues who are in contact with, for example, high noise levels or dust. Everyone working in operational areas has a general medical every three years.
Some categories of worker are exposed to materials which may pose a risk to health, such as chemicals and process dust. In these cases, more specific health surveillance, such as lung function tests, hearing tests and eyesight tests are undertaken through an ongoing programme managed in accordance with risk, exposure and Health and Safety Executive requirements. Driving and driver training support programmes are in place for those who travel frequently on business.
Each year we have a planned programme of health promotion. In 2012, Drax Power Limited received the bronze level Healthy Heart award from Heart Research UK in recognition of various initiatives including a “Quit Smoking” programme and other campaigns to encourage healthy diet, exercise and lifestyle.
At Haven Power we aim to create a supportive, healthy and safe environment for all employees. Our employment policies aim to promote an environment that ensures the health and wellbeing of all employees, creating a dynamic environment where people can excel including health screening and occupational health support where required. We run a variety of initiatives throughout the year promoting a healthy lifestyle including “quit smoking” days, cancer awareness, walk to work and other employee-driven events that focus on improving individual wellbeing.
All of the UK workforce is represented in formal joint management-worker health and safety committees that help monitor and advise on occupational health and safety programmes. The committees have senior management representation, with trade union or employee representatives.
Pension provision and retirementThere are 356 employees who are members of the Drax Power Group of the Electricity Supply Pension Scheme, which was closed to new entrants in 2002. All other UK employees are eligible to join the Group Personal Pension Plan or the Haven Power Personal Pension Plan, which are both actively promoted to new recruits. Any UK employee aged 55 or over is eligible to take their accrued retirement benefits, in line with the statutory minimum age for receipt of an occupational pension.
At Drax Power Limited, our phased retirement policy means that any employee aged 55 or over may apply to take accrued retirement benefits and continue to work part-time subject to operational requirements. For employees approaching their chosen retirement age we offer paid pre-retirement leave and pre-retirement courses to help people transition smoothly from working life to their new life.
A flexible retirement policy is operated at Haven Power, and employees may voluntarily retire at a time of their choosing. Employees aged 65 or over, who are members of the Haven Power Personal Pension Plan remain entitled to the benefits of the scheme.
43Drax Group plcAnnual report and
accounts 2012
Fina
ncia
lsG
over
nanc
eM
arke
tpla
ce, p
erfo
rman
ce a
nd r
isk
Cor
pora
te a
nd s
ocia
l res
pons
ibili
tyO
verv
iewStakeholder engagement
and community relations
Engaging with our stakeholdersLike many businesses, our stakeholders are many and diverse, including our shareholders, employees, customers, suppliers, the local community, Government, non-governmental organisations, regulators, opinion formers and the media. Communication with all our stakeholders is considered to be an essential part of our business and we aim to be open and transparent in all that we do. Reference has been already made to specific stakeholder engagement practice and exercises throughout this Corporate and social responsibility section; below we touch on other aspects of our stakeholder engagement commitments, from investor relations to community relations.
Investor relationsWe are committed to delivering shareholder value. We communicate our results and prospects to our shareholders in an accurate and timely manner using a variety of channels. In addition to the Annual General Meeting, we communicate through our Annual report and accounts, Half year report and Interim Management Statements. All of these documents are made available on our website at www.draxgroup.plc.uk. Significant matters relating to trading and the development of the business are disseminated to the market by way of announcements via a regulatory information service and those announcements appear as soon as practicable on our website.
Announcements are frequently followed up with either conference calls or presentations to provide further detail and greater understanding. In addition, face-to-face meetings are held with our major institutional shareholders, and other potential investors in the Group, again to assist them in their understanding of the announcements, but also to ensure that the Board is aware of their views and concerns. To aid our communication with private investors, the investor section of our website has been developed to be a readily accessible and transparent source of information to enhance understanding of the business.
External relationsAs in previous years, we maintained our engagement with public affairs audiences on issues with implications for our business. With energy policy still high on the political agenda we had significant engagement with Parliamentarians and officials at all levels on issues including forthcoming environmental legislation, renewables policy and market reform issues.
The form of engagement was varied and included both face-to-face and written briefings, participation in public consultations, written evidence to inquiries, and visits by Parliamentarians and officials to Drax Power Station. As in the past, trade association membership proved useful during the year. The ability to meet with and discuss issues of the day with other interested parties has facilitated representation of collective positions on energy policy matters.
No political donations were made in the UK or elsewhere during 2012 (2011: nil), and the Group’s contact with those active in the political arena has been and will continue to be aimed solely at the promotion of the Group’s business interests.
The definitions of EU political expenditure are broad and there is widespread doubt about the extent to which normal business activities, which might not be thought to be political expenditure in the usual sense, could be considered to be political expenditure within the meaning of the legislation. The Company wishes to avoid any inadvertent infringement of the legislation and each year, though a resolution at the Annual General Meeting, seeks the authority of shareholders to incur expenditure for the Company and its subsidiaries for such purposes of £100,000.
Community relationsWe are committed to being a good neighbour to our local community and our “caring for the community” philosophy involves being part of local and regional communities. Our involvement takes the form of sponsoring a variety of local charities and fundraising events, promoting our own campaigns which focus on the three themes of youth sport, education and the environment, and maintaining open communication channels and good working relationships with the region’s key opinion formers.
Sponsorship and fundraisingDuring 2012, the Group gave financial support of £182,000 (2011: £137,000) in total across a range of charitable and non-charitable community causes. Of that total, charitable donations amounted to £127,000 (2011: £94,000).
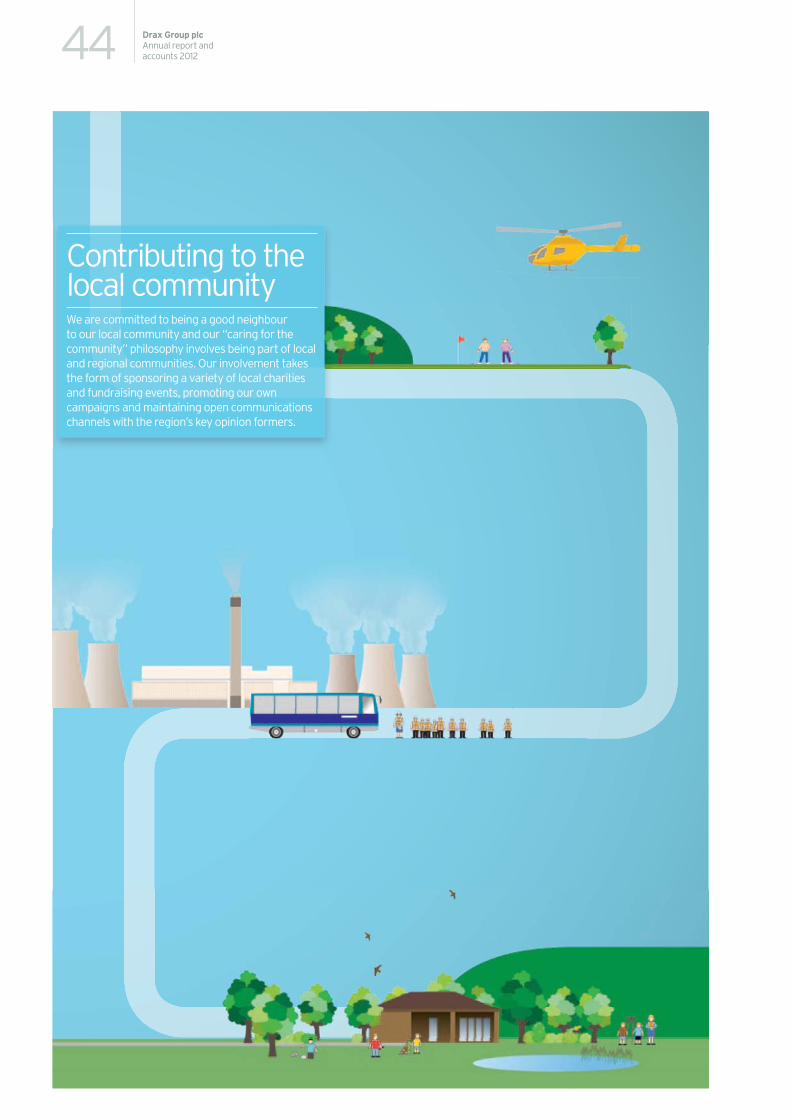
44 Drax Group plcAnnual report and accounts 2012
Contributing to the local communityWe are committed to being a good neighbour to our local community and our “caring for the community” philosophy involves being part of local and regional communities. Our involvement takes the form of sponsoring a variety of local charities and fundraising events, promoting our own campaigns and maintaining open communications channels with the region’s key opinion formers.
45Drax Group plcAnnual report and
accounts 2012
Fina
ncia
lsG
over
nanc
eM
arke
tpla
ce, p
erfo
rman
ce a
nd r
isk
Cor
pora
te a
nd s
ocia
l res
pons
ibili
tyO
verv
iew
Corporate and social responsibility
Some £18,000 of the total donations were made under the direction of our sponsorship team, across a range of activities within a 20-mile radius of the power station. Each month the team meets to consider requests received for charitable donations and community sponsorship and makes awards against our criteria of furthering community, environmental and sporting interests.
Drax also operates a “£ for £” and Give As You Earn matching scheme, under which we match any monies raised for, or donated to, charity by employees. During 2012, some £53,000 of the total donations made were through these schemes.
Now in its eighth year, the outage charity scheme raised £12,000 during the year’s two planned outages. Through the scheme £500 is donated for every seven days that goes by without an injury requiring more than first aid treatment. The money was divided equally between four charities chosen by Drax staff and our contractors. A further £1,000 was donated to local charities following a fundraising event held at our annual safety conference for contractors and staff.
For the sixth year running we held a charity corporate golf tournament at Fulford Golf Club, York. The event raised just under £15,000 for the Yorkshire Air Ambulance, which provides a crucial emergency service for the region. We were honoured to receive a recognition award from the Yorkshire Air Ambulance for the donations made over the years, approaching some £50,000, through the golf tournament.
Education in the communityWe provide a choice of educational experiences hosted by our team of power station guides and, at times, technical experts. A state-of-the-art visitor centre is of particular interest to students of all ages allowing them to explore the properties of electricity, discover how a power station works and consider the environmental issues related to electricity generation.
Combined with a tour of the power station, students can learn about the basic principles and development of electricity generation, the role of different fuels in electricity generation, trading of electricity, environmental issues related to burning fossil fuels, the recycling of by-products and the role of a large industrial complex in the local economy and community.
Another visitor opportunity exists at our nature reserve that lies at the heart of our ash disposal site. Established as a sanctuary for over 100 species of wildlife, it is specially designed to help schoolchildren understand more about the natural habitat and ecology of the area.
Educational visits are complemented by the Skylark Centre which provides classroom and laboratory facilities where teachers and students can discuss and investigate the results of pond dipping, a bugs and grubs hunt, or a nature trail walk through woodland areas. These facilities were enhanced during 2012 with the construction of a new Skylark Centre building equipped with the latest technology to assist the schoolchildren with their nature studies. The new centre was opened by Olympic gold medallist, Nicola Adams.
Our “Cricket in the Community” initiative, launched in May 2006, has continued to prove popular with local schools. During the year, the England and Wales Cricket Board qualified coaches on our staff, together with England ladies’ cricketer, Katherine Brunt, took cricket coaching to schools in the local area as part of our support for education and to promote sports learning as part of the National Curriculum.
Strengthening our links with the game of cricket, for the sixth year we ran the Drax Cup, a cricket competition for teams of girls and boys under the age of nine. Some 300 primary schools across Yorkshire took part in the knock-out tournament organised by the Yorkshire County Cricket Club (“Yorkshire CCC”) in conjunction with the Yorkshire Cricket Board and the Yorkshire Schools’ Cricket Association. This year the winning school was Bedale Primary School in North Yorkshire.
Under the “Art in the Community” banner, we held our sixth art competition for primary and secondary schools. Some 24 schools participated and the winners received prizes of top art supplies and their schools shared in prize money totalling over £2,800.
Our Summer Art Schools, designed to encourage and develop art appreciation as part of our support for education and to promote art learning within the National Curriculum, entered their fifth year in 2012. Children aged 7 to 10 learnt how to design and make masks and kites using a variety of materials along with t-shirt painting and jigsaw making, while a masterclass for 12 to 16 year-olds helped them learn more about the skills and techniques involved in using watercolour and mixed media.
Visitors to DraxThousands of visitors are welcomed to the power station every year. The appeal of discovering more about how power is produced and the sheer scale of the site and its associated activities attracts schools and colleges as well as business organisations, and local and professional associations. During 2012, we played host to some 6,500 visitors.
46 Drax Group plcAnnual report and accounts 2012
The Board of directors
The Board of directorsAs at 18 February 2013, the Board consisted of the non-executive Chairman, five independent non-executive directors and four executive directors. The current directors are Tim Barker, Charles Berry, Tim Cobbold, Peter Emery, Melanie Gee, David Lindsell, Tony Quinlan, Paul Taylor, Dorothy Thompson and Tony Thorne. Biographical notes of the directors appear below.
Charles BerryChairman
As Chairman, Charles is responsible for the leadership of an effective Board ensuring cohesion between the executive and non-executive directors. He liaises closely with the Chief Executive in order to fully understand the business challenges facing the executive directors and the senior management team and in turn he ensures that matters laid before the non-executive directors are challenged and tested in a robust manner.
Dorothy ThompsonChief Executive
As Chief Executive, Dorothy is responsible for all aspects of the stewardship of the Group and its business, including developing an appropriate business strategy for Board approval and securing its timely and effective implementation. She provides leadership to the executive team and takes responsibility for the important external relationships with customers, suppliers, regulatory agencies and Government bodies.
Tony QuinlanFinance Director
As Finance Director, Tony is responsible for the financial management of the Group, and for relationships with the Group’s bankers. In addition, he has the Investor Relations, Risk Management, IT, Facilities, and Procurement functions reporting to him.
Appointment to the Board:15 December 2005 and was appointed Chairman on 17 April 2008.
Committee membership:Nominations (Chairman) and Remuneration.
External appointments:A non-executive director and Chairman of Senior plc, a non-executive director of The Weir Group PLC, Securities Trust of Scotland plc and of Impax Environmental Markets plc.
Previous experience:Charles has extensive experience within the UK power sector. He joined ScottishPower in 1991 and was appointed to the Board in 1999. From 2000 to 2005, Charles was Chief Executive of the company’s UK operations, with responsibility for over 6,200MW of generating capacity as well as the trading business, energy retailing and strategic transactions, such as renewables development. Charles is also a former non-executive Chairman of Eaga plc and of THUS Group plc.
Qualifications:BSc (Hons) in Electrical Engineering and MSc in Management.
Appointment to the Board:20 October 2005, having joined Drax in September 2005.
Committee membership:Executive.
External appointments:A non-executive director of Johnson Matthey plc.
Previous experience:Dorothy was previously the head of the European business of InterGen NV, the power generation subsidiary of Shell NV and Bechtel Inc., responsible for the management and operation of four gas-fired power plants, totalling some 3,160MW of capacity across the UK and the Netherlands. Prior to joining InterGen NV in 1998, Dorothy was initially in banking and subsequently was assistant group treasurer for Powergen plc.
Qualifications:BSc (Hons) and MSc in Economics.
Appointment to the Board:1 September 2008.
Committee membership:Executive. Tony is also Chairman of the Group’s US subsidiary, Drax Biomass International Inc.
External appointments:A non-executive director of the Port of London Authority.
Previous experience:Tony qualified as a Chartered Accountant with Coopers & Lybrand and subsequently joined Marks & Spencer where he went on to hold a number of senior positions within Internal Audit, Corporate Finance, Investor Relations and Financial Control. From 2005, he was Director of Finance, the deputy to the Group Finance Director.
Qualifications:BSc (Hons) in Chemistry with Business Studies and an Associate of the Institute of Chartered Accountants in England and Wales (ACA).
47Drax Group plcAnnual report and
accounts 2012
Fina
ncia
lsC
orpo
rate
and
soc
ial r
espo
nsib
ility
Mar
ketp
lace
, per
form
ance
and
ris
kG
over
nanc
eO
verv
iew
Peter EmeryProduction Director
As Production Director, Peter is responsible for the operation of the Group’s plant and equipment. This includes all aspects of safety management, plant integrity, plant operations, engineering support, maintenance and plant design. Peter also has responsibility for leading the Company’s carbon capture and storage activity.
Paul TaylorRetail and Trading Director
As Retail and Trading Director, Paul has responsibility for the trading of power and other associated commodities. He is also responsible for the retail division, Haven Power, which sells electricity to customers in the industrial and commercial and small and medium enterprises markets.
Tim BarkerSenior independent non-executive director
As the Senior Independent Director, Tim’s counsel is of great importance to the Board and its Committees. His knowledge and experience of financialmarkets provides the Board with added insight.
Appointment to the Board:20 October 2005, having joined Drax in June 2004.
Committee membership:Executive.
External appointments:A non-executive director of NG Bailey Limited. A member of The Energy Research Partnership.
Previous experience:Peter joined Esso Petroleum upon leaving university and held a number of analyst and managerial roles in the UK before moving to Esso’s parent, Exxon in the US to co-ordinate its downstream marketing and distribution investments outside North America and Canada. Peter returned to Esso’s Fawley Oil Refinery in 1992 as plant technical services manager. In 1997, he became refinery maintenance manager and in 2002, he was appointed operations manager with full management and operational responsibility for Fawley Oil Refinery, the UK’s largest refinery. He was also a member of ExxonMobil’s European leadership team for refining.
Qualifications:BSc (Hons) in Mining Engineering, Fellow of the Institute of Materials, Minerals and Mining (FMIMM) and completed the Advanced Management Programme at INSEAD in 2007.
Appointment to the Board:1 September 2011, having joined Drax in July 2004.
Committee membership:Executive. Paul is also Chairman of the Group’s retail subsidiary, Haven Power Limited.
External appointments:None.
Previous experience:Paul has more than 15 years experience in energy trading previously working for TXU Europe and Powergen/E.ON UK. At TXU Europe Paul led the UK electricity trading function responsible for trading a combined portfolio of over 7GW of power plant and a retail position of more than 50TWh. Before energy trading Paul worked in operational research.
Qualifications:BSc (Hons) in Business Operation and Control.
Appointment to the Board:20 October 2005, having joined Drax in June 2004 and was appointed as the Senior Independent Director on 15 December 2005.
Committee membership:Remuneration (Chairman), Audit and Nominations.
External appointments:A non-executive director of several other companies including the European subsidiary of the Investment Bank Jeffries Group Inc. and Chairman of an early stage company developing a new energy storage technology.
Previous experience:From 1993, Tim was Vice Chairman of Kleinwort Benson Group plc and from 1998, until his retirement in 2000, he was Vice Chairman of Dresdner Kleinwort Benson. Notably, he was involved with a number of clients in the energy sector and was an adviser to the UK Government on the privatisation of the electricity sector. In the mid-1980s, Tim was Director General of the City Panel on Takeovers and Mergers. He is a former Chairman of Robert Walters plc and was the senior independent non-executive director of Electrocomponents plc.
Qualifications:MA (Hons) in Economics.
Each of the independent non-executive directors detailed in this section served the Group throughout the year ended 31 December 2012, with the exception of Melanie Gee who was appointed to the Board on 1 January 2013. No person, other than those mentioned above, served as a director or as an alternate director at any time during the year.

48 Drax Group plcAnnual report and accounts 2012
Tim CobboldIndependent non-executive director
Tim’s blend of financial and engineering experience means that he is well placed to contribute significantly to the Board and its Committees. His role as an active chief executive in a different sector adds an alternative dimension to his contribution.
Melanie GeeIndependent non-executive director
Melanie’s blend of financial and corporate experience means that she is well placed to contribute significantly to the Board and its Committees. Her advisory role in a City firm brings added insight to the Board.
David LindsellIndependent non-executive director
David’s recent and relevant experience in the areas of finance and audit are a significant asset to the Board and his role as Chairman of the Audit Committee.
Tony ThorneIndependent non-executive director
Tony’s experience of operating in different geographical territories is of great importance as Drax considers expansion into global markets.
Appointment to the Board:27 September 2010.
Committee membership:Audit, Nominations and Remuneration.
External appointments:Chief Executive and an executive director of De La Rue Plc.
Previous experience:Tim was previously the Chief Executive Officer of Chloride Group plc, the leading international provider of secure power solutions having joined them in 2007 as Chief Operating Officer. Following Emerson Electric’s takeover of Chloride he held a senior position in Emerson, responsible for the Chloride Group of companies. He trained as a Mechanical Engineer and qualified as a Chartered Accountant in 1987 and joined Smiths Group plc (formerly TI Group plc) in 1989 where he held a number of senior financial and operational management positions over an 18 year period.
Qualifications:BSc (Hons) in Mechanical Engineering and a Fellow of the Institute of Chartered Accountants in England and Wales (FCA).
Appointment to the Board:1 January 2013.
Committee membership:Audit, Nominations and Remuneration.
External appointments:A senior advisor to Lazard & Co. Limited and a non-executive director of The Weir Group PLC.
Previous experience:Melanie joined Lazard & Co. Limited in 2008 as a Managing Director and became a Senior Advisor at the end of 2012. Prior to that, she was at UBS Investment Bank (1982 to 2007), where she held a number of senior positions in Corporate Finance.
Qualifications:MA in Mathematics.
Appointment to the Board:1 December 2008.
Committee membership:Audit (Chairman), Nominations and Remuneration.
External appointments:A non-executive director of Premier Oil plc.
Previous experience:David was a partner at Ernst & Young for nearly 30 years. He specialised in audit and assurance services and has extensive experience across a range of industry sectors. He was Deputy Chairman of the Financial Reporting Review Panel from 2008 to 2012 and has served on a number of professional bodies relating to financial reporting, including the IFRS Advisory Council, the Auditing Practices Board, the Turnbull Committee and the European Financial Reporting Advisory Group. David is a former non-executive director of Gartmore Group Limited.
Qualifications:Fellow of the Institute of Chartered Accountants in England and Wales (FCA).
Appointment to the Board:29 June 2010.
Committee membership:Audit, Nominations and Remuneration.
External appointments:Chairman of the South East Coast Ambulance Service.
Previous experience:Tony was Chief Executive of DS Smith plc, the international packaging and office products group, from 2001 until his retirement from the Board in May 2010. Previously he was President of SCA’s corrugated packaging business. Prior to this he spent 20 years with Shell International, working throughout the world in senior management roles, including strategic planning and President of the Shell companies in Mexico.
Qualifications:BSc (Hons) in Agricultural Economics.
The Board of directors
49Drax Group plcAnnual report and
accounts 2012
Fina
ncia
lsC
orpo
rate
and
soc
ial r
espo
nsib
ility
Mar
ketp
lace
, per
form
ance
and
ris
kG
over
nanc
eO
verv
iew
Corporate governance
A cornerstone of success…What good corporate governance means at Drax “ The Board believes that good practice should flow throughout the Group, which in turn should guide the decisions taken on a daily basis. If we achieve this, then we can be sure that we are taking the right actions for the benefit of all our stakeholders.”Charles Berry Chairman
Chairman’s letterI am pleased to present the Group’s Corporate governance report for 2012 on behalf of our Board. This report is intended to provide you with a clear and meaningful explanation of what governance means to us and how it guides our decision making. Good governance at all levels is taken seriously within the Group and it is the Board that sets the tone and takes the lead.
Good governance should be second nature to everyone within the Group as they go about their day-to-day business and is not simply a set of policies and processes. The Board believes that good practice should flow throughout the Group, which in turn should guide the decisions taken on a daily basis. If we achieve this, then we can be sure that we are taking the right actions for the benefit of all our stakeholders.
It is important that we continue to develop our board structures, processes and procedures to ensure that our governance remains relevant and focused on improving our business and driving our strategic priorities. As in previous years, during 2012, we continued to strengthen our internal control and risk management processes to ensure that they remain effective and are embedded in business operations across the Group.
I believe the drive for transparent reporting has continued to improve business conduct in recent years. The UK Corporate Governance Code issued by the Financial Reporting Council emphasises that organisations should actively consider the make up and diversity of their boards. We have an established policy which ensures that gender diversity is one of the factors taken into account when considering appointments to the Board and other senior roles.
I am pleased to report that the Board has reviewed the requirements of the UK Corporate Governance Code and we comply with it and we intend to continue to observe it, to ensure ongoing good governance is maintained. A more detailed report on our corporate governance arrangements is set out on the following pages.our corporate governance arrangements is
Charles Berry Chairman
Directors’ reportThe directors present their report for Drax Group plc for the year ended 31 December 2012 on pages 1 to 82.
Corporate governanceThe Group is committed to high standards of corporate governance, details of which are given in this Corporate governance report and the Audit, Nominations and Remuneration Committee reports set out on pages 59 to 82.
The various sections of this report contain in summary certain provisions of the Company’s current Articles of Association (the “Articles”) and applicable English law concerning companies (the Companies Act 2006). This is a summary only and the relevant provisions of the Articles or the Companies Act should be consulted if further information is required.
Compliance with the UK Corporate Governance CodeIt is the Board’s view that throughout the period commencing on 1 January 2012, there has been full compliance with the provisions of the UK Corporate Governance Code issued in June 2010 and applicable to this financial year.
50 Drax Group plcAnnual report and accounts 2012
Corporate governance
How the Board functions The Board has seven scheduled meetings each year, and arranges additional meetings if the need arises. There are also three scheduled business updates for the Board by telephone conference call, which are constituted as Board meetings held by telephone if required to address matters for formal decisions. In addition, the Board meets at least annually to consider strategy. In October 2012, the Board also met specifically to consider and approve proposals for the issue and placing of shares and for entering into financing arrangements to support the Company’s planned investments.
The Board has adopted a schedule of matters reserved for its decision and formal terms of reference for its committees which are available to view on the Group’s website at www.draxgroup.plc.uk. The Board determines: the Group’s strategy; the Group’s appetite for risk; the internal control and risk management policies; the Business Plan and principal performance indicators; acquisitions and disposals and other transactions outside delegated limits; material changes to accounting policies or practices; significant financial decisions; capital structure and dividend policy; shareholder communications; prosecution, defence or settlement of material litigation; Group remuneration policy; the terms of reference and membership of Board Committees; and the Board structure, composition and succession. Matters which are not specifically reserved to the Board and its committees under their terms of reference, or to shareholders in General Meeting, are delegated to the Chief Executive or otherwise delegated in accordance with a schedule of delegated authorities approved by the Board.
The Board receives regular reports on performance against the Business Plan and periodic business reports from senior management. Directors are briefed on matters to be discussed at meetings by papers distributed in advance of Board and committee meetings.
The Board has adopted a policy whereby directors may, in the furtherance of their duties, seek independent professional advice at the Company’s expense. During 2012, no director sought independent professional advice pursuant to the policy.
The Company Secretary is responsible for advising the Board on all governance matters, ensuring good information flows within the Board, its committees and senior management, and ensuring that Board processes are complied with. He is also responsible for compliance with the Companies Act, the Listing, Prospectus and Disclosure and Transparency Rules. In his role as Director of Corporate Affairs, he is also responsible for advising the Board on legal matters and has responsibility for the Company Secretarial, Environmental, External Communications, Group Legal, Human Resources, and Regulatory and Policy functions, and for the management of the Group’s internal control and risk management framework and processes.
The Articles give the directors power to approve conflicts of interest. The Board has adopted a procedure that has operated effectively by which situations giving rise to potential conflicts of interest are identified to the Board, considered for authorisation and recorded. The Articles also allow the Board to exercise voting rights in group companies without restriction (e.g. so as to appoint a director to the board of a group company without this counting as a conflict requiring authorisation).
Each director has the benefit of a deed of indemnity from the Company and its subsidiaries in respect of claims made and liabilities incurred, in either case arising out of the bona fide discharge by the director of his or her duties. The Company has also arranged appropriate insurance cover in respect of legal action against directors of the Company and its subsidiaries.
51Drax Group plcAnnual report and
accounts 2012
Mar
ketp
lace
, per
form
ance
and
ris
kC
orpo
rate
and
soc
ial r
espo
nsib
ility
Fina
ncia
lsG
over
nanc
eO
verv
iewSelection, appointment, review and re-election
The Articles provide that one-third of directors, not including directors appointed by the Board, (rounded down to the nearest whole number) shall retire by rotation each year but are eligible to submit themselves for re-election by shareholders and that directors shall not serve longer than the third Annual General Meeting (“AGM”) following their election without being re-elected by shareholders.
Notwithstanding the provisions of the Articles, and in accordance with the UK Corporate Governance Code, the Company will continue to propose all directors for annual re-election. Accordingly each of Charles Berry, Tim Cobbold, Peter Emery, David Lindsell, Tony Quinlan, Paul Taylor, Dorothy Thompson and Tony Thorne will retire at the forthcoming AGM and, being eligible, offer themselves for re election.
Tim Barker will retire at the conclusion of the forthcoming AGM and will not seek re-election.
The Articles require that, following appointment to the Board, directors submit themselves for election by shareholders at the first AGM following their appointment. Melanie Gee has been appointed to the Board after the last AGM and, therefore, will retire and offer herself for election by shareholders at the forthcoming AGM.
The evaluation of the Board described below concluded that the directors offering themselves for election or re-election (in line with the provisions contained in the Articles) continue to demonstrate commitment, management and industry expertise in their particular role and perform effectively.
The election or re-election of each director is recommended by the Board. Details of the service contracts for the executive directors and letters of appointment for the non-executive directors are set out in a table on page 69.
It is the Board’s policy that each non-executive director will be appointed for a term of three years which, subject to the Board being satisfied as to the director’s performance and commitment, and a resolution to re-elect at the appropriate AGM, may be renewed by mutual agreement. However, it is the Board’s policy not to extend the aggregate period of service of any independent non executive director beyond nine years and, any proposal made to extend a non-executive director’s aggregate period of office beyond six years is the subject of a rigorous review. Such reviews in cases where a director remains in office after six years, will be conducted annually, as part of the evaluation of the Board.
The Board is satisfied that all the directors are able to devote sufficient time to their duties as directors.
Performance reviews and directors’ development The effectiveness of the Board is vital to the success of the Group. For each of the previous five years the Board has conducted a review of its effectiveness and that of its committees with the assistance of external facilitation. In 2012, the performance review was undertaken internally, led by the Chairman and facilitated by the Company Secretary. The review concluded that the Board, its individual directors and its committees continued to be effective. There were no significant areas of concern. The review did, however, identify areas in which processes could be improved to enhance the Board’s effectiveness in monitoring performance as the Group implements its biomass transformation plans which will increase the scope and complexity of the Group’s operations. In particular:
– enhanced reporting on major capital projects, including those in the US, will be incorporated into regular Board reporting;
– specific measures were identified to assist directors in maintaining appropriate knowledge and understanding of commodity market conditions in which the Group operates and to enable them to assess the risks inherent in trading activities; and
– there is a continuing need to keep the Group’s Bribery Act compliance processes under review in the light of the expansion of jurisdictions in which the business will be operating.
During the year, the Chairman held a meeting with the non-executive directors in the absence of the executive directors, and the Senior Independent Director held a meeting with the non-executive directors without the Chairman being present, as required by provision A.4.2 of the UK Corporate Governance Code.
The Board is committed to the development of all employees and directors and has reviewed and will periodically continue to review each individual director’s development requirements and make appropriate arrangements to address them. All new directors receive an induction, including being provided with information about the Group and their responsibilities, meetings with key managers and visits to the Group’s sites. In addition, each non-executive director visits operational sites and meets with senior management to be briefed on the Group’s business at least annually, and specific Board training days are arranged, where appropriate, involving presentations on relevant topics.
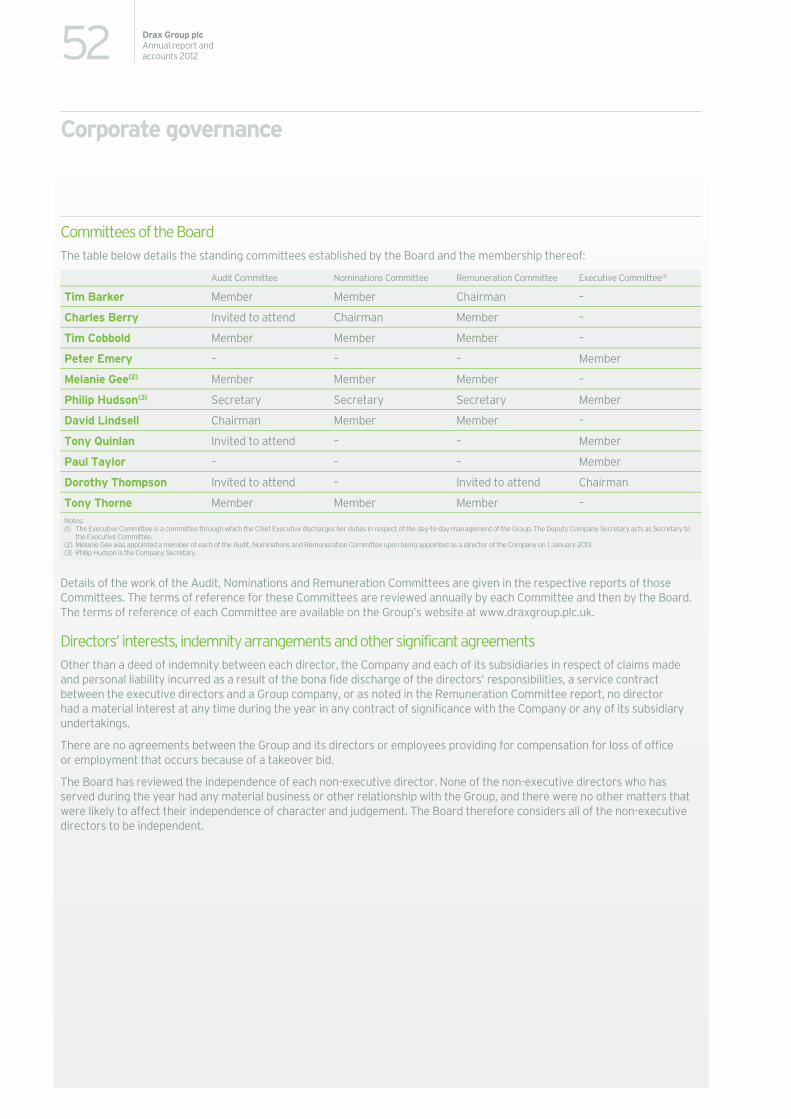
52 Drax Group plcAnnual report and accounts 2012
Corporate governance
Committees of the Board The table below details the standing committees established by the Board and the membership thereof:
Audit Committee Nominations Committee Remuneration Committee Executive Committee(1)
Tim Barker Member Member Chairman –
Charles Berry Invited to attend Chairman Member –
Tim Cobbold Member Member Member –
Peter Emery – – – Member
Melanie Gee(2) Member Member Member –
Philip Hudson(3) Secretary Secretary Secretary Member
David Lindsell Chairman Member Member –
Tony Quinlan Invited to attend – – Member
Paul Taylor – – – Member
Dorothy Thompson Invited to attend – Invited to attend Chairman
Tony Thorne Member Member Member – Notes: (1) The Executive Committee is a committee through which the Chief Executive discharges her duties in respect of the day-to-day management of the Group. The Deputy Company Secretary acts as Secretary to
the Executive Committee. (2) Melanie Gee was appointed a member of each of the Audit, Nominations and Remuneration Committee upon being appointed as a director of the Company on 1 January 2013. (3) Philip Hudson is the Company Secretary.
Details of the work of the Audit, Nominations and Remuneration Committees are given in the respective reports of those Committees. The terms of reference for these Committees are reviewed annually by each Committee and then by the Board. The terms of reference of each Committee are available on the Group’s website at www.draxgroup.plc.uk.
Directors’ interests, indemnity arrangements and other significant agreements Other than a deed of indemnity between each director, the Company and each of its subsidiaries in respect of claims made and personal liability incurred as a result of the bona fide discharge of the directors’ responsibilities, a service contract between the executive directors and a Group company, or as noted in the Remuneration Committee report, no director had a material interest at any time during the year in any contract of significance with the Company or any of its subsidiary undertakings.
There are no agreements between the Group and its directors or employees providing for compensation for loss of office or employment that occurs because of a takeover bid.
The Board has reviewed the independence of each non-executive director. None of the non-executive directors who has served during the year had any material business or other relationship with the Group, and there were no other matters that were likely to affect their independence of character and judgement. The Board therefore considers all of the non-executive directors to be independent.
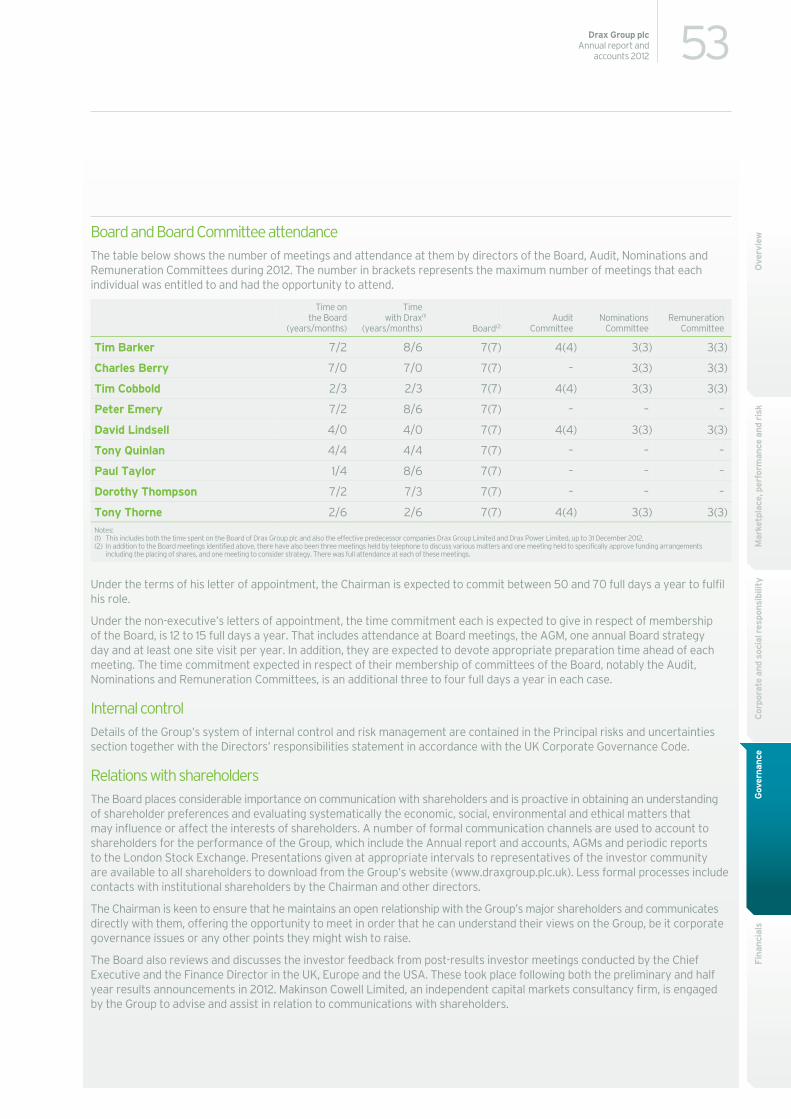
53Drax Group plcAnnual report and
accounts 2012
Mar
ketp
lace
, per
form
ance
and
ris
kC
orpo
rate
and
soc
ial r
espo
nsib
ility
Fina
ncia
lsG
over
nanc
eO
verv
iew
Board and Board Committee attendance The table below shows the number of meetings and attendance at them by directors of the Board, Audit, Nominations and Remuneration Committees during 2012. The number in brackets represents the maximum number of meetings that each individual was entitled to and had the opportunity to attend.
Time on the Board
(years/months)
Timewith Drax(1)
(years/months) Board(2)Audit
Committee Nominations
Committee Remuneration
Committee
Tim Barker 7/2 8/6 7(7) 4(4) 3(3) 3(3)
Charles Berry 7/0 7/0 7(7) – 3(3) 3(3)
Tim Cobbold 2/3 2/3 7(7) 4(4) 3(3) 3(3)
Peter Emery 7/2 8/6 7(7) – – –
David Lindsell 4/0 4/0 7(7) 4(4) 3(3) 3(3)
Tony Quinlan 4/4 4/4 7(7) – – –
Paul Taylor 1/4 8/6 7(7) – – –
Dorothy Thompson 7/2 7/3 7(7) – – –
Tony Thorne 2/6 2/6 7(7) 4(4) 3(3) 3(3) Notes: (1) This includes both the time spent on the Board of Drax Group plc and also the effective predecessor companies Drax Group Limited and Drax Power Limited, up to 31 December 2012. (2) In addition to the Board meetings identified above, there have also been three meetings held by telephone to discuss various matters and one meeting held to specifically approve funding arrangements
including the placing of shares, and one meeting to consider strategy. There was full attendance at each of these meetings.
Under the terms of his letter of appointment, the Chairman is expected to commit between 50 and 70 full days a year to fulfil his role.
Under the non-executive’s letters of appointment, the time commitment each is expected to give in respect of membership of the Board, is 12 to 15 full days a year. That includes attendance at Board meetings, the AGM, one annual Board strategy day and at least one site visit per year. In addition, they are expected to devote appropriate preparation time ahead of each meeting. The time commitment expected in respect of their membership of committees of the Board, notably the Audit, Nominations and Remuneration Committees, is an additional three to four full days a year in each case.
Internal control Details of the Group’s system of internal control and risk management are contained in the Principal risks and uncertainties section together with the Directors’ responsibilities statement in accordance with the UK Corporate Governance Code.
Relations with shareholders The Board places considerable importance on communication with shareholders and is proactive in obtaining an understanding of shareholder preferences and evaluating systematically the economic, social, environmental and ethical matters that may influence or affect the interests of shareholders. A number of formal communication channels are used to account to shareholders for the performance of the Group, which include the Annual report and accounts, AGMs and periodic reports to the London Stock Exchange. Presentations given at appropriate intervals to representatives of the investor community are available to all shareholders to download from the Group’s website (www.draxgroup.plc.uk). Less formal processes include contacts with institutional shareholders by the Chairman and other directors.
The Chairman is keen to ensure that he maintains an open relationship with the Group’s major shareholders and communicates directly with them, offering the opportunity to meet in order that he can understand their views on the Group, be it corporate governance issues or any other points they might wish to raise.
The Board also reviews and discusses the investor feedback from post-results investor meetings conducted by the Chief Executive and the Finance Director in the UK, Europe and the USA. These took place following both the preliminary and half year results announcements in 2012. Makinson Cowell Limited, an independent capital markets consultancy firm, is engaged by the Group to advise and assist in relation to communications with shareholders.
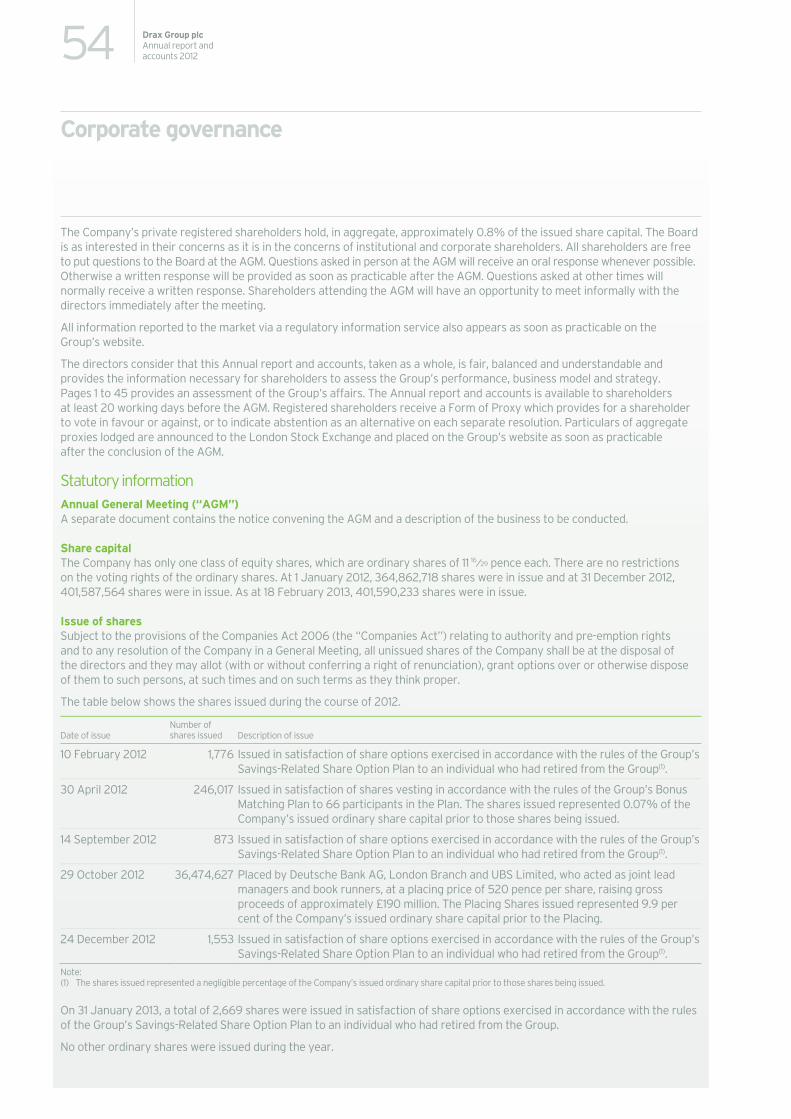
54 Drax Group plcAnnual report and accounts 2012
Corporate governance
The Company’s private registered shareholders hold, in aggregate, approximately 0.8% of the issued share capital. The Board is as interested in their concerns as it is in the concerns of institutional and corporate shareholders. All shareholders are free to put questions to the Board at the AGM. Questions asked in person at the AGM will receive an oral response whenever possible. Otherwise a written response will be provided as soon as practicable after the AGM. Questions asked at other times will normally receive a written response. Shareholders attending the AGM will have an opportunity to meet informally with the directors immediately after the meeting.
All information reported to the market via a regulatory information service also appears as soon as practicable on the Group’s website.
The directors consider that this Annual report and accounts, taken as a whole, is fair, balanced and understandable and provides the information necessary for shareholders to assess the Group’s performance, business model and strategy. Pages 1 to 45 provides an assessment of the Group’s affairs. The Annual report and accounts is available to shareholders at least 20 working days before the AGM. Registered shareholders receive a Form of Proxy which provides for a shareholder to vote in favour or against, or to indicate abstention as an alternative on each separate resolution. Particulars of aggregate proxies lodged are announced to the London Stock Exchange and placed on the Group’s website as soon as practicable after the conclusion of the AGM.
Statutory information Annual General Meeting (“AGM”) A separate document contains the notice convening the AGM and a description of the business to be conducted.
Share capital The Company has only one class of equity shares, which are ordinary shares of 11 16⁄29 pence each. There are no restrictions on the voting rights of the ordinary shares. At 1 January 2012, 364,862,718 shares were in issue and at 31 December 2012, 401,587,564 shares were in issue. As at 18 February 2013, 401,590,233 shares were in issue.
Issue of shares Subject to the provisions of the Companies Act 2006 (the “Companies Act”) relating to authority and pre-emption rights and to any resolution of the Company in a General Meeting, all unissued shares of the Company shall be at the disposal of the directors and they may allot (with or without conferring a right of renunciation), grant options over or otherwise dispose of them to such persons, at such times and on such terms as they think proper.
The table below shows the shares issued during the course of 2012.
Date of issue Number of shares issued Description of issue
10 February 2012 1,776 Issued in satisfaction of share options exercised in accordance with the rules of the Group’s Savings-Related Share Option Plan to an individual who had retired from the Group(1).
30 April 2012 246,017 Issued in satisfaction of shares vesting in accordance with the rules of the Group’s Bonus Matching Plan to 66 participants in the Plan. The shares issued represented 0.07% of the Company’s issued ordinary share capital prior to those shares being issued.
14 September 2012 873 Issued in satisfaction of share options exercised in accordance with the rules of the Group’s Savings-Related Share Option Plan to an individual who had retired from the Group(1).
29 October 2012 36,474,627 Placed by Deutsche Bank AG, London Branch and UBS Limited, who acted as joint lead managers and book runners, at a placing price of 520 pence per share, raising gross proceeds of approximately £190 million. The Placing Shares issued represented 9.9 per cent of the Company’s issued ordinary share capital prior to the Placing.
24 December 2012 1,553 Issued in satisfaction of share options exercised in accordance with the rules of the Group’s Savings-Related Share Option Plan to an individual who had retired from the Group(1).
Note: (1) The shares issued represented a negligible percentage of the Company’s issued ordinary share capital prior to those shares being issued.
On 31 January 2013, a total of 2,669 shares were issued in satisfaction of share options exercised in accordance with the rules of the Group’s Savings-Related Share Option Plan to an individual who had retired from the Group.
No other ordinary shares were issued during the year.
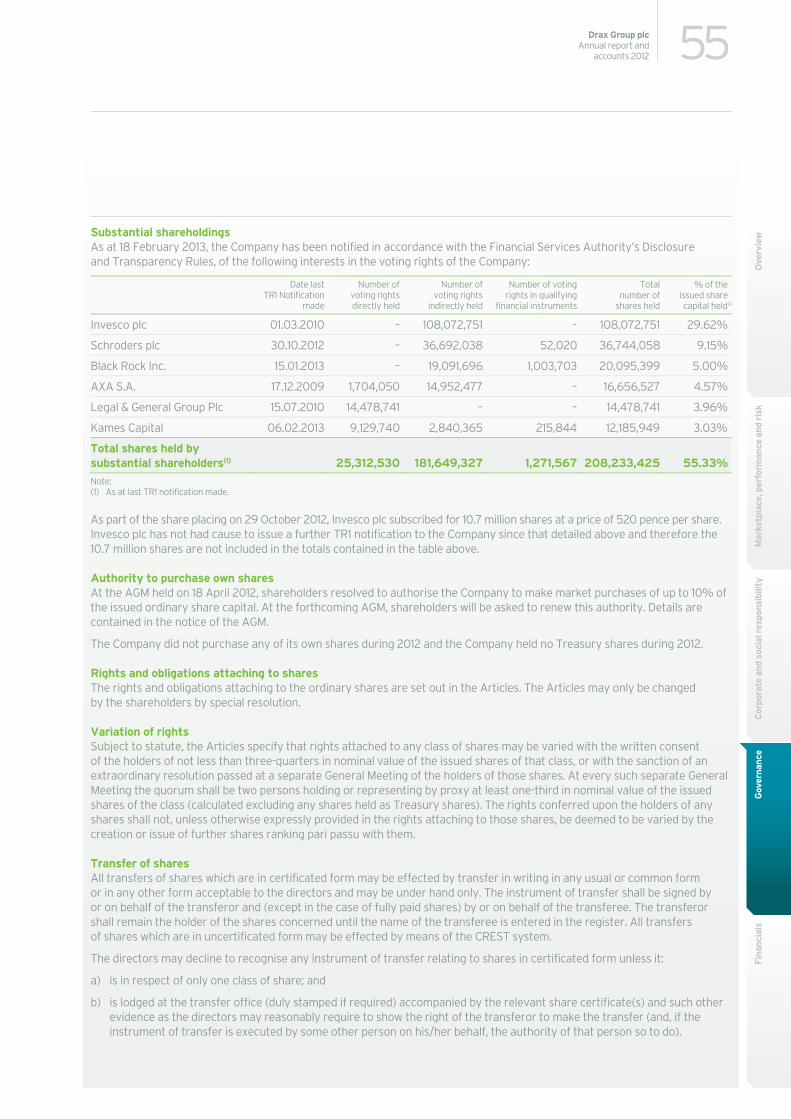
55Drax Group plcAnnual report and
accounts 2012
Mar
ketp
lace
, per
form
ance
and
ris
kC
orpo
rate
and
soc
ial r
espo
nsib
ility
Fina
ncia
lsG
over
nanc
eO
verv
iewSubstantial shareholdings
As at 18 February 2013, the Company has been notified in accordance with the Financial Services Authority’s Disclosure and Transparency Rules, of the following interests in the voting rights of the Company:
Date last TR1 Notification
made
Number of voting rights directly held
Number of voting rights
indirectly held
Number of voting rights in qualifying
financial instruments
Total number of
shares held
% of the issued sharecapital held(i)
Invesco plc 01.03.2010 – 108,072,751 – 108,072,751 29.62%
Schroders plc 30.10.2012 – 36,692,038 52,020 36,744,058 9.15%
Black Rock Inc. 15.01.2013 – 19,091,696 1,003,703 20,095,399 5.00%
AXA S.A. 17.12.2009 1,704,050 14,952,477 – 16,656,527 4.57%
Legal & General Group Plc 15.07.2010 14,478,741 – – 14,478,741 3.96%
Kames Capital 06.02.2013 9,129,740 2,840,365 215,844 12,185,949 3.03%
Total shares held by substantial shareholders(1) 25,312,530 181,649,327 1,271,567 208,233,425 55.33%Note: (1) As at last TR1 notification made.
As part of the share placing on 29 October 2012, Invesco plc subscribed for 10.7 million shares at a price of 520 pence per share. Invesco plc has not had cause to issue a further TR1 notification to the Company since that detailed above and therefore the 10.7 million shares are not included in the totals contained in the table above.
Authority to purchase own shares At the AGM held on 18 April 2012, shareholders resolved to authorise the Company to make market purchases of up to 10% of the issued ordinary share capital. At the forthcoming AGM, shareholders will be asked to renew this authority. Details are contained in the notice of the AGM.
The Company did not purchase any of its own shares during 2012 and the Company held no Treasury shares during 2012.
Rights and obligations attaching to shares The rights and obligations attaching to the ordinary shares are set out in the Articles. The Articles may only be changed by the shareholders by special resolution.
Variation of rights Subject to statute, the Articles specify that rights attached to any class of shares may be varied with the written consent of the holders of not less than three-quarters in nominal value of the issued shares of that class, or with the sanction of an extraordinary resolution passed at a separate General Meeting of the holders of those shares. At every such separate General Meeting the quorum shall be two persons holding or representing by proxy at least one-third in nominal value of the issued shares of the class (calculated excluding any shares held as Treasury shares). The rights conferred upon the holders of any shares shall not, unless otherwise expressly provided in the rights attaching to those shares, be deemed to be varied by the creation or issue of further shares ranking pari passu with them.
Transfer of shares All transfers of shares which are in certificated form may be effected by transfer in writing in any usual or common form or in any other form acceptable to the directors and may be under hand only. The instrument of transfer shall be signed by or on behalf of the transferor and (except in the case of fully paid shares) by or on behalf of the transferee. The transferor shall remain the holder of the shares concerned until the name of the transferee is entered in the register. All transfers of shares which are in uncertificated form may be effected by means of the CREST system.
The directors may decline to recognise any instrument of transfer relating to shares in certificated form unless it:
a) is in respect of only one class of share; and
b) is lodged at the transfer office (duly stamped if required) accompanied by the relevant share certificate(s) and such other evidence as the directors may reasonably require to show the right of the transferor to make the transfer (and, if the instrument of transfer is executed by some other person on his/her behalf, the authority of that person so to do).
56 Drax Group plcAnnual report and accounts 2012
Corporate governance
The directors may, in the case of shares in certificated form, in their absolute discretion and without assigning any reason therefore, refuse to register any transfer of shares (not being fully paid shares) provided that, where any such shares are admitted to the Official List of the London Stock Exchange, such discretion may not be exercised in such a way as to prevent dealings in the shares of that class from taking place on an open and proper basis. The directors may also refuse to register an allotment or transfer of shares (whether fully paid or not) in favour of more than four persons jointly.
If the directors refuse to register an allotment or transfer, they shall send within two months after the date on which the letter of allotment or transfer was lodged with the Company, to the allottee or transferee, notice of the refusal.
A shareholder does not need to obtain the approval of the Company, or of other shareholders of shares in the Company, for a transfer of shares to take place.
The Articles provide that directors must give reasons for any refusal to register a transfer of shares in accordance with the Companies Act.
Shares in uncertificated form Directors may determine that any class of shares may be held in uncertificated form and title to such shares may be transferred by means of a relevant system or that shares of any class should cease to be held and transferred. Subject to the provisions of the Companies Act, the CREST Regulations and every other statute, statutory instrument, regulation or order for the time being in force concerning companies and affecting the Company. The provisions of the Articles shall not apply to shares of any class which are in uncertificated form to the extent that the Articles are inconsistent with the holding of shares of that class in uncertificated form, the transfer of title to shares of that class by means of a relevant system or any provision of the CREST Regulations.
Voting Subject to the Articles generally and to any special rights or restrictions as to voting attached by, or in accordance with, the Articles to any class of shares, on a show of hands every member who is present in person at a General Meeting shall have one vote and, on a poll, every member who is present in person or by proxy shall have one vote for every share of which he/she is the holder. It has been the Company’s practice since incorporation to hold a poll on every resolution at Annual General Meetings and Extraordinary General Meetings.
Where shares are held by trustees/nominees in respect of the Group’s employee share plans and the voting rights attached to such shares are not directly exercisable by the employees, it is the Company’s practice that such rights are not exercised by the relevant trustee/nominee.
Under the Companies Act, members are entitled to appoint a proxy, who need not be a member of the Company, to exercise all or any of their rights to attend and to speak and vote on their behalf at a General Meeting or class meeting. A member may appoint more than one proxy in relation to a General Meeting or class meeting provided that each proxy is appointed to exercise the rights attached to a different share or shares held by that member. A member that is a corporation may appoint one or more individuals to act on its behalf at a General Meeting or class meetings as a corporate representative.
Deadlines for exercising voting rights Votes are exercisable at a General Meeting of the Company in respect of which the business being voted upon is being heard. Votes may be exercised in person, by proxy, or in relation to corporate members, by corporate representative. The Articles provide a deadline for submission of proxy forms of not less than 48 hours before the time appointed for the holding of the meeting or adjourned meeting.
Restrictions on voting No member shall, unless the directors otherwise determine, be entitled in respect of any share held by him/her to vote either personally or by proxy at a shareholders’ meeting or to exercise any other right conferred by membership in relation to shareholders’ meetings if any call or other sum presently payable by him/her to the Company in respect of that share remains unpaid. In addition, no member shall be entitled to vote if he/she has been served with a notice after failing to provide the Company with information concerning interests in those shares required to be provided under the Companies Act.
57Drax Group plcAnnual report and
accounts 2012
Mar
ketp
lace
, per
form
ance
and
ris
kC
orpo
rate
and
soc
ial r
espo
nsib
ility
Fina
ncia
lsG
over
nanc
eO
verv
iewOther significant agreements
Under a £100 million amortising term loan facility agreement dated 20 December 2012 between, amongst others, Drax Finance Limited and the Prudential M&G UK Companies Financing Fund, on a change of control, if any lender requires, it may by giving notice to Drax Finance Limited and the facility agent within 30 days of receiving notice from Drax Finance Limited that a change of control has occurred, cancel its commitments and require the repayment of its share of any outstanding amounts within three business days of such cancellation notice being given.
Under a £100 million amortising term loan facility agreement dated 20 December 2012 between, amongst others, Drax Finance Limited and the Green Investment Bank, on a change of control, if any lender requires, it may by giving notice to Drax Finance Limited and the facility agent within 30 days of receiving notice from Drax Finance Limited that a change of control has occurred, cancel its commitments and require the repayment of its share of any outstanding amounts within three business days of such cancellation notice being given.
Under a £400 million revolving credit facility agreement dated 20 December 2012 between, amongst others, Drax Power Limited and Barclays Bank PLC (as facility agent), on a change of control, if any lender requires, it may by giving notice to Drax Power Limited and the facility agent within 30 days of receiving notice from Drax Power Limited that a change of control has occurred, cancel its commitments and require the repayment of its share of any outstanding amounts within three business days of such cancellation notice being given.
Under the terms of the above credit facility agreements, a “change of control” occurs if any person or group of persons acting in concert gains control of Drax Group plc.
There are no other significant agreements to which the Group is a party that take effect, alter or terminate upon a change of control of the Group following a takeover bid.
Auditors and the disclosure of information to the auditor So far as each person who is a director at the date of approving this report is aware, there is no relevant audit information, being information needed by the auditor in connection with preparing the report, of which the auditor is unaware. Having made enquiries of fellow directors, each director has taken all steps that he/she ought to have taken as a director to ascertain any relevant audit information and to establish that the auditor is aware of that information. This information is given and should be interpreted in accordance with the provisions of Section 418 of the Companies Act.
In accordance with Section 489 of the Companies Act, a resolution is to be proposed at the AGM for the reappointment of Deloitte LLP as the auditor of the Group. A resolution will also be proposed authorising the directors to determine the auditor’s remuneration. The Audit Committee reviews the appointment of the auditor, the auditor’s effectiveness and relationship with the Group, including the level of audit and non-audit fees paid to the auditor. Further details on the work of the auditor and the Audit Committee are set out in the Audit Committee report on pages 59 to 61.
By order of the Board.
Philip Hudson Company Secretary
18 February 2013
Registered office: Drax Power Station Selby North Yorkshire YO8 8PH Registered in England and Wales No. 5562053
58 Drax Group plcAnnual report and accounts 2012
Corporate governance
Directors’ responsibilities statement The directors are responsible for preparing the Annual report and the financial statements in accordance with applicable law and regulations.
Company law requires the directors to prepare financial statements for each financial year. Under that law the directors are required to prepare the Group financial statements in accordance with International Financial Reporting Standards (IFRSs) as adopted by the European Union and Article 4 of the IAS Regulation and have elected to prepare the parent Company financial statements in accordance with United Kingdom Generally Accepted Accounting Practice (United Kingdom Accounting Standards and applicable law). Under company law the directors must not approve the accounts unless they are satisfied that they give a true and fair view of the state of affairs of the Company and of the profit or loss of the Company for that period.
In preparing the parent Company financial statements, the directors are required to:
– select suitable accounting policies and then apply them consistently;
– make judgements and accounting estimates that are reasonable and prudent;
– state whether applicable UK Accounting Standards have been followed, subject to any material departures disclosed and explained in the financial statements; and
– prepare the financial statements on the going concern basis unless it is inappropriate to presume that the Company will continue in business.
In preparing the Group financial statements, International Accounting Standard 1 requires that directors:
– properly select and apply accounting policies;
– present information, including accounting policies, in a manner that provides relevant, reliable, comparable and understandable information;
– provide additional disclosures when compliance with the specific requirements in IFRSs are insufficient to enable users to understand the impact of particular transactions, other events and conditions on the entity’s financial position and financial performance; and
– make an assessment of the Company's ability to continue as a going concern.
The directors are responsible for keeping adequate accounting records that are sufficient to show and explain the Company’s transactions and disclose with reasonable accuracy at any time the financial position of the Company and enable them to ensure that the financial statements comply with the Companies Act 2006. They are also responsible for safeguarding the assets of the Company and hence for taking reasonable steps for the prevention and detection of fraud and other irregularities.
The directors are responsible for the maintenance and integrity of the corporate and financial information included on the Company’s website. Legislation in the United Kingdom governing the preparation and dissemination of financial statements may differ from legislation in other jurisdictions.
Responsibility statement We confirm that to the best of our knowledge:
– the financial statements, prepared in accordance with the relevant financial reporting framework, give a true and fair view of the assets, liabilities, financial position and profit or loss of the Company and the undertakings included in the consolidation taken as a whole; and
– the management report, which is incorporated into the Directors’ report, includes a fair review of the development and performance of the business and the position of the Company and the undertakings included in the consolidation taken as a whole, together with a description of the principal risks and uncertainties that they face.
By order of the Board.
Dorothy Thompson Tony Quinlan Chief Executive Finance Director
18 February 2013 18 February 2013
59Drax Group plcAnnual report and
accounts 2012
Mar
ketp
lace
, per
form
ance
and
ris
kC
orpo
rate
and
soc
ial r
espo
nsib
ility
Fina
ncia
lsG
over
nanc
eO
verv
iew
Audit Committee report
Membership and process Throughout 2012, the Audit Committee (the “Committee”) consisted of David Lindsell (as Chairman), Tim Barker (Senior Independent Director), Tim Cobbold and Tony Thorne all of whom are independent non-executive directors.
The Board is satisfied that the membership of the Committee meets the requirement for recent and relevant financial experience. The Company Secretary acts as Secretary to the Committee.
The Committee met on four occasions in 2012 and the members’ attendance record is set out on page 53. The Chairman of the Committee reports the Committee’s deliberations to the following Board meeting and the minutes of each meeting of the Committee are circulated to all members of the Board.
Role The Committee assists the Board to fulfil its oversight responsibilities. Its primary functions are to:
– monitor the integrity of the financial statements and other information provided to shareholders;
– review significant financial reporting issues and judgements contained in the financial statements;
– review the systems of internal control and risk management;
– maintain an appropriate relationship with the Group’s external auditor and review the effectiveness and objectivity of the external audit process; and
– monitor and review the effectiveness of the internal audit function (which is provided by Grant Thornton UK LLP), review the internal audit plan, all internal audit reports and review and monitor management’s responses to the findings and recommendations of the internal audit function.
The terms of reference for the Committee are reviewed annually by the Committee and then by the Board. The terms of reference are available on the Group’s website at www.draxgroup.plc.uk.
The Chairman of the Board, the Chief Executive, the Finance Director, the Group Financial Controller and the internal and external auditor are normally invited by the Chairman of the Committee to attend meetings of the Committee. In undertaking its duties, the Committee has access to the services of the Finance Director and the Company Secretary and their resources, as well as access to external professional advice.
During the year, the Committee undertook its duties in accordance with an agreed annual work plan of which the main features were:
– at meetings in February and July 2012, the Committee reviewed the Group’s Preliminary results announcement and Annual report and accounts, and the Half year results announcement and Half year report respectively. On each occasion, the Committee received reports from management and the external auditor on the application of accounting policies on significant estimates and judgements made in preparing the financial statements, and on the methods used to account for any significant or unusual transactions. The summary of the key accounting judgements, estimates and assumptions and our principal accounting policies, all of which have been considered by the Committee, are set out in Note 3 to the accounts. In respect of all such matters, the external auditor concurred with the judgements made by management and the Committee was satisfied that the accounting policies were applied appropriately and the estimates and judgements made were appropriate. In addition, the Committee also satisfied itself of the independence and objectivity of the external auditor on the basis set out below under the Independence of the external audit section of the report;
– at each meeting the Committee received reports from the internal audit function on the progress of their programme for the year, reviewed new internal audit reports and monitored progress with the implementation of internal control recommendations. The Committee continues to focus on specifically identified strategic risk areas, as well as ensuring
“During 2012, the Committee continued to focus on specifically identified strategic risk areas, whilst ensuring the provision of a core compliance assurance service offers comfort to stakeholders that effective controls are in place.”David LindsellChairman of the Audit Committee
60 Drax Group plcAnnual report and accounts 2012
Audit Committee report
the provision of a core compliance assurance service. No significant weaknesses were identified in any of the internal audit reports although certain improvements in processes and procedures were made as a result of reviews;
– in November 2012, the Committee reviewed the structure and resources of the finance team and treasury function processes and controls;
– the Committee reviews the operation of the Company’s risk management system, encompassing operational as well as financial controls. At meetings in April and November 2012, the Committee reviewed the Company’s risk register and in February and November 2012, it undertook a review of the effectiveness of the system of internal controls. The Committee was satisfied that appropriate frameworks and controls were well embedded into the business and that the system of internal controls was effective;
– in April 2012, the Committee undertook a detailed review of the management letter covering the external auditor’s findings in respect of the prior financial year and also reviewed the performance of the external auditor at the February 2012 meeting;
– during 2012, PricewaterhouseCoopers LLP (“PwC”) conducted a further phase on the review of effectiveness of controls applicable to Drax Power Limited’s commodity trading activities. In November 2012, the results of this further phase were presented to the Committee. The report did not identify any significant weaknesses in the controls in place although certain improvements in processes and procedures are to be implemented as a result of the reviews;
– during the year, the Committee met twice in the absence of management with each of the external and internal auditor. No matters of concern were drawn to the Committee’s attention at any of these meetings. The Committee’s understanding with both the external and internal auditor is that, if they should at any time become aware of any matters occasioning them material concern, they will immediately draw it to the Committee’s attention via the Chairman of the Committee. Nothing was subject to this procedure in the course of the year; and
– the Committee has reviewed the content of the Annual report and accounts and advised the Board that, in its view, taken as a whole, it is fair, balanced and understandable and provides the information necessary for shareholders to assess the Group’s performance, business model and strategy.
Independence of the external audit The Group has an Auditor Independence Policy, in accordance with which, the Committee annually reviews the quality and cost effectiveness of the external audit and the independence and objectivity of the external auditor. The Auditor Independence Policy can be found on the Company’s website at www.draxgroup.plc.uk
The provisions of the Policy include: – seeking confirmation that the auditor is, in its professional judgement, independent of the Group and obtaining from it an
account of all relationships which may affect the firm’s independence and the objectivity of the audit partner and staff;
– a policy governing the engagement of the auditor to conduct non-audit work under which:
– the auditor may not be engaged to provide certain categories of work, including those where they may be required to audit their own work or make management decisions, or where the auditor would act in an advocacy role for the Group;
– there is a clear process of approval for engaging the auditor to conduct other categories of non-audit work, subject to financial limits;
– all engagements of the auditor to conduct non-audit work are reported to the next meeting of the Committee;
– the balance between the fees paid to the external auditor for audit and non-audit work is monitored by the Committee; and
– a policy on the employment by the Group of former employees of the external auditor, the essence of which is to require a period of two years to elapse between the cessation of an individual’s association with the auditor and appointment to any financial reporting oversight role within the Group.
The Committee receives reports from the external auditor on its own processes and procedures to ensure its independence and objectivity and to ensure compliance with the relevant standards.
Details of the amounts paid to the external auditor during the year for audit and other services are set out in Note 5 to the consolidated financial statements on page 97. The external auditor is required to rotate the audit partner responsible for the Group audit every five years and the current audit partner, Carl Hughes, has been in place for four years.
No contractual obligations exist that restrict the Group’s choice of external auditor.
61Drax Group plcAnnual report and
accounts 2012
Mar
ketp
lace
, per
form
ance
and
ris
kC
orpo
rate
and
soc
ial r
espo
nsib
ility
Fina
ncia
lsG
over
nanc
eO
verv
iewInternal audit
Grant Thornton UK LLP undertakes the Group’s internal audit function. The Committee periodically reviews whether the internal audit function is likely to be more effective or efficient if provided internally. In view of the nature and scope of the Group’s business and its management structure, the Committee considers that it continues to be more effective and efficient for core internal audit functions to be undertaken by an external service provider, augmented as appropriate by additional reviews that require specialist expertise.
The Committee receives reports at each meeting regarding the internal audit programme and reviews undertaken. Recommendations are made to management for process improvements as appropriate. Topics dealt with by internal audit reports reviewed by the Committee during 2012 included: Group payroll and PAYE; Drax Power Limited key financial controls on revenue and financial reporting and on treasury and expenditure; VAT and international trade; ROC accreditation; fuel – covering coal and biomass procurement and logistics; IT key controls and strategy; Know Your Customer and Bribery Act Compliance; Haven Power Limited key financial controls and physical security.
External auditor Deloitte LLP was appointed auditor of the Group in 2005 and has been reappointed at each subsequent Annual General Meeting. It previously acted as auditor to the Drax group of companies prior to the listing of the Company in December 2005. Any decision to open the external audit to tender is taken on the recommendation of the Audit Committee based on the results of the performance review described below.
Having reviewed its performance during the year and satisfied itself of its continuing independence and objectivity within the context of applicable regulatory requirements and professional standards, the Committee has invited the Board to recommend the reappointment of Deloitte LLP as auditor at the forthcoming AGM and a resolution to that effect appears in the notice of the AGM.
The Chairman of the Committee, independent of management, maintains regular and direct contact with both the internal and external auditor.
This report was reviewed and approved by the Board on 18 February 2013.
David Lindsell Chairman of the Audit Committee
62 Drax Group plcAnnual report and accounts 2012
Nominations Committee report
Throughout 2012, the Nominations Committee (the “Committee”) consisted of Charles Berry (as Chairman), Tim Barker (Senior Independent Director), Tim Cobbold, David Lindsell and Tony Thorne all of whom are independent non-executive directors. The Company Secretary acts as Secretary to the Committee.
The principal duties of the Committee are to keep under review the structure, size and composition of the Board (including the skills, knowledge and experience required by it), to consider succession planning for the directors and other senior managers, to identify and nominate candidates to fill vacancies among the directors and to review the time required from non-executive directors.
The terms of reference for the Committee are reviewed annually by the Committee and then by the Board. They are available on the Group’s website at www.draxgroup.plc.uk.
The Committee met on three occasions in 2012, and the members’ attendance record is set out on page 53.
The Chairman of the Committee reports on the Committee’s proceedings to the following Board meeting and, subject to redaction in the event that they include personal information, the minutes of each meeting of the Committee are circulated to all members of the Board.
During 2012, the Company enhanced its succession planning and career development processes. The Committee considered the revised processes and reviewed the succession plan in relation to senior management roles. The succession plan was considered to be appropriate taking into account the size and management structure of the Group.
During the course of the year, the Committee also reviewed the composition of the Board and concluded that it was an appropriate time to appoint an additional non-executive director.
The Committee engaged The Zygos Partnership to conduct a search and selection process. (The Zygos Partnership has no other connection with the Company other than in relation to previous engagements on search and selection assignments). The Committee was presented with a list of candidates from which a short list was identified. Following consideration and interviews with a number of excellent candidates, the Committee recommended to the Board that Melanie Gee be appointed as a non-executive director. Her appointment became effective on 1 January 2013 and she will retire and offer herself for election by shareholders at the AGM to be held on 24 April 2013. Melanie’s biography appears on page 48.
It is the Board’s policy to ensure that the proportion of women on the Board is one of the considerations for Board and senior management appointments. That policy is implemented as part of the recruitment and selection process. Further details of gender diversity in the Group are included in the Corporate and social responsibility section of the Annual report and accounts.
The Company’s Articles provide that directors retire by rotation. However, the UK Corporate Governance Code provides that all directors should be subject to annual re-election. The Company adopted the provisions of the UK Corporate Governance Code on the annual re-election of all directors at the beginning of 2011.
At the conclusion of the AGM on 24 April 2013, Tim Barker is to retire as a director of the Company and from the committees on which he serves.
Charles BerryChairman of the Nominations Committee
“ The Committee keeps under review the structure, size and composition of the Board and also the succession planning for executive directors and other senior managers.”
63Drax Group plcAnnual report and
accounts 2012
Mar
ketp
lace
, per
form
ance
and
ris
kC
orpo
rate
and
soc
ial r
espo
nsib
ility
Fina
ncia
lsG
over
nanc
eO
verv
iewThe Committee initiated the review of the effectiveness of the Board, its committees and individual directors and the outcome
is reported in the Corporate governance report on page 51.
The Board met on 12 February 2013, following the completion of the Board evaluation process, and determined that all of the directors who are the subject of annual re-election will retire at the forthcoming AGM and, being eligible, offer themselves for re-election. The evaluation of the Board described on page 51 concluded that the directors offering themselves for re-election continue to demonstrate commitment to their particular role and perform effectively.
At that meeting, the Board also reviewed the membership of the various Board committees and appointed David Lindsell as Senior Independent Director and Tony Thorne as Chairman of the Remuneration Committee, each to replace Tim Barker upon his retirement.
The executive directors’ service contracts and non-executive directors’ letters of appointment are available for inspection by prior arrangement during normal business hours at the Company’s registered office. They will also be available for inspection at the venue, prior to the AGM, details of which are contained in the Notice of Meeting.
This report was reviewed and approved by the Board on 18 February 2013.
Charles Berry Chairman of the Nominations Committee
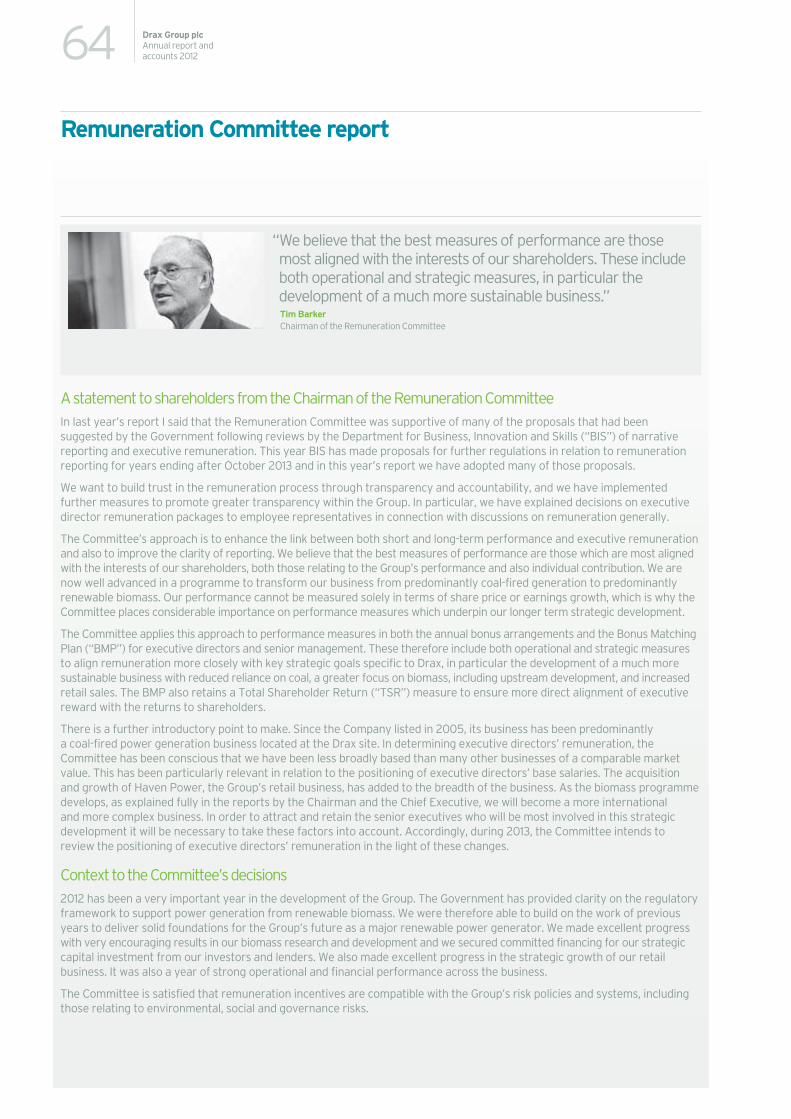
64 Drax Group plcAnnual report and accounts 2012
Remuneration Committee report
A statement to shareholders from the Chairman of the Remuneration Committee In last year’s report I said that the Remuneration Committee was supportive of many of the proposals that had been suggested by the Government following reviews by the Department for Business, Innovation and Skills (“BIS”) of narrative reporting and executive remuneration. This year BIS has made proposals for further regulations in relation to remuneration reporting for years ending after October 2013 and in this year’s report we have adopted many of those proposals.
We want to build trust in the remuneration process through transparency and accountability, and we have implemented further measures to promote greater transparency within the Group. In particular, we have explained decisions on executive director remuneration packages to employee representatives in connection with discussions on remuneration generally.
The Committee’s approach is to enhance the link between both short and long-term performance and executive remuneration and also to improve the clarity of reporting. We believe that the best measures of performance are those which are most aligned with the interests of our shareholders, both those relating to the Group’s performance and also individual contribution. We are now well advanced in a programme to transform our business from predominantly coal-fired generation to predominantly renewable biomass. Our performance cannot be measured solely in terms of share price or earnings growth, which is why the Committee places considerable importance on performance measures which underpin our longer term strategic development.
The Committee applies this approach to performance measures in both the annual bonus arrangements and the Bonus Matching Plan (“BMP”) for executive directors and senior management. These therefore include both operational and strategic measures to align remuneration more closely with key strategic goals specific to Drax, in particular the development of a much more sustainable business with reduced reliance on coal, a greater focus on biomass, including upstream development, and increased retail sales. The BMP also retains a Total Shareholder Return (“TSR”) measure to ensure more direct alignment of executive reward with the returns to shareholders.
There is a further introductory point to make. Since the Company listed in 2005, its business has been predominantly a coal-fired power generation business located at the Drax site. In determining executive directors’ remuneration, the Committee has been conscious that we have been less broadly based than many other businesses of a comparable market value. This has been particularly relevant in relation to the positioning of executive directors’ base salaries. The acquisition and growth of Haven Power, the Group’s retail business, has added to the breadth of the business. As the biomass programme develops, as explained fully in the reports by the Chairman and the Chief Executive, we will become a more international and more complex business. In order to attract and retain the senior executives who will be most involved in this strategic development it will be necessary to take these factors into account. Accordingly, during 2013, the Committee intends to review the positioning of executive directors’ remuneration in the light of these changes.
Context to the Committee’s decisions 2012 has been a very important year in the development of the Group. The Government has provided clarity on the regulatory framework to support power generation from renewable biomass. We were therefore able to build on the work of previous years to deliver solid foundations for the Group’s future as a major renewable power generator. We made excellent progress with very encouraging results in our biomass research and development and we secured committed financing for our strategic capital investment from our investors and lenders. We also made excellent progress in the strategic growth of our retail business. It was also a year of strong operational and financial performance across the business.
The Committee is satisfied that remuneration incentives are compatible with the Group’s risk policies and systems, including those relating to environmental, social and governance risks.
“We believe that the best measures of performance are those most aligned with the interests of our shareholders. These include both operational and strategic measures, in particular the development of a much more sustainable business.”
Chairman of the Remuneration CommitteeTim Barker
65Drax Group plcAnnual report and
accounts 2012
Mar
ketp
lace
, per
form
ance
and
ris
kC
orpo
rate
and
soc
ial r
espo
nsib
ility
Fina
ncia
lsG
over
nanc
eO
verv
iewKey Committee decisions in the year
Each year the Committee agrees an annual work schedule. The regular scheduled matters considered by the Committee in 2012 were:
– review of the performance of the Group by reference to the 2011 Balanced Corporate Scorecard (“Scorecard”), including the application of the discretionary factor;
– agree the measures and weightings of the 2012 Scorecard;
– 2011 annual bonus awards to executive directors and senior managers by reference to the Scorecard and individual performance against personal objectives;
– agreeing personal objectives for executive directors and senior managers for 2012;
– review of base salary and overall remuneration packages for executive directors and senior managers;
– review of the Chairman’s remuneration;
– granting of awards under executive and all employee share plans;
– consideration of vesting of awards under executive share plans;
– the 2011 Remuneration Report; and
– review of advisers and the fees paid to them.
At various stages throughout the year the Committee considered the consultation on executive remuneration by BIS, and has actively participated in the consultation. The Committee considered the Group’s own remuneration policy and practices in that context. It concluded that the structure and level of executive remuneration in the Group continued to be appropriate. As noted in the introduction to this report, the Committee intends to review the positioning of executive directors’ remuneration in the light of the development of the Group’s biomass transformation. The Committee has sought to develop its reporting in line with developing best practice.
The Committee also considered the provision of pension benefits in the Group as a whole. It agreed that additional steps should be taken to make employees aware of the likely level of retirement benefits and encourage additional contributions. This may require additional contributions by the Group dependent upon the terms applicable to the relevant schemes.
Policy report Introduction This report covers the reporting period from 1 January 2012 to 31 December 2012 and provides details of the remuneration policy for the Group. This report has been prepared by the Remuneration Committee based on the regulations proposed by BIS. The regulations will apply to all UK companies listed on a major stock exchange with financial years ending on or after October 2013.
Remuneration policy During the year, the Committee reviewed its terms of reference to ensure that they remain sufficiently flexible and appropriate to meet the different requirements necessary to attract, reward and retain senior managers in all Group companies.
The objectives of the remuneration policy are:
– to enable the Group to recruit, retain and motivate the people needed to achieve its business objectives;
– to strengthen teamwork by enabling all employees to share in the success of the business;
– to ensure alignment of executive and shareholder interests; and
– to develop an approach which emphasises total reward.
66 Drax Group plcAnnual report and accounts 2012
Remuneration Committee report
The core principles of the remuneration policy are to:
– pay market rates of total remuneration;
– adopt different pay and benefit structures for different operating entities in the Group as appropriate for each entity’s markets, workforce and location;
– ensure that there is an appropriate link between performance and reward;
– award annual bonuses which are linked to the delivery of the annual Business Plan targets including the achievement of strategic objectives and personal performance; and
– ensure that long-term incentives are linked to TSR and to the delivery of Business Plan targets including the achievement of strategic objectives.
The role of the Committee The principles set out above are put into effect through the Committee’s principal duties, which are to:
– determine and recommend for approval by the Board the framework or broad policy for the remuneration of the Company’s Chairman, Chief Executive and other executive directors and the senior managers;
– approve the design of, and determine targets for, any performance related pay schemes operated by the Group in respect of executive directors and senior managers and approve the total annual payments made under such schemes;
– review the design of all share incentive plans for approval by the Board and shareholders. For any such plans, determine each year whether awards will be made, and if so, the overall amount of such awards, the individual awards to executive directors and senior managers and the performance targets to be used;
– determine the pension arrangements for executive directors and senior managers;
– ensure that contractual terms on termination of the employment of any executive directors or senior manager, and any payments made, are fair to the individual, and the Group, that failure is not rewarded and that the duty to mitigate loss is fully recognised;
– within the terms of the agreed policy determine the individual total remuneration packages of the executive directors and senior managers including bonuses, incentive payments and share options or other share awards;
– review and note annually the remuneration trends across the Group; and
– oversee any major changes in employee benefits structures throughout the Group.
Throughout 2012, the Remuneration Committee comprised Tim Barker, Senior Independent Director and Chairman of the Committee, Charles Berry, Chairman of the Company, Tim Cobbold, David Lindsell and Tony Thorne, all of whom are independent non-executive directors. The Company Secretary acted as Secretary to the Committee.
The Chief Executive is invited to attend meetings of the Committee except when her own remuneration is being discussed.
The Committee met on three occasions during the year and its members’ attendance record is set out on page 53.
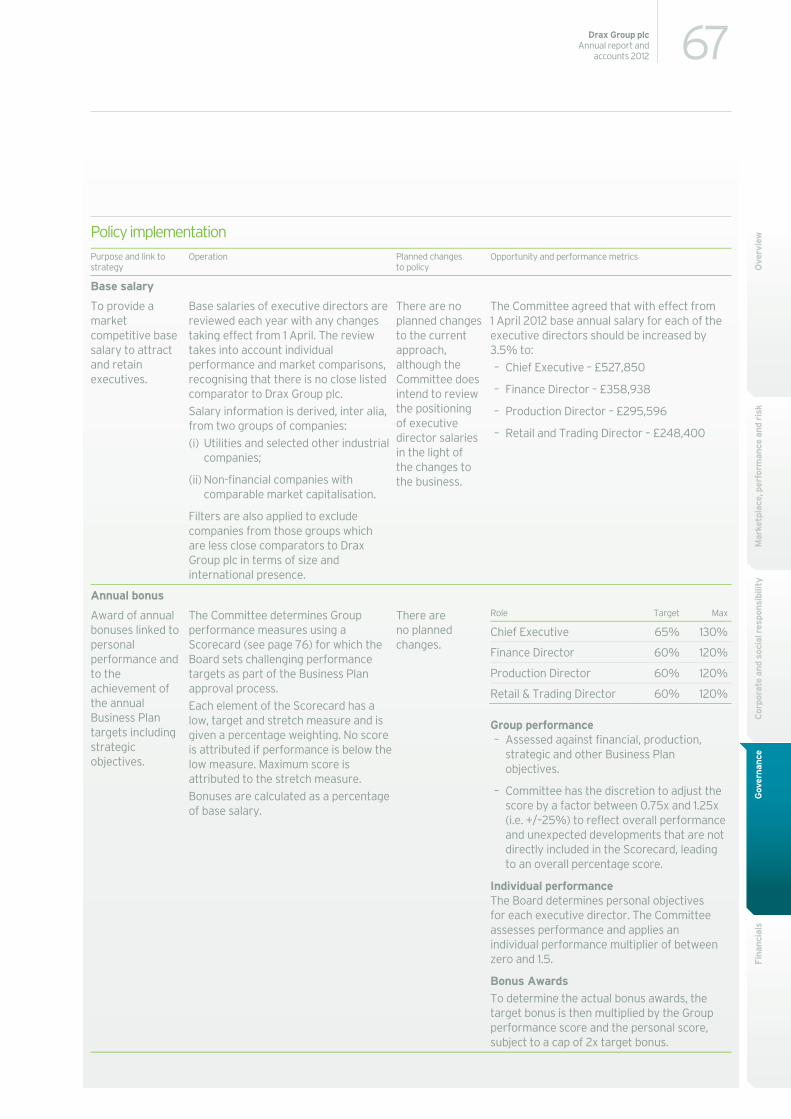
67Drax Group plcAnnual report and
accounts 2012
Mar
ketp
lace
, per
form
ance
and
ris
kC
orpo
rate
and
soc
ial r
espo
nsib
ility
Fina
ncia
lsG
over
nanc
eO
verv
iewPolicy implementation
Purpose and link to strategy
Operation Planned changes to policy
Opportunity and performance metrics
Base salary
To provide a market competitive base salary to attract and retain executives.
Base salaries of executive directors are reviewed each year with any changes taking effect from 1 April. The review takes into account individual performance and market comparisons, recognising that there is no close listed comparator to Drax Group plc. Salary information is derived, inter alia, from two groups of companies: (i) Utilities and selected other industrial
companies;
(ii) Non-financial companies with comparable market capitalisation.
Filters are also applied to exclude companies from those groups which are less close comparators to Drax Group plc in terms of size and international presence.
There are no planned changes to the current approach, although the Committee does intend to review the positioning of executive director salaries in the light of the changes to the business.
The Committee agreed that with effect from 1 April 2012 base annual salary for each of the executive directors should be increased by 3.5% to: – Chief Executive – £527,850
– Finance Director – £358,938
– Production Director – £295,596
– Retail and Trading Director – £248,400
Annual bonus
Award of annual bonuses linked to personal performance and to the achievement of the annual Business Plan targets including strategic objectives.
The Committee determines Group performance measures using a Scorecard (see page 76) for which the Board sets challenging performance targets as part of the Business Plan approval process. Each element of the Scorecard has a low, target and stretch measure and is given a percentage weighting. No score is attributed if performance is below the low measure. Maximum score is attributed to the stretch measure. Bonuses are calculated as a percentage of base salary.
There are no planned changes.
Role Target Max
Chief Executive 65% 130%
Finance Director 60% 120%
Production Director 60% 120%
Retail & Trading Director 60% 120% Group performance – Assessed against financial, production,
strategic and other Business Plan objectives.
– Committee has the discretion to adjust the score by a factor between 0.75x and 1.25x (i.e. +/–25%) to reflect overall performance and unexpected developments that are not directly included in the Scorecard, leading to an overall percentage score.
Individual performance The Board determines personal objectives for each executive director. The Committee assesses performance and applies an individual performance multiplier of between zero and 1.5.
Bonus Awards To determine the actual bonus awards, the target bonus is then multiplied by the Group performance score and the personal score, subject to a cap of 2x target bonus.
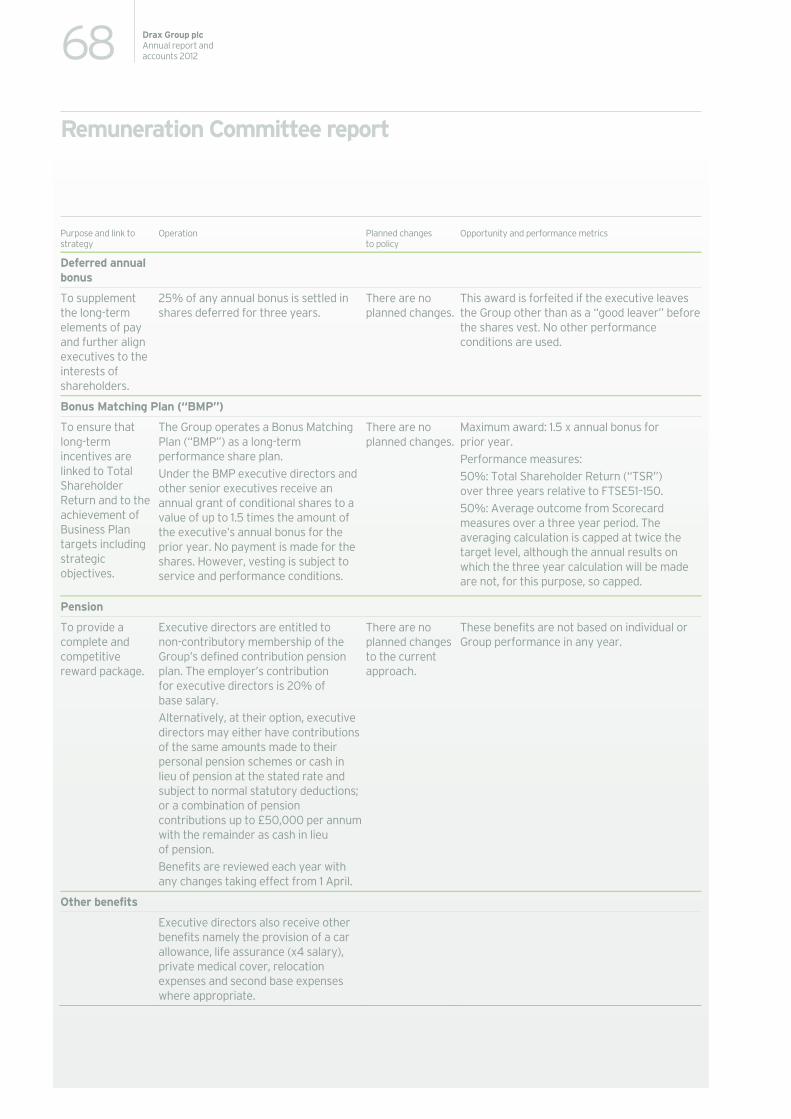
68 Drax Group plcAnnual report and accounts 2012
Remuneration Committee report
Purpose and link to strategy
Operation Planned changes to policy
Opportunity and performance metrics
Deferred annual bonus
To supplement the long-term elements of pay and further align executives to the interests of shareholders.
25% of any annual bonus is settled in shares deferred for three years.
There are no planned changes.
This award is forfeited if the executive leaves the Group other than as a “good leaver” before the shares vest. No other performance conditions are used.
Bonus Matching Plan (“BMP”)
To ensure that long-term incentives are linked to Total Shareholder Return and to the achievement of Business Plan targets including strategic objectives.
The Group operates a Bonus Matching Plan (“BMP”) as a long-term performance share plan. Under the BMP executive directors and other senior executives receive an annual grant of conditional shares to a value of up to 1.5 times the amount of the executive’s annual bonus for the prior year. No payment is made for the shares. However, vesting is subject to service and performance conditions.
There are no planned changes.
Maximum award: 1.5 x annual bonus for prior year. Performance measures: 50%: Total Shareholder Return (“TSR”) over three years relative to FTSE51–150. 50%: Average outcome from Scorecard measures over a three year period. The averaging calculation is capped at twice the target level, although the annual results on which the three year calculation will be made are not, for this purpose, so capped.
Pension
To provide a complete and competitive reward package.
Executive directors are entitled to non-contributory membership of the Group’s defined contribution pension plan. The employer’s contribution for executive directors is 20% of base salary. Alternatively, at their option, executive directors may either have contributions of the same amounts made to their personal pension schemes or cash in lieu of pension at the stated rate and subject to normal statutory deductions; or a combination of pension contributions up to £50,000 per annum with the remainder as cash in lieu of pension. Benefits are reviewed each year with any changes taking effect from 1 April.
There are no planned changes to the current approach.
These benefits are not based on individual or Group performance in any year.
Other benefits
Executive directors also receive other benefits namely the provision of a car allowance, life assurance (x4 salary), private medical cover, relocation expenses and second base expenses where appropriate.
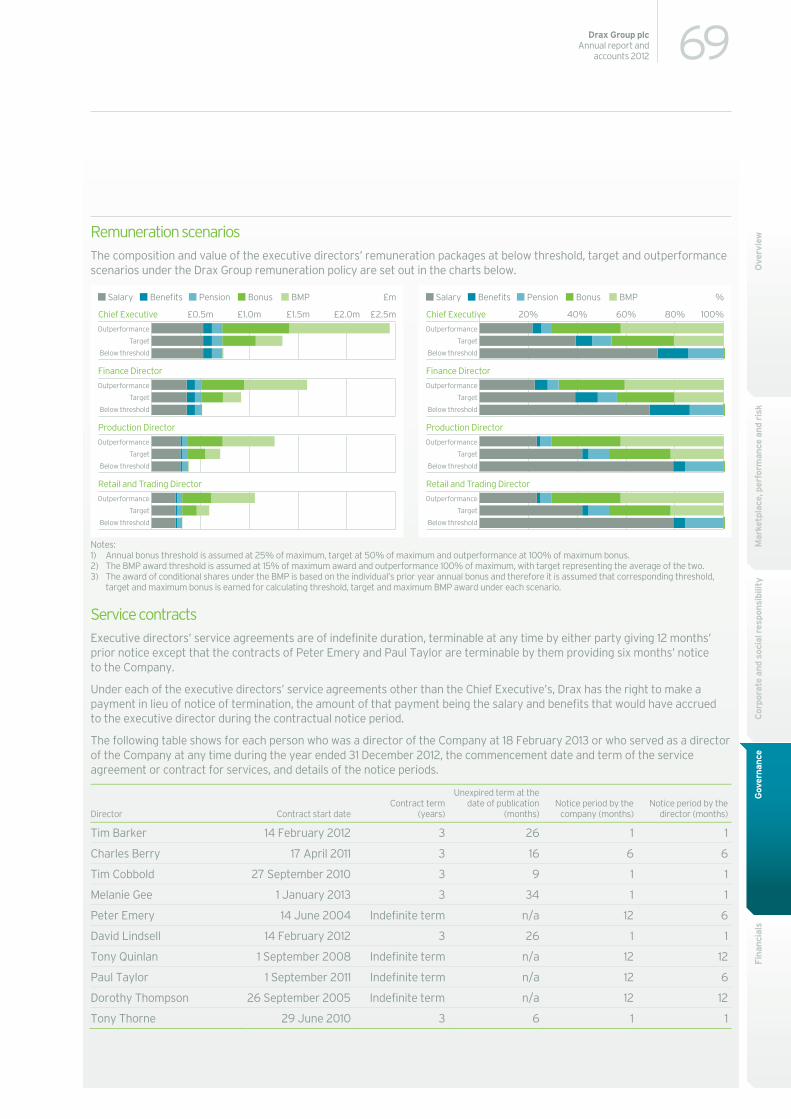
69Drax Group plcAnnual report and
accounts 2012
Mar
ketp
lace
, per
form
ance
and
ris
kC
orpo
rate
and
soc
ial r
espo
nsib
ility
Fina
ncia
lsG
over
nanc
eO
verv
iew
Remuneration scenarios The composition and value of the executive directors’ remuneration packages at below threshold, target and outperformance scenarios under the Drax Group remuneration policy are set out in the charts below.
Notes: 1) Annual bonus threshold is assumed at 25% of maximum, target at 50% of maximum and outperformance at 100% of maximum bonus. 2) The BMP award threshold is assumed at 15% of maximum award and outperformance 100% of maximum, with target representing the average of the two. 3) The award of conditional shares under the BMP is based on the individual’s prior year annual bonus and therefore it is assumed that corresponding threshold,
target and maximum bonus is earned for calculating threshold, target and maximum BMP award under each scenario.
Service contracts Executive directors’ service agreements are of indefinite duration, terminable at any time by either party giving 12 months’ prior notice except that the contracts of Peter Emery and Paul Taylor are terminable by them providing six months’ notice to the Company.
Under each of the executive directors’ service agreements other than the Chief Executive’s, Drax has the right to make a payment in lieu of notice of termination, the amount of that payment being the salary and benefits that would have accrued to the executive director during the contractual notice period.
The following table shows for each person who was a director of the Company at 18 February 2013 or who served as a director of the Company at any time during the year ended 31 December 2012, the commencement date and term of the service agreement or contract for services, and details of the notice periods.
Director Contract start dateContract term
(years)
Unexpired term at the date of publication
(months)Notice period by the
company (months) Notice period by the
director (months)
Tim Barker 14 February 2012 3 26 1 1
Charles Berry 17 April 2011 3 16 6 6
Tim Cobbold 27 September 2010 3 9 1 1
Melanie Gee 1 January 2013 3 34 1 1
Peter Emery 14 June 2004 Indefinite term n/a 12 6
David Lindsell 14 February 2012 3 26 1 1
Tony Quinlan 1 September 2008 Indefinite term n/a 12 12
Paul Taylor 1 September 2011 Indefinite term n/a 12 6
Dorothy Thompson 26 September 2005 Indefinite term n/a 12 12
Tony Thorne 29 June 2010 3 6 1 1
Chief Executive
£m %
Outperformance
Target
Below threshold
£0.5m £1.0m £1.5m £2.0m £2.5m
Salary
Chief Executive
Outperformance
Target
Below threshold
20% 60%40% 80% 100%
Finance Director
Outperformance
Target
Below threshold
Finance Director
Outperformance
Target
Below threshold
Production Director
Outperformance
Target
Below threshold
Production Director
Outperformance
Target
Below threshold
Retail and Trading Director
Outperformance
Target
Below threshold
Retail and Trading Director
Outperformance
Target
Below threshold
Benefits Pension Bonus BMP Salary Benefits Pension Bonus BMP
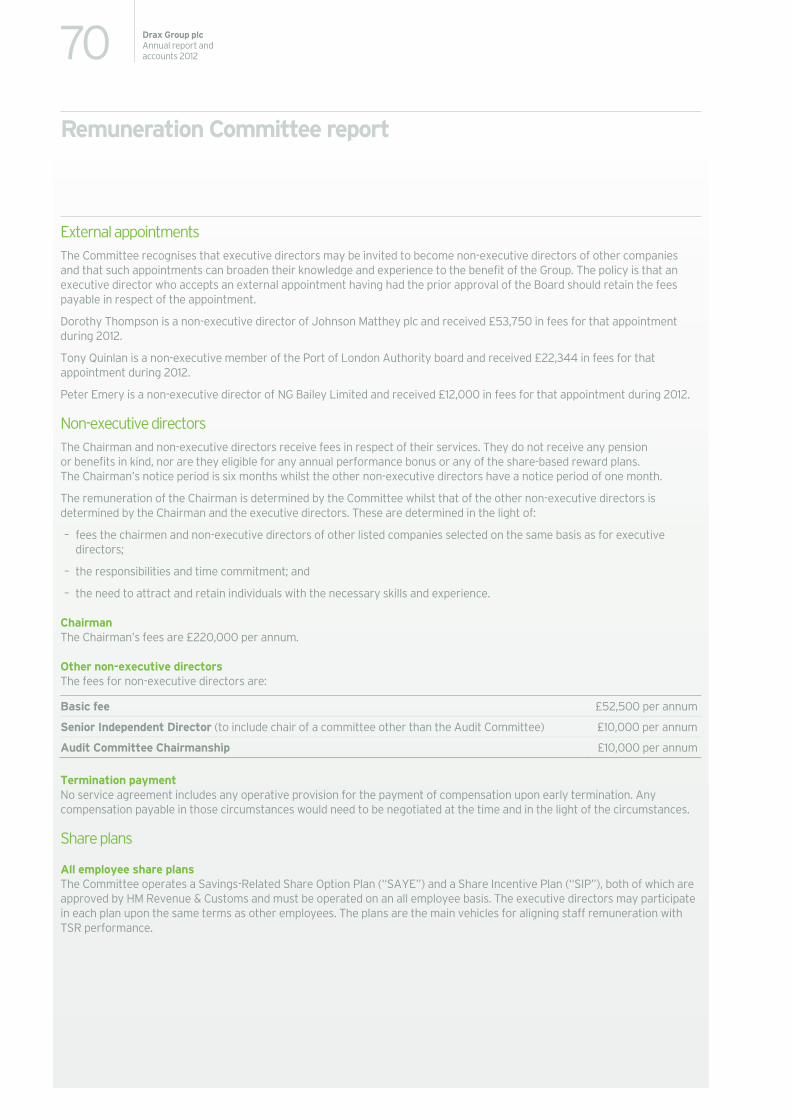
70 Drax Group plcAnnual report and accounts 2012
Remuneration Committee report
External appointments The Committee recognises that executive directors may be invited to become non-executive directors of other companies and that such appointments can broaden their knowledge and experience to the benefit of the Group. The policy is that an executive director who accepts an external appointment having had the prior approval of the Board should retain the fees payable in respect of the appointment.
Dorothy Thompson is a non-executive director of Johnson Matthey plc and received £53,750 in fees for that appointment during 2012.
Tony Quinlan is a non-executive member of the Port of London Authority board and received £22,344 in fees for that appointment during 2012.
Peter Emery is a non-executive director of NG Bailey Limited and received £12,000 in fees for that appointment during 2012.
Non-executive directors The Chairman and non-executive directors receive fees in respect of their services. They do not receive any pension or benefits in kind, nor are they eligible for any annual performance bonus or any of the share-based reward plans. The Chairman’s notice period is six months whilst the other non-executive directors have a notice period of one month.
The remuneration of the Chairman is determined by the Committee whilst that of the other non-executive directors is determined by the Chairman and the executive directors. These are determined in the light of:
– fees the chairmen and non-executive directors of other listed companies selected on the same basis as for executive directors;
– the responsibilities and time commitment; and
– the need to attract and retain individuals with the necessary skills and experience.
Chairman The Chairman’s fees are £220,000 per annum.
Other non-executive directors The fees for non-executive directors are:
Basic fee £52,500 per annum
Senior Independent Director (to include chair of a committee other than the Audit Committee) £10,000 per annum
Audit Committee Chairmanship £10,000 per annum
Termination payment No service agreement includes any operative provision for the payment of compensation upon early termination. Any compensation payable in those circumstances would need to be negotiated at the time and in the light of the circumstances.
Share plans
All employee share plans The Committee operates a Savings-Related Share Option Plan (“SAYE”) and a Share Incentive Plan (“SIP”), both of which are approved by HM Revenue & Customs and must be operated on an all employee basis. The executive directors may participate in each plan upon the same terms as other employees. The plans are the main vehicles for aligning staff remuneration with TSR performance.
71Drax Group plcAnnual report and
accounts 2012
Mar
ketp
lace
, per
form
ance
and
ris
kC
orpo
rate
and
soc
ial r
espo
nsib
ility
Fina
ncia
lsG
over
nanc
eO
verv
iewSAYE
The SAYE plan provides for the grant of options (which, at the Committee’s discretion, may be offered at a discount of up to 20% to the market price of a share determined in accordance with the rules of the plan) linked to a savings contract which pays interest at a statutory rate. The plan was operated in 2006 and again in 2010, 2011 and 2012, so that (subject to the statutory upper aggregate limit of £250 per month on an individual’s savings under all SAYE plans) a participating employee could choose to save for either or both periods of three or five years.
In each year of operation, options have been granted at the permitted discount of 20% to the prevailing share price (determined in accordance with the plan rules) resulting in option prices of:
2006 – 636.00 pence per share
2010 – 310.50 pence per share
2011 – 321.00 pence per share
2012 – 410.00 pence per share
Options may be exercised upon successful completion of the three or five year savings contract to which they are linked.
Details of the SAYE options held by the executive directors are shown in the table in the Audited Information section of this report.
On 12 February 2013, the Committee agreed that invitations to the SAYE be made again in 2013, following the preliminary results announcement. The 20% discount to the market price is applied and participants will be able to take out SAYE contracts over three and five years and contribute in total no more than £250 per month.
SIP In any one tax year, the Committee may operate the SIP for the benefit of participants using any combination of the following elements:
– award Free Shares (up to £3,000 in value);
– allow the purchase of Partnership Shares (up to £1,500 in value subject to an overriding maximum of 10% of salary);
– allocate free Matching Shares (in a maximum ratio of two Matching Shares for each Partnership Share); and
– allow the investment in shares of dividends received in respect of SIP shares.
The table below details how the SIP has been operated between 2006 and 2009:
2006 2007 2008 2009
SIP Free Share Award(1) Participants received £2,000 worth of shares
Participants received £2,500 worth of shares in each year.
Participants received £1,000 worth of shares.
Partnership Share Award Participants were allowed to invest up to the maximum permitted of £1,500 (subject to an overriding maximum of 10% of salary) in each year.
Matching Share Award(1) Partnership Shares matched on a one-for-one basis in each year. Note: (1) The SIP Trustee was funded by the Group to purchase the required Free and Matching Shares.
In accordance with the plan rules, shares taken up by an employee are allocated to a trustee which holds them on behalf of the employee. Under normal circumstances, the employee will receive the shares from the trustee without incurring a tax liability once the shares have been held in trust for five years. The employee is entitled to receive dividends paid in respect of the shares held in trust.
Details of the shares allocated to executive directors under the SIP are shown in the table in the Audited Information section of this report.
The SIP has not operated since 2009.
72 Drax Group plcAnnual report and accounts 2012
Remuneration Committee report
Provision of shares for share plans – dilution All equity-based plans are funded through the issuance of shares, or through the purchase of shares in the marketplace through a trust, subject to an overall dilution limit for all employee share plans of no more than 10% of share capital in any ten year period and a limit of 5% of share capital in any ten year period for the Group’s discretionary share plans (e.g. Bonus Matching Plan).
The current estimated dilution from subsisting awards, including executive and all employee share awards, is less than 0.5% of the shares in issue at the date of this report.
Share ownership guidelines The Group has share ownership guidelines for senior executives participating in its performance share plans. They are 100% and 50% of base salary for executive directors and other senior management BMP participants, respectively.
Those who receive shares by virtue of share plan awards or who receive deferred bonus shares must retain 50% of the net (that is, after income tax and national insurance contributions) shares received until the applicable guideline is reached.
Other matters
Wider employee population In determining executive remuneration, the Committee also takes into account the level of general pay increases within the Group. The pay increase in 2012 for staff covered by collective bargaining arrangements was determined by a 33 months agreement with increases on 1 January 2011 and 2012 at RPI plus 0.3%. The increase was subject to a cap of 4.9%, which was therefore the level of the general pay increase on 1 January 2012. The agreement continued until 31 December 2012. Following joint negotiations, a two-year pay offer has been made to all employees within the collective bargaining unit. The pay offer, which covers the period from 1 January 2013 to 31 December 2014, is based on another “RPI plus” formula. The average pensionable pay of an executive director is eight and a half times the average of pensionable pay for employees within the collective bargaining unit.
Views taken from the employee population In the course of discussions on pay with employee representatives, the Group discussed executive remuneration policy and provided details of the process by which the Committee established executive remuneration packages. The information provided included details of the benchmarking of executive director remuneration as well as information benchmarking the packages of employees in the collective bargaining unit with those elsewhere in the industry.
Shareholder engagement The Company holds regular meetings with its largest shareholders, and the Committee takes into account any views or representations of shareholders relating to executive remuneration. During 2012 shareholders did not raise any matters of concern with the Company with regard to executive remuneration.
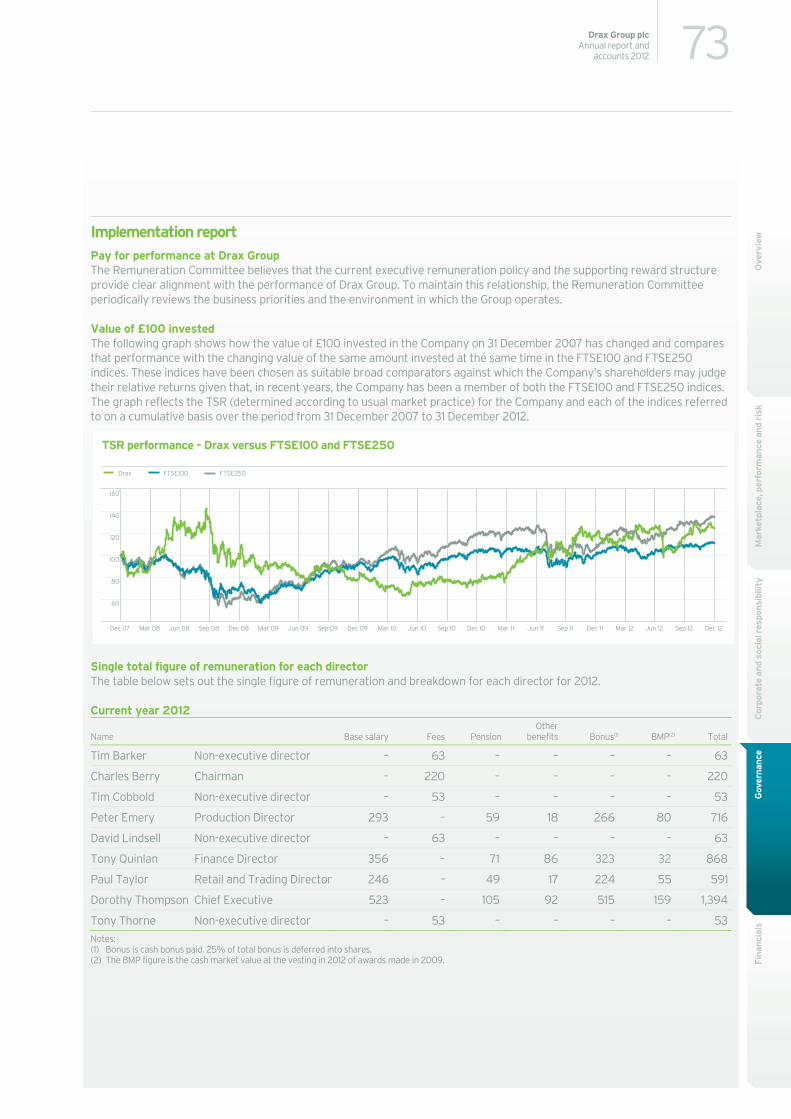
73Drax Group plcAnnual report and
accounts 2012
Mar
ketp
lace
, per
form
ance
and
ris
kC
orpo
rate
and
soc
ial r
espo
nsib
ility
Fina
ncia
lsG
over
nanc
eO
verv
iewImplementation report
Pay for performance at Drax Group The Remuneration Committee believes that the current executive remuneration policy and the supporting reward structure provide clear alignment with the performance of Drax Group. To maintain this relationship, the Remuneration Committee periodically reviews the business priorities and the environment in which the Group operates.
Value of £100 invested The following graph shows how the value of £100 invested in the Company on 31 December 2007 has changed and compares that performance with the changing value of the same amount invested at the same time in the FTSE100 and FTSE250 indices. These indices have been chosen as suitable broad comparators against which the Company’s shareholders may judge their relative returns given that, in recent years, the Company has been a member of both the FTSE100 and FTSE250 indices. The graph reflects the TSR (determined according to usual market practice) for the Company and each of the indices referred to on a cumulative basis over the period from 31 December 2007 to 31 December 2012.
Single total figure of remuneration for each director The table below sets out the single figure of remuneration and breakdown for each director for 2012.
Current year 2012
Name Base salary Fees Pension Other
benefits Bonus(1) BMP(2) Total
Tim Barker Non-executive director – 63 – – – – 63
Charles Berry Chairman – 220 – – – – 220
Tim Cobbold Non-executive director – 53 – – – – 53
Peter Emery Production Director 293 – 59 18 266 80 716
David Lindsell Non-executive director – 63 – – – – 63
Tony Quinlan Finance Director 356 – 71 86 323 32 868
Paul Taylor Retail and Trading Director 246 – 49 17 224 55 591
Dorothy Thompson Chief Executive 523 – 105 92 515 159 1,394
Tony Thorne Non-executive director – 53 – – – – 53Notes: (1) Bonus is cash bonus paid. 25% of total bonus is deferred into shares. (2) The BMP figure is the cash market value at the vesting in 2012 of awards made in 2009.
TSR performance – Drax versus FTSE100 and FTSE250
160
140
120
100
80
60
Mar 09Jun 08Mar 08Dec 07 Sep 08 Dec 08 Sep 09Jun 09 Mar 10 Jun 10Dec 09 Sep 10 Dec 10 Mar 12 Jun 12 Sep 12 Dec 12Mar 11 Jun 11 Sep 11 Dec 11
Drax FTSE100 FTSE250
74 Drax Group plcAnnual report and accounts 2012
Remuneration Committee report
Implementation report (continued) Previous year 2011
Name Base salary Fees Pension Other
benefits Bonus(1) ESIP(2) Total
Tim Barker Non-executive director – 63 – – – – 63
Charles Berry Chairman – 215 – – – – 215
Tim Cobbold Non-executive director – 53 – – – – 53
Peter Emery Production Director 284 – 57 18 257 – 616
David Lindsell Non-executive director – 63 – – – – 63
Tony Quinlan Finance Director 345 – 69 85 312 – 811
Paul Taylor Retail and Trading Director 225 – 39 15 216 – 495
Dorothy Thompson Chief Executive 508 – 101 90 497 – 1,196
Tony Thorne Non-executive director – 53 – – – – 53Notes: (1) Bonus is the cash bonus paid 25% of bonus is deferral into shares. (2) The Executive Share Incentive Plan was the predecessor plan to the BMP.
Details of performance against metrics for variable pay awards
Annual bonus plan outcome A summary of the Committee’s assessment in respect of the 2012 Scorecard is set out in the following table:
Strategic Area Elements Target Weighting Actual Weighting
Financial performance Group underlying earnings per share(1) 20% 37.7%
Cash flow(2) and controllable costs 10% 13.6%
Safety, production and retail
Safety and plant operation performance
15% 20.4%
Retail sales volume 5% 7.0%
Strategic and other Business Plan objectives
Regulatory − securing appropriate support and sustainability requirements for biomass combustion
5% 6.3%
Development of biomass conversion 20% 30.0%
Biomass procurement targets 10% 14.0%
Industrial Emissions Directive compliance plan development 5% 5.0%
Other strategic development initiatives 10% 8.8%Notes: (1) Calculated using underlying earnings, being profit attributable to equity shareholders adjusted to exclude the after tax impact of unrealised gains and losses on
derivative contracts, and exceptional items (see note 9 to the consolidated financial statements). (2) Cash flow for the year excluding the impact of short-term investments, prior to payment of equity dividends.
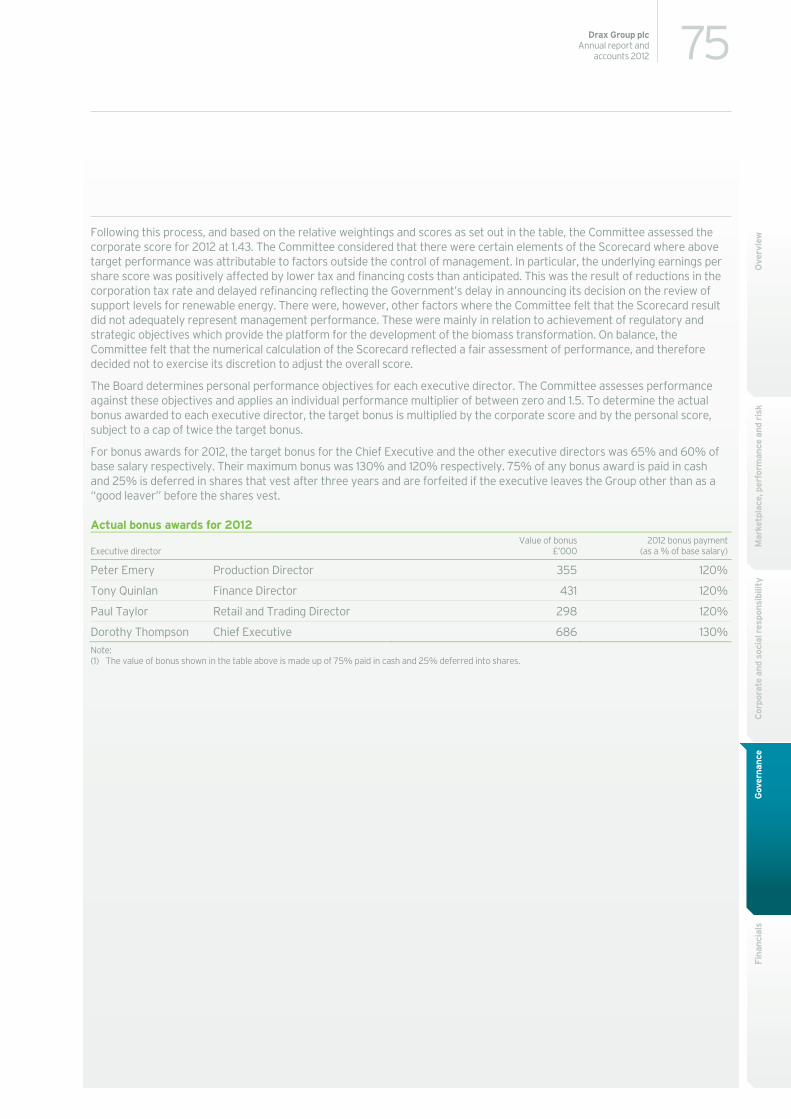
75Drax Group plcAnnual report and
accounts 2012
Mar
ketp
lace
, per
form
ance
and
ris
kC
orpo
rate
and
soc
ial r
espo
nsib
ility
Fina
ncia
lsG
over
nanc
eO
verv
iewFollowing this process, and based on the relative weightings and scores as set out in the table, the Committee assessed the
corporate score for 2012 at 1.43. The Committee considered that there were certain elements of the Scorecard where above target performance was attributable to factors outside the control of management. In particular, the underlying earnings per share score was positively affected by lower tax and financing costs than anticipated. This was the result of reductions in the corporation tax rate and delayed refinancing reflecting the Government’s delay in announcing its decision on the review of support levels for renewable energy. There were, however, other factors where the Committee felt that the Scorecard result did not adequately represent management performance. These were mainly in relation to achievement of regulatory and strategic objectives which provide the platform for the development of the biomass transformation. On balance, the Committee felt that the numerical calculation of the Scorecard reflected a fair assessment of performance, and therefore decided not to exercise its discretion to adjust the overall score.
The Board determines personal performance objectives for each executive director. The Committee assesses performance against these objectives and applies an individual performance multiplier of between zero and 1.5. To determine the actual bonus awarded to each executive director, the target bonus is multiplied by the corporate score and by the personal score, subject to a cap of twice the target bonus.
For bonus awards for 2012, the target bonus for the Chief Executive and the other executive directors was 65% and 60% of base salary respectively. Their maximum bonus was 130% and 120% respectively. 75% of any bonus award is paid in cash and 25% is deferred in shares that vest after three years and are forfeited if the executive leaves the Group other than as a “good leaver” before the shares vest.
Actual bonus awards for 2012
Executive director Value of bonus
£’000 2012 bonus payment
(as a % of base salary)
Peter Emery Production Director 355 120%
Tony Quinlan Finance Director 431 120%
Paul Taylor Retail and Trading Director 298 120%
Dorothy Thompson Chief Executive 686 130%Note: (1) The value of bonus shown in the table above is made up of 75% paid in cash and 25% deferred into shares.
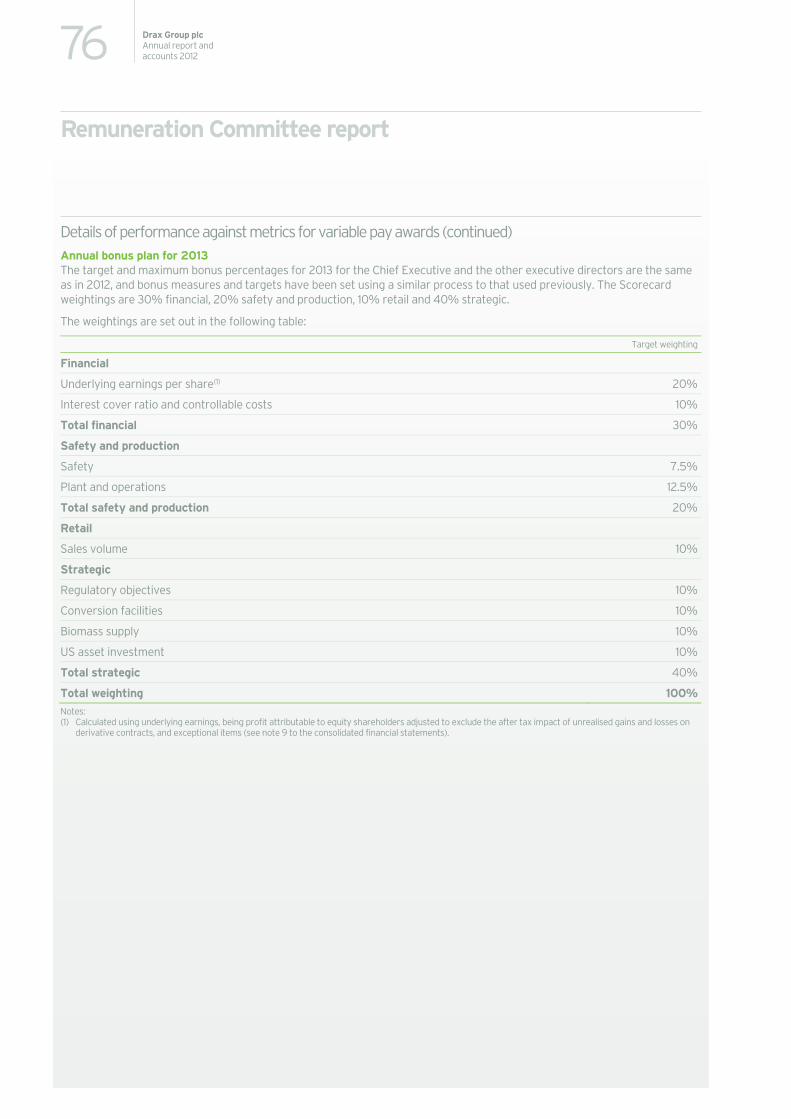
76 Drax Group plcAnnual report and accounts 2012
Remuneration Committee report
Details of performance against metrics for variable pay awards (continued) Annual bonus plan for 2013 The target and maximum bonus percentages for 2013 for the Chief Executive and the other executive directors are the same as in 2012, and bonus measures and targets have been set using a similar process to that used previously. The Scorecard weightings are 30% financial, 20% safety and production, 10% retail and 40% strategic.
The weightings are set out in the following table:
Target weighting
Financial
Underlying earnings per share(1) 20%
Interest cover ratio and controllable costs 10%
Total financial 30%
Safety and production
Safety 7.5%
Plant and operations 12.5%
Total safety and production 20%
Retail
Sales volume 10%
Strategic
Regulatory objectives 10%
Conversion facilities 10%
Biomass supply 10%
US asset investment 10%
Total strategic 40%
Total weighting 100%Notes: (1) Calculated using underlying earnings, being profit attributable to equity shareholders adjusted to exclude the after tax impact of unrealised gains and losses on
derivative contracts, and exceptional items (see note 9 to the consolidated financial statements).
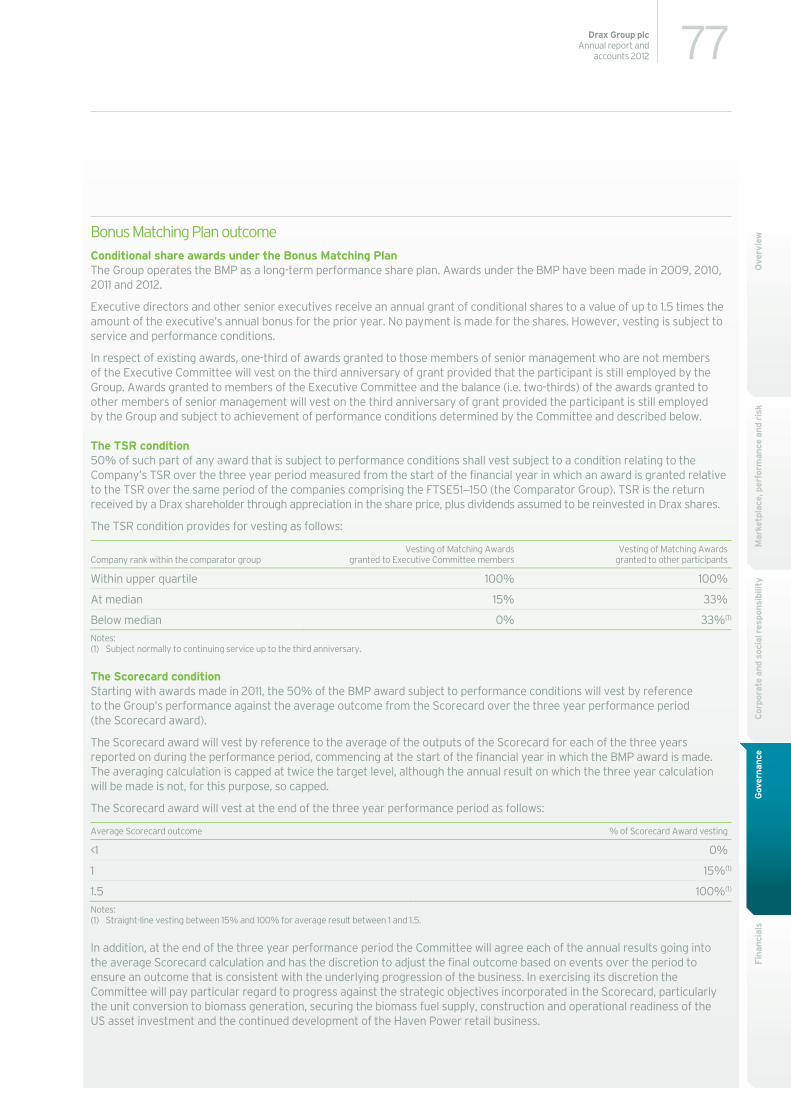
77Drax Group plcAnnual report and
accounts 2012
Mar
ketp
lace
, per
form
ance
and
ris
kC
orpo
rate
and
soc
ial r
espo
nsib
ility
Fina
ncia
lsG
over
nanc
eO
verv
iewBonus Matching Plan outcome
Conditional share awards under the Bonus Matching Plan The Group operates the BMP as a long-term performance share plan. Awards under the BMP have been made in 2009, 2010, 2011 and 2012.
Executive directors and other senior executives receive an annual grant of conditional shares to a value of up to 1.5 times the amount of the executive’s annual bonus for the prior year. No payment is made for the shares. However, vesting is subject to service and performance conditions.
In respect of existing awards, one-third of awards granted to those members of senior management who are not members of the Executive Committee will vest on the third anniversary of grant provided that the participant is still employed by the Group. Awards granted to members of the Executive Committee and the balance (i.e. two-thirds) of the awards granted to other members of senior management will vest on the third anniversary of grant provided the participant is still employed by the Group and subject to achievement of performance conditions determined by the Committee and described below.
The TSR condition 50% of such part of any award that is subject to performance conditions shall vest subject to a condition relating to the Company’s TSR over the three year period measured from the start of the financial year in which an award is granted relative to the TSR over the same period of the companies comprising the FTSE51−150 (the Comparator Group). TSR is the return received by a Drax shareholder through appreciation in the share price, plus dividends assumed to be reinvested in Drax shares.
The TSR condition provides for vesting as follows:
Company rank within the comparator group Vesting of Matching Awards
granted to Executive Committee membersVesting of Matching Awards
granted to other participants
Within upper quartile 100% 100%
At median 15% 33%
Below median 0% 33%(1)
Notes: (1) Subject normally to continuing service up to the third anniversary.
The Scorecard condition Starting with awards made in 2011, the 50% of the BMP award subject to performance conditions will vest by reference to the Group’s performance against the average outcome from the Scorecard over the three year performance period (the Scorecard award).
The Scorecard award will vest by reference to the average of the outputs of the Scorecard for each of the three years reported on during the performance period, commencing at the start of the financial year in which the BMP award is made. The averaging calculation is capped at twice the target level, although the annual result on which the three year calculation will be made is not, for this purpose, so capped.
The Scorecard award will vest at the end of the three year performance period as follows:
Average Scorecard outcome % of Scorecard Award vesting
<1 0%
1 15%(1)
1.5 100%(1)
Notes: (1) Straight-line vesting between 15% and 100% for average result between 1 and 1.5.
In addition, at the end of the three year performance period the Committee will agree each of the annual results going into the average Scorecard calculation and has the discretion to adjust the final outcome based on events over the period to ensure an outcome that is consistent with the underlying progression of the business. In exercising its discretion the Committee will pay particular regard to progress against the strategic objectives incorporated in the Scorecard, particularly the unit conversion to biomass generation, securing the biomass fuel supply, construction and operational readiness of the US asset investment and the continued development of the Haven Power retail business.
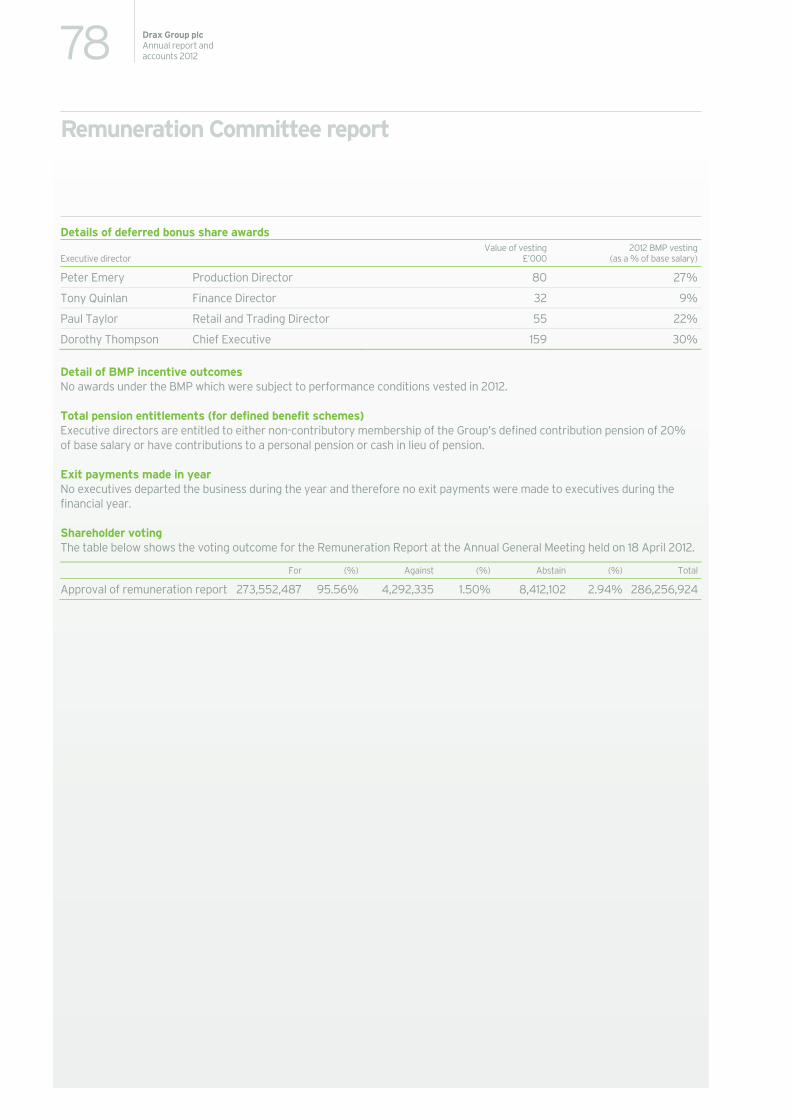
78 Drax Group plcAnnual report and accounts 2012
Remuneration Committee report
Details of deferred bonus share awards
Executive director Value of vesting
£’0002012 BMP vesting
(as a % of base salary)
Peter Emery Production Director 80 27%
Tony Quinlan Finance Director 32 9%
Paul Taylor Retail and Trading Director 55 22%
Dorothy Thompson Chief Executive 159 30%
Detail of BMP incentive outcomes No awards under the BMP which were subject to performance conditions vested in 2012.
Total pension entitlements (for defined benefit schemes) Executive directors are entitled to either non-contributory membership of the Group’s defined contribution pension of 20% of base salary or have contributions to a personal pension or cash in lieu of pension.
Exit payments made in year No executives departed the business during the year and therefore no exit payments were made to executives during the financial year.
Shareholder voting The table below shows the voting outcome for the Remuneration Report at the Annual General Meeting held on 18 April 2012.
For (%) Against (%) Abstain (%) Total
Approval of remuneration report 273,552,487 95.56% 4,292,335 1.50% 8,412,102 2.94% 286,256,924
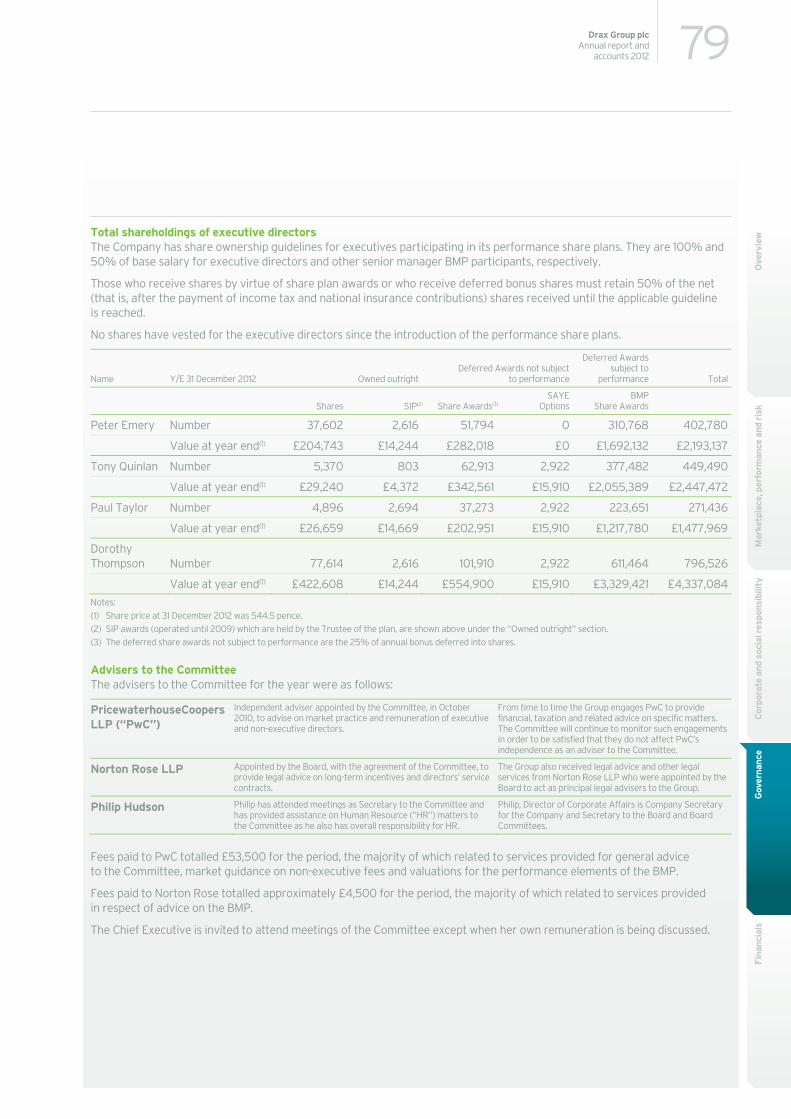
79Drax Group plcAnnual report and
accounts 2012
Mar
ketp
lace
, per
form
ance
and
ris
kC
orpo
rate
and
soc
ial r
espo
nsib
ility
Fina
ncia
lsG
over
nanc
eO
verv
iewTotal shareholdings of executive directors
The Company has share ownership guidelines for executives participating in its performance share plans. They are 100% and 50% of base salary for executive directors and other senior manager BMP participants, respectively.
Those who receive shares by virtue of share plan awards or who receive deferred bonus shares must retain 50% of the net (that is, after the payment of income tax and national insurance contributions) shares received until the applicable guideline is reached.
No shares have vested for the executive directors since the introduction of the performance share plans.
Name Y/E 31 December 2012 Owned outrightDeferred Awards not subject
to performance
Deferred Awards subject to
performance Total
Shares SIP(2) Share Awards(3)SAYE
Options BMP
Share Awards
Peter Emery Number 37,602 2,616 51,794 0 310,768 402,780
Value at year end(1) £204,743 £14,244 £282,018 £0 £1,692,132 £2,193,137
Tony Quinlan Number 5,370 803 62,913 2,922 377,482 449,490
Value at year end(1) £29,240 £4,372 £342,561 £15,910 £2,055,389 £2,447,472
Paul Taylor Number 4,896 2,694 37,273 2,922 223,651 271,436
Value at year end(1) £26,659 £14,669 £202,951 £15,910 £1,217,780 £1,477,969
Dorothy Thompson Number 77,614 2,616 101,910 2,922 611,464 796,526
Value at year end(1) £422,608 £14,244 £554,900 £15,910 £3,329,421 £4,337,084Notes: (1) Share price at 31 December 2012 was 544.5 pence. (2) SIP awards (operated until 2009) which are held by the Trustee of the plan, are shown above under the “Owned outright” section. (3) The deferred share awards not subject to performance are the 25% of annual bonus deferred into shares.
Advisers to the Committee The advisers to the Committee for the year were as follows:
PricewaterhouseCoopers LLP (“PwC”)
Independent adviser appointed by the Committee, in October 2010, to advise on market practice and remuneration of executive and non-executive directors.
From time to time the Group engages PwC to provide financial, taxation and related advice on specific matters. The Committee will continue to monitor such engagements in order to be satisfied that they do not affect PwC’s independence as an adviser to the Committee.
Norton Rose LLP Appointed by the Board, with the agreement of the Committee, to provide legal advice on long-term incentives and directors’ service contracts.
The Group also received legal advice and other legal services from Norton Rose LLP who were appointed by the Board to act as principal legal advisers to the Group.
Philip Hudson Philip has attended meetings as Secretary to the Committee and has provided assistance on Human Resource (“HR”) matters to the Committee as he also has overall responsibility for HR.
Philip, Director of Corporate Affairs is Company Secretary for the Company and Secretary to the Board and Board Committees.
Fees paid to PwC totalled £53,500 for the period, the majority of which related to services provided for general advice to the Committee, market guidance on non-executive fees and valuations for the performance elements of the BMP.
Fees paid to Norton Rose totalled approximately £4,500 for the period, the majority of which related to services provided in respect of advice on the BMP.
The Chief Executive is invited to attend meetings of the Committee except when her own remuneration is being discussed.
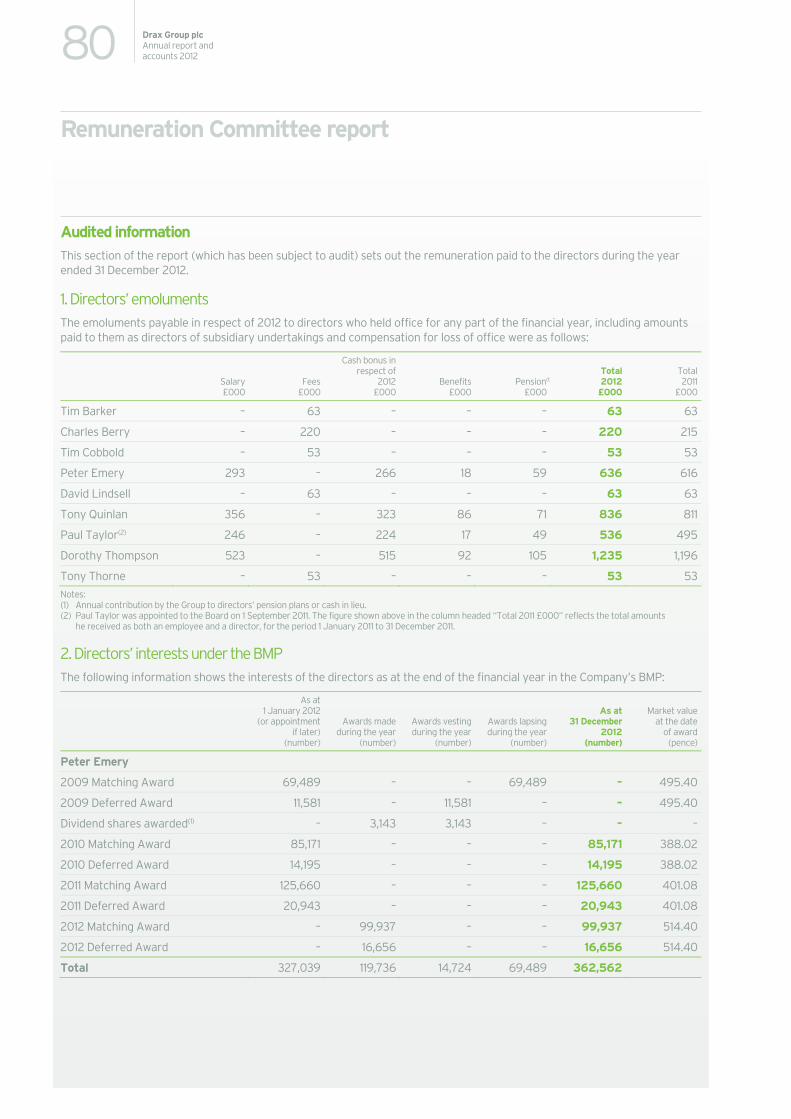
80 Drax Group plcAnnual report and accounts 2012
Remuneration Committee report
Audited information This section of the report (which has been subject to audit) sets out the remuneration paid to the directors during the year ended 31 December 2012.
1. Directors’ emoluments The emoluments payable in respect of 2012 to directors who held office for any part of the financial year, including amounts paid to them as directors of subsidiary undertakings and compensation for loss of office were as follows:
Salary £000
Fees £000
Cash bonus in respect of
2012 £000
Benefits £000
Pension(1)
£000
Total 2012 £000
Total 2011
£000
Tim Barker – 63 – – – 63 63
Charles Berry – 220 – – – 220 215
Tim Cobbold – 53 – – – 53 53
Peter Emery 293 – 266 18 59 636 616
David Lindsell – 63 – – – 63 63
Tony Quinlan 356 – 323 86 71 836 811
Paul Taylor(2) 246 – 224 17 49 536 495
Dorothy Thompson 523 – 515 92 105 1,235 1,196
Tony Thorne – 53 – – – 53 53Notes: (1) Annual contribution by the Group to directors’ pension plans or cash in lieu. (2) Paul Taylor was appointed to the Board on 1 September 2011. The figure shown above in the column headed “Total 2011 £000” reflects the total amounts
he received as both an employee and a director, for the period 1 January 2011 to 31 December 2011.
2. Directors’ interests under the BMP The following information shows the interests of the directors as at the end of the financial year in the Company’s BMP:
As at 1 January 2012
(or appointment if later)
(number)
Awards made during the year
(number)
Awards vesting during the year
(number)
Awards lapsing during the year
(number)
As at 31 December
2012 (number)
Market value at the date
of award (pence)
Peter Emery
2009 Matching Award 69,489 – – 69,489 – 495.40
2009 Deferred Award 11,581 – 11,581 – – 495.40
Dividend shares awarded(1) – 3,143 3,143 – – –
2010 Matching Award 85,171 – – – 85,171 388.02
2010 Deferred Award 14,195 – – – 14,195 388.02
2011 Matching Award 125,660 – – – 125,660 401.08
2011 Deferred Award 20,943 – – – 20,943 401.08
2012 Matching Award – 99,937 – – 99,937 514.40
2012 Deferred Award – 16,656 – – 16,656 514.40
Total 327,039 119,736 14,724 69,489 362,562
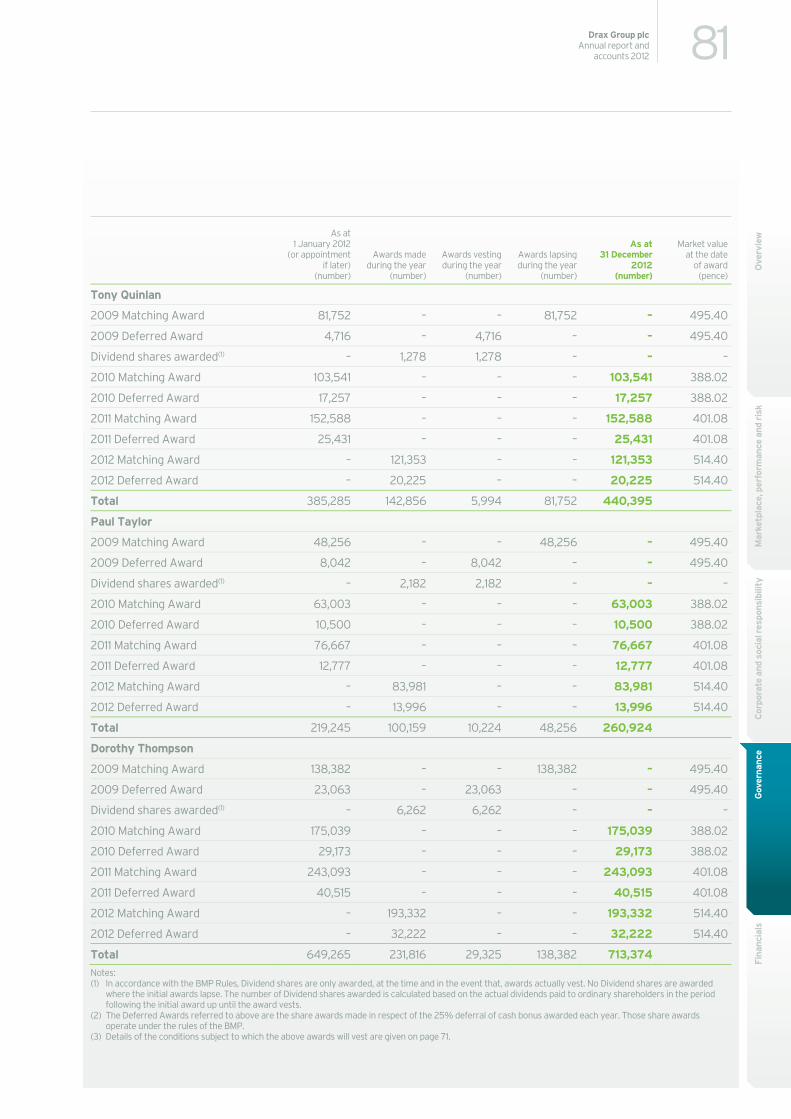
81Drax Group plcAnnual report and
accounts 2012
Mar
ketp
lace
, per
form
ance
and
ris
kC
orpo
rate
and
soc
ial r
espo
nsib
ility
Fina
ncia
lsG
over
nanc
eO
verv
iew
As at 1 January 2012
(or appointment if later)
(number)
Awards made during the year
(number)
Awards vesting during the year
(number)
Awards lapsing during the year
(number)
As at 31 December
2012 (number)
Market value at the date
of award (pence)
Tony Quinlan
2009 Matching Award 81,752 – – 81,752 – 495.40
2009 Deferred Award 4,716 – 4,716 – – 495.40
Dividend shares awarded(1) – 1,278 1,278 – – –
2010 Matching Award 103,541 – – – 103,541 388.02
2010 Deferred Award 17,257 – – – 17,257 388.02
2011 Matching Award 152,588 – – – 152,588 401.08
2011 Deferred Award 25,431 – – – 25,431 401.08
2012 Matching Award – 121,353 – – 121,353 514.40
2012 Deferred Award – 20,225 – – 20,225 514.40
Total 385,285 142,856 5,994 81,752 440,395
Paul Taylor
2009 Matching Award 48,256 – – 48,256 – 495.40
2009 Deferred Award 8,042 – 8,042 – – 495.40
Dividend shares awarded(1) – 2,182 2,182 – – –
2010 Matching Award 63,003 – – – 63,003 388.02
2010 Deferred Award 10,500 – – – 10,500 388.02
2011 Matching Award 76,667 – – – 76,667 401.08
2011 Deferred Award 12,777 – – – 12,777 401.08
2012 Matching Award – 83,981 – – 83,981 514.40
2012 Deferred Award – 13,996 – – 13,996 514.40
Total 219,245 100,159 10,224 48,256 260,924
Dorothy Thompson
2009 Matching Award 138,382 – – 138,382 – 495.40
2009 Deferred Award 23,063 – 23,063 – – 495.40
Dividend shares awarded(1) – 6,262 6,262 – – –
2010 Matching Award 175,039 – – – 175,039 388.02
2010 Deferred Award 29,173 – – – 29,173 388.02
2011 Matching Award 243,093 – – – 243,093 401.08
2011 Deferred Award 40,515 – – – 40,515 401.08
2012 Matching Award – 193,332 – – 193,332 514.40
2012 Deferred Award – 32,222 – – 32,222 514.40
Total 649,265 231,816 29,325 138,382 713,374 Notes: (1) In accordance with the BMP Rules, Dividend shares are only awarded, at the time and in the event that, awards actually vest. No Dividend shares are awarded
where the initial awards lapse. The number of Dividend shares awarded is calculated based on the actual dividends paid to ordinary shareholders in the period following the initial award up until the award vests.
(2) The Deferred Awards referred to above are the share awards made in respect of the 25% deferral of cash bonus awarded each year. Those share awards operate under the rules of the BMP.
(3) Details of the conditions subject to which the above awards will vest are given on page 71.
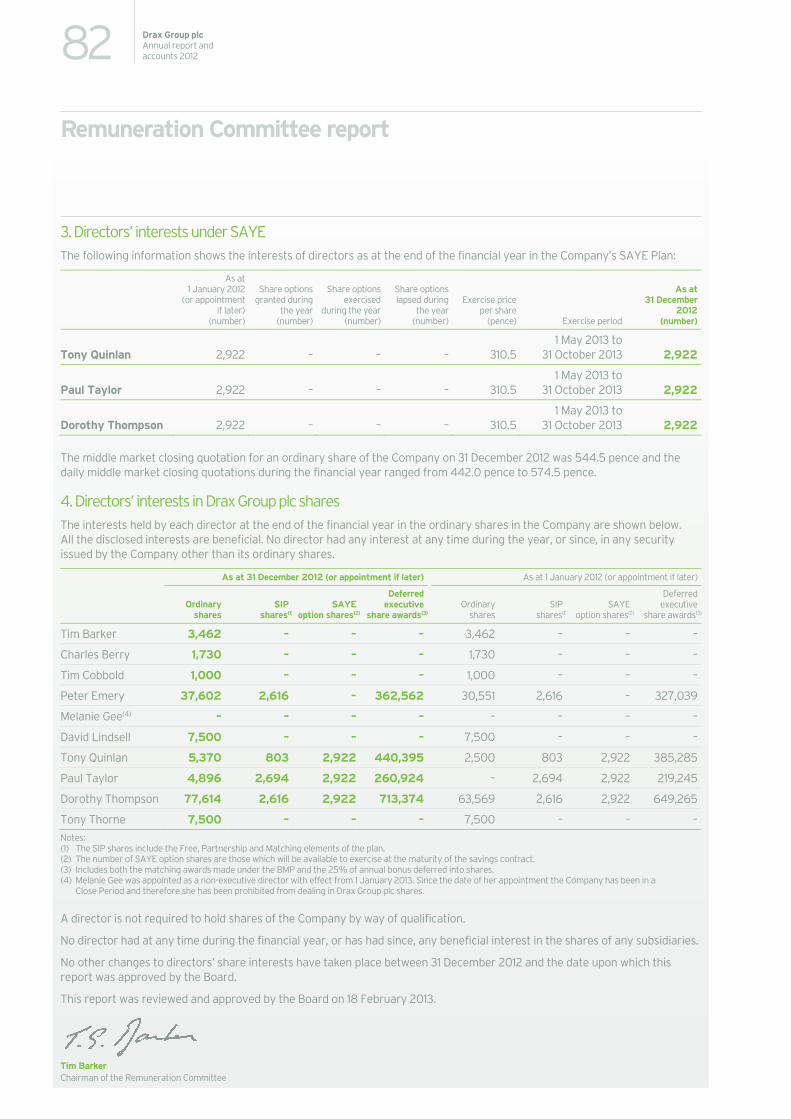
82 Drax Group plcAnnual report and accounts 2012
Remuneration Committee report
3. Directors’ interests under SAYE The following information shows the interests of directors as at the end of the financial year in the Company’s SAYE Plan:
As at 1 January 2012
(or appointment if later)
(number)
Share options granted during
the year (number)
Share options exercised
during the year (number)
Share options lapsed during
the year (number)
Exercise price per share
(pence) Exercise period
As at 31 December
2012 (number)
Tony Quinlan 2,922 – – – 310.51 May 2013 to
31 October 2013 2,922
Paul Taylor 2,922 – – – 310.51 May 2013 to
31 October 2013 2,922
Dorothy Thompson 2,922 – – – 310.51 May 2013 to
31 October 2013 2,922
The middle market closing quotation for an ordinary share of the Company on 31 December 2012 was 544.5 pence and the daily middle market closing quotations during the financial year ranged from 442.0 pence to 574.5 pence.
4. Directors’ interests in Drax Group plc shares The interests held by each director at the end of the financial year in the ordinary shares in the Company are shown below. All the disclosed interests are beneficial. No director had any interest at any time during the year, or since, in any security issued by the Company other than its ordinary shares.
As at 31 December 2012 (or appointment if later) As at 1 January 2012 (or appointment if later)
Ordinary
shares SIP
shares(1)SAYE
option shares(2)
Deferred executive
share awards(3)Ordinary
sharesSIP
shares(1)SAYE
option shares(2)
Deferred executive
share awards(3)
Tim Barker 3,462 – – – 3,462 – – –
Charles Berry 1,730 – – – 1,730 – – –
Tim Cobbold 1,000 – – – 1,000 – – –
Peter Emery 37,602 2,616 – 362,562 30,551 2,616 – 327,039
Melanie Gee(4) – – – – – – – –
David Lindsell 7,500 – – – 7,500 – – –
Tony Quinlan 5,370 803 2,922 440,395 2,500 803 2,922 385,285
Paul Taylor 4,896 2,694 2,922 260,924 – 2,694 2,922 219,245
Dorothy Thompson 77,614 2,616 2,922 713,374 63,569 2,616 2,922 649,265
Tony Thorne 7,500 – – – 7,500 – – –Notes: (1) The SIP shares include the Free, Partnership and Matching elements of the plan. (2) The number of SAYE option shares are those which will be available to exercise at the maturity of the savings contract. (3) Includes both the matching awards made under the BMP and the 25% of annual bonus deferred into shares. (4) Melanie Gee was appointed as a non-executive director with effect from 1 January 2013. Since the date of her appointment the Company has been in a
Close Period and therefore she has been prohibited from dealing in Drax Group plc shares.
A director is not required to hold shares of the Company by way of qualification.
No director had at any time during the financial year, or has had since, any beneficial interest in the shares of any subsidiaries.
No other changes to directors’ share interests have taken place between 31 December 2012 and the date upon which this report was approved by the Board.
This report was reviewed and approved by the Board on 18 February 2013.
Tim Barker Chairman of the Remuneration Committee
83Drax Group plcAnnual report and
accounts 2012
Mar
ketp
lace
, per
form
ance
and
ris
kC
orpo
rate
and
soc
ial r
espo
nsib
ility
Gov
erna
nce
Fina
ncia
lsO
verv
iew
Group – Independent auditor’s report
To the members of Drax Group plc We have audited the Group financial statements of Drax Group plc for the year ended 31 December 2012 which comprise the Consolidated income statement, the Consolidated statement of comprehensive income, the Consolidated balance sheet, the Consolidated statement of changes in equity, the Consolidated cash flow statement and the related notes 1 to 33. The financial reporting framework that has been applied in their preparation is applicable law and International Financial Reporting Standards (“IFRSs”) as adopted by the European Union. This report is made solely to the Company’s members, as a body, in accordance with Chapter 3 of Part 16 of the Companies Act 2006. Our audit work has been undertaken so that we might state to the Company’s members those matters we are required to state to them in an auditor’s report and for no other purpose. To the fullest extent permitted by law, we do not accept or assume responsibility to anyone other than the Company and the Company’s members as a body, for our audit work, for this report, or for the opinions we have formed.
Respective responsibilities of directors and auditor As explained more fully in the Directors’ responsibilities statement, the directors are responsible for the preparation of the Group financial statements and for being satisfied that they give a true and fair view. Our responsibility is to audit and express an opinion on the Group financial statements in accordance with applicable law and International Standards on Auditing (UK and Ireland). Those standards require us to comply with the Auditing Practices Board’s Ethical Standards for Auditors.
Scope of the audit of the financial statements An audit involves obtaining evidence about the amounts and disclosures in the financial statements sufficient to give reasonable assurance that the financial statements are free from material misstatement, whether caused by fraud or error. This includes an assessment of: whether the accounting policies are appropriate to the Group’s circumstances and have been consistently applied and adequately disclosed; the reasonableness of significant accounting estimates made by the directors; and the overall presentation of the financial statements. In addition, we read all the financial and non-financial information in the annual report to identify material inconsistencies with the audited financial statements. If we become aware of any apparent material misstatements or inconsistencies we consider the implications for our report.
Opinion on financial statements In our opinion the Group financial statements: – give a true and fair view of the state of the Group’s affairs as at 31 December 2012 and of its profit for the year then ended; – have been properly prepared in accordance with IFRSs as adopted by the European Union; and – have been prepared in accordance with the requirements of the Companies Act 2006 and Article 4 of the IAS Regulation.
Opinion on other matters prescribed by the Companies Act 2006 In our opinion the information given in the Directors’ report for the financial year for which the financial statements are prepared is consistent with the Group financial statements.
Matters on which we are required to report by exception We have nothing to report in respect of the following:
Under the Companies Act 2006 we are required to report to you if, in our opinion:
– certain disclosures of directors’ remuneration specified by law are not made; or – we have not received all the information and explanations we require for our audit.
Under the Listing Rules we are required to review: – the directors’ statement contained within the Directors’ report in relation to going concern; – the part of the Corporate governance statement relating to the Company’s compliance with the nine provisions of the
UK Corporate Governance Code specified for our review; and – certain elements of the report to shareholders by the Board on directors’ remuneration.
Other matters We have reported separately on the Company financial statements of Drax Group plc for the year ended 31 December 2012 and on the information in the Directors’ remuneration report that is described as having been audited.
Carl D Hughes MA FCA (Senior Statutory Auditor) for and on behalf of Deloitte LLP Chartered Accountants and Statutory Auditor London, UK
18 February 2013
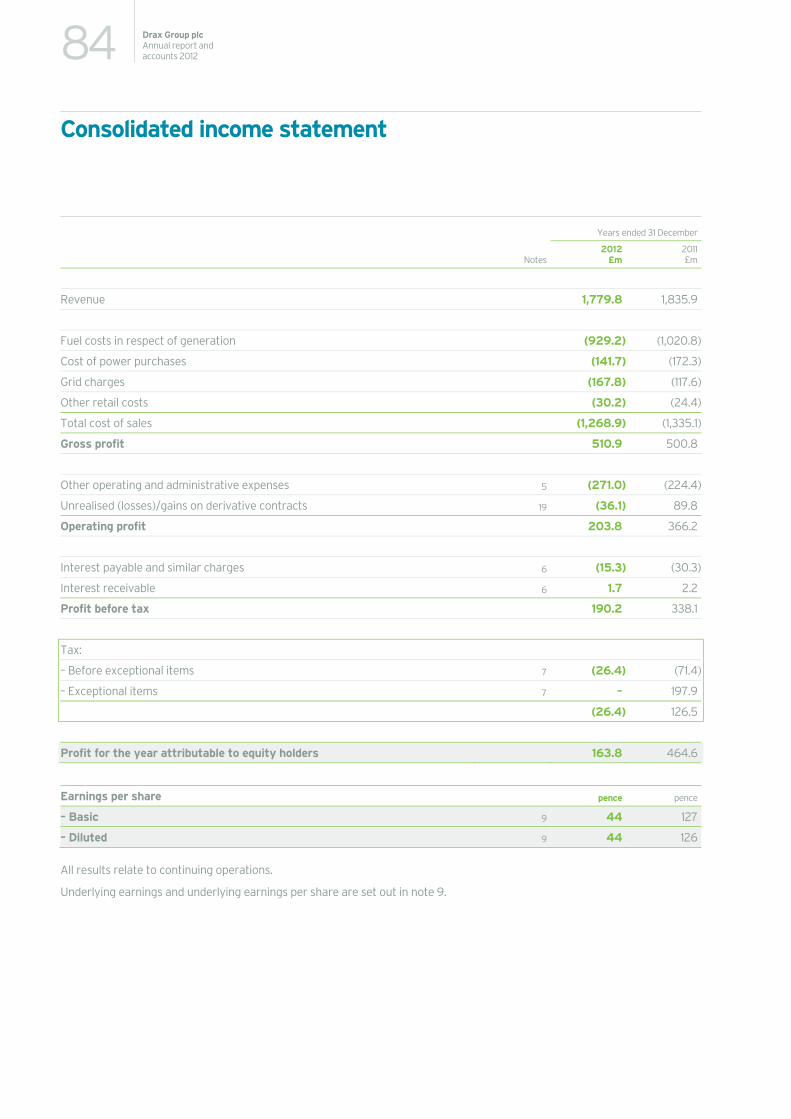
84 Drax Group plcAnnual report and accounts 2012
Consolidated income statement
Years ended 31 December
Notes2012
£m 2011£m
Revenue 1,779.8 1,835.9
Fuel costs in respect of generation (929.2) (1,020.8)
Cost of power purchases (141.7) (172.3)
Grid charges (167.8) (117.6)
Other retail costs (30.2) (24.4)
Total cost of sales (1,268.9) (1,335.1)
Gross profit 510.9 500.8
Other operating and administrative expenses 5 (271.0) (224.4)
Unrealised (losses)/gains on derivative contracts 19 (36.1) 89.8
Operating profit 203.8 366.2
Interest payable and similar charges 6 (15.3) (30.3)
Interest receivable 6 1.7 2.2
Profit before tax 190.2 338.1
Tax:
– Before exceptional items 7 (26.4) (71.4)
– Exceptional items 7 – 197.9
(26.4) 126.5
Profit for the year attributable to equity holders 163.8 464.6
Earnings per share pence pence
– Basic 9 44 127
– Diluted 9 44 126
All results relate to continuing operations.
Underlying earnings and underlying earnings per share are set out in note 9.
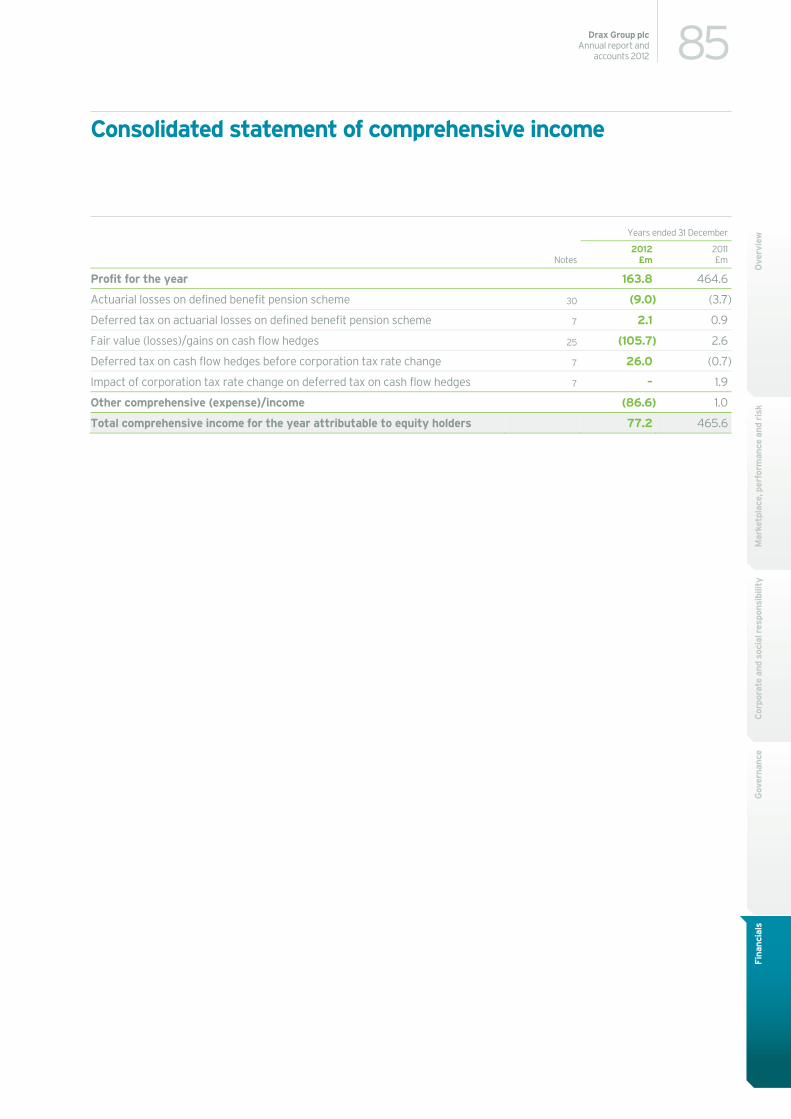
85Drax Group plcAnnual report and
accounts 2012
Mar
ketp
lace
, per
form
ance
and
ris
kC
orpo
rate
and
soc
ial r
espo
nsib
ility
Gov
erna
nce
Fina
ncia
lsO
verv
iew
Consolidated statement of comprehensive income
Years ended 31 December
Notes 2012
£m 2011£m
Profit for the year 163.8 464.6
Actuarial losses on defined benefit pension scheme 30 (9.0) (3.7)
Deferred tax on actuarial losses on defined benefit pension scheme 7 2.1 0.9
Fair value (losses)/gains on cash flow hedges 25 (105.7) 2.6
Deferred tax on cash flow hedges before corporation tax rate change 7 26.0 (0.7)
Impact of corporation tax rate change on deferred tax on cash flow hedges 7 – 1.9
Other comprehensive (expense)/income (86.6) 1.0
Total comprehensive income for the year attributable to equity holders 77.2 465.6
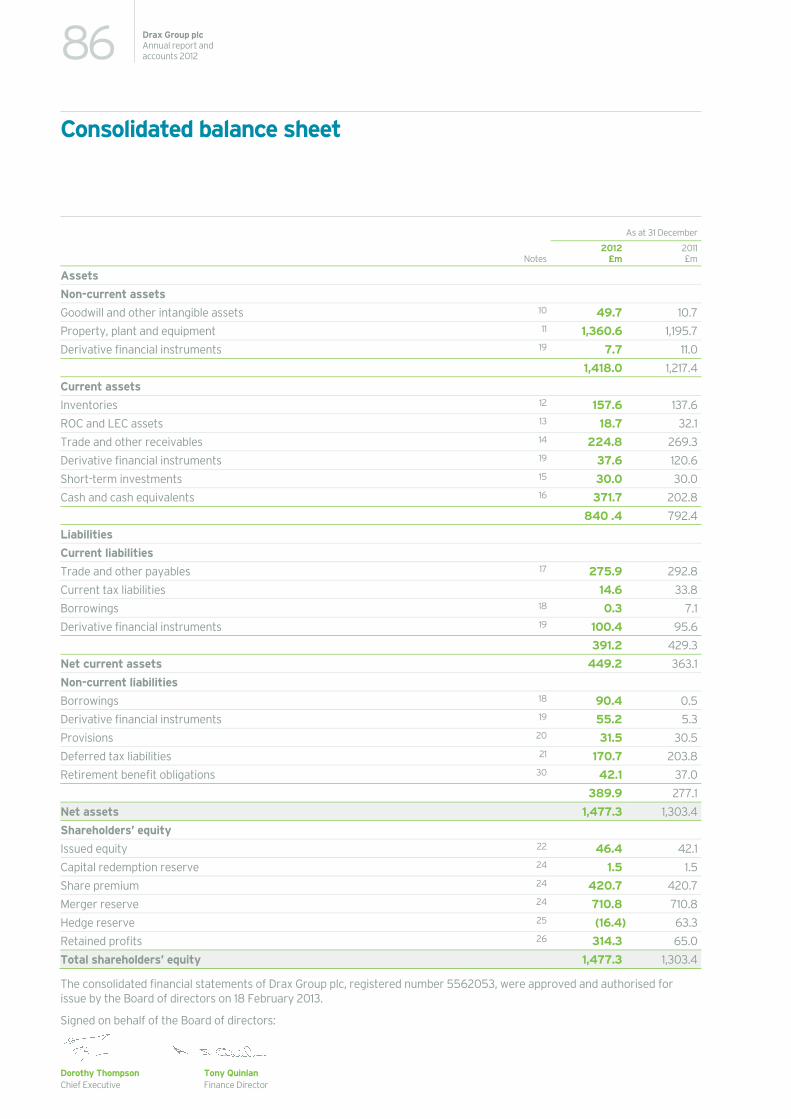
86 Drax Group plcAnnual report and accounts 2012
Consolidated balance sheet
As at 31 December
Notes2012
£m 2011£m
Assets
Non-current assets
Goodwill and other intangible assets 10 49.7 10.7
Property, plant and equipment 11 1,360.6 1,195.7
Derivative financial instruments 19 7.7 11.0
1,418.0 1,217.4
Current assets
Inventories 12 157.6 137.6
ROC and LEC assets 13 18.7 32.1
Trade and other receivables 14 224.8 269.3
Derivative financial instruments 19 37.6 120.6
Short-term investments 15 30.0 30.0
Cash and cash equivalents 16 371.7 202.8
840 .4 792.4
Liabilities
Current liabilities
Trade and other payables 17 275.9 292.8
Current tax liabilities 14.6 33.8
Borrowings 18 0.3 7.1
Derivative financial instruments 19 100.4 95.6
391.2 429.3
Net current assets 449.2 363.1
Non-current liabilities
Borrowings 18 90.4 0.5
Derivative financial instruments 19 55.2 5.3
Provisions 20 31.5 30.5
Deferred tax liabilities 21 170.7 203.8
Retirement benefit obligations 30 42.1 37.0
389.9 277.1
Net assets 1,477.3 1,303.4
Shareholders’ equity
Issued equity 22 46.4 42.1
Capital redemption reserve 24 1.5 1.5
Share premium 24 420.7 420.7
Merger reserve 24 710.8 710.8
Hedge reserve 25 (16.4) 63.3
Retained profits 26 314.3 65.0
Total shareholders’ equity 1,477.3 1,303.4
The consolidated financial statements of Drax Group plc, registered number 5562053, were approved and authorised for issue by the Board of directors on 18 February 2013.
Signed on behalf of the Board of directors:
Dorothy Thompson Tony Quinlan Chief Executive Finance Director
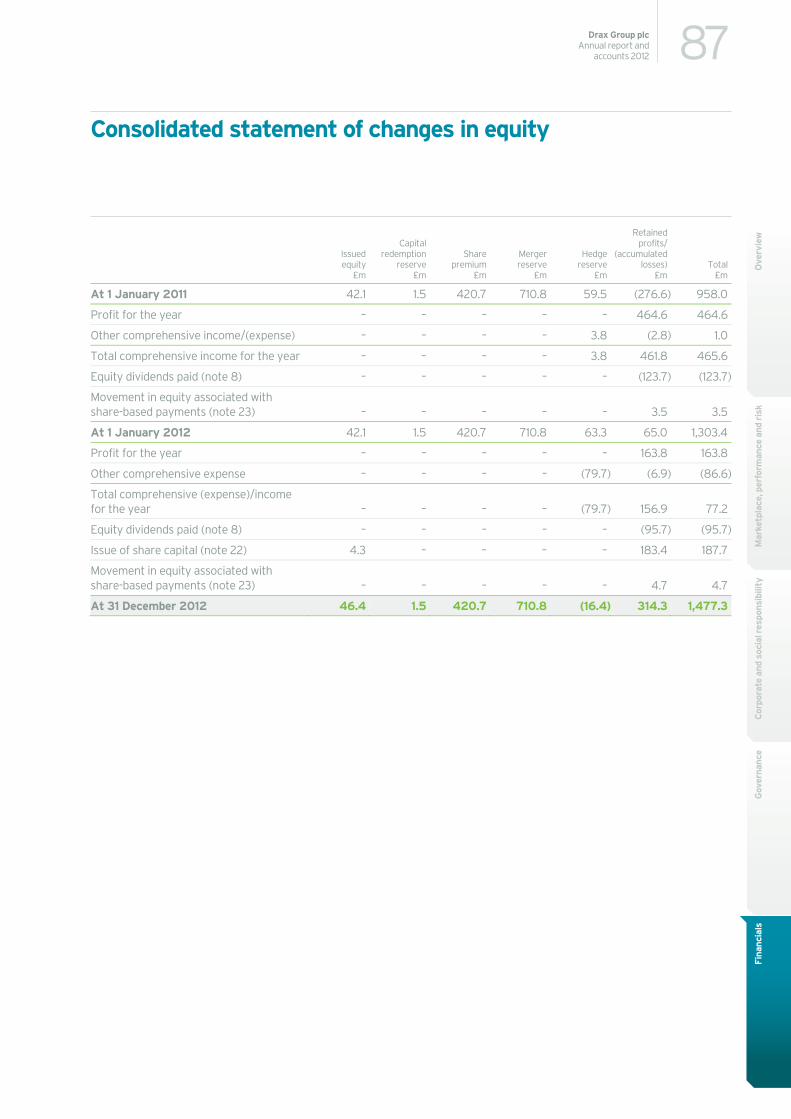
87Drax Group plcAnnual report and
accounts 2012
Mar
ketp
lace
, per
form
ance
and
ris
kC
orpo
rate
and
soc
ial r
espo
nsib
ility
Gov
erna
nce
Fina
ncia
lsO
verv
iew
Consolidated statement of changes in equity
Issued equity
£m
Capitalredemption
reserve£m
Sharepremium
£m
Mergerreserve
£m
Hedge reserve
£m
Retained profits/
(accumulated losses)
£mTotal
£m
At 1 January 2011 42.1 1.5 420.7 710.8 59.5 (276.6) 958.0
Profit for the year – – – – – 464.6 464.6
Other comprehensive income/(expense) – – – – 3.8 (2.8) 1.0
Total comprehensive income for the year – – – – 3.8 461.8 465.6
Equity dividends paid (note 8) – – – – – (123.7) (123.7)
Movement in equity associated with share-based payments (note 23) – – – – – 3.5 3.5
At 1 January 2012 42.1 1.5 420.7 710.8 63.3 65.0 1,303.4
Profit for the year – – – – – 163.8 163.8
Other comprehensive expense – – – – (79.7) (6.9) (86.6)
Total comprehensive (expense)/income for the year – – – – (79.7) 156.9 77.2
Equity dividends paid (note 8) – – – – – (95.7) (95.7)
Issue of share capital (note 22) 4.3 – – – – 183.4 187.7
Movement in equity associated with share-based payments (note 23) – – – – – 4.7 4.7
At 31 December 2012 46.4 1.5 420.7 710.8 (16.4) 314.3 1,477.3
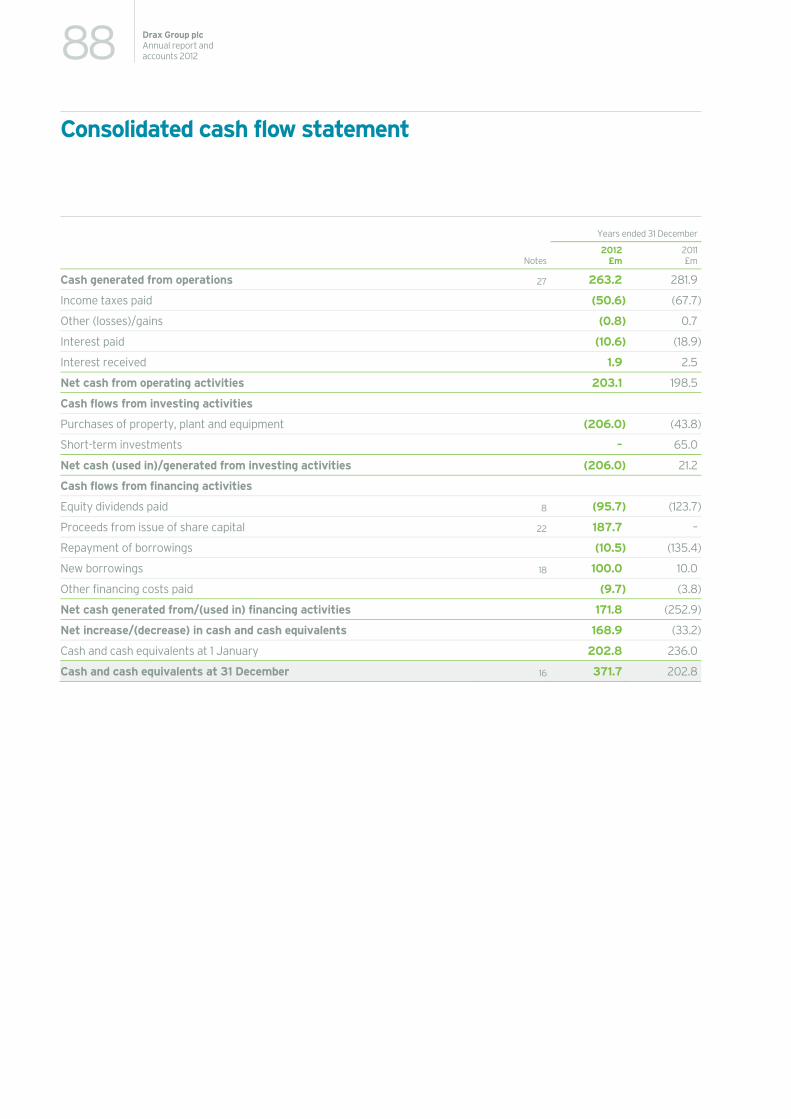
88 Drax Group plcAnnual report and accounts 2012
Consolidated cash flow statement
Years ended 31 December
Notes2012
£m 2011£m
Cash generated from operations 27 263.2 281.9
Income taxes paid (50.6) (67.7)
Other (losses)/gains (0.8) 0.7
Interest paid (10.6) (18.9)
Interest received 1.9 2.5
Net cash from operating activities 203.1 198.5
Cash flows from investing activities
Purchases of property, plant and equipment (206.0) (43.8)
Short-term investments – 65.0
Net cash (used in)/generated from investing activities (206.0) 21.2
Cash flows from financing activities
Equity dividends paid 8 (95.7) (123.7)
Proceeds from issue of share capital 22 187.7 –
Repayment of borrowings (10.5) (135.4)
New borrowings 18 100.0 10.0
Other financing costs paid (9.7) (3.8)
Net cash generated from/(used in) financing activities 171.8 (252.9)
Net increase/(decrease) in cash and cash equivalents 168.9 (33.2)
Cash and cash equivalents at 1 January 202.8 236.0
Cash and cash equivalents at 31 December 16 371.7 202.8
89Drax Group plcAnnual report and
accounts 2012
Mar
ketp
lace
, per
form
ance
and
ris
kC
orpo
rate
and
soc
ial r
espo
nsib
ility
Gov
erna
nce
Fina
ncia
lsO
verv
iew
Notes to the consolidated financial statements
1. General information Drax Group plc (the “Company”) is incorporated in England and Wales under the Companies Act. The Company and its subsidiaries (together the “Group”) operate in the electricity generation and supply industry within the UK. The address of the Company’s registered office and principal establishment is Drax Power Station, Selby, North Yorkshire YO8 8PH, United Kingdom. The operating companies of the Group are disclosed in note 3 to the Company’s separate financial statements, which follow these consolidated financial statements. The principal activities of the Group are the generation and sale of electricity and by-products of the electricity generation process at Drax Power Station, Selby, North Yorkshire, and the sale of electricity to business customers by Haven Power Limited (“Haven Power”).
2. Basis of preparation The financial statements have been prepared in accordance with International Financial Reporting Standards (“IFRSs”) adopted by the European Union and therefore the consolidated financial statements comply with Article 4 of the EU IAS Regulations.
The financial statements have been prepared on a going concern basis, as explained in Operational and financial performance on page 29, and on the historical cost basis, except for certain financial assets and liabilities that have been measured at fair value.
Change in accounting policy In 2012 the Group changed its accounting policy for the measurement of ROC assets generated by the burning of biomass. As a result of the change, ROC assets are now measured in accordance with IAS 20: “Accounting for government grants and disclosure of government assistance”, at fair value. The Group previously valued ROCs based on the attributable, incremental cost of generating ROCs over the cost of coal.
The change in accounting policy results in recognition that more accurately reflects the substance of generation of ROC assets during the business cycle particularly as more biomass is burned and ROC income earned. Accordingly, the Group considers that this will result in more relevant presentation as we implement our biomass transformation plans.
Retrospective application of the change in accounting policy has not had a material impact on the financial statements of the Group in either the current or prior period and as such corresponding amounts have not been restated as a result of this change.
Adoption of new and revised accounting standards In 2012, several amended standards and interpretations became effective. These are IFRS 7 (amended) “Disclosures – transfers of financial assets”, IFRS 1 (amended) “Severe hyperinflation and removal of fixed dates for first-time adopters” and IAS 12 (amended) “Deferred tax: recovery of underlying assets”. The adoption of these standards and interpretations has not had a material impact on the financial statements of the Group.
At the date of authorisation of these financial statements, the following standards and relevant interpretations, which have not been applied in these financial statements, were in issue but not yet effective (and some of which were pending endorsement by the EU):
– IFRS 1 (amended) “Government loans” – effective for accounting periods beginning on or after 1 January 2013.
– IFRS 7 (amended) “Disclosures: Offsetting financial assets and financial liabilities” – effective for accounting periods beginning on or after 1 January 2013.
– IFRS 9 “Financial instruments – Classification and measurement” – effective for accounting periods beginning on or after 1 January 2015.
– IFRS 10 “Consolidated financial statements” – effective for accounting periods beginning on or after 1 January 2013.
– IFRS 11 “Joint arrangements” – effective for accounting periods beginning on or after 1 January 2013.
– IFRS 12 “Disclosure of interests in other entities” – effective for accounting periods beginning on or after 1 January 2013.
– IFRS 13 “Fair value measurement” – effective for accounting periods beginning on or after 1 January 2013.
90 Drax Group plcAnnual report and accounts 2012
Notes to the consolidated financial statements
2. Basis of preparation (continued) – IAS 1 (amended) “Presentation of financial statements – other comprehensive income” – effective for accounting periods
beginning on or after 1 July 2012.
– IAS 19 (revised) “Employee benefits” – effective for accounting periods beginning on or after 1 January 2013.
– IAS 27 (revised) “Separate financial statements” – effective for accounting periods beginning on or after 1 January 2013.
– IAS 28 (revised) “Investments in associates and joint ventures” – effective for accounting periods beginning on or after 1 January 2013.
– IAS 32 (amended) “Offsetting financial assets and financial liabilities” – effective for accounting periods beginning on or after 1 January 2014.
– Annual improvements to IFRS 2009–2011 cycle (various standards) – effective for accounting periods beginning on or after 1 January 2013.
The Group is yet to assess the full impact of adoption of IFRS 9 and intends to adopt the standard no later than the accounting period beginning on or after 1 January 2015, subject to endorsement by the EU.
Adoption of the other standards in future periods is not expected to have a material impact on the financial statements of the Group.
3. Summary of significant accounting policies The principal accounting policies adopted in the preparation of these financial statements are set out below. These policies have been consistently applied to both years presented, unless otherwise stated.
(A) Basis of consolidation The consolidated financial statements incorporate the financial statements of the Company and entities controlled by the Company made up to the reporting date each year. Control is achieved where the Company has the power to govern the financial and operating policies of an investee entity so as to obtain benefits from its activities.
All intra-group transactions, balances, income and expenses are eliminated on consolidation.
(B) Critical accounting judgements, estimates and assumptions The preparation of financial statements in conformity with IFRSs requires the use of estimates and assumptions that affect the reported amounts of assets and liabilities at the date of the financial statements and the reported amounts of revenues and expenses during the reporting period. Although these estimates are based on management’s reasonable knowledge of the amount, event or actions, actual results ultimately may differ from those estimates. The critical accounting judgements, estimates and assumptions that have a significant risk of causing a material adjustment to the carrying amounts of assets and liabilities within the next financial year are discussed below.
Property, plant and equipment – Estimated useful lives and residual values are reviewed annually, taking into account prices prevailing at each balance sheet date. The carrying values of property, plant and equipment are also reviewed for impairment where there has been a trigger event (that is, an event which may have resulted in impairment) by assessing the present value of estimated future cash flows and net realisable value compared with net book value. The calculation of estimated future cash flows and residual values is based on management’s reasonable estimates of future prices, output and costs, and is therefore subjective.
Impairment – The Group tests annually whether goodwill has suffered any impairment, in accordance with the accounting policy stated in note 3 (E). The recoverable amounts of cash-generating units have been determined based on value in use calculations. These calculations require the use of estimates (see note 10).
Pensions – The Group operates an approved defined benefit scheme. The cost of providing benefits is determined using the projected unit credit method and actuarial valuations of the plan assets and liabilities are carried out as at the balance sheet date. Inherent in these valuations are key assumptions, including discount rates, inflation rates, expected returns on scheme assets, salary and pension increases, and mortality rates.
These actuarial assumptions are reviewed annually and modified as appropriate. The Group believes that the assumptions utilised in recording obligations under the scheme are reasonable based on prior experience, market conditions and the advice of scheme actuaries. However, actual results may differ from such assumptions.
91Drax Group plcAnnual report and
accounts 2012
Mar
ketp
lace
, per
form
ance
and
ris
kC
orpo
rate
and
soc
ial r
espo
nsib
ility
Gov
erna
nce
Fina
ncia
lsO
verv
iewTaxation – In accounting for taxation the Group makes assumptions regarding the treatment of items of income and expenditure
for tax purposes. The Group believes that these assumptions are reasonable based on prior experience and consultation with advisers.
Full provision is made for deferred taxation at the rates of tax prevailing at the period end dates unless future rates have been substantively enacted. Deferred tax assets are recognised where it is considered more likely than not that they will be recovered, taking into account the nature of the losses, and the certainty of the relevant offsetting income streams.
Derivatives – Derivative financial instruments are stated in the balance sheet at their fair value. Changes in the fair value of derivatives are recorded each period in earnings unless specific hedge accounting criteria are met. The fair values of derivative instruments for commodities and foreign exchange rates are determined using forward price curves. Forward price curves represent the Group’s estimates of the prices at which a buyer or seller could contract today for delivery or settlement of a commodity or foreign exchange payment or receipt, at future dates. The Group generally bases forward price curves upon readily obtainable market price quotations, as the Group’s commodity and forward foreign exchange contracts do not generally extend beyond the actively traded portion of these curves. However, the forward price curves used are only an estimate of how future prices will move and are, therefore, subjective. Where derivative financial instruments include options these are valued using an option pricing model. Inputs to the model include market commodity prices, forward price curves, the term of the option and assumptions around volatility based on historical movements. The inputs include assumptions around future transactions and market movements and are, therefore, subjective.
ROCs and LECs – ROCs and LECs are stated within the balance sheet at fair value. Inherent to the calculation of this fair value is an assumption regarding future sales prices in the market. Historic experience indicates that the assumptions used in the valuation are reasonable; however actual sales prices may differ.
(C) Revenue recognition Revenue represents amounts receivable for goods or services provided in the normal course of business, net of trade discounts, VAT and other sales-related taxes, and excluding transactions with or between group companies.
Revenues from the sale of electricity are recorded based upon output delivered at rates specified under contract terms or prevailing market rates as applicable.
Revenues from sales of ROCs and LECs are recorded at the invoiced value, net of VAT. Revenue is recognised when the risks and rewards of ownership have been substantially transferred to a third party.
Where goods or services are exchanged for goods or services of a similar nature and value, the exchange is not treated as giving rise to revenue. Where goods or services are exchanged for goods or services of a dissimilar nature, the exchange is treated as giving rise to revenue. The revenue is measured at the fair value of goods or services received, adjusted by the amount of any cash or cash equivalents received or paid. If the fair value of the goods or services received cannot be measured reliably, the revenue is measured at the fair value of the goods or services given up, adjusted by the amount of any cash or cash equivalents received or paid.
Revenue from the sale of electricity direct to customers through our retail business, Haven Power is recorded after deduction of trade discounts, VAT and Climate Change Levy. Revenue is recognised on the supply of electricity when a contract exists, supply has taken place, a quantifiable price has been established or can be determined and the receivables are likely to be recovered. Energy supplied, but not yet measured or billed is calculated based on consumption statistics and selling price estimates.
(D) Segmental reporting The business activity of the Group consists of the generation and sale of electricity at Drax Power Station, along with the sale of electricity direct to customers through our retail business, Haven Power. The costs incurred by the US operations have been included within the generation segment.
92 Drax Group plcAnnual report and accounts 2012
Notes to the consolidated financial statements
3. Summary of significant accounting policies (continued) (E) Goodwill Goodwill arising on an acquisition is recognised as an asset and initially measured at cost, being the excess of the cost of the business combination over the Group’s interest in the net fair value of the identifiable assets, liabilities and contingent liabilities recognised. Goodwill which is recognised as an asset is reviewed for impairment at least annually. Any impairment is recognised immediately in the income statement and is not subsequently reversed.
For the purpose of impairment testing, goodwill is allocated to each of the Group’s cash-generating units expected to benefit from the synergies of the combination. Cash-generating units to which goodwill has been allocated are tested for impairment annually or more frequently where there is an indication it may be impaired. If the recoverable amount of the cash-generating unit is less than its carrying amount, the impairment loss is allocated first to reduce the carrying amount of goodwill and then to its other assets.
On disposal of a subsidiary, the attributable amount of goodwill is included in the determination of the profit or loss on disposal.
(F) Property, plant and equipment Property, plant and equipment are initially measured at cost. Cost comprises the purchase price (after deducting trade discounts and rebates), any directly attributable costs of bringing the asset to the location and condition necessary for it to be capable of operating in the manner intended by management, and the estimate of the present value of the costs of dismantling and removing the item and restoring the site. Property, plant and equipment are stated at cost less accumulated depreciation and any provision for impairment in value. Freehold land and assets in the course of construction are not depreciated.
Depreciation is provided on a straight-line basis to write down assets to their residual value evenly over the estimated useful lives of the assets from the date of acquisition (limited to the expected decommissioning date of the power station). The estimated useful lives, beginning in 2004 when they were reset, are currently:
Years
Main generating plant and freehold buildings up to 35
Other plant and machinery 3–20
Decommissioning asset 35
Plant spare parts 35
Estimated useful lives and residual values are reviewed annually, taking into account commercial and technological obsolescence as well as normal wear and tear, and any provision for impairment. Residual values are based on prices prevailing at each balance sheet date.
Costs relating to major inspections, overhauls and upgrades to the power station are included in the asset’s carrying amount or recognised as a separate asset, as appropriate, if the recognition criteria are met; namely, when it is probable that future economic benefits associated with the item will flow to the Group and the cost of the item can be measured reliably. All other repairs and maintenance costs are expensed as incurred.
(G) Impairment of property, plant and equipment At each balance sheet date the Group reviews its property, plant and equipment to determine whether there is any indication that these assets may have suffered an impairment loss. If such an indication exists, the recoverable amount is assessed by reference to the net present value of expected future cash flows of the asset (value in use) or sales value net of expenses. If an asset is impaired, a provision is made to reduce its carrying amount to the estimated recoverable amount. The discount rate applied is a pre-tax rate based upon the Group’s weighted average cost of capital and reflects the current market assessment of the time value of money and the risks specific to the business.
93Drax Group plcAnnual report and
accounts 2012
Mar
ketp
lace
, per
form
ance
and
ris
kC
orpo
rate
and
soc
ial r
espo
nsib
ility
Gov
erna
nce
Fina
ncia
lsO
verv
iew(H) Decommissioning costs
Provision is made for the estimated decommissioning costs at the end of the useful economic life of the Group’s generating assets, when a legal or constructive obligation arises, on a discounted basis. The amount provided represents the present value of the expected costs. The discount rate used is a risk free pre-tax rate, reflecting the fact that the estimated future cash flows have built in risks specific to the liability. An amount equivalent to the discounted provision is capitalised within property, plant and equipment and is depreciated over the useful lives of the related assets. The unwinding of the discount is included in interest payable and similar charges.
(I) Inventories Inventories primarily comprise coal and biomass stocks, together with other fuels and consumables. Coal and biomass stocks are valued at the lower of the weighted average cost and net realisable value. Other stocks of fuel and consumables are valued at the lower of average cost and net realisable value.
(J) ROC and LEC assets The Group is able to claim ROCs and LECs from the Office of Gas and Electricity Markets (“OFGEM”) as a result of burning renewable fuels instead of coal. ROCs and LECs are recognised as current assets in the period they are generated and measured at fair value based on anticipated sales prices. At each balance sheet date the Group reviews the fair value of ROC and LEC assets generated but not sold. Any reductions in fair value are recognised in the income statement in the period incurred. The Group’s revenue recognition policy in respect of ROCs and LECs sold to third parties is set out in 3(C) above.
(K) CO2 emissions allowances The Group recognises its free emissions allowances received under the UK NAP at £nil cost allocated to each financial year on a straight line basis. Any additional allowances, in excess of the amount allocated and required for the current financial year, purchased in the market are recorded at cost, net of any impairment where required, within non-current intangible assets. The Group also recognises a liability in respect of its unsettled obligations to deliver emissions allowances. The charge to the income statement within fuel costs and the liability is measured based on an estimate of the amounts that will be required to satisfy the net obligation, taking into account generation, free allowances allocated under the UK NAP, market purchases, sales and forward contracts already in place allocated to the financial year, and the market price at the balance sheet date.
(L) Taxation Current tax is provided at amounts expected to be paid (or recovered) using the tax rates and laws that have been enacted or substantively enacted by the balance sheet date.
Deferred tax is the tax payable or recoverable on the difference between the carrying amounts of assets and liabilities in the balance sheet and the corresponding tax bases used in the computation of taxable profits. Deferred tax liabilities are generally recognised for all taxable temporary differences and deferred tax assets are recognised to the extent that it is considered more likely than not that taxable profit will be available against which deductible temporary differences can be utilised.
Deferred tax is calculated at the tax rates that have been substantively enacted at the balance sheet date and are expected to apply in the period in which the liability is settled or the asset is realised, and is charged or credited in the income statement, except where it relates to items charged or credited to equity via the statement of comprehensive income, in which case the deferred tax is also dealt with in equity and is shown in the statement of comprehensive income.
(M) Pension and other post-retirement benefits The Group provides pensions through an approved industry defined benefit scheme and a defined contribution scheme. The cost of providing benefits under the defined benefit scheme is determined using the projected unit credit method, and actuarial valuations of the plan assets and liabilities are carried out as at the balance sheet date. Actuarial gains and losses are recognised in full in the statement of comprehensive income.
The current service cost of the pension charge is deducted in arriving at operating profit in other operating and administrative expenses. The net interest cost of the pension charge is included in finance costs and therefore deducted in arriving at profit before tax. The excess of the present value of the defined benefit obligation over the fair value of the plan assets is recognised as a liability in the balance sheet.
For the defined contribution scheme, the Group pays contributions to publicly or privately administered pension insurance plans on a mandatory, contractual or voluntary basis. The Group has no further payment obligations once the contributions have been paid. The contributions are recognised as employee benefit expense when they are due to be paid.
94 Drax Group plcAnnual report and accounts 2012
Notes to the consolidated financial statements
3. Summary of significant accounting policies (continued) (N) Share-based payments Share-based payments are measured at fair value at the date of grant and expensed on a straight line basis over the relevant vesting period, based on an estimate of the shares that will ultimately vest.
(O) Foreign currencies Foreign currency transactions Transactions in foreign currencies are translated into sterling at the exchange rate ruling at the date of the transaction. Foreign exchange gains and losses resulting from the settlement of such transactions, and from the translation at the exchange rate ruling at the balance sheet date of monetary assets and liabilities denominated in foreign currencies, are recognised in the income statement.
Foreign operations The assets and liabilities of foreign operations with a functional currency other than sterling are translated to sterling using published exchange rates at the reporting date. The income and expenses of such operations are translated to sterling using the exchange rate prevailing at the date of the transaction.
(P) Financial instruments Debt instruments The Group measures all debt instruments, whether financial assets or financial liabilities, initially at the fair value of the consideration paid or received. Subsequent to initial measurement, debt instruments are measured at amortised cost using the effective interest method. Transaction costs (any such costs incremental and directly attributable to the issue of the financial instrument) are included in the calculation of the effective interest rate and are, in effect, amortised through the income statement over the life of the instrument.
Fees paid on the establishment of loan facilities are recognised as transaction costs of the loan to the extent that it is probable that some or all of the facility will be drawn down. In this case, the fee is deferred until the draw-down occurs.
Commodity contracts and treasury derivatives Where possible, the Group takes the own use exemption for commodity contracts entered into and held for the purpose of the Group’s own purchase, sale or usage requirements. Commodity contracts which do not qualify for the own use exemption are dealt with as derivatives and are recorded at fair value in the balance sheet with changes in fair value reflected through the hedge reserve to the extent that contracts are treated as effective hedges, or the income statement to the extent the contracts are not treated as effective hedges.
The Group designates certain hedging instruments used to address commodity price risk as cash flow hedges. At the inception of the hedge, the relationship between the hedging instrument and hedged item is documented, along with its risk management objectives. Furthermore, at the inception of the hedge and on an ongoing basis, the Group documents whether the hedging instruments used in hedging transactions are highly effective in offsetting changes in cash flows of hedged items.
The Group also uses treasury related derivatives to manage exposure to currency fluctuations. Treasury related derivatives are recorded at fair value in the balance sheet with changes in fair value reflected through the hedge reserve to the extent that contracts are considered to be effective cash flow hedges, or the income statement to the extent the contracts are not effective as hedges.
The effective portion of changes in the fair value of derivatives that are designated and qualify as cash flow hedges are deferred in equity. The gain or loss relating to any ineffective portion is recognised immediately in the income statement. Amounts deferred in equity are released in the periods when the hedged item is recognised in the income statement.
The fair value of hedging derivatives is classified as a non-current asset or non-current liability if the remaining maturity of the hedge relationship is more than 12 months, and as a current asset or liability if the remaining maturity of the hedge relationship is less than 12 months.
Other financial instruments Issued equity – Ordinary shares are classified as equity as evidenced by their residual interest in the assets of the Company after deducting all of its liabilities. Incremental costs directly attributable to the issue of new shares or options are shown in equity as a deduction, net of tax, from the proceeds. The share premium account records the difference between the nominal value of shares issued and the fair value of the consideration received, unless merger relief criteria within Companies Act (2006) apply, in which case the difference is recorded in retained earnings.
Cash and cash equivalents – Cash and cash equivalents includes cash in hand, deposits held at call with banks, other short-term highly liquid investments with original maturities of three months or less, and bank overdrafts.
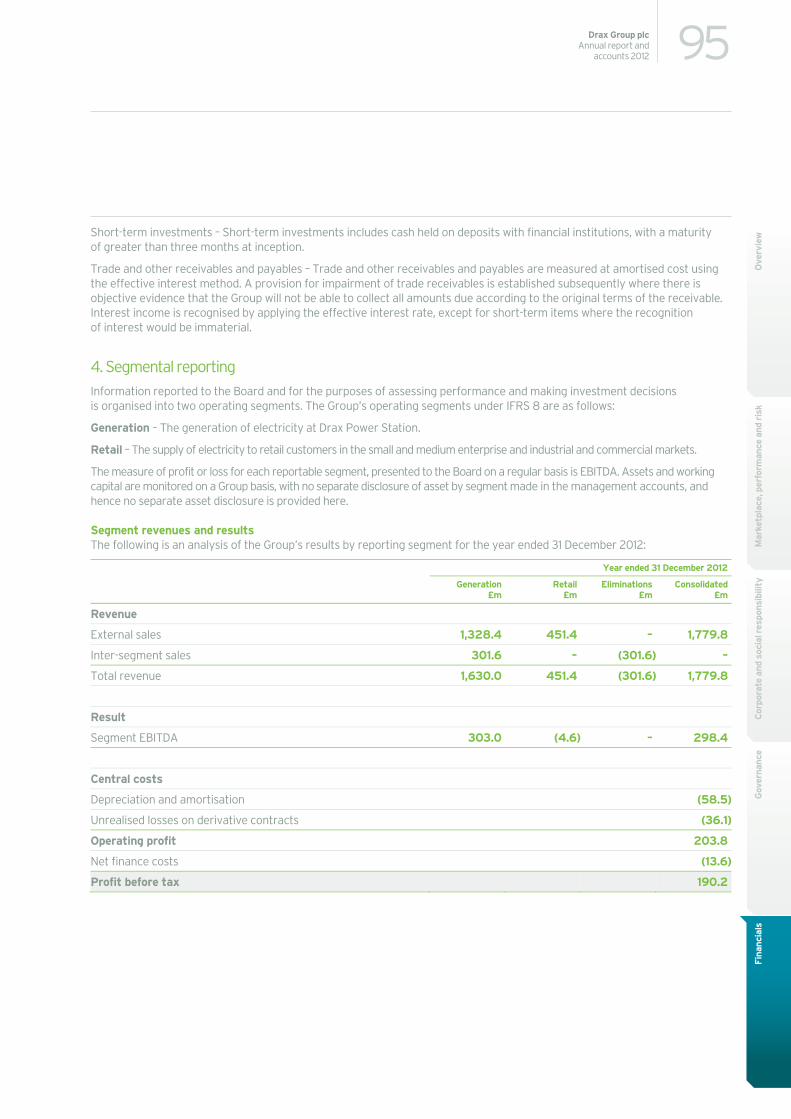
95Drax Group plcAnnual report and
accounts 2012
Mar
ketp
lace
, per
form
ance
and
ris
kC
orpo
rate
and
soc
ial r
espo
nsib
ility
Gov
erna
nce
Fina
ncia
lsO
verv
iewShort-term investments – Short-term investments includes cash held on deposits with financial institutions, with a maturity
of greater than three months at inception.
Trade and other receivables and payables – Trade and other receivables and payables are measured at amortised cost using the effective interest method. A provision for impairment of trade receivables is established subsequently where there is objective evidence that the Group will not be able to collect all amounts due according to the original terms of the receivable. Interest income is recognised by applying the effective interest rate, except for short-term items where the recognition of interest would be immaterial.
4. Segmental reporting Information reported to the Board and for the purposes of assessing performance and making investment decisions is organised into two operating segments. The Group’s operating segments under IFRS 8 are as follows:
Generation – The generation of electricity at Drax Power Station.
Retail – The supply of electricity to retail customers in the small and medium enterprise and industrial and commercial markets.
The measure of profit or loss for each reportable segment, presented to the Board on a regular basis is EBITDA. Assets and working capital are monitored on a Group basis, with no separate disclosure of asset by segment made in the management accounts, and hence no separate asset disclosure is provided here.
Segment revenues and results The following is an analysis of the Group’s results by reporting segment for the year ended 31 December 2012:
Year ended 31 December 2012
Generation£m
Retail £m
Eliminations £m
Consolidated£m
Revenue
External sales 1,328.4 451.4 – 1,779.8
Inter-segment sales 301.6 – (301.6) –
Total revenue 1,630.0 451.4 (301.6) 1,779.8
Result
Segment EBITDA 303.0 (4.6) – 298.4
Central costs
Depreciation and amortisation (58.5)
Unrealised losses on derivative contracts (36.1)
Operating profit 203.8
Net finance costs (13.6)
Profit before tax 190.2
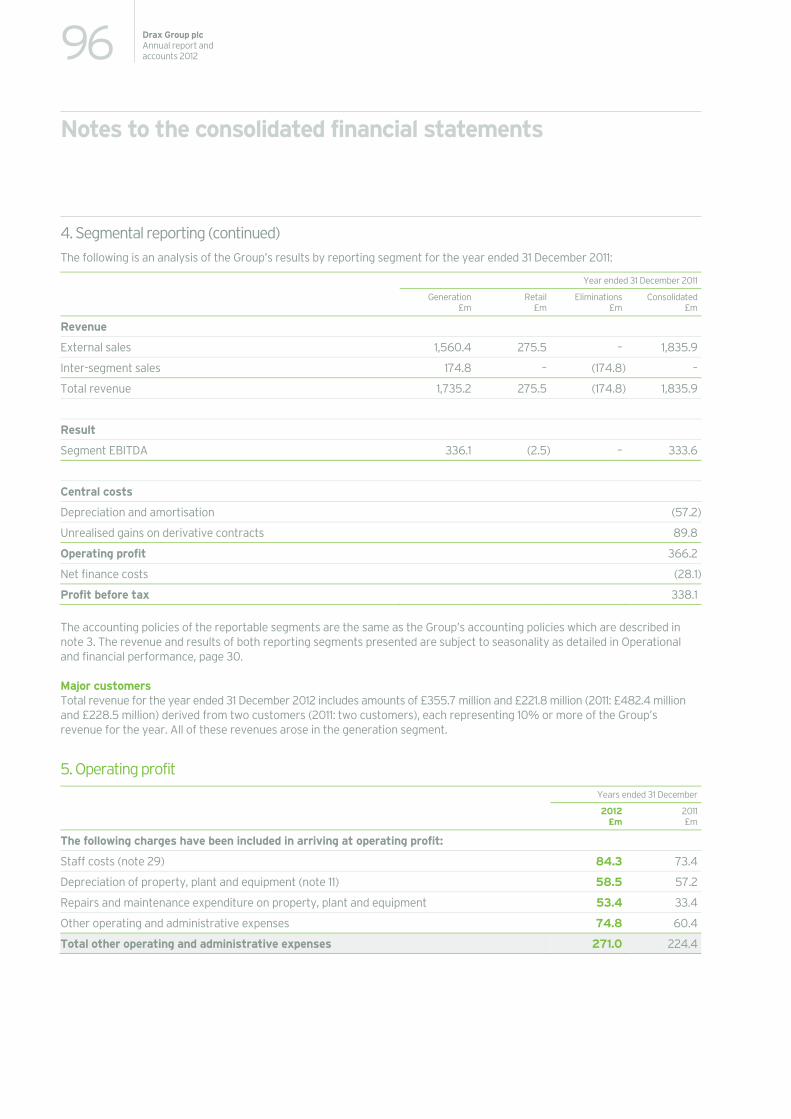
96 Drax Group plcAnnual report and accounts 2012
Notes to the consolidated financial statements
4. Segmental reporting (continued) The following is an analysis of the Group’s results by reporting segment for the year ended 31 December 2011:
Year ended 31 December 2011
Generation£m
Retail£m
Eliminations £m
Consolidated£m
Revenue
External sales 1,560.4 275.5 – 1,835.9
Inter-segment sales 174.8 – (174.8) –
Total revenue 1,735.2 275.5 (174.8) 1,835.9
Result
Segment EBITDA 336.1 (2.5) – 333.6
Central costs
Depreciation and amortisation (57.2)
Unrealised gains on derivative contracts 89.8
Operating profit 366.2
Net finance costs (28.1)
Profit before tax 338.1
The accounting policies of the reportable segments are the same as the Group’s accounting policies which are described in note 3. The revenue and results of both reporting segments presented are subject to seasonality as detailed in Operational and financial performance, page 30.
Major customers Total revenue for the year ended 31 December 2012 includes amounts of £355.7 million and £221.8 million (2011: £482.4 million and £228.5 million) derived from two customers (2011: two customers), each representing 10% or more of the Group’s revenue for the year. All of these revenues arose in the generation segment.
5. Operating profit Years ended 31 December
2012 £m
2011£m
The following charges have been included in arriving at operating profit:
Staff costs (note 29) 84.3 73.4
Depreciation of property, plant and equipment (note 11) 58.5 57.2
Repairs and maintenance expenditure on property, plant and equipment 53.4 33.4
Other operating and administrative expenses 74.8 60.4
Total other operating and administrative expenses 271.0 224.4
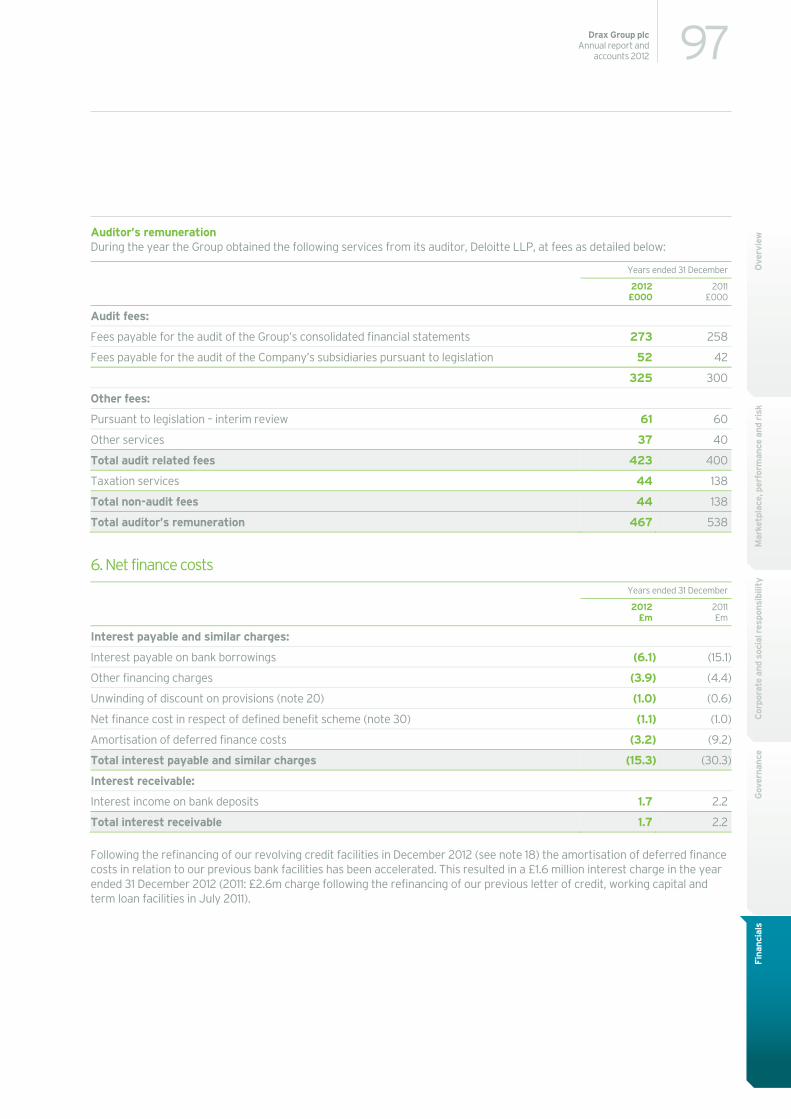
97Drax Group plcAnnual report and
accounts 2012
Mar
ketp
lace
, per
form
ance
and
ris
kC
orpo
rate
and
soc
ial r
espo
nsib
ility
Gov
erna
nce
Fina
ncia
lsO
verv
iewAuditor’s remuneration
During the year the Group obtained the following services from its auditor, Deloitte LLP, at fees as detailed below:
Years ended 31 December
2012
£000 2011
£000
Audit fees:
Fees payable for the audit of the Group’s consolidated financial statements 273 258
Fees payable for the audit of the Company’s subsidiaries pursuant to legislation 52 42
325 300
Other fees:
Pursuant to legislation – interim review 61 60
Other services 37 40
Total audit related fees 423 400
Taxation services 44 138
Total non-audit fees 44 138
Total auditor’s remuneration 467 538
6. Net finance costs Years ended 31 December
2012
£m 2011£m
Interest payable and similar charges:
Interest payable on bank borrowings (6.1) (15.1)
Other financing charges (3.9) (4.4)
Unwinding of discount on provisions (note 20) (1.0) (0.6)
Net finance cost in respect of defined benefit scheme (note 30) (1.1) (1.0)
Amortisation of deferred finance costs (3.2) (9.2)
Total interest payable and similar charges (15.3) (30.3)
Interest receivable:
Interest income on bank deposits 1.7 2.2
Total interest receivable 1.7 2.2
Following the refinancing of our revolving credit facilities in December 2012 (see note 18) the amortisation of deferred finance costs in relation to our previous bank facilities has been accelerated. This resulted in a £1.6 million interest charge in the year ended 31 December 2012 (2011: £2.6m charge following the refinancing of our previous letter of credit, working capital and term loan facilities in July 2011).
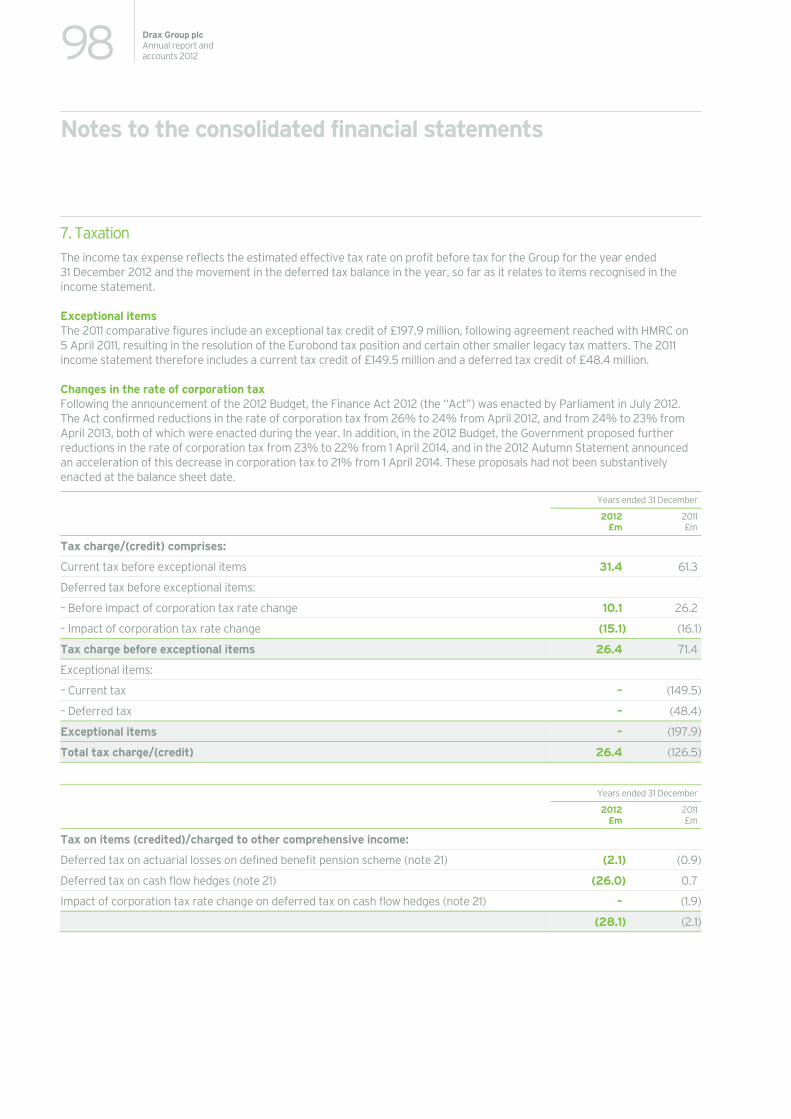
98 Drax Group plcAnnual report and accounts 2012
Notes to the consolidated financial statements
7. Taxation The income tax expense reflects the estimated effective tax rate on profit before tax for the Group for the year ended 31 December 2012 and the movement in the deferred tax balance in the year, so far as it relates to items recognised in the income statement.
Exceptional items The 2011 comparative figures include an exceptional tax credit of £197.9 million, following agreement reached with HMRC on 5 April 2011, resulting in the resolution of the Eurobond tax position and certain other smaller legacy tax matters. The 2011 income statement therefore includes a current tax credit of £149.5 million and a deferred tax credit of £48.4 million.
Changes in the rate of corporation tax Following the announcement of the 2012 Budget, the Finance Act 2012 (the “Act”) was enacted by Parliament in July 2012. The Act confirmed reductions in the rate of corporation tax from 26% to 24% from April 2012, and from 24% to 23% from April 2013, both of which were enacted during the year. In addition, in the 2012 Budget, the Government proposed further reductions in the rate of corporation tax from 23% to 22% from 1 April 2014, and in the 2012 Autumn Statement announced an acceleration of this decrease in corporation tax to 21% from 1 April 2014. These proposals had not been substantively enacted at the balance sheet date.
Years ended 31 December
2012 £m
2011£m
Tax charge/(credit) comprises:
Current tax before exceptional items 31.4 61.3
Deferred tax before exceptional items:
– Before impact of corporation tax rate change 10.1 26.2
– Impact of corporation tax rate change (15.1) (16.1)
Tax charge before exceptional items 26.4 71.4
Exceptional items:
– Current tax – (149.5)
– Deferred tax – (48.4)
Exceptional items – (197.9)
Total tax charge/(credit) 26.4 (126.5)
Years ended 31 December
2012 £m
2011£m
Tax on items (credited)/charged to other comprehensive income:
Deferred tax on actuarial losses on defined benefit pension scheme (note 21) (2.1) (0.9)
Deferred tax on cash flow hedges (note 21) (26.0) 0.7
Impact of corporation tax rate change on deferred tax on cash flow hedges (note 21) – (1.9)
(28.1) (2.1)
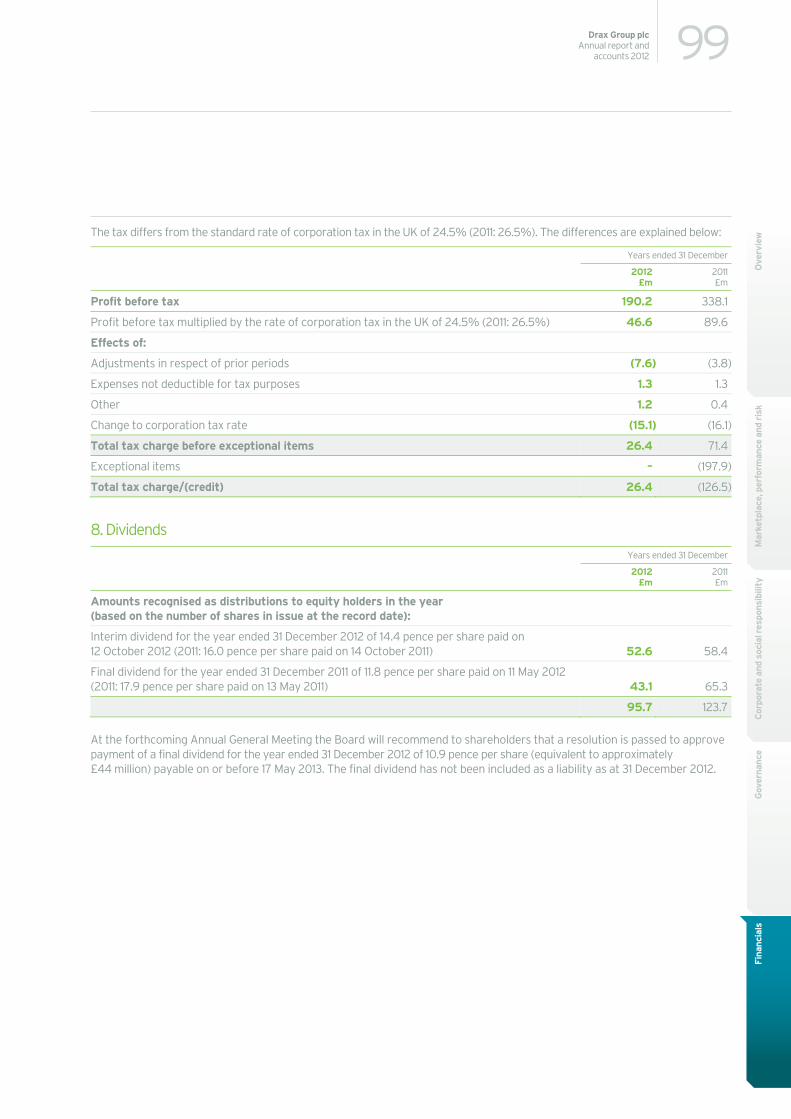
99Drax Group plcAnnual report and
accounts 2012
Mar
ketp
lace
, per
form
ance
and
ris
kC
orpo
rate
and
soc
ial r
espo
nsib
ility
Gov
erna
nce
Fina
ncia
lsO
verv
iewThe tax differs from the standard rate of corporation tax in the UK of 24.5% (2011: 26.5%). The differences are explained below:
Years ended 31 December
2012
£m 2011£m
Profit before tax 190.2 338.1
Profit before tax multiplied by the rate of corporation tax in the UK of 24.5% (2011: 26.5%) 46.6 89.6
Effects of:
Adjustments in respect of prior periods (7.6) (3.8)
Expenses not deductible for tax purposes 1.3 1.3
Other 1.2 0.4
Change to corporation tax rate (15.1) (16.1)
Total tax charge before exceptional items 26.4 71.4
Exceptional items – (197.9)
Total tax charge/(credit) 26.4 (126.5)
8. Dividends Years ended 31 December
2012
£m 2011£m
Amounts recognised as distributions to equity holders in the year (based on the number of shares in issue at the record date):
Interim dividend for the year ended 31 December 2012 of 14.4 pence per share paid on 12 October 2012 (2011: 16.0 pence per share paid on 14 October 2011) 52.6 58.4
Final dividend for the year ended 31 December 2011 of 11.8 pence per share paid on 11 May 2012 (2011: 17.9 pence per share paid on 13 May 2011) 43.1 65.3
95.7 123.7
At the forthcoming Annual General Meeting the Board will recommend to shareholders that a resolution is passed to approve payment of a final dividend for the year ended 31 December 2012 of 10.9 pence per share (equivalent to approximately £44 million) payable on or before 17 May 2013. The final dividend has not been included as a liability as at 31 December 2012.
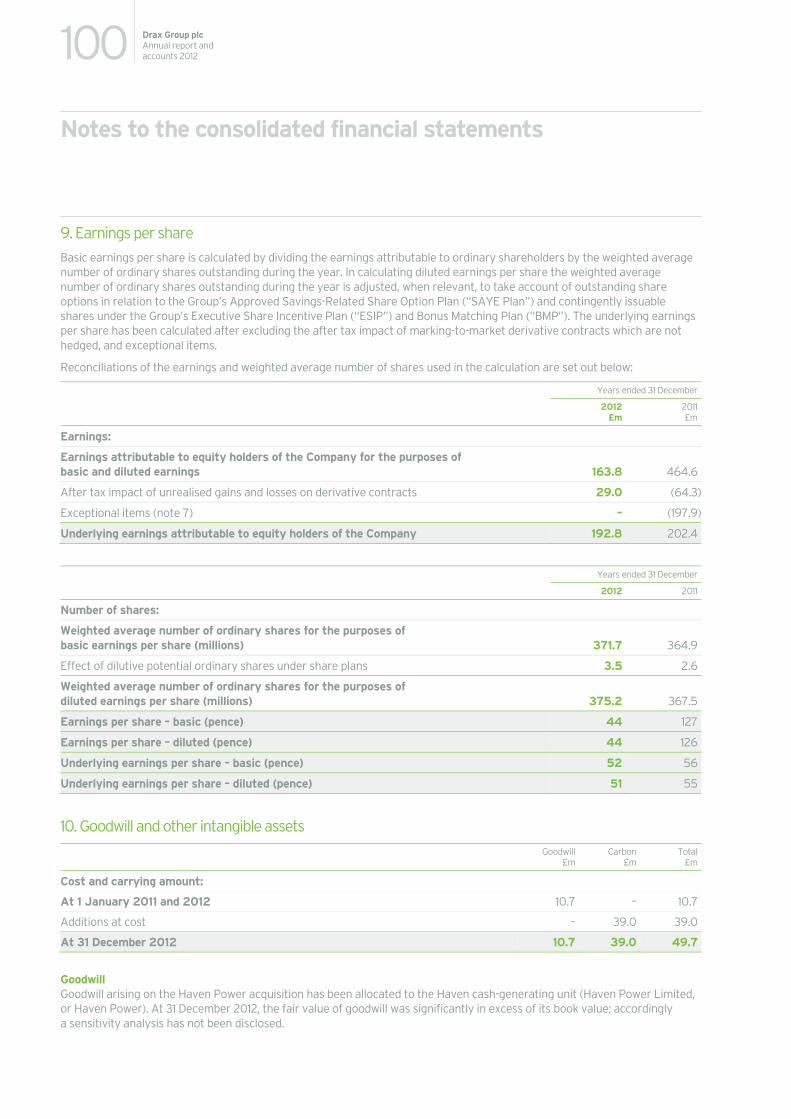
100 Drax Group plcAnnual report and accounts 2012
Notes to the consolidated financial statements
9. Earnings per share Basic earnings per share is calculated by dividing the earnings attributable to ordinary shareholders by the weighted average number of ordinary shares outstanding during the year. In calculating diluted earnings per share the weighted average number of ordinary shares outstanding during the year is adjusted, when relevant, to take account of outstanding share options in relation to the Group’s Approved Savings-Related Share Option Plan (“SAYE Plan”) and contingently issuable shares under the Group’s Executive Share Incentive Plan (“ESIP”) and Bonus Matching Plan (“BMP”). The underlying earnings per share has been calculated after excluding the after tax impact of marking-to-market derivative contracts which are not hedged, and exceptional items.
Reconciliations of the earnings and weighted average number of shares used in the calculation are set out below:
Years ended 31 December
2012 £m
2011£m
Earnings:
Earnings attributable to equity holders of the Company for the purposes of basic and diluted earnings 163.8 464.6
After tax impact of unrealised gains and losses on derivative contracts 29.0 (64.3)
Exceptional items (note 7) – (197.9)
Underlying earnings attributable to equity holders of the Company 192.8 202.4
Years ended 31 December
2012 2011
Number of shares:
Weighted average number of ordinary shares for the purposes of basic earnings per share (millions) 371.7 364.9
Effect of dilutive potential ordinary shares under share plans 3.5 2.6
Weighted average number of ordinary shares for the purposes of diluted earnings per share (millions) 375.2 367.5
Earnings per share – basic (pence) 44 127
Earnings per share – diluted (pence) 44 126
Underlying earnings per share – basic (pence) 52 56
Underlying earnings per share – diluted (pence) 51 55
10. Goodwill and other intangible assets Goodwill
£m Carbon
£m Total
£m
Cost and carrying amount:
At 1 January 2011 and 2012 10.7 – 10.7
Additions at cost – 39.0 39.0
At 31 December 2012 10.7 39.0 49.7
Goodwill Goodwill arising on the Haven Power acquisition has been allocated to the Haven cash-generating unit (Haven Power Limited, or Haven Power). At 31 December 2012, the fair value of goodwill was significantly in excess of its book value; accordingly a sensitivity analysis has not been disclosed.
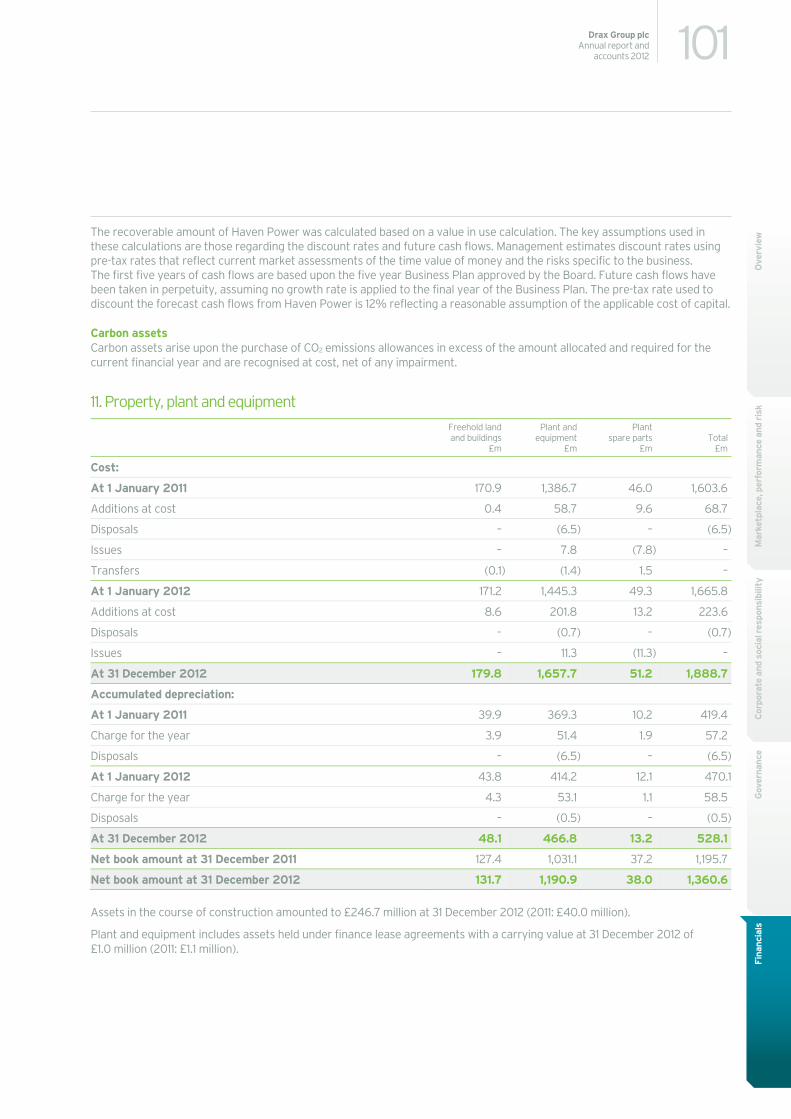
101Drax Group plcAnnual report and
accounts 2012
Mar
ketp
lace
, per
form
ance
and
ris
kC
orpo
rate
and
soc
ial r
espo
nsib
ility
Gov
erna
nce
Fina
ncia
lsO
verv
iewThe recoverable amount of Haven Power was calculated based on a value in use calculation. The key assumptions used in
these calculations are those regarding the discount rates and future cash flows. Management estimates discount rates using pre-tax rates that reflect current market assessments of the time value of money and the risks specific to the business. The first five years of cash flows are based upon the five year Business Plan approved by the Board. Future cash flows have been taken in perpetuity, assuming no growth rate is applied to the final year of the Business Plan. The pre-tax rate used to discount the forecast cash flows from Haven Power is 12% reflecting a reasonable assumption of the applicable cost of capital.
Carbon assets Carbon assets arise upon the purchase of CO2 emissions allowances in excess of the amount allocated and required for the current financial year and are recognised at cost, net of any impairment.
11. Property, plant and equipment Freehold land and buildings
£m
Plant and equipment
£m
Plant spare parts
£m Total
£m
Cost:
At 1 January 2011 170.9 1,386.7 46.0 1,603.6
Additions at cost 0.4 58.7 9.6 68.7
Disposals – (6.5) – (6.5)
Issues – 7.8 (7.8) –
Transfers (0.1) (1.4) 1.5 –
At 1 January 2012 171.2 1,445.3 49.3 1,665.8
Additions at cost 8.6 201.8 13.2 223.6
Disposals – (0.7) – (0.7)
Issues – 11.3 (11.3) –
At 31 December 2012 179.8 1,657.7 51.2 1,888.7
Accumulated depreciation:
At 1 January 2011 39.9 369.3 10.2 419.4
Charge for the year 3.9 51.4 1.9 57.2
Disposals – (6.5) – (6.5)
At 1 January 2012 43.8 414.2 12.1 470.1
Charge for the year 4.3 53.1 1.1 58.5
Disposals – (0.5) – (0.5)
At 31 December 2012 48.1 466.8 13.2 528.1
Net book amount at 31 December 2011 127.4 1,031.1 37.2 1,195.7
Net book amount at 31 December 2012 131.7 1,190.9 38.0 1,360.6
Assets in the course of construction amounted to £246.7 million at 31 December 2012 (2011: £40.0 million).
Plant and equipment includes assets held under finance lease agreements with a carrying value at 31 December 2012 of £1.0 million (2011: £1.1 million).
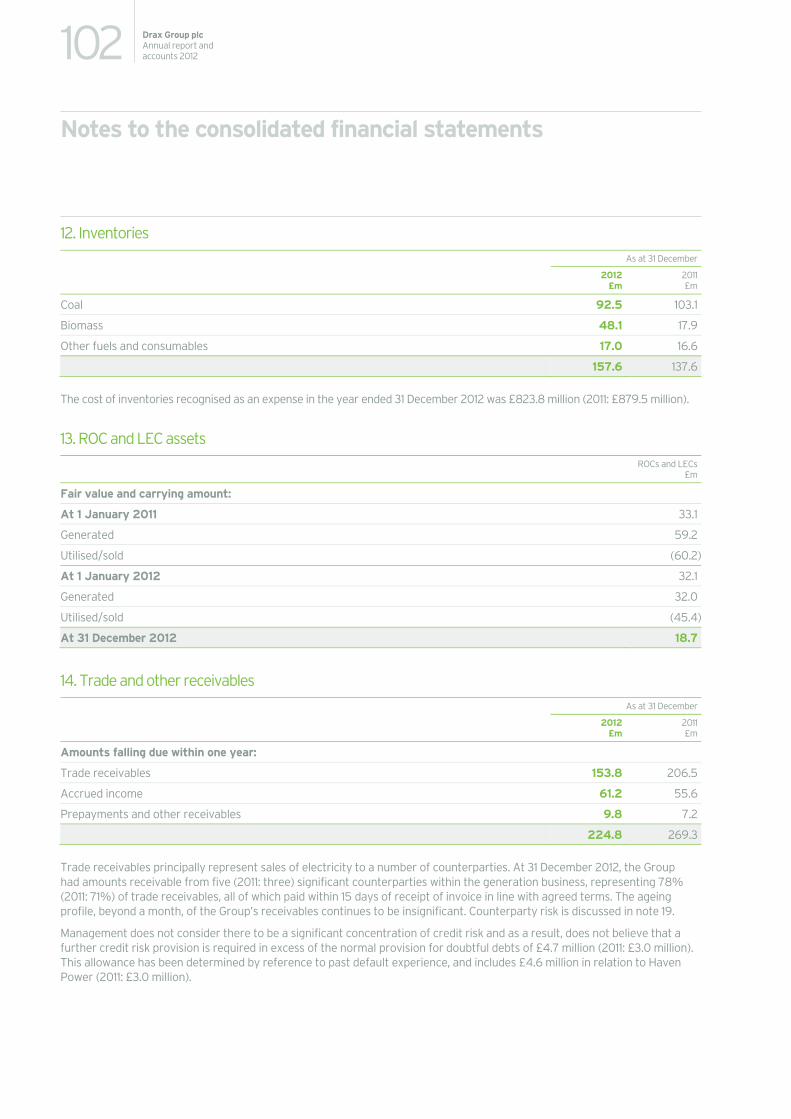
102 Drax Group plcAnnual report and accounts 2012
Notes to the consolidated financial statements
12. Inventories As at 31 December
2012 £m
2011£m
Coal 92.5 103.1
Biomass 48.1 17.9
Other fuels and consumables 17.0 16.6
157.6 137.6
The cost of inventories recognised as an expense in the year ended 31 December 2012 was £823.8 million (2011: £879.5 million).
13. ROC and LEC assets
ROCs and LECs
£m
Fair value and carrying amount:
At 1 January 2011 33.1
Generated 59.2
Utilised/sold (60.2)
At 1 January 2012 32.1
Generated 32.0
Utilised/sold (45.4)
At 31 December 2012 18.7
14. Trade and other receivables As at 31 December
2012 £m
2011£m
Amounts falling due within one year:
Trade receivables 153.8 206.5
Accrued income 61.2 55.6
Prepayments and other receivables 9.8 7.2
224.8 269.3
Trade receivables principally represent sales of electricity to a number of counterparties. At 31 December 2012, the Group had amounts receivable from five (2011: three) significant counterparties within the generation business, representing 78% (2011: 71%) of trade receivables, all of which paid within 15 days of receipt of invoice in line with agreed terms. The ageing profile, beyond a month, of the Group’s receivables continues to be insignificant. Counterparty risk is discussed in note 19.
Management does not consider there to be a significant concentration of credit risk and as a result, does not believe that a further credit risk provision is required in excess of the normal provision for doubtful debts of £4.7 million (2011: £3.0 million). This allowance has been determined by reference to past default experience, and includes £4.6 million in relation to Haven Power (2011: £3.0 million).
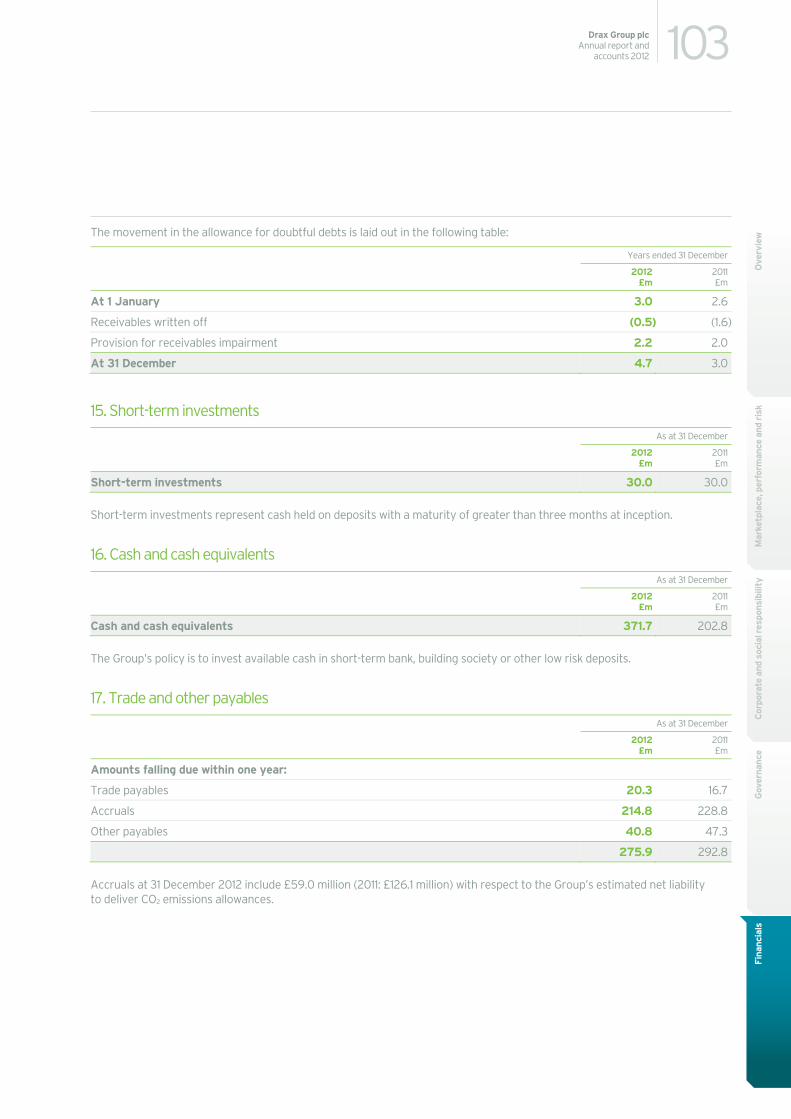
103Drax Group plcAnnual report and
accounts 2012
Mar
ketp
lace
, per
form
ance
and
ris
kC
orpo
rate
and
soc
ial r
espo
nsib
ility
Gov
erna
nce
Fina
ncia
lsO
verv
iewThe movement in the allowance for doubtful debts is laid out in the following table:
Years ended 31 December
2012
£m 2011£m
At 1 January 3.0 2.6
Receivables written off (0.5) (1.6)
Provision for receivables impairment 2.2 2.0
At 31 December 4.7 3.0
15. Short-term investments As at 31 December
2012
£m 2011£m
Short-term investments 30.0 30.0
Short-term investments represent cash held on deposits with a maturity of greater than three months at inception.
16. Cash and cash equivalents As at 31 December
2012
£m 2011£m
Cash and cash equivalents 371.7 202.8
The Group’s policy is to invest available cash in short-term bank, building society or other low risk deposits.
17. Trade and other payables As at 31 December
2012
£m 2011£m
Amounts falling due within one year:
Trade payables 20.3 16.7
Accruals 214.8 228.8
Other payables 40.8 47.3
275.9 292.8
Accruals at 31 December 2012 include £59.0 million (2011: £126.1 million) with respect to the Group’s estimated net liability to deliver CO2 emissions allowances.
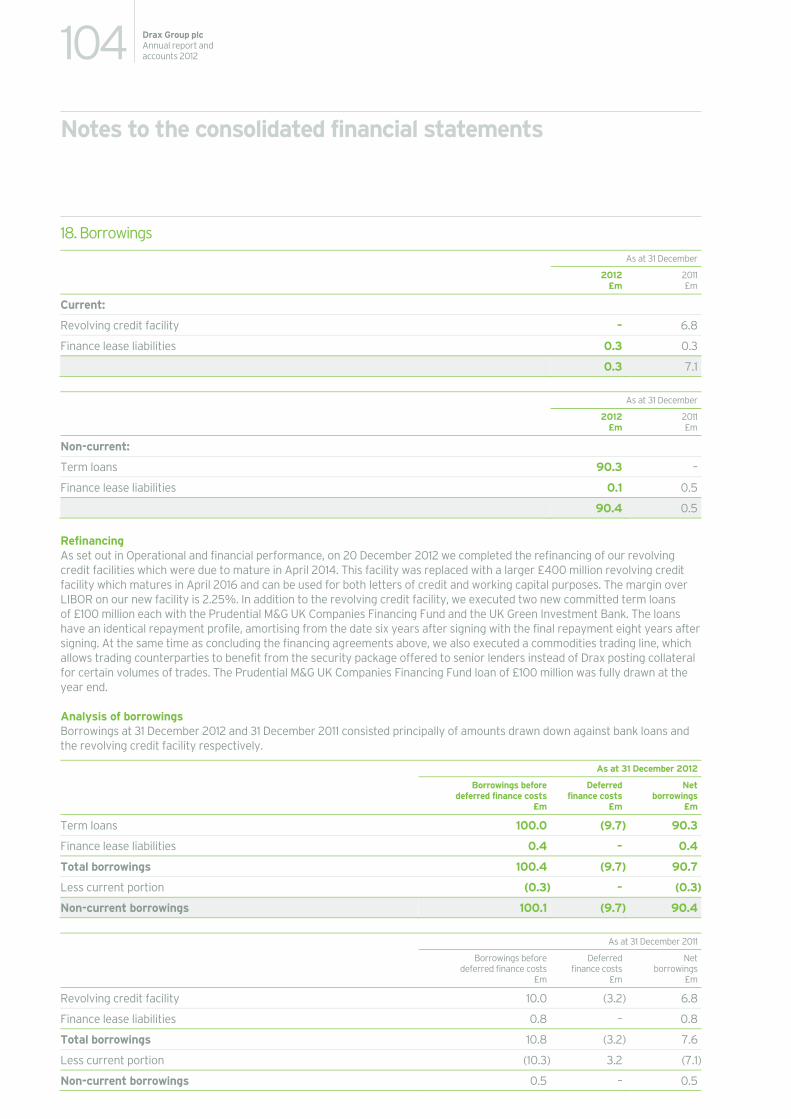
104 Drax Group plcAnnual report and accounts 2012
Notes to the consolidated financial statements
18. Borrowings As at 31 December
2012 £m
2011£m
Current:
Revolving credit facility – 6.8
Finance lease liabilities 0.3 0.3
0.3 7.1
As at 31 December
2012 £m
2011£m
Non-current:
Term loans 90.3 –
Finance lease liabilities 0.1 0.5
90.4 0.5
Refinancing As set out in Operational and financial performance, on 20 December 2012 we completed the refinancing of our revolving credit facilities which were due to mature in April 2014. This facility was replaced with a larger £400 million revolving credit facility which matures in April 2016 and can be used for both letters of credit and working capital purposes. The margin over LIBOR on our new facility is 2.25%. In addition to the revolving credit facility, we executed two new committed term loans of £100 million each with the Prudential M&G UK Companies Financing Fund and the UK Green Investment Bank. The loans have an identical repayment profile, amortising from the date six years after signing with the final repayment eight years after signing. At the same time as concluding the financing agreements above, we also executed a commodities trading line, which allows trading counterparties to benefit from the security package offered to senior lenders instead of Drax posting collateral for certain volumes of trades. The Prudential M&G UK Companies Financing Fund loan of £100 million was fully drawn at the year end.
Analysis of borrowings Borrowings at 31 December 2012 and 31 December 2011 consisted principally of amounts drawn down against bank loans and the revolving credit facility respectively.
As at 31 December 2012
Borrowings before deferred finance costs
£m
Deferred finance costs
£m
Net borrowings
£m
Term loans 100.0 (9.7) 90.3
Finance lease liabilities 0.4 – 0.4
Total borrowings 100.4 (9.7) 90.7
Less current portion (0.3) – (0.3)
Non-current borrowings 100.1 (9.7) 90.4
As at 31 December 2011
Borrowings before deferred finance costs
£m
Deferred finance costs
£m
Net borrowings
£m
Revolving credit facility 10.0 (3.2) 6.8
Finance lease liabilities 0.8 – 0.8
Total borrowings 10.8 (3.2) 7.6
Less current portion (10.3) 3.2 (7.1)
Non-current borrowings 0.5 – 0.5
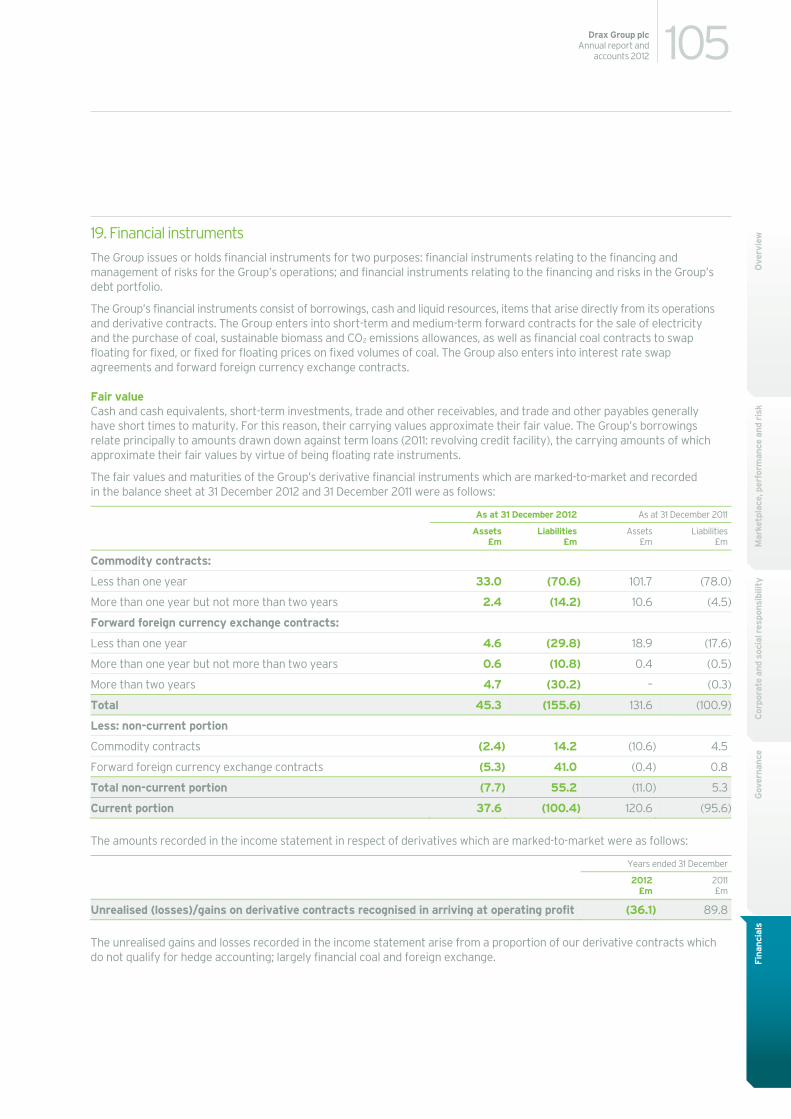
105Drax Group plcAnnual report and
accounts 2012
Mar
ketp
lace
, per
form
ance
and
ris
kC
orpo
rate
and
soc
ial r
espo
nsib
ility
Gov
erna
nce
Fina
ncia
lsO
verv
iew19. Financial instruments
The Group issues or holds financial instruments for two purposes: financial instruments relating to the financing and management of risks for the Group’s operations; and financial instruments relating to the financing and risks in the Group’s debt portfolio.
The Group’s financial instruments consist of borrowings, cash and liquid resources, items that arise directly from its operations and derivative contracts. The Group enters into short-term and medium-term forward contracts for the sale of electricity and the purchase of coal, sustainable biomass and CO2 emissions allowances, as well as financial coal contracts to swap floating for fixed, or fixed for floating prices on fixed volumes of coal. The Group also enters into interest rate swap agreements and forward foreign currency exchange contracts.
Fair value Cash and cash equivalents, short-term investments, trade and other receivables, and trade and other payables generally have short times to maturity. For this reason, their carrying values approximate their fair value. The Group’s borrowings relate principally to amounts drawn down against term loans (2011: revolving credit facility), the carrying amounts of which approximate their fair values by virtue of being floating rate instruments.
The fair values and maturities of the Group’s derivative financial instruments which are marked-to-market and recorded in the balance sheet at 31 December 2012 and 31 December 2011 were as follows:
As at 31 December 2012 As at 31 December 2011
Assets £m
Liabilities £m
Assets £m
Liabilities£m
Commodity contracts:
Less than one year 33.0 (70.6) 101.7 (78.0)
More than one year but not more than two years 2.4 (14.2) 10.6 (4.5)
Forward foreign currency exchange contracts:
Less than one year 4.6 (29.8) 18.9 (17.6)
More than one year but not more than two years 0.6 (10.8) 0.4 (0.5)
More than two years 4.7 (30.2) – (0.3)
Total 45.3 (155.6) 131.6 (100.9)
Less: non-current portion
Commodity contracts (2.4) 14.2 (10.6) 4.5
Forward foreign currency exchange contracts (5.3) 41.0 (0.4) 0.8
Total non-current portion (7.7) 55.2 (11.0) 5.3
Current portion 37.6 (100.4) 120.6 (95.6)
The amounts recorded in the income statement in respect of derivatives which are marked-to-market were as follows:
Years ended 31 December
2012
£m 2011£m
Unrealised (losses)/gains on derivative contracts recognised in arriving at operating profit (36.1) 89.8
The unrealised gains and losses recorded in the income statement arise from a proportion of our derivative contracts which do not qualify for hedge accounting; largely financial coal and foreign exchange.
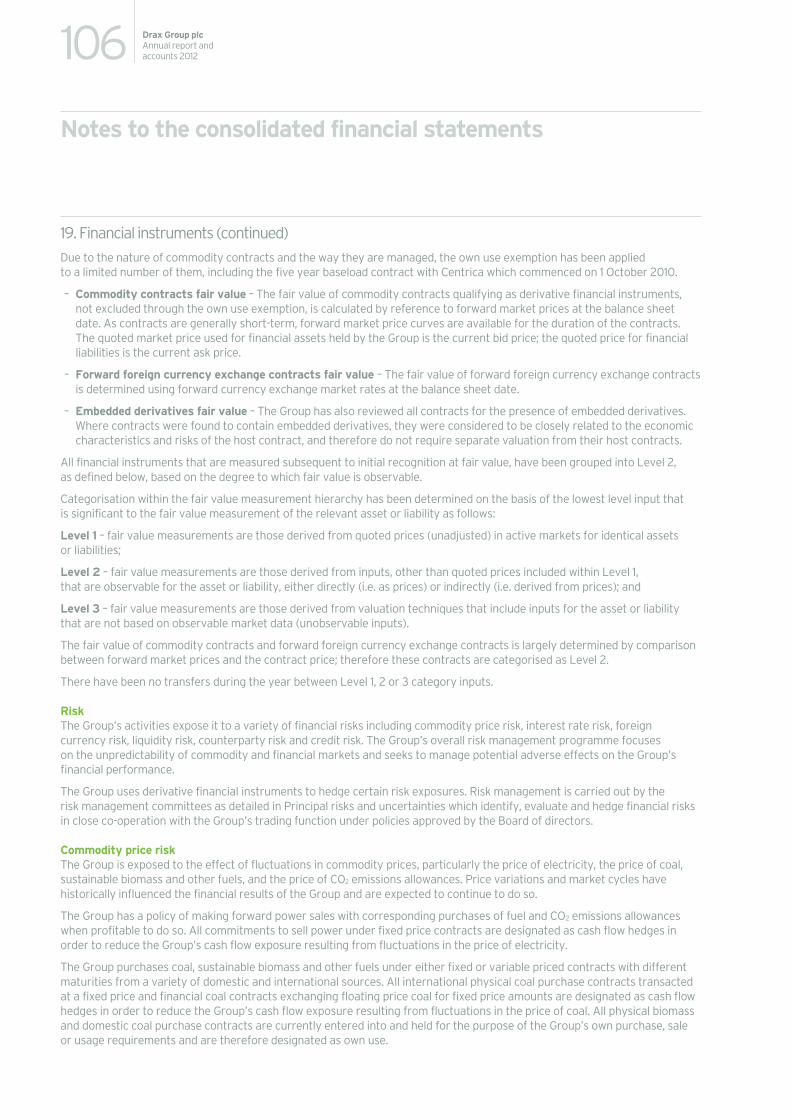
106 Drax Group plcAnnual report and accounts 2012
Notes to the consolidated financial statements
19. Financial instruments (continued) Due to the nature of commodity contracts and the way they are managed, the own use exemption has been applied to a limited number of them, including the five year baseload contract with Centrica which commenced on 1 October 2010.
– Commodity contracts fair value – The fair value of commodity contracts qualifying as derivative financial instruments, not excluded through the own use exemption, is calculated by reference to forward market prices at the balance sheet date. As contracts are generally short-term, forward market price curves are available for the duration of the contracts. The quoted market price used for financial assets held by the Group is the current bid price; the quoted price for financial liabilities is the current ask price.
– Forward foreign currency exchange contracts fair value – The fair value of forward foreign currency exchange contracts is determined using forward currency exchange market rates at the balance sheet date.
– Embedded derivatives fair value – The Group has also reviewed all contracts for the presence of embedded derivatives. Where contracts were found to contain embedded derivatives, they were considered to be closely related to the economic characteristics and risks of the host contract, and therefore do not require separate valuation from their host contracts.
All financial instruments that are measured subsequent to initial recognition at fair value, have been grouped into Level 2, as defined below, based on the degree to which fair value is observable.
Categorisation within the fair value measurement hierarchy has been determined on the basis of the lowest level input that is significant to the fair value measurement of the relevant asset or liability as follows:
Level 1 – fair value measurements are those derived from quoted prices (unadjusted) in active markets for identical assets or liabilities;
Level 2 – fair value measurements are those derived from inputs, other than quoted prices included within Level 1, that are observable for the asset or liability, either directly (i.e. as prices) or indirectly (i.e. derived from prices); and
Level 3 – fair value measurements are those derived from valuation techniques that include inputs for the asset or liability that are not based on observable market data (unobservable inputs).
The fair value of commodity contracts and forward foreign currency exchange contracts is largely determined by comparison between forward market prices and the contract price; therefore these contracts are categorised as Level 2.
There have been no transfers during the year between Level 1, 2 or 3 category inputs.
Risk The Group’s activities expose it to a variety of financial risks including commodity price risk, interest rate risk, foreign currency risk, liquidity risk, counterparty risk and credit risk. The Group’s overall risk management programme focuses on the unpredictability of commodity and financial markets and seeks to manage potential adverse effects on the Group’s financial performance.
The Group uses derivative financial instruments to hedge certain risk exposures. Risk management is carried out by the
in close co-operation with the Group’s trading function under policies approved by the Board of directors.
Commodity price risk The Group is exposed to the effect of fluctuations in commodity prices, particularly the price of electricity, the price of coal, sustainable biomass and other fuels, and the price of CO2 emissions allowances. Price variations and market cycles have historically influenced the financial results of the Group and are expected to continue to do so.
The Group has a policy of making forward power sales with corresponding purchases of fuel and CO2 emissions allowances when profitable to do so. All commitments to sell power under fixed price contracts are designated as cash flow hedges in order to reduce the Group’s cash flow exposure resulting from fluctuations in the price of electricity.
The Group purchases coal, sustainable biomass and other fuels under either fixed or variable priced contracts with different maturities from a variety of domestic and international sources. All international physical coal purchase contracts transacted at a fixed price and financial coal contracts exchanging floating price coal for fixed price amounts are designated as cash flow hedges in order to reduce the Group’s cash flow exposure resulting from fluctuations in the price of coal. All physical biomass and domestic coal purchase contracts are currently entered into and held for the purpose of the Group’s own purchase, sale or usage requirements and are therefore designated as own use.
risk management committees as detailed in Principal risks and uncertainties which identify, evaluate and hedge financial risks
107Drax Group plcAnnual report and
accounts 2012
Mar
ketp
lace
, per
form
ance
and
ris
kC
orpo
rate
and
soc
ial r
espo
nsib
ility
Gov
erna
nce
Fina
ncia
lsO
verv
iewThe Group purchases CO2 emissions allowances under fixed price contracts with different maturity dates from a range
of domestic and international sources. All commitments to purchase CO2 emissions allowances under fixed price contracts are designated as cash flow hedges in order to reduce the Group’s cash flow exposure resulting from fluctuations in the price of CO2 emissions allowances.
Commodity price sensitivity The sensitivity analysis below has been determined based on the exposure to commodity prices for outstanding monetary items at the balance sheet date. The analysis is based on the Group’s commodity financial instruments held at each balance sheet date.
If commodity prices had been 5% higher/lower and all other variables were held constant, the Group’s:
– profit after tax for the year ended 31 December 2012 would increase/decrease by £5.4 million (2011: decrease/increase by £7.2 million). This is mainly attributable to the Group’s exposure to financial coal derivatives; and
– other equity reserves would decrease/increase by £32.0 million (2011: decrease/increase by £10.5 million) mainly as a result of the changes in the fair value of commitments to sell power.
Interest rate risk Historically the Group has been exposed to interest rate risk principally in relation to its bank debt, and has sought to mitigate this risk with interest rate hedges on a proportion of its debt facilities. On refinancing in December 2012 (see note 18), the Group repaid its outstanding balance against the revolving credit facility, and drew down £100 million of new term loans. No new interest rate swaps have been taken out to the date of the approval of these consolidated financial statements; however this risk management tool remains available to the Group. Information about the Group’s instruments that are exposed to interest rate risk and their repayment schedules is included in note 18.
Interest rate sensitivity The sensitivity analysis below has been determined based on the exposure to interest rates for both derivatives and non-derivative instruments at the balance sheet date. For floating rate liabilities, the analysis is prepared assuming the amount of liability outstanding at the balance sheet date was outstanding for the whole year.
If interest rates had been 1% higher/lower and all other variables were held constant, the Group’s profit after tax and net assets for the year ended 31 December 2012 would decrease/increase by £0.2 million (2011: increase/decrease by £0.8 million) as a result of the changes in interest payable during the period.
Foreign currency risk Foreign currency exchange contracts are entered into to hedge fixed price international coal purchases in US dollars, biomass purchases in Canadian dollars, US dollars and euros, and CO2 emissions allowances purchases in euros. As we progress our biomass transformation plans, we are entering into an increasing volume of forward foreign exchange contracts. Exchange rate exposures are managed within approved policy parameters utilising a variety of foreign currency exchange contracts.
Foreign currency sensitivity If sterling exchange rates had been 5% stronger/weaker against other currencies and all other variables were held constant, the Group’s:
– profit after tax for the year ended 31 December 2012 would decrease/increase by £86.5 million (2011: decrease/increase by £21.2 million). This is mainly attributable to the Group’s exposure to foreign currency exchange contracts entered into in relation to biomass purchase (2011: financial coal) contracts; and
– other equity reserves would decrease/increase by £1.1 million (2011: decrease/increase by £4.9 million) as a result of the changes in the fair value of hedged foreign currency exchange contracts.
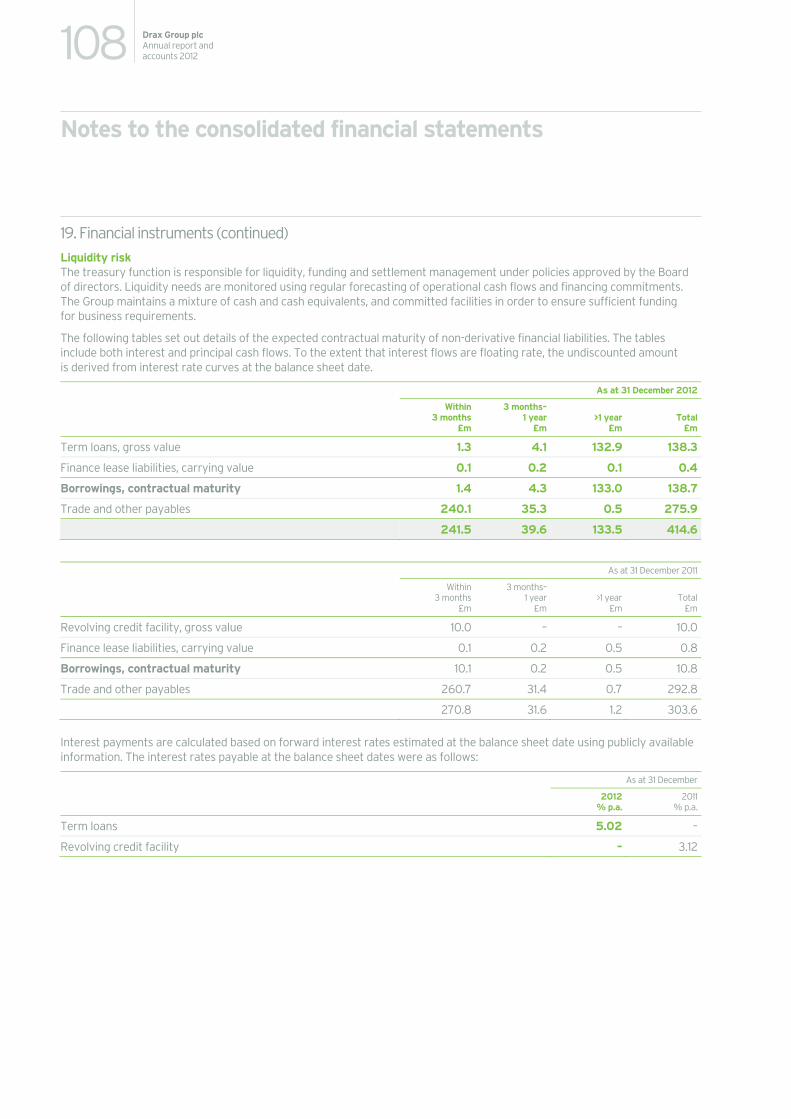
108 Drax Group plcAnnual report and accounts 2012
Notes to the consolidated financial statements
19. Financial instruments (continued) Liquidity risk The treasury function is responsible for liquidity, funding and settlement management under policies approved by the Board of directors. Liquidity needs are monitored using regular forecasting of operational cash flows and financing commitments. The Group maintains a mixture of cash and cash equivalents, and committed facilities in order to ensure sufficient funding for business requirements.
The following tables set out details of the expected contractual maturity of non-derivative financial liabilities. The tables include both interest and principal cash flows. To the extent that interest flows are floating rate, the undiscounted amount is derived from interest rate curves at the balance sheet date.
As at 31 December 2012
Within 3 months
£m
3 months– 1 year
£m>1 year
£m Total
£m
Term loans, gross value 1.3 4.1 132.9 138.3
Finance lease liabilities, carrying value 0.1 0.2 0.1 0.4
Borrowings, contractual maturity 1.4 4.3 133.0 138.7
Trade and other payables 240.1 35.3 0.5 275.9
241.5 39.6 133.5 414.6
As at 31 December 2011
Within 3 months
£m
3 months– 1 year
£m>1 year
£m Total
£m
Revolving credit facility, gross value 10.0 – – 10.0
Finance lease liabilities, carrying value 0.1 0.2 0.5 0.8
Borrowings, contractual maturity 10.1 0.2 0.5 10.8
Trade and other payables 260.7 31.4 0.7 292.8
270.8 31.6 1.2 303.6
Interest payments are calculated based on forward interest rates estimated at the balance sheet date using publicly available information. The interest rates payable at the balance sheet dates were as follows:
As at 31 December
2012 % p.a.
2011% p.a.
Term loans 5.02 –
Revolving credit facility – 3.12
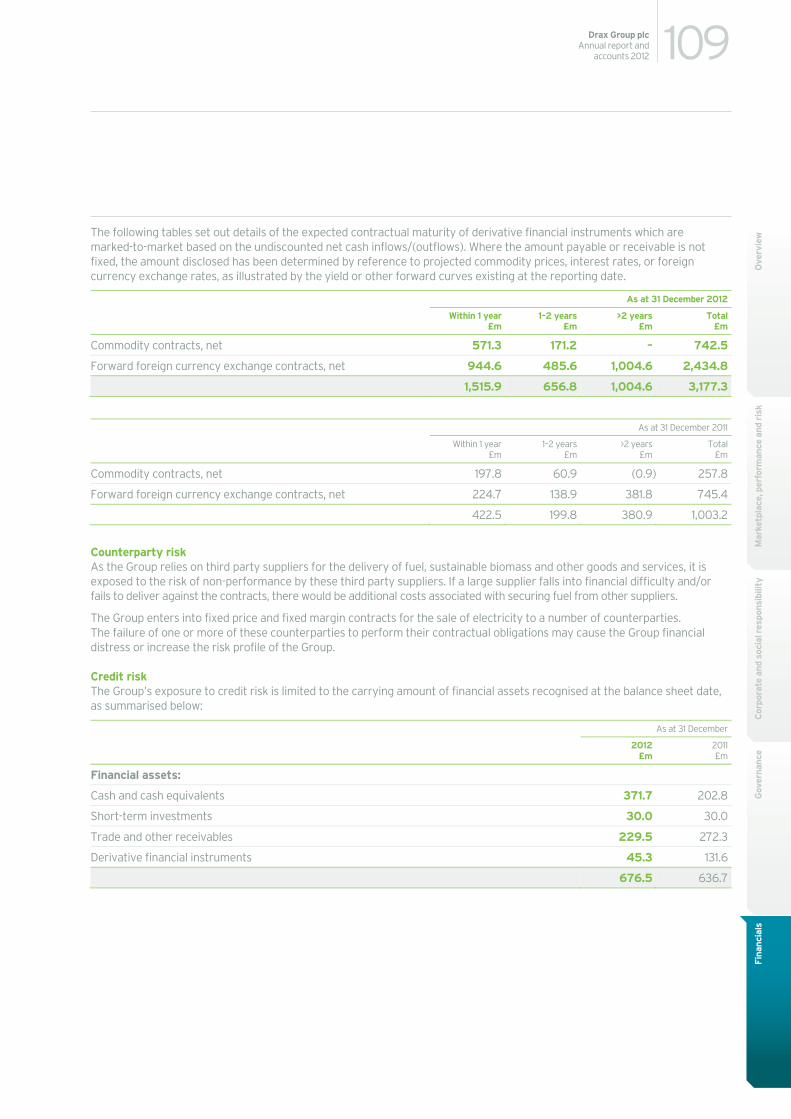
109Drax Group plcAnnual report and
accounts 2012
Mar
ketp
lace
, per
form
ance
and
ris
kC
orpo
rate
and
soc
ial r
espo
nsib
ility
Gov
erna
nce
Fina
ncia
lsO
verv
iewThe following tables set out details of the expected contractual maturity of derivative financial instruments which are
marked-to-market based on the undiscounted net cash inflows/(outflows). Where the amount payable or receivable is not fixed, the amount disclosed has been determined by reference to projected commodity prices, interest rates, or foreign currency exchange rates, as illustrated by the yield or other forward curves existing at the reporting date.
As at 31 December 2012
Within 1 year£m
1–2 years £m
>2 years £m
Total£m
Commodity contracts, net 571.3 171.2 – 742.5
Forward foreign currency exchange contracts, net 944.6 485.6 1,004.6 2,434.8
1,515.9 656.8 1,004.6 3,177.3
As at 31 December 2011
Within 1 year£m
1–2 years £m
>2 years £m
Total£m
Commodity contracts, net 197.8 60.9 (0.9) 257.8
Forward foreign currency exchange contracts, net 224.7 138.9 381.8 745.4
422.5 199.8 380.9 1,003.2
Counterparty risk As the Group relies on third party suppliers for the delivery of fuel, sustainable biomass and other goods and services, it is exposed to the risk of non-performance by these third party suppliers. If a large supplier falls into financial difficulty and/or fails to deliver against the contracts, there would be additional costs associated with securing fuel from other suppliers.
The Group enters into fixed price and fixed margin contracts for the sale of electricity to a number of counterparties. The failure of one or more of these counterparties to perform their contractual obligations may cause the Group financial distress or increase the risk profile of the Group.
Credit risk The Group’s exposure to credit risk is limited to the carrying amount of financial assets recognised at the balance sheet date, as summarised below:
As at 31 December
2012
£m 2011£m
Financial assets:
Cash and cash equivalents 371.7 202.8
Short-term investments 30.0 30.0
Trade and other receivables 229.5 272.3
Derivative financial instruments 45.3 131.6
676.5 636.7
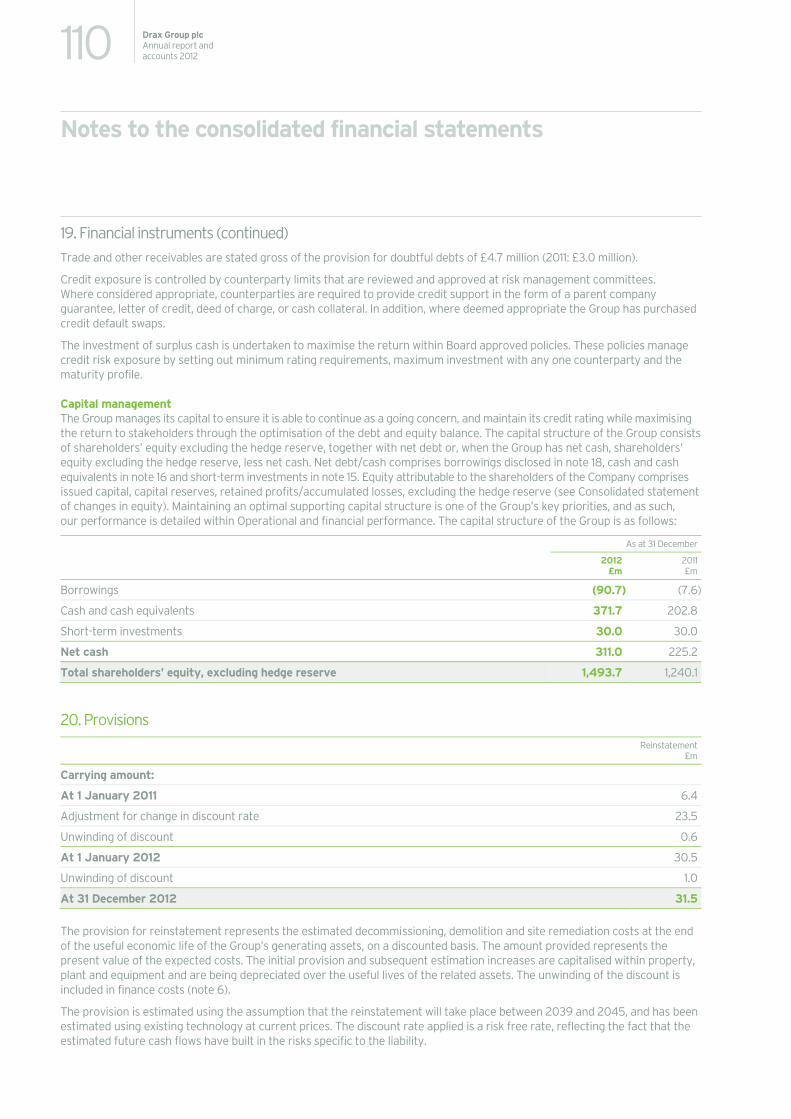
110 Drax Group plcAnnual report and accounts 2012
Notes to the consolidated financial statements
19. Financial instruments (continued) Trade and other receivables are stated gross of the provision for doubtful debts of £4.7 million (2011: £3.0 million).
Credit exposure is controlled by counterparty limits that are reviewed and approved at risk management committees. Where considered appropriate, counterparties are required to provide credit support in the form of a parent company guarantee, letter of credit, deed of charge, or cash collateral. In addition, where deemed appropriate the Group has purchased credit default swaps.
The investment of surplus cash is undertaken to maximise the return within Board approved policies. These policies manage credit risk exposure by setting out minimum rating requirements, maximum investment with any one counterparty and the maturity profile.
Capital management The Group manages its capital to ensure it is able to continue as a going concern, and maintain its credit rating while maximising the return to stakeholders through the optimisation of the debt and equity balance. The capital structure of the Group consists of shareholders’ equity excluding the hedge reserve, together with net debt or, when the Group has net cash, shareholders’ equity excluding the hedge reserve, less net cash. Net debt/cash comprises borrowings disclosed in note 18, cash and cash equivalents in note 16 and short-term investments in note 15. Equity attributable to the shareholders of the Company comprises issued capital, capital reserves, retained profits/accumulated losses, excluding the hedge reserve (see Consolidated statement of changes in equity). Maintaining an optimal supporting capital structure is one of the Group’s key priorities, and as such, our performance is detailed within Operational and financial performance. The capital structure of the Group is as follows:
As at 31 December
2012 £m
2011£m
Borrowings (90.7) (7.6)
Cash and cash equivalents 371.7 202.8
Short-term investments 30.0 30.0
Net cash 311.0 225.2
Total shareholders’ equity, excluding hedge reserve 1,493.7 1,240.1
20. Provisions
Reinstatement
£m
Carrying amount:
At 1 January 2011 6.4
Adjustment for change in discount rate 23.5
Unwinding of discount 0.6
At 1 January 2012 30.5
Unwinding of discount 1.0
At 31 December 2012 31.5
The provision for reinstatement represents the estimated decommissioning, demolition and site remediation costs at the end of the useful economic life of the Group’s generating assets, on a discounted basis. The amount provided represents the present value of the expected costs. The initial provision and subsequent estimation increases are capitalised within property, plant and equipment and are being depreciated over the useful lives of the related assets. The unwinding of the discount is included in finance costs (note 6).
The provision is estimated using the assumption that the reinstatement will take place between 2039 and 2045, and has been estimated using existing technology at current prices. The discount rate applied is a risk free rate, reflecting the fact that the estimated future cash flows have built in the risks specific to the liability.
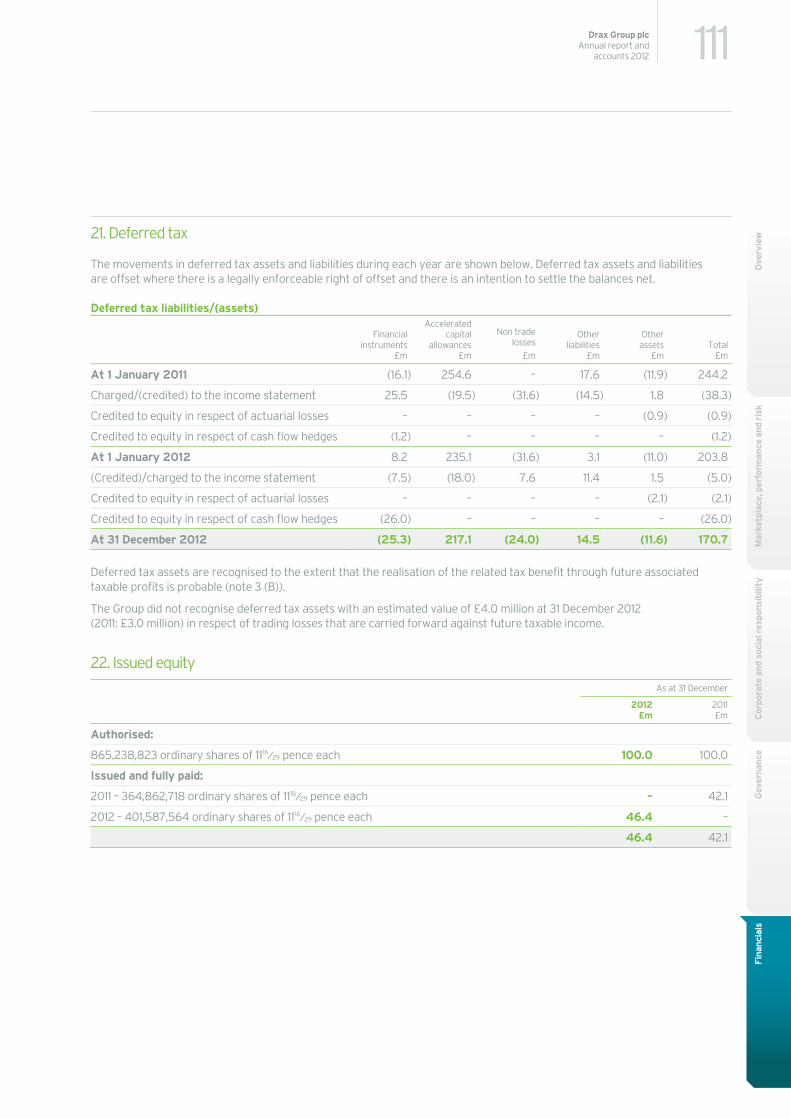
111Drax Group plcAnnual report and
accounts 2012
Mar
ketp
lace
, per
form
ance
and
ris
kC
orpo
rate
and
soc
ial r
espo
nsib
ility
Gov
erna
nce
Fina
ncia
lsO
verv
iew21. Deferred tax
The movements in deferred tax assets and liabilities during each year are shown below. Deferred tax assets and liabilities are offset where there is a legally enforceable right of offset and there is an intention to settle the balances net.
Deferred tax liabilities/(assets)
Financial instruments
£m
Accelerated capital
allowances£m
Non trade losses
£m
Other liabilities
£m
Other assets
£mTotal
£m
At 1 January 2011 (16.1) 254.6 – 17.6 (11.9) 244.2
Charged/(credited) to the income statement 25.5 (19.5) (31.6) (14.5) 1.8 (38.3)
Credited to equity in respect of actuarial losses – – – – (0.9) (0.9)
Credited to equity in respect of cash flow hedges (1.2) – – – – (1.2)
At 1 January 2012 8.2 235.1 (31.6) 3.1 (11.0) 203.8
(Credited)/charged to the income statement (7.5) (18.0) 7.6 11.4 1.5 (5.0)
Credited to equity in respect of actuarial losses – – – – (2.1) (2.1)
Credited to equity in respect of cash flow hedges (26.0) – – – – (26.0)
At 31 December 2012 (25.3) 217.1 (24.0) 14.5 (11.6) 170.7
Deferred tax assets are recognised to the extent that the realisation of the related tax benefit through future associated taxable profits is probable (note 3 (B)).
The Group did not recognise deferred tax assets with an estimated value of £4.0 million at 31 December 2012 (2011: £3.0 million) in respect of trading losses that are carried forward against future taxable income.
22. Issued equity As at 31 December
2012
£m 2011£m
Authorised:
865,238,823 ordinary shares of 1116⁄29 pence each 100.0 100.0
Issued and fully paid:
2011 – 364,862,718 ordinary shares of 1116⁄29 pence each – 42.1
2012 – 401,587,564 ordinary shares of 1116⁄29 pence each 46.4 –
46.4 42.1
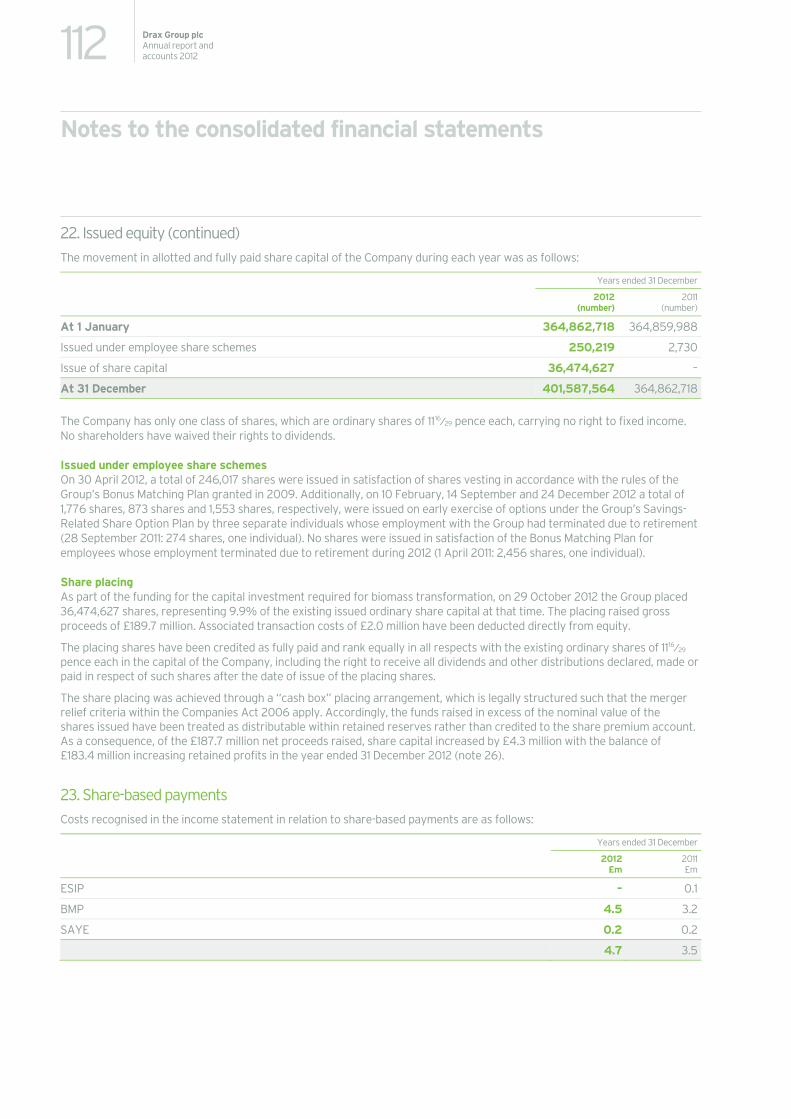
112 Drax Group plcAnnual report and accounts 2012
Notes to the consolidated financial statements
22. Issued equity (continued) The movement in allotted and fully paid share capital of the Company during each year was as follows:
Years ended 31 December
2012 (number)
2011(number)
At 1 January 364,862,718 364,859,988
Issued under employee share schemes 250,219 2,730
Issue of share capital 36,474,627 –
At 31 December 401,587,564 364,862,718
The Company has only one class of shares, which are ordinary shares of 1116⁄29 pence each, carrying no right to fixed income. No shareholders have waived their rights to dividends.
Issued under employee share schemes On 30 April 2012, a total of 246,017 shares were issued in satisfaction of shares vesting in accordance with the rules of the Group’s Bonus Matching Plan granted in 2009. Additionally, on 10 February, 14 September and 24 December 2012 a total of 1,776 shares, 873 shares and 1,553 shares, respectively, were issued on early exercise of options under the Group’s Savings-Related Share Option Plan by three separate individuals whose employment with the Group had terminated due to retirement (28 September 2011: 274 shares, one individual). No shares were issued in satisfaction of the Bonus Matching Plan for employees whose employment terminated due to retirement during 2012 (1 April 2011: 2,456 shares, one individual).
Share placing As part of the funding for the capital investment required for biomass transformation, on 29 October 2012 the Group placed 36,474,627 shares, representing 9.9% of the existing issued ordinary share capital at that time. The placing raised gross proceeds of £189.7 million. Associated transaction costs of £2.0 million have been deducted directly from equity.
The placing shares have been credited as fully paid and rank equally in all respects with the existing ordinary shares of 1116⁄29 pence each in the capital of the Company, including the right to receive all dividends and other distributions declared, made or paid in respect of such shares after the date of issue of the placing shares.
The share placing was achieved through a “cash box” placing arrangement, which is legally structured such that the merger relief criteria within the Companies Act 2006 apply. Accordingly, the funds raised in excess of the nominal value of the shares issued have been treated as distributable within retained reserves rather than credited to the share premium account. As a consequence, of the £187.7 million net proceeds raised, share capital increased by £4.3 million with the balance of £183.4 million increasing retained profits in the year ended 31 December 2012 (note 26).
23. Share-based payments Costs recognised in the income statement in relation to share-based payments are as follows:
Years ended 31 December
2012 £m
2011£m
ESIP – 0.1
BMP 4.5 3.2
SAYE 0.2 0.2
4.7 3.5
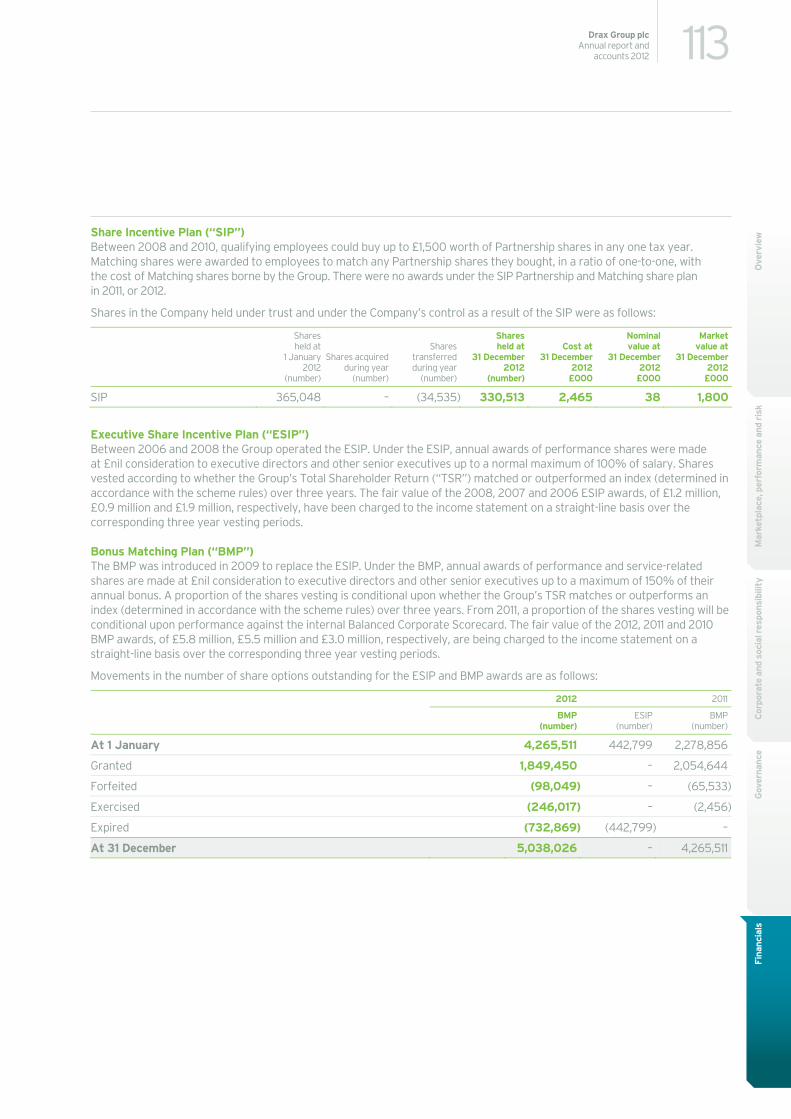
113Drax Group plcAnnual report and
accounts 2012
Mar
ketp
lace
, per
form
ance
and
ris
kC
orpo
rate
and
soc
ial r
espo
nsib
ility
Gov
erna
nce
Fina
ncia
lsO
verv
iewShare Incentive Plan (“SIP”)
Between 2008 and 2010, qualifying employees could buy up to £1,500 worth of Partnership shares in any one tax year. Matching shares were awarded to employees to match any Partnership shares they bought, in a ratio of one-to-one, with the cost of Matching shares borne by the Group. There were no awards under the SIP Partnership and Matching share plan in 2011, or 2012.
Shares in the Company held under trust and under the Company’s control as a result of the SIP were as follows:
Shares held at
1 January 2012
(number)
Shares acquired during year
(number)
Shares transferred during year
(number)
Shares held at
31 December2012
(number)
Cost at 31 December
2012 £000
Nominal value at
31 December 2012
£000
Market value at
31 December2012
£000
SIP 365,048 – (34,535) 330,513 2,465 38 1,800
Executive Share Incentive Plan (“ESIP”) Between 2006 and 2008 the Group operated the ESIP. Under the ESIP, annual awards of performance shares were made at £nil consideration to executive directors and other senior executives up to a normal maximum of 100% of salary. Shares vested according to whether the Group’s Total Shareholder Return (“TSR”) matched or outperformed an index (determined in accordance with the scheme rules) over three years. The fair value of the 2008, 2007 and 2006 ESIP awards, of £1.2 million, £0.9 million and £1.9 million, respectively, have been charged to the income statement on a straight-line basis over the corresponding three year vesting periods.
Bonus Matching Plan (“BMP”) The BMP was introduced in 2009 to replace the ESIP. Under the BMP, annual awards of performance and service-related shares are made at £nil consideration to executive directors and other senior executives up to a maximum of 150% of their annual bonus. A proportion of the shares vesting is conditional upon whether the Group’s TSR matches or outperforms an index (determined in accordance with the scheme rules) over three years. From 2011, a proportion of the shares vesting will be conditional upon performance against the internal Balanced Corporate Scorecard. The fair value of the 2012, 2011 and 2010 BMP awards, of £5.8 million, £5.5 million and £3.0 million, respectively, are being charged to the income statement on a straight-line basis over the corresponding three year vesting periods.
Movements in the number of share options outstanding for the ESIP and BMP awards are as follows:
2012 2011
BMP
(number) ESIP
(number) BMP
(number)
At 1 January 4,265,511 442,799 2,278,856
Granted 1,849,450 – 2,054,644
Forfeited (98,049) – (65,533)
Exercised (246,017) – (2,456)
Expired (732,869) (442,799) –
At 31 December 5,038,026 – 4,265,511
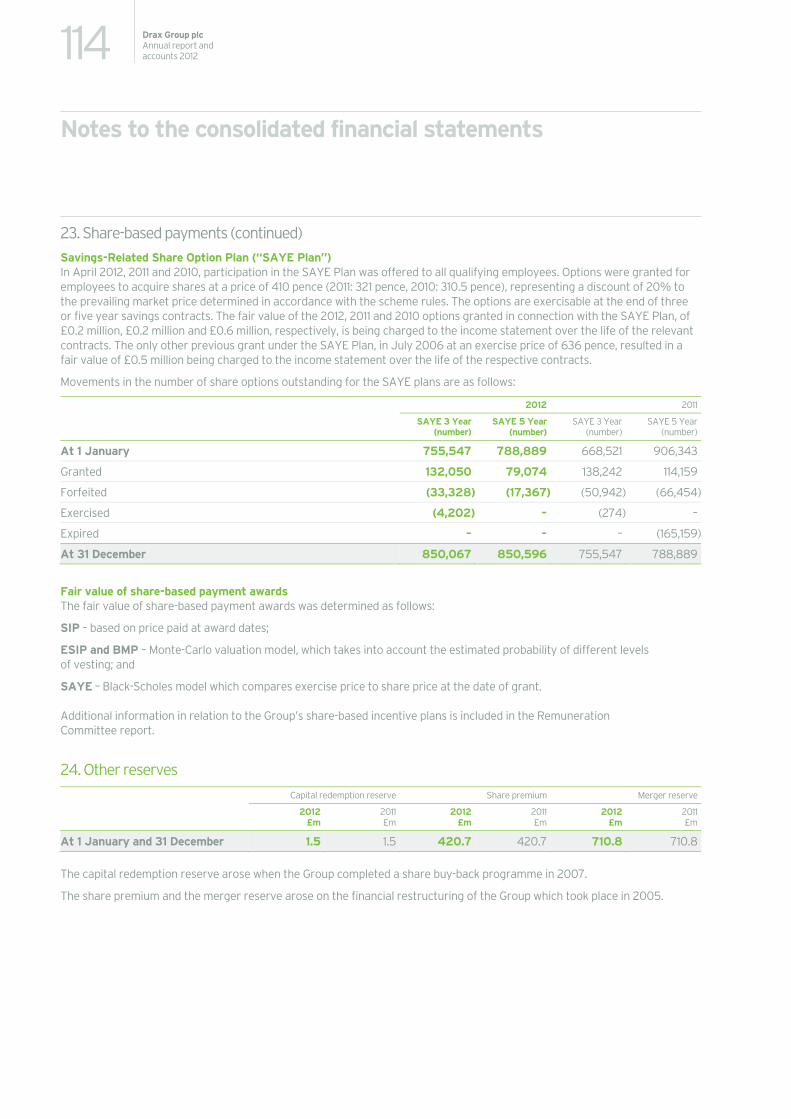
114 Drax Group plcAnnual report and accounts 2012
Notes to the consolidated financial statements
23. Share-based payments (continued) Savings-Related Share Option Plan (“SAYE Plan”) In April 2012, 2011 and 2010, participation in the SAYE Plan was offered to all qualifying employees. Options were granted for employees to acquire shares at a price of 410 pence (2011: 321 pence, 2010: 310.5 pence), representing a discount of 20% to the prevailing market price determined in accordance with the scheme rules. The options are exercisable at the end of three or five year savings contracts. The fair value of the 2012, 2011 and 2010 options granted in connection with the SAYE Plan, of £0.2 million, £0.2 million and £0.6 million, respectively, is being charged to the income statement over the life of the relevant contracts. The only other previous grant under the SAYE Plan, in July 2006 at an exercise price of 636 pence, resulted in a fair value of £0.5 million being charged to the income statement over the life of the respective contracts.
Movements in the number of share options outstanding for the SAYE plans are as follows:
2012 2011
SAYE 3 Year(number)
SAYE 5 Year(number)
SAYE 3 Year (number)
SAYE 5 Year(number)
At 1 January 755,547 788,889 668,521 906,343
Granted 132,050 79,074 138,242 114,159
Forfeited (33,328) (17,367) (50,942) (66,454)
Exercised (4,202) – (274) –
Expired – – – (165,159)
At 31 December 850,067 850,596 755,547 788,889
Fair value of share-based payment awards The fair value of share-based payment awards was determined as follows:
SIP – based on price paid at award dates;
ESIP and BMP – Monte-Carlo valuation model, which takes into account the estimated probability of different levels of vesting; and
SAYE – Black-Scholes model which compares exercise price to share price at the date of grant.
Additional information in relation to the Group’s share-based incentive plans is included in the Remuneration Committee report.
24. Other reserves Capital redemption reserve Share premium Merger reserve
2012 £m
2011£m
2012£m
2011£m
2012 £m
2011£m
At 1 January and 31 December 1.5 1.5 420.7 420.7 710.8 710.8
The capital redemption reserve arose when the Group completed a share buy-back programme in 2007.
The share premium and the merger reserve arose on the financial restructuring of the Group which took place in 2005.
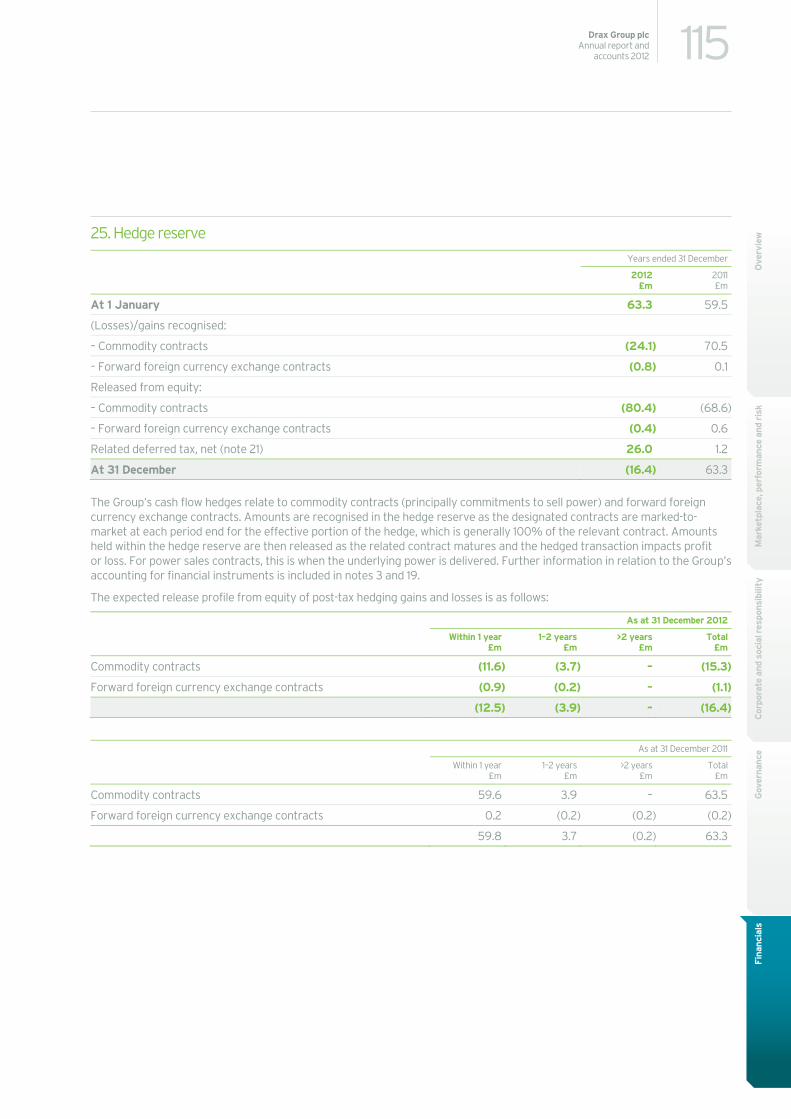
115Drax Group plcAnnual report and
accounts 2012
Mar
ketp
lace
, per
form
ance
and
ris
kC
orpo
rate
and
soc
ial r
espo
nsib
ility
Gov
erna
nce
Fina
ncia
lsO
verv
iew25. Hedge reserve
Years ended 31 December
2012
£m 2011£m
At 1 January 63.3 59.5
(Losses)/gains recognised:
– Commodity contracts (24.1) 70.5
– Forward foreign currency exchange contracts (0.8) 0.1
Released from equity:
– Commodity contracts (80.4) (68.6)
– Forward foreign currency exchange contracts (0.4) 0.6
Related deferred tax, net (note 21) 26.0 1.2
At 31 December (16.4) 63.3
The Group’s cash flow hedges relate to commodity contracts (principally commitments to sell power) and forward foreign currency exchange contracts. Amounts are recognised in the hedge reserve as the designated contracts are marked-to- market at each period end for the effective portion of the hedge, which is generally 100% of the relevant contract. Amounts held within the hedge reserve are then released as the related contract matures and the hedged transaction impacts profit or loss. For power sales contracts, this is when the underlying power is delivered. Further information in relation to the Group’s accounting for financial instruments is included in notes 3 and 19.
The expected release profile from equity of post-tax hedging gains and losses is as follows:
As at 31 December 2012
Within 1 year£m
1–2 years £m
>2 years £m
Total£m
Commodity contracts (11.6) (3.7) – (15.3)
Forward foreign currency exchange contracts (0.9) (0.2) – (1.1)
(12.5) (3.9) – (16.4)
As at 31 December 2011
Within 1 year£m
1–2 years £m
>2 years £m
Total£m
Commodity contracts 59.6 3.9 – 63.5
Forward foreign currency exchange contracts 0.2 (0.2) (0.2) (0.2)
59.8 3.7 (0.2) 63.3
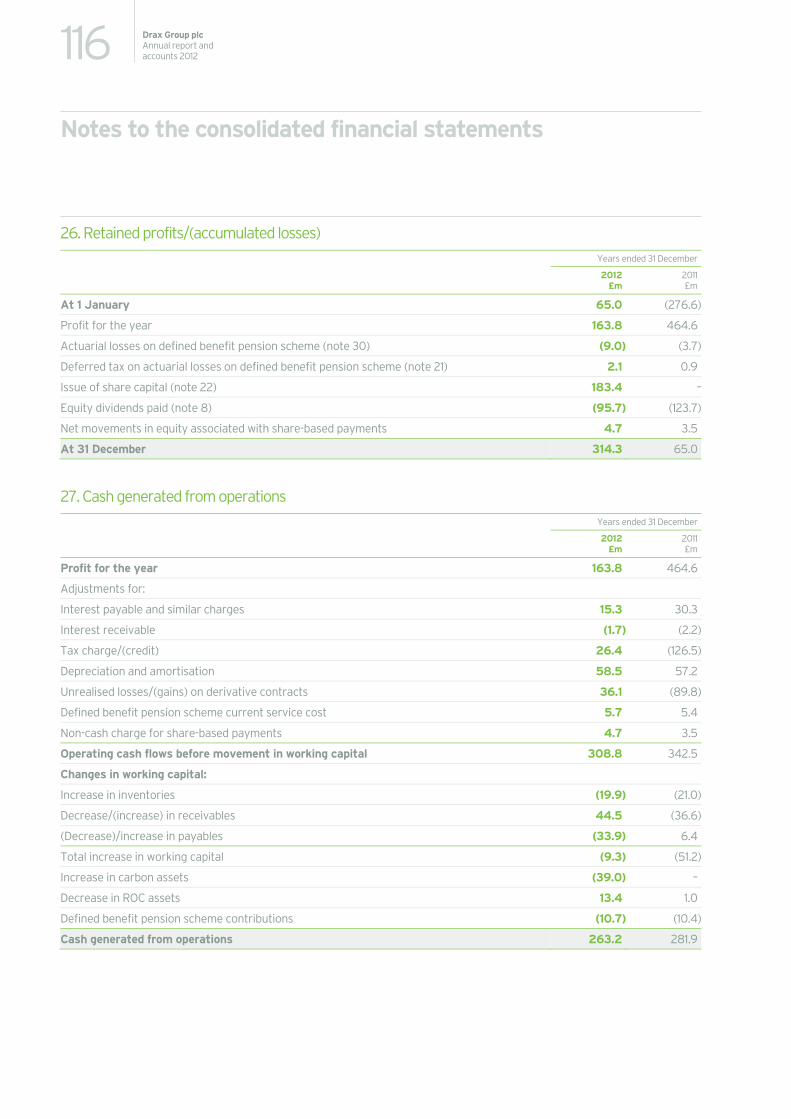
116 Drax Group plcAnnual report and accounts 2012
Notes to the consolidated financial statements
26. Retained profits/(accumulated losses) Years ended 31 December
2012 £m
2011£m
At 1 January 65.0 (276.6)
Profit for the year 163.8 464.6
Actuarial losses on defined benefit pension scheme (note 30) (9.0) (3.7)
Deferred tax on actuarial losses on defined benefit pension scheme (note 21) 2.1 0.9
Issue of share capital (note 22) 183.4 –
Equity dividends paid (note 8) (95.7) (123.7)
Net movements in equity associated with share-based payments 4.7 3.5
At 31 December 314.3 65.0
27. Cash generated from operations Years ended 31 December
2012 £m
2011£m
Profit for the year 163.8 464.6
Adjustments for:
Interest payable and similar charges 15.3 30.3
Interest receivable (1.7) (2.2)
Tax charge/(credit) 26.4 (126.5)
Depreciation and amortisation 58.5 57.2
Unrealised losses/(gains) on derivative contracts 36.1 (89.8)
Defined benefit pension scheme current service cost 5.7 5.4
Non-cash charge for share-based payments 4.7 3.5
Operating cash flows before movement in working capital 308.8 342.5
Changes in working capital:
Increase in inventories (19.9) (21.0)
Decrease/(increase) in receivables 44.5 (36.6)
(Decrease)/increase in payables (33.9) 6.4
Total increase in working capital (9.3) (51.2)
Increase in carbon assets (39.0) –
Decrease in ROC assets 13.4 1.0
Defined benefit pension scheme contributions (10.7) (10.4)
Cash generated from operations 263.2 281.9
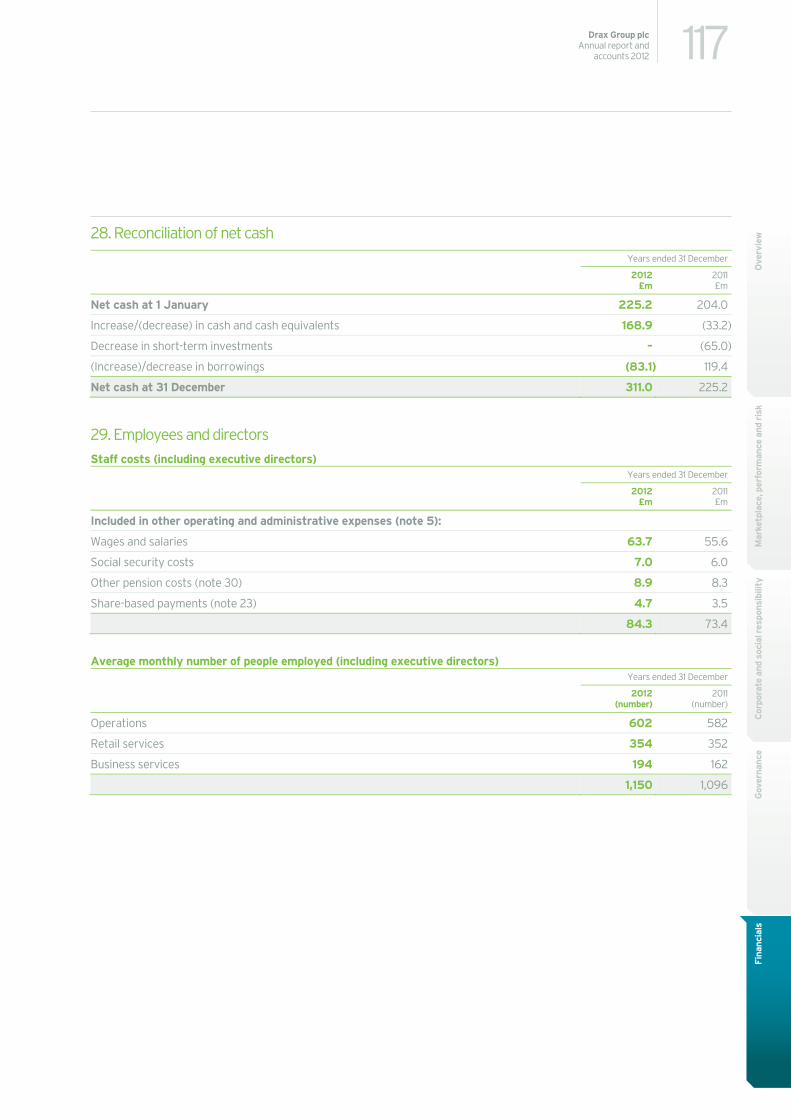
117Drax Group plcAnnual report and
accounts 2012
Mar
ketp
lace
, per
form
ance
and
ris
kC
orpo
rate
and
soc
ial r
espo
nsib
ility
Gov
erna
nce
Fina
ncia
lsO
verv
iew28. Reconciliation of net cash
Years ended 31 December
2012
£m 2011£m
Net cash at 1 January 225.2 204.0
Increase/(decrease) in cash and cash equivalents 168.9 (33.2)
Decrease in short-term investments – (65.0)
(Increase)/decrease in borrowings (83.1) 119.4
Net cash at 31 December 311.0 225.2
29. Employees and directors Staff costs (including executive directors)
Years ended 31 December
2012
£m 2011£m
Included in other operating and administrative expenses (note 5):
Wages and salaries 63.7 55.6
Social security costs 7.0 6.0
Other pension costs (note 30) 8.9 8.3
Share-based payments (note 23) 4.7 3.5
84.3 73.4
Average monthly number of people employed (including executive directors) Years ended 31 December
2012
(number) 2011
(number)
Operations 602 582
Retail services 354 352
Business services 194 162
1,150 1,096
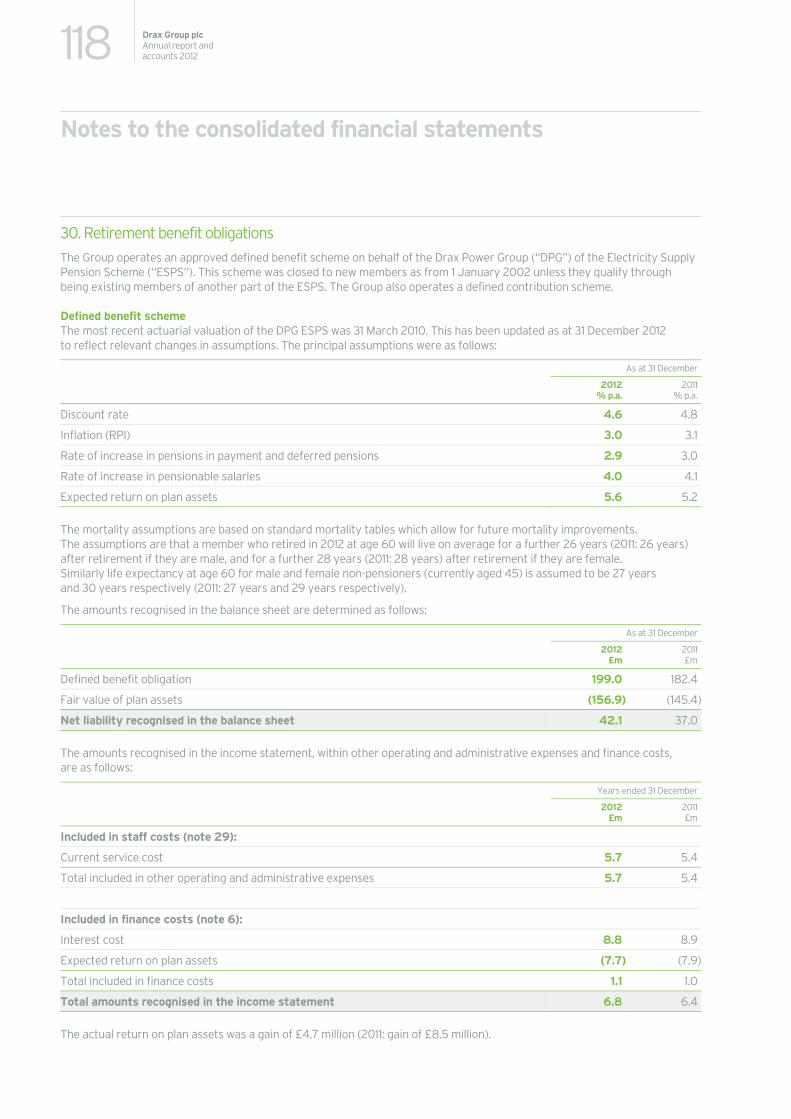
118 Drax Group plcAnnual report and accounts 2012
Notes to the consolidated financial statements
30. Retirement benefit obligations The Group operates an approved defined benefit scheme on behalf of the Drax Power Group (“DPG”) of the Electricity Supply Pension Scheme (“ESPS”). This scheme was closed to new members as from 1 January 2002 unless they qualify through being existing members of another part of the ESPS. The Group also operates a defined contribution scheme.
Defined benefit scheme The most recent actuarial valuation of the DPG ESPS was 31 March 2010. This has been updated as at 31 December 2012 to reflect relevant changes in assumptions. The principal assumptions were as follows:
As at 31 December
2012 % p.a.
2011% p.a.
Discount rate 4.6 4.8
Inflation (RPI) 3.0 3.1
Rate of increase in pensions in payment and deferred pensions 2.9 3.0
Rate of increase in pensionable salaries 4.0 4.1
Expected return on plan assets 5.6 5.2
The mortality assumptions are based on standard mortality tables which allow for future mortality improvements. The assumptions are that a member who retired in 2012 at age 60 will live on average for a further 26 years (2011: 26 years) after retirement if they are male, and for a further 28 years (2011: 28 years) after retirement if they are female. Similarly life expectancy at age 60 for male and female non-pensioners (currently aged 45) is assumed to be 27 years and 30 years respectively (2011: 27 years and 29 years respectively).
The amounts recognised in the balance sheet are determined as follows:
As at 31 December
2012 £m
2011£m
Defined benefit obligation 199.0 182.4
Fair value of plan assets (156.9) (145.4)
Net liability recognised in the balance sheet 42.1 37.0
The amounts recognised in the income statement, within other operating and administrative expenses and finance costs, are as follows:
Years ended 31 December
2012 £m
2011£m
Included in staff costs (note 29):
Current service cost 5.7 5.4
Total included in other operating and administrative expenses 5.7 5.4
Included in finance costs (note 6):
Interest cost 8.8 8.9
Expected return on plan assets (7.7) (7.9)
Total included in finance costs 1.1 1.0
Total amounts recognised in the income statement 6.8 6.4
The actual return on plan assets was a gain of £4.7 million (2011: gain of £8.5 million).
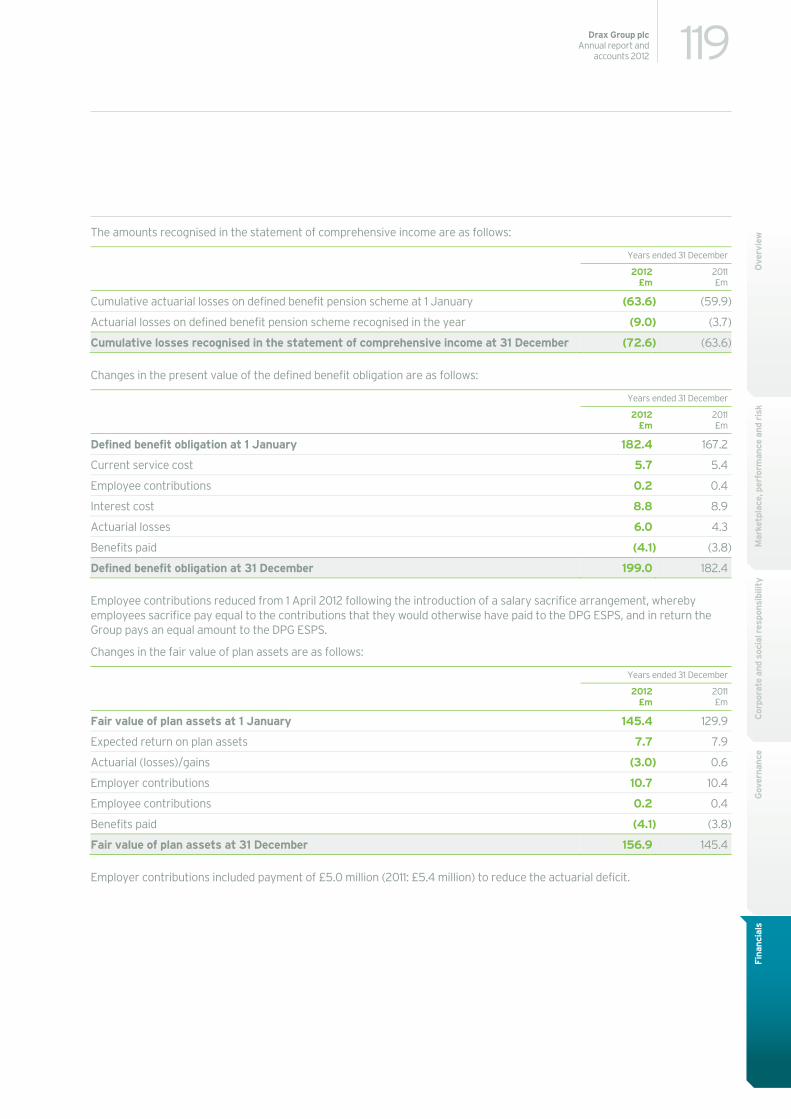
119Drax Group plcAnnual report and
accounts 2012
Mar
ketp
lace
, per
form
ance
and
ris
kC
orpo
rate
and
soc
ial r
espo
nsib
ility
Gov
erna
nce
Fina
ncia
lsO
verv
iewThe amounts recognised in the statement of comprehensive income are as follows:
Years ended 31 December
2012
£m 2011£m
Cumulative actuarial losses on defined benefit pension scheme at 1 January (63.6) (59.9)
Actuarial losses on defined benefit pension scheme recognised in the year (9.0) (3.7)
Cumulative losses recognised in the statement of comprehensive income at 31 December (72.6) (63.6)
Changes in the present value of the defined benefit obligation are as follows:
Years ended 31 December
2012
£m 2011£m
Defined benefit obligation at 1 January 182.4 167.2
Current service cost 5.7 5.4
Employee contributions 0.2 0.4
Interest cost 8.8 8.9
Actuarial losses 6.0 4.3
Benefits paid (4.1) (3.8)
Defined benefit obligation at 31 December 199.0 182.4
Employee contributions reduced from 1 April 2012 following the introduction of a salary sacrifice arrangement, whereby employees sacrifice pay equal to the contributions that they would otherwise have paid to the DPG ESPS, and in return the Group pays an equal amount to the DPG ESPS.
Changes in the fair value of plan assets are as follows:
Years ended 31 December
2012
£m 2011£m
Fair value of plan assets at 1 January 145.4 129.9
Expected return on plan assets 7.7 7.9
Actuarial (losses)/gains (3.0) 0.6
Employer contributions 10.7 10.4
Employee contributions 0.2 0.4
Benefits paid (4.1) (3.8)
Fair value of plan assets at 31 December 156.9 145.4
Employer contributions included payment of £5.0 million (2011: £5.4 million) to reduce the actuarial deficit.
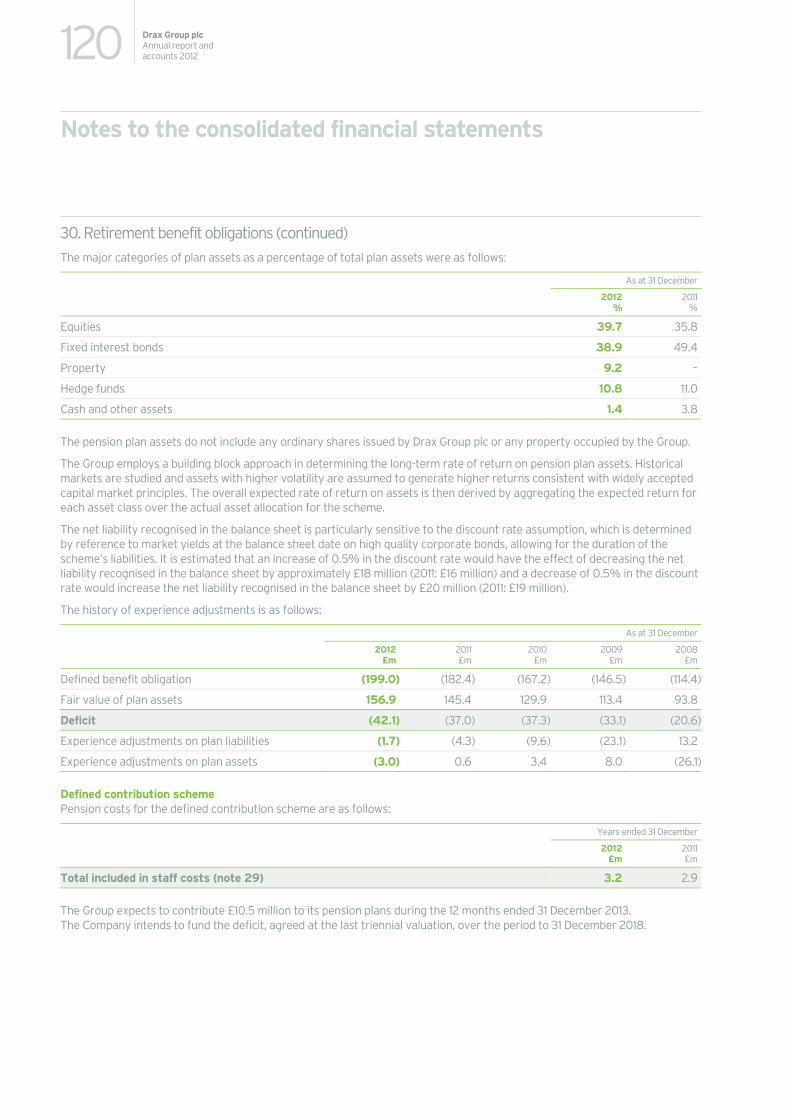
120 Drax Group plcAnnual report and accounts 2012
Notes to the consolidated financial statements
30. Retirement benefit obligations (continued) The major categories of plan assets as a percentage of total plan assets were as follows:
As at 31 December
2012 %
2011%
Equities 39.7 35.8
Fixed interest bonds 38.9 49.4
Property 9.2 –
Hedge funds 10.8 11.0
Cash and other assets 1.4 3.8
The pension plan assets do not include any ordinary shares issued by Drax Group plc or any property occupied by the Group.
The Group employs a building block approach in determining the long-term rate of return on pension plan assets. Historical markets are studied and assets with higher volatility are assumed to generate higher returns consistent with widely accepted capital market principles. The overall expected rate of return on assets is then derived by aggregating the expected return for each asset class over the actual asset allocation for the scheme.
The net liability recognised in the balance sheet is particularly sensitive to the discount rate assumption, which is determined by reference to market yields at the balance sheet date on high quality corporate bonds, allowing for the duration of the scheme’s liabilities. It is estimated that an increase of 0.5% in the discount rate would have the effect of decreasing the net liability recognised in the balance sheet by approximately £18 million (2011: £16 million) and a decrease of 0.5% in the discount rate would increase the net liability recognised in the balance sheet by £20 million (2011: £19 million).
The history of experience adjustments is as follows:
As at 31 December
2012
£m2011£m
2010£m
2009 £m
2008£m
Defined benefit obligation (199.0) (182.4) (167.2) (146.5) (114.4)
Fair value of plan assets 156.9 145.4 129.9 113.4 93.8
Deficit (42.1) (37.0) (37.3) (33.1) (20.6)
Experience adjustments on plan liabilities (1.7) (4.3) (9.6) (23.1) 13.2
Experience adjustments on plan assets (3.0) 0.6 3.4 8.0 (26.1)
Defined contribution scheme Pension costs for the defined contribution scheme are as follows:
Years ended 31 December
2012 £m
2011£m
Total included in staff costs (note 29) 3.2 2.9
The Group expects to contribute £10.5 million to its pension plans during the 12 months ended 31 December 2013. The Company intends to fund the deficit, agreed at the last triennial valuation, over the period to 31 December 2018.
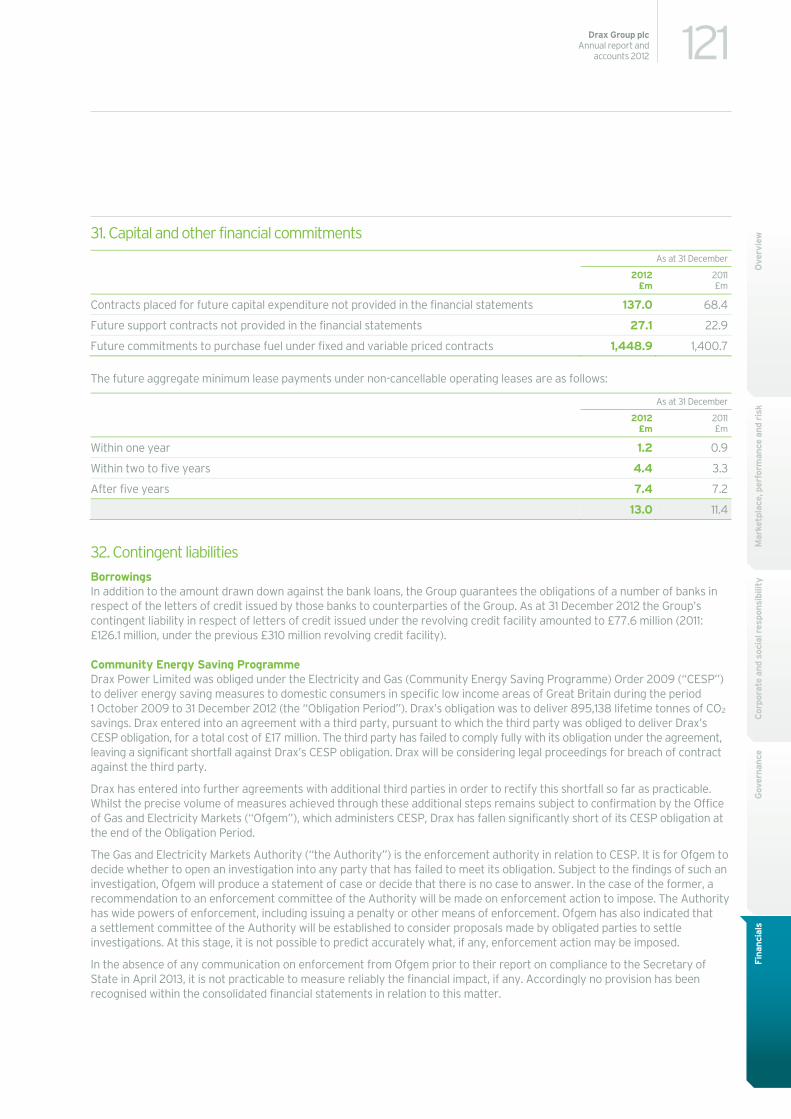
121Drax Group plcAnnual report and
accounts 2012
Mar
ketp
lace
, per
form
ance
and
ris
kC
orpo
rate
and
soc
ial r
espo
nsib
ility
Gov
erna
nce
Fina
ncia
lsO
verv
iew31. Capital and other financial commitments
As at 31 December
2012
£m 2011£m
Contracts placed for future capital expenditure not provided in the financial statements 137.0 68.4
Future support contracts not provided in the financial statements 27.1 22.9
Future commitments to purchase fuel under fixed and variable priced contracts 1,448.9 1,400.7
The future aggregate minimum lease payments under non-cancellable operating leases are as follows:
As at 31 December
2012
£m 2011£m
Within one year 1.2 0.9
Within two to five years 4.4 3.3
After five years 7.4 7.2
13.0 11.4
32. Contingent liabilities Borrowings In addition to the amount drawn down against the bank loans, the Group guarantees the obligations of a number of banks in respect of the letters of credit issued by those banks to counterparties of the Group. As at 31 December 2012 the Group’s contingent liability in respect of letters of credit issued under the revolving credit facility amounted to £77.6 million (2011: £126.1 million, under the previous £310 million revolving credit facility).
Community Energy Saving Programme Drax Power Limited was obliged under the Electricity and Gas (Community Energy Saving Programme) Order 2009 (“CESP”) to deliver energy saving measures to domestic consumers in specific low income areas of Great Britain during the period 1 October 2009 to 31 December 2012 (the “Obligation Period”). Drax’s obligation was to deliver 895,138 lifetime tonnes of CO2 savings. Drax entered into an agreement with a third party, pursuant to which the third party was obliged to deliver Drax’s CESP obligation, for a total cost of £17 million. The third party has failed to comply fully with its obligation under the agreement, leaving a significant shortfall against Drax’s CESP obligation. Drax will be considering legal proceedings for breach of contract against the third party.
Drax has entered into further agreements with additional third parties in order to rectify this shortfall so far as practicable. Whilst the precise volume of measures achieved through these additional steps remains subject to confirmation by the Office of Gas and Electricity Markets (“Ofgem”), which administers CESP, Drax has fallen significantly short of its CESP obligation at the end of the Obligation Period.
The Gas and Electricity Markets Authority (“the Authority”) is the enforcement authority in relation to CESP. It is for Ofgem to decide whether to open an investigation into any party that has failed to meet its obligation. Subject to the findings of such an investigation, Ofgem will produce a statement of case or decide that there is no case to answer. In the case of the former, a recommendation to an enforcement committee of the Authority will be made on enforcement action to impose. The Authority has wide powers of enforcement, including issuing a penalty or other means of enforcement. Ofgem has also indicated that a settlement committee of the Authority will be established to consider proposals made by obligated parties to settle investigations. At this stage, it is not possible to predict accurately what, if any, enforcement action may be imposed.
In the absence of any communication on enforcement from Ofgem prior to their report on compliance to the Secretary of State in April 2013, it is not practicable to measure reliably the financial impact, if any. Accordingly no provision has been recognised within the consolidated financial statements in relation to this matter.
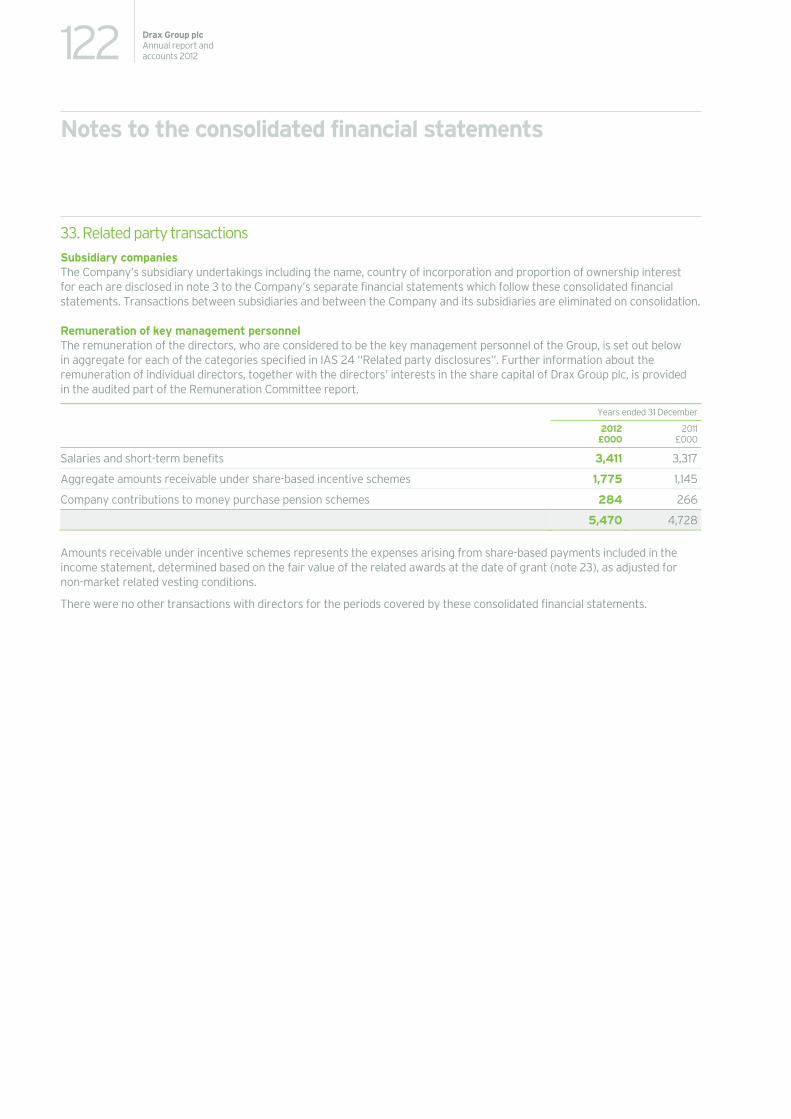
122 Drax Group plcAnnual report and accounts 2012
Notes to the consolidated financial statements
33. Related party transactions Subsidiary companies The Company’s subsidiary undertakings including the name, country of incorporation and proportion of ownership interest for each are disclosed in note 3 to the Company’s separate financial statements which follow these consolidated financial statements. Transactions between subsidiaries and between the Company and its subsidiaries are eliminated on consolidation.
Remuneration of key management personnel The remuneration of the directors, who are considered to be the key management personnel of the Group, is set out below in aggregate for each of the categories specified in IAS 24 “Related party disclosures”. Further information about the remuneration of individual directors, together with the directors’ interests in the share capital of Drax Group plc, is provided in the audited part of the Remuneration Committee report.
Years ended 31 December
2012 £000
2011£000
Salaries and short-term benefits 3,411 3,317
Aggregate amounts receivable under share-based incentive schemes 1,775 1,145
Company contributions to money purchase pension schemes 284 266
5,470 4,728
Amounts receivable under incentive schemes represents the expenses arising from share-based payments included in the income statement, determined based on the fair value of the related awards at the date of grant (note 23), as adjusted for non-market related vesting conditions.
There were no other transactions with directors for the periods covered by these consolidated financial statements.
123Drax Group plcAnnual report and
accounts 2012
Mar
ketp
lace
, per
form
ance
and
ris
kC
orpo
rate
and
soc
ial r
espo
nsib
ility
Gov
erna
nce
Fina
ncia
lsO
verv
iew
Company – Independent auditor’s report
To the members of Drax Group plc We have audited the Company financial statements of Drax Group plc for the year ended 31 December 2012 which comprise the Company balance sheet and the related notes 1 to 7. The financial reporting framework that has been applied in their preparation is applicable law and United Kingdom Accounting Standards (United Kingdom Generally Accepted Accounting Practice). This report is made solely to the Company’s members, as a body, in accordance with Chapter 3 of Part 16 of the Companies Act 2006. Our audit work has been undertaken so that we might state to the Company’s members those matters we are required to state to them in an auditor’s report and for no other purpose. To the fullest extent permitted by law, we do not accept or assume responsibility to anyone other than the Company and the Company’s members as a body, for our audit work, for this report, or for the opinions we have formed.
Respective responsibilities of directors and auditor As explained more fully in the Directors’ responsibilities statement, the directors are responsible for the preparation of the Company financial statements and for being satisfied that they give a true and fair view. Our responsibility is to audit and express an opinion on the Company financial statements in accordance with applicable law and International Standards on Auditing (UK and Ireland). Those standards require us to comply with the Auditing Practices Board’s Ethical Standards for Auditors.
Scope of the audit of the financial statements An audit involves obtaining evidence about the amounts and disclosures in the financial statements sufficient to give reasonable assurance that the financial statements are free from material misstatement, whether caused by fraud or error. This includes an assessment of: whether the accounting policies are appropriate to the Company’s circumstances and have been consistently applied and adequately disclosed; the reasonableness of significant accounting estimates made by the directors; and the overall presentation of the financial statements. In addition, we read all the financial and non-financial information in the annual report to identify material inconsistencies with the audited financial statements. If we become aware of any apparent material misstatements or inconsistencies we consider the implications for our report.
Opinion on financial statements In our opinion the Company financial statements:
– give a true and fair view of the state of the Company’s affairs as at 31 December 2012;
– have been properly prepared in accordance with United Kingdom Generally Accepted Accounting Practice; and
– have been prepared in accordance with the requirements of the Companies Act 2006.
Opinion on other matters prescribed by the Companies Act 2006 In our opinion:
– the part of the Directors’ remuneration report to be audited has been properly prepared in accordance with the Companies Act 2006; and
– the information given in the Directors’ report for the financial year for which the financial statements are prepared is consistent with the Company financial statements.
Matters on which we are required to report by exception We have nothing to report in respect of the following matters where the Companies Act 2006 requires us to report to you if, in our opinion:
– adequate accounting records have not been kept by the Company, or returns adequate for our audit have not been received from branches not visited by us; or
– the Company financial statements and the part of the Directors’ remuneration report to be audited are not in agreement with the accounting records and returns; or
– certain disclosures of directors’ remuneration specified by law are not made; or
– we have not received all the information and explanations we require for our audit.
Other matters We have reported separately on the Group financial statements of Drax Group plc for the year ended 31 December 2012.
Carl D Hughes MA FCA (Senior Statutory Auditor) for and on behalf of Deloitte LLP Chartered Accountants and Statutory Auditor London, UK
18 February 2013
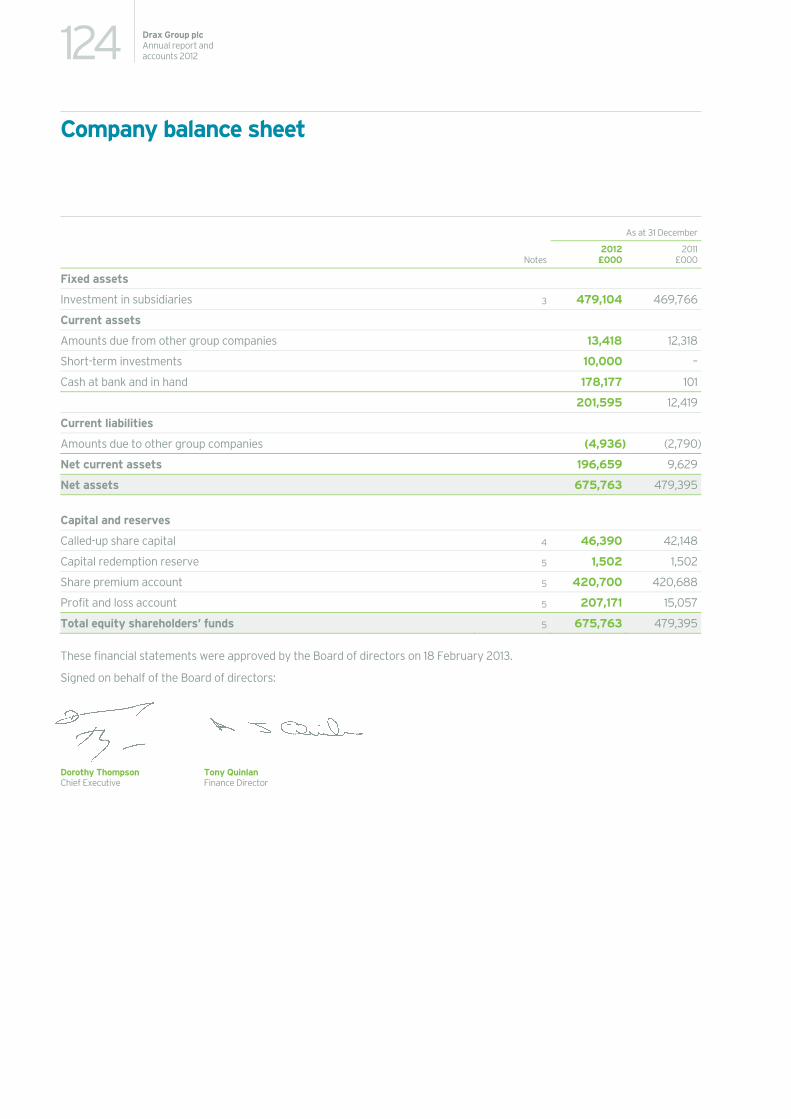
124 Drax Group plcAnnual report and accounts 2012
Company balance sheet
As at 31 December
Notes2012
£000 2011
£000
Fixed assets
Investment in subsidiaries 3 479,104 469,766
Current assets
Amounts due from other group companies 13,418 12,318
Short-term investments 10,000 –
Cash at bank and in hand 178,177 101
201,595 12,419
Current liabilities
Amounts due to other group companies (4,936) (2,790)
Net current assets 196,659 9,629
Net assets 675,763 479,395
Capital and reserves
Called-up share capital 4 46,390 42,148
Capital redemption reserve 5 1,502 1,502
Share premium account 5 420,700 420,688
Profit and loss account 5 207,171 15,057
Total equity shareholders’ funds 5 675,763 479,395
These financial statements were approved by the Board of directors on 18 February 2013.
Signed on behalf of the Board of directors:
Dorothy Thompson Tony Quinlan Chief Executive Finance Director
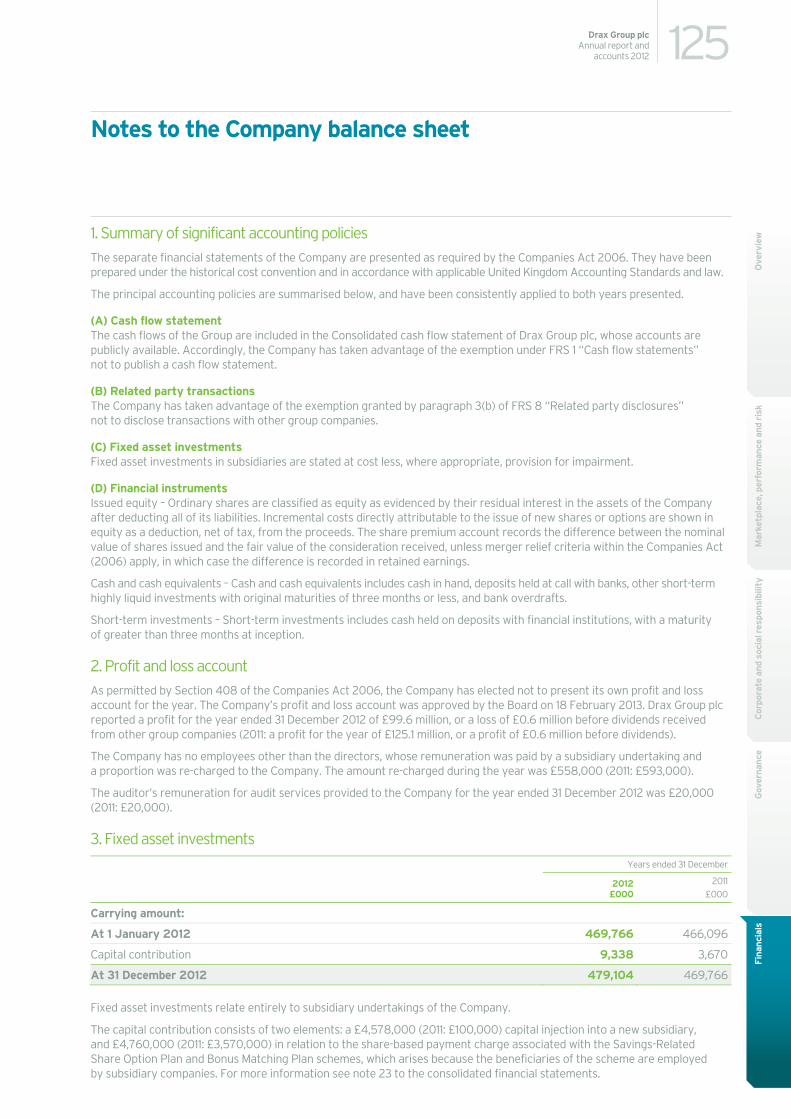
125Drax Group plcAnnual report and
accounts 2012
Mar
ketp
lace
, per
form
ance
and
ris
kC
orpo
rate
and
soc
ial r
espo
nsib
ility
Gov
erna
nce
Fina
ncia
lsO
verv
iew
Notes to the Company balance sheet
1. Summary of significant accounting policies The separate financial statements of the Company are presented as required by the Companies Act 2006. They have been prepared under the historical cost convention and in accordance with applicable United Kingdom Accounting Standards and law.
The principal accounting policies are summarised below, and have been consistently applied to both years presented.
(A) Cash flow statement The cash flows of the Group are included in the Consolidated cash flow statement of Drax Group plc, whose accounts are publicly available. Accordingly, the Company has taken advantage of the exemption under FRS 1 “Cash flow statements” not to publish a cash flow statement.
(B) Related party transactions The Company has taken advantage of the exemption granted by paragraph 3(b) of FRS 8 “Related party disclosures” not to disclose transactions with other group companies.
(C) Fixed asset investments Fixed asset investments in subsidiaries are stated at cost less, where appropriate, provision for impairment.
(D) Financial instruments Issued equity – Ordinary shares are classified as equity as evidenced by their residual interest in the assets of the Company after deducting all of its liabilities. Incremental costs directly attributable to the issue of new shares or options are shown in equity as a deduction, net of tax, from the proceeds. The share premium account records the difference between the nominal value of shares issued and the fair value of the consideration received, unless merger relief criteria within the Companies Act (2006) apply, in which case the difference is recorded in retained earnings.
Cash and cash equivalents – Cash and cash equivalents includes cash in hand, deposits held at call with banks, other short-term highly liquid investments with original maturities of three months or less, and bank overdrafts.
Short-term investments – Short-term investments includes cash held on deposits with financial institutions, with a maturity of greater than three months at inception.
2. Profit and loss account As permitted by Section 408 of the Companies Act 2006, the Company has elected not to present its own profit and loss account for the year. The Company’s profit and loss account was approved by the Board on 18 February 2013. Drax Group plc reported a profit for the year ended 31 December 2012 of £99.6 million, or a loss of £0.6 million before dividends received from other group companies (2011: a profit for the year of £125.1 million, or a profit of £0.6 million before dividends).
The Company has no employees other than the directors, whose remuneration was paid by a subsidiary undertaking and a proportion was re-charged to the Company. The amount re-charged during the year was £558,000 (2011: £593,000).
The auditor’s remuneration for audit services provided to the Company for the year ended 31 December 2012 was £20,000 (2011: £20,000).
3. Fixed asset investments Years ended 31 December
2012 £000
2011£000
Carrying amount:
At 1 January 2012 469,766 466,096
Capital contribution 9,338 3,670
At 31 December 2012 479,104 469,766
Fixed asset investments relate entirely to subsidiary undertakings of the Company.
The capital contribution consists of two elements: a £4,578,000 (2011: £100,000) capital injection into a new subsidiary, and £4,760,000 (2011: £3,570,000) in relation to the share-based payment charge associated with the Savings-Related Share Option Plan and Bonus Matching Plan schemes, which arises because the beneficiaries of the scheme are employed by subsidiary companies. For more information see note 23 to the consolidated financial statements.
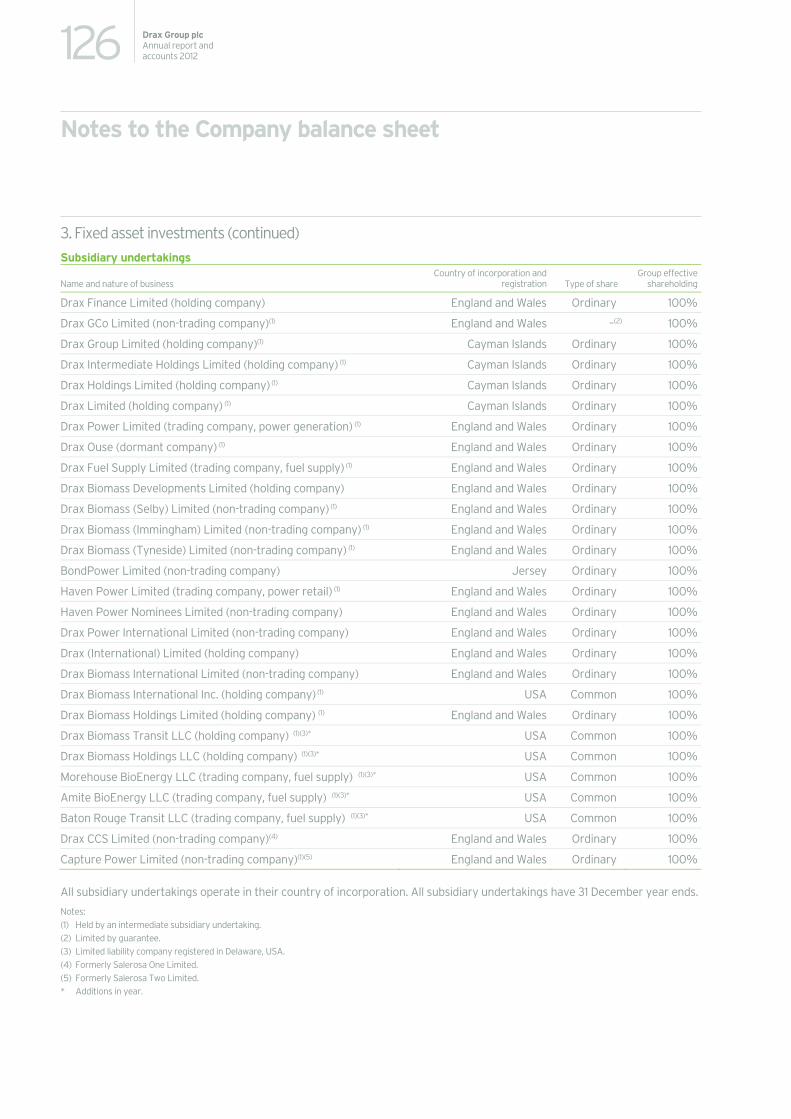
126 Drax Group plcAnnual report and accounts 2012
Notes to the Company balance sheet
3. Fixed asset investments (continued) Subsidiary undertakings
Name and nature of business Country of incorporation and
registration Type of share Group effective
shareholding
Drax Finance Limited (holding company) England and Wales Ordinary 100%
Drax GCo Limited (non-trading company)(1) England and Wales –(2) 100%
Drax Group Limited (holding company)(1) Cayman Islands Ordinary 100%
Drax Intermediate Holdings Limited (holding company) (1) Cayman Islands Ordinary 100%
Drax Holdings Limited (holding company) (1) Cayman Islands Ordinary 100%
Drax Limited (holding company) (1) Cayman Islands Ordinary 100%
Drax Power Limited (trading company, power generation) (1) England and Wales Ordinary 100%
Drax Ouse (dormant company) (1) England and Wales Ordinary 100%
Drax Fuel Supply Limited (trading company, fuel supply) (1) England and Wales Ordinary 100%
Drax Biomass Developments Limited (holding company) England and Wales Ordinary 100%
Drax Biomass (Selby) Limited (non-trading company) (1) England and Wales Ordinary 100%
Drax Biomass (Immingham) Limited (non-trading company) (1) England and Wales Ordinary 100%
Drax Biomass (Tyneside) Limited (non-trading company) (1) England and Wales Ordinary 100%
BondPower Limited (non-trading company) Jersey Ordinary 100%
Haven Power Limited (trading company, power retail) (1) England and Wales Ordinary 100%
Haven Power Nominees Limited (non-trading company) England and Wales Ordinary 100%
Drax Power International Limited (non-trading company) England and Wales Ordinary 100%
Drax (International) Limited (holding company) England and Wales Ordinary 100%
Drax Biomass International Limited (non-trading company) England and Wales Ordinary 100%
Drax Biomass International Inc. (holding company) (1) USA Common 100%
Drax Biomass Holdings Limited (holding company) (1) England and Wales Ordinary 100%
Drax Biomass Transit LLC (holding company) (1)(3)* USA Common 100%
Drax Biomass Holdings LLC (holding company) (1)(3)* USA Common 100%
Morehouse BioEnergy LLC (trading company, fuel supply) (1)(3)* USA Common 100%
Amite BioEnergy LLC (trading company, fuel supply) (1)(3)* USA Common 100%
Baton Rouge Transit LLC (trading company, fuel supply) (1)(3)* USA Common 100%
Drax CCS Limited (non-trading company)(4) England and Wales Ordinary 100%
Capture Power Limited (non-trading company)(1)(5) England and Wales Ordinary 100%
All subsidiary undertakings operate in their country of incorporation. All subsidiary undertakings have 31 December year ends.
Notes: (1) Held by an intermediate subsidiary undertaking. (2) Limited by guarantee. (3) Limited liability company registered in Delaware, USA. (4) Formerly Salerosa One Limited. (5) Formerly Salerosa Two Limited. * Additions in year.
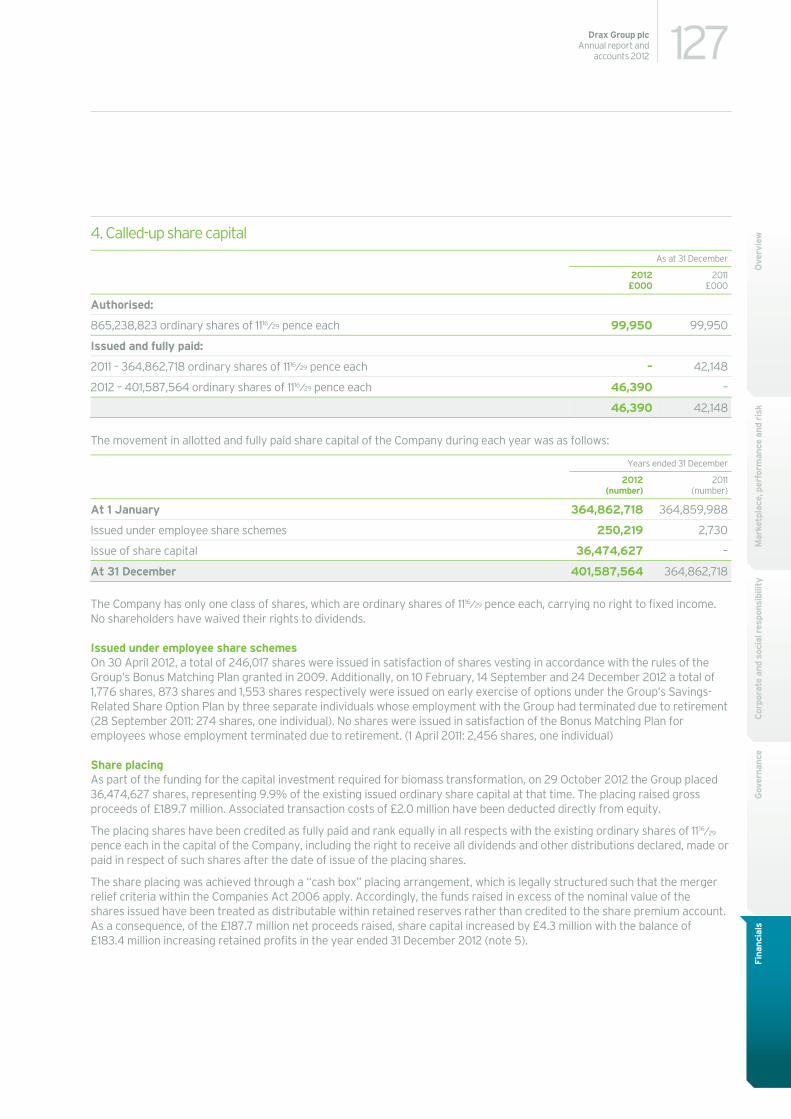
127Drax Group plcAnnual report and
accounts 2012
Mar
ketp
lace
, per
form
ance
and
ris
kC
orpo
rate
and
soc
ial r
espo
nsib
ility
Gov
erna
nce
Fina
ncia
lsO
verv
iew
4. Called-up share capital As at 31 December
2012
£000 2011
£000
Authorised:
865,238,823 ordinary shares of 1116⁄29 pence each 99,950 99,950
Issued and fully paid:
2011 – 364,862,718 ordinary shares of 1116⁄29 pence each – 42,148
2012 – 401,587,564 ordinary shares of 1116⁄29 pence each 46,390 –
46,390 42,148
The movement in allotted and fully paid share capital of the Company during each year was as follows:
Years ended 31 December
2012
(number) 2011
(number)
At 1 January 364,862,718 364,859,988
Issued under employee share schemes 250,219 2,730
Issue of share capital 36,474,627 –
At 31 December 401,587,564 364,862,718
The Company has only one class of shares, which are ordinary shares of 1116⁄29 pence each, carrying no right to fixed income. No shareholders have waived their rights to dividends.
Issued under employee share schemes On 30 April 2012, a total of 246,017 shares were issued in satisfaction of shares vesting in accordance with the rules of the Group’s Bonus Matching Plan granted in 2009. Additionally, on 10 February, 14 September and 24 December 2012 a total of 1,776 shares, 873 shares and 1,553 shares respectively were issued on early exercise of options under the Group’s Savings-Related Share Option Plan by three separate individuals whose employment with the Group had terminated due to retirement (28 September 2011: 274 shares, one individual). No shares were issued in satisfaction of the Bonus Matching Plan for employees whose employment terminated due to retirement. (1 April 2011: 2,456 shares, one individual)
Share placing As part of the funding for the capital investment required for biomass transformation, on 29 October 2012 the Group placed 36,474,627 shares, representing 9.9% of the existing issued ordinary share capital at that time. The placing raised gross proceeds of £189.7 million. Associated transaction costs of £2.0 million have been deducted directly from equity.
The placing shares have been credited as fully paid and rank equally in all respects with the existing ordinary shares of 1116⁄29 pence each in the capital of the Company, including the right to receive all dividends and other distributions declared, made or paid in respect of such shares after the date of issue of the placing shares.
The share placing was achieved through a “cash box” placing arrangement, which is legally structured such that the merger relief criteria within the Companies Act 2006 apply. Accordingly, the funds raised in excess of the nominal value of the shares issued have been treated as distributable within retained reserves rather than credited to the share premium account. As a consequence, of the £187.7 million net proceeds raised, share capital increased by £4.3 million with the balance of £183.4 million increasing retained profits in the year ended 31 December 2012 (note 5).
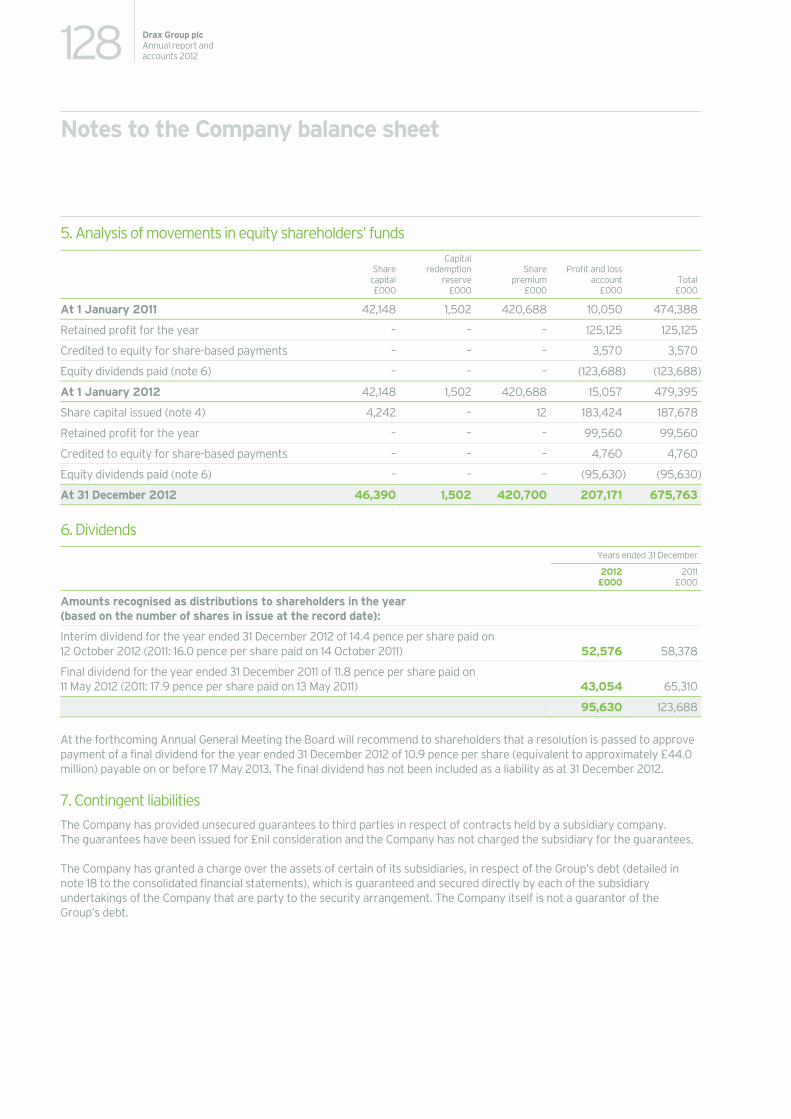
128 Drax Group plcAnnual report and accounts 2012
Notes to the Company balance sheet
5. Analysis of movements in equity shareholders’ funds
Share capital£000
Capital redemption
reserve£000
Share premium
£000
Profit and loss account
£000 Total£000
At 1 January 2011 42,148 1,502 420,688 10,050 474,388
Retained profit for the year – – – 125,125 125,125
Credited to equity for share-based payments – – – 3,570 3,570
Equity dividends paid (note 6) – – – (123,688) (123,688)
At 1 January 2012 42,148 1,502 420,688 15,057 479,395
Share capital issued (note 4) 4,242 – 12 183,424 187,678
Retained profit for the year – – – 99,560 99,560
Credited to equity for share-based payments – – – 4,760 4,760
Equity dividends paid (note 6) – – – (95,630) (95,630)
At 31 December 2012 46,390 1,502 420,700 207,171 675,763
6. Dividends Years ended 31 December
2012 £000
2011 £000
Amounts recognised as distributions to shareholders in the year (based on the number of shares in issue at the record date):
Interim dividend for the year ended 31 December 2012 of 14.4 pence per share paid on 12 October 2012 (2011: 16.0 pence per share paid on 14 October 2011) 52,576 58,378
Final dividend for the year ended 31 December 2011 of 11.8 pence per share paid on 11 May 2012 (2011: 17.9 pence per share paid on 13 May 2011) 43,054 65,310
95,630 123,688
At the forthcoming Annual General Meeting the Board will recommend to shareholders that a resolution is passed to approve payment of a final dividend for the year ended 31 December 2012 of 10.9 pence per share (equivalent to approximately £44.0 million) payable on or before 17 May 2013. The final dividend has not been included as a liability as at 31 December 2012.
7. Contingent liabilities The Company has provided unsecured guarantees to third parties in respect of contracts held by a subsidiary company. The guarantees have been issued for £nil consideration and the Company has not charged the subsidiary for the guarantees.
The Company has granted a charge over the assets of certain of its subsidiaries, in respect of the Group’s debt (detailed in note 18 to the consolidated financial statements), which is guaranteed and secured directly by each of the subsidiary undertakings of the Company that are party to the security arrangement. The Company itself is not a guarantor of the Group’s debt.
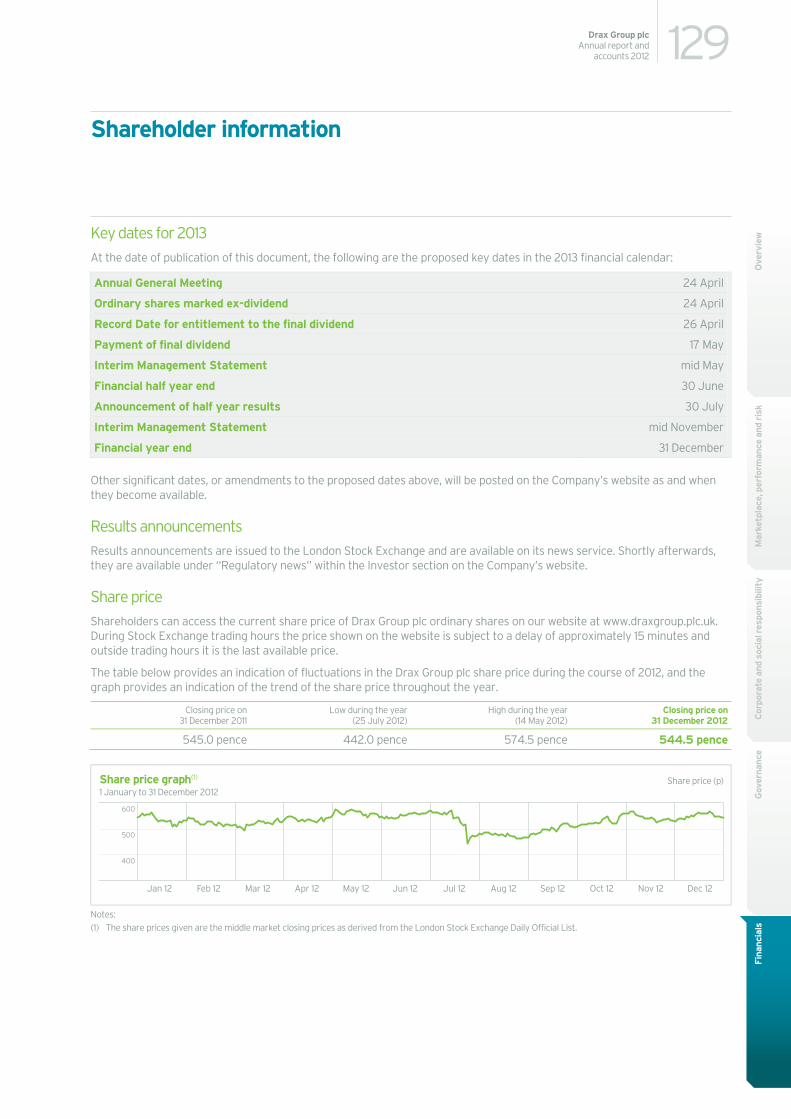
129Drax Group plcAnnual report and
accounts 2012
Mar
ketp
lace
, per
form
ance
and
ris
kC
orpo
rate
and
soc
ial r
espo
nsib
ility
Gov
erna
nce
Fina
ncia
lsO
verv
iew
Shareholder information
Key dates for 2013 At the date of publication of this document, the following are the proposed key dates in the 2013 financial calendar:
Annual General Meeting 24 April
Ordinary shares marked ex-dividend 24 April
Record Date for entitlement to the final dividend 26 April
Payment of final dividend 17 May
Interim Management Statement mid May
Financial half year end 30 June
Announcement of half year results 30 July
Interim Management Statement mid November
Financial year end 31 December
Other significant dates, or amendments to the proposed dates above, will be posted on the Company’s website as and when they become available.
Results announcements Results announcements are issued to the London Stock Exchange and are available on its news service. Shortly afterwards, they are available under “Regulatory news” within the Investor section on the Company’s website.
Share price Shareholders can access the current share price of Drax Group plc ordinary shares on our website at www.draxgroup.plc.uk. During Stock Exchange trading hours the price shown on the website is subject to a delay of approximately 15 minutes and outside trading hours it is the last available price.
The table below provides an indication of fluctuations in the Drax Group plc share price during the course of 2012, and the graph provides an indication of the trend of the share price throughout the year.
Closing price on 31 December 2011
Low during the year(25 July 2012)
High during the year (14 May 2012)
Closing price on 31 December 2012
545.0 pence 442.0 pence 574.5 pence 544.5 pence
Notes: (1) The share prices given are the middle market closing prices as derived from the London Stock Exchange Daily Official List.
Share price graph(1)
1 January to 31 December 2012
600
500
400
Mar 12Feb 12Jan 12 May 12 Jun 12Apr 12 Sep 12 Oct 12 Nov 12 Dec 12Jul 12 Aug 12
Share price (p)
130 Drax Group plcAnnual report and accounts 2012
Shareholder information
Market capitalisation The market capitalisation, based on the number of shares in issue and the closing middle market price at 31 December 2012, was approximately £2.2 billion.
Financial reports Copies of all financial reports we publish are available from the date of publication and can be downloaded from our website. Printed copies of reports can be requested by writing to the Company Secretary at the registered office, by clicking on “Contact Us” on our website, or direct by e-mail to [email protected].
Drax shareholder queries Drax’s share register is maintained by Equiniti Limited (“Equiniti”), who is primarily responsible for updating the share register and for dividend payments.
Shareholders should contact Equiniti directly if they have a query relating to their Drax shareholding. In particular queries regarding:
– Transfer of shares;
– Change of name or address;
– Lost share certificates;
– Lost or out-of-date dividend cheques;
– Payment of dividends direct to a bank or building society account;
– Death of a registered shareholder.
Equiniti can be contacted as follows:
– Call Equiniti on 0871 384 2030 from within the UK (calls to this number cost 8 pence per minute plus network charges. Lines are open from 8.30am to 5.30pm, Monday to Friday – excluding Bank Holidays); or +44 121 415 7047 from outside the UK.
– Write to Equiniti at Equiniti Limited, Aspect House, Spencer Road, Lancing, West Sussex BN99 6DA.
When contacting Equiniti by telephone or in writing it is advisable to have your shareholder reference to hand and quote Drax Group plc, as well as the name and address in which the shares are held.
Online communications Registering for online communications allows you to have more control over the administration of your shareholding. The registration process is easy via Equiniti’s secure website www.shareview.com.
Once registered with Shareview you are able to:
– elect how Drax communicates with you;
– amend some of your personal details;
– amend the way you receive dividends; and
– buy or sell shares online.
Registering for electronic communications does not mean that you can no longer receive paper copies of documents. We are able to offer a range of services and tailor the communications to meet your needs.
A range of frequently asked shareholder questions can also be found on the Drax website at www.draxgroup.plc.uk/investor/shareholder_info/shareholderfaq.
131Drax Group plcAnnual report and
accounts 2012
Mar
ketp
lace
, per
form
ance
and
ris
kC
orpo
rate
and
soc
ial r
espo
nsib
ility
Gov
erna
nce
Fina
ncia
lsO
verv
iewBeneficial owners and “information rights”
If your shares are registered in the name of a third party (i.e. an ISA provider or other nominee company) you may, if you wish, receive information rights under Section 146 of the Companies Act 2006. In order for this to happen, you must contact the third party registered holder, who will then nominate you. All communications by beneficial owners of shares where the shares are held by third party registered holders must be directed to that registered holder and not to Drax or Equiniti.
ShareGift ShareGift (registered charity No. 1052686) is an independent charity which provides a free service for shareholders wishing to dispose charitably of small parcels of shares, which would most likely cost more to sell than they are worth. There are no capital gains tax implications (i.e. no gain or loss) on gifts of shares to charity and it is possible to obtain income tax relief. Further information can be obtained directly from the charity at www.sharegift.org.
Share frauds (“Boiler room scams”) In recent years, many companies have become aware that their shareholders have received unsolicited phone calls or correspondence offering to purchase their shares at apparently inflated prices. It is often the case that the caller, or message in the correspondence claims that they represent a majority shareholder who is looking to take over the Company. Some Drax Group plc shareholders have received such communications in the latter part of 2012.
At the time of this report, the Company was not the subject of a take-over attempt, hostile or otherwise, and approaches such as those experienced by our shareholders are usually made by unauthorised companies and individuals. The approaches can be very persistent and extremely persuasive. Shareholders should be very wary of any unsolicited advice, offers to buy shares at a premium or offers of free reports into the Company.
If you receive any unsolicited investment advice or any offers to purchase your shares:
– make sure you get the correct name of the person and organisation;
– check that they are properly authorised by the Financial Services Authority (”FSA”) before getting involved. You can check at www.fsa.gov.uk/register;
– the FSA also maintains on its website a list of unauthorised overseas firms who are targeting, or have targeted, UK investors and any approach from such organisations should be reported to the FSA so that this list can be kept up to date and any other appropriate action can be considered. If you deal with an unauthorised firm, you would not be eligible to receive payment under the Financial Services Compensation Scheme;
– do not provide any personal details to callers e.g. bank details, full address;
– do not send your share certificates to anyone; and
– report the matter to the FSA either by calling 0845 606 1234 (cost of calls may vary) or visiting www.fsa.gov.uk/pages/consumerinformation.
The FSA advises that, if it sounds too good to be true, it probably is. The FSA also recommend ten steps to help protect shareholders and consumers from scams such as this. More detailed information on this or similar activity can be found on the FSA website (details above).
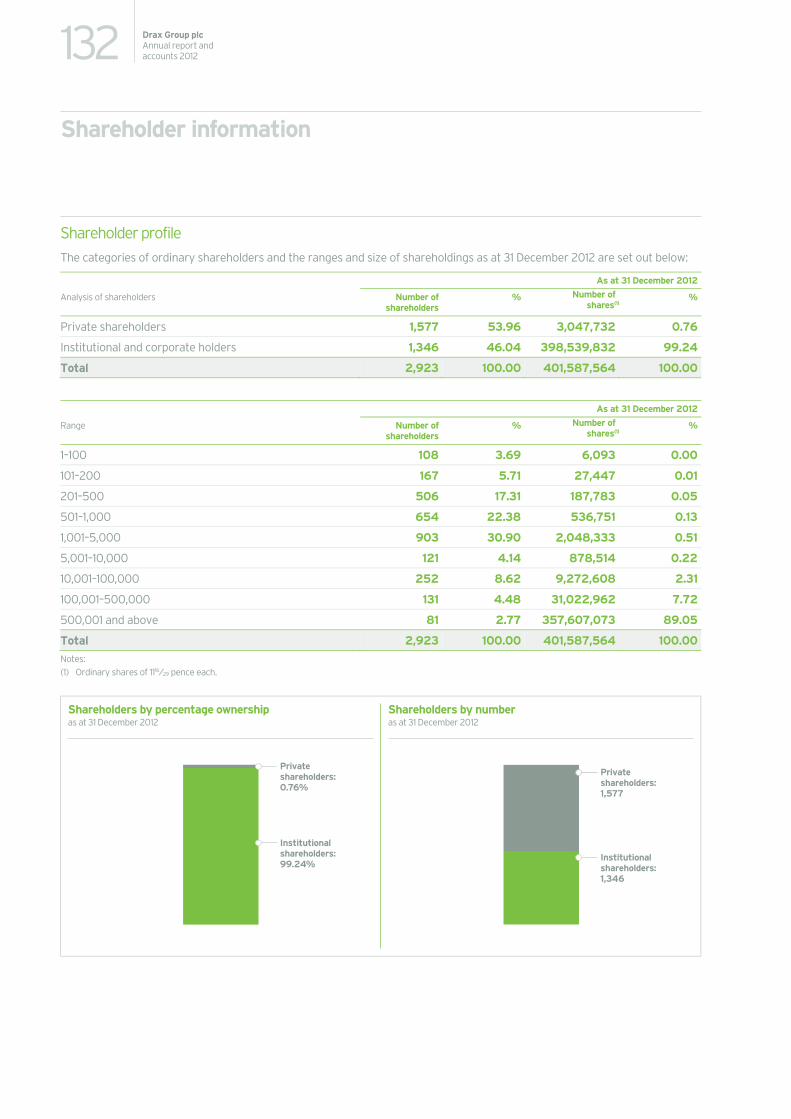
132 Drax Group plcAnnual report and accounts 2012
Shareholder information
Shareholder profile The categories of ordinary shareholders and the ranges and size of shareholdings as at 31 December 2012 are set out below:
As at 31 December 2012
Analysis of shareholders Number of shareholders
% Number of shares(1)
%
Private shareholders 1,577 53.96 3,047,732 0.76
Institutional and corporate holders 1,346 46.04 398,539,832 99.24
Total 2,923 100.00 401,587,564 100.00
As at 31 December 2012
Range Number of shareholders
% Number of shares(1)
%
1–100 108 3.69 6,093 0.00
101–200 167 5.71 27,447 0.01
201–500 506 17.31 187,783 0.05
501–1,000 654 22.38 536,751 0.13
1,001–5,000 903 30.90 2,048,333 0.51
5,001–10,000 121 4.14 878,514 0.22
10,001–100,000 252 8.62 9,272,608 2.31
100,001–500,000 131 4.48 31,022,962 7.72
500,001 and above 81 2.77 357,607,073 89.05
Total 2,923 100.00 401,587,564 100.00Notes: (1) Ordinary shares of 1116⁄29 pence each.
Shareholders by numberShareholders by percentage ownership as at 31 December 2012as at 31 December 2012
Institutionalshareholders:99.24%
Privateshareholders:0.76%
Institutionalshareholders:1,346
Privateshareholders:1,577
133Drax Group plcAnnual report and
accounts 2012
Mar
ketp
lace
, per
form
ance
and
ris
kC
orpo
rate
and
soc
ial r
espo
nsib
ility
Gov
erna
nce
Fina
ncia
lsO
verv
iewCompany information, professional advisers and service providers
Drax Group plc Registered office and trading address Drax Power Station Selby North Yorkshire YO8 8PH Telephone +44 (0)1757 618381 Fax +44 (0)1757 612192 www.draxgroup.plc.uk
Registration details Registered in England and Wales Company Number: 5562053
Company Secretary Philip Hudson
Enquiry e-mail address [email protected]
Professional advisers and service providers Auditor Deloitte LLP 2 New Street Square, London EC4A 3BZ
Bankers Barclays Bank PLC 1 Churchill Place, Canary Wharf, London E14 5HP
Brokers Deutsche Bank AG Winchester House, 1 Great Winchester Street, London EC2N 2DB
UBS Investment Bank 1 Finsbury Avenue, London EC2M 2PP
Financial PR Brunswick Group LLP 16 Lincoln’s Inn Fields, London WC2A 3ED
Registrars Equiniti Limited Aspect House, Spencer Road, Lancing, West Sussex BN99 6DA
Remuneration advisers PricewaterhouseCoopers LLP 1 Embankment Place, London WC2N 6RH
Solicitors Norton Rose LLP 3 More London Riverside, London SE1 2AQ
Slaughter and May LLP One Bunhill Row, London EC1Y 8YY
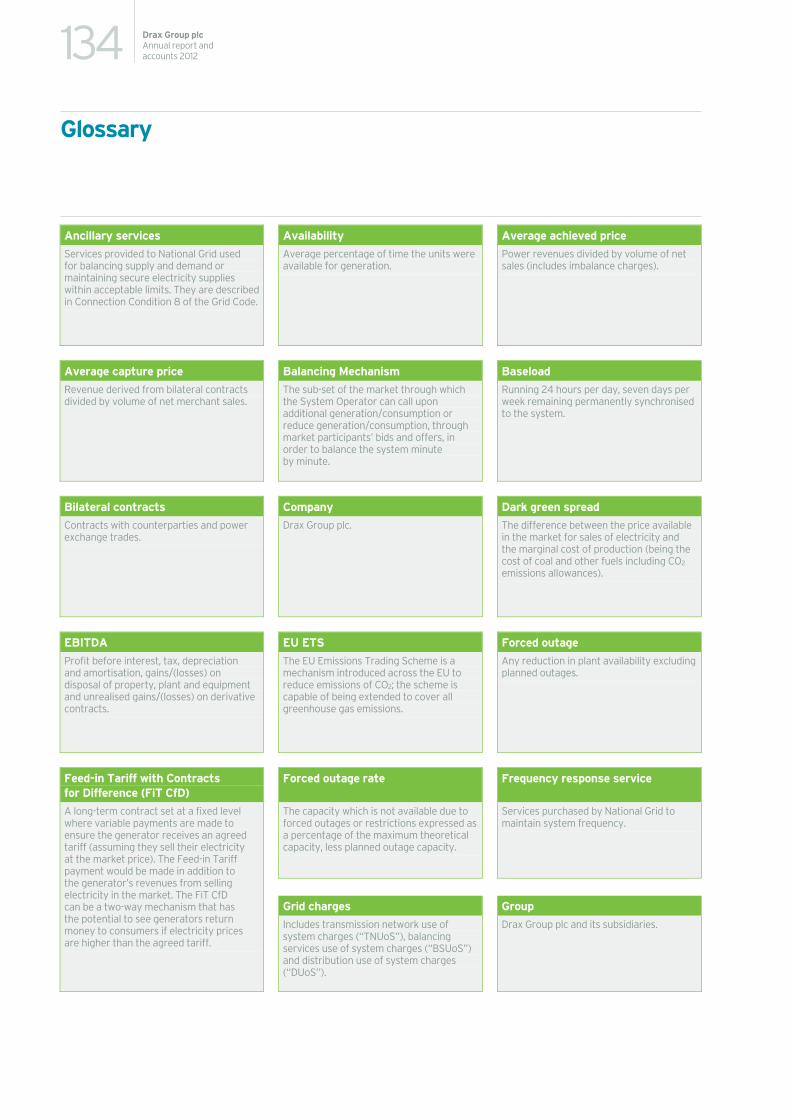
134 Drax Group plcAnnual report and accounts 2012
Glossary
Ancillary services Availability Average achieved price Services provided to National Grid used for balancing supply and demand or maintaining secure electricity supplies within acceptable limits. They are described in Connection Condition 8 of the Grid Code.
Average percentage of time the units were available for generation.
Power revenues divided by volume of net sales (includes imbalance charges).
Average capture price Balancing Mechanism Baseload Revenue derived from bilateral contracts divided by volume of net merchant sales.
The sub-set of the market through which the System Operator can call upon additional generation/consumption or reduce generation/consumption, through market participants’ bids and offers, in order to balance the system minute by minute.
Running 24 hours per day, seven days per week remaining permanently synchronised to the system.
Bilateral contracts Company Dark green spread Contracts with counterparties and power exchange trades.
Drax Group plc. The difference between the price available in the market for sales of electricity and the marginal cost of production (being the cost of coal and other fuels including CO2 emissions allowances).
EBITDA EU ETS Forced outage Profit before interest, tax, depreciation and amortisation, gains/(losses) on disposal of property, plant and equipment and unrealised gains/(losses) on derivative contracts.
The EU Emissions Trading Scheme is a mechanism introduced across the EU to reduce emissions of CO2; the scheme is capable of being extended to cover all greenhouse gas emissions.
Any reduction in plant availability excluding planned outages.
Feed-in Tariff with Contracts for Difference (FiT CfD)
Forced outage rate Frequency response service
A long-term contract set at a fixed level where variable payments are made to ensure the generator receives an agreed tariff (assuming they sell their electricity at the market price). The Feed-in Tariff payment would be made in addition to the generator’s revenues from selling electricity in the market. The FiT CfD can be a two-way mechanism that has the potential to see generators return money to consumers if electricity prices are higher than the agreed tariff.
The capacity which is not available due to forced outages or restrictions expressed as a percentage of the maximum theoretical capacity, less planned outage capacity.
Services purchased by National Grid to maintain system frequency.
Grid charges Group Includes transmission network use of system charges (“TNUoS”), balancing services use of system charges (“BSUoS”) and distribution use of system charges (“DUoS”).
Drax Group plc and its subsidiaries.
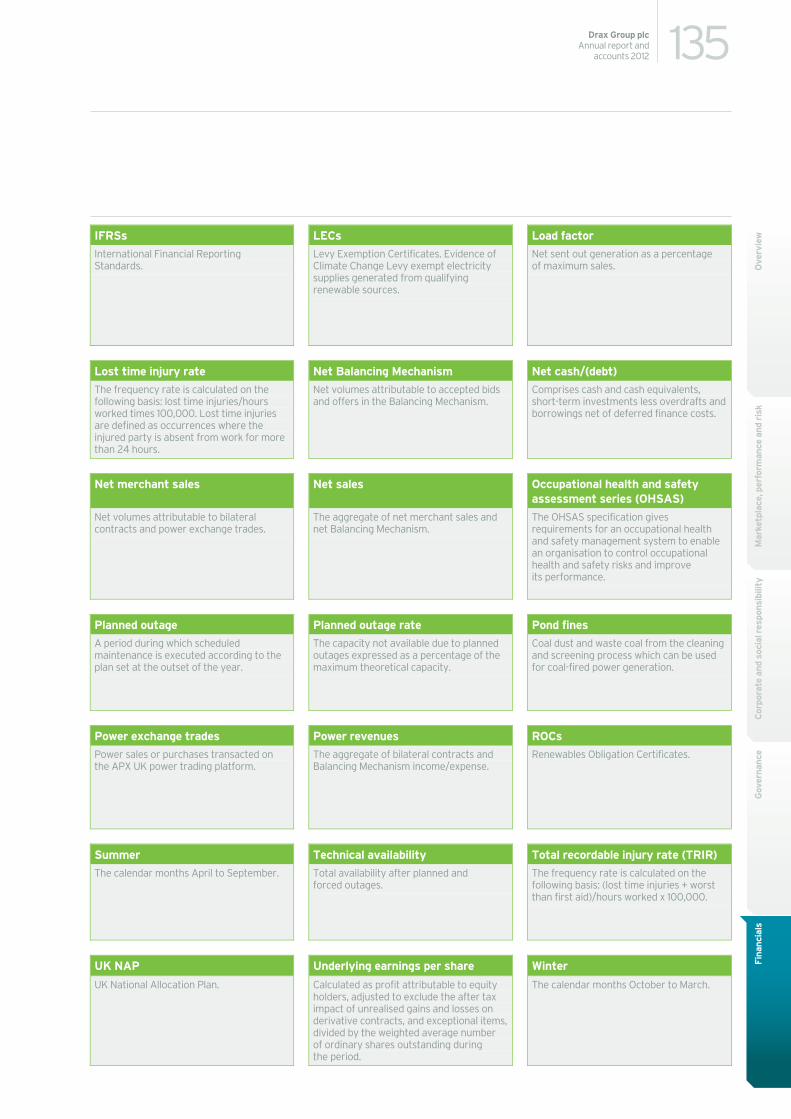
135Drax Group plcAnnual report and
accounts 2012
Mar
ketp
lace
, per
form
ance
and
ris
kC
orpo
rate
and
soc
ial r
espo
nsib
ility
Gov
erna
nce
Fina
ncia
lsO
verv
iew
IFRSs LECs Load factor International Financial Reporting Standards.
Levy Exemption Certificates. Evidence of Climate Change Levy exempt electricity supplies generated from qualifying renewable sources.
Net sent out generation as a percentage of maximum sales.
Lost time injury rate Net Balancing Mechanism Net cash/(debt) The frequency rate is calculated on the following basis: lost time injuries/hours worked times 100,000. Lost time injuries are defined as occurrences where the injured party is absent from work for more than 24 hours.
Net volumes attributable to accepted bids and offers in the Balancing Mechanism.
Comprises cash and cash equivalents, short-term investments less overdrafts and borrowings net of deferred finance costs.
Net merchant sales Net sales Occupational health and safety assessment series (OHSAS)
Net volumes attributable to bilateral contracts and power exchange trades.
The aggregate of net merchant sales and net Balancing Mechanism.
The OHSAS specification gives requirements for an occupational health and safety management system to enable an organisation to control occupational health and safety risks and improve its performance.
Planned outage Planned outage rate Pond fines A period during which scheduled maintenance is executed according to the plan set at the outset of the year.
The capacity not available due to planned outages expressed as a percentage of the maximum theoretical capacity.
Coal dust and waste coal from the cleaning and screening process which can be used for coal-fired power generation.
Power exchange trades Power revenues ROCs Power sales or purchases transacted on the APX UK power trading platform.
The aggregate of bilateral contracts and Balancing Mechanism income/expense.
Renewables Obligation Certificates.
Summer Technical availability Total recordable injury rate (TRIR) The calendar months April to September. Total availability after planned and
forced outages. The frequency rate is calculated on the
following basis: (lost time injuries + worst than first aid)/hours worked x 100,000.
UK NAP Underlying earnings per share Winter
UK National Allocation Plan. Calculated as profit attributable to equity holders, adjusted to exclude the after tax impact of unrealised gains and losses on derivative contracts, and exceptional items, divided by the weighted average number of ordinary shares outstanding during the period.
The calendar months October to March.

136 Drax Group plcAnnual report and accounts 2012
Notes
Design and production: Radley Yeldar | www.ry.com
Illustration: Graphic Ad
Board photography: Henry Thomas
Print: Park Communications Ltd
Park is an EMAS certified CarbonNeutral® Company and its Environmental Management System is certified to ISO14001.
100% of the inks used are vegetable oil based, 95% of press chemicals are recycled for further use and, on average 99% of any waste associated with this production will be recycled.
This document is printed on Revive 100 White Silk, a fully certified FSC® paper containing 100% de-inked post consumer waste. The pulp used to produce this product is bleached using a Totally Chlorine Free (TCF) process.

Drax G
roup plc Annual report and accounts 2012
Drax Group plc
Drax Power Station Selby North Yorkshire YO8 8PH
Telephone: +44 (0)1757 618381 Fax: +44 (0)1757 612192
www.draxgroup.plc.uk