POWERING TODAY, FOR TOMORROW - drax.com · Drax Group plc Annual report and accounts 2017 1 “THE...
186
POWERING TODAY, FOR TOMORROW Drax Group plc Annual report and accounts 2017
Transcript of POWERING TODAY, FOR TOMORROW - drax.com · Drax Group plc Annual report and accounts 2017 1 “THE...

POWERING TODAY,FOR TOMORROW
Drax Group plcAnnual report and accounts
2017
Drax Group plc Annual report and accounts 2017
2017 HIGHLIGHTS
DRAX GROUP INVESTMENT CASE AND 2025 AMBITION CONTENTS
£3,685mTOTAL REVENUE(2016: £2,950m)
£229mEBITDA(1)
(2016: £140m)
12.3pDIVIDEND PER SHARE(2016: 2.7p)
15%PERCENTAGE OF TOTAL UK RENEWABLE ELECTRICITY GENERATED(2)
(2016: 16%)
822kWOOD PELLETS PRODUCED(2016: 607k)
– Critical to decarbonisation of the UK’s energy system– Underlying growth in the core business and attractive
investment opportunities– Increasing earnings visibility, reducing commodity exposure– Strong financial position and clear capital allocation plan
These objectives are underpinned by safety, sustainability and expertise in our core markets, which support our ambition to deliver 2025 EBITDA in excess of £425 million – more than a third of which is expected to come from our B2B Energy Supply and Pellet Production businesses.
£545mGROSS PROFIT(2016: £376m)
£367mNET DEBT(2016: £93m)
0.27TOTAL RECORDABLE INJURY RATE(2016: 0.22)
376kRETAIL METER POINTS(2016: 41k)
Strategic report IFC 2017 highlights1 Introduction2 Our business model4 Market context8 Our strategic objectives12 Chairman’s statement14 Chief Executive’s review18 Performance review
Pellet ProductionPower GenerationB2B Energy Supply
30 Building a sustainable business42 Stakeholder engagement46 Group financial review50 Viability statement51 Principal risks and uncertainties
Governance58 Board of directors62 Letter from the Chairman64 Corporate governance report71 Nomination Committee report76 Audit Committee report81 Remuneration Committee report108 Directors’ report111 Directors’ responsibilities statement
Financial statements112 Independent auditor’s report to
the members of Drax Group plc119 Financial statements121 Financial statements contents122 Consolidated financial statements
Consolidated income statementConsolidated statement of comprehensive incomeConsolidated balance sheetConsolidated statement of changes in equityConsolidated cash flow statement
127 Financial performance138 Operating assets and working capital144 Financing and capital structure148 Other assets and liabilities153 Our people161 Risk management169 Reference information172 Company financial statements
Company balance sheetCompany statement of changes in equity
174 Notes to the Company financial statements
Shareholder information181 Company information182 Glossary
(1) EBITDA is defined as earnings before interest, tax, depreciation, amortisation and material one-off items that do not reflect the underlying trading performance of the business
(2) Drax estimates that it produced around 15% of the UK’s renewable electricity between Q4 2016 and Q3 2017 This is based upon the latest BEIS Energy Trends 6.1 data
Drax Group plc Annual report and accounts 2017 1
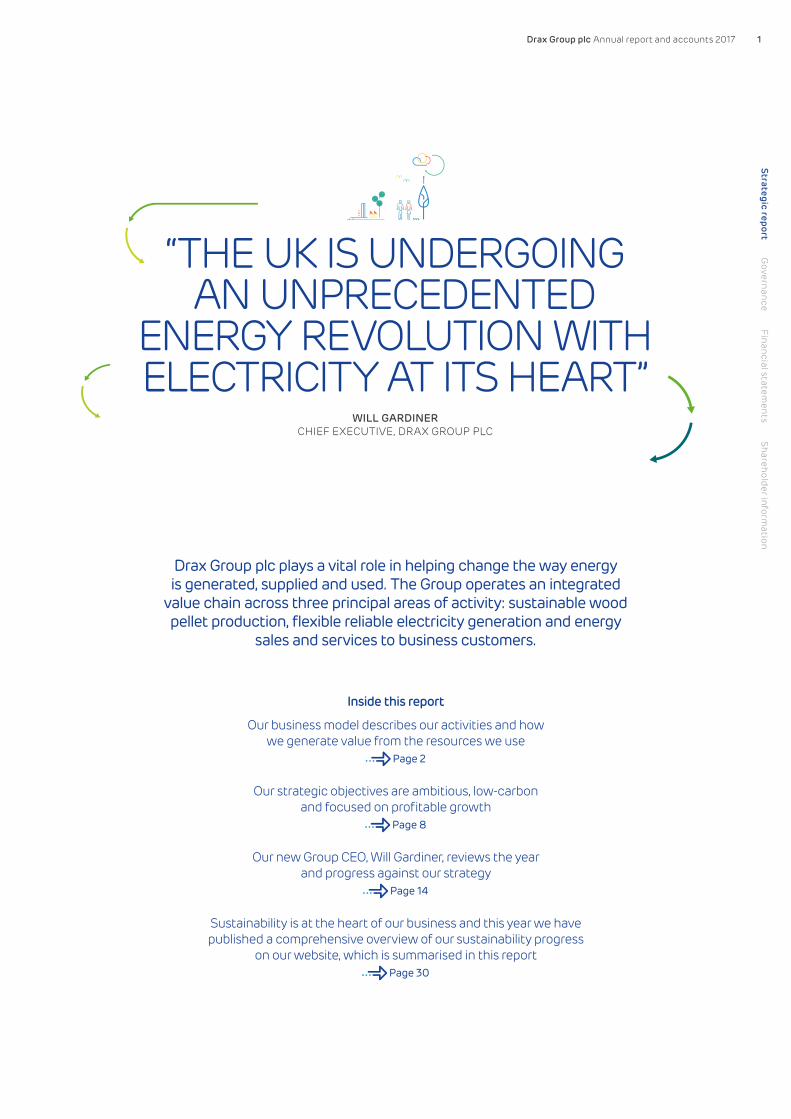
“THE UK IS UNDERGOING AN UNPRECEDENTED
ENERGY REVOLUTION WITH ELECTRICITY AT ITS HEART”
WILL GARDINERCHIEF EXECUTIVE, DRAX GROUP PLC
Drax Group plc plays a vital role in helping change the way energy is generated, supplied and used. The Group operates an integrated
value chain across three principal areas of activity: sustainable wood pellet production, flexible reliable electricity generation and energy
sales and services to business customers.
Inside this report
Our business model describes our activities and how we generate value from the resources we use
Page 2
Our strategic objectives are ambitious, low-carbon and focused on profitable growth
Page 8
Our new Group CEO, Will Gardiner, reviews the year and progress against our strategy
Page 14
Sustainability is at the heart of our business and this year we have published a comprehensive overview of our sustainability progress
on our website, which is summarised in this report Page 30
Strategic reportG
overnanceFinancial statem
entsShareholder inform
ation

Drax Group plc Annual report and accounts 20172
OUR BUSINESS MODEL
THROUGH OUR INTEGRATED VALUE CHAIN AND FLEXIBLE LOWER-CARBON ENERGY PROPOSITION, WE ARE SUPPORTING
THE UK’S ELECTRICITY REVOLUTION.
PELLET PRODUCTION AMBITION FOR 2025
A LEADING PRODUCER OF WOOD PELLETS FROM SUSTAINABLE LOW-VALUE COMMERCIAL FORESTRY RESIDUES.Manufacture and supply of good quality wood pellets to our Power Generation business for use in the generation of low-carbon electricity.
Revenues
£136m
822,000tpellets produced
Employees
258
Our assets: – 2 x 525k tonne pellet plants (operational) – 1 x 450k tonne pellet plant (commissioning) – 2.1m tonne throughput export facility
Our focus: – Operational excellence – good quality,
low-cost pellets – Continuous improvement and leverage
benefits of asset portfolio – Increase in wood pellet production capacity Current sites
EBITDA
>£75m – Targeting 30% self-supply
capability
Page 10
POWER GENERATION AMBITION FOR 2025
GENERATES 6% OF THE UK’S ELECTRICITY AND 15% OF ITS TOTAL RENEWABLE ELECTRICITY.Produces reliable, flexible low-carbon electricity from sustainably sourced wood pellets and provides system support services to the electricity grid from biomass and coal generation.
Revenues
£2.7bn
Generation
20.0TWh
65%Renewables
Employees
804
Our assets: – 3 x 645MW biomass generation and system
support, with plans to convert another coal unit to biomass
– 3 x 645MW coal generation and system support
Developing options: – 4 x 299MW Open Cycle Gas Turbines (OCGT) – 3.6GW coal-to gas repowering and
200MW battery
Our focus: – Optimise returns – Expand to support low-carbon future
and system support – Options for long-term efficiencies
Drax Power Station Options for Open CycleGas Turbine projects
EBITDA
>£300m – Includes the development
of four OCGTs if successful in capacity market auctions
Page 11
B2B ENERGY SUPPLY AMBITION FOR 2025
A LEADING SUPPLIER OF LOW-CARBON ENERGY SOLUTIONS TO INDUSTRIAL AND BUSINESS CUSTOMERS.Supplier of power, gas and value-adding services to industrial, corporate and small businesses. Our assets represent 10% of the B2B power market.
Revenues
£2.0bn
Customer meters
>375k
Power sales
20.1TWh
Employees
1,311
Our assets: – Opus Energy – Haven Power
Our focus: – Profitable B2B energy supply business – Innovative customer propositions – To be customer-centric – Make sustainability simple
Current sites
EBITDA
>£80m – Growth in market share
whilst maintaining margins
Page 11
OUR CORE ACTIVITIESOur activities are underpinned by safety, sustainability, operational excellence and expertise in our markets.

Drax Group plc Annual report and accounts 2017 3
PELLET PRODUCTION AMBITION FOR 2025
A LEADING PRODUCER OF WOOD PELLETS FROM SUSTAINABLE LOW-VALUE COMMERCIAL FORESTRY RESIDUES.Manufacture and supply of good quality wood pellets to our Power Generation business for use in the generation of low-carbon electricity.
Revenues
£136m
822,000tpellets produced
Employees
258
Our assets: – 2 x 525k tonne pellet plants (operational) – 1 x 450k tonne pellet plant (commissioning) – 2.1m tonne throughput export facility
Our focus: – Operational excellence – good quality,
low-cost pellets – Continuous improvement and leverage
benefits of asset portfolio – Increase in wood pellet production capacity Current sites
EBITDA
>£75m – Targeting 30% self-supply
capability
Page 10
POWER GENERATION AMBITION FOR 2025
GENERATES 6% OF THE UK’S ELECTRICITY AND 15% OF ITS TOTAL RENEWABLE ELECTRICITY.Produces reliable, flexible low-carbon electricity from sustainably sourced wood pellets and provides system support services to the electricity grid from biomass and coal generation.
Revenues
£2.7bn
Generation
20.0TWh
65%Renewables
Employees
804
Our assets: – 3 x 645MW biomass generation and system
support, with plans to convert another coal unit to biomass
– 3 x 645MW coal generation and system support
Developing options: – 4 x 299MW Open Cycle Gas Turbines (OCGT) – 3.6GW coal-to gas repowering and
200MW battery
Our focus: – Optimise returns – Expand to support low-carbon future
and system support – Options for long-term efficiencies
EBITDA
>£300m – Includes the development
of four OCGTs if successful in capacity market auctions
Page 11
B2B ENERGY SUPPLY AMBITION FOR 2025
A LEADING SUPPLIER OF LOW-CARBON ENERGY SOLUTIONS TO INDUSTRIAL AND BUSINESS CUSTOMERS.Supplier of power, gas and value-adding services to industrial, corporate and small businesses. Our assets represent 10% of the B2B power market.
Revenues
£2.0bn
Customer meters
>375k
Power sales
20.1TWh
Employees
1,311
Our assets: – Opus Energy – Haven Power
Our focus: – Profitable B2B energy supply business – Innovative customer propositions – To be customer-centric – Make sustainability simple
EBITDA
>£80m – Growth in market share
whilst maintaining margins
Page 11
USING VALUE CREATED MORE INFO
FINANCIAL – Broader base of core assets – Efficient debt, foreign exchange and trading
facilities to support strategy – Revised dividend policy
– Profit growth, earnings visibility and reduced commodity exposure
– Attractively priced financing and stable credit rating
– Acquisition of value-enhancing assets and long-term growth
– Sustainable and growing dividend
Page 46
MANUFACTURING – Investment in high-quality generation capabilities – Good quality pellets at lowest cost – Output and efficiency are key targets
– 13.0TWh biomass-fired electricity
– 822,000 wood pellets produced
Page 18–25
INTELLECTUAL – Experts and world leaders in sustainable
biomass generation and logistics – “Intelligent sustainability” for our customers – Innovation is key to business development
– Biomass generation represents 65% of total generation
Page 22
HUMAN – Excellent health and safety – Our people provide a wide range of knowledge
and skills – Our values (Honest, Energised, Achieving,
Together) guide the way we work
– TRIR 0.27 – 18,500 jobs supported
across the UK
Page 40
NATURAL – Only source biomass fibre from working forests,
where surplus stock is available as well as wood shavings and sawdust from commercial processes
– Largest single source of renewable electricity in the UK
– Biomass power is at least 80% lower carbon than coal
– 100% renewable power available to supply customers
Page 30
SOCIAL – Each business has strong links to its local
communities and we focus our charitable support on the areas where we operate
– We welcome visitors and our people volunteer in local communities
– 13,200 visitors to Drax Power Station
– 5,200 people reached via our outreach programme
Page 42
GENERATING VALUE FROM OUR RESOURCESCareful use of our resources allows us to create sustainable long-term value
for stakeholders whilst helping deliver our strategy.
Strategic reportG
overnanceFinancial statem
entsShareholder inform
ation

Drax Group plc Annual report and accounts 20174
MARKET CONTEXT
“THE ENERGY SECTOR IS CHANGING RAPIDLY, WITH SIGNIFICANT POTENTIAL
BENEFITS FOR CONSUMERS” STATE OF THE ENERGY MARKET 2017 REPORT – OFGEM
The boundaries between generators, suppliers and users are blurring as more users are choosing to generate their own energy or seeking to manage their energy use proactively. At the same time, the energy market is more competitive
with new market entrants.

5Drax Group plc Annual report and accounts 2017
(1) Total UK generation Q4 2016 - Q3 2017 BEIS Energy Trends 5.1
(2) Total renewable generation Q4 2016 - Q3 2017 BEIS Energy Trends 6.1 / Total UK generation Q4 2016–Q3 2017 BEIS Energy Trends 5.1
(3) www.cornwall-insight.com/documents/supply-markets/ business-electricity-market-share-survey
Drax generation in 2017
20TWh
% of the B2B market served by Drax(3)
10%
Percentage of UK generation from renewables(2)
27%
UK electricity generation(1)
337TWh
Strategic reportG
overnanceFinancial statem
entsShareholder inform
ation
Drax Group plc Annual report and accounts 20176
0 2012 2013 2014 2015 2016 To Q32017
20,000
40,000
100,000
80,000
60,000
120,000
Source: www.gov.uk/government/statistics/statistical-release-and-data-smart-meters-great-britainquarter-3-2017
MARKET CONTEXT CONTINUED
ACROSS PELLET PRODUCTION, POWER GENERATION AND B2B ENERGY SUPPLY, DRAX’S BUSINESSES ARE RESPONDING TO THE NEEDS OF A CHANGING ENERGY SYSTEM
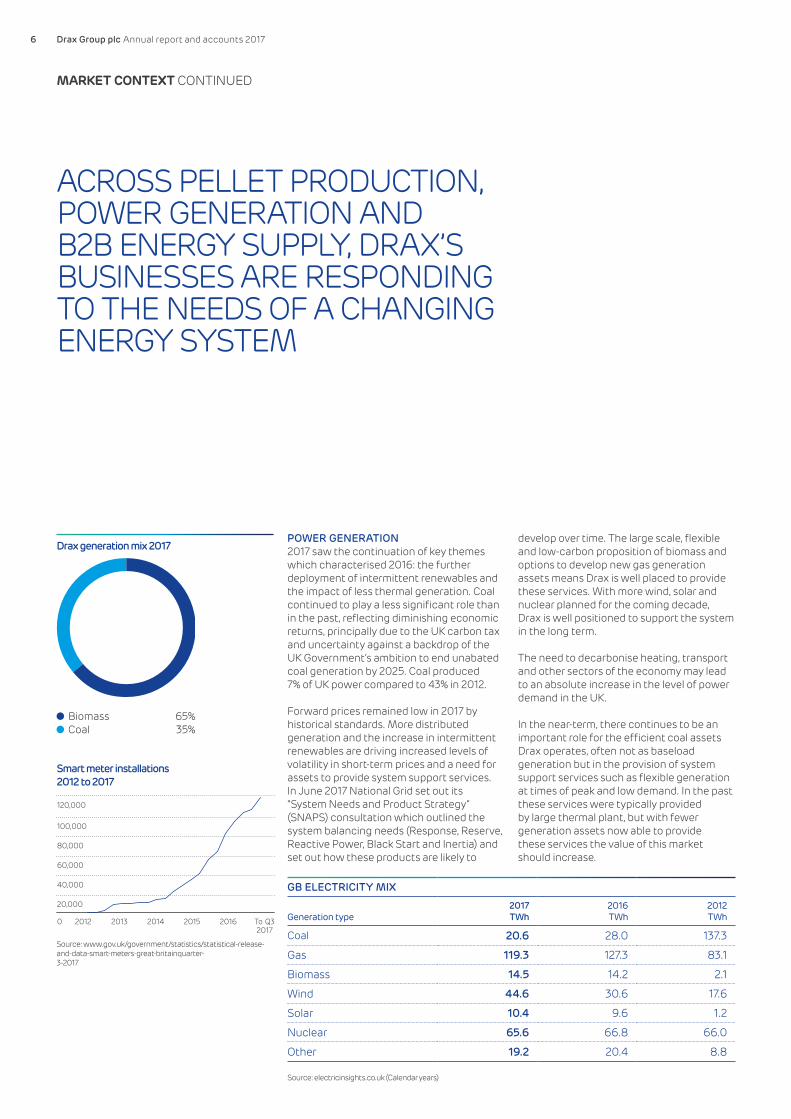
POWER GENERATION2017 saw the continuation of key themes which characterised 2016: the further deployment of intermittent renewables and the impact of less thermal generation. Coal continued to play a less significant role than in the past, reflecting diminishing economic returns, principally due to the UK carbon tax and uncertainty against a backdrop of the UK Government’s ambition to end unabated coal generation by 2025. Coal produced 7% of UK power compared to 43% in 2012.
Forward prices remained low in 2017 by historical standards. More distributed generation and the increase in intermittent renewables are driving increased levels of volatility in short-term prices and a need for assets to provide system support services. In June 2017 National Grid set out its “System Needs and Product Strategy” (SNAPS) consultation which outlined the system balancing needs (Response, Reserve, Reactive Power, Black Start and Inertia) and set out how these products are likely to
develop over time. The large scale, flexible and low-carbon proposition of biomass and options to develop new gas generation assets means Drax is well placed to provide these services. With more wind, solar and nuclear planned for the coming decade, Drax is well positioned to support the system in the long term.
The need to decarbonise heating, transport and other sectors of the economy may lead to an absolute increase in the level of power demand in the UK.
In the near-term, there continues to be an important role for the efficient coal assets Drax operates, often not as baseload generation but in the provision of system support services such as flexible generation at times of peak and low demand. In the past these services were typically provided by large thermal plant, but with fewer generation assets now able to provide these services the value of this market should increase.
GB ELECTRICITY MIX
Generation type2017TWh
2016TWh
2012TWh
Coal 20.6 28.0 137.3
Gas 119.3 127.3 83.1
Biomass 14.5 14.2 2.1
Wind 44.6 30.6 17.6
Solar 10.4 9.6 1.2
Nuclear 65.6 66.8 66.0
Other 19.2 20.4 8.8
Source: electricinsights.co.uk (Calendar years)
Drax generation mix 2017
Smart meter installations 2012 to 2017
Biomass 65%Coal 35%

Drax Group plc Annual report and accounts 2017 7
PELLET PRODUCTION2017 saw an increase in spot market prices for wood pellets. Our focus on long-term contracts and self-supply offers us protection from price rises. By approaching the market in this way we see opportunities to create value, such as through the addition of further pellet capacity to progress towards our target to self-supply up to 30% of our requirement. For the volume of biomass procured from third parties, our approach remains to source sustainable pellets underpinned by long-term contracts with fixed formula pricing and to actively hedge our long-term foreign exchange requirement. This approach gives us good long-term visibility of our biomass costs over a five-year period.
B2B ENERGY SUPPLYIn the context of a converging energy market, business to business (B2B) customers are seeking more support from their energy suppliers, including: competitive prices, expert support, renewable offers and flexible terms.
Smart meters are becoming a central part of the customer experience and their benefits are starting to be seen across the market. As of October 2017, 7.7 million smart meters had been installed in the UK and research by Smart Energy GB(1) shows they are driving behavioural change, with 86% of customers who have had a meter installed making energy saving changes.
Through our brands, Opus Energy and Haven Power, in the B2B market our offers are distinctive, tailored to the needs of customers which will allow the Group to play a significant role in the changing energy market.
In October 2017 the Government published a Bill to implement an energy price cap on default tariffs in the domestic supply market (commonly known as Standard Variable Tariffs). Drax is monitoring this development closely but we do not operate in the domestic market.
Balancing use of system charge (£m)
2016
2017
2015
2014
1,285
1,046
1,015
1,027
Source: www.nationalgrid.com/uk/electricity/market-operations-and-data/system-balancing-reports
Thermal generation vs renewable (TWh)
2013201220112010 2014 2015 2016 20170
50
100
150
200
250
Renewable energy Thermal
Source: electricinsights.co.uk (Calendar years)
The market trends seen in 2016 continued in 2017.
(1) www.smartenergygb.org
Strategic reportG
overnanceFinancial statem
entsShareholder inform
ation

Drax Group plc Annual report and accounts 20178
OUR STRATEGIC OBJECTIVES
MEETING THE NEEDS OF A CHANGING ENERGY
LANDSCAPE AND CREATING VALUE FOR STAKEHOLDERS
Underpinned by safety, sustainability, operational excellence
and expertise in our markets.
2016 EBITDA(1)
£140m
2017 EBITDA
£229m
2025 EBITDA ambition
£425m(1) EBITDA is defined as earnings before interest, tax, depreciation, amortisation
and material one-off items that do not reflect the underlying trading performance of the business

Drax Group plc Annual report and accounts 2017 9
PROGRESSING THE STRATEGY
GROUP
Our ambition for EBITDA
>£425mby 2025
Progress in 2017 – EBITDA growth in all areas,
up 64% year-on-year – Higher quality earnings – CfD
contract and acquisition of Opus Energy
– New dividend policy – a sustainable and growing dividend
– Refinancing completed
Page 14
PELLET PRODUCTION
Progress in 2017 – Now profitable at EBITDA level – Pellet production, up 35% year-
on-year – Acquisition of LaSalle Bioenergy
completed, now commissioning – Increased capacity at Amite and
Morehouse plants
Page 18
Our ambition for EBITDA
>£75mby 2025
POWER GENERATION
Progress in 2017 – Improvement in EBITDA, 37% year-on-
year increase – Increase in non-commodity revenues – CfD,
ROC and capacity payments – Continued reduction in carbon emissions – Development of system support services – Successful completion of major planned
outage programme on CfD unit – Commenced planning application for
coal-to-gas repowering and battery storage option
– Progressed and de-risked OCGT projects
Page 22
B2B ENERGY SUPPLY
Our ambition for EBITDA
>£80mby 2025
Progress in 2017 – Acquisition of Opus Energy, on-boarding
progressing well – Haven Power now profitable at EBITDA level – Continued growth in customer numbers – Progressing IT replatforming to provide
better information and operational improvements
Page 26
Our ambition for EBITDA
>£300mby 2025
Our strategic achievements are linked to remuneration.
Page 81
Strategic reportShareholder inform
ationFinancial statem
entsG
overnance

Drax Group plc Annual report and accounts 201710
50%increase in production capacity allowing us to process 1.5 million tonnes of pellets per year
OUR STRATEGIC OBJECTIVES CONTINUED
PELLET PRODUCTIONACQUISITION OF LASALLE BIOENERGY (LASALLE)
In April we completed the acquisition of LaSalle which will provide an additional 450k tonnes of pellet capacity and make a meaningful contribution to our target of self-supplying 30% of our pellet requirement for power generation.
LaSalle was acquired for $35 million and after a $27 million investment programme the unit is now commissioning.
The plant is located in close proximity to our existing assets in the US Gulf region and will deliver significant operational and financial benefits, once fully commissioned.
PELLET PRODUCTION
ADDITIONAL LOW-COST PELLET CAPACITY AT AMITE AND MOREHOUSEDuring 2017 we installed and commissioned 150kt of additional unloading and storage capacity at our Amite and Morehouse pellet plants, which allows us to receive and process a greater amount of lower cost residues from commercial forestry and lumber mill processes. These facilities will help reduce our overall biomass cost.
LOOKING AHEADAs the UK transitions to a low-carbon economy, major carbon savings will need to be delivered across generation heating and transport.
If the UK is to achieve its aims it will need to electrify heating and transport, which will increase power demand and require new sources of generation.
We take a long-term approach, seeking to identify options which can deliver value-accretive growth to 2025 and beyond. To that end we continue to look for opportunities through Research and Innovation (R&I) to support our ambitions for 2025, identifying additional sources of value from our core areas of activity – Pellet Production, Power Generation and B2B Energy Supply.
FLEXIBLE, LOW-CARBON AND RELIABLE – THE LONG-TERM NEED FOR BIOMASS ELECTRICITYDemand for low-carbon electricity is set to increase with more intermittent renewables and less thermal generation available to support the system.
National Grid’s System Needs and Product Strategy report suggests that within four years the generation schedule presented by the market will be inadequate to maintain security of supply up to 60% of the time, without some form of intervention.
We therefore see a long-term role for biomass in the UK generation market. To help deliver this, our R&I team is highly focused on opportunities to drive efficiencies into our supply chain and reduce biomass costs.
PROGRESSING OUR STRATEGY FOR 2025During 2017 we made excellent progress in delivering our strategy for 2025 and beyond.
OTHER DEVELOPMENTS
www.nationalgrid.com/uk/electricity/balancing-services/future-balancing-services

Drax Group plc Annual report and accounts 2017 11
POWER GENERATION
OPEN CYCLE GAS TURBINE (OCGT) DEVELOPMENTDuring the year we progressed development of four OCGT projects which will begin construction once we have secured a 15-year capacity contract for their power. These plants will take three years to build and commission before the delivery period for the contract commences.
Once operational, the plants will each provide 299MW of fast, flexible gas generation to meet peak power demand and provide system support services.
Page 23
B2B ENERGY SUPPLY
ACQUISITION OF OPUS ENERGY
In February 2017 the Group acquired Opus Energy, a leading player in the SME sector of the B2B energy supply market. Opus Energy has now been successfully integrated with the Group alongside our existing Haven Power business, positioning the Group as the fifth largest B2B energy supply operator in the UK.
POWER GENERATION
COAL TO BIOMASS CONVERSIONIn January 2018 the UK government confirmed support for conversion of a fourth unit to biomass fuel. The conversion of unit 4 will complete during 2018 allowing us to optimise generation across three ROC accredited units.
COAL-TO-GAS REPOWERINGWe are developing an option for up to 3.6GW of gas generation by repowering two of our remaining coal units at Drax Power Station. This would utilise existing infrastructure to deliver a lower cost solution for new Combined Cycle Gas Turbines (CCGT) and reduce carbon emissions versus coal, with a wide operating range covering baseload and peaking generation, in addition to system support services. Alongside this we are developing an option for a new 200MW battery storage facility through which we could provide immediate system support services as part of the UK’s energy revolution.
These developments are progressing through a public consultation after which they could participate in a future capacity market auction and receive a 15-year capacity agreement, which would underpin the investment decision.
ACADEMIC PARTNERSHIPS FOR FUTURE INNOVATIONWe are funding postgraduate research at Sheffield University’s Centre for Doctoral Training in Energy Storage and its Applications. Can flow batteries support the national high voltage transmission system, once dominated by thermal generators? How will customers interact with us, using smart technology to turn their company car fleets into mini power plants? And how may we be able to scrub the flue gas – and potentially capture or use carbon dioxide emissions?
Find out more: www.drax.com/sheffielduni
Strategic reportG
overnanceFinancial statem
entsShareholder inform
ation
Drax Group plc Annual report and accounts 201712 Drax Group plc Annual report and accounts 201712
CHAIRMAN’S STATEMENT
“OUR FLEXIBLE, LOW-CARBON AND CUSTOMER-FOCUSED APPROACH WILL DELIVER
HIGH QUALITY EARNINGS AND OPPORTUNITIES FOR GROWTH”
PHILIP COX CBECHAIRMAN, DRAX GROUP
INVESTMENT CASE1 Critical to decarbonisation
of the UK’s energy system2 Underlying growth in the
core business and attractive investment opportunities
3 Increasing earnings visibility, reducing commodity exposure
4 Strong financial position and clear capital allocation plan

Drax Group plc Annual report and accounts 2017 13Drax Group plc Annual report and accounts 2017 13
In 2017 we made significant progress with the strategy we announced in December 2016.
First, we completed the acquisition of Opus Energy – a leading challenger brand in the UK Small and Medium-sized Enterprise (SME) energy market; second, we acquired a third biomass pellet plant (LaSalle Bioenergy), which significantly increases our pellet production capacity; and third, we continued to develop options for flexible gas generation at four sites around the UK.
We also began developing longer-term options for growth, with the exploration of coal-to-gas repowering at Drax Power Station, as we look to provide new sources of flexible generation backed up by long-term capacity contracts. To support our strategy, we completed a refinancing in May and announced a new dividend policy in June.
At the same time, we have continued to provide a significant amount of the UK’s renewable electricity. With confirmation of Government support for further biomass generation at Drax Power Station we plan to continue our work to develop a low-cost solution for a fourth biomass unit conversion, allowing us to provide even more renewable electricity, whilst supporting system stability at minimum cost to the consumer.
Opus Energy performed well, delivering on the plans we set out at the time of acquisition and, in North America, LaSalle Bioenergy is successfully commissioning. This performance alongside safety, sustainability and expertise in our core markets acts as a strong base from which the business can grow and deliver long-term sustainable value.
We have a major role to play in supporting the UK energy system, as it becomes increasingly ambitious in decarbonising, first the electricity sector and subsequently transport and heating. In doing so, through our flexible, low-carbon and customer-focused approach we aim to deliver higher quality earnings, with a reduction in commodity exposure alongside opportunities for growth.
Our people – employees and contractors – remain a key asset of the business. Their safety remains at the centre of our operational philosophy and we have performed well in this regard, although we continue to work to improve our performance across the Group.
RESULTS AND DIVIDENDEBITDA in 2017 of £229 million was significantly ahead of 2016 (£140 million).
This increase was principally from producing high levels of renewable power from sustainable biomass. We also benefited from our growing B2B Energy Supply and Pellet Production businesses. Through these activities we are improving the visibility of our earnings.
In June we announced a new dividend policy. This policy is to pay a dividend which is sustainable and expected to grow as the implementation of the strategy generates an increasing proportion of stable earnings and cash flows. In determining the rate of growth in dividends the Board will take account of contracted cash flows, the less predictable cash flows from the Group’s commodity based business and future investment opportunities. If there is a build-up of capital the Board will consider the most appropriate mechanism to return this to shareholders.
At the 2017 half year results we confirmed an interim dividend of £20 million (4.9 pence per share) representing 40% of the full year expected dividend of £50 million (12.3 pence per share) (2016: £10 million, 2.5 pence per share). Accordingly, the Board proposes to pay a final dividend in respect of 2017 of £30 million, equivalent to 7.4 pence per share. In addition, the Board has decided to announce a £50 million share buy-back programme, which will take place during 2018, which is consistent with our capital allocation policy.
CORPORATE GOVERNANCEIn September, Dorothy Thompson CBE announced her intention to stand down as Group Chief Executive Officer (CEO). I would like to thank Dorothy for her enormous contribution to the Group over the last 13 years. During her tenure Dorothy led the transformation of the business and leaves the Group in a strong position with a clear strategy that lays the foundations for further success in a changing energy sector.
Dorothy is succeeded by Will Gardiner, who was previously Group Chief Financial Officer (CFO) and a key architect of the strategy. His appointment follows a thorough review of internal and external candidates and is a natural progression after two years working alongside Dorothy developing a strategy which I am confident will create significant benefits for all Drax’s stakeholders.
A process to appoint a permanent CFO is underway and Den Jones has been appointed as Interim CFO. Den is highly experienced, having previously served as CFO of both Johnson Matthey and BG Group. Drax remains committed to the highest standards of corporate governance. The Board and its committees play an active role in guiding the Company and leading its
strategy. We greatly value the contribution made by our Non-Executive Directors (NEDs) and during a time of transition their role is especially important.
We indicated last year that we were seeking additional NEDs with experience in sustainability and energy supply to complement our already experienced Board. I am therefore delighted to welcome two new NEDs to the Drax Board. Firstly, David Nussbaum, whose in-depth knowledge of sustainability will support our continued focus in this area; and secondly, Nicola Hodson, whose experience in technology, business transformation and energy, will provide real value as the Group delivers its strategy.
Sustainability remains at the heart of the business, both the specific sustainability of biomass and more broadly the long-term sustainability of the business. As such I am pleased to note that alongside this year’s annual report and accounts the Group has published a a comprehensive overview of our sustainability progress in 2017 on our website www.drax.com/sustainability.
Full details of our corporate governance can be found on page 64.
OUR PEOPLEAs the Group grows I would also like to welcome colleagues from Opus Energy and our other developments. On-boarding is proceeding well and by working together in our common goal to help change the way energy is generated, supplied and used, we are creating real value for all stakeholders.
I must thank all the employees and contractors who have worked so hard to help the Group succeed in the last 12 months. It is through their skill, expertise and hard work that we are able to deliver our strategy for the business.
My sincere thanks to colleagues for their commitment and hard work.
It only remains for me to say that your Board remains totally committed to the complementary aims of delivering sustainable long-term value for the Group, and of helping our country build a low-carbon economy.
PHILIP COX CBECHAIRMAN
Strategic reportG
overnanceFinancial statem
entsShareholder inform
ation

Drax Group plc Annual report and accounts 201714 Drax Group plc Annual report and accounts 201714
CHIEF EXECUTIVE’S REVIEW
“WE ARE PROGRESSING OUR STRATEGY AGAINST
A BACKDROP OF FUNDAMENTAL CHANGE IN THE UK ENERGY MARKET”
WILL GARDINERCHIEF EXECUTIVE, DRAX GROUP
KEY MILESTONES IN 20171 Acquisition of Opus Energy2 Refinancing complete3 Acquisition and commissioning
of LaSalle Bioenergy4 Confirmation of new dividend policy5 Commenced planning application
for coal-to-gas repowering and battery storage option
PERFORMANCE1 Significant growth in EBITDA
across all areas of the Group2 Mixed results in Group scorecard3 Positive safety record continued4 Stretching operational
targets not achieved5 Strong contribution from
B2B Energy Supply

Drax Group plc Annual report and accounts 2017 15Drax Group plc Annual report and accounts 2017 15
MARKET BACKGROUNDThe UK is undergoing an energy revolution – a transition to a low-carbon economy requiring new energy solutions for power generation, heating, transport and the wider economy. Through our flexible, lower carbon electricity proposition and business to business (B2B) energy solutions, the Group is positioning itself for growth in this environment. More details can be seen on page 4.
OUR STRATEGYOur purpose is to help change the way energy is generated, supplied and used.
Through addressing UK energy needs, and those of our customers, our strategy is designed to deliver growing earnings and cash flow, alongside significant cash returns for shareholders.
Our ambition is to grow our EBITDA to over £425 million by 2025, with over a third of those earnings coming from Pellet Production and B2B Energy Supply to create a broader, more balanced earnings profile. We intend to pay a sustainable and growing dividend to shareholders. Progression towards these targets is underpinned by safety, sustainability, operational excellence and expertise in our markets.
SUMMARY OF 2017We made significant progress during 2017, but were below our expectations on the challenging scorecard targets we set ourselves in pellet production and biomass availability, the latter reflecting the significant incident we experienced on our biomass rail unloading facilities at the end of 2017, which extended into January 2018. Energy Supply performed well with Opus Energy in line with plan and Haven Power exceeding its targets. Through a combination of this performance and the progress of our strategy we have delivered EBITDA of £229 million, significantly ahead of 2016 (£140 million) and with each of our three businesses contributing positive EBITDA for the first time.
The Group scorecard is reported in full in the Remuneration Report and the KPIs are also shown on the following pages of this review. They reflect the diversity of our operations and our need to maintain clear focus on delivering operational excellence.
On a statutory basis we recorded a loss of £151 million, which reflects unrealised losses on derivative contracts, previously announced accounting policy on the accelerated depreciation on coal-specific assets as well as amortisation of newly-acquired intangible assets in Opus Energy. We also calculate underlying earnings, a profit after tax of £2.7 million, which excludes the effect of unrealised gains and losses on derivative contracts and, to assess the performance of the Group without the income statement volatility introduced by non-cash fair value adjustments on our portfolio of forward commodity and currency futures contracts.
During the year we refinanced our existing debt facilities, reducing our debt cost. We also confirmed a new dividend policy which will pay a sustainable and growing dividend (£50 million in respect of 2017), consistent with our commitment to a strong balance sheet and our ambitions for growth. At year end our net debt was £91 million below our 2x net debt to EBITDA target, providing additional headroom. There is more detail on our financial performance in the Group Financial Review on page 46.
In the US, our Pellet Production operations recorded year-on-year growth in output of 35%, with our first two plants now producing at full capacity. During the second half of 2017 we also completed the installation of additional capacity enabling our Morehouse and Amite facilities to handle a greater amount of residue material, supporting efforts to produce good quality pellets at the lowest cost.
As part of our target to expand our biomass self-supply capability we completed the acquisition of LaSalle Bioenergy (LaSalle) adding pellet production capacity. LaSalle commenced commissioning in November 2017 and due to its close proximity to our existing US facilities, once complete, will provide further opportunities for supply chain optimisation.
As in 2016, we benefited from the flexibility of self-supply. This often overlooked attribute of our supply chain enables us to manage biomass supply across the Power Generation business’ planned outage season and to benefit from attractively priced biomass cargoes in the short-term spot market.
In Power Generation, we experienced a significant incident on our biomass rail unloading facilities, including a small fire on a section of conveyor. We fully investigated the incident and following repairs over the Christmas period have now recommissioned the facility, with enhanced operating procedures. This is a timely reminder of the combustible nature of biomass and the need for strong controls and processes to protect our people and assets.
Our biomass units continued to produce high levels of renewable electricity from sustainable wood pellets for the UK market – Drax produced 15% of the UK’s renewable electricity – enough to power Sheffield, Leeds, Liverpool and Manchester combined. In doing so, we are making a vital contribution to the UK’s ambitious targets for decarbonisation across electricity generation, heating and transport – an 80% reduction by 2050 vs. 1990 levels.
We benefited from the first year of operation of our third biomass unit under the Contract for Difference (CfD) scheme which provides an index-linked price for the power produced until March 2027. The unit underwent a major planned outage between September and November, with a full programme of works successfully completed.
The flexibility, reliability and scale of our renewable generation, alongside an attractive total system cost, means we are strongly placed to play a long-term role in the UK’s energy mix. To that end we continue to see long-term biomass generation as a key enabler, allowing the UK Government to meet its decarbonisation targets and the system operator to manage the grid.
The UK Government recently confirmed support for further biomass generation at Drax Power Station and we now plan to continue our work to develop a low-cost solution for a fourth biomass unit, allowing us to provide even more renewable electricity, whilst supporting system stability at minimum cost to the consumer.
£229mEBITDA(2017: £140m)
Strategic reportG
overnanceFinancial statem
entsShareholder inform
ation

Drax Group plc Annual report and accounts 201716 Drax Group plc Annual report and accounts 201716
Our heritage is coal, but our future is flexible lower-carbon electricity. We are making progress with the development of four new standalone OCGT plants situated in eastern England and Wales and our work to develop options for coal-to-gas repowering with battery technologies. If these options would be supported by 15-year capacity market contracts, providing a clear investment signal and extending visibility of contract-based earnings out to the late 2030s.
In B2B Energy Supply, we completed the acquisition of Opus Energy, a supplier of electricity and gas to corporates and small businesses. The transaction completed in February 2017 and Opus Energy has continued to operate successfully within the Group, achieving its targets and making an immediate and significant contribution to profitability. Alongside this good performance we have also implemented the operational steps necessary to realise further operational benefits of the acquisition, and we now source all of Opus’ power and gas internally.
Haven Power delivered a strong performance with the sale of large volumes of electricity to industrial customers. Through our customer focus and efficiencies, margins have improved and the business generated a positive EBITDA for the first time.
Together, our B2B Energy Supply business now has over 375,000 customer meters, making it the fifth largest B2B power supplier in the UK. We are delivering innovative low-carbon power solutions, with 46% of our energy sold from renewable sources. As the power system transforms, we will be working closely with our customers to help them adapt to a world of more decentralised and decarbonised power. We see this as a significant opportunity for the Group in the medium to long term.
In October 2017 we completed the sale of Billington Bioenergy (BBE) to Aggregated Micro Power Holding (AMPH). Consideration for the transaction was £2.3 million, comprised of £1.6 million of shares in AMPH and £0.7 million of cash.
The sale of BBE is aligned with our strategy to focus on B2B energy supply. However, through our shareholding in AMPH, we will retain an interest in the UK heating market, whilst gaining exposure to the development of small-scale distributed energy assets.
POLITICAL, REGULATORY AND ECONOMIC BACKGROUNDWe continue to operate in a changing environment. The full impact of the UK’s decision to leave the EU is still unknown.
The immediate impact on the Group was a weakening of Sterling and an associated increase in the cost of biomass, which is generally denominated in other currencies. Through our utilisation of medium-term foreign exchange hedges the Group protected the cash impact of this weakness. In 2017, Sterling has generally strengthened, and we have been able to extend our hedged position out to 2022 at rates close to those that we saw before Brexit.
In terms of UK energy policy, the Government’s main focus has been on what it sees as unfair treatment of domestic consumers on legacy standard variable tariff (SVT) contracts. SVT are not a common feature of the B2B market. At the microbusiness end of this market, which is closer in size to domestic, most of our customers are on fixed price products and are active in renewing contracts.
The UK Government’s response to its consultation on the cessation of coal generation by 2025 has confirmed an end to non-compliant coal generation by October 2025. We believe our assets, projects and ability to support our customers’ electricity management will support the Government’s ambition to maintain reliability when coal generation ceases.
Running a resilient, reliable grid is not simply about meeting the power demand on the system; there are also system support services which are essential to its effective operation. As the grid decentralises and becomes dependent on smaller, distributed generation, the number of plants able to provide these services is reducing. Biomass generation, our proposed OCGTs and our repowering project would allow us to meet these needs, but this will not come for free. A reliable, flexible, low-carbon energy system will require the right long-term incentives.
In November 2017, the Government confirmed that the UK will maintain a total carbon price (the combined UK Carbon Price Support – CPS – and the European Union Emissions Trading Scheme – EU ETS) at around the current level. CPS has been the single most effective instrument in reducing the level of carbon emissions in generation and we continue to support the pricing of carbon, a view echoed in a report prepared for the UK Government by the leading academic Professor Dieter Helm. (www.biee.org/wpcms/wp-content/uploads/Cost_of_Energy_Review.pdf)
Against this backdrop we continue to make an important contribution to the UK economy. According to a study published by Oxford Economics in 2016 (Draximpact.co.uk), Drax’s total economic impact – including our supply chain and the wages our employees and suppliers’ employees spend in the wider consumer-economy was £1.7 billion, supporting 18,500 jobs across the UK.
SAFETY, SUSTAINABILITY AND PEOPLEThe health, safety and wellbeing of our employees and contractors is vital to the Group, with safety at the centre of our operational philosophy. We also recognise the growing need to support the wellbeing of our employees and their mental health.
B2B Energy Supply customer meters
>375k
CHIEF EXECUTIVE’S REVIEW CONTINUED

Drax Group plc Annual report and accounts 2017 17Drax Group plc Annual report and accounts 2017 17
During the year we continued to use Total Recordable Injury Rate (TRIR) as our primary KPI in this area. Performance was positive, at 0.27, but we expect this to improve in the coming year.
The incident at our biomass rail unloading facilities in December did not lead to physical injuries but was nonetheless a significant event and caused disruption into 2018. We consequently launched an incident investigation to ensure our personal and process safety management procedures are robust.
To promote greater awareness around wellbeing we have embedded this in our new people strategy (see below) and expect to focus more energy and resources on this important area during 2018.
Strong corporate governance is at the heart of the Group – acting responsibly, doing the right thing and being transparent. As the Group grows the range of sustainability issues we face is widening and recognising the importance of strong corporate governance, we have published a comprehensive overview of our sustainability progress in 2017 on our website. This also highlights future priorities to broaden our approach to sustainability and improved reporting of environment, social and governance (ESG) performance. We have also completed the process which allows us to participate in the UN Global Compact (UNGC) – an international framework which will guide our approach in the areas of human rights, labour, environment and anti-corruption.
During 2017 we published our first statement on the prevention of slavery and human trafficking in compliance with the UK Modern Slavery Act. We have added modern slavery awareness to our programme of regular training for contract managers and reviewed our counterparty due diligence processes.
Total Recordable Injury Rate
0.27(2016: 0.22)
We have continued to maintain our rigorous and robust approach to biomass sustainability, ensuring the wood pellets we use are sustainable, low-carbon and fully compliant with the UK’s mandatory sustainability standards for biomass. The biomass we use to generate electricity provides a 64% carbon emissions saving against gas, inclusive of supply chain emissions. Our biomass lifecycle carbon emissions are 36g CO2/ MJ, less than half the UK Government’s 79g CO2/ MJ limit.
Our people are a key asset of the business. Through 2017 we developed a new people strategy. The strategy focuses on driving performance and developing talent to deliver the Group’s objectives. We have established Group-wide practices, including a career development and behaviour framework focused on performance and personal development.
RESEARCH AND INNOVATIONA key part of our strategy is to identify opportunities to improve existing operations and create options for long-term growth. To that end we have established a dedicated Research and Innovation (R&I) team led by the Drax engineers who delivered our world-first biomass generation and supply chain solution. We are actively looking at ways to improve the efficiency of our operations, notably in our biomass supply chain. Biomass is our largest single cost and as such we are focused on greater supply chain efficiency and the extraction of value from a wide range of low-value residue materials.
In B2B Energy Supply we are using our engineering expertise to help offer our customers value-adding services and products which will improve efficiency and allow them to optimise their energy consumption.
Page 29 for 2018 priorities
In the following sections we review the performance of our businesses during the year.
Strategic reportG
overnanceFinancial statem
entsShareholder inform
ation
Drax Group plc Annual report and accounts 201718 Drax Group plc Annual report and accounts 201718
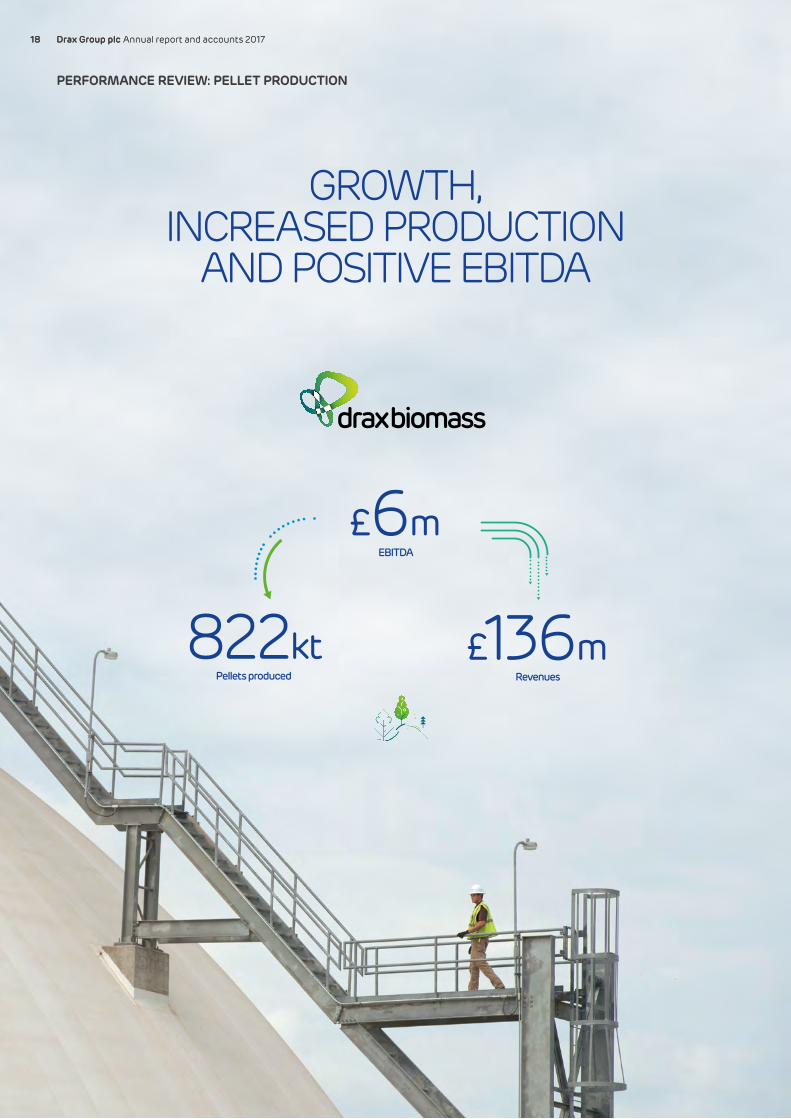
GROWTH, INCREASED PRODUCTION
AND POSITIVE EBITDA
PERFORMANCE REVIEW: PELLET PRODUCTION
£6mEBITDA
£136mRevenues
822ktPellets produced

Drax Group plc Annual report and accounts 2017 19Drax Group plc Annual report and accounts 2017 19
CASE STUDY
Low-cost, high-impact capacity increaseBy-products of higher value wood industries, such as sawdust from sawmills, offer a low-cost source of residues for use in our pellet production process and during 2017 we added an additional 150k tonnes of capacity at our pellet plants to allow us to use more of this material. By investing in giant hydraulic platforms known as “truck dumps”, operators at Amite and Morehouse can unload a 50-foot truck carrying either sawdust or wood chips and weighing 60 tonnes in less than two minutes, increasing processing capacity, reducing the cost of processing and increasing the use of lower cost residues.
Find out more: www.drax.com/truckdumps and www.drax.com/sustainability/sourcing
PELLET PRODUCTION Our pellets provide a sustainable, low-carbon fuel source – one that can be safely and efficiently delivered through our global supply chain and used by Drax’s Power Generation business to make renewable electricity for the UK. Our manufacturing operations also promote forest health by incentivising local landowners to actively manage and reinvest in their forests.
OPERATIONAL REVIEWSafety remains our primary concern and we have delivered year-on-year reduction in the level of recordable incidents.
Output at our Amite and Morehouse pellet plants increased significantly, although was below our target for the year.
We have remained focused on opportunities to improve efficiencies and capture cost savings as part of our drive to produce good quality pellets at the lowest possible cost. We still have more work to do in this area to optimise quality and cost, as our performance was below target for the year.
As part of our plans to optimise and improve operations we added 150k tonnes capacity at our existing plants, bringing
total installed capacity to 1.1 million tonnes and increasing the amount of lower cost sawmill residues we are able to process and used in our pellets.
At our Baton Rouge port facility greater volumes of production from our facilities drove higher levels of throughput with 17 vessels loaded and dispatched during the year (2016: 11 vessels).
In April, in line with our strategy to increase self-supply, we acquired a 450k tonne wood pellet plant – LaSalle Bioenergy (LaSalle). Commissioning of the plant began in November 2017 and we expect to increase production through 2018. LaSalle is within a 200-mile radius of our existing facilities. By leveraging the locational benefits of these assets we aim to deliver further operational and financial efficiencies.
Strategic reportG
overnanceFinancial statem
entsShareholder inform
ation
Drax Group plc Annual report and accounts 201720 Drax Group plc Annual report and accounts 201720
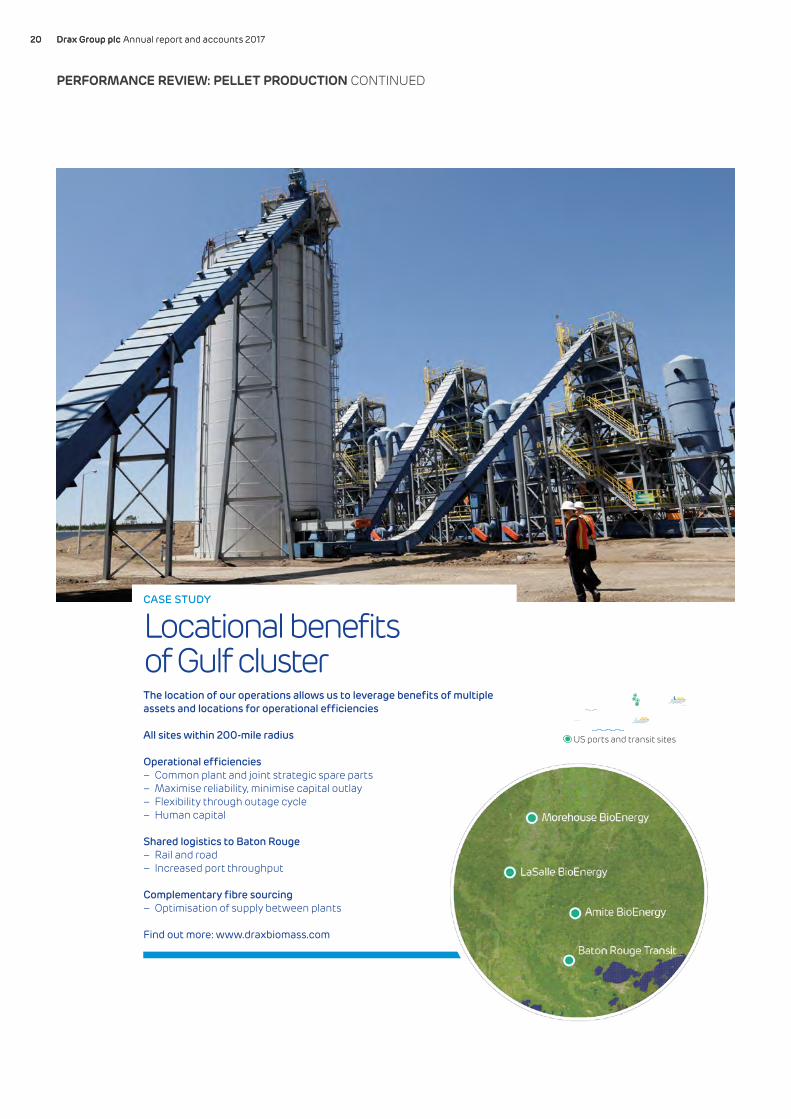
CASE STUDY
Locational benefits of Gulf clusterThe location of our operations allows us to leverage benefits of multiple assets and locations for operational efficiencies
All sites within 200-mile radius
Operational efficiencies– Common plant and joint strategic spare parts– Maximise reliability, minimise capital outlay– Flexibility through outage cycle– Human capital
Shared logistics to Baton Rouge– Rail and road– Increased port throughput
Complementary fibre sourcing– Optimisation of supply between plants
Find out more: www.draxbiomass.com
PERFORMANCE REVIEW: PELLET PRODUCTION CONTINUED
Current sitesUS ports and transit sites

Drax Group plc Annual report and accounts 2017 21Drax Group plc Annual report and accounts 2017 21
FINANCIAL RESULTSThere was a significant improvement in 2017, with EBITDA of £5.5 million (2016: £6.3 million negative EBITDA), driven by increasing volumes of wood pellets produced and sold to the Power Generation business. Sales of pellets in the year ending 31 December 2017 totalled £136 million, an increase of 84% over 2016.
Gross margin increased, reflecting higher production volumes. Raw fibre procurement, transportation and processing comprised the majority of cost of sales and as such this remains an important area of focus and an opportunity for the business. Through incremental investment in plant enhancements we expect to see further benefits from efficiencies and greater utilisation of lower cost residues.
Total operating costs have increased, reflecting an increase in operations at Amite, Morehouse and the Port of Baton Rouge, alongside the addition of LaSalle.
We acquired LaSalle for $35 million and have invested an additional $27 million as part of a programme to return the unit to service.
LOOKING AHEADThrough 2018 we expect to continue to deliver growth in EBITDA from our existing assets. Our focus is on the commissioning of LaSalle alongside opportunities for optimisation and efficiencies in our processes, to deliver good quality pellets at the lowest cost.
We remain alert to market opportunities to develop further capacity as part of our self-supply strategy.
PELLET PRODUCTION FINANCIAL PERFORMANCE2017
£m2016
£m
Revenue 135.7 73.6
Cost of sales (96.7) (55.5)
Gross profit 39.0 18.1
Operating costs (33.5) (24.4)
EBITDA 5.5 (6.3)
KEY PERFORMANCE INDICATORSArea KPI Unit of measure 2017 2016
Operations Fines at disport % 9.6 7.6
Operations Output ,000 tonnes 822 607
Financial Variable cost/tonne $/tonne 77 82
Strategic reportG
overnanceFinancial statem
entsShareholder inform
ation

Drax Group plc Annual report and accounts 201722 Drax Group plc Annual report and accounts 201722
A FLEXIBLE AND RELIABLE GENERATION BUSINESS
WITH LONG-TERM EARNINGS STABILITY AND OPPORTUNITIES TO OPTIMISE RETURNS FROM ENERGY MARKET VOLATILITY
PERFORMANCE REVIEW: POWER GENERATION
£2.7bnRevenues
£238mEBITDA
13TWhBiomass generation
15%UK renewable electricity
Drax Group plc Annual report and accounts 2017 23Drax Group plc Annual report and accounts 2017 23
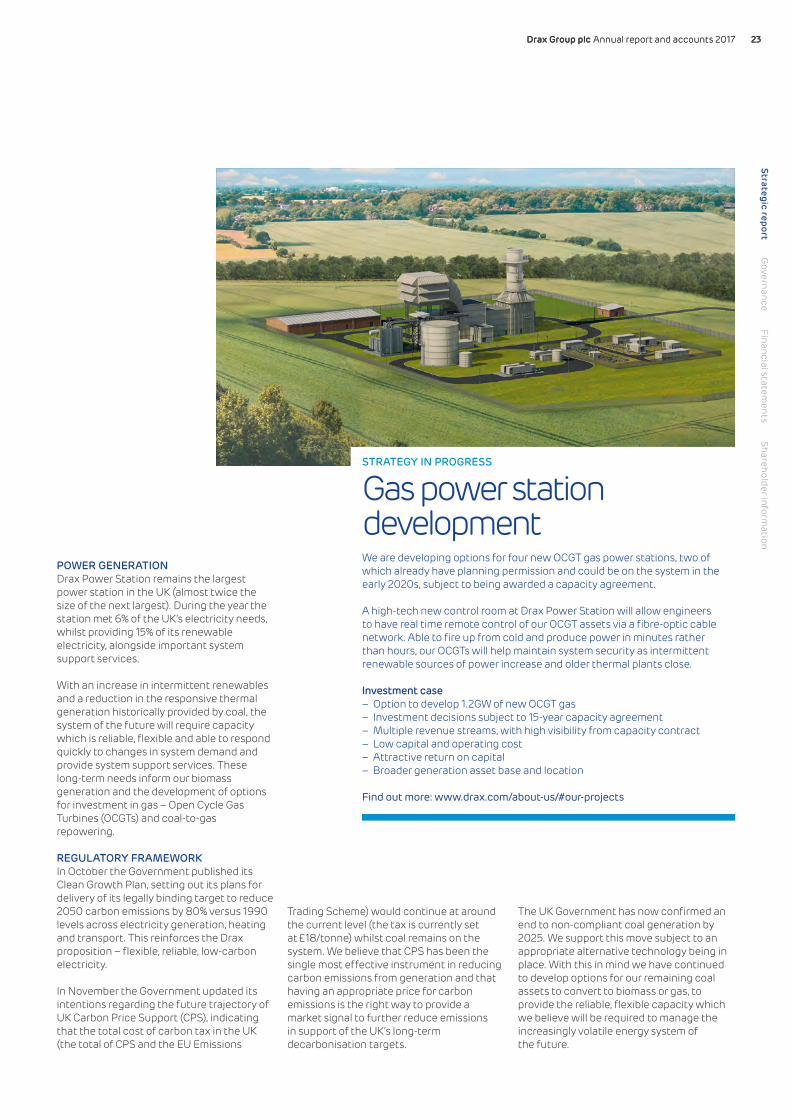
STRATEGY IN PROGRESS
Gas power station developmentWe are developing options for four new OCGT gas power stations, two of which already have planning permission and could be on the system in the early 2020s, subject to being awarded a capacity agreement.
A high-tech new control room at Drax Power Station will allow engineers to have real time remote control of our OCGT assets via a fibre-optic cable network. Able to fire up from cold and produce power in minutes rather than hours, our OCGTs will help maintain system security as intermittent renewable sources of power increase and older thermal plants close.
Investment case– Option to develop 1.2GW of new OCGT gas– Investment decisions subject to 15-year capacity agreement– Multiple revenue streams, with high visibility from capacity contract– Low capital and operating cost– Attractive return on capital– Broader generation asset base and location
Find out more: www.drax.com/about-us/#our-projects
POWER GENERATIONDrax Power Station remains the largest power station in the UK (almost twice the size of the next largest). During the year the station met 6% of the UK’s electricity needs, whilst providing 15% of its renewable electricity, alongside important system support services.
With an increase in intermittent renewables and a reduction in the responsive thermal generation historically provided by coal, the system of the future will require capacity which is reliable, flexible and able to respond quickly to changes in system demand and provide system support services. These long-term needs inform our biomass generation and the development of options for investment in gas – Open Cycle Gas Turbines (OCGTs) and coal-to-gas repowering.
REGULATORY FRAMEWORKIn October the Government published its Clean Growth Plan, setting out its plans for delivery of its legally binding target to reduce 2050 carbon emissions by 80% versus 1990 levels across electricity generation, heating and transport. This reinforces the Drax proposition – flexible, reliable, low-carbon electricity.
In November the Government updated its intentions regarding the future trajectory of UK Carbon Price Support (CPS), indicating that the total cost of carbon tax in the UK (the total of CPS and the EU Emissions
Trading Scheme) would continue at around the current level (the tax is currently set at £18/tonne) whilst coal remains on the system. We believe that CPS has been the single most effective instrument in reducing carbon emissions from generation and that having an appropriate price for carbon emissions is the right way to provide a market signal to further reduce emissions in support of the UK’s long-term decarbonisation targets.
The UK Government has now confirmed an end to non-compliant coal generation by 2025. We support this move subject to an appropriate alternative technology being in place. With this in mind we have continued to develop options for our remaining coal assets to convert to biomass or gas, to provide the reliable, flexible capacity which we believe will be required to manage the increasingly volatile energy system of the future.
Strategic reportG
overnanceFinancial statem
entsShareholder inform
ation
Drax Group plc Annual report and accounts 201724 Drax Group plc Annual report and accounts 201724
CHIEF EXECUTIVE’S REVIEW
Most recently with confirmation of Government support for further biomass generation at Drax Power Station we plan to continue our work to develop a low-cost solution for a fourth biomass unit, accelerating the removal of coal-fired generation from the UK electricity system, whilst supporting security of supply.
GENERATION CAPACITY AND SYSTEM SUPPORT2017 saw the first full year of operation of our biomass unit under the Contract for Difference (CfD) mechanism, which provides index-linked revenues for renewable electricity out to 2027.
Our other biomass units are supported by the Renewable Obligation Certificate (ROC) mechanism which, similar to the CfD, is also index-linked to 2027. This acts as a premium above the price of power we sell from these units. We sell power forward to the extent there is liquidity in the power markets which, combined with our fuel hedging strategy, provides long-term earnings and revenue visibility.
Lower gas prices, higher carbon costs and the continued penetration of intermittent renewables have kept wholesale electricity prices subdued.
With increasing levels of intermittent renewables we are continuing to see opportunities to extract value from flexibility – short-term power and balancing market activity, the provision of Ancillary Services and the value achieved from out-of-specification fuels. To capture value in this market we continue to focus resource on optimising availability and flexibility of both coal and biomass units. This whole process requires a high level of teamwork between the operational and commercial teams across the Group to capture and protect value.
Over the period 2017 to 2022 we expect to earn £90 million from a series of one-year capacity market contracts for our coal units, demonstrating that they still have a role to play. The first of these contracts commenced in October 2017, adding £3 million to EBITDA.
Lastly, we continue to source attractively priced fuel cargoes – out-of-specification coals and distressed cargoes, which help keep costs down for the business and consumers. We do this for both coal and biomass. This is a good example of how our commercial and operational teams work together to identify opportunities to create value for the business, as these fuels typically require more complex handling processes.
You can follow the market and see prices at electricinsights.co.uk
OPERATIONAL REVIEWOverall, we delivered a good performance during 2017 and maintained a strong safety performance.
We completed a major planned outage on the unit supported by the CfD contract. This unit provides stable and reliable baseload renewable electricity to the network and long-term earnings visibility for the Group. The safe and efficient completion of these complex works is a credit to those involved and reflects our continued focus on opportunities for improvement and efficiencies.
STRATEGY IN PROGRESS
Repowering away from coalOptions for Drax Power Station to operate into the late 2030s and beyond moved up a gear in 2017 with the development of an option to repower two coal units to gas. Drax gave notice of the nationally significant infrastructure project to the Planning Inspectorate in September 2017. One of the units could be eligible for the capacity market auction planned for December 2019.
Local community consultations began in November 2017 and continued in February 2018 on options including up to 3.6GW of new gas generation capacity, a gas pipeline and 200MW of battery storage in line with Government plans to end non-compliant coal generation by 2025 and Drax Group’s strategy of playing a vital role in the future energy system.
Find out more: www.repower.drax.com/
PERFORMANCE REVIEW: POWER GENERATION CONTINUED
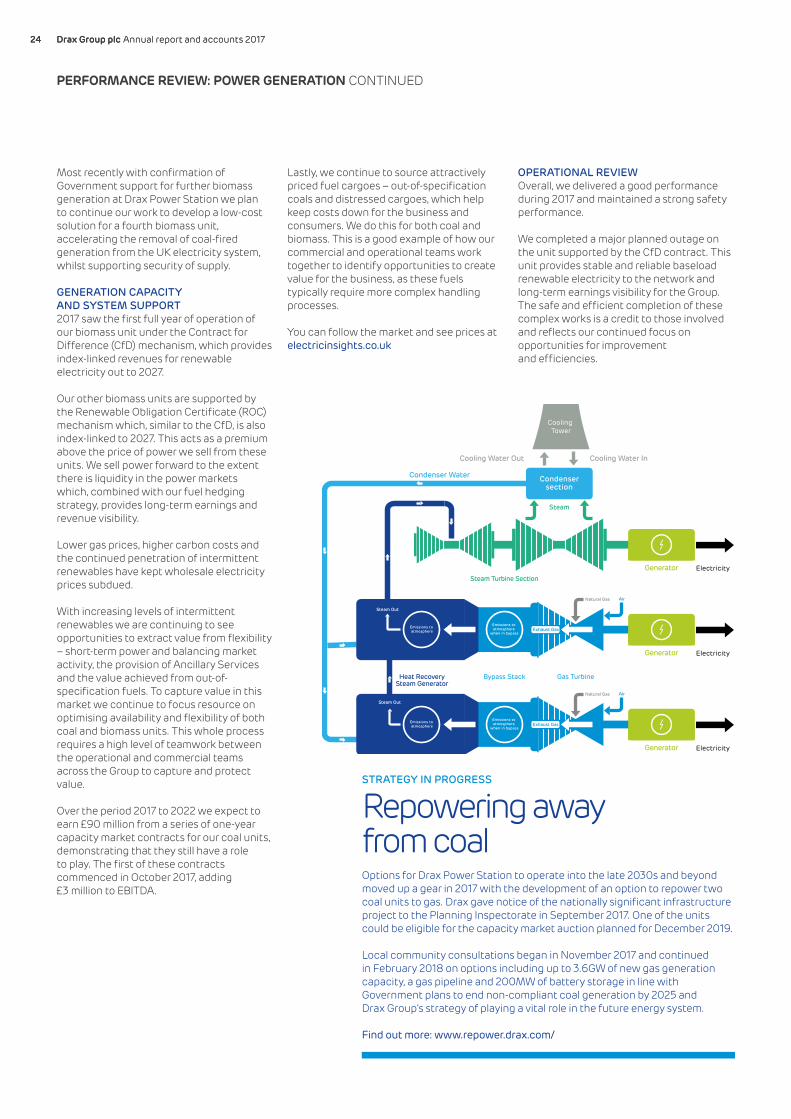
ElectricityGenerator
Generator Electricity
Emissions to atmosphere
when in bypassEmissions to atmosphere Exhaust Gas
Steam Out
Steam Out
Condenser Water
Cooling Water Out Cooling Water In
Cooling Tower
Condensersection
Steam Turbine Section
Bypass Stack Gas TurbineHeat RecoverySteam Generator
Generator Electricity
Emissions to atmosphere
when in bypassEmissions to atmosphere Exhaust Gas
AirNatural Gas
AirNatural Gas
Steam

Drax Group plc Annual report and accounts 2017 25Drax Group plc Annual report and accounts 2017 25
The entire organisation has responded to a number of challenging unplanned events. Most notably, in December we experienced a fire on a section of conveyor at our biomass rail unloading facility and consequently an unplanned outage from late December 2017 to mid-January 2018. Following investigation and recommissioning, the facility has returned to service with enhanced operating procedures. Although this issue did not relate to the operation of the biomass-generating units, the resulting restriction on fuel deliveries by rail required the optimisation of generation across our biomass units, resulting in lower EBITDA and full year biomass availability than our target for the year.
FINANCIAL RESULTSFinancial performance has significantly improved, with EBITDA of £238 million (2016: £174 million), principally due to the CfD mechanism.
Value from flexibility was below our target for the year, principally reflecting a lower level of Ancillary Service payments versus 2016.
Our operational performance drives the results. The financial impact of the unplanned outage on the rail unloading facility was mitigated by optimisation of our available biomass and the use of additional generation capacity retained for self-insurance purposes. However, this incident is a reminder of the need to invest appropriately to maintain a high level of operational availability and flexibility.
At the operating cost level, we have reduced costs reflecting the efficient single outage and our focus on the implementation of lean management techniques.
POWER GENERATION FINANCIAL PERFORMANCE2017
£m2016
£m
Revenue 2,719.6 2,490.9
Cost of power purchases (891.2) (904.4)
Grid charges (62.9) (69.4)
Fuel and other costs (1,367.1) (1,180.1)
Cost of sales (2,321.2) (2,153.9)
Gross profit 398.4 337.0
Operating costs (160.9) (163.2)
EBITDA 237.5 173.8
KEY PERFORMANCE INDICATORS
Area KPIUnit of
measure 2017 2016
Operations Biomass unit technical availability
% Below target
Below target
Operations Value from flexibility £m 88 N/A
LOOKING AHEADWe aim to optimise returns from our core assets, through reliable, flexible, low-carbon energy solutions which provide a long-term solution to the UK’s energy needs. Alongside this, value in the generation market will be created from an ability to execute agile decisions and capture value from volatile short-term power markets.
We will also continue to explore opportunities for lower carbon generation, to exploit our strengths and create opportunities for the long term. To that end we will continue to develop options for gas and pursue efficiencies through our biomass supply chain.
Strategic reportG
overnanceFinancial statem
entsShareholder inform
ation

Drax Group plc Annual report and accounts 201726 Drax Group plc Annual report and accounts 201726
PERFORMANCE REVIEW: B2B ENERGY SUPPLY
MAJOR INCREASE IN EBITDA, SALES VOLUME AND CUSTOMER METERS
£2bnRevenues
£29mEBITDA
10%B2B market (1)
376kMeter points

Drax Group plc Annual report and accounts 2017 27Drax Group plc Annual report and accounts 2017 27
B2B ENERGY SUPPLYOur B2B Energy Supply business – comprised of Opus Energy and Haven Power – is the fifth largest B2B power supplier in the UK. As the power system transforms, we will be working closely with our customers to help them adapt to a world of more decentralised and decarbonised power. The key factors influencing our business are regulation, competition and our operational performance.
REGULATION AND COMPETITIONThe UK Government’s main focus has been on what it sees as unfair treatment of domestic consumers on legacy standard variable tariff (SVT) contracts. The Government will take forward legislation which will provide the regulator Ofgem with the authority to cap these domestic tariffs. SVTs are not a feature of our business. Our focus remains on the B2B market. At the microbusiness end of the market, which is closer in proximity to domestic, most of our customers are on fixed price products and are actively rather than passively renewing their power supply contracts.
STRATEGY IN PROGRESS
An innovative energy supplier90% of the electricity that Opus Energy supplied last year came from clean, renewable sources, at no extra cost to their predominantly small and medium-sized business customers. For those customers who want it, 100% renewable energy contracts are also available.
This was exactly what All Saints Church in Ascot was looking for to power their business.
Assistant Church Warden, Chris Gunton, commented: “We wanted to move to a greener energy supplier, without paying a premium, so approached an energy broker for guidance. They advised us that Opus Energy were a reliable company with a good reputation, and when we asked for a quote they were the most competitive.”
It was a similar story for the Salisbury Museum, in Wiltshire.
“We were looking for an energy supplier that offered great value, combined with the right length of contract and good ethics,” commented Finance Manager, Nicola Kilgour-Croft. “Opus Energy ticked all these boxes for us.”
Alongside supplying customers, Opus Energy has Power Purchase Agreements with over 2,300 independent UK renewable energy generators. These could be anything from a single wind turbine owned by a village community, to Europe’s greenest zoo, Hamerton Zoo Park.
Commented Andrew Swales, Director of Hamerton Zoo: “Working with Opus Energy has given us competitive prices, considerably better documentation and a highly efficient service. We’d happily recommend them.”
(1) Opus Energy and Haven Power combined represent 10% of the non-domestic UK power market
Strategic reportG
overnanceFinancial statem
entsShareholder inform
ation

Drax Group plc Annual report and accounts 201728 Drax Group plc Annual report and accounts 201728
PERFORMANCE REVIEW: B2B ENERGY SUPPLY CONTINUED
The B2B market remains competitive with 65 different suppliers across the market. Our Haven Power and Opus Energy businesses offer customer-centric power, gas and services. We offer simplicity and flexibility across our products and actively engage with customers to help them manage their energy requirements and reduce carbon emissions.
OPERATIONAL REVIEWWe have remained focused on delivering an excellent standard of customer service, which is central to our proposition.
February 2017 saw the completion of the acquisition of Opus Energy, which has made good progress integrating into the Group supported by a dedicated team, who have been working on systems, people and commercial projects to ensure our processes work effectively together.
In March we completed the purchase of a new office facility in Northampton, enabling the consolidation of four Opus Energy offices into one and the centralisation of the operational teams.
Sales volumes at Opus Energy were lower than target, reflecting our focus on margin which has remained strong and customer renewal rates were towards the high end of expectation. This reflects the continued commitment to a strong level of customer service and in recognition of this Opus Energy was awarded Utility Provider to Small Businesses of the Year 2017 at the British Business Awards.
At Haven Power we have continued to focus on value-adding flexible products and services particularly to Industrial & Commercial customers whose needs extend beyond commodity supply. This is demonstrated through our ability to help customers manage and optimise their power consumption profiles through collaboration with our carefully selected partners. Through better systems and services, customer targeting and a keener focus on cost to serve we are driving efficiencies and improved margin at Haven Power.
Following the acquisition of Opus Energy the major Enterprise Resource Platform (ERP) system upgrade was re-planned which has led to a revised timeline from Q2 2018 onwards.
We continue to actively manage credit risk by assessing the financial strength of customers and applying rigorous credit management processes, with a strong focus continuing to be placed on billing and cash collection.
Health and safety remains an area of focus for the business and we continue to target a reduction in the level of recordable incidents.
FINANCIAL RESULTSFinancial performance has significantly improved, with EBITDA of £29 million in line with our guidance (2016: £4 million negative). This was principally due to the acquisition of Opus Energy, which added 10 months of EBITDA, but also improved financial performance from Haven Power, which was ahead of plan.
Third Party Costs (TPCs) include grid charges, the cost of meeting our obligations under the Renewable Obligation (RO) and small-scale Feed-in-Tariff schemes. Grid charges include distribution, transmission and system balancing costs. TPCs have continued to increase and now account for 50% of revenue.
Total operating costs have risen with the acquisition of Opus Energy. We remain confident that over time the benefits of common platforms and knowledge sharing will lead to efficiencies.
LOOKING AHEADIn 2018 we will focus on Opus Energy on-boarding, systems development and the roll out of smart meters.
We continue to see opportunities for EBITDA growth in the B2B markets, which we will deliver through our customer-focused supply proposition.
B2B ENERGY SUPPLY FINANCIAL PERFORMANCE2017
£m2016
£m
Revenue 1,999.0 1,326.4
Cost of power purchases (883.7) (688.9)
Grid charges (435.8) (310.4)
Other retail costs (562.1) (303.6)
Cost of sales (1,881.6) (1,302.9)
Gross profit 117.4 23.5
Operating costs (88.0) (27.8)
EBITDA 29.4 (4.3)
KEY PERFORMANCE INDICATORS
Area KPIUnit of
measure 2017 2016
Operations Implementation of new ERP (Haven Power)
Date Q2 2018 N/A
Operations Sales volume (Opus Energy) TWh 5.7 N/A
Operations Renewal rate (Opus Energy) % Above Target
N/A

Drax Group plc Annual report and accounts 2017 29Drax Group plc Annual report and accounts 2017 29
OUTLOOKOur focus in 2018 remains on the delivery of our strategy and long-term ambitions for earnings growth, underpinned by safety, sustainability, operational excellence and expertise in our markets. We also recognise that being the most efficient operator in each of our markets is a key factor in our success.
Our objective in Pellet Production remains the commissioning of LaSalle, the production of good quality pellets at the lowest cost, cross-supply chain optimisation and identifying attractive options to increase self-supply.
Our biomass proposition is strong – reliable, flexible, low-carbon renewable electricity and system support which, combined with an effective fuel hedging strategy, will provide long-term earnings visibility. We remain focused on ways to increase supply chain efficiency and make biomass competitive beyond 2027. As part of this we remain focused on the optimisation of our assets in the US Gulf and reduction in pellet cost. To support this focus we are moving our US headquarters from Atlanta to Monroe, Louisiana, which benefits from a much closer proximity to these assets.
In Power Generation, we continue to explore ways to optimise our existing operations, whilst meeting the needs of the changing UK electricity system.
We remain supportive of the UK Government’s decarbonisation targets and will continue our work to deliver four OCGTs and a low-cost biomass unit conversion utilising existing infrastructure at Drax Power Station, alongside developing the option to repowering the remaining coal units to gas.
In B2B Energy Supply, we will continue to grow our B2B offering, with significant opportunities to grow market share. At the same time, we will invest in supporting infrastructure to ensure we can continue to grow, offer market-leading digital propositions and smart metering services.
%
2018 PRIORITIES
Pellet Production – Commissioning of LaSalle Bioenergy
– Development of options for optimisation and efficiencies
– Consistent production and quality of pellets
– Continued cost reduction and improvement in EBITDA
Power Generation – Reliable biomass generation
– Development of fourth biomass unit – System support services
– Development of OCGT options – Development of coal-to-gas
repowering option – Continued cost reduction and growth
in EBITDA
B2B Energy Supply – Development of value-added services – Continued cost reduction and growth
in EBITDA – Investment in systems to support growth
and Smart compliance
We have made good progress on the delivery of our strategy and will continue to build on this as we progress our targets for 2025, whilst playing an important role in our markets and helping to change the way energy is generated, supplied and used.
WILL GARDINERCHIEF EXECUTIVE, DRAX GROUP
Strategic reportG
overnanceFinancial statem
entsShareholder inform
ation

Drax Group plc Annual report and accounts 201730 Drax Group plc Annual report and accounts 201730
BUILDING A SUSTAINABLE BUSINESS
OUR PURPOSE IS TO HELP CHANGE THE WAY ENERGY IS GENERATED, SUPPLIED AND
USED FOR A BETTER FUTURE
www.drax.com/sustainability
Drax’s commitment to improved performance and sustainability is integral to our purpose and has guided us through years of research, development
and extensive upgrades to our infrastructure. Today we are proud to supply 15% of the UK’s renewable electricity from biomass, positioning us as the
largest single renewable electricity generator in the country.
We have completed the process which allows us to participate in the United Nations Global Compact (UNGC).

Drax Group plc Annual report and accounts 2017 31Drax Group plc Annual report and accounts 2017 31
GROUP PURPOSETo help change the way energy is generated, supplied
and used for a better future
WE DETAIL PROGRESS MADE IN 2017 UNDER THESE THEMES
ACHIEVE TOGETHER WITH
OUR PEOPLE
DELIVER FOR OUR
CUSTOMERS
REDUCE OUR ENVIRONMENTAL
IMPACT
POSITIVE SOCIAL IMPACT
A LOWER CARBON
COMPANY
RESPONSIBLE SOURCING
OUR APPROACH TO CORPORATE SUSTAINABILITYOur Group strategy positions Drax as a leading low-carbon energy company in the UK, and broadens our earnings base to protect long-term returns to shareholders. As a result, the business is focused on: Pellet Production, Power Generation and B2B Energy Supply.
Our strategy is underpinned by safety, sustainability, operational excellence and expertise across our markets.
We provide a summary of our progress and performance in 2017 against six themes on the following pages.
Our aim is to build a sustainable business and improved environment, social and governance (ESG) performance is a prerequisite for this. We have published a comprehensive overview of our sustainability progress on our website www.drax.com/sustainability.
GOVERNANCE OF SUSTAINABILITYWe have policies and procedures in place to manage sustainability and a strong governance structure ensures these are implemented.
The Board has ultimate responsibility for the Group’s sustainability performance, with operational oversight by the Executive Committee, chaired by the Group Chief Executive. The Executive Committee reviews sustainability performance and progress regularly. The Group Director of Corporate Affairs leads Drax’s sustainability programme and is a member of the Executive Committee.
The Executive Committee has oversight of risk, ethics and business conduct for the Group. This responsibility is discharged through the risk management framework as described in the principal risks and uncertainties section.
Page 51
ETHICS AND INTEGRITY
At Drax Group we believe in doing the right thing. We are committed to conducting business with honesty and integrity, and we
comply with all relevant laws and regulations. We do not tolerate any form of bribery, corruption or improper business conduct.
Our compliance framework sets out the ethical principles that our people must uphold, as outlined in the Group ethics guide, Doing the Right Thing. The framework was updated in 2017 to reflect new legislation and to encourage whistleblowing in all appropriate circumstances.
The framework is underpinned by policies and procedures. Our principles regarding ethics, integrity and anti-bribery and corruption are supported by the Group corporate crime policy. Compliance is overseen by the Group Ethics and Business Conduct Committee (EBCC). Internal and external audits ensure compliance with our ethical principles. Corporate Compliance also conducts an annual Bribery Act risk assessment.
We expect the same high standards from everyone we work with in the United Kingdom, United States and elsewhere. Third parties are subject to our due diligence checks at the time of contracting and on an ongoing basis through continual monitoring (via our third party due diligence solution).
ANTI-BRIBERY AND CORRUPTIONOur internal processes ensure consistency with our zero tolerance approach to bribery and corruption. Requests to do business in new countries pass through our country risk process. Medium and high scoring countries are reviewed by the Currency and Commodity Risk Management Committee (CCRMC), as required. Associated counterparties are then put forward for our due diligence process. We refresh due diligence for high risk counterparties on an annual basis and all other counterparties are evaluated every three years. In 2017, Drax
Group was not involved in any legal cases related to corruption and bribery.
WHISTLEBLOWINGWe encourage anyone with a concern to speak out and report concerns through our whistleblowing procedure. Employees can raise issues through internal channels and an anonymous, third-party hotline is available to internal and external stakeholders. Should concerns be raised, we have a strict non-retaliation policy. During 2017 there was one whistleblowing case which was raised. Two investigations were carried out, one by the local business and one by the Group team, neither finding any evidence that Company policy and procedures had been breached.
OUR PERFORMANCE IN 2017ACHIEVE TOGETHER WITH OUR PEOPLEOur people strategy and approach to developing talent, providing a safe and healthy workplace and promoting diversity and inclusion are detailed on page 40 of this report.
DELIVER FOR OUR CUSTOMERSWe are dedicated to providing our customers with secure, sustainable energy and excellent customer service. Our B2B Energy Supply business includes Opus Energy and Haven Power, who supply large industrial and commercial customers, corporate and small business customers with power, gas and value-adding services. Both businesses offer renewable energy options.
Excellent customer service is at the heart of our business and both Haven Power and Opus Energy have strict standards for treating customers fairly, protecting customer data and privacy, and a clear complaints procedure if things go wrong. We are pleased that Haven Power was shortlisted for “Supplier of the Year” at the
Strategic reportG
overnanceFinancial statem
entsShareholder inform
ation

Drax Group plc Annual report and accounts 201732 Drax Group plc Annual report and accounts 201732
BUILDING A SUSTAINABLE BUSINESS CONTINUED
Energy Awards 2017, and named the UK’s best performing energy supplier by Third Party Intermediaries (TPIs) in this year’s Cornwall Insight Report. Opus Energy won “Utilities Provider of the Year” at the British Small Business Awards 2017(1) and was shortlisted in the National Business Awards 2017.
Our B2B Energy Supply businesses support customers to be more sustainable. Haven Power offers industrial and commercial customers 100% renewable electricity at an affordable price, powered by biomass supplied from Drax Power. Opus Energy offers SME businesses renewable energy, makes it easy for them to switch suppliers and reduce their energy costs.
Opus Energy also buys energy from renewable generators across the UK, from sources including wind turbines, solar panels and anaerobic digestion plants. In 2017 this amounted to 992GWh of renewable energy generated from 2,300 generators.
A LOWER CARBON COMPANYAs a major electricity producer, we have a significant role to play in the transition to a low carbon future. We are determined to continue to reduce our carbon emissions while providing the power the economy requires.
Climate change poses both risks and opportunities for Drax Group. To reduce the risks to our business, we are committed to reducing our operational carbon emissions and emissions from our supply chain, by transitioning away from coal and using sustainable biomass, as well as investing in lower carbon energy sources such as Open Cycle Gas Turbine (OCGT) generation plants. We are also exploring innovative battery technology. We are enabling the use of solar and wind energy, with our biomass, gas and potential battery storage options all supporting the capacity and stability of the UK energy grid, providing services such as voltage control, frequency response and inertia.
We recognise that investors and other stakeholders increasingly require clear information about the climate change risks to our business and we are fully committed to transparent disclosure of climate information. We welcomed the Government’s Clean Growth Strategy to ensure a green economy and energy are at the heart of the UK’s industry strategy. We believe this will provide certainty for businesses investing in lower-carbon and renewable capacity, and incentivise the development of new lower-carbon
technology. The significant investments we have made to upgrade our units to renewable biomass, coupled with a reduction in coal-fired generation, have resulted in a 73% reduction in carbon emissions since 2012.
Carbon EmissionsWe calculate and report our carbon emissions in accordance with the Companies Act 2006 and the European Union Emissions Trading System (EU ETS), as disclosed in Table 1.
We are also required to disclose emissions from biologically sequestered carbon, which includes emissions released through the combustion of biomass to generate electricity. These emissions are shown in Table 2. The figures do not take into account the CO2 that has been absorbed from the atmosphere during the growth of feedstocks
which are used to manufacture the biomass pellets used at Drax to generate electricity.
The biogenic CO2 emissions resulting from power generation are counted as zero in official reporting to both UK authorities and under the EU ETS as the use of sustainable biomass is considered to be carbon neutral at the point of combustion. This methodology originates from the United Nations Framework Convention on Climate Change (UNFCCC).
The majority of our emissions result from the process of using solid fuel. This can make it difficult to identify other smaller trends that are still significant. To counteract this dominance and to ensure we retain a balance between highlighting significant developments and providing meaningful data, we have adopted a materiality threshold of 100,000 tonnes of CO2.
(1) www.opusenergyblog.com/opus-energy-winning-brand-small-businesses/
STRATEGY IN PROGRESS
Providing customers with great value and good ethicsFounded in 1860, Salisbury Museum is located in a Grade I listed building opposite Salisbury Cathedral. As a charitable, not-for-profit organisation, the museum relies on entry fees, grants, donations and the support of its members to continue its vital work. Finding a business energy supplier that offered the best prices on the market, as well as the right length of contract and good ethics, was important for the museum.
SMEs are a key part of the business and we know that a business energy service that is as smooth and efficient as possible is a top priority. Nicola Kilgour-Croft, Finance Manager at Salisbury Museum, commented: “The switching process went through really smoothly, and the facility to receive invoices via email means I don’t need to spend time on the phone trying to sort out payment. Having 12-month contracts really works for us.”
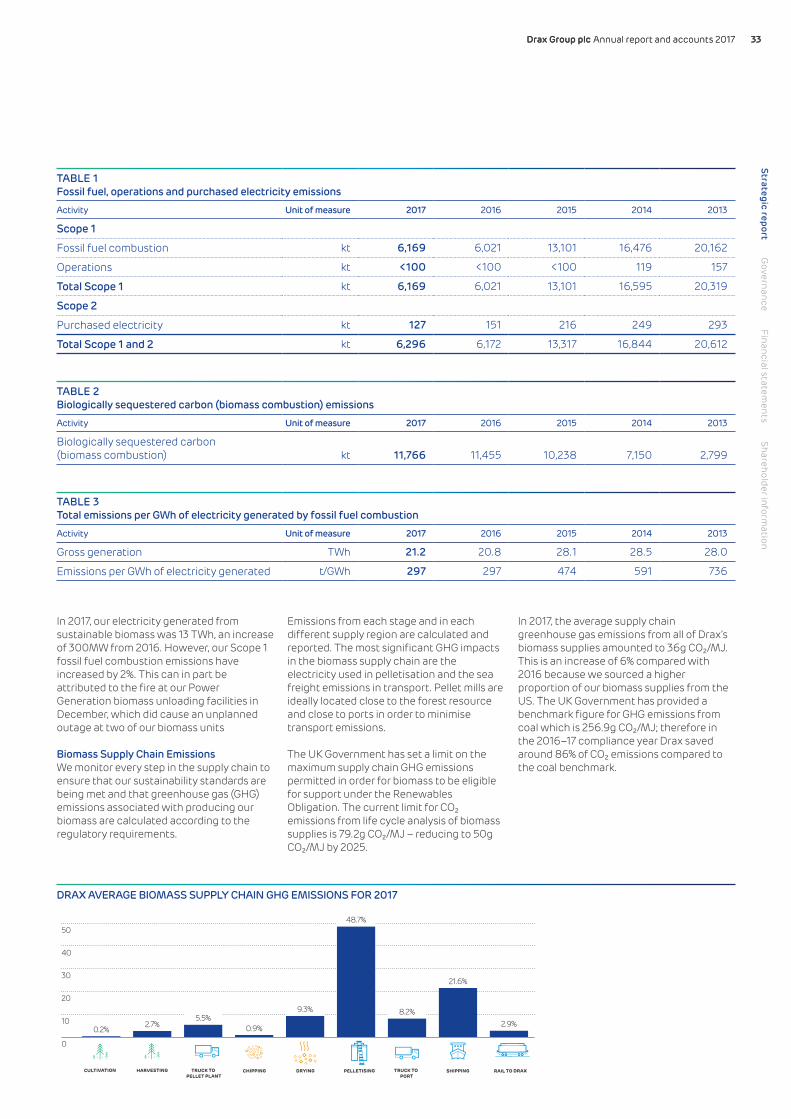
Drax Group plc Annual report and accounts 2017 33Drax Group plc Annual report and accounts 2017 33
In 2017, our electricity generated from sustainable biomass was 13 TWh, an increase of 300MW from 2016. However, our Scope 1 fossil fuel combustion emissions have increased by 2%. This can in part be attributed to the fire at our Power Generation biomass unloading facilities in December, which did cause an unplanned outage at two of our biomass units
Biomass Supply Chain EmissionsWe monitor every step in the supply chain to ensure that our sustainability standards are being met and that greenhouse gas (GHG) emissions associated with producing our biomass are calculated according to the regulatory requirements.
Emissions from each stage and in each different supply region are calculated and reported. The most significant GHG impacts in the biomass supply chain are the electricity used in pelletisation and the sea freight emissions in transport. Pellet mills are ideally located close to the forest resource and close to ports in order to minimise transport emissions.
The UK Government has set a limit on the maximum supply chain GHG emissions permitted in order for biomass to be eligible for support under the Renewables Obligation. The current limit for CO2 emissions from life cycle analysis of biomass supplies is 79.2g CO2/MJ – reducing to 50g CO2/MJ by 2025.
In 2017, the average supply chain greenhouse gas emissions from all of Drax’s biomass supplies amounted to 36g CO2/MJ. This is an increase of 6% compared with 2016 because we sourced a higher proportion of our biomass supplies from the US. The UK Government has provided a benchmark figure for GHG emissions from coal which is 256.9g CO2/MJ; therefore in the 2016–17 compliance year Drax saved around 86% of CO2 emissions compared to the coal benchmark.
TABLE 1Fossil fuel, operations and purchased electricity emissionsActivity Unit of measure 2017 2016 2015 2014 2013
Scope 1
Fossil fuel combustion kt 6,169 6,021 13,101 16,476 20,162
Operations kt <100 <100 <100 119 157
Total Scope 1 kt 6,169 6,021 13,101 16,595 20,319
Scope 2
Purchased electricity kt 127 151 216 249 293
Total Scope 1 and 2 kt 6,296 6,172 13,317 16,844 20,612
TABLE 2Biologically sequestered carbon (biomass combustion) emissionsActivity Unit of measure 2017 2016 2015 2014 2013
Biologically sequestered carbon (biomass combustion) kt 11,766 11,455 10,238 7,150 2,799
TABLE 3Total emissions per GWh of electricity generated by fossil fuel combustionActivity Unit of measure 2017 2016 2015 2014 2013
Gross generation TWh 21.2 20.8 28.1 28.5 28.0
Emissions per GWh of electricity generated t/GWh 297 297 474 591 736
0
10
20
30
40
50
0.2%2.7%
5.5%0.9%
9.3%
48.7%
8.2%
21.6%
2.9%
CHIPPING DRYING PELLETISINGTRUCK TO PELLET PLANT
TRUCK TO PORT
RAIL TO DRAXSHIPPINGCULTIVATION HARVESTING
DRAX AVERAGE BIOMASS SUPPLY CHAIN GHG EMISSIONS FOR 2017
Strategic reportG
overnanceFinancial statem
entsShareholder inform
ation

Drax Group plc Annual report and accounts 201734 Drax Group plc Annual report and accounts 201734
BUILDING A SUSTAINABLE BUSINESS CONTINUED
RESPONSIBLE SOURCINGBeing a responsible business means we source raw materials, including important resources such as sustainable biomass and coal, in a responsible manner. We aim to treat suppliers fairly and pay them promptly. We expect our suppliers to uphold the same high ethical standards we apply to our business, which are outlined in our Group ethics guide, Doing the Right Thing.
SUSTAINABLE BIOMASSWe believe the best way to ensure our biomass is sustainable and legal is through a combination of proactive supplier engagement, third party certification and our own audits and checks. We rely on a number of forest certification programmes, including the Sustainable Forest Initiative (SFI), Forest Stewardship Council® (FSC®)(1), the Programme for the Endorsement of Forest Certification (PEFC) and Sustainable Biomass Program (SBP).
Our requirements are laid out in our Group sustainability policy: www.drax.com/sustainability/sustainability-policy/. We adhere to the UK Government criteria for sustainable biomass, the Forest Europe Sustainable Forest Management Criteria and we comply with the European Union Timber Regulation (EUTR).
The Group Director of Corporate Affairs has overall responsibility for ensuring biomass meets the Government’s sustainability criteria. Cases requiring special attention are escalated to the Ethics and Business Conduct Committee (EBCC) or the Executive Committee.
An example of this in 2017 was when new information came to light on one of our suppliers through an SBP audit report. Background information collected during preparation for SBP assessment highlighted that our supplier had not provided us with the most accurate information regarding harvesting locations. Without this, we cannot carry out the regional risk-based assessment required under the legislation.
Although the volume in question was low, we halted deliveries until our supplier could properly identify the material and we could carry out the appropriate due diligence.
In 2017, Drax Group started a review and update of our policy with various stakeholders to ensure that it is still relevant and addresses the key biomass sustainability issues. We also asked the non-profit TFT (The Forest Trust, www.tft-earth.org) to visit our key supply regions to examine local challenges and identify opportunities for improved environmental and social performance. TFT is a UK-registered charity working with other global companies to improve the environmental and social impact of their supply chains.
Maintaining forest carbon stocksEnsuring that forest carbon stocks are maintained, or not adversely impacted by biomass demand, is one of the requirements of the UK Government’s criteria for sustainable biomass. Drax only sources sustainable biomass from working forests. We regularly monitor forest inventory data, in addition to our detailed certification and auditing process, to ensure that biomass demand is having a positive impact on regional forest industries. Recent analysis of historical trends in the southern US has shown that as demand for wood products increased over the last 60 years, management practices have also improved to increase forest growth rates and more than double the amount of carbon stored in the working forest from 4 billion m3 to 8.4 billion m3.(2)
Healthy markets for wood products have led to an increase in forest growth (carbon sequestration) and stored carbon. The total growing stock in the forests of the 28 EU member states increased by 7.4 billion m3 between 1990 and 2015, an increase of 38%(3). Over this same period, total production of roundwood (harvesting) also increased by 103 million m3, around 29%(4). This demonstrates that increasing demand for wood products and increased harvesting does not necessarily lead to deforestation or lower forest carbon stocks.
The continual cycle of sustainable forest management, production of wood products, improving management practice and increased sequestration of atmospheric carbon leads to substantial GHG benefits. These benefits are even greater when compared to the linear emissions associated with burning coal.
OUR BIOMASS SUSTAINABILITY REQUIREMENTS – Group sustainability policy – in place
since 2008, our policy covers our core sustainability values on protecting biodiversity, reduction of greenhouse gas emissions and contribution to social values.
– UK Government criteria for sustainable biomass – we report monthly on compliance with the UK sustainability criteria, including life cycle emissions limits and the land criteria. This covers the requirements of the Forest Europe Sustainable Forest Management criteria, including: maintaining forest area and carbon stocks; encouraging the production of forest products; maintaining the forest ecosystem health and vitality; conserving and enhancing biological diversity; contributing socio-economic benefits; and ensuring that soil and water protection is maintained.
– European Union Timber Regulation – in place since 2013, the EUTR requires purchasers of wood products to have coherent due diligence processes in place to ensure a negligible risk of trading illegally logged timber.
(1) FSC-C119787(2) www.forest2market.com/hubfs/2016_Website/
Documents/20170726_Forest2Market_Historical_Perspective_US_South.pdf
(3) www.appsso.eurostat.ec.europa.eu/nui/show.do?dataset=for_vol&lang=en
(4) www.fao.org/faostat/en/#data

Drax Group plc Annual report and accounts 2017 35Drax Group plc Annual report and accounts 2017 35
(1) Figures for audited plants only
How we ensure sustainable biomass sourcingDrax has developed a rigorous process to ensure that new and existing biomass suppliers demonstrate that all sustainability and legal requirements are being met. Our eight key stages for ensuring compliance are: chain of custody; supplier audits; the EUTR legality assessment; GHG life cycle assessment and monitoring; the sustainability data return (SDR) captured in the contract; the SDR and annual declaration; regional and country risk assessments; and supplier relationship management and monitoring. These stages are implemented in an ongoing cycle to provide robust evidence across each element.
Our due diligence process always begins with a regional risk assessment, which identifies high-level risks such as deforestation or illegal logging, corruption and issues with workers’ rights. This ensures focus on these high risks and that they are mitigated. These reports are renewed every three years, or more frequently if there is cause for concern, to ensure that we always stay on top of developing issues.
This is followed by a sustainability data return (SDR), where we ask each supplier 43 detailed questions about all aspects of their supply chain and they are required to provide documentary evidence to support their answers. This sustainability declaration subsequently forms part of the contract between Drax and the supplier.
Our supplier audit processEach new supplier is subject to an independent audit before pellets can be delivered. Existing suppliers are audited at least once every three to four years. The audit requires the supplier to pass a series of detailed environmental and social checks along the whole length of their supply chain and pellet manufacturing process. Findings are categorised into three priorities: high, medium and low.
High-priority findings can result in termination of a supplier agreement. Medium-priority findings result in the supplier being given a set timescale within which to rectify them. Low-priority issues highlight areas where our independent auditors believe suppliers have room to improve their practices. Drax engages with our suppliers to share best practice and support and encourage improvements to procedures.
The Sustainable Biomass ProgramAlternatively, suppliers can evidence the necessary sustainability requirements through Sustainable Biomass Program (SBP) certification, as SBP-compliant material has been benchmarked by Ofgem to fully meet the UK sustainability requirements. If a supplier can provide all of their biomass to Drax with an SBP compliant biomass claim, Drax does not require an audit to be carried out and the supplier can progress through the process much faster. We encourage our suppliers to move towards SBP certification and we aim to achieve 90% SBP-compliant material by the end of 2018.
Drax Power is certified under the SBP Chain of Custody standard. In 2017, 2.7 million tonnes of Drax Power’s sourced biomass came from SBP-certified pellet mills. Drax Biomass is an SBP-certified Biomass Producer.
DRAX POWER SUPPLIER AUDIT AND SBP FIGURES FOR 2017 (1)
Suppliers assessed throughDrax audit process 12.8%SBP-certified suppliers 87.2%
The number of audits has decreased since 2016 because increasingly more audits are covered by SBP. In 2017, 69.6% of our biomass suppliers were in the audit cycle. 34 of the 56 pellet mills we sourced from were SBP certified and were audited by an independent third party. In addition, we carried out five first party audits by Drax staff and six third party audits by independent auditors. In 2017, three of the suppliers that we audited did not meet our standards and as a result we made the decision not to contract them.
Forest management certificationIn addition to the Drax internal process and third party SBP certification, sustainability can also be demonstrated through Forest Management (FM) certification. This confirms that the forest is being managed in a way that preserves the natural ecosystem and benefits the lives of local people and workers, while ensuring it sustains economic viability. In 2017, Drax Power purchased 1.3 million tonnes of wood fibre from FM-certified forests, 20% of our total supply of pellets.
FM certification may be difficult to achieve for some types of forest owners and, for this reason, a secondary level of assessment called Controlled Wood is available. This ensures that wood fibre is not: illegally harvested; harvested in violation of traditional and human rights; harvested in forests in which high conservation values are threatened by management activities; harvested in forests being converted to plantations or non-forest use; or from forests in which genetically modified trees are planted. In 2017, Drax Power purchased 4.9 million tonnes of wood fibre from Controlled Wood sources.
Chain of CustodyOnce certified, Chain of Custody (CoC) can be used as a mechanism for tracking wood fibre from the forest to the final product and destination. Each supplier in the chain must have a documented system to be able to identify and trace the wood fibre at each stage. Drax requires that all of its suppliers achieve CoC certification before contracts are signed and pellets can be delivered.
At Drax Power, our key biomass buyers, logistics, legal and communications employees are required to complete Chain of Custody training with the sustainability team.
In 2017
2.7Mtof Drax’s sourced biomass came with an SBP-compliant claim
Strategic reportG
overnanceFinancial statem
entsShareholder inform
ation
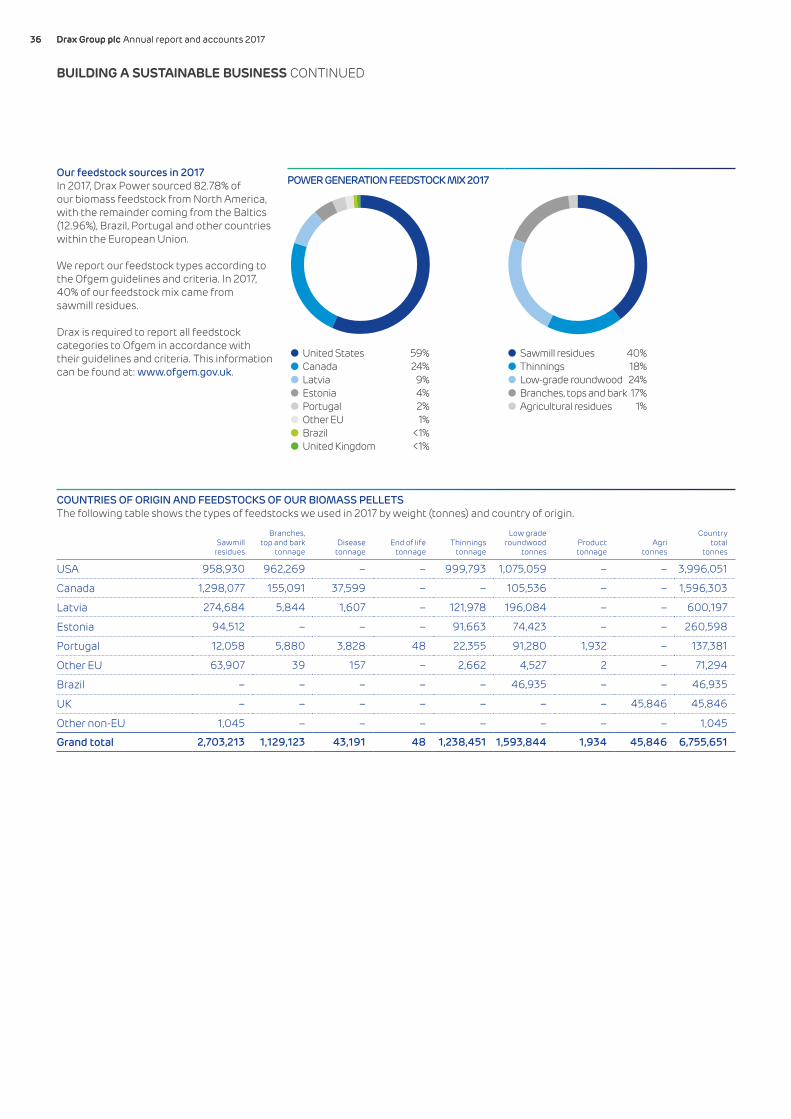
Drax Group plc Annual report and accounts 201736 Drax Group plc Annual report and accounts 201736
POWER GENERATION FEEDSTOCK MIX 2017
United States 59%Canada 24%Latvia 9%Estonia 4%Portugal 2%Other EU 1%Brazil <1%United Kingdom <1%
Sawmill residues 40%Thinnings 18%Low-grade roundwood 24%Branches, tops and bark 17%Agricultural residues 1%
Our feedstock sources in 2017In 2017, Drax Power sourced 82.78% of our biomass feedstock from North America, with the remainder coming from the Baltics (12.96%), Brazil, Portugal and other countries within the European Union.
We report our feedstock types according to the Ofgem guidelines and criteria. In 2017, 40% of our feedstock mix came from sawmill residues.
Drax is required to report all feedstock categories to Ofgem in accordance with their guidelines and criteria. This information can be found at: www.ofgem.gov.uk.
COUNTRIES OF ORIGIN AND FEEDSTOCKS OF OUR BIOMASS PELLETS The following table shows the types of feedstocks we used in 2017 by weight (tonnes) and country of origin.
Sawmill residues
Branches, top and bark
tonnageDisease
tonnageEnd of life
tonnageThinnings
tonnage
Low grade roundwood
tonnesProduct tonnage
Agri tonnes
Country total
tonnes
USA 958,930 962,269 – – 999,793 1,075,059 – – 3,996,051
Canada 1,298,077 155,091 37,599 – – 105,536 – – 1,596,303
Latvia 274,684 5,844 1,607 – 121,978 196,084 – – 600,197
Estonia 94,512 – – – 91,663 74,423 – – 260,598
Portugal 12,058 5,880 3,828 48 22,355 91,280 1,932 – 137,381
Other EU 63,907 39 157 – 2,662 4,527 2 – 71,294
Brazil – – – – – 46,935 – – 46,935
UK – – – – – – – 45,846 45,846
Other non-EU 1,045 – – – – – – – 1,045
Grand total 2,703,213 1,129,123 43,191 48 1,238,451 1,593,844 1,934 45,846 6,755,651
BUILDING A SUSTAINABLE BUSINESS CONTINUED

Drax Group plc Annual report and accounts 2017 37Drax Group plc Annual report and accounts 2017 37
ENSURING A COAL-FREE FUTUREReducing our reliance on coalOur business is changing rapidly. Today we have cut our coal consumption by 72%, from 9.8 million tonnes in 2011 to 2.7 million tonnes in 2017, with three units upgraded to run on renewable biomass.
Given the UK Government’s policy decision to remove coal from the nation’s energy system by 2025, we are preparing for a post-coal future. Our goal is to replace coal with alternative lower-carbon fuels (subject to alternative generation being available).
In June 2017 we announced plans to consult on upgrading two of the remaining coal-fired units at Drax Power Station to become gas-powered generating plants. This is in addition to our plans to construct four fast-response Open Cycle Gas Turbine (OCGT) generation plants at new sites across England and Wales.
The upgraded gas-powered units could provide flexible and reliable electricity for the UK’s homes and businesses and facilitate other investments in renewable energy such as wind and solar power by helping to bridge intermittent renewable supplies.
In January 2018 the UK government confirmed support for conversion of a fourth unit to biomass fuel. The conversion of unit 4 will complete during 2018 allowing us to optimise generation across three ROC accredited units.
Sourcing coal responsibly Transitioning away from coal is challenging and will take time. In the meantime, we must continue to secure reliable and responsible sources of coal. Our coal sourcing approach is strictly governed by our compliance, sustainability and risk teams. Drax’s corporate social responsibility (CSR) statement sets out the legal, ethical, environmental and social standards we expect of our suppliers. Requirements are also set out in our contracts, including our preference for Bettercoal.
THE BETTERCOAL INITIATIVEBettercoal is a global, not-for-profit initiative established by a group of major utilities to promote the continuous improvement of corporate responsibility in the coal supply chain www.bettercoal.org.
We buy coal only from known sources and from suppliers that are transparent about origin mines. Any jurisdictions we source from are vetted against our policies. In 2017, 31% of the coal we used came from UK deep and surface mines, with the remainder coming predominantly from the US, Colombia and Russia. Where possible, we use pond fines (the filtered residue of coal washings) and other advantaged fuels to reduce the amount of raw coal extracted and burned.
As we look to the future, coal sourcing will continue to be governed by our focus on responsible sourcing. Origins will be determined by balancing quality and economics. Where possible, we source from Bettercoal-engaged mines.
We carry out due diligence to ensure coal is supplied in line with our CSR policy and carry out visits to suppliers’ sites. Where our checks raise any “red flags” we undertake enhanced due diligence and commission third party investigations. Results and concerns are reviewed by Drax’s Ethics and Business Conduct Committee if necessary.
Partnering with others to raise standardsWe work with a range of stakeholders to try and improve standards in the coal industry. For example, we engage with coal suppliers through conferences and through our membership of industry initiatives such as Bettercoal. In 2017, we attended conferences with large suppliers such as Cerrejón, to understand developments in their sustainability approach. We also enhanced our risk assessment process by capturing key questions on potential risks to revisit with suppliers.
The Bettercoal initiative works with coal suppliers to encourage continuous improvements in social, ethical and environmental standards. Suppliers complete a self-assessment process and are independently audited against the Bettercoal Code by approved assessors. We make it clear in supplier contracts that we prefer to source Bettercoal. Results from Bettercoal assessments form part of our supply chain due diligence procedures and any new information on suppliers is reviewed by Drax’s procurement and compliance teams.
In 2017, 23% of the coal we sourced was Bettercoal. As a member of the Technical & Advisory Committee (TAC), in 2017 we worked with other members to further develop rigorous procedures, protocols and assurance in the Bettercoal system.
Strategic reportG
overnanceFinancial statem
entsShareholder inform
ation

Drax Group plc Annual report and accounts 201738 Drax Group plc Annual report and accounts 201738
REDUCE OUR ENVIRONMENTAL IMPACTWe are committed to managing, monitoring and reducing our environmental impact and the Group environment policy outlines our approach. Our Environmental Management System (EMS) covering Drax Power Station and its associated ash disposal site is certified to IS0 14001. We are committed to complying with all relevant environmental legislation and there were no major or minor breaches to our environmental permits at Drax Power in 2017.
In addition to carbon, we manage our other emissions to air including sulphur dioxide (SO2), nitrogen oxides (NOX) and particulates. Managing the use of water and other natural resources, along with disposal of waste, is also important across our business. We aim to protect biodiversity both at our own sites and through our biomass sourcing.
POSITIVE SOCIAL IMPACTWe strive to have a positive social impact in the communities and countries in which we operate, through the jobs we provide, our wider economic contribution, the tax we pay and the education and charity projects we support. Communicating effectively with people is a vital aspect of being a successful
business and we aim to be transparent and open. We are in constant dialogue with our local communities and the diverse group of stakeholders affected by our business (see page 42, Stakeholder Engagement).
In 2017, we commissioned Oxford Economics to analyse Drax’s economic footprint across the UK. The researchers found that Drax contributed an estimated £1.67 billion to the UK economy in 2016, through the 18,500 people we directly employ, the supply chain we support and the goods and services we purchase.
Local recruitment is important to us. Opus Energy works with a network of education providers in Northampton to recruit local talent for apprenticeships in business administration and its graduate programme in the areas of risk management and IT. In the United States, our business activities have helped to revitalise communities which have lost jobs in traditional industries, such as pulp and paper, and our Pellet Production business provides a steady income for landowners who supply us with low-grade wood.
We also make a positive contribution by investing in skills and education projects, particularly in STEM (science, technology, engineering and maths) subjects which are aligned to our future business needs. In 2017 we supported education projects to develop STEM skills in schools and through apprenticeships to nurture the STEM skills and talents of young people.
Our businesses support local projects through fundraising, partnerships and volunteering. Each business has strong links to its local communities and we focus our charitable support on the areas where we operate. During 2017, the Group donated a total of £185,888 to a range of charities and £53,465 to non-charitable causes.
We take a responsible approach to managing our tax affairs and we will always comply with applicable tax laws and regulations in the countries in which we operate. In 2017 we paid taxes of more than £150 million. These included taxes on our profits, taxes on our workforce, taxes levied for burning fossil fuels as well as environmental taxes. This figure excludes VAT.
CASE STUDY
American Tree FarmThe majority of forestlands in the southern US are privately owned (86%) and two-thirds of these forests are owned by families and individuals. The American Tree Farm System (ATFS), administered by the American Forest Foundation, was established over 75 years ago to provide support and recognition to these non-corporate landowners who play such a key role in forest sustainability. Today, the 74,000 tree farmers across the US manage approximately 20.5 million acres of forestland. The programme has evolved into an internationally recognised, third party verified certification standard sanctioned by the Programme for the Endorsement of Forest Certification (PEFC) standards. The ATFS now provides a means by which family tree farmers can be recognised and rewarded in the marketplace for meeting rigorous sustainability standards analogous to large corporate owners certified to Sustainable Forestry Initiative (SFI) or Forest Stewardship Council (FSC) standard.

Drax Group plc Annual report and accounts 2017 39Drax Group plc Annual report and accounts 2017 39
CASE STUDY
Restoring Brickmakers’ WoodThe Eden-Rose Coppice Trust is a woodland network that transforms urban environmental disasters into beautiful, natural high-biodiversity woodland settings for people living with a terminal illness. Haven Power has been supporting the Trust’s ambitious Brickmakers’ Wood project in Ipswich since April 2016.
Brickmakers’ Wood is a three-and-a-half-acre site that is being transformed into a peaceful space for cancer patients, disadvantaged children and people with mental or physical health problems and learning difficulties. Throughout 2017, up to 12 Haven Power employees spent time volunteering at the project each month. Volunteers contributed to the restoration of the site and relished getting their hands dirty, clearing rubbish and dense overgrowth, building new structures, creating an allotment and planting wild flowers.
Without Haven Power’s contribution, the charity founders would have had to undertake most of the work at Brickmakers’ Wood themselves. In their words: “The continual volunteering has transformed the project, so we are now two to three years ahead of where we would have been otherwise.”
The site is being transformed into a town centre oasis and has already been put to good use. The charity has run skills workshops for 12–16 year-olds who have been excluded from school, encouraging them to learn about woodcraft and how to run a business.
BUILDING A SUSTAINABLE BUSINESS CONTINUED
13,200VISITORS TO DRAX POWER STATION
5,200PEOPLE REACHED BY
OUR OUTREACH PROGRAMME
Strategic reportG
overnanceFinancial statem
entsShareholder inform
ation

Drax Group plc Annual report and accounts 201740 Drax Group plc Annual report and accounts 201740
PEOPLE AND CULTUREDrax Group maintains high standards in its employment practices and all our employees benefit from a range of policies to support them in the workplace. These include policies designed to enable different work and lifestyle preferences, processes whereby employees can raise grievances or concerns about safety, along with supporting a diverse and inclusive workplace.
As at 31 September 2017, Drax Group employed a total number of 2,558 people and almost all our employees were on permanent contracts.
Of the total, 1,714 were male and 844 were female. There were eight Board directors (one female) and three members of the Executive Committee who were not directors (one female).
Diversity and inclusionDrax Group is fully committed to the elimination of unlawful and unfair discrimination and values the differences that a diverse workforce brings to the organisation. Our goal is to create and maintain a working environment that is supportive of all our people and where every employee has the opportunity to realise his or her potential. We believe that a commitment to diversity is critical to
achieving our strategic goals. We are determined to be a place where employees, customers and suppliers alike feel respected, comfortable and supported in all their diversity.
Employee representation and engagementOverall, 22% of the workforce across the Group is covered by collective bargaining. We have representative employee consultation and information arrangements in place for those employees who have individual employment contracts.
We communicate with employees through a range of channels, including our internal intranet, quarterly newsletter and Open Forum meetings. We track employee engagement through our opinion surveys. The 2016 survey of all UK and US employees (prior to Opus Energy joining the Group) was completed by 79% of employees. Key issues raised included the need for clearer learning and development programmes and more effective communication. The results were used to inform the development of our new people strategy. The next employee engagement survey will take place in 2018.
OUR EMPLOYEES ARE AT THE HEART OF OUR SUCCESS AND ARE KEY ENABLERS OF OUR BUSINESS STRATEGY
Employment contracts
Full time 92%Part time 8%
Employment gender
Male 67%Female 33%
Employees per country
United Kingdom 2,300United States 258
Employees per business unit
Corporate 185Pellet Production 258Power Generation 804B2B Energy Supply 1,311

Drax Group plc Annual report and accounts 2017 41Drax Group plc Annual report and accounts 2017 41
Our people strategyIn 2017, we launched our new Group-wide people strategy, One Drax. The strategy focuses on valuing our people, driving business performance and developing talent to deliver our strategic and operational objectives.
LABOUR AND HUMAN RIGHTSOur commitment to the protection of human rights includes not tolerating the use of underage workers or forced labour. This is captured in our ethics guide, “Doing the Right Thing”, in our Corporate Crime policy and our corporate social responsibility (CSR) statement.
Our CSR statement outlines the standard of ethical business conduct we expect from suppliers. Businesses in our supply chain should offer a safe workplace for their employees that is free from harm, intimidation, harassment and fear. We have incorporated further provisions into our statement template to manage and reduce these risks within our procurement contracts.
We encourage suppliers and contractors working on our behalf to challenge unethical behaviour and promote a “speak up” culture.
MODERN SLAVERYIn 2017 we published our first statement to comply with the UK Modern Slavery Act. This describes the steps we are taking to reduce the risk of modern slavery in our supply chain. We have added modern slavery awareness to our programme of regular training for contract managers, provided classroom-based training to higher-risk teams and reviewed our counterparty due diligence processes. Our most recent statement is available on our website.
HEALTH, SAFETY AND WELLBEINGThe Drax Group approach is outlined in our Group Health and Safety policy.
www.drax.com/about-us/health-and-safety/
Each business unit and corporate team has local arrangements in place, appropriate to the operating environment and hazards inherent in the workplace, to ensure that high standards are set and maintained.
We have well-established Safety Management Systems (SMS) in place to ensure safe workplaces for all our people. At Drax Power, the SMS is certified to OHSAS 18001 and subject to regular compliance reviews, the last of which took place in 2017. At Drax Biomass, the SMS meets the requirements of OHSAS 18001 and the United States certification ANSI Z10.
Safety performance is reported and reviewed regularly by local management teams, the Executive Committee and the Board. Each incident is comprehensively analysed and reviewed, lessons learnt are shared with employees and actions are taken to mitigate the risk of future failures. At Drax Power, a weekly safety update is uploaded to our intranet and at Drax Biomass, information is made available to employees through a health and safety online portal.
The Board receives monthly reports which include Lost Time Injury Rates (LTIR), Total Recordable Injury Rates (TRIR) and numbers of Reporting of Injuries, Diseases and Dangerous Occurrences Regulations (RIDDORs) (or US equivalent) for the Group. TRIR is included in the Group scorecard.
The results for 2017 were in line with targets, but the number of incidents increased from previous years, partly reflecting the increased headcount of the Group.
While the Group’s TRIR remained on target in 2017, the incident at our biomass rail unloading facilities in December did cause a fire. It highlighted once again that the risks of generating using biomass must be mitigated through robust safety procedures and a risk-based plant investment and maintenance programme.
HEALTH & SAFETY PERFORMANCE2017 Actual 2017 Target 2016 2015
Lost Time Injury Rates (LTIR)(1) 0.13 0.10 0.02 0.05
Total Recordable Injury Rates (TRIR)(2) 0.27 0.30 0.22 0.31
Reporting of Injuries, Diseases and Dangerous Occurrences Regulations (RIDDOR) 7 6 4 2
(1) LTIR is the total fatalities and lost time injuries per 100,000 hours worked (2) TRIR is the total fatalities, lost time injuries and medical treatment injuries per 100,000 hours worked
AT DRAX POWER, WE HAVE A PROUD HISTORY OF APPRENTICESHIPS, WITH THE MAJORITY REMAINING TO WORK AT DRAX AND PROGRESSING THROUGH THE COMPANY.
BUILDING A SUSTAINABLE BUSINESS CONTINUED
Strategic reportG
overnanceFinancial statem
entsShareholder inform
ation

Drax Group plc Annual report and accounts 201742 Drax Group plc Annual report and accounts 201742
STAKEHOLDER ENGAGEMENT
“THE MOVE TO CLEANER ECONOMIC GROWTH IS ONE OF THE GREATEST
INDUSTRIAL OPPORTUNITIES OF OUR TIME”
GREG CLARKSECRETARY OF STATE FOR BUSINESS, ENERGY AND INDUSTRIAL STRATEGY,
CLEAN GROWTH STRATEGY

Drax Group plc Annual report and accounts 2017 43Drax Group plc Annual report and accounts 2017 43
We engage with a range of people who are directly or indirectly involved in our business and affected by what we do.
IDENTIFYING STAKEHOLDERS Like many businesses we have a diverse group of stakeholders who are affected by our activities across the United Kingdom, Europe and the US. These include our shareholders, employees, customers, suppliers, communities, government regulators and policymakers, academia, non-governmental organisations, opinion formers and the media.
We communicate with different audiences regularly and keep track of stakeholder relationships. We use stakeholder feedback to inform the planning and delivery of our business activities.
We conduct an ongoing mapping exercise to assess how the stakeholder landscape is developing and to ensure we are recognising the expectations of a broad range of stakeholders and that across our businesses we do the right thing every day.
Investor engagement is discussed on page 69
PUBLIC AFFAIRSIt is vital to our business that we develop and maintain good relationships with governments, regulators and individuals in public life.
No party political donations were made in the UK or elsewhere in 2017 or 2016 and our interactions with those engaged in the political arena were aimed solely at the promotion of the Group’s business interests.
What counts as political expenditure within the EU encompasses a wide range of activities, many of which would not be considered as political in the normal sense. For that reason, in order to avoid inadvertently breaching EU legislation, Drax presents a resolution at its Annual General Meeting to seek shareholders’ approval for expenditure of up to £100,000 by the Company and its subsidiaries.
2017 HIGHLIGHTS
18Community sessionsWe listened to people near to our gas-fired power station projects at 18 drop-in sessions this year
16,604 Number of visitors to electricinsights.co.uk16,604 people visited Electric Insights, a Drax collaboration with researchers at Imperial College London, to learn more about our national electricity network
£1.67bn Contribution to GDPDrax’s 2017 Economic Impact report by Oxford Economics estimates that Drax’s direct, indirect and induced contribution to GDP was £1.67bn in 2016 and the Group supported 18,500 jobs
+28%Group website visits170,724 people visited our Group website in 2017, an increase of 28% on 2016
13,200Visitor numbersWe welcomed 13,200 visitors to Drax Visitor Centre this year
+83%New social media followers in 2017Followers on Twitter, Facebook, Instagram and LinkedIn increased by 83%, from 10,215 to 18,644
10.6mTwitter feedsIn 2017 our Tweets appeared in 10.6m Twitter users’ feeds
£185,888 Charitable donationsIn the course of 2017 Drax Group donated £185,888 to charitable causes and £53,465 to non-charitable causes
Strategic reportG
overnanceFinancial statem
entsShareholder inform
ation
Drax Group plc Annual report and accounts 201744 Drax Group plc Annual report and accounts 201744
COMMUNICATING WITH STAKEHOLDERSCommunicating effectively is a vital aspect of being a successful business. Honesty is one of the Drax core behaviours and we aim to be transparent and open.
Drax has a long history of engaging with people, businesses and local authorities. We engage with stakeholders and partner with many other organisations to make progress on sustainability topics throughout the year. We use the most appropriate communication channels to listen to our
stakeholders and ensure they can access the information they need about our policies, practices and strategic direction.
The table below summarises our key stakeholder engagement activities in 2017 and the topics raised.
STAKEHOLDER COMMUNICATION
Stakeholder group Key engagement activities in 2017 Overview of topics raised
Communities and local authorities
We have been in extensive dialogue with a number of communities around the UK throughout 2017 as our expanding Business to Business offer widened our geographic footprint and we progressed our various gas-fired power station projects through the planning process.Our employees also strengthen our links to local communities by volunteering to support local organisations.Drax provides a Board member and is a keen supporter of the Northern Powerhouse Partnership.
– Management of environmental impacts
– Transport management – Community initiatives
and sponsorships – The Northern
Powerhouse
Customers We generate and sell power to business customers. Haven Power and Opus Energy engage with their customers daily, including through our dedicated, UK-based customer service advisers at Haven Power and an online portal at Opus Energy.
– Customer service support – Sales and product details – Energy efficiency
Employees We communicate with our employees through various channels, such as the intranet, Open Forums and newsletters, and keep them informed of any important developments in the Group’s operations.We began the roll out of our new “One Drax” people strategy which has been designed to address the key issues that were raised by our employees, such as the need for clearer learning and development programmes and more effective internal communications.Drax Group companies also run graduate programmes focused on two areas of the business: commercial analysts and IT. Our apprenticeship programme offers opportunities in a number of different disciplines, including: electrical engineering, mechanical engineering, electrical control, an instrumentation engineering and corporate support function at Drax Power or administrative, customer service and facilitates management roles at Haven Power and Opus Energy.We work closely with employee representatives for the third of our workforce covered by collective bargaining. Business-led employee Forums, along with employee-led feedback groups are in place for employees on individual contracts.
– The One Drax strategy – Learning and
development – The purpose and future
direction of the Company – Career progression
Think tanks and academia
We frequently meet with a number of think tanks and academic institutions in the UK, Europe and US to inform our thinking around various policy issues and co-operate on issues of shared interest.We are collaborating with universities across the UK as part of our research and innovation work, including: Imperial College London, the University of Nottingham, the University of Leeds and the University of York. We are sponsoring three PhD projects at the University of Sheffield to understand developing technologies to enable Drax to support the UK’s energy system in the future.
– Carbon pricing – Developing technologies
for future energy needs – Sustainable wood
sourcing – Battery technology
and storage
Schools We have a long tradition of supporting education and helping children to develop their STEM (science, technology, engineering and maths) skills. Our activities included the launch of Project Reinvent – a challenge for secondary school students to develop an idea to improve their community using STEM skills.Our Skylark Centre and Barlow Nature Reserve is open to the public and regularly offers experiences for schoolchildren to learn about nature and ecology.
– STEM skills – Biodiversity and ecology
STAKEHOLDER ENGAGEMENT CONTINUED

Drax Group plc Annual report and accounts 2017 45Drax Group plc Annual report and accounts 2017 45
STAKEHOLDER COMMUNICATION continued
Stakeholder group Key engagement activities in 2017 Overview of topics raised
Government and regulators
We regularly engage with regulators and policymakers to ensure our business understands and contributes to the evolving regulatory agenda. We engage with the UK Government, particularly the Department for Business, Energy, Innovation and Skills and Her Majesty’s Treasury, on a range of topics including: the importance of biomass sustainability; carbon price support; the future of coal; the decarbonisation, decentralisation and digitisation of the energy sector; and innovation, training and skills.We engaged with representatives from the European Commission, European Parliament and Council of Ministers to inform the development of pan-European sustainability criteria for biomass as part of the Renewable Energy Directive II. The Directive is expected to be finalised in early 2018.
– European Union’s biomass sustainability policy
– Ofgem’s Targeted Charging Review
– Closure of unabated coal power stations
– Controlling the costs of biomass under the Renewable Obligation
Non-governmental organisations (NGOs)
NGOs play an important part in challenging our thinking and we engage with representatives from a number of leading UK and international NGOs active on climate and energy issues.In November, we invited a number of NGOs and other stakeholders to two roundtables in London and Brussels to discuss our approach to biomass sustainability. The roundtables were facilitated by leading environmentalist Tony Juniper, who presented on his recent fact-finding visit to Drax’s Biomass operations in the United States.Drax Biomass conducted a stakeholder consultation on risks associated with wood fibre procurement, as part of its efforts to meet the standards set out by the Sustainable Biomass Program (SBP) and the Forest Stewardship Council (FSC).
– Emissions to air, including particulates
– Closure of coal generation
– Carbon Price Support
Regulator and network businesses
We have engaged with Ofgem and National Grid on the need to deliver a secure and reliable network at least cost to the consumer, in addition to promoting efficient investment decisions and market behaviours via the system operator incentive scheme and industry licence, code and charging arrangements.
– Delivery of a secure and reliable network
Shareholders and investors
Sharing timely and accurate communication with shareholders is central to our relationship with investors. We shared results, prospects and our latest thinking with investors through a wide range of channels. These included our Capital Markets Day, Annual General Meeting, our Preliminary and Interim results announcements, our annual report and accounts and trading updates. Relevant documents can all be found online at www.drax.com.The remuneration policy for 2017-2019 and the Annual Report on Remuneration for 2016 were approved by the majority of investors in 2017 but we are conscious that a significant minority of shareholders voted against the policy and particularly the report. This feedback has been considered and noted.
– Results and prospects – Operations – Business strategy – Remuneration policy
Suppliers and Contractors
We engage proactively with our key fuel suppliers. We have developed a biomass supplier engagement programme and our approach includes regular site visits to improve overall performance. For coal sourcing, we carry out visits to suppliers’ sites.Drax Biomass requires and monitors biomass suppliers’ professional logger training as part of our certification requirements and commitment to our stakeholders.
– Expected standards of conduct
– Prompt Payment Code – Guidance on statutory
obligations, such as modern slavery
Trade and industry associations
We work closely with a number of trade and industry associations, particularly those active in the energy, renewable energy, timber and forestry sectors.We continued to play an active role in Energy UK, the trade body for the UK’s electricity industry, with our Group Chief Executive on its Board. We are a founding member of Biomass UK (the Renewable Energy Association’s biomass power sector group). Drax also serves on the Policy Board of the Renewable Energy Association. We are co-founders and an active member of the Sustainable Biomass Program (SBP).SBP’s vision is an economically, environmentally and socially sustainable woody biomass supply chain that contributes to a low carbon economy.In Europe we are represented on the Board of the European Biomass Association (AEBIOM) and are members of Eurelectric.The US Industrial Pellet Association, of which Drax Biomass is a member, has regular meetings at which members share best practice for managing health and safety, a critical part of our industry.
– Ofgem’s Targeted Charging Review
– The Renewable Energy Directive
– Health and safety in operations
Strategic reportG
overnanceFinancial statem
entsShareholder inform
ation

Drax Group plc Annual report and accounts 201746 Drax Group plc Annual report and accounts 201746
GROUP FINANCIAL REVIEW
“THE GROUP HAS GONE THROUGH A PERIOD OF
SIGNIFICANT CHANGE, WHILST DELIVERING MATERIAL
IMPROVEMENTS TO EBITDA”WILL GARDINER
CHIEF EXECUTIVE, DRAX GROUP
2017 HIGHLIGHTS1 Revenue increased to £3,685 million2 Gross margin increased
to £545 million3 Profit before tax impacted by non-
cash losses on derivative contracts4 Significant increase to
EBITDA, at £229 million5 Successful £550 million
bond placing6 Investment in growth: acquisition of
Opus Energy and LaSalle Bioenergy
(1) EBITDA is defined as earnings before interest, tax, depreciation, amortisation and material one-off items that do not reflect the underlying trading performance of the business
Drax Group plc Annual report and accounts 2017 47Drax Group plc Annual report and accounts 2017 47
INTRODUCTION The Group’s performance for 2017 was significantly improved from 2016, with EBITDA(1) of £229 million (2016: £140 million). This principally reflects contributions from recently acquired Opus Energy and the operation of a biomass unit in Power Generation under a CfD. This was delivered alongside a well-supported refinancing, a positive result for the Pellet Production business and good operational performance.
Profit before tax was adversely impacted by higher depreciation (£13 million), which included the previously announced accelerated depreciation of coal-specific assets, one off costs associated with the Opus Energy acquisition (£8 million) and the refinancing (£24 million), as well as amortisation of newly acquired intangible assets in Opus Energy (£37 million). Non-cash unrealised losses on derivative contracts in the period of £156 million (2016: profit £197 million), principally a result of foreign exchange rate movements, materially affected the result and led to a loss before tax of £183 million for the period.
The underlying profit performance, which excludes the volatility of open derivative contract valuations and associated tax charges and one off transaction costs, resulted in underlying earnings of £2.7 million, as shown in note 2.7 to the consolidated financial statements.
The financial structure of the business has changed over the year and the Group benefits from increasingly visible and growing earnings from a broader base, with reducing exposure to commodity prices, and strong cash generation potential. We expect the CfD will provide high quality earnings through the life of the contract (to March 2027), supported by growing contributions from expanding Pellet Production operations and B2B Energy Supply.
On 10 February 2017 we completed the acquisition of Opus Energy Group Limited for total consideration of £367 million. The acquisition was funded from the Group’s own resources and £200 million from an acquisition facility and resulted in £159 million of goodwill and £224 million of intangible assets (see note 5.1 to the consolidated financial statements).
The Group is supported by a strong balance sheet, strengthened in the period by the refinancing and restructuring of the Group’s debt and a continued focus on working capital and cash optimisation. Net debt was £367 million at 31 December, increased from £93 million in 2016, largely driven by debt funding drawn to finance the acquisition of Opus Energy. However, continued focus on working capital and cash optimisation resulted in net debt at 1.6x EBITDA at the end of the year.
The results for 2017 demonstrate clear progress with the Group’s strategy. Positive contributions were made from across the Group, the balance sheet was restructured and investment targeted in areas with the potential to deliver strong returns. This provides an excellent platform from which to increase shareholder value.
INCOME STATEMENTREVENUEConsolidated revenue for 2017 of £3,685 million was £735 million greater than 2016, driven by higher Power Generation sales and the acquisition of Opus Energy.
Electrical output from Power Generation of 20.0TWh was in line with our plan, 65% from biomass units and 35% from coal units. This included the impact of maintenance outages for two biomass units and the impact of low load factors on coal units during the summer. 2017 saw the first full year of generation under the CfD, contributing £248 million of revenue.
Revenues from system support services and the business’ ability to respond flexibly to grid demands grew during the year, contributing £88 million. The revenues available from flexibility recognises the value of the Drax plant in an increasingly volatile and intermittent generation market.
Renewable Obligation Certificate (ROC) revenues, recognised when we sell ROCs to third parties, of £368 million were recorded during the year (2016: £362 million).
B2B Energy Supply revenues increased from £1,326 million in 2016 to £1,999 million in 2017. This included contributions from Opus Energy (from 10 February) and included sales of gas, a key contributor to revenues over the winter period.
Revenues of our US-based Pellet Production business continued to rise, as we increased production from 607,000 tonnes in 2016 to 822,000 tonnes in the year. Revenues are based on sales of pellets from the US to our Power Generation business, based on an arms-length contract. Volumes included 18,000 tonnes of commissioning production from our new plant at LaSalle Bioenergy.
GROSS MARGINConsolidated gross margin for 2017 of £545 million (2016: £376 million) was primarily derived from our generation and supply activities.
Power Generation delivered £398 million of gross margin from biomass units operating under a CfD and the ROC regime and coal units providing system support. ROCs continue to form a key component of financial performance and the expected benefit of ROCs earned is recognised as a reduction in our biomass fuel costs at the point of generation. Each ROC is
subsequently recognised as revenue when that ROC is sold to a third party. We earned ROCs, reducing costs, with a total value of £481 million in 2017 (2016: £536 million) as CfD replaced ROC generation.
B2B Energy supply gross margin improved from £24 million in 2016 to £117 million in 2017, with positive contributions from Haven Power and Opus Energy. Electricity sales were supplemented, for the first time, with gas sales by Opus Energy.
Pellet Production gross margin relies on pellet sales and close control over production and operating costs. Increasing volumes and stable costs allowed margins to improve to £39 million during the year and deliver a positive EBITDA contribution for the first time.
Further segmental financial performance data is provided in the notes to our consolidated financial statements on page 127.
OPERATING COSTSOperating costs of £316 million increased from the previous year (2016: £236 million). This increase largely reflected the addition of Opus Energy to the Group and the expansion of the Pellet Production business. Operating costs in Power Generation included a major planned outage on one of the biomass units.
Central costs for 2017 were £34 million, compared with £21 million in 2016. The increase reflected investment in strategy, innovation and development activities, the majority of which is not expected to be recurring.
We incurred transaction costs of £8 million during the year (2016: £nil), supporting the delivery of strategic options, including the acquisition of Opus Energy. Transaction costs were also incurred as part of the disposal of Billington Bioenergy to Aggregated Micro Power Holdings plc on 31 October. These costs were all one off in nature, related to asset acquisitions and disposals, and were therefore excluded from EBITDA.
EBITDAAs a result of the financial performance described above, consolidated EBITDA for 2017 was £229 million, compared to £140 million in 2016.
DEPRECIATION AND AMORTISATIONDepreciation of £123 million in the year was £13 million higher than 2016, largely driven by the acceleration of charges following the shortening of useful economic lives for certain coal-specific assets and including write off of obsolete assets. We assume that assets which are only able to support coal-fired generation will not operate beyond 2025, in line with the Government’s declared intention to cease
Strategic reportG
overnanceFinancial statem
entsShareholder inform
ation

Drax Group plc Annual report and accounts 201748 Drax Group plc Annual report and accounts 201748
GROUP FINANCIAL REVIEW CONTINUED
unabated coal generation, resulting in accelerated depreciation charges between 1 January 2017 and 31 December 2025.
Amortisation charges of £44 million included £37.5 million relating to intangible assets arising from the Opus Energy acquisition. These assets totalled £224 million and were comprised of customer contracts, brand value and software, as shown in note 5.3. Charges in the year also include the impact of reclassifying software assets in use across the Group as intangible assets, following investment in new systems capability.
UNREALISED LOSSES ON DERIVATIVE CONTRACTSA key component of the Group’s risk management strategy is the use of forward contracts to secure and de-risk the future cash flows of the business. Whilst these contracts are all entered into for risk management purposes, a proportion of our portfolio is not designated into a hedge accounting relationship under IFRS. Where this is the case, the unrealised gains and losses arising from the change in fair market value of these contracts is recognised in our income statement.
In 2017, we recognised unrealised losses of £156 million (2016: gain £177 million) within the income statement in respect of outstanding contracts for future delivery. This was recorded below EBITDA and excluded from underlying earnings. In our balance sheet a similar loss of £209 million was recognised (2016: gain £330 million) in the hedge reserve (2016: gain £327 million). The losses, which do not impact cash, principally relate to forward foreign currency purchase contracts designed to fix the Sterling cost of future purchases of biomass. The majority of our fuel purchases are denominated in US Dollars, with the remainder in Canadian Dollars and Euros. The losses reflect the change in value of our hedge as Sterling has strengthened against the US Dollar during the year. The strengthening in Sterling during 2017 partially reversed the significant mark to market gains posted during 2016 as its value fell following the Brexit vote.
In addition to hedging foreign currency commitments we also forward purchase, as required, coal, oil, gas and carbon. An increase to oil prices during 2017 drove an unrealised gain from forward contracts for these commodities, which partially offset the unrealised losses on forward foreign exchange purchases.
Despite the loss in the year the Group continues to benefit from the hedging programme, securing medium-term fuel costs and other liabilities.
The term of our hedges is limited by available credit lines and market liquidity. We have
hedges in place to cover anticipated exposures until 2022, beyond which there is a risk that the cost of our fuel purchases will materially increase. We remain very focused on reducing the long- term cost of biomass fuel to preserve gross margins beyond the current currency hedge period.
The accounting treatment of derivative contracts is set out in note 7.2 to the consolidated financial statements.
EBITLoss before interest and tax (Operating loss) fell from £204 million in 2016 to a loss of £117 million in 2017, influenced by the items described above, a loss on disposal of Billington Bioenergy (£4 million), but principally reflecting the volatility in the unrealised gains and losses on derivative contracts. The impact of these movements is excluded in the calculation of underlying earnings (see below).
NET INTEREST CHARGESNet interest charges of £66 million include costs incurred as a result of the Group’s refinancing. This includes acceleration of deferred financing costs, the one-off cost of early repayment charges for loans outstanding at the refinancing date (£24 million) and interest costs driven by a higher quantum of debt than the previous year. A full breakdown of interest payable is shown in note 2.5.
PROFIT/LOSS BEFORE AND AFTER TAXThe Group’s loss before tax, calculated in accordance with IFRS, was £183 million for 2017, compared to a profit of £197 million for the previous year. The reduction predominantly reflects improvements to EBITDA, offset by higher depreciation and amortisation and unrealised losses on forward foreign currency purchase contracts.
The net tax credit of £32 million compares to £3 million in 2016. It includes two one-off items arising in the year.
Firstly, a tax credit of £13 million arising from a patent relating to biomass was granted to the Group in late 2016. Under the UK Patent Box tax regime, this enables the Group to pay corporate taxes at a lower rate on profits which arise from the use of innovation. We have agreed the claim with HMRC for prior years 2013 to 2016 (£10 million) and have included our best estimate of the benefit arising under the tax regime for 2017 (£3 million). However, for accounting purposes our best estimate is made of the benefit arising under the tax regime from 2013 to 2017.
Offsetting this credit is a non-cash deferred tax charge of £16 million arising from the reduction in US Federal tax rates to 21% from 1 January 2018.
Applying the tax credit results in a loss after tax of £151 million (2016: £194 million) and a basic loss per share of 37.2 pence (2016: 47.7 pence).
UNDERLYING EARNINGSUnderlying profit (also referred to as underlying earnings) is used to assess the performance of the Group without the P&L volatility caused by derivative contracts and any other material, one-off items. The reconciliation of IFRS earnings to underlying earnings is shown in note 2.7.
Underlying profit before tax for 2017 of £5 million reduced from £21 million in 2016, reflecting higher EBITDA offset by higher depreciation, amortisation and interest charges.
The underlying tax charge for the year of £2 million (2016: £nil) excludes the tax effect of non-underlying translations.
Underlying profit after tax for the year was £3 million (2016: £21 million), resulting in underlying EPS of 0.7 pence per share (2016: 5.0 pence per share).
FINANCIAL POSITIONCAPITAL EXPENDITUREThe Group has a disciplined approach to capital expenditure, with all projects subject to review by investment committees and large projects requiring Board approval. Investment is prioritised to address safety and regulatory requirements, ensure plant is fully maintained and fit for purpose, and only released to enhancement projects where incremental returns have been identified.
Capital expenditure in the year was £181 million, increased from £97 million during 2016. This included the purchase, at auction, of the pellet-production assets at LaSalle Bioenergy and investment to recommission the plant and achieve throughput of 450k tonnes of wood pellets per annum. In total the LaSalle investment was £48 million. Details are shown in note 3.1.
At Drax Power Station investment reflected routine asset replacement and upgrades (£62 million), including the purchase of strategic spares, and payments to secure development options for four OCGT power plants.
In B2B Energy Supply the development of a new information technology platform and preparations for Smart meters adoption added £9 million and an office facility was purchased in Northampton (£17 million), which will be used to consolidate existing Opus Energy operations from four offices into a single facility, enhancing operational effectiveness.
CASH GENERATED FROM OPERATIONSCash generated from operations was £315 million in 2017, an increase of

Drax Group plc Annual report and accounts 2017 49Drax Group plc Annual report and accounts 2017 49
£125 million from the previous year. Key drivers were the improvement in EBITDA and cash inflows generated from working capital management.
Working capital management included use of a committed facility to manage receivables in our B2B Energy Supply business, providing cash in advance of normal payment terms. More details can be found in note 4.4 to the consolidated financial statements.
A cash inflow was also generated from ROC sales. Cash from ROCs is typically realised several months after the ROC is earned however, we have optimised our trading activities to enable us to accelerate the cash flows over a proportion of these assets. This provided a £142 million cash benefit during 2017. In 2016, three uncommitted ROC facilities were used to accelerate ROC receivables, these were unused at 31 December 2017 (2016: £111 million).
The net cash outflow for the year was £6 million (2016: £95 million inflow), after cash payments for capital expenditure of £159 million (2016: £93 million) and dividend payments of £22 million (2016: £11 million). Cash taxes paid during the year were £14 million (2016: £2 million).
NET DEBT AND FUNDINGThe cash position of the Group during the year was significantly impacted by a full Group refinancing, which was executed on 5 May 2017. The Group successfully raised £550 million of publicly traded bonds, supported by a revised revolving credit facility and indexed loan notes totalling £350 million. The newly raised funds were used to repay the £200 million Opus Energy acquisition facility. The remaining funds will provide support for the Group’s investment and strategic programmes.
The use of the receivables facility and ROC sales mentioned above accelerated cash flows to a value of £110 million (2016: £74 million) with a corresponding reduction to net debt. We expect to continue to use the receivables facility throughout 2018. In addition we expect to maintain the flexibility to accelerate ROC cash flows through optimising our trading activities or through uncommitted ROC receivable facilities.
The Group also has access to secured trading lines, available with certain counterparties, providing support to the trading programme.
Net debt at 31 December 2017 was £367 million, an increase of £273 million from 31 December 2016 (£94 million).
We remain committed to a strong balance sheet and maintaining an appropriate credit rating. Cash optimisation contributed to achieving a ratio of net debt to EBITDA
of 1.6x at 31 December and we remain focused on further reductions, supported by improved cash generation.
Further information on funding arrangements is included in note 4.3 to the consolidated financial statements, on page 144.
PENSIONSThe Group operates a defined contribution pension scheme in each of its operating companies and, in addition, the Power Generation business operates a defined benefit scheme within the Electricity Supply Pension Scheme framework. The triannual valuation for this scheme (dated 31 March 2016) completed during the year, resulting in an agreement with the Trustees for the Company to make deficit repair contributions, totalling £52 million, from 1 January 2017 to 31 December 2025. The agreement also establishes a legally binding journey plan, involving the deficit contributions, improved investment returns and liability reductions, targeting financial self-sufficiency for the scheme by 2025.
OTHER INFORMATIONACQUISITION OF OPUS ENERGY GROUP LIMITEDOn 6 December 2016 we announced the proposed acquisition of Opus Energy Group Limited, a well-established and proven B2B energy supply business serving the SME market, for consideration of £340 million cash, plus locked box interest.
The acquisition was partly financed by a short-term debt facility of up to £375 million, of which £200 million was initially drawn down and then repaid during the year.
The proposed acquisition was approved by shareholders at a general meeting on 8 February 2017 and concluded on 10 February 2017, with Drax obtaining control of Opus Energy at that date. Opus Energy is expected to deliver enhanced margins to Drax’s retail business and drive our growth in the SME market. The business made a positive contribution to performance during 2017.
Financial information on the assets and liabilities acquired, plus an assessment of the impact of the acquisition on our financial statements, is provided in note 5.1 to the consolidated financial statements on page 148.
IMPACT OF BREXITWe have continued to monitor the progress of the UK’s Brexit negotiations and the potential impact on the Group. Whilst we continue to expect limited impact on our operations, any associated Sterling weakness may influence the future cost of fuel used by the Power Generation business. To manage this risk a number
of financial instruments, including FX options, were added to the foreign exchange hedging programme during the year, effectively capping future FX liabilities on an additional proportion of the future foreign currency fuel exposures.
DISTRIBUTIONSOn 15 June we announced a new dividend policy, consistent with maintaining the Group’s credit rating and investing in its business. As part of this announcement the Board expected to recommend a dividend of £50 million with regard to the 2017 financial year, with growth expected in future years.
The Board is confident that this level of dividend is sustainable and expects it to grow from this level as the implementation of the strategy generates an increasing proportion of stable earnings and cash flows. In determining the rate of growth in dividends the Board will take account of future investment opportunities and the less predictable cash flows from the Group’s commodity based businesses. If there is a build-up of capital in excess of the Group’s investment needs the Board will consider the most appropriate mechanism to return this to shareholders.
At the Annual General Meeting on 13 April 2017, shareholders approved payment of a final dividend for the year ended 31 December 2016 of 0.4 pence per share (£1.6 million). The final dividend was subsequently paid on 12 May 2017.
On 18 July 2017, the Board resolved to pay an interim dividend for the six months ended 30 June 2017 of 4.9 pence per share (£20 million), representing 40% of the expected full year dividend. The interim dividend was paid on 6 October 2017.
At the forthcoming Annual General Meeting, on 25 April 2018, the Board will recommend to shareholders that a resolution is passed to approve payment of a final dividend for the year ended 31 December 2017 of 7.4 pence per share (£30 million), payable on or before 11 May 2018.
Shares will be marked ex-dividend on 19 April 2018. In addition, in line with our capital allocation policy, the Board has agreed to undertake a £50 million share buy back programme during 2018 to return cash to our shareholders.
Strategic reportG
overnanceFinancial statem
entsShareholder inform
ation

Drax Group plc Annual report and accounts 201750 Drax Group plc Annual report and accounts 201750
VIABILITY STATEMENT
The risks were evaluated, where possible, to assess the potential impact of each on the viability of the Group, should that risk arise in its unmitigated form. The potential inputs were included, where appropriate, as sensitivities to the Plan and considered by the Board as part of the approval process required before the Plan was adopted by the Group.
In this regard, the Group has a proven track record of adapting to changes to its environment and deploying innovative solutions to protect financial performance. Recent developments suggest that this will continue in the future as the Group invests in new plant, equipment and systems and broadens the business in line with the strategy.
REVIEW OF FINANCIAL FORECASTSThe Plan considers the Group’s financial position, performance, cash flows, covenant compliance and other key financial ratios and was most recently updated to reflect current market and external environment conditions in December 2017. It is built by business and segment, and includes growth assumptions appropriate to the markets each business serves.
The Plan includes certain assumptions, the most material of which relate to commodity market price curves and levels of subsidy support available to the Group through the generation of biomass-fuelled renewable power. It is underpinned by the stable revenues available through the generation of CfD-backed electricity and sales to B2B Energy Supply customers.
The Plan is subject to stress testing, which involves the construction of reasonably foreseeable scenarios, including those aligned to the principal risks, which test the robustness of the Plan when key variables are flexed both individually and in unison. Where such a scenario suggests a risk to viability, the availability and quantum of mitigating actions is considered.
The Board considers the most significant of these scenarios in the assessment period to be a significant deterioration of commodity market prices, leading to a fall in the available price for power and thus a fall in the margins available to the Group from power generation and supply activities. This impact would however be partially mitigated through the earnings stability provided by the CfD and a reducing reliance on commodity price-dependant earnings. Based on its review the Board is satisfied that in such a scenario sufficient actions could be taken to preserve the viability of the Group.
AVAILABILITY OF ADEQUATE FUNDINGThe sources of funding available to the Group are set out in note 4.3 to the consolidated financial statements (see page 144). The Board expects these sources, along with cash flows generated by the Group from its normal operations, to provide adequate levels of funding to support the execution of the Group’s Plan.
Refinancing of the Group’s debt facilities during the year, and in particular the placement of a new bond facility, has provided the Group with enhanced facilities and the ability to access debt markets, should that need arise during the viability assessment period.
EXPECTATIONSThe directors have considered all the factors in their assessment of viability over the next three years, including the latest Plan, scenario analysis, levels of funding, control environment and the principal risks and uncertainties facing the Group. The directors have also considered the availability of actions within their control in the event of plausible negative scenarios occurring. They have a reasonable expectation that the Group will be able to continue in operation and meet its liabilities as they fall due over the three-year period of their assessment.
The assessment of viability was led by the Group Chief Executive and Interim Chief Financial Officer in conjunction with divisional and functional management teams and presented to the Board. In reviewing this assessment the Board has considered the principal risks faced by the Group, relevant financial forecasts and sensitivities, the availability of adequate funding and the strength of the Group’s control environment.
ASSESSMENT PERIODThe Board conducted this assessment over a period of three years, which was selected for the following reasons:
– The Group’s Business Plan, which is reviewed and assessed on a quarterly basis and is used for strategic decision making, includes a range of financial forecasts and associated sensitivity analysis. This Plan covers a three-year period in detail.
– Within the three-year period liquid commodity market curves and established contract positions are used in the forecasts. Liquid curves typically cover a one to two-year window and contracts cover periods between one and ten years. In particular, we benefit from the stable and material earnings stream available from the CfD until 2027. Selecting a three-year period balances short-term market liquidity against our longer term contractual positions.
– Within a three-year horizon there is limited certainty around markets and regulatory regimes. However, in selecting this period the Board has assumed no material changes to the Group’s mid-term regulatory environment and associated support regimes.
REVIEW OF PRINCIPAL RISKSThe Group’s principal risks and uncertainties, set out in detail on pages 51 to 57, have been considered over the period.
The principal risks with the potential to exert significant influence on viability are: commodity price changes, political and regulatory changes, biomass acceptability changes and plant operating failures. A significant adverse change to the status of each risk has the potential to place material financial stress on the Group.
IN ACCORDANCE WITH THE UK CORPORATE GOVERNANCE CODE, THE DIRECTORS HAVE ASSESSED THE PROSPECTS OF
THE GROUP OVER A PERIOD SIGNIFICANTLY LONGER THAN THE 12 MONTHS REQUIRED BY THE GOING CONCERN PROVISION.

Drax Group plc Annual report and accounts 2017 51Drax Group plc Annual report and accounts 2017 51
PRINCIPAL RISKS AND UNCERTAINTIES
GROUP APPROACH TO RISK MANAGEMENTThe effective identification and management of risk across the Group is integral to the delivery of our strategy. The Group has a Risk Management Policy, approved by the Board, which defines the Group’s approach to risk management. The key elements of the policy are as follows:
– identify principal risks that threaten the achievement of our strategic objectives then assess their significance to the business;
– put in place appropriate mitigating controls to manage identified risks to an acceptable level;
– escalate and report principal risk and control information to support management decision making;
– assign responsibility and define accountabilities for risk management and put these into practice across the Group;
– continuously monitor the changing risk environment, the Group’s principal risks, the effectiveness of mitigation strategies and the application of the risk framework.
The approach manages rather than eliminates the risk of failure to achieve business objectives, and provides reasonable, not absolute, assurance against material misstatement or loss.
RISK MANAGEMENT COMMITTEESThe risk management governance structure includes seven business risk management committees (RMCs).
Each RMC: – reports to the executive management of that area, assisting in the management of their risks. In turn, each executive is responsible for their risks to the Group Executive Committee with responsibility for ensuring that all risks associated with their specific area of the business are identified, analysed and managed systematically and appropriately. This includes new and emerging risks and changes to existing risks. New risks are also identified during development of the Business Plan;
– has terms of reference that require local level risk policies and control systems to be approved, implemented and monitored in order to ensure that activities are commensurate with the risk appetite established by the Board, are adequately resourced and comply with applicable legal and regulatory requirements.
The Group Executive Committee and the Board review reporting on risks from each RMC and from Group Risk. In addition, the Audit Committee reviews the suitability and effectiveness of risk management processes and controls on behalf of the Board.
We manage the commercial and operational risks faced by the Group in accordance with policies approved by the Board. We have reviewed the principal risks and consider they are broadly unchanged from the previous year.
The Board is responsible for defining risk appetite and ensuring the effectiveness of risk management and internal controls across the Group. The Group has a comprehensive system of governance controls to manage key risks.
WE MANAGE THE COMMERCIAL AND OPERATIONAL RISKS FACED
BY THE GROUP IN ACCORDANCE WITH POLICIES APPROVED BY THE BOARD.
Strategic reportG
overnanceFinancial statem
entsShareholder inform
ation

Drax Group plc Annual report and accounts 201752 Drax Group plc Annual report and accounts 201752
ACCOUNTABILITYASSURANCEAUDIT COMMITTEE GROUP EXECUTIVE
COMMITTEEGROUP RISK
BUSINESS RISK MANAGEMENT COMMITTEES
DRAX GROUP PLC BOARD
PRINCIPAL RISKS AND UNCERTAINTIES CONTINUED
INTERNAL CONTROLThe Group has a comprehensive and well-defined internal control system with clear structures, delegated authority levels and accountability. The Board has adopted a schedule of matters which are required to be brought to it for decision. The internal control system is designed to ensure that the directors maintain full and effective control over all significant strategic, financial and organisational issues.
Through the Audit Committee, the Board has implemented a programme of internal audits of different aspects of the Group’s activities. The programme is developed based on an assessment of the key risks of the Group, the existing assurance and controls in place to manage the risks and the core financial control framework.
The results of each internal audit are documented in a report for internal distribution and action. A full copy of the report is distributed to the Group Executive Committee and the Chair of the Audit Committee, with an executive summary going to the other members of the Audit Committee. Each report includes management responses to Internal Audit’s findings and recommendations and an agreement of the actions that management will take to improve the risk management and the internal control framework. In addition to the results of work undertaken by Internal Audit, the Audit Committee also satisfies itself that an action plan is in place and management are addressing issues raised by the external auditor in their yearly management letter.
Based on the reporting from the RMCs and from the Audit Committee in 2017, the Board determined that it was not aware of any significant deficiency or material weakness in the system of internal control.
CHANGE IN RISK PROFILERisks are reported to the Board and disclosed in the annual report and accounts under eight principal risk headings. These are unchanged from 2016.

Drax Group plc Annual report and accounts 2017 53Drax Group plc Annual report and accounts 2017 53
Risk Mitigations Movement Changes in factors impacting risk in 2017
1. Strategic risks
ContextThe Group has a strategy designed to strengthen the long-term future of the Group. The strategy includes:
– Higher quality, diversified earnings and management of commodity market exposure by increasing contractual and non-commodity related earnings and;
– Targeted long-term growth opportunities with priority on post 2027 earnings and creating new opportunities in all the markets in which we operate.
Risk and impact – Development of the four OCGT plants acquired in 2016 and re-powering of coal units to gas with battery storage option is dependent on winning contracts with acceptable returns in capacity market auctions which is uncertain.
– Post 2027 biomass generation dependent upon cost of generation relative to market prices.
– Biomass self-supply requires acquisition and/or expansion in order to achieve the 30% self-supply target. Acquisition opportunities are dependent on willing vendors or distressed plants coming to market.
– The energy markets in which we operate are evolving at a rapid pace with new entrants competing with existing players in both Power Generation and B2B Energy Supply.
– Continue work on reducing projects’ costs to increase competitiveness in the capacity market auction; a disciplined approach to the auction means such projects will only go forward upon obtaining a 15-year capacity market contract (“CM” contract) which meets our hurdle rate.
– Continued work on cost reductions from biomass supply and generation efficiency to support post-2027 operations.
– We continue to actively pursue potential acquisitions of pellet plant facilities and evaluate the case for expansion of existing facilities.
– We continually analyse the changing dynamics of the markets in which we operate. A programme of product incubation to bring new energy services to market and research/development into new technologies is in place.
– Acquisition of Opus Energy and integration into the Group provides support to diversification of earnings.
– Acquisition and start of commissioning of LaSalle pellet facility supports self-supply target.
– Announcement of a cap to standard variable tariffs (SVTs) for residential customers increases regulatory risk to the sector.
– Announcement of a de-rating mechanism for battery storage will result in a fairer competition for CM contracts.
Key Up/increasing Down/reducing No change
Strategic reportG
overnanceFinancial statem
entsShareholder inform
ation

Drax Group plc Annual report and accounts 201754 Drax Group plc Annual report and accounts 201754
PRINCIPAL RISKS AND UNCERTAINTIES CONTINUED
Risk Mitigations Movement Changes in factors impacting risk in 2017
2. Political and regulatory risks
ContextWe remain vulnerable to changes in government policy at UK and EU level. The energy sector is subject to detailed legislation and regulation that is frequently changing as the economy decarbonises and decentralises and is ever more stringent. Regulation and compliance generally applicable to businesses is also increasing with a trend towards transparency and accountability.
Risk and impact – Changes to UK policy and regulations may reduce our ability to deliver our forecast earnings from our base business and our growth strategy putting pressure on our financial results and cash flows.
– More complex and challenging regulations increase the potential for non-compliant outcomes, regulatory investigation and sanctions.
– Engagement with politicians across the political spectrum and Government officials to influence thinking.
– Communication of our socio- economic value to the UK.
– Working with think tanks and specialist consultants to establish Drax as a thought leader on priority policy and regulatory issues.
– Engagement with regulators to influence strategic direction of, and ensure compliance with, regulatory requirements.
– Working with Energy UK to identify market improvements, enhance competition and develop voluntary codes of practice.
– Regulatory and compliance programmes in place proportionate to the risk of non-compliance. Key programmes include compliance with the Criminal Finances Act 2017 and the General Data Protection Regulation (GDPR) and associated data protection laws.
– The Government has confirmed the Carbon Price Floor will remain in place and at its current level until the end of coal generation in the power sector (by 2025).
– The Government has unveiled a successor to the Levy Control Framework to monitor the cost of subsidies and confirmed no new funding commitments until 2025.
– Brexit continues to create uncertainty over UK participation in, and influence over, discussions on new EU legislation.
– The Government has published a Bill to introduce a price cap for domestic power retailers; we remain vigilant to the risk this could be extended to some SMEs.
– The smart meter roll out continues and the obligation to install a smart meter for every customer (where reasonable steps have been exhausted) remains.
– Many ancillary services require policy, regulatory and market change to ensure generators are suitably compensated for these services.
– Ofgem is reviewing the way in which network businesses are remunerated, which will impact network charging and access rights for generators and demand users.
– New Data Protection Bill announced due to Brexit to ensure the UK is regarded as an “approved country” to continue to process EU citizen personal data.
– The introduction of the Markets in Financial Instruments Directive 2 (MiFID2) increases the regulatory requirements placed on businesses participating in non-physical commodity markets.
Key Up/increasing Down/reducing No change
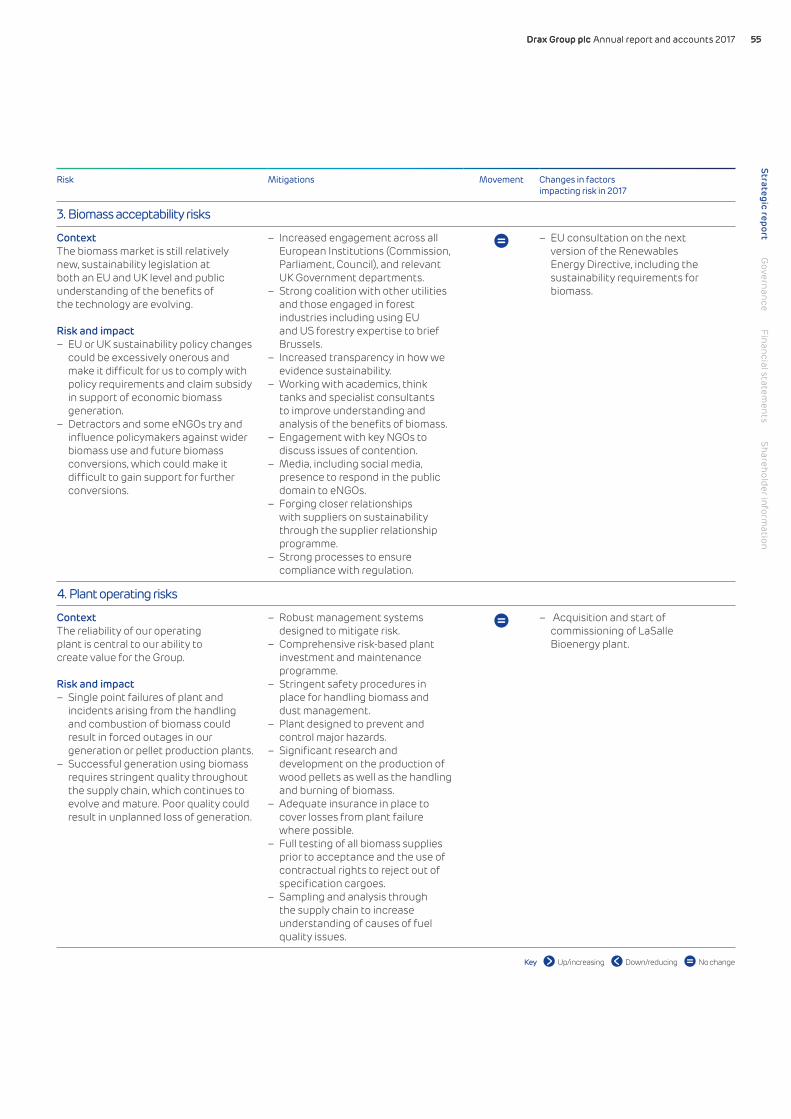
Drax Group plc Annual report and accounts 2017 55Drax Group plc Annual report and accounts 2017 55
Risk Mitigations Movement Changes in factors impacting risk in 2017
3. Biomass acceptability risks
ContextThe biomass market is still relatively new, sustainability legislation at both an EU and UK level and public understanding of the benefits of the technology are evolving.
Risk and impact – EU or UK sustainability policy changes could be excessively onerous and make it difficult for us to comply with policy requirements and claim subsidy in support of economic biomass generation.
– Detractors and some eNGOs try and influence policymakers against wider biomass use and future biomass conversions, which could make it difficult to gain support for further conversions.
– Increased engagement across all European Institutions (Commission, Parliament, Council), and relevant UK Government departments.
– Strong coalition with other utilities and those engaged in forest industries including using EU and US forestry expertise to brief Brussels.
– Increased transparency in how we evidence sustainability.
– Working with academics, think tanks and specialist consultants to improve understanding and analysis of the benefits of biomass.
– Engagement with key NGOs to discuss issues of contention.
– Media, including social media, presence to respond in the public domain to eNGOs.
– Forging closer relationships with suppliers on sustainability through the supplier relationship programme.
– Strong processes to ensure compliance with regulation.
– EU consultation on the next version of the Renewables Energy Directive, including the sustainability requirements for biomass.
4. Plant operating risks
ContextThe reliability of our operating plant is central to our ability to create value for the Group.
Risk and impact – Single point failures of plant and incidents arising from the handling and combustion of biomass could result in forced outages in our generation or pellet production plants.
– Successful generation using biomass requires stringent quality throughout the supply chain, which continues to evolve and mature. Poor quality could result in unplanned loss of generation.
– Robust management systems designed to mitigate risk.
– Comprehensive risk-based plant investment and maintenance programme.
– Stringent safety procedures in place for handling biomass and dust management.
– Plant designed to prevent and control major hazards.
– Significant research and development on the production of wood pellets as well as the handling and burning of biomass.
– Adequate insurance in place to cover losses from plant failure where possible.
– Full testing of all biomass supplies prior to acceptance and the use of contractual rights to reject out of specification cargoes.
– Sampling and analysis through the supply chain to increase understanding of causes of fuel quality issues.
– Acquisition and start of commissioning of LaSalle Bioenergy plant.
Key Up/increasing Down/reducing No change
Strategic reportG
overnanceFinancial statem
entsShareholder inform
ation

Drax Group plc Annual report and accounts 201756 Drax Group plc Annual report and accounts 201756
PRINCIPAL RISKS AND UNCERTAINTIES CONTINUED
Risk Mitigations Movement Changes in factors impacting risk in 2017
5. Trading and commodity risks
ContextThe margins of our Power Generation and B2B Energy Supply businesses are influenced by commodity market movements, which are inherently volatile.
Risk and impact – Fluctuations in commodity prices, particularly gas and power, could result in lower margins and a reduction in cash flow in our generation business.
– Drax Power may fail to secure future grid system services contracts which are a source of revenue diversity for the Group.
– The value of ROCs generated may be lower than forecast if the recycle value outturns below BEIS’ projections due to higher than anticipated renewable generation.
– High levels of forward power sales for 2018 and a CfD for one generation biomass unit.
– Hedging energy supply commodity price exposures when fixed price sales are executed with third parties.
– Wood pellets purchased under long-term contracts with fixed pricing.
– Significant forward foreign exchange hedging in place.
– Hedging fluctuations in ROC generation from wind farms through weather derivatives.
– Sterling exchange rates against the Euro and Dollar remain weak.
– Power prices remain low with increased volatility in short-term prices.
– Prices for wood pellets increased as oversupply reduced.
– Opus Energy’ supply to smaller customers, including gas, increases commodity exposure relating to weather impacts on demand patterns.
6. Information systems and security risks
ContextThe availability, integrity and security of our IT systems and Company data are essential to support operations of the Group.
Risk and impact – Non-availability of IT systems, or a breach in their security, could result in the inability to operate systems or our information could be compromised.
– If our IT architecture does not meet the increasingly demanding and complex requirements of the Group, we may not deliver our growth plans effectively.
– Business continuity, disaster recovery and crisis management plans in place across the Group.
– Cyber security measures, including a defence, detect, remedy strategy, in place.
– IT transformation programme in place to deliver upgraded architecture.
– Significant investment in our critical IT systems has improved the general resilience of the core systems.
– Implementation of the IT transformation programme.
7. People risks
ContextWe need to ensure we have the right people in place with the leadership and specialist skills to help the Group to compete, innovate and grow.
Risk and impact – Our performance and the delivery of our strategy is dependent upon having strong, high-quality leaders and engaged and talented people at all levels of the organisation.
– Consistent Group-wide performance management, potential assessment and career development frameworks.
– Regular staff surveys to monitor engagement levels and alignment of people with Group values.
– Investment in leadership development.
– Regular staff communications. – Reward packages to aid retention.
– Development and launch of a new people strategy centred around valuing people, driving business performance and focusing on talent. This is placing greater onus on performance, learning, equitable treatment and consistency in approach across the Drax Group.
Key Up/increasing Down/reducing No change
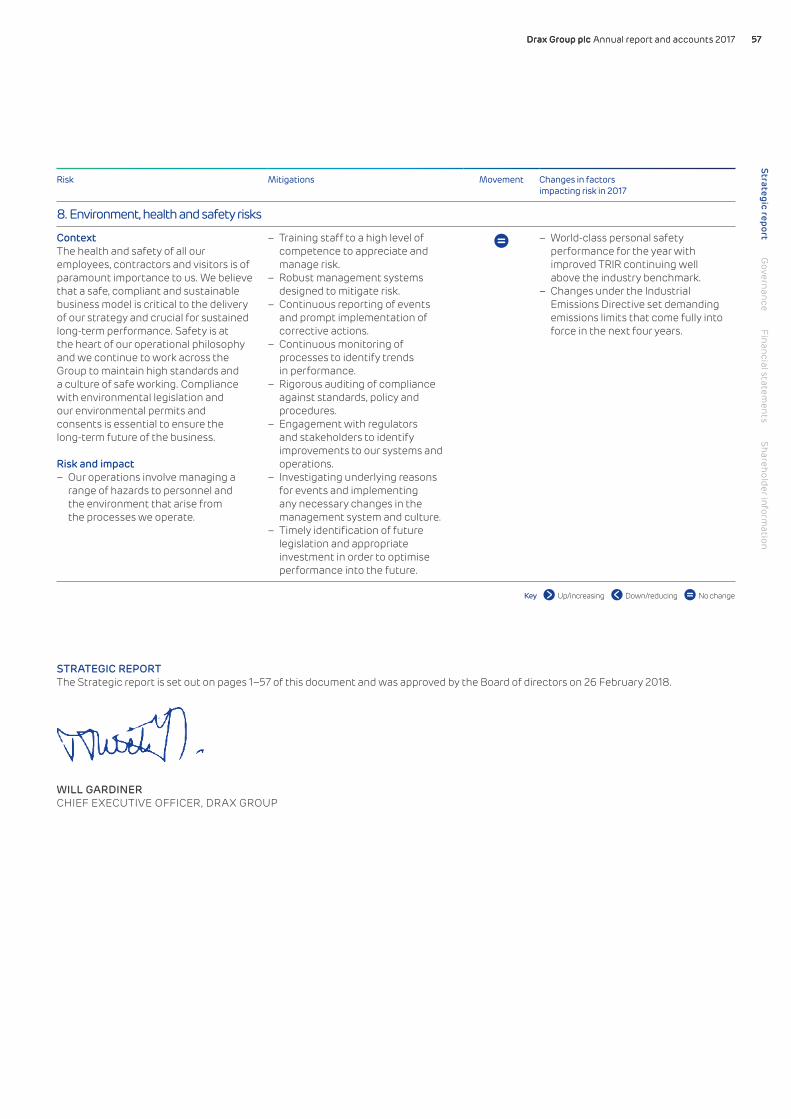
Drax Group plc Annual report and accounts 2017 57Drax Group plc Annual report and accounts 2017 57
Risk Mitigations Movement Changes in factors impacting risk in 2017
8. Environment, health and safety risks
ContextThe health and safety of all our employees, contractors and visitors is of paramount importance to us. We believe that a safe, compliant and sustainable business model is critical to the delivery of our strategy and crucial for sustained long-term performance. Safety is at the heart of our operational philosophy and we continue to work across the Group to maintain high standards and a culture of safe working. Compliance with environmental legislation and our environmental permits and consents is essential to ensure the long-term future of the business.
Risk and impact – Our operations involve managing a range of hazards to personnel and the environment that arise from the processes we operate.
– Training staff to a high level of competence to appreciate and manage risk.
– Robust management systems designed to mitigate risk.
– Continuous reporting of events and prompt implementation of corrective actions.
– Continuous monitoring of processes to identify trends in performance.
– Rigorous auditing of compliance against standards, policy and procedures.
– Engagement with regulators and stakeholders to identify improvements to our systems and operations.
– Investigating underlying reasons for events and implementing any necessary changes in the management system and culture.
– Timely identification of future legislation and appropriate investment in order to optimise performance into the future.
– World-class personal safety performance for the year with improved TRIR continuing well above the industry benchmark.
– Changes under the Industrial Emissions Directive set demanding emissions limits that come fully into force in the next four years.
Key Up/increasing Down/reducing No change
STRATEGIC REPORTThe Strategic report is set out on pages 1–57 of this document and was approved by the Board of directors on 26 February 2018.
WILL GARDINERCHIEF EXECUTIVE OFFICER, DRAX GROUP
Strategic reportG
overnanceFinancial statem
entsShareholder inform
ation
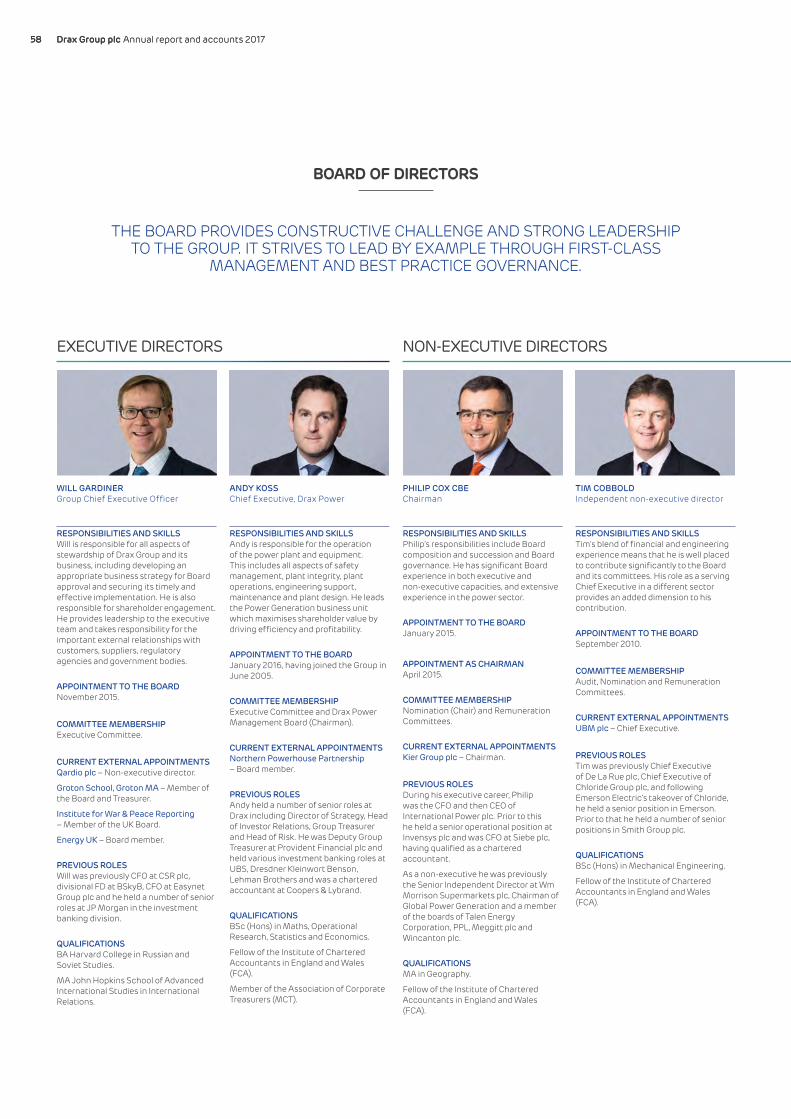
Drax Group plc Annual report and accounts 201758 Drax Group plc Annual report and accounts 201758
BOARD OF DIRECTORS
EXECUTIVE DIRECTORS NON-EXECUTIVE DIRECTORS
ANDY KOSSChief Executive, Drax Power
RESPONSIBILITIES AND SKILLSAndy is responsible for the operation of the power plant and equipment. This includes all aspects of safety management, plant integrity, plant operations, engineering support, maintenance and plant design. He leads the Power Generation business unit which maximises shareholder value by driving efficiency and profitability.
APPOINTMENT TO THE BOARDJanuary 2016, having joined the Group in June 2005.
COMMITTEE MEMBERSHIPExecutive Committee and Drax Power Management Board (Chairman).
CURRENT EXTERNAL APPOINTMENTSNorthern Powerhouse Partnership – Board member.
PREVIOUS ROLESAndy held a number of senior roles at Drax including Director of Strategy, Head of Investor Relations, Group Treasurer and Head of Risk. He was Deputy Group Treasurer at Provident Financial plc and held various investment banking roles at UBS, Dresdner Kleinwort Benson, Lehman Brothers and was a chartered accountant at Coopers & Lybrand.
QUALIFICATIONSBSc (Hons) in Maths, Operational Research, Statistics and Economics.
Fellow of the Institute of Chartered Accountants in England and Wales (FCA).
Member of the Association of Corporate Treasurers (MCT).
TIM COBBOLDIndependent non-executive director
RESPONSIBILITIES AND SKILLSTim’s blend of financial and engineering experience means that he is well placed to contribute significantly to the Board and its committees. His role as a serving Chief Executive in a different sector provides an added dimension to his contribution.
APPOINTMENT TO THE BOARDSeptember 2010.
COMMITTEE MEMBERSHIPAudit, Nomination and Remuneration Committees.
CURRENT EXTERNAL APPOINTMENTSUBM plc – Chief Executive.
PREVIOUS ROLESTim was previously Chief Executive of De La Rue plc, Chief Executive of Chloride Group plc, and following Emerson Electric’s takeover of Chloride, he held a senior position in Emerson. Prior to that he held a number of senior positions in Smith Group plc.
QUALIFICATIONSBSc (Hons) in Mechanical Engineering.
Fellow of the Institute of Chartered Accountants in England and Wales (FCA).
WILL GARDINERGroup Chief Executive Officer
RESPONSIBILITIES AND SKILLSWill is responsible for all aspects of stewardship of Drax Group and its business, including developing an appropriate business strategy for Board approval and securing its timely and effective implementation. He is also responsible for shareholder engagement. He provides leadership to the executive team and takes responsibility for the important external relationships with customers, suppliers, regulatory agencies and government bodies.
APPOINTMENT TO THE BOARDNovember 2015.
COMMITTEE MEMBERSHIPExecutive Committee.
CURRENT EXTERNAL APPOINTMENTSQardio plc – Non-executive director.
Groton School, Groton MA – Member of the Board and Treasurer.
Institute for War & Peace Reporting – Member of the UK Board.
Energy UK – Board member.
PREVIOUS ROLESWill was previously CFO at CSR plc, divisional FD at BSkyB, CFO at Easynet Group plc and he held a number of senior roles at JP Morgan in the investment banking division.
QUALIFICATIONSBA Harvard College in Russian and Soviet Studies.
MA John Hopkins School of Advanced International Studies in International Relations.
PHILIP COX CBEChairman
RESPONSIBILITIES AND SKILLSPhilip’s responsibilities include Board composition and succession and Board governance. He has significant Board experience in both executive and non-executive capacities, and extensive experience in the power sector.
APPOINTMENT TO THE BOARDJanuary 2015.
APPOINTMENT AS CHAIRMANApril 2015.
COMMITTEE MEMBERSHIPNomination (Chair) and Remuneration Committees.
CURRENT EXTERNAL APPOINTMENTSKier Group plc – Chairman.
PREVIOUS ROLESDuring his executive career, Philip was the CFO and then CEO of International Power plc. Prior to this he held a senior operational position at Invensys plc and was CFO at Siebe plc, having qualified as a chartered accountant.
As a non-executive he was previously the Senior Independent Director at Wm Morrison Supermarkets plc, Chairman of Global Power Generation and a member of the boards of Talen Energy Corporation, PPL, Meggitt plc and Wincanton plc.
QUALIFICATIONSMA in Geography.
Fellow of the Institute of Chartered Accountants in England and Wales (FCA).
THE BOARD PROVIDES CONSTRUCTIVE CHALLENGE AND STRONG LEADERSHIP TO THE GROUP. IT STRIVES TO LEAD BY EXAMPLE THROUGH FIRST-CLASS
MANAGEMENT AND BEST PRACTICE GOVERNANCE.
Drax Group plc Annual report and accounts 2017 59Drax Group plc Annual report and accounts 2017 59
Male 88%Female 12%
Non-executive 50%Executive 38%Chairman 12%
45–49 12%50–54 12%55–59 38%65–70 38%
0–3 38%4–6 12%7–9 38%10–12 12%
NICOLA HODSON Independent non-executive director(appointed 12 January 2018)
RESPONSIBILITIES AND SKILLSNicola has extensive sales and IT experience gained in senior roles at organisations including Ofgem, Microsoft, Siemens, CSC, Ernst & Young and British Nuclear Fuels.
APPOINTMENT TO THE BOARD12 January 2018.
COMMITTEE MEMBERSHIPAudit, Remuneration and Nomination Committees.
CURRENT EXTERNAL APPOINTMENTSMicrosoft – Vice-President, Global Sales and Marketing, Field Transformation.
TechUK – Board member.
PREVIOUS ROLESIn an executive capacity, Nicola was Chief Operating Officer, General Manager Public Sector at Microsoft and at Siemens she was General Manager FS, PS, Manufacturing, Sales and Marketing Director.
Nicola was previously a non-executive director at Ofgem, a Board member at the UK Council for Child Internet Safety and at the Child Exploitation and Online Protection group.
QUALIFICATIONSMBA in Business Administration, Management and Operations.
PhD in Materials Engineering.
BSc in Chemistry and Materials Science.
DAVID LINDSELLSenior Independent non-executive director
RESPONSIBILITIES AND SKILLSDavid’s recent and relevant experience in the areas of finance and audit are a significant asset to the Board in his role as Chairman of the Audit Committee.
APPOINTMENT TO THE BOARDDecember 2008.
COMMITTEE MEMBERSHIPAudit (Chairman), Nomination and Remuneration Committees.
CURRENT EXTERNAL APPOINTMENTSCancer Research UK – Trustee and Chairman of the Audit Committee.
University of the Arts, London – Deputy Chairman of Governors.
PREVIOUS ROLESDuring his executive career, David was a Partner at Ernst & Young LLP and was Deputy Chair of the Financial Reporting Review Panel.
He was a non-executive director and Chairman of the Audit and Risk Committee at Premier Oil plc and a non-executive director of HellermannTyton Group PLC.
QUALIFICATIONSMA in History.
Fellow of the Institute of Chartered Accountants in England and Wales (FCA).
DAVID NUSSBAUMIndependent non-executive director
RESPONSIBILITIES AND SKILLSDavid’s experience in international development and environmental matters, as well as his financial and governance background, is a valuable addition to the Board and its committees, and helps the successful delivery of the Group’s sustainability agenda.
APPOINTMENT TO THE BOARDAugust 2017.
COMMITTEE MEMBERSHIPAudit, Nomination and Remuneration Committees.
CURRENT EXTERNAL APPOINTMENTSThe Elders – Chief Executive.
International Integrated Reporting Council – Deputy Chair.
PREVIOUS ROLESDuring his executive career, David was the Chief Executive of World Wide Fund for Nature UK, Chief Executive of Transparency International UK, Finance Director and Deputy Chief Executive of Oxfam and Finance Director of Field Group plc. In a non-executive capacity, David was Vice-Chairman of Shared Interest Society, Chairman of Traidcraft plc and a non-executive director of Low Carbon Accelerator Limited.
QUALIFICATIONSMA in Theology.
MTh in Theology.
MSc in Finance.
Member of the Institute of Chartered Accountants of Scotland (CA).
TONY THORNEIndependent non-executive director
RESPONSIBILITIES AND SKILLSTony’s experience of operating in different geographical territories is of great value to the Board as the Group’s operations develop.
APPOINTMENT TO THE BOARDJune 2010.
COMMITTEE MEMBERSHIPAudit, Nomination and Remuneration (Chairman) Committees.
CURRENT EXTERNAL APPOINTMENTSNone.
PREVIOUS ROLESDuring his executive career, Tony was Chief Executive of DS Smith plc and President of SCA Packaging Limited. He worked throughout the world in senior management roles for Shell International.
He was the non-executive Chairman of South East Coast Ambulance Service.
QUALIFICATIONSBSc (Hons) in Agricultural Economics.
Gender diversityAs at 31 December 2017
CompositionAs at 31 December 2017
Age profile in yearsAs at 31 December 2017
Tenure in yearsAs at 31 December 2017
Note:Dorothy Thompson is included in the above analysis as she was a director throughout 2017, stepping down on 31 December 2017.Nicola Hodson is not included in the above analysis as she was appointed as a director on 12 January 2018.
Strategic reportG
overnanceFinancial statem
entsShareholder inform
ation

Drax Group plc Annual report and accounts 201760 Drax Group plc Annual report and accounts 201760
Female 33%Male 67%
Business Unit operations 50%Group operations 33%Chair 17%
BOARD OF DIRECTORS CONTINUED
EXECUTIVE COMMITTEE MEMBERS Gender diversityAs at 31 December 2017
CompositionAs at 31 December 2017
WILL GARDINERGroup Chief Executive Officer
Will was appointed to the Executive Committee on joining the Group in November 2015.
His biography appears on page 58.
ANDY KOSSChief Executive, Drax Power
Andy was appointed to the current Executive Committee in March 2015, having joined the Group in June 2005.
His biography appears on page 58.
DOROTHY THOMPSON(Former) Group Chief Executive Officer
Dorothy was Chairman of the Executive Committee before stepping down as a director on 31 December 2017.
CLARE HARBORDDirector of Corporate Affairs
RESPONSIBILITIES AND SKILLSClare leads the Group’s internal and external communications, brand, public affairs and corporate social responsibility strategies. She also has responsibility for sustainability, regulation, policy and compliance.
APPOINTMENT TO THE EXECUTIVE COMMITTEEMay 2017, having joined the Group at the same time.
COMMITTEE MEMBERSHIPExecutive Committee.
CURRENT EXTERNAL APPOINTMENTSNone.
PREVIOUS ROLESClare was Director of Corporate Affairs at Heathrow Airport, Director of Communications at the Ministry of Justice and Head of UK Communications at E.ON.
QUALIFICATIONSBA (Hons) in Archaeology.
JONATHAN KINIChief Executive, Drax Retail
RESPONSIBILITIES AND SKILLSJonathan oversees business operations and champions Drax’s retail strategy across Haven Power and Opus Energy. He is responsible for pursuing increased business growth through small to medium-sized enterprise (SME) sectors, and for sustaining and growing Drax Retail’s industrial and commercial (I&C) customer base.
APPOINTMENT TO THE EXECUTIVE COMMITTEESeptember 2016, having joined the Group in January 2016.
COMMITTEE MEMBERSHIPExecutive Committee, Haven Power and Opus Energy management boards (Chairman).
CURRENT EXTERNAL APPOINTMENTSNone.
PREVIOUS ROLESJonathan was Director of SME at Vodafone and held various commercial roles at Virgin Media.
QUALIFICATIONSBsc (Hons) in Mathematics.
MBA.
ACMA (CIMA qualified).
PETE MADDENChief Executive, Drax Biomass
RESPONSIBILITIES AND SKILLSPete guides the business strategy and oversees day-to-day operations at three pellet plants and a port facility in the South Eastern United States, ensuring that they are environmentally sound, safe and professionally managed.
APPOINTMENT TO THE EXECUTIVE COMMITTEEJanuary 2016, having joined the Group in March 2015.
COMMITTEE MEMBERSHIPExecutive Committee and Drax Biomass Inc.
CURRENT EXTERNAL APPOINTMENTSUniversity of Georgia Center for Forest Business – Advisory Board Member.
US Industrial Pellet Association – Board member.
Forest History Society – Board member.
PREVIOUS ROLESPete held a number of senior roles at Plum Creek (USA) including: Vice President, Renewable Energy and Supply Chain; Vice President, Operations Support; and Director, Regional Marketing, Operations, Resource Management, Materials Management and Corporation Planning.
QUALIFICATIONSBA Marlboro College.
MS (Forestry).
MBA.
Note:Dorothy Thompson is included in the above analysis as she was a member of the Executive Committee throughout 2017, stepping down on 31 December 2017

Drax Group plc Annual report and accounts 2017 61Drax Group plc Annual report and accounts 2017 61
THE EXECUTIVE COMMITTEE
ROLE OF THE EXECUTIVE COMMITTEEThe Executive Committee focuses on the Group’s strategy, financial structure, planning and performance, succession planning, organisational development and Group wide policies.
HOW THE EXECUTIVE COMMITTEE FUNCTIONSThe Executive Committee receives regular reports on performance against the Business Plan and periodic business reports from each of the business units. Papers are distributed in advance of meetings, to brief members on matters to be discussed. Members also receive presentations on various business issues by senior managers within the business units.
HIGHLIGHTS OF 2017 ACTIVITIES
HEALTH & SAFETY Regular updates to ensure attention and commitment across the Group
CAPITAL RESTRUCTURE AND NEW DIVIDEND POLICY To ensure financial resources provide significant strategic flexibility
ON-BOARDING OF OPUS ENERGY Regular updates on the continued integration process and progression of smart metering roll out
BIOMASS SUPPLY CHAIN Consideration of how to increase supply, particularly self-supply
GENERATION Development of four standalone OCGT plants and coal to gas repowering
NEW PEOPLE STRATEGYDevelopment of our people to ensure full optimisation of the diversity of skills of the workforce
GROUP INFORMATION SERVICES STRATEGYIncluding cyber security, data protection and GDPR readiness, and better use of technology
GROUP COMMUNICATIONS STRATEGYEffective internal communication and improved external stakeholder engagement
COMPOSITIONWith the exception of Clare Harbord, Director of Corporate Affairs (who was appointed a member in May 2017), all of those listed below served on the Executive Committee throughout the year and all continued to be members at the date of this report except for Dorothy Thompson, who ceased to be a member on 31 December 2017. Biographical details of the Executive Committee members appear on page 58 (executive directors) and page 60 (senior management). Matthew Rivers, who was Director of Corporate Affairs, ceased to be a member of the Executive Committee in May 2017.
EXECUTIVE COMMITTEE COMPOSITION AS AT 31 DECEMBER 2017Executive Committee membersWill GardinerClare HarbordJonathan Kini Andy Koss Pete MaddenDorothy Thompson
The Group Company Secretary is Secretary to the Executive Committee.
EXECUTIVE COMMITTEE DIVERSITY AT 31 DECEMBER 2017Executive Committee diversityDuring 2017 there were four male members and two female members of the Executive Committee.
Number of meetingsThe Executive Committee has 11 scheduled meetings each calendar year and arranges additional meetings if needed.
EXECUTIVE COMMITTEE ATTENDANCE 2017The table below shows the number of meetings and attendance at them by members of the Executive Committee during 2017.
Date appointed as a member of the
current Executive Committee
Maximum possible
meetings(1)
Number of meeting
attended
% of meetings attended
Dorothy Thompson CBE(2)
1 March 2015
11 8 73%
Will Gardiner 16 November 2015
11 11 100%
Clare Harbord(3) 9 May 2017
7 7 100%
Jonathan Kini 1 September 2016
11 11 100%
Andy Koss 1 March 2015
11 11 100%
Pete Madden 1 January 2016
11 11 100%
Matthew Rivers(3) 1 March 2015
5 5 100%
Notes:(1) The maximum number of meetings that each individual was entitled to, and had the opportunity
to attend(2) Dorothy Thompson ceased to be Group Chief Executive Officer and a member of the Executive
Committee on 31 December 2017 and as part of the transition process for the new Chairman of the Executive Committee she stepped away from meetings in the run up to that date
(3) Matthew Rivers ceased to be a member of the Committee and Clare Harbord was appointed to the Committee in May 2017
Strategic reportG
overnanceFinancial statem
entsShareholder inform
ation

Drax Group plc Annual report and accounts 201762 Drax Group plc Annual report and accounts 201762
LETTER FROM THE CHAIRMAN
“THE MANAGEMENT OF OUR BUSINESS AND
CONTROL OF OUR ACTIVITIES IS FOUNDED ON GOOD
GOVERNANCE” PHILIP COX CBE
CHAIRMAN
OUR HEAT VALUES
HONEST We say what we mean and do what we say, we’re genuine and true to our word
ENERGISEDWe’re passionate about our daily activities and have the drive to turn ideas into action
ACHIEVINGWe’re focused on our goals and determined to succeed. We work hard to deliver innovative solutions to help us do things better, for the benefit of the Group
TOGETHER We work collaboratively with our colleagues, customers and stakeholders with a friendly approach and recognise the value each of us brings to achieving our Group vision

Drax Group plc Annual report and accounts 2017 63Drax Group plc Annual report and accounts 2017 63
Dear shareholders
Drax places considerable emphasis on governance and in this section of the Annual Report, we describe governance at Drax, the principal activities of the Board and its committees and how we have complied with the principles of the UK Corporate Governance Code (the Code).
MY ROLE AS CHAIRMANThe division of responsibilities between the roles of Chairman and Group Chief Executive Officer (CEO) is well established, as shown below. As Chairman I am responsible for leading the Board and ensuring it operates effectively. The Group CEO is responsible for running the business and the implementation of the strategy and policies adopted by the Board.
Chairman’s responsibilities – Chairing and managing the business of the Board. – Together with the Group CEO, ensuring the Board carries out a full
and robust review of the strategy of the business and ensuring effective implementation of the strategy by the executive management team.
– Engagement with shareholders and other key stakeholders. – In conjunction with the Nomination Committee, taking
responsibility for the composition of the Board. – Overseeing the annual Board evaluation and acting on its results. – Ensuring effective contribution and constructive challenge from
non-executive directors and a productive relationship between executive and non-executive directors.
– Ensuring Board agendas cover all material aspects of the business. – Overseeing a thorough process for succession management, both
for the Board and for the executive management. – Ensuring Group policies, including policies for health and safety,
trading, environment, diversity, ethical, social and sustainability standards are fit for purpose and appropriately implemented.
– Oversight of risk management and internal control systems.
Group CEO’s responsibilities – Communicating the culture, vision and values of the Group. – The development and implementation of the Group’s strategy. – The day-to-day management of the Group. – Leading the Executive Committee. – Managing relationships with key stakeholders. – With the Group Chief Financial Officer, communicating the
Group’s financial performance to shareholders.
KEY AREAS OF FOCUSIn 2017 significant progress was made with the strategy.
The on-boarding of Opus Energy following its acquisition in February continues to go well and the acquisition of LaSalle Bioenergy in the US Gulf region significantly increased our biomass pellet capacity.
In developing longer-term options for growth we continue to explore the option of coal-to-gas repowering at Drax Power Station and construction of new OCGT plants, in order to provide new sources of flexible generation backed up by long-term contracts.
The health and safety of all employees and contractors is of paramount importance and safety remains at the centre of our operational philosophy. We have performed well in this regard and we continue to work to improve our performance across the Group.
SUCCESSION PLANNING AND DIVERSITYWe recognise that in order to maintain an effective Board it is essential to plan for the future and to ensure the right individuals are appointed to the Board from a diverse pool of talent. We are strong advocates of diversity and we consider the Board to be diverse in terms of the background, skills and experience each individual brings to the Board.
All appointments will continue to be based on merit. More detail on the work of the Nomination Committee can be found in the Nomination Committee Report on pages 71–75.
We recognise the importance of diversity within the Group and we have reported on Board and Executive Committee composition and diversity earlier on pages 59 and 60. Currently around 25% of Drax’s senior management are women and we recently appointed a new female non-executive director, Nicola Hodson. Drax’s business and demographics are changing and we are committed to improving gender diversity across the Group.
BOARD DIRECTORATE CHANGESExecutive directorate changesIn September 2017, we announced that Will Gardiner would succeed Dorothy Thompson as Group CEO in January 2018. Will was previously the Group Chief Financial Officer (CFO) and his appointment is a natural progression after two years working alongside Dorothy.
A process to appoint a permanent Group CFO is underway and in the meantime Den Jones has been appointed as Interim Group CFO.
Non-executive directorate changesThe Board membership has been refreshed and diversified with the appointments of David Nussbaum and Nicola Hodson as non-executive directors in August 2017 and January 2018 respectively. David’s knowledge of sustainability will support our good work in this area and Nicola’s experience in technology, sales and marketing, business transformation and energy will provide real value as Drax delivers on its strategy.
BOARD AND COMMITTEE EVALUATIONDuring 2017 we conducted an internal evaluation of the Board and its committees. The evaluation process involved the completion of questionnaires and interviews by the Chairman. More information on the process and the key action areas can be found on page 72 in the report of the Nomination Committee.
During 2018 and beyond I am confident that we have the right team in place to meet the challenges and opportunities of the future.
PHILIP COX CBECHAIRMAN
Strategic reportG
overnanceFinancial statem
entsShareholder inform
ation

Drax Group plc Annual report and accounts 201764 Drax Group plc Annual report and accounts 201764
AUDIT COMMITTEEOverseas financial reporting, internal
controls and risk management systems, whistleblowing and fraud,
internal and external audit effectiveness
Page 76
REMUNERATION COMMITTEEOversees the Group’s approach to remuneration and sets key
performance measures
Page 81
NOMINATION COMMITTEEMakes recommendations on the
structure, size and composition of the Board and succession planning for
the directors and senior executives
Page 71
CORPORATE GOVERNANCE REPORT
DRAX GROUP PLC BOARDResponsible for overseeing the Group’s strategy and risk appetite,
monitoring performance and ensuring that the necessary controls and resources are in place to deliver the Group’s plans
EXECUTIVE COMMITTEEFocuses on the Group’s strategy, financial structure, planning and performance,
succession planning and organisational development
All Board committees are authorised to obtain legal or other professional advice as necessary, to secure the attendance of external advisers at their meetings and to seek information required from any employee of the Group in order to perform their duties.
ROLE OF THE BOARDThe Board determines: the Group’s strategy; the Group’s appetite for risk; the risk management policies; the annual plan and key performance indicators; acquisitions and disposals and other transactions outside delegated limits; material changes to accounting policies or practices; significant financial decisions; capital structure and dividend policy; shareholder communications; prosecution, defence or settlement of material litigation; Group remuneration policy; the terms of reference of Board committees; and the Board structure, composition and succession.
TERMS OF REFERENCEThe Board has a schedule of matters reserved for its decisions and formal terms of reference for its committees. These are reviewed annually and are available to view on the Group’s website at www.drax.com.
Matters which are not specifically reserved to the Board and its committees under their terms of reference, or to shareholders in General Meeting, are delegated to the Executive Committee or otherwise delegated in accordance with a schedule of delegated authorities approved by the Board.
HOW THE BOARD FUNCTIONSAt each meeting the Board receives a report from the Group Chief Executive Officer in relation to key business and operational matters and from the Group Chief Financial Officer updating the Board on the financial performance of the Group. It also receives regular reports on performance against the Business Plan, safety, operational, financial and periodic business reports from senior management across the Group. Of equal importance, the Board also receives industry, regulatory and topical updates from external experts and advisers, as well as internal specialists, from time to time. Papers are distributed in advance of Board and committee meetings, to brief directors.
The core activities of the Board and its committees are documented and planned on an annual basis and a list of matters arising from each meeting is maintained and followed up at subsequent meetings.
Directors may, in the furtherance of their duties, seek independent professional advice at the Company’s expense. During 2017, no director sought independent professional advice.
The Company Secretary advises the Board on all governance matters, ensuring good information flows within the Board, its committees, the Executive Committee and senior management. He ensures that Board processes are complied with and is also responsible for compliance with the Listing, Prospectus,
OUR LEADERSHIP ENSURES CLEAR DECISION MAKING WITHIN THE SAFEGUARDS OF A SOUND
GOVERNANCE FRAMEWORK

Drax Group plc Annual report and accounts 2017 65Drax Group plc Annual report and accounts 2017 65
Disclosure Guidance and Transparency Rules and the Companies Act. There is collaboration with other parties to ensure wider corporate compliance.
The Company’s Articles of Association (the Articles), give the directors power to authorise conflicts of interest. The Board has an effective procedure to identify potential conflicts of interest, consider them for authorisation and record them. The Articles also allow the Board to exercise voting rights in Group companies without restriction (for example to appoint a director to a Group company).
The Company has appropriate insurance cover in place in respect of legal action against directors of the Company and its subsidiaries.The Nomination Committee report contains details of the selection, appointment, review and re-election of directors, as well as the Board performance review and directors’ development. The Articles are available on the Group’s website at www.drax.com.
SCHEDULE OF MATTERS RESERVED FOR THE BOARDAt least once a year the Board reviews the nature and scale of matters reserved for its decision and these include:
– Dividend policy. – Company strategy, business objectives and annual budgets. – Succession planning for the Board and senior management. – Approval of significant funding decisions. – Review and approval of corporate transactions.
Other day-to-day operational decisions are delegated by the Board to the Executive Committee, subject to formal delegated authority limits.
GOVERNANCE OVERVIEWThe Board recognises that there is always scope for improvement to make us better able to achieve our aspirations and deal with the challenges we face. To address this, we continually work to ensure that our governance structures and processes are aligned with the requirements of the business and that good governance is embedded by management throughout the Group. At Drax we believe that governance is not only about following the rules, but also about doing things in the right way. We believe that it is important for the Board to establish and lead a strong moral and ethical culture within the organisation. The values of the Group are expressed as; honest, energised, achieving and together, or “HEAT” as it is known within the business. These values have been established for several years, and are embedded throughout the organisation in the way our people go about their everyday business.
THE BOARD IN 2017The composition of the Board in 2017 was as follows: the Chairman, three executive directors and four independent non-executive directors.
Position Role
Philip Cox CBE Chairman
Tim Cobbold Independent non-executive director
Will Gardiner Group Chief Financial Officer(1)
Andy Koss Chief Executive, Drax Power
David Lindsell Senior Independent non-executive director
David Nussbaum(2) Independent non-executive director
Dorothy Thompson CBE(3) Group Chief Executive Officer
Tony Thorne Independent non-executive director
The Group Company Secretary is the Secretary to the Board.
Notes:(1) Will Gardiner was the Group Chief Financial Officer until 31 December 2017. On 1 January 2018
he was appointed as Group Chief Executive Officer.(2) David Nussbaum was appointed as a director on 1 August 2017. (3) Dorothy Thompson ceased to be a director on 31 December 2017.
BOARD ROLESAt 31 December 2017, the Board comprised of the Chairman, three executive directors and four independent non-executive directors. The key responsibilities of members of the Board are as follows:
Position Role
Chairman Responsible for leading and managing the Board, its effectiveness, and governance. Ensures Board members are aware of and understand the views and objectives of major shareholders and other key stakeholders. Helps set the tone from the top in terms of the purpose, goal, vision and values for the whole organisation.
Group Chief Executive Officer
Responsible for the day-to-day management of the business, developing the Group’s strategic direction for consideration and approval by the Board and implementing the agreed strategy.
Group Chief Financial Officer
Supports the Chief Executive in developing and implementing strategy, and in relation to the financial and operational performance of the Group.
Chief Executive, Drax Power
Responsible for leading and developing the operation of the Power Generation business.
IndependentNon-executive directors
Responsible for bringing sound judgement and objectivity to the Board’s deliberations and decision-making process. Constructively challenge and support the executive directors. Monitor the delivery of the strategy within the risk and control framework set by the Board.
Senior IndependentDirector
Acts as a sounding board for the Chairman and a trusted intermediary for other directors. Available to discuss any concerns with shareholders that cannot be resolved through the normal channels of communication with the Chairman or the executive directors.
Strategic reportG
overnanceFinancial statem
entsShareholder inform
ation

Drax Group plc Annual report and accounts 201766 Drax Group plc Annual report and accounts 201766
CORPORATE GOVERNANCE REPORT CONTINUED
2017 CALENDAR OF BOARD ACTIVITIES – HIGHLIGHTS
JANUARY 2017 – Approval of changes to management and operational structure.
– Review of the challenges presented by the EU sustainability regulations comprised in the Renewable Energy Directive.
– Top ten risk analysis and in particular the completion of actions necessary to satisfactorily address the two Health & Safety Executive Improvement Notices relating to levels of dust detected in areas of the generation plant and the Principal Risks for the Annual report and accounts
– Budgets for 2017 approved. – Investment plan for the B2B Energy Supply business approved.
JULY 2017 – 2017 interim report and accounts approved.
– 2017 interim dividend approved.
AUGUST 2017 – Appointment of David Nussbaum as a new non-executive director.
SEPTEMBER 2017 – Update on data protection in readiness for the implementation of the GDPR.
– Review of the B2B Energy Supply business’ strategy.
– Succession to the role of Group CEO.
OCTOBER 2017 – Sale of Billington Bioenergy approved as company no longer in line with Group strategy.
– Group strategy review and approval of gas repowering project.
– New people strategy approved.
DECEMBER 2017 – Update on OCGT projects. – Outage contract approved.
FEBRUARY 2017 – Approval of the completion of the Opus Energy acquisition.
– Statement on prevention of slavery and human trafficking in Drax Group plc was presented to the meeting and discussed.
– Preliminary results approved. – 2016 Annual report and accounts approved.
– 2016 final dividend approved. – 2016 Corporate Scorecard approved by the Remuneration Committee.
MARCH 2017 – Group refinancing approved.
APRIL 2017 – Business plan and budgets for Opus Energy approved.
– Performance and Deferred Share Plans approved.
MAY 2017 – New dividend policy approved.
JUNE 2017 – Review of the operations of the Power Generation business, including consideration of OCGT projects.
– Discussed an update on Group risks.
NOVEMBER 2017 – Announcement of the appointment of Nicola Hodson as a new non-executive director in January 2018.
– Review of draft Business Plan for 2018.
JAN2017
FEB2017
MAR2017
APR2017
MAY2017
JUN2017
JUL2017
AUG2017
SEP2017
OCT2017
NOV2017
DEC2017
Drax Group plc Annual report and accounts 2017 67Drax Group plc Annual report and accounts 2017 67
BOARD ATTENDANCE 2017The table below shows the number of meetings held and the directors’ attendance during 2017.
DirectorDate appointed as a director
and member of the Board
Maximum possible
meetings(1)
No. of meetings attended
% ofmeetingsattended
Tim Cobbold 27 September 2010 8 7 88%
Philip Cox 1 January 2015 8 8 100%
Will Gardiner 16 November 2015 8 8 100%
Andy Koss 1 January 2016 8 8 100%
David Lindsell 1 December 2008 8 8 100%
David Nussbaum 1 August 2017 3 3 100%
Dorothy Thompson(2) 20 October 2005 8 8 100%
Tony Thorne 29 June 2010 8 8 100%
Notes:(1) The maximum number of meetings that each individual was entitled to, and had the opportunity to attend(2) Dorothy Thompson ceased to be a director on 31 December 2017
BOARD DIVERSITYIn 2017, there were seven male directors and one female director on the Board.
NUMBER OF MEETINGS HELDThe Board and its committees have regular scheduled meetings and hold additional meetings as required. Directors are expected, where possible, to attend all Board meetings, relevant committee meetings, the Annual General Meeting (AGM) and any General Meetings.
– The Board has eight scheduled meetings each year. – In 2017, an additional three meetings were held by telephone to address matters requiring formal decisions and a Shareholder General Meeting was held to approve the Opus Energy acquisition.
– In addition, the Board meets at least annually to consider strategy.
TIME COMMITMENTUnder the terms of his letter of appointment, the Chairman is expected to commit between 50 and 70 full days a year to this role.Under the non-executive directors’ letters of appointment, each is expected to commit 12 to 15 full days a year. That includes attendance at Board meetings, the AGM, one annual Board strategy day and at least one site visit per year. In addition, they are expected to devote appropriate preparation time ahead of each meeting. The time commitment expected in respect of their membership of the Audit, Nomination and Remuneration Committees is an additional three to four full days a year in each case. However, in practice considerably more time is devoted, particularly by the Chairmen of the Board committees. Non-executive directors also spend time with management, to maintain their knowledge of the developing business and to understand the operational challenges being faced.
COMPLIANCE WITH THE UK CORPORATE GOVERNANCE CODEIt is the Board’s view that throughout the period commencing on 1 January 2017, the Company has complied in full with the principles of the Code issued in April 2016. The Code can be found on the Financial Reporting Council website at www.frc.org.uk.
With the exception of David Nussbaum who was appointed as a director on 1 August 2017, and Nicola Hodson who was appointed as a director on 12 January 2018, all of the directors listed on pages 58–59 served throughout the year. Each of those listed, except for Dorothy Thompson, remained directors as at the date of the approval of this report. Biographical details of the directors appear on pages 58–59.
DIRECTORS’ INTERESTS, INDEMNITY ARRANGEMENTS AND OTHER SIGNIFICANT AGREEMENTSOther than a service contract between the executive directors and a Group company, or as noted in the Remuneration Committee report, no director had a material interest at any time during the year in any significant contract with the Company or any of its subsidiary undertakings.
There are no agreements between the Group and its directors providing for compensation for loss of office or employment because of a takeover bid.
The Board has reviewed the independence of each non-executive director. None of the non-executive directors who served during the year had any material business or other relationship with the Group, and there were no other matters that were likely to affect their independence of character and judgement. The Board recognises that in view of the characteristics of independence set out in the UK Corporate Governance Code, length of service is an important factor when considering the independence of non-executive directors and that directors having served for longer than nine years may not be considered independent. In November, David Lindsell was re-appointed for a fourth time until the 2019 AGM. The Board considers that David Lindsell’s experienced oversight in ensuring careful financial stewardship as Chairman of the Audit Committee is crucial during a period of change in the implementation of the new strategy and the development of the new Group CEO into that role, and the establishment of a new Group CFO. The established Chairman of the Audit Committee continuing in post during this period of transition and assisting in the recruitment and induction of a new Audit Committee Chairman in 2018 will be an integral part of ongoing good financial governance. The Board is satisfied that David Lindsell’s judgement has remained wholly independent and that he has consistently displayed all of the behaviours expected of our independent non-executive directors. The Board therefore considers all of the non-executive directors to be independent.
Strategic reportG
overnanceFinancial statem
entsShareholder inform
ation

Drax Group plc Annual report and accounts 201768 Drax Group plc Annual report and accounts 201768
DIRECTORS’ DEVELOPMENTThe Board is committed to the development of all employees and directors and has reviewed, and will continue to review, each director’s development requirements and make appropriate arrangements to address them. For example, as part of his ongoing development, Will Gardiner worked with an executive coach during 2017. In addition to regular coaching sessions, where his coach reviewed priorities and challenges with him, his coach also prepared 360 degree feedback to support more in-depth coaching.
The non-executive directors visit operational sites both in the UK and the US. In 2017 a delegation of the Board visited operational and administrative sites in the US, and over a three-day period carried out
visits to Drax Biomass operations and reviewed the wider sustainability programme and activities. Periodically, the non-executive directors also meet with senior management to be briefed on the Group’s business and specific Board training is arranged covering key relevant topics. For example, in September the Board held its meeting at one of the Opus Energy offices in Northampton where the Board received presentations on the operation of the retail business by members of the senior management team. The directors were then taken through various customer scenarios to illustrate the customer experience.
These programmes are reviewed regularly during the year.
STRATEGY IN PROGRESS
Succession planning, development and inductionIn September 2017 we announced that after 12 successful years as Group Chief Executive Officer, Dorothy Thompson would be leaving the Group at the end of the year and that Will Gardiner would be appointed as Group Chief Executive Officer with effect from 1 January 2018.
The Nomination Committee has a well-established and robust succession planning process in place and it regularly identifies and monitors potential suitable internal candidates for senior roles. The Chairman of the Nomination Committee led the process to appoint a new Group Chief Executive Officer and had a number of discussions with the Nomination Committee to scope out the best approach to take and the requirements for the role. The Committee enlisted the help of a professional external executive recruitment agency, Russell Reynolds Associates. Aside from assisting with the recruitment, Russell Reynolds has no connection with the Group.
A timetable was adopted for the process and regular Committee discussions and updates were held throughout. From a detailed understanding of our requirements and specification of the role, a list was compiled of potential external candidates and an assessment of both the external and internal candidates was carried out using the same criteria to ensure consistency. A shortlist was then drawn up and the shortlisted candidates met the Committee.
The Nomination Committee unanimously agreed that Will Gardiner had the blend of skills and experience to be our next Group Chief Executive Officer. Will joined Drax as Group Chief Financial Officer and a member of the Group Board in November 2015. He has been a key architect of our new strategy and is a focused, innovative and engaging leader.
CORPORATE GOVERNANCE REPORT CONTINUED

Drax Group plc Annual report and accounts 2017 69Drax Group plc Annual report and accounts 2017 69
SHAREHOLDER ENGAGEMENTDrax believes engagement with shareholders is very important. The Group has a comprehensive investor relations programme, maintaining regular dialogue with shareholders and investors.
Throughout the year, meetings are held for the Group Chief Executive Officer, Group Chief Financial Officer and Head of Investor Relations to meet with institutional shareholders and sell-side analysts. These meetings allow us to discuss the Company’s business model, strategy and marketplace, as well as update on performance. Meetings are arranged proactively and on request and often include site visits, which provide shareholders with valuable insight into the Group’s operations.
Digital communication is increasingly used as a means of keeping in touch with shareholders. During 2017 we introduced a new Investor Relations section to the Drax Group website. In addition to providing information on RNS announcements, Company publications and a
calendar of events, the website provides content relating to the markets in which the Group operates.
The Board receives reports of meetings with institutional shareholders together with regular market updates which give the directors a clear understanding of shareholders’ views and concerns. The Chairman is also available to meet with shareholders, independently of the executive directors, as required.
The Annual report and accounts is sent to all shareholders who wish to receive a copy. It is also available in the investor section of the Company’s website www.drax.com.
Communication with all our stakeholders is an essential part of our business. Details of communications with stakeholders are contained in the Stakeholder engagement section of this report beginning on page 42, with further details of our communications with investors set out below.
SHAREHOLDER ENGAGEMENT IS A PRIORITY FOR THE GROUP TO ENSURE GOOD UNDERSTANDING
OF OUR INVESTMENT CASE
THE DRAX INVESTOR RELATIONS PROGRAMME INCLUDES THE FOLLOWING ACTIVITIES
1. SHAREHOLDER MEETINGSThrough the year the management team are available to meet shareholders and, in addition, following the full and half year results, a structured programme of meetings is arranged to allow management to meet with shareholders and prospective investors.
Why it is importantThe Group considers that it is important that the owners of the business have access to management in order to understand the business, its operation and strategy.
FrequencyOngoing.
2. THE ANNUAL GENERAL MEETINGThe AGM is attended by the full Board of directors. Details of the resolutions to be proposed at the AGM on 25 April 2018 can be found in the Notice of AGM which is available at www.drax.com, and will be dispatched to shareholders who have requested a hard copy of the documentation from the Company. All shareholders are invited to vote on the resolutions and the results are made available after the meeting and published on our website.
Why it is importantThe AGM provides all shareholders with a forum to put questions to the Board of Directors, and to vote on important issues.
FrequencyOnce a year.
3. SELL-SIDE ANALYST ENGAGEMENTThe executive directors and members of the senior management team engage with sell-side analysts formally at the full and half year results presentations. In addition, the Group CFO and Head of Investor Relations are in regular dialogue with analysts as they publish research on the Company.
Why it is importantSell-side analysts write research on the Company, which is sent to their clients, existing and prospective investors. It is therefore important that analysts have up-to-date and accurate information on the business and its strategy in order to present an informed view to the equity market.
FrequencyPeriodically.
4. CAPITAL MARKETS DAY EVENTSA Capital Markets Day was held in June and included management presentations. The executive directors were present, as well as members of the senior management team.
Why it is importantCapital Markets Days allow the Group to provide the capital markets with insight on strategy as well as the different aspects of the business and expand on its plans to create shareholder value.
FrequencyPeriodically.
Strategic reportG
overnanceFinancial statem
entsShareholder inform
ation

Drax Group plc Annual report and accounts 201770 Drax Group plc Annual report and accounts 201770
Communications with shareholders are given a high priority and the Chairman is keen to ensure that he maintains an open relationship with the Company’s major shareholders and communicates directly with them and offers them the opportunity to meet any other directors. This enables the Board to understand their views on the Group and its governance. The Company has implemented the provisions of the Companies Act 2006 regarding electronic communication with its shareholders, in order to give shareholders more choice and flexibility in how they receive information from the Company. The Group’s website www.drax.com contains a wide range of information on the Group, including a dedicated Investors section and all information reported to the market via a regulatory information service also appears as soon as practicable on the website.
Financial results are communicated to the market twice a year and at the preliminary and interim results, a presentation is given to sell-side analysts, which is made available to the public through a webcast on the Group’s website www.drax.com. The Board also reviews and discusses the investor feedback from post-results investor meetings conducted by the Group Chief Executive and the Chief Financial Officer. The Group engages Makinson Cowell, part of the KPMG Group, to advise and assist with communications with shareholders and regularly discusses matters with its brokers, JP Morgan.
This year the Chair of the Remuneration Committee, Tony Thorne, also consulted with shareholders on the proposed changes to the current remuneration policy.
2017 Calendar of investor events
February General Meeting (Opus Energy acquisition)
2016 year-end results released
UK investor roadshows
March Dialogue with shareholders on AGM remuneration resolutions and on 2016 Directors’ Remuneration report
April Annual General Meeting
June Capital markets event for investors and analysts
July 2017 interim results released
UK investor roadshows
December Trading update
Communication with shareholders and shareholder representative bodies on proposed changes to the Company’s remuneration policy
The Company’s private registered shareholders hold, in aggregate, approximately 0.65% of the issued share capital. The Board is as interested in their views as it is in the views of institutional and corporate shareholders. All shareholders are free to put questions to the Board at the AGM. Questions asked in person at the AGM will receive a verbal response whenever possible. Otherwise, a written response will be provided as soon as practicable after the AGM. Questions asked at other times will normally receive a written response. Shareholders attending the AGM will have an opportunity to meet informally with the directors immediately after the meeting.
The Annual report and accounts is available to shareholders at least 20 working days before the AGM. Registered shareholders receive a Form of Proxy which allows them to vote for or against, or to abstain, on each resolution. Particulars of aggregate proxies lodged are announced to the London Stock Exchange and appear on the Group’s website as soon as practicable after the conclusion of the AGM.
OTHER STAKEHOLDER ENGAGEMENTWe communicate with our employees through various channels such as open forums and the employee newsletter. We seek employee feedback through our All Ideas Matter (AIM) initiative and we regularly carry out a full employee engagement survey with Towers Watson.
We strive to have a positive impact on local communities and work hard to ensure we understand the potential impacts of our business now, and in the future. We regularly meet with local people, as well as with community and local authority representatives, to make sure that people’s voices are heard. We work closely with a number of trade and industry associations, particularly those active in energy, renewable energy, timber and forestry sectors, and our Corporate Affairs team engages with regulators and policy makers to ensure our business understands and contributes to the evolving regulatory agenda. Sustainability remains at the heart of our business and as we grow this will be a continued focus to enable us to achieve a positive economic, social and environmental impact.
The feedback from all of these activities is available to the Board through the Executive Committee, ensuring that the interests of all stakeholders are considered, when relevant, in decision making. This is supportive of the Board’s duty to promote the success of the Company as set out in Section 172 of the Companies Act 2006. (For further detail and information on stakeholder engagement and communication please refer to pages 42–45.)
CORPORATE GOVERNANCE REPORT CONTINUED
,,
Drax Group plc Annual report and accounts 2017 71Drax Group plc Annual report and accounts 2017 71
NOMINATION COMMITTEE REPORT
NOMINATION COMMITTEE ACTIVITIES IN 2017
– Appointment of David Nussbaum as a non-executive director
– Appointment of the Group Chief Executive Officer
– Appointment of an Interim Group Chief Financial Officer
– Appointment of Nicola Hodson as a non-executive director
– Considered the effectiveness and performance of the Board and its committees
– Review of management development and succession planning
ROLE OF THE COMMITTEEThe Committee’s principal responsibilities are to: – keep under review the Board’s structure,
size and composition (including requisite skills, diversity, knowledge and experience it requires);
– conduct the search and selection process for new directors, taking advice from independent search consultants as appropriate; and
– ensure a rigorous succession planning process for the directors and other senior managers, including the identification of candidates from both within and outside the Group.
TERMS OF REFERENCEThe Committee’s terms of reference are reviewed annually by the Committee and then by the Board. The terms of reference are available on the Group’s website at www.drax.com.
“THE COMMITTEE’S ROLE IS TO ENSURE THE RIGHT LEADERSHIP IS IN PLACE TO STEER THE COMPANY”PHILIP COX CBECHAIRMAN
ATTENDANCE IN 2017
Committee member
Date appointed a member
Maximumpossible
meetings
No. of meetings attended
% of meetings attended
Tim Cobbold 27 September 2010 4 4 100%
Philip Cox 22 April 2015 4 4 100%
David Lindsell 1 December 2008 4 4 100%
David Nussbaum 1 August 2017 1 1 100%
Tony Thorne 29 June 2010 4 4 100%
COMMITTEE MEMBERSTim CobboldDavid LindsellDavid NussbaumTony ThorneNicola Hodson (appointed 12 January 2018)
ATTENDING BY INVITATIONGroup Chief Executive Officer Head of Corporate HR
NUMBER OF MEETINGS HELD IN 2017
4The Group Company Secretary is Secretary to the Committee.
Strategic reportG
overnanceFinancial statem
entsShareholder inform
ation
Drax Group plc Annual report and accounts 201772 Drax Group plc Annual report and accounts 201772
NOMINATION COMMITTEE REPORT CONTINUED
The Chairman of the Committee reports on the Committee’s proceedings to the following Board meeting.
The Committee has had a busy year as following Dorothy Thompson’s decision to stand down as Group Chief Executive Officer (CEO). it led the process of the search for a replacement. Will Gardiner, formerly Group Chief Financial Officer (CFO) was appointed as the new Group CEO, effective 1 January 2018 with Den Jones appointed as Interim Group CFO until the process for appointing a permanent Group CFO has been completed.
During the year an additional non-executive director, David Nussbaum, was appointed and the announcement of another non-executive director, Nicola Hodson, to be appointed in January 2018, was made.
DIRECTORATE CHANGESThe past year has been a significant year for the Board with the announcement in September 2017 that Will Gardiner, Group CFO was to succeed Dorothy Thompson as Group CEO with effect from 1 January 2018 following Dorothy Thompson’s decision to step down after 12 years as Group CEO.
Will’s appointment is a natural progression after two years working alongside Dorothy developing the new strategy. The Board is progressing the process to appoint a permanent Group CFO as soon as practicable, but in the meantime Den Jones was appointed on 1 November 2017 as Interim Group CFO. Den is highly experienced, having previously been the CFO at Johnson Matthey and BG Group.
On behalf of the Board I would like to thank Dorothy for her enormous contribution to Drax. She has led the transformation of the business during her tenure and leaves the Group in a strong position with a clear strategy that lays the foundations for further success in a changing energy sector.
I am pleased to welcome two new non-executive directors to the Board, David Nussbaum and Nicola Hodson. David, who was appointed on 1 August 2017, has a strong background in sustainability, environmental, ethical and social responsibility, and Nicola, who was appointed on 12 January 2018, has significant experience in the technology, business transformation, IT, sales and marketing and energy sectors. I am confident that with their breadth of experience and expertise, they will be valuable additions to the Board.
NON-EXECUTIVE DIRECTORSIt is the Board’s policy that each non-executive director will be appointed for a term of three years which, subject to the Board being satisfied as to the director’s performance and commitment, and a resolution to re-elect at the appropriate AGM, may be renewed by mutual agreement. The Board will not normally extend the aggregate period of service of any independent non-executive director beyond nine years, and any proposal made to extend a non-executive director’s aggregate period of office beyond six years is subject to rigorous review. All directors are subject to annual re-election at our Annual General Meeting.
BOARD AND COMMITTEE EVALUATIONThe Board continually strives to improve its effectiveness and recognises that the performance evaluation process represents an annual opportunity to enhance overall Board effectiveness. In 2016 the Board conducted an externally facilitated Board evaluation which resulted in some important recommendations for improving the Board’s effectiveness which have subsequently been implemented, including inviting advisers and external experts to selectively attend Board meetings to share their perspective on the business and the markets in which we operate. In 2017 the Board received presentations from external consultants on: energy, marketing and branding, and from the Company’s brokers. In addition, presentations from Group senior management were received on a wide range of issues such as safety, operational integrity, risk analysis, IT and cyber security, people development, innovation and development. There has also been some restructuring of how the Board conducts its meetings in order to increase the effectiveness of meetings, by the introduction of pre-meetings for the Chairman and non-executive directors before the Board meeting.
This year, in view of the externally facilitated evaluation carried out in 2016, it was agreed that an internal Board performance evaluation would be most beneficial to the Company. The Chairman and the Company Secretary discussed how best to facilitate this and it was decided that the Company Secretary should prepare a questionnaire for this purpose.
The questionnaire was approved by the Chairman and was subsequently completed by all directors to evaluate the performance of the Board, each of its committees and individual Board members. Following completion of the questionnaires, the Chairman held a series of one-to-one meetings with each of the directors in order to discuss the outcomes of the evaluation.

Drax Group plc Annual report and accounts 2017 73Drax Group plc Annual report and accounts 2017 73
The main points arising from the 2017 performance evaluation include the following:
Key strengths
– Board meetings are conducted in a way that ensures open and meaningful participation. Non-executive directors are given full transparency and are actively included on all matters. The Board also has regular engagement with management levels below the executive, through presentations and visits to all business units.
– The Board is very aware of the risk of political and regulatory changes. There is strong engagement with policy makers. The executives keep the non-executives well informed of political and regulatory developments, and key milestones.
– The Board has an appropriate variety of skills and experience which is aligned to the strategy.
– The Board is very effective in managing change within the business. The organisation has managed a significant scale change over the last few years which has gone well.
– The duties and responsibilities of the Board and its committees have been clearly defined and are carried out well.
– The ethics and corporate responsibility processes are highly effective.
Principal areas of focus for 2018
– Improving diversity, as it was recognised that additional focus is needed to further widen the composition of the Board.
– The Board has developed a clear and coherent strategy. The focus is now on the successful implementation of this strategy.
– Risk – increased discussion on risk and the Board’s appetite for risk.
– More focus on assessing the non-financial, qualitative and quantitative measures when assessing company performance.
– Further examination of new technologies in the energy sector, and continued focus on cyber security risk.
– Implementation of the new employee performance and appraisal process to drive forward talent development.
SUCCESSION PLANNING AND DIVERSITYMaintaining and improving the effectiveness of the Group’s succession planning process is key to the success of the business in the future. Selecting and supporting the right individuals are essential in leading the delivery of the new strategy. We will be assisted in this by the implementation of the new people strategy which will help to create opportunities for talented individuals to develop and to lead the Group in the future.
Diversity is one aspect of the succession planning process and includes: gender, age, race, religion, background and experience. The Board is committed to expanding the diversity of the workforce across the Group, including its top management. This ongoing commitment is reflected in the recent appointments of David Nussbaum and Nicola Hodson to the Board.
SKILLS AND KNOWLEDGE OF THE BOARDA key responsibility of the Committee is to ensure that the Board maintains a balance of skills, knowledge and experience appropriate to the operation of the business and required to deliver the strategy. As in past years, the Nomination Committee has reviewed the composition of the Board and as part of this review the Committee considered whether the:
– Board contains the right mix of skills, experience and diversity; – Board has an appropriate balance of executive directors and
non-executive directors; and – non-executive directors are able to commit sufficient time to the
Company in order to discharge their responsibilities effectively.
Following the review, the Committee was satisfied that the Board continues to have an appropriate mix of skills and experience to operate effectively. All the directors have many years of experience, all gained from a broad range of businesses and they collectively bring a range of expertise and knowledge of different business sectors to Board deliberations, which encourage constructive, challenging and innovative discussions.
In addition to the specific focus for 2017, there is an annual programme of work which is designed to fulfil its principal duties. This programme reviews:
– Re-election and appointment of directors The Committee met on 15 February 2018, following the completion of the 2017 Board evaluation and performance review process, (described above) and determined that all of the directors who are the subject of annual re-election will retire at the forthcoming AGM and, being eligible, offer themselves for re-election. The Board evaluation and performance review concluded that the directors offering themselves for re-election continue to demonstrate commitment to their particular role and to perform effectively.
– Size, structure and composition of the Board At its meeting in February 2017, the Chairman provided the Committee with an update in the search for and recruitment of two additional non-executive director roles. The Committee concluded that the Board, constituted with three executive directors, five independent non-executive directors and a Chairman who was independent on appointment, was appropriate for the Company .
– Membership of Board committees It is the Board’s policy to invite all independent non-executive directors to join the Audit, Nomination and Remuneration committees. The Committee reviewed this policy, and also the composition of the Board committees. It was noted that the committees remained compliant with the provisions of the Code and thus no changes to membership of the committees were recommended.
Strategic reportG
overnanceFinancial statem
entsShareholder inform
ation

Drax Group plc Annual report and accounts 201774 Drax Group plc Annual report and accounts 201774
– Succession planning The Committee reviews the succession plan at least annually. The Group has a well-established and robust succession planning process, which covers all Executive Committee members and their direct reports, as well as other individuals within the Group who have been identified as having longer-term potential for senior roles. In the Committee’s opinion, the plan is well prepared and appropriate for the size of the Group’s business and management structure, and there is a range of strong candidates for most senior roles. Any potential gaps are the subject of both internal development plans and/or selected external recruitment.
– Appointment of new Group CEO The Committee led the process for the search of a new Group CEO to replace Dorothy Thompson. The Committee engaged an external recruitment agency, Russell Reynolds, to assist in the search. Russell Reynolds does not have any other connection with the Company. A suitable list of external candidates was drawn up and an assessment of both the external and internal candidates was carried out. A shortlist of candidates then met the Committee and it was decided to appoint Will Gardiner.
– Appointment of two new non-executive directors The Committee continued its search to broaden non-executive strength and diversify the Board’s skills and experience base, leading to the appointments of David Nussbaum in August 2017 and Nicola Hodson in January 2018. External recruitment agencies, Acre and Heidrick & Struggles, were used to assist in the recruitment process for David Nussbaum and Nicola Hodson respectively. Aside from assisting with recruitment, Acre and Heidrick & Struggles have no other connection with the Company.
– Board diversity In addition to the regular programme of work and the evaluation mentioned below, the Committee recognises the diversity challenge and considers the question of Board diversity in its widest sense, and gender diversity in particular. The Committee identified a number of additional capabilities in its non-executive director search specification which were used in the successful recruitment of David Nussbaum, who has a background in the charity and sustainability sectors, and Nicola Hodson who has extensive experience in technology, business transformation, IT sales and marketing, and energy. The Committee recognises the strength that can be achieved through diversity in the Group’s management and this is an important consideration in the recruitment, promotion and training of the senior management team. The Company participated in the Hampton Alexander review into increasing the number of women in senior positions in FTSE 350 companies. The Board fully supports the findings of this review. Looking forward we have further opportunities to address our diversity agenda. We have already started in 2018 the search to recruit a non-executive director who will shadow David Lindsell as Chair of the Audit Committee, and in 2019 the scheduled retirements of Tim Cobbold and Tony Thorne from the Board will provide further planned opportunities. To assist in this process the Board plans to only use executive search agencies which have signed up to the Hampton Alexander voluntary code of conduct on gender diversity. Further details of our commitment to diversity can be found on page 40.

Drax Group plc Annual report and accounts 2017 75Drax Group plc Annual report and accounts 2017 75
STRATEGY IN PROGRESS
Induction of David Nussbaum
All new directors receive a comprehensive and tailored induction programme including wider background briefings on the Group’s activities, meetings with key managers and visits to the Group’s operational sites. In August 2017 David Nussbaum joined the Board as an independent non-executive director, bringing with him valuable experience and expertise particularly in the charity and sustainability sectors. David’s induction programme included a visit to our US operations, and the Drax Power Station site in Selby which included a site tour and meetings with some of the
senior management team as well as the Group Company Secretary who provided an overview of the Board procedures and governance framework. David was provided with a comprehensive induction pack which contained a wide range of material including: Board papers and minutes of previous meetings; schedule of matters reserved for the Board; schedule of dates for Board and committee meetings; terms of reference for all Board committees; Group company structure chart and senior management structure chart.
RENEWAL AND RE-ELECTIONThe Company’s Articles provide that, unless otherwise determined by the Company, the Board must consist of at least two, and no more than 15 directors. The shareholders and the Board have the power to appoint any person who is willing to act as a director. If the Board appoints a director, that director must retire at the first AGM following their appointment. That director may, if they so wish, put themselves forward for re-election. Nicola Hodson and David Nussbaum were appointed by the Board subsequent to the 2017 AGM and therefore they will retire and offer themselves for re-election by shareholders at the forthcoming AGM.
The Articles provide that, one-third of directors shall retire by rotation each year and are eligible for re-election by shareholders at the AGM. In accordance with the Code, the Company will continue its practice to propose all directors for annual re-election. Accordingly, each of Tim Cobbold, Philip Cox, Will Gardiner, Andy Koss, David Lindsell and Tony Thorne will retire at the forthcoming AGM and, being eligible, offer themselves up for re-election.
Following the evaluation and review of the Board described above, I concluded that the directors offering themselves for re-election continue to demonstrate commitment, management and industry expertise in their particular role and continue to perform effectively. The re-election of each director is recommended by the Board. Details of the service contracts for the executive directors and letters of appointment for the non-executive directors are set out in a table on page 103.
The Company may however, remove a director by ordinary resolution before the expiration of the director’s period of office (without prejudice to any claim the director may have for breach of any service contract) and may appoint another person who is willing to act to be a director in their place. The replacement director is regarded as a director from the outgoing director’s date of last appointment/re-appointment.
The executive directors’ service contracts and non-executive directors’ letters of appointment are available for inspection by prior arrangement during normal business hours at the Company’s registered office. They will also be available for inspection at the venue of the AGM, prior to the meeting, details of which are contained in the Notice of Meeting.
During the year, the Chairman held meetings with the non-executive directors in the absence of the executive directors, and, separately, the Senior Independent Director held a meeting with the non-executive directors without the Chairman being present, as required by provision A.4.2 of the Code.
This report was reviewed and approved by the Nomination Committee on 26 February 2018.
PHILIP COX CBECHAIRMAN OF THE NOMINATION COMMITTEE
Strategic reportG
overnanceFinancial statem
entsShareholder inform
ation

Drax Group plc Annual report and accounts 201776 Drax Group plc Annual report and accounts 201776
AUDIT COMMITTEE REPORT
AUDIT COMMITTEE ACTIVITIES IN 2017The Audit Committee follows a programme of work designed to ensure that the Group has sound risk management processes, a robust system of internal control and delivers fair and balanced performance reporting.
The acquisition of Opus Energy, its risk management and internal control systems and its integration into the Group was a particular focus in 2017.
ROLE OF THE COMMITTEEThe Committee assists the Board to fulfil its oversight responsibilities. Its primary functions are to:
– monitor the integrity of the financial statements and other information provided to shareholders;
– review significant financial reporting issues and judgements contained in the financial statements;
– advise the Board on whether the Committee believes the annual report and accounts are fair, balanced and understandable;
– maintain an appropriate relationship with the Group’s external auditor and review the effectiveness and objectivity of the external audit process;
– review the systems of internal control and risk management;
– monitor and review the effectiveness of the internal audit function; and
– make recommendations to the Board (to put to shareholders for approval) regarding that appointment of the external auditor.
TERMS OF REFERENCEThe Committee’s terms of reference are reviewed annually by the Committee and then by the Board. The terms of reference are available on the Group’s website at www.drax.com.
“WITH THE INCREASED RANGE OF THE GROUP’S ACTIVITIES, THE COMMITTEE HAS FOCUSED ON THE EFFECTIVENESS OF THE EXTENDED RISK MANAGEMENT AND INTERNAL CONTROL SYSTEMS” DAVID LINDSELLCHAIRMAN
ATTENDANCE IN 2017
Committee member
Date appointed a member
Maximumpossible
meetings
No. of meetings attended
% of meetings attended
Tim Cobbold 27 September 2010 5 5 100%
David Nussbaum(1) 1 August 2017 1 1 100%
David Lindsell 1 December 2008 5 5 100%
Tony Thorne 29 June 2010 5 5 100%
Note:(1) David Nussbaum was appointed as a non-executive director with effect from 1 August 2017 and joined the Committee
from this date
COMMITTEE MEMBERSTim CobboldDavid NussbaumTony ThorneNicola Hodson (appointed 12 January 2018)
The Board is satisfied that the Committee’s membership has the recent and relevant financial experience required by the Code.
ATTENDING BY INVITATIONChairman of the Board, Group Chief Executive, Chief Financial Officer, Group Financial Controller, Group Finance Manager, Head of Group Risk and Internal Audit, External auditor (Deloitte).
NUMBER OF MEETINGS HELD IN 2017
5 The Group Company Secretary acts as Secretary to the Committee.
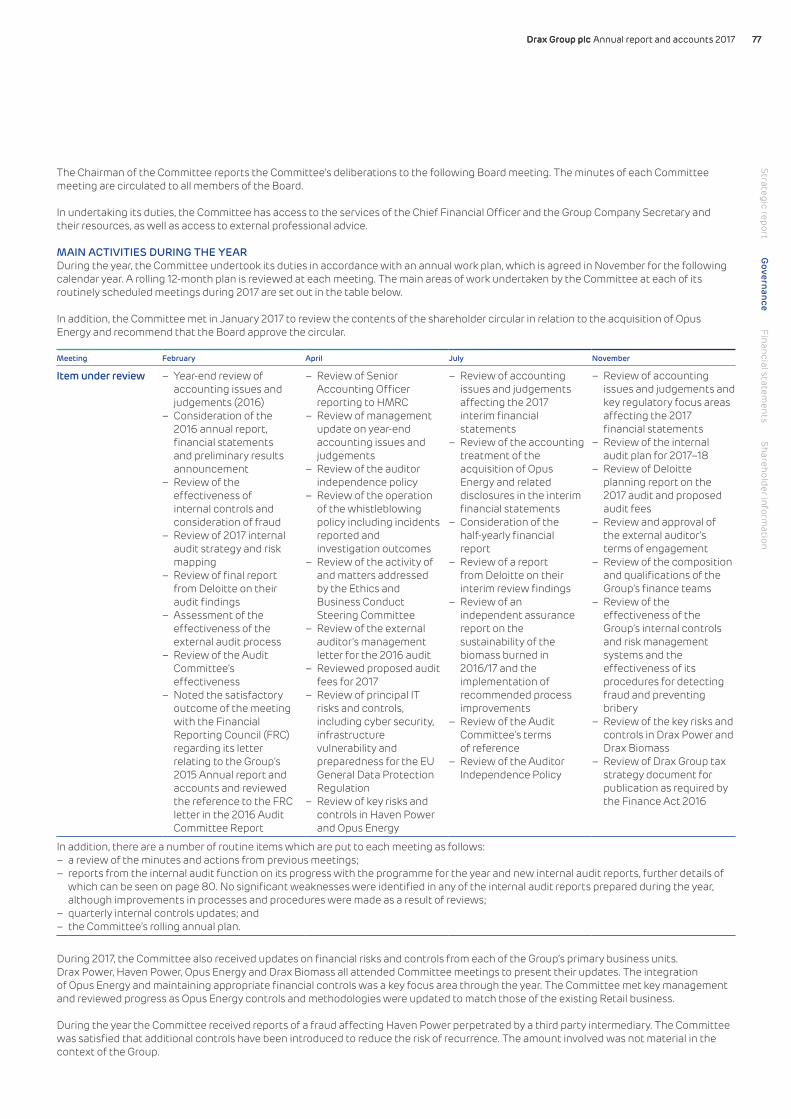
Drax Group plc Annual report and accounts 2017 77Drax Group plc Annual report and accounts 2017 77
The Chairman of the Committee reports the Committee’s deliberations to the following Board meeting. The minutes of each Committee meeting are circulated to all members of the Board.
In undertaking its duties, the Committee has access to the services of the Chief Financial Officer and the Group Company Secretary and their resources, as well as access to external professional advice.
MAIN ACTIVITIES DURING THE YEARDuring the year, the Committee undertook its duties in accordance with an annual work plan, which is agreed in November for the following calendar year. A rolling 12-month plan is reviewed at each meeting. The main areas of work undertaken by the Committee at each of its routinely scheduled meetings during 2017 are set out in the table below.
In addition, the Committee met in January 2017 to review the contents of the shareholder circular in relation to the acquisition of Opus Energy and recommend that the Board approve the circular.
Meeting February April July November
Item under review – Year-end review of accounting issues and judgements (2016)
– Consideration of the 2016 annual report, financial statements and preliminary results announcement
– Review of the effectiveness of internal controls and consideration of fraud
– Review of 2017 internal audit strategy and risk mapping
– Review of final report from Deloitte on their audit findings
– Assessment of the effectiveness of the external audit process
– Review of the Audit Committee’s effectiveness
– Noted the satisfactory outcome of the meeting with the Financial Reporting Council (FRC) regarding its letter relating to the Group’s 2015 Annual report and accounts and reviewed the reference to the FRC letter in the 2016 Audit Committee Report
– Review of Senior Accounting Officer reporting to HMRC
– Review of management update on year-end accounting issues and judgements
– Review of the auditor independence policy
– Review of the operation of the whistleblowing policy including incidents reported and investigation outcomes
– Review of the activity of and matters addressed by the Ethics and Business Conduct Steering Committee
– Review of the external auditor’s management letter for the 2016 audit
– Reviewed proposed audit fees for 2017
– Review of principal IT risks and controls, including cyber security, infrastructure vulnerability and preparedness for the EU General Data Protection Regulation
– Review of key risks and controls in Haven Power and Opus Energy
– Review of accounting issues and judgements affecting the 2017 interim financial statements
– Review of the accounting treatment of the acquisition of Opus Energy and related disclosures in the interim financial statements
– Consideration of the half-yearly financial report
– Review of a report from Deloitte on their interim review findings
– Review of an independent assurance report on the sustainability of the biomass burned in 2016/17 and the implementation of recommended process improvements
– Review of the Audit Committee’s terms of reference
– Review of the Auditor Independence Policy
– Review of accounting issues and judgements and key regulatory focus areas affecting the 2017 financial statements
– Review of the internal audit plan for 2017–18
– Review of Deloitte planning report on the 2017 audit and proposed audit fees
– Review and approval of the external auditor’s terms of engagement
– Review of the composition and qualifications of the Group’s finance teams
– Review of the effectiveness of the Group’s internal controls and risk management systems and the effectiveness of its procedures for detecting fraud and preventing bribery
– Review of the key risks and controls in Drax Power and Drax Biomass
– Review of Drax Group tax strategy document for publication as required by the Finance Act 2016
In addition, there are a number of routine items which are put to each meeting as follows: – a review of the minutes and actions from previous meetings; – reports from the internal audit function on its progress with the programme for the year and new internal audit reports, further details of which can be seen on page 80. No significant weaknesses were identified in any of the internal audit reports prepared during the year, although improvements in processes and procedures were made as a result of reviews;
– quarterly internal controls updates; and – the Committee’s rolling annual plan.
During 2017, the Committee also received updates on financial risks and controls from each of the Group’s primary business units. Drax Power, Haven Power, Opus Energy and Drax Biomass all attended Committee meetings to present their updates. The integration of Opus Energy and maintaining appropriate financial controls was a key focus area through the year. The Committee met key management and reviewed progress as Opus Energy controls and methodologies were updated to match those of the existing Retail business.
During the year the Committee received reports of a fraud affecting Haven Power perpetrated by a third party intermediary. The Committee was satisfied that additional controls have been introduced to reduce the risk of recurrence. The amount involved was not material in the context of the Group.
Strategic reportG
overnanceFinancial statem
entsShareholder inform
ation

Drax Group plc Annual report and accounts 201778 Drax Group plc Annual report and accounts 201778
AUDIT COMMITTEE REPORT CONTINUED
The Committee met twice in the absence of management with each of the external auditor (February and July) and Head of Group Risk and Internal Audit (April and November). No matters of concern were drawn to the Committee’s attention at any of these meetings. The Committee’s understanding with both the external and internal auditor is that, if they should at any time become aware of any matters giving them material concern, they will immediately draw it to the Committee’s attention via the Chairman of the Committee.
REVIEWING THE 2017 ANNUAL REPORT AND ACCOUNTSBetween the year-end date and the date of the approval of the annual report and accounts, the Committee met in February 2018 principally to review the draft 2017 Annual report and accounts and the external auditor’s findings. The Committee reviewed papers prepared by management on accounting issues and judgements affecting the accounts and a report from Deloitte LLP setting out their audit findings.
The Committee also reviewed the underlying process, internal controls, forecasts and relevant assumptions made in preparing the Viability Statement, disclosed on page 50. Having challenged the assumptions made in this process and considered the appropriateness of the three-year period of assessment, the Committee concluded that the process supporting the Viability Statement was robust.
Explanations of the critical accounting judgements, estimates and assumptions are set out in detail throughout the notes to the consolidated financial statements, with a summary on pages 119 and 120 which also includes an explanation of the two non-IFRS measures of performance used by the Group. The Committee reviewed these aspects of the financial statements, paying particular attention to those issues that involve the most subjective and complex judgements, namely impairment of fixed assets, valuation of derivative financial instruments and business combinations, which are discussed below. In previous years, ROC valuations were among such aspects. However, following several years in which the net realised value of ROCs, including value recovered through the ROC recycling fund, has not differed significantly from the expected realisable value at which they were stated in the balance sheet, the Committee no longer considers the valuation of ROCs to be subject to such a high level of subjectivity and complexity.
The existence and valuation of fuel inventories was also regarded as an area of significant risk in previous years, principally due to the need to derive year-end volumes of biomass on-site at Drax Power Station from data on the weight of inventory movements and thermal efficiency calculations, since it is not practicable to physically count the stocks at the year end. During 2017, management reviewed the IT systems which sit behind the weighing process, the data flows between them, and the accuracy of the calculations, all of which has provided greater assurance regarding the accuracy of the biomass inventory valuation. The Committee noted also that an internal audit review was carried out during the year of the processes and controls to manage biomass stocks held off-site and managed by third-party service providers, and that the review had concluded that the controls in place to measure and report biomass volumes were appropriate in design and effective in operation. Accordingly, the Committee does not regard biomass inventories as a significant issue in relation to the 2017 financial statements.
The significant issues in relation to the financial statements were as follows:
Matter Issue and key judgements Factors considered and conclusions reached
Carrying value of Power Generation fixed assets
In 2017 the market capitalisation of the Group remained materially below the carrying value of the Group’s net assets. In addition, the value of Sterling against both the Euro and US Dollar indicated a potentially material increase in the long-term costs of fuel for our generation business, which are predominantly priced in these currencies.
As a result, in accordance with the requirements of IFRS, management conducted an impairment review in respect of the Drax Power cash-generating unit (CGU). They did so by comparing the present value of the future cash flows of the CGU with the carrying value of its tangible and intangible assets.
The assumptions that underpin such calculations are, by their nature, dependent upon the application of judgement and are thus subject to uncertainty. In particular this is because observable market information is only available for a limited proportion of the remaining lives of the Group’s power generation assets.
Management presented an overview of the methodology and most critical assumptions to the Committee meeting in November 2017.
The Committee reviewed an updated report at its meeting in February 2018 that considered refinements in assumptions and key judgements up to the present time, as described in note 2.4.
It was noted that the cash flows that underpin the value in use calculation for the Drax Power CGU were derived from the Group’s five-year business plan, which was subject to review by the Board in January 2018. This review included challenge of the key assumptions, including commodity and currency forward curves, the expected useful life of the coal generating units (see note 3.1) and revenue sources after the expiry of the current Renewables Obligation certificate scheme in 2027.
After challenging management regarding these longer-term assumptions, the Committee concluded that a reasonable, supportable and consistent approach had been taken in preparing the review and that there was no current indication of impairment.

Drax Group plc Annual report and accounts 2017 79Drax Group plc Annual report and accounts 2017 79
Matter Issue and key judgements Factors considered and conclusions reached
Valuation of derivative financial instruments
The Group makes extensive use of derivative financial instruments in order to manage key risks facing the business and its balance sheet includes significant assets and liabilities arising from derivatives which are stated at their fair value. In particular, the asset values of forward foreign currency purchase contracts reduced substantially in the period following the recovery of Sterling against US Dollar.
Changes in the fair value of such instruments are recognised in the income statement or when the specific criteria for hedge accounting are met, in the hedge reserve.
The fair values for derivative financial instruments are determined using forward price curves and, where an instrument incorporates an element of optionality, an option pricing model.
The inputs to these calculations include assumptions regarding future transactions and market movements, as well as credit risk, and are therefore subjective.
The Committee reviewed the Group’s derivative position in February, July and November 2017 having regard in particular to the critical judgemental areas described in note 7.2 and considered the position as at 31 December 2017 at its meeting in February 2018.
At each meeting, management explained the trends in market prices that underpinned changes in the fair value of the derivative portfolio and highlighted any new types of derivative instrument for the Committee’s consideration.
The Committee concluded that the fair value calculations had been performed in a reasonable and consistent manner based on quoted market prices as explained in note 7.2 and that the system of controls in place was fit for purpose. Accordingly, it was concluded that the amounts included in the financial statements were appropriate.
Business combinations
During the year, the Group acquired Opus Energy Group Limited, a well-established energy retail business serving customers in the SME market. To account for the business combination the identifiable assets acquired and liabilities assumed are required to be measured at their acquisition-date fair values. This process can require estimation of the effects of uncertain events on those assets and liabilities. In the case of Opus Energy, as stated page 148, the fair value measurement of the existing customer contracts depends on a number of assumptions, and in particular requires estimates to be made of likely margins on current customer contracts, future contract renewal rates and future margins on renewed contracts.
The Committee reviewed management reports detailing the valuations and key judgements and estimates, noting that management had been assisted by independent valuation specialists in measuring the fair value of existing customer contracts. The Committee concluded that the assumptions used to value the contracts were appropriately supported and reasonable.
Unbilled B2B Energy Supply revenue
The acquisition of Opus Energy resulted in a significant increase in the amount of revenue from electricity and gas supplied to customers between the date of the last meter reading and the financial year end. The amount of this revenue is based on estimates in relation to the volume of energy consumed and the valuation of that consumption.
The Committee reviewed the process for and assumptions applied in determining the calculation of unbilled receivables, noting that historically, final settlements had been closely in line with the unbilled receivables recognised in the financial statements. The Committee concluded that the process and assumptions applied were appropriate and reasonable.
FAIR, BALANCED AND UNDERSTANDABLEAs a result of its review of the Annual report and accounts, underpinned by its discussions with operating and finance management regarding the strategic report, and with the Group finance team regarding the financial statements, the Audit Committee advised the Board that, in the Committee’s view, the Annual report and accounts, taken as a whole, is fair, balanced and understandable and provides the information necessary for shareholders to assess the company’s position and performance, business model and strategy.
REVIEW OF AUDIT COMMITTEE EFFECTIVENESS BY MEMBERSIn line with the FRC’s Guidance on Audit Committees, the Committee reviewed its own effectiveness and concluded that the composition of its membership, the manner in which it operates and the reviews that it undertakes throughout the year all contribute to the continued effective functioning of the Committee.
The Board performance evaluation questionnaire referred to on page 72 included questions on the effectiveness of the Audit Committee, in particular its effectiveness in monitoring the integrity of the Group’s financial statements, the Group’s internal controls and risk management systems, its arrangements and processes to ensure compliance with its ethical standards, and the effectiveness of the internal audit activities and the external audit process. The questionnaire also asked whether the Committee has sufficient expertise, time and access to key staff and information to enable it to discharge its monitoring and oversight role effectively. Based on responses to the questionnaire, the Committee, the members of which between them have extensive experience and expertise in business management, financial management, financial reporting and auditing, discharged its responsibilities effectively in 2017.
Strategic reportG
overnanceFinancial statem
entsShareholder inform
ation

Drax Group plc Annual report and accounts 201780 Drax Group plc Annual report and accounts 201780
AUDIT COMMITTEE REPORT CONTINUED
EXTERNAL AUDITOR EFFECTIVENESSThe Committee reviewed the effectiveness of the external auditor, Deloitte LLP, who have performed the role continuously since the Company’s listing in 2005 and were reappointed in 2017 following a tender process. The review of effectiveness incorporated feedback from management and key individuals across the Group, as well as the Committee’s own experience. The assessment considered the independence and objectivity of Deloitte, the robustness of the audit process, the quality of delivery of the audit plan, the quality of reporting on findings and recommendations to the Committee and management, and the experience and expertise of the audit team and the quality of service provided.
INDEPENDENCE OF THE EXTERNAL AUDITThe Group has an Auditor Independence Policy, the provisions of which include:
– seeking confirmation that the auditor is, in its professional judgement, independent of the Group, and obtaining from it an account of all relationships which may affect the firm’s independence and the objectivity of the audit partner and staff;
– a requirement to rotate the lead audit partner every five years. The current lead audit partner, James Leigh, has completed four years of his term;
– a policy governing the engagement of the auditor to conduct non-audit work, under which: • the auditor may not be engaged to provide certain categories of
work, including those where they may be required to audit their own work or make management decisions, or where the auditor would act in an advocacy role for the Group;
• there is a clear approval process for engaging the auditor to conduct other categories of non-audit work, subject to financial limits. Permitted non-audit services for which the fee exceeds £50,000 is required to be approved in advance by the Audit Committee;
• all engagements of the auditor to conduct non-audit work are reported to the next meeting of the Committee; and
• the balance between the fees paid to the external auditor for audit and non-audit work is monitored by the Committee.
The Policy can be found on the Company’s website at www.drax.com.
The Committee receives reports from the external auditor on its own processes and procedures, to ensure its independence and objectivity and to ensure compliance with the relevant standards.
Details of the amounts paid to the external auditor during the year for audit and other services are set out in note 2.3 to the consolidated financial statements on page 131.
No contractual obligations exist that restrict the Group’s choice of external auditor.
AUDITOR REAPPOINTMENTThe Group has complied with the provisions of The Statutory Audit Services for Large Companies Market Investigation (Mandatory Use of Competitive Tender Processes and Audit Committee Responsibilities) Order 2014.
The Group conducted a tender to appoint the external auditor during 2016 and the Board agreed to reappoint Deloitte LLP. Deloitte have now been the Group’s auditor for the past 12 years.
Having considered the effectiveness and independence of the external auditor as described above, the Audit Committee agreed to recommend to the Board that the a resolution to reappoint Deloitte LLP as the company’s external auditor should be put to shareholders at the AGM in April 2018.
INTERNAL AUDITThe Group operates a co-sourced model for its internal audit function.
Under this model, the internal team conducts core financial control reviews. Reviews of specialist technical areas are outsourced to firms with appropriate experience and qualifications.
The Committee receives reports at each meeting regarding the internal audit programme and reviews undertaken. Recommendations are made to management for control improvements as appropriate. Topics dealt with by internal audit reports reviewed by the Committee during 2017 included:
– ROC controls and verification – Fixed asset capitalisation – Financial risk management processes – Controls around the power trading strategy – Foreign currency risk management – Cyber security – Derivatives accounting – Off-site biomass stocks – Opus Energy commodity hedging
In addition, at the April and November meetings the Committee received reports detailing progress with implementing recommendations previously raised by internal audit. Following the most recent of these updates, in November 2017, the Committee was satisfied that management is taking appropriate steps to deal with the recommendations raised.
The Chairman of the Committee, independent of management, maintains regular and direct contact with both the internal and external auditor, allowing open dialogue and feedback. At it’s annual review, the Committee concluded that the internal audit function remains effective.
This report was reviewed and approved by the Audit Committee on 15 February 2018.
DAVID LINDSELLCHAIRMAN OF THE AUDIT COMMITTEE

Drax Group plc Annual report and accounts 2017 81Drax Group plc Annual report and accounts 2017 81Strategic report
Governance
Financial statements
Shareholder information
REMUNERATION COMMITTEE REPORT
REMUNERATION COMMITTEE ACTIVITIES IN 2017Considered and approved the:– Remuneration policy– New Long-Term Incentive Plan (LTIP)– Annual Report of the Committee
on remuneration for 2016– Remuneration of executive
directors and senior staff– Remuneration terms for the
outgoing Group CEO– Remuneration for the
incoming Group CEO – New performance appraisal
process for Group employees ROLE OF THE COMMITTEEThe Committee’s principal responsibilities are to: – recommend to the Board the
remuneration strategy and framework for the executive directors and members of the Executive Committee;
– determine, within that framework, the individual remuneration packages for the executive directors and members of the Executive Committee;
– approve the design of annual and long-term incentive arrangements for executive directors and members of the Executive Committee, including agreeing the annual targets and payments under such arrangements;
– determine and agree the general terms and conditions of service and the specific terms for any individual within the Committee’s remit, either on recruitment or on termination;
– determine the policy for, and scope of, executive pension arrangements; and
– oversee any major changes in employee benefit structures throughout the Group and review remuneration trends across the Group.
TERMS OF REFERENCEThe Committee’s terms of reference are reviewed regularly by the Committee and then by the Board. The terms of reference are available on the Group’s website at www.drax.com.
“OUR KEY FOCUS IS TO MAKE SURE THAT EXECUTIVE REMUNERATION IS ALIGNED WITH PERFORMANCE AND THE SUCCESSFUL DELIVERY OF THE GROUP STRATEGY” TONY THORNECHAIRMAN
ATTENDANCE IN 2017
Committee member
Date appointed a member
Maximumpossible
meetings
No. of meetings attended
% of meetings attended
Tim Cobbold 27 September 2010 6 4 67%
Philip Cox 22 April 2015 6 6 100%
David Lindsell 1 December 2008 6 6 100%
David Nussbaum 1 August 2017 1 1 100%
Tony Thorne 29 June 2010 6 6 100%
COMMITTEE MEMBERSTim Cobbold Philip Cox David Lindsell David NussbaumNicola Hodson (appointed on 12 January 2018)
ATTENDING BY INVITATIONGroup CEO Head of Corporate HR External remuneration advisers
NUMBER OF MEETINGS HELD IN 2017
6 The Group Company Secretary is Secretary to the Committee.
This Directors’ Remuneration Report has been prepared in accordance with Schedule 8 to the Large and Medium-sized Companies and Groups (Accounts and Reports) Regulations 2008, as amended (the Regulations) and the provisions of the Code.
Drax Group plc Annual report and accounts 201782 Drax Group plc Annual report and accounts 201782
REMUNERATION COMMITTEE REPORT CONTINUED
ANNUAL STATEMENT TO SHAREHOLDERS
Dear shareholdersThis report reviews the key matters considered by the Remuneration Committee in the past year and the future matters we expect to consider. Before reviewing the past year I want to highlight two proposed changes in the current remuneration policy that require your consideration.
We believe the changes to be incremental to the approved policy but we are required to submit the revised policy to a shareholder vote at the 2018 AGM. We hope that the revised policy will receive your support.
Technically the revised policy, if approved, would be valid for three years, until the AGM in 2021. However, we intend to keep to the timetable for the original policy. Therefore, we will make a full review of the revised policy in 2019, incorporating the results of this review into a new policy for shareholder consideration at the 2020 AGM.
CHANGES TO THE REMUNERATION POLICYAt the 2017 AGM, shareholders approved a new remuneration policy for the executive directors. A component of this policy, namely the operation of the annual bonus, applies both to executive directors and employees. As part of a wider project to align processes and raise efficiency, a decision has been taken as to how the bonus formula will apply to employees from the financial year ending 31 December 2018 onwards. The changes we are proposing comprise two amendments to the approved Remuneration Policy, which are designed to ensure a consistent approach to our bonus arrangements for executive directors and employees. These changes are set out in detail in the report but in summary they are:
(i) removal of the personal performance component of the bonus formula. In future, bonuses will be earned for the delivery of stretching corporate and divisional related financial, strategic and operational targets, as measured through the Corporate Scorecard; and
(ii) an increase in the level of Corporate Scorecard performance which must be attained for maximum bonus payout, thereby strengthening the link between corporate performance and incentive payouts.
The rigour in setting and scoring the Corporate Scorecard will not be changed. The Committee will retain the discretion to adjust the bonus if the Corporate Scorecard outcome is not reflective of corporate or an individual executive’s performance.
The proposed changes simplify the remuneration arrangements for the executive directors as well as aligning the approach to bonus for all employees. As set out further in the report, I believe that the removal of the personal performance component also addresses the concern raised by shareholders in feedback on our current policy about the continuing use of such a component in the determination of bonus.
We are not proposing changes to the 2017 Performance Share Plan. Therefore our incentive arrangements will be linked only to performance under the Corporate Scorecard and Total Shareholder Return from 2018.
The proposed changes substantially toughen the operation of bonus arrangements. The Committee recognises that they will most likely lead to lower bonuses but believes it right that the bonus outcome should be on demonstrable performance and that there is a consistent approach across all employees. I would add that the changes have the full support of the executive directors.
Full details on the changes and the policy are set out later in the report.
REVIEW OF 2017 2017 was the first year following the announcement of our new strategy. It was a year of change and challenge for the Group as we set about implementing this strategy. Management delivered a substantial uplifting of financial performance, with EBITDA of £229 million (2016: £140 million). This was principally due to high levels of renewable generation, but also from the growth of our B2B Energy Supply business. A new capital structure and dividend policy were concluded, which will see the Group pay a sustainable and growing dividend to shareholders.
In support of the strategy, the Group acquired Opus Energy (the leading challenger brand in the UK SME energy market). In-sourcing of this business has progressed well. The Group also acquired a third biomass pellet plant (LaSalle Bioenergy). This has been upgraded and at the end of the year was commissioning. In Power Generation, plans for a fourth biomass unit were progressed. Having received the necessary Government support the conversion will go ahead in 2018. The development of the options for rapid response gas generation at four sites around the UK was continued, with two sites ready for construction, subject to securing a capacity market agreement. The repowering project, being two combined cycle gas turbine plants plus battery storage, to be built on the Drax site, was scoped and taken into the planning process.
Operationally, performance was mixed. The ramp up of pellet output at Drax Biomass was down on plan but this reflected a slower start to the year, followed by a strong finish which augurs well for 2018. Power Generation continued to meet a significant amount of the UK’s renewable electricity and provided good support to the electricity system’s stability. However, plant availability was below plan, including the December unplanned outage which impacted the end of 2017 with the disruption continuing into 2018. The energy supply businesses performed well. Opus Energy met the planned EBITDA and had a high customer retention while Haven Power exceeded planned EBITDA and was well up on the prior year.
Management continued to make the case for biomass with the result that the Government, in early 2018, provided the necessary support to allow the conversion of a fourth unit. There was continued high attention to biomass sustainability. Feedback to the Board from various site visits and the results of third party audits gives confidence that sustainability is well embedded.

Drax Group plc Annual report and accounts 2017 83Drax Group plc Annual report and accounts 2017 83Strategic report
Governance
Financial statements
Shareholder information
The Group is committed to paying an externally competitive salary consistent with an employee’s role. In order to provide the basis for a consistent approach to setting salary across the Group, management carried out a Group-wide job grading and salary benchmarking exercise. The results will now be worked through. This exercise was in addition to the review of performance management that led to the changes in the bonus formula discussed above. In line with the Gender Pay Gap reporting requirements, details for the individual subsidiary companies in the UK will be submitted by the required deadline.
I hope you find the above statement helpful background to the following section on the Committee’s assessment of executive performance.
ANNUAL ASSESSMENT OF PERFORMANCE IN 2017 Please note that the assessment of performance for 2017 is made under the current policy. The proposed changes to the policy, as described above and in greater detail on page 87, would not come into effect until immediately after the 2018 AGM.
The Committee determines the remuneration of the executive directors and members of the Executive Committee against the strategic objectives and priorities of the company. Executive performance is therefore closely aligned to business performance with a high proportion of total remuneration delivered through variable pay designed to reward achievement of short and long-term strategic targets.
There is a detailed review of performance against our balanced scorecard measures on page 99. Components within the scorecard can be scored between 0 and 2.0. A score of 1 represents an on-target performance. For 2017 the Board assessed the overall performance at 0.84. The Committee, having reviewed the performance of the Group over the year, believes this outturn of the Corporate Scorecard is reflective of overall performance.
The score is applied both to the annual bonus and the Bonus Matching Plan (BMP). For the purposes of the annual bonus the overall score in any year is capped at 1.5. There is no cap on the annual score when applied to the BMP scorecard, but there is a cap of 1.5 on the average for the three years.
The Committee assessed the personal performance of each executive in driving the 2017 performance and delivering on the strategy. This assessment was both as regards their individual contribution and as a member of the executive team.
Based on performance, a corporate score of 0.84 out of 2 and personal score of 1.25 out of 1.5 was agreed by the Committee, resulting in annual bonuses of approximately 53% of maximum. The Committee believes that this bonus outcome fairly reflects executive directors’ performance.
LONG-TERM ASSESSMENT OF PERFORMANCEBMP awards made in 2015 were tested at the end of 2017 by reference to relative Total Shareholder Return (TSR) performance (50%) and on the three-year average of the Corporate Scorecard (50%). The Company’s TSR over the period was below the median of the comparator group, and the Committee therefore confirmed that none of the TSR element of the award would vest. The average Corporate Scorecard outcome over the same period was 0.97 out of 1.5, and as the vesting threshold is 1.0 there will be a nil vesting of the executive directors’ 2015 BMP performance awards.
The Committee decided not to exercise its discretion in determining the outcome for the possible vesting of performance awards.
SHAREHOLDER ENGAGEMENTThe current remuneration policy and the Annual Report on Remuneration for 2016 were approved by the majority of investors in 2017, but we are conscious that a significant minority of shares were voted against the policy and, particularly, the annual report. The Committee has discussed the shareholder feedback and noted areas of concern for future consideration. As outlined above, a concern we propose to address short term is the use of personal measures in the calculation of the executives’ annual bonuses. Our proposal to remove the personal element simplifies the remuneration arrangements and aligns the approach to the executives’ bonuses with that of our other employees.
We continue to monitor developments in executive remuneration. Notably this year, we have considered the likely revisions to the Corporate Governance Code. We are supportive of the changes. We recognise that these will widen the Remuneration Committee’s responsibility, both in overseeing pay arrangements across the Company and being seen to take into account the different stakeholder views when setting executive director remuneration.
APPLICATION OF POLICYDuring the year we applied the executive remuneration policy that was approved by shareholders in 2017. We have listened to shareholders and taken account of emerging “best practice” and this is reflected in the outcomes to the following areas addressed in the year:
(i) proposed an amendment to the policy for 2018 onwards to remove the personal element of the annual bonus, which will simplify the bonus arrangements, align pay and performance and ensure bonus arrangements for executive directors are consistent with those for the wider workforce;
(ii) used judgement as regards the treatment of the outgoing Group CEO, Dorothy Thompson, taking into account the remuneration policy, plan rules and her service agreement;
(iii) applied judgement on the remuneration package for the incoming Group CEO, balancing the need to remunerate competitively a high quality individual with the objective to stop the ratcheting up of remuneration; and
(iv) used judgement in determining the pay outcomes for the year in the context of performance achieved.
In addition to the above, the Committee reviewed and approved the proposed changes resulting from the extensive project in employee job grading and pay benchmarking carried out across the Group.

Drax Group plc Annual report and accounts 201784 Drax Group plc Annual report and accounts 201784
REMUNERATION COMMITTEE REPORT CONTINUED
CHANGES TO THE BOARDWe announced in September 2017 that Dorothy Thompson, Chief Executive Officer, had given notice of her intention to stand down as Group CEO. It was agreed that she would leave prior to the completion of her 12 month notice period on 31 December 2017. The Committee undertook a detailed review of the treatment of Dorothy’s remuneration, taking into account the circumstances of her leaving Drax and her performance up to the date of retirement which has continued to be strong. Further detail is provided on the individual elements of remuneration within the Annual Report on Remuneration but in summary:
– Dorothy was treated as a good leaver for the purpose of the outstanding share awards, with pro-rating from the date the award was granted to the date of leaving i.e. 31 December 2017;
– pro-rated performance related share awards will vest at the normal vesting date subject to performance conditions being met;
– pro-rated deferred share awards granted under the legacy BMP vested shortly after retirement in accordance with the provisions of the previous remuneration policy and the BMP scheme rules; and
– Dorothy is entitled to salary, pension and other benefits for the unworked period of notice from 1 January 2018 to 20 September 2018 and is also contractually eligible to be considered for a bonus for the unworked period of notice during which she was unable to earn a bonus, with the bonus amount to be determined in the usual way for all executives, early in 2019.
The Committee is confident that the decisions made in relation to Dorothy’s remuneration are fair to her and to the Company, taking into account her outstanding performance, the agreed termination date, the provisions of the remuneration policy applying to executive directors and her employment contract. We are conscious that the payment of bonus for the unworked notice period as provided for in Dorothy’s contract and our remuneration policy, is less common in the market and, as discussed with our major shareholders, we have committed not to include this for any newly appointed directors in future service contracts, including that of the new Group CEO.
Dorothy is succeeded by Will Gardiner, who has been our Group CFO since his appointment in November 2015. Will’s base salary was increased to £530,000 on his promotion. His other elements of pay will be in line with those for Dorothy. Will has been a member of the Board over the last two years and is a key architect of the Company strategy. We look forward to working with him in his new role over the coming years.
A process to appoint a new permanent Group CFO is underway and in the meantime Den Jones has been appointed as Interim Group CFO. Den is highly experienced, having previously been CFO at Johnson Matthey and BG Group.
BASE SALARIESThe salaries of Dorothy Thompson, Will Gardiner and Andy Koss were reviewed and increased by 2.5% with effect from 1 April 2017. This was in line with the average increase for the wider workforce.
SUMMARYI, and the other members of the Committee, are satisfied that the 2017 remuneration outcomes fairly reflect corporate and personal performance. We are confident that the changes to our policy to remove the personal element of the bonus formula and to increase the level of performance required for maximum bonus, provide a fair and consistent approach to remuneration across the Group and are in the shareholders’ interests.

Drax Group plc Annual report and accounts 2017 85Drax Group plc Annual report and accounts 2017 85
Total£1,236,000
71463117585
Total£1,595,000
7674756115574
2017
2016
Total£790,000
2029479397
Total£971,000
2447978390
2017
2016
Total£632,000
1923463316
Total£793,000
211938162310
2017
2016
Strategic reportG
overnanceFinancial statem
entsShareholder inform
ation
Corporate score result
0.84
The Remuneration Report is colour-coded as follows:
Base salary Pension Annual bonus LTIP Other benefits
DOROTHY THOMPSON (GROUP CEO) £000s
WILL GARDINER (GROUP CFO) £000s
ANDY KOSS (CHIEF EXECUTIVE, DRAX POWER) £000s
REMUNERATION AT A GLANCE
– Bonus is the total value of the annual bonus payable in respect of performance in the relevant year, including the cash bonus and the value of bonus deferred which is paid in shares after three years subject only to continued service.
– The performance conditions for the BMP Matching Awards awarded in March 2015 and due to vest in March 2018 were not met and therefore there was a nil vesting of BMP Matching Awards in 2018.
The resulting bonus outcomes as a percentage of base salary were:
BONUS EARNED FOR GROUP CEO BONUS EARNED FOR OTHER EXECUTIVE DIRECTORS
TARGETBONUS
75%CORPORATE
SCORE
0.84PERSONAL
SCORE
1.25X XTARGETBONUS
70%CORPORATE
SCORE
0.84PERSONAL
SCORE
1.25X X
Group CEO 79% of salary out of a maximum of 150% salary
Executive directors 74% of salary out of a maximum of 140% salary
BONUS EARNED FOR 2017
Below is a top line summary of the 2017 remuneration earned by each of our executive directors during 2017. This shows the alignment between our remuneration framework, the Company’s performance and how the payments to directors in 2017 link to this.
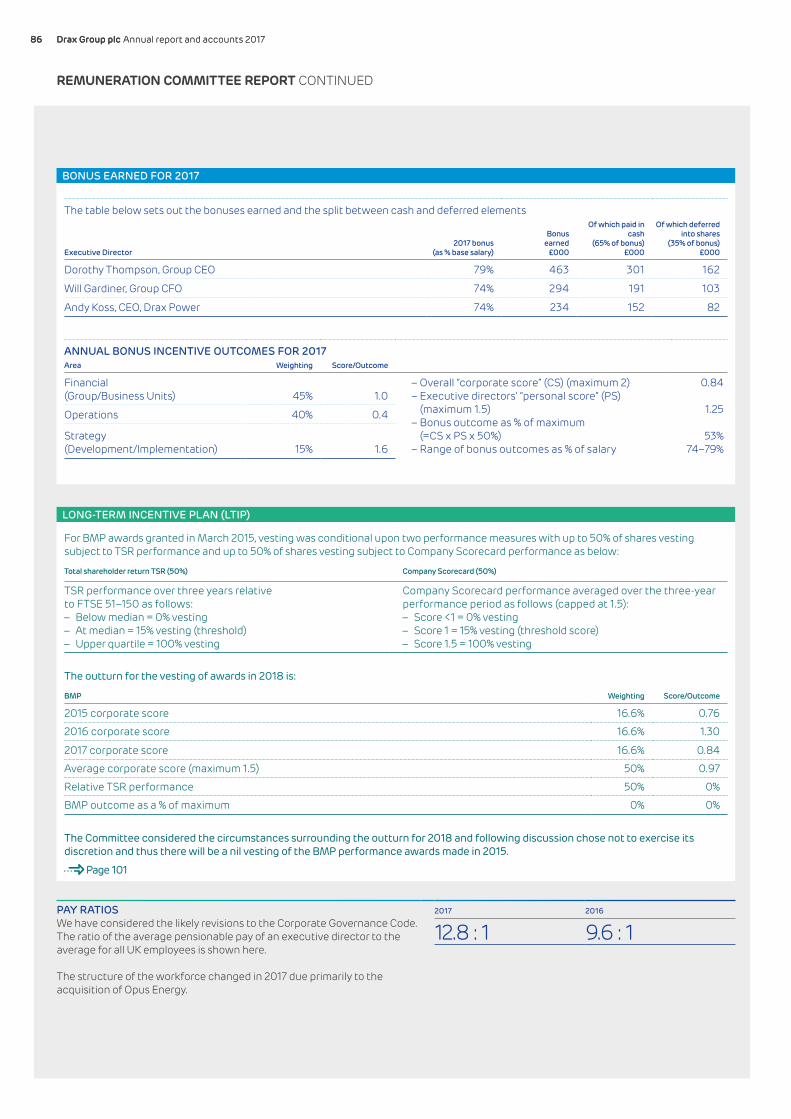
Drax Group plc Annual report and accounts 201786 Drax Group plc Annual report and accounts 201786
For BMP awards granted in March 2015, vesting was conditional upon two performance measures with up to 50% of shares vesting subject to TSR performance and up to 50% of shares vesting subject to Company Scorecard performance as below:
Total shareholder return TSR (50%) Company Scorecard (50%)
TSR performance over three years relative to FTSE 51–150 as follows: – Below median = 0% vesting – At median = 15% vesting (threshold) – Upper quartile = 100% vesting
Company Scorecard performance averaged over the three-year performance period as follows (capped at 1.5): – Score <1 = 0% vesting – Score 1 = 15% vesting (threshold score) – Score 1.5 = 100% vesting
The outturn for the vesting of awards in 2018 is:
BMP Weighting Score/Outcome
2015 corporate score 16.6% 0.76
2016 corporate score 16.6% 1.30
2017 corporate score 16.6% 0.84
Average corporate score (maximum 1.5) 50% 0.97
Relative TSR performance 50% 0%
BMP outcome as a % of maximum 0% 0%
The Committee considered the circumstances surrounding the outturn for 2018 and following discussion chose not to exercise its discretion and thus there will be a nil vesting of the BMP performance awards made in 2015.
Page 101
LONG-TERM INCENTIVE PLAN (LTIP)
PAY RATIOSWe have considered the likely revisions to the Corporate Governance Code. The ratio of the average pensionable pay of an executive director to the average for all UK employees is shown here.
The structure of the workforce changed in 2017 due primarily to the acquisition of Opus Energy.
2017 2016
12.8 : 1 9.6 : 1
The table below sets out the bonuses earned and the split between cash and deferred elements
Executive Director2017 bonus
(as % base salary)
Bonus earned
£000
Of which paid in cash
(65% of bonus) £000
Of which deferred into shares
(35% of bonus) £000
Dorothy Thompson, Group CEO 79% 463 301 162
Will Gardiner, Group CFO 74% 294 191 103
Andy Koss, CEO, Drax Power 74% 234 152 82
ANNUAL BONUS INCENTIVE OUTCOMES FOR 2017Area Weighting Score/Outcome
Financial (Group/Business Units) 45% 1.0
– Overall “corporate score” (CS) (maximum 2)– Executive directors’ “personal score” (PS)
(maximum 1.5)– Bonus outcome as % of maximum
(=CS x PS x 50%)– Range of bonus outcomes as % of salary
0.84
1.25
53%74–79%
Operations 40% 0.4
Strategy (Development/Implementation) 15% 1.6
BONUS EARNED FOR 2017
REMUNERATION COMMITTEE REPORT CONTINUED

Drax Group plc Annual report and accounts 2017 87Drax Group plc Annual report and accounts 2017 87Strategic report
Governance
Financial statements
Shareholder information
DIRECTORS’ REMUNERATION POLICYAs set out in the Chairman of the Committee’s Annual Statement to Shareholders, we are proposing changes to the current remuneration policy which, in order to be effected, require shareholders’ approval.
This revised remuneration policy, subject to shareholder approval at the 2018 AGM, will be effective from immediately after the AGM on 25 April 2018. Normally it would be binding on the Group for three years but, as outlined earlier, the Committee intends to review the policy in 2019 and incorporate the results of this review in a policy to be presented to shareholders at the 2020 AGM. Therefore the results of the 2018 vote on the revised policy will be binding for two years, until the close of the 2020 AGM.
The core principles of the remuneration policy are set out below:
– making sure that executive remuneration is linked strongly to performance and the achievement of strategic objectives; – ensuring transparency in executive pay reporting through simplification in design and appropriate reporting; – securing and retaining top talent and incentivising strong performance; and – maintaining flexibility, to recognise the uncertain business environment, whilst ensuring that remuneration outcomes are aligned to
shareholder interests.
CHANGES TO THE POLICYAs described in the Chairman’s Statement, the proposed changes to the current remuneration policy ensure a consistent approach to our bonus arrangements for executive directors and employees. These changes are:
– removal of the personal performance component of the bonus formula such that the formula moves from target bonus x corporate score x personal score to target bonus x corporate score. In future, bonuses will be earned solely for the delivery of stretching corporate and divisional related financial, strategic and operational targets, as measured through the Corporate Scorecard; and
– raising the level of Corporate Scorecard performance which must be attained for maximum bonus pay out (from maximum bonus pay out being possible at a score of 1.5 to a score of 2.0) thereby strengthening the link between corporate performance and incentive pay outs.
The rigour in setting and scoring the Corporate Scorecard will not be changed. The proposed changes toughen the operation of bonus arrangements as the executives’ personal score in recent years has had the effect of increasing the bonus outcome from what would have been earned through the Corporate Scorecard alone. The Committee will retain the overall discretion to adjust the bonus if the Corporate Scorecard outcome is not reflective of corporate or individual performance in the year. We are not proposing any other change to the Directors’ Remuneration Policy approved at the 2017 AGM, except for minor changes to the wording to clarify the operation of the policy.
The following is an overview of our remuneration framework under the revised policy.
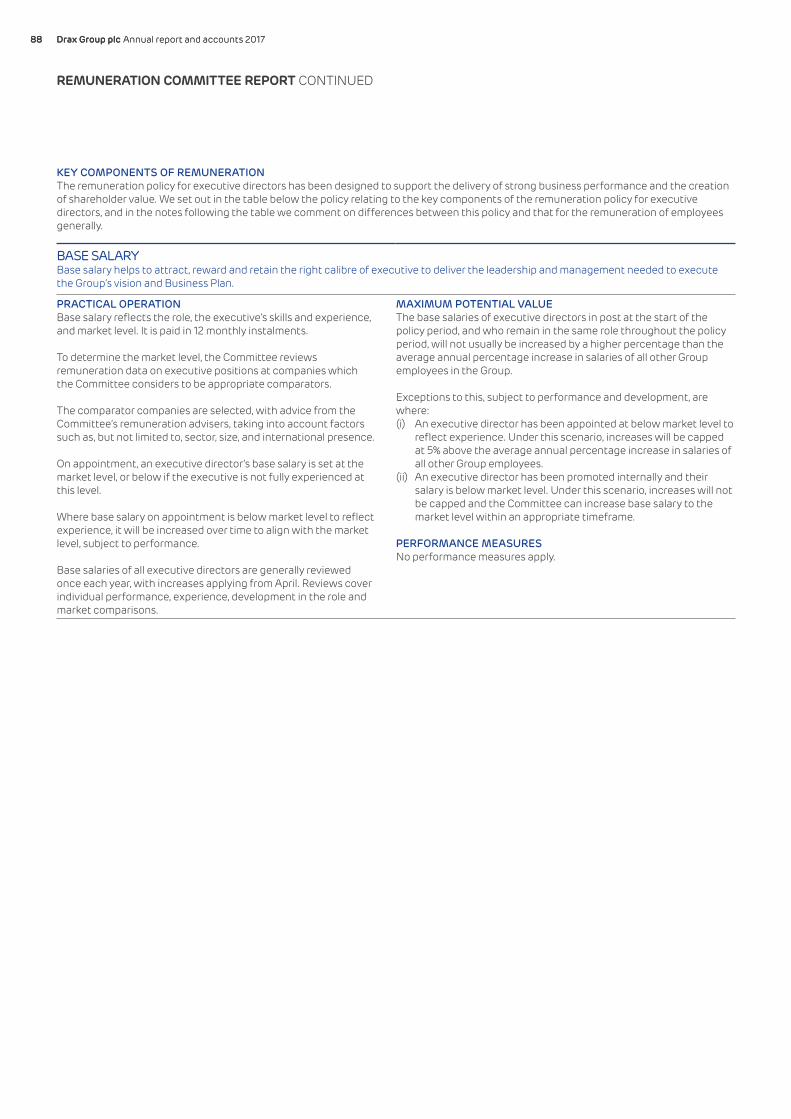
Drax Group plc Annual report and accounts 201788 Drax Group plc Annual report and accounts 201788
KEY COMPONENTS OF REMUNERATION The remuneration policy for executive directors has been designed to support the delivery of strong business performance and the creation of shareholder value. We set out in the table below the policy relating to the key components of the remuneration policy for executive directors, and in the notes following the table we comment on differences between this policy and that for the remuneration of employees generally.
BASE SALARYBase salary helps to attract, reward and retain the right calibre of executive to deliver the leadership and management needed to execute the Group’s vision and Business Plan.
PRACTICAL OPERATIONBase salary reflects the role, the executive’s skills and experience, and market level. It is paid in 12 monthly instalments.
To determine the market level, the Committee reviews remuneration data on executive positions at companies which the Committee considers to be appropriate comparators.
The comparator companies are selected, with advice from the Committee’s remuneration advisers, taking into account factors such as, but not limited to, sector, size, and international presence.
On appointment, an executive director’s base salary is set at the market level, or below if the executive is not fully experienced at this level.
Where base salary on appointment is below market level to reflect experience, it will be increased over time to align with the market level, subject to performance.
Base salaries of all executive directors are generally reviewed once each year, with increases applying from April. Reviews cover individual performance, experience, development in the role and market comparisons.
MAXIMUM POTENTIAL VALUEThe base salaries of executive directors in post at the start of the policy period, and who remain in the same role throughout the policy period, will not usually be increased by a higher percentage than the average annual percentage increase in salaries of all other Group employees in the Group.
Exceptions to this, subject to performance and development, are where:(i) An executive director has been appointed at below market level to
reflect experience. Under this scenario, increases will be capped at 5% above the average annual percentage increase in salaries of all other Group employees.
(ii) An executive director has been promoted internally and their salary is below market level. Under this scenario, increases will not be capped and the Committee can increase base salary to the market level within an appropriate timeframe.
PERFORMANCE MEASURESNo performance measures apply.
REMUNERATION COMMITTEE REPORT CONTINUED

Drax Group plc Annual report and accounts 2017 89Drax Group plc Annual report and accounts 2017 89Strategic report
Governance
Financial statements
Shareholder information
ANNUAL BONUSThe award of annual bonuses is linked directly to personal performance and to achieving the annual Business Plan targets.
The aim of the deferred portion of annual bonus is to further align executives to shareholders’ interests, by linking share-based reward to long-term sustainable performance.
PRACTICAL OPERATION65% of annual bonus earned is paid in cash, normally three months after the end of the financial year to which it relates.
35% of annual bonus earned is deferred in nil cost awards over shares under the Deferred Share Plan (DSP), which vest after three years subject to continued employment or “good leaver” termination provisions.
The DSP was introduced in 2017, as a vehicle for deferring the relevant proportion of annual bonus in shares.
Annual bonus earned (subject to the maximum opportunity) is:
Target bonus x corporate score.Target bonus is 50% of maximum.Corporate score ranges from zero to 2.0.
Each measure in the corporate scorecard is assigned a weighting and three performance levels (low, target and stretch). The score is zero if performance is below the low target, one if performance is at target and two for stretch performance.
Dividends in respect of the deferred shares are reinvested in additional shares, which vest when the deferred shares vest.
In certain circumstances, the Committee can apply clawback to any annual bonus awards, as set out in the notes to the policy table.
Summary corporate scorecard and performance results are published in the Annual report on remuneration.
The Committee will review the formulaic outcome of the Annual bonus and has the discretion to amend the final outcome to make sure that bonus payments reflect overall performance. The use of such discretion will be explained fully in the relevant Annual report on remuneration.
MAXIMUM POTENTIAL VALUE
RoleMaximum bonus potential
(% of base salary)
Chief Executive, Drax Group 150%
Other executive directors 140%
There is no payment for below threshold performance.
PERFORMANCE MEASURESCorporate score is based on performance, against the Corporate Scorecard, of strategic and Business Plan targets set, each year, by the Committee, in conjunction with the Board. Performance measures include financial, operational and strategic objectives. Typically, across the Group and Business Units, around 40% of the Scorecard is based on financial objectives, 30–40% on strategic goals with the balance on operational issues. The Committee has the discretion to vary the weightings from year to year.
The corporate scorecard is amended each year, in line with business strategy and objectives.
In exceptional circumstances such that the Committee believes the original measures and/or targets are no longer appropriate, the Committee has discretion to amend performance measures and targets during the year.
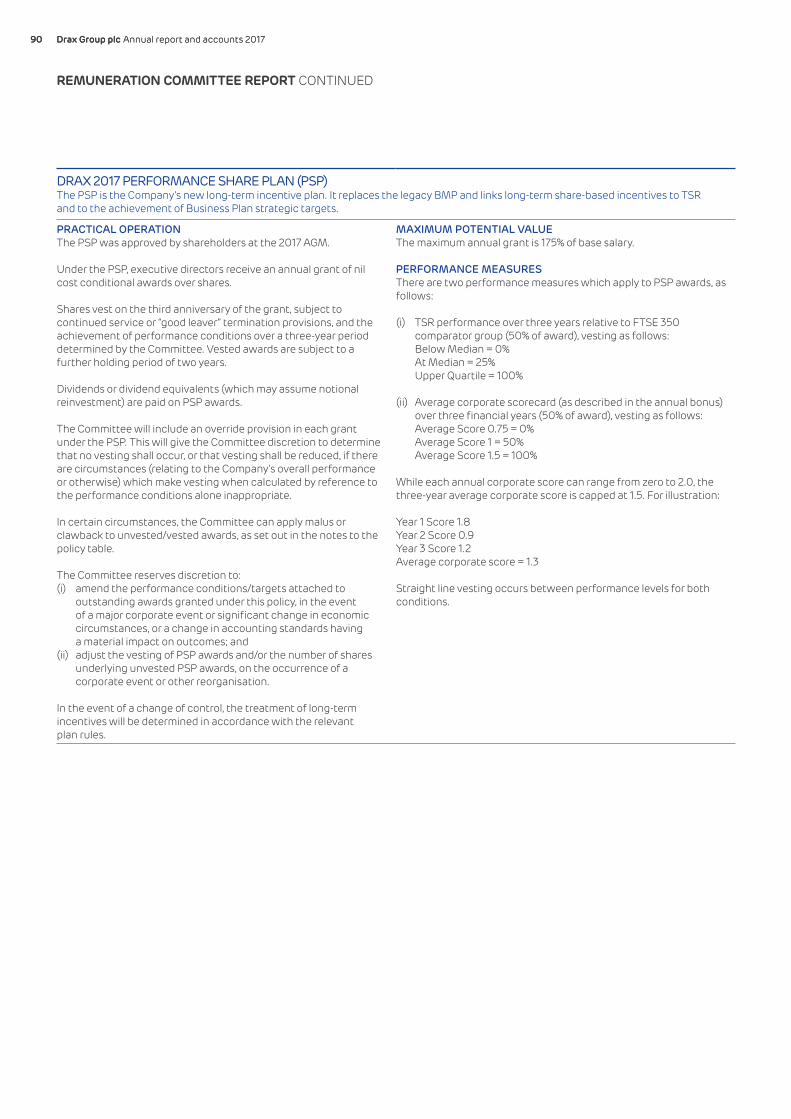
Drax Group plc Annual report and accounts 201790 Drax Group plc Annual report and accounts 201790
DRAX 2017 PERFORMANCE SHARE PLAN (PSP)The PSP is the Company’s new long-term incentive plan. It replaces the legacy BMP and links long-term share-based incentives to TSR and to the achievement of Business Plan strategic targets.
PRACTICAL OPERATIONThe PSP was approved by shareholders at the 2017 AGM.
Under the PSP, executive directors receive an annual grant of nil cost conditional awards over shares.
Shares vest on the third anniversary of the grant, subject to continued service or “good leaver” termination provisions, and the achievement of performance conditions over a three-year period determined by the Committee. Vested awards are subject to a further holding period of two years.
Dividends or dividend equivalents (which may assume notional reinvestment) are paid on PSP awards.
The Committee will include an override provision in each grant under the PSP. This will give the Committee discretion to determine that no vesting shall occur, or that vesting shall be reduced, if there are circumstances (relating to the Company’s overall performance or otherwise) which make vesting when calculated by reference to the performance conditions alone inappropriate.
In certain circumstances, the Committee can apply malus or clawback to unvested/vested awards, as set out in the notes to the policy table.
The Committee reserves discretion to:(i) amend the performance conditions/targets attached to
outstanding awards granted under this policy, in the event of a major corporate event or significant change in economic circumstances, or a change in accounting standards having a material impact on outcomes; and
(ii) adjust the vesting of PSP awards and/or the number of shares underlying unvested PSP awards, on the occurrence of a corporate event or other reorganisation.
In the event of a change of control, the treatment of long-term incentives will be determined in accordance with the relevant plan rules.
MAXIMUM POTENTIAL VALUEThe maximum annual grant is 175% of base salary.
PERFORMANCE MEASURESThere are two performance measures which apply to PSP awards, as follows:
(i) TSR performance over three years relative to FTSE 350 comparator group (50% of award), vesting as follows:
Below Median = 0% At Median = 25% Upper Quartile = 100%
(ii) Average corporate scorecard (as described in the annual bonus) over three financial years (50% of award), vesting as follows:
Average Score 0.75 = 0% Average Score 1 = 50% Average Score 1.5 = 100%
While each annual corporate score can range from zero to 2.0, the three-year average corporate score is capped at 1.5. For illustration:
Year 1 Score 1.8Year 2 Score 0.9Year 3 Score 1.2Average corporate score = 1.3
Straight line vesting occurs between performance levels for both conditions.
REMUNERATION COMMITTEE REPORT CONTINUED

Drax Group plc Annual report and accounts 2017 91Drax Group plc Annual report and accounts 2017 91Strategic report
Governance
Financial statements
Shareholder information
PENSIONPension provision is one of the components to attract, reward and retain the right calibre of executive, to ensure delivery of the leadership and management needed to execute the Group’s vision and Business Plan.
PRACTICAL OPERATIONExecutive directors are entitled to non-contributory membership of the Group’s defined contribution pension plan. The employer’s contribution for executive directors is 20% of base salary.
Alternatively, at their option, executive directors may either have contributions of the same amounts made to their personal pension schemes, cash in lieu of pension (subject to normal statutory deductions); or a combination of pension contributions and cash in lieu of pension.
MAXIMUM POTENTIAL VALUEMaximum is 20% of base salary.
PERFORMANCE MEASURESNo performance measures apply.
BENEFITSBenefits are provided to be market competitive as an integral part of directors’ total remuneration.
PRACTICAL OPERATIONExecutive directors receive a car allowance, life assurance (four times salary), the opportunity to participate in all-employee share plans on the same basis as other employees, annual private health assessment and annual private medical cover.
Additional benefits may be provided if the Committee considers them appropriate.
Relocation expenses and/or second base expenses are paid, where appropriate, in individual cases. Directors’ relocation expenses are determined on a case-by-case basis. The policy is designed to assist the director to relocate to a home of similar standing.
MAXIMUM POTENTIAL VALUEBenefits are set at a level appropriate to the individual’s role and circumstances.
The maximum opportunity will depend on the type of benefit and cost of its provision, which will vary according to the market and individual circumstances.
PERFORMANCE MEASURESNo performance measures apply.
SHARE OWNERSHIP GUIDELINEThe Group’s share ownership guidelines align the interests of executives with shareholders.
PRACTICAL OPERATIONThe share ownership guideline is that all executive directors should retain shares to the value of 200% of base salary, to be accumulated over five years. Until this level is reached, directors who receive shares by virtue of any share plan award or who receive deferred bonus shares must retain 50% of the shares received net (i.e. after income tax and national insurance contributions). Only shares that have actually vested count towards the threshold.
MAXIMUM POTENTIAL VALUEN/A
PERFORMANCE MEASURESN/A
ELEMENTS OF PREVIOUS POLICY THAT WILL CONTINUE – BMP AWARDS MADE IN 2015, 2016 AND 2017
Remuneration component and link to strategy Practical operation Performance measures
Bonus Matching Plan – deferred awards made in 2015, 2016 and 2017 and conditional awards made in 2015 and 2016.
Links long-term share-based incentives to TSR and to the achievement of Business Plan strategic targets.
Vesting is subject to the achievement of performance conditions (conditional awards) and continued service or “good leaver” termination provisions (deferred and conditional awards).
Further details of the terms of the awards were included in the Annual remuneration reports for the respective years.
Vesting of conditional awards is subject to relative TSR and average Corporate Scorecard outcome over three years.

Drax Group plc Annual report and accounts 201792 Drax Group plc Annual report and accounts 201792
PERFORMANCE MEASURES AND APPROACH TO SETTING TARGETSThe measures for elements of variable pay are: – Corporate Scorecard, consisting of strategic and Business Plan targets set by the Committee each year in conjunction with the Board.
The Corporate Scorecard aligns incentives of executive directors with achievement of key business goals. – Relative TSR, which aligns executive director remuneration with creation of long-term shareholder value. – The Committee sets targets for the performance measures each year, taking into account market conditions, the Business Plan and other
circumstances as appropriate. A summary of the Corporate Scorecard targets that apply for the following year are disclosed in the Annual Report on Remuneration.
CIRCUMSTANCES IN WHICH MALUS OR CLAWBACK MAY APPLYMalus and/or clawback may be applied to incentive awards under the following circumstances: – Clawback for the annual bonus – the Committee may require a director to repay any amount of annual bonus payment it considers
appropriate, in circumstances of financial misstatement, or misconduct, or if assessment of a performance condition is found to have been based on an error, inaccuracy or misleading information, or in other circumstances that the Committee considers to justify the operation of the clawback provision.
– Malus and clawback for the BMP – if a repayment of bonus is required (see “annual bonus” above) the Committee shall reduce the number of shares that may vest under the BMP by an appropriate amount (in respect of an award made pursuant to the annual bonus payment subject to the clawback). The Committee may also reduce the number of shares under a BMP award in circumstances of financial misstatement, or if assessment of a performance condition is found to have been based on an error, inaccuracy or misleading information, or in other circumstances that the Committee considers to justify the operation of the clawback provision.
– Malus and clawback for the PSP and DSP – the Committee may also reduce the number of shares under a PSP and/or DSP award in circumstances of financial misstatement, or if assessment of a performance condition is found to have been based on an error, inaccuracy or misleading information, or in other circumstances that the Committee considers to justify the operation of the clawback provision.
COMMITTEE’S JUDGEMENT AND DISCRETIONIn addition to assessing and making judgements on the meeting of performance targets and the appropriate incentives payable, the Committee has certain operational discretions it can exercise in relation to executive directors’ remuneration. These include, but are not limited to: – reviewing the formulaic outcome of the annual bonus and applying discretion to amend the final outcome, to ensure that bonus payments
reflect overall performance or an individual executive’s performance; – deciding whether to apply malus or clawback to an award; and – determining whether a leaver is a “good leaver”.
Where such discretion is exercised, it will be explained in the relevant directors’ remuneration report.
REMUNERATION SCENARIOS The composition and value of the executive directors’ remuneration packages at low, target and stretch performance scenarios under the Drax Group remuneration policy are set out in the charts below. The assumptions used in the charts are provided in the following table:
BASE SALARY, PENSION AND BENEFITS
Description Scenario Annual bonus PSP
Salary is the rate payable to each director from 1 January 2017
Low None None
The value of benefits is taken from the single figure for the year ended 31 December 2017
Target 50% of the maximum bonus TSR: 62.5% vesting (midpoint between threshold and maximum)Scorecard: 50% vesting
Pension is the value of the pension payable on the salary rate used
Stretch Maximum bonus (150% of salary for Group Chief Executive, 140% of salary for other executive directors)
Maximum PSP opportunity (175% of salary) with no allowance for share price appreciation or dividend equivalents
WILL GARDINER (GROUP CHIEF EXECUTIVE OFFICER) £,000
ANDY KOSS (CHIEF EXECUTIVE, DRAX POWER) £,000
Fixed elementsAnnual variableMulti-period variable
3,000
2,500
2,000
1,500
1,000
500
0
Fixed elementsAnnual variable
Multi-period variable
Low
100%
£630
£1,549
£2,353
41% 27%
26%34%
34%
39%
Target Stretch
1,600
1,400
1,200
1,000
800
400
600
200
0
Fixed elementsAnnual variable
Multi-period variable
Low
100%
£400
£936
£1,401
43% 28%
24% 32%
33%
40%
Target Stretch
REMUNERATION COMMITTEE REPORT CONTINUED

Drax Group plc Annual report and accounts 2017 93Drax Group plc Annual report and accounts 2017 93Strategic report
Governance
Financial statements
Shareholder information
APPROACH TO RECRUITMENT REMUNERATIONThe Committee will apply the core principles on page 87 and the components set out in the table on pages 88 to 92 to determine the remuneration of newly appointed directors. Base salary will be set at a level appropriate to the role and the experience of the director being appointed. Where this is below the market level, it will be adjusted over time to align with the market level, subject to good performance. The incentive provision for a new executive director will include annual bonus up to 150% of salary and a PSP award of up to 175% of salary.
In relation to directors appointed from outside the Group, where the Committee considers it to be necessary to secure the appointment of the director, the Committee may: – pay compensation for loss of benefits on resignation from a previous employer, such as loss of long-term share incentives (subject to the
right to phase any payment to reflect performance, the requirement to mitigate loss and the Company’s right to claw back any amount which is subsequently paid to the executive by the former employer, and to claw back an appropriate proportion of the payment if the executive leaves soon after appointment); and
– make appropriate payments in circumstances where a director is relocated from outside the UK.
SERVICE AGREEMENTS AND COMPENSATION ON LOSS OF OFFICEExecutive directors’ service agreements are of indefinite duration, terminable at any time by either party giving 12 months’ notice.
Element Details
Notice periods Executive directors may be required to work during the notice period or may be provided with pay in lieu of notice if not required to work the full notice period.
Under each of the executive directors’ service agreements, the Company has the right to make a payment in lieu of notice of termination, the amount of that payment being the salary and benefits that would have accrued to the executive director during the contractual notice period.
Compensationfor loss of office
If an executive director’s employment is brought to an end by either party and if it is necessary to determine a termination payment, the Committee’s policy, in the absence of a breach of the service agreement by the director, is to determine a director’s termination payment in accordance with his/her service agreement. The termination payment will be calculated based on the value of base salary and contractual benefits that would have accrued to the director during the contractual notice period. The Committee will seek mitigation to reduce the amount of any termination payment to a leaving director when appropriate to do so, having regard to the circumstances and the law governing the agreement. It may, for example, be appropriate to consider mitigation if the director has secured another job at a similar level. Mitigation would not apply retrospectively to a contractual payment in lieu of notice.
In addition, the director may be entitled to a payment in respect of his/her statutory rights. The Group may pay reasonable fees for a departing director to obtain independent legal advice in relation to their termination arrangements and nominal consideration for agreement to any contractual terms protecting the Company’s rights following termination. No service agreement includes any provision for the payment of compensation upon termination. Any compensation payable in those circumstances would need to be determined at the time and in the light of the circumstances.
Treatment of annual bonus on termination
All bonus payments are discretionary benefits. The Committee will consider whether a departing director should receive an annual bonus in respect of the financial year in which, and/or immediately preceding which, the termination occurs, pro-rated to reflect the period of the performance year completed at the date of termination. The Committee will take into account performance; cooperation with succession; any breach of goodwill, and adherence to contractual obligations/restrictions. If the termination is by the Company on less than the notice specified in the director’s service agreement and, if required, in order to adhere to contractual obligations, the Committee will also consider whether the director should receive an annual bonus in respect of any period of the financial year following termination for which the director has been deprived of the opportunity to earn annual bonus. As outlined earlier in the report the latest Chief Executive service contract for Will Gardiner as Group CEO, does not allow for the payment of bonus after termination. If the employment ends in any of the following circumstances, the director will be treated as a “good leaver” and the director will be eligible for a bonus payment: – redundancy; – retirement; – ill-health or disability, proved to the satisfaction of the Company; and – death.
If the termination is for any other reason, a bonus payment will be at the Committee’s discretion and it is the Committee’s policy to ensure that any such bonus payment properly reflects the departing director’s performance and behaviour towards the Company. Therefore the amount of any such payment will be determined as described in the table on page 92, taking into account (i) the director’s personal performance and behaviour towards the Company and (ii) the Group performance. If a bonus payment is made, it will normally be paid as soon as is reasonably practicable after the Group performance element has been determined for the relevant period. There may be circumstances in which the Committee considers it appropriate for the bonus payment to be made earlier, for example, on termination due to ill-health, in which case, on-target Group performance score shall be assumed.
No payment will be made unless the director is employed on the date of bonus payment, except for “good leavers” as defined above.
Drax Group plc Annual report and accounts 201794 Drax Group plc Annual report and accounts 201794
Element Details
Treatment of unvested long-term incentive and deferred share awards on termination
The Committee will consider the extent to which deferred and conditional share awards held by the director under the BMP, DSP and PSP should lapse or vest. Any determination by the Committee will be in accordance with the rules of the BMP, DSP and PSP (as approved by shareholders).
In summary, the rules of the BMP and PSP provide that awards will vest (pro-rated to the date of employment termination) if employment ends for any of the following reasons (“long-term good leaver reasons”): – redundancy; – retirement; – ill-health or disability proved to the satisfaction of the Company; – change of ownership; and – death.
If employment ends for any other reason, the rules of the BMP and PSP require the Committee to exercise its discretion. In doing so, it will take account of all relevant circumstances, in particular, the Company’s performance; the director’s performance and behaviour towards the Company during the performance cycle of the relevant awards; and other relevant factors, including the proximity of the award to its maturity date.
The rules of the BMP also provide that in circumstances where awards vest, deferred and conditional shares vest as soon as reasonably practicable following termination. Awards, which vest subject to satisfaction of the relevant performance conditions, will be time pro-rated and will be phased over the performance cycle of the relevant awards.
The rules of the DSP provide that deferred bonus awards will vest (in full) if employment ends for any of the “long-term good leaver reasons” detailed above. If employment ends for any other reason, the rules of the DSP require the Committee to exercise its discretion. In doing so it will take account of all relevant circumstances, in particular, the Company’s performance; the director’s performance and behaviour towards the Company during the performance cycle of the relevant awards; and a range of other relevant factors, including the proximity of the award to its maturity date.
The rules of the DSP and PSP also provide that in circumstances where awards vest, they do so at the normal vesting date, unless the Committee exercises discretion to vest awards earlier. Awards which vest subject to satisfaction of the relevant performance conditions will be (time) pro-rated.
Outside appointments Executive directors may accept external Board appointments, subject to the Chairman’s approval. Normally only one appointment to a listed company would be approved. Fees may be retained by the director.
CONSIDERATION OF CIRCUMSTANCES FOR LEAVERSThe Committee will consider whether the overall value of any benefits accruing to a leaving director is fair and appropriate, taking account of all relevant circumstances. Examples of circumstances in which the Committee may be minded to award an annual bonus payment and/or permit the vesting of PSP awards include: – the director’s continued good performance up to and following the giving of notice; and – the director accommodating the Company in the timing of his/her departure and handover arrangements.
Conversely, the Committee may be minded not to allow such payments if the reason for the departure is: – poor performance; or – the director does not continue to perform effectively following notice.
REMUNERATION COMMITTEE REPORT CONTINUED

Drax Group plc Annual report and accounts 2017 95Drax Group plc Annual report and accounts 2017 95Strategic report
Governance
Financial statements
Shareholder information
REMUNERATION OF NON-EXECUTIVE DIRECTORS AND CHAIRMAN
Remuneration component and link to strategy Practical operation Maximum potential value
Fees To attract a Chairman and independent non-executive directors who, together with the executive directors, form a Board with a broad range of skills and experience.
The Chairman’s remuneration is determined by the Committee whilst that of the other non-executive directors is determined by the Chairman and the executive directors. These are determined in the light of: – fees of chairmen and non-executive directors of other listed
companies selected for comparator purposes, on the same basis as for executive directors;
– the responsibilities and time commitment; and – the need to attract and retain individuals with the necessary skills
and experience.
Non-executive directors’ fees are reviewed periodically against market comparators. They were last reviewed in 2017. Current fee levels are shown in the annual report on remuneration.
The Chairman receives an annual fee.
Non-executive directors receive an annual base fee.
Additional annual fees are paid: – to the Senior Independent Director (which includes the fee for
chairing a Board Committee other than the Audit Committee); – to the Chair of the Audit Committee; – to the Chair of the Remuneration Committee; and – to the Chair of any other committee (this is not paid to the Chairman
of the Nomination Committee if he or she is also the Chairman of the Board).
Non-executive directors are not entitled to participate in any performance related remuneration arrangements.
Overall aggregate fees paid to all non-executive directors will remain within the limit as stated in the Company’s Articles (currently £1,000,000).
Expenses Reasonable travel and accommodation expenses are reimbursed as applicable.
Non-executive directors do not receive any benefits in kind, nor are they eligible for any annual performance bonus, pension or any of the Group’s share-based reward plans.
The Chairman’s notice period is six months whilst the other non-executive directors have a notice period of one month.

Drax Group plc Annual report and accounts 201796 Drax Group plc Annual report and accounts 201796
DIFFERENCES BETWEEN THE POLICY AND THAT OF THE REMUNERATION OF EMPLOYEES GENERALLYThe following differences apply between the remuneration of directors and the policy on the remuneration of employees generally: – executive directors and a number of senior employees are eligible for PSP awards, although there are differences in terms of levels
of grant; – annual bonus levels vary across the workforce, but the requirement to defer a portion of annual bonus applies only to executive directors; – employees in the collective bargaining unit have a contractual right to receive an annual bonus subject to Company performance and
continued employment, whereas directors and all other UK-based employees participate in a discretionary bonus scheme; and – hourly paid employees qualify for overtime payments.
CONTEXTWider employee populationIn determining executive remuneration, the Committee also takes into account the level of general pay increases within the Group.The Committee’s policy is that annual salary increases for executive directors should not exceed the average annual salary increase for the wider employee population unless there is a particular reason for a higher increase, such as a change in the nature or scope of responsibilities or if an executive director has been appointed at a salary below market level reflecting experience in the role.
The Committee has considered a number of comparison metrics when determining its approach to executive remuneration, including the ratio of Group Chief Executive to median employee pay.
Views taken from the employee populationIn the course of discussions on pay with employee representatives, the Group discusses executive remuneration policy and provides details of the process by which the Committee establishes executive remuneration packages. The information provided includes details of the benchmarking of executive director remuneration, as well as information benchmarking the pay of employees in the collective bargaining unit with pay elsewhere in the industry.
Environmental, social and governance issuesThe Committee is able to consider corporate performance on environmental, social and governance issues when setting the remuneration of executive directors. Specific measures can be included in the balanced Corporate Scorecard. The Committee is also able to consider these issues in determining whether to exercise its discretion to adjust the overall score, and in considering the performance conditions override under the PSP, as described on page 92.
Shareholder engagementThe Company holds regular meetings with its largest shareholders, and the Committee takes into account all shareholder views or representations relating to executive remuneration. We held discussions with a number of shareholders leading up to and around the time of the 2017 AGM and the Committee has considered this feedback. The proposal to remove the personal element from the annual bonus within the current policy takes on board that feedback. We wrote to a number of shareholders in late 2017 to explain the proposed changes to the remuneration policy for executive directors. The Committee takes shareholder feedback very seriously and will continue to engage.
REMUNERATION COMMITTEE REPORT CONTINUED

Drax Group plc Annual report and accounts 2017 97Drax Group plc Annual report and accounts 2017 97Strategic report
Governance
Financial statements
Shareholder information
ANNUAL REPORT ON REMUNERATIONThe relevant sections of this report have been audited as required by the Regulations and, in accordance with the Regulations, this part of the report will be subject to an advisory vote at the AGM to be held on 25 April 2018.
SINGLE TOTAL FIGURE OF REMUNERATION FOR EACH DIRECTOR (AUDITED INFORMATION)The table below sets out the single figure of remuneration and the breakdown for each executive director for 2017, together with comparative figures for 2016:
Salary/Fees (£000)
Pension (£000)
Bonus(1) (£000)
Long Term Incentives(2) (£000)
Other benefits (4) (£000)
Total (£000)
Name 2017 2016 2017 2016 2017 2016 2017 2016 (3) 2017 2016 2017 2016
Dorothy Thompson 585 574 117 115 463 756 0 74 71 76 1,236 1,595
Will Gardiner 397 390 79 78 294 479 – – 20 24 790 971
Andy Koss 316 310 63 62 234 381 0 19 19 21 632 793
Notes:(1) Bonus is the cash value of the annual bonus payable in respect of performance in the relevant year, including the value of bonus deferred and paid in shares after three years subject only to continued
service(2) There is a nil vesting of BMP awards that would vest in 2018, due to the performance conditions in respect of the 2015 BMP awards not being satisfied(3) The BMP figure for 2016 is the value of the BMP Matching Awards granted in March 2014 which vested in March 2017, together with the dividend shares in relation to those vested shares. The value has
been re-stated to reflect the share price of £3.415 at the vesting date of 13 March 2017(4) Other benefits include car allowance, private medical insurance, life assurance, permanent health insurance, dependent’s pension, and prior to her ceasing to be a director on 31 December 2017, in the
case of Dorothy Thompson, a second base allowance
BASE SALARIESThe base salaries of the executive directors as at 31 December 2017, together with comparative figures as at 31 December 2016, are shown in the following table:
Base salary as at 31 December 2017
£000
Base salary as at 31 December 2016
£000Percentage
increase
Andy Koss 318 310 2.5%
Will Gardiner 400 390 2.5%
Dorothy Thompson 588 574 2.5%
Base salaries were reviewed with effect from 1 April 2017. In line with policy, the salaries of Dorothy Thompson, Will Gardiner and Andy Koss were reviewed and increased by 2.5%. This was in line with the average increase for the wider workforce of 2.5%. Will Gardiner’s salary was increased to £530,000 as at 1 January 2018 on his promotion to Group CEO.
ANNUAL FEESWill Gardiner’s salary increased to £530,000 as at 1 January 2018 on his promotion to Group CEO.
Fees at31 December 2017
£000
Fees at31 December 2016
£000Percentage
increase
Chairman 250 250 0%
Non-Executive Director base fee 55 55 0%
Senior Independent Director 10 10 0%
Audit Committee Chair 10 10 0%
Remuneration Committee Chair 10 10 0%
Nomination Committee Chair (1) 7.5 7.5 0%
Note:(1) This is not paid if the Chairman of the Nomination Committee is also the Chairman of the Board
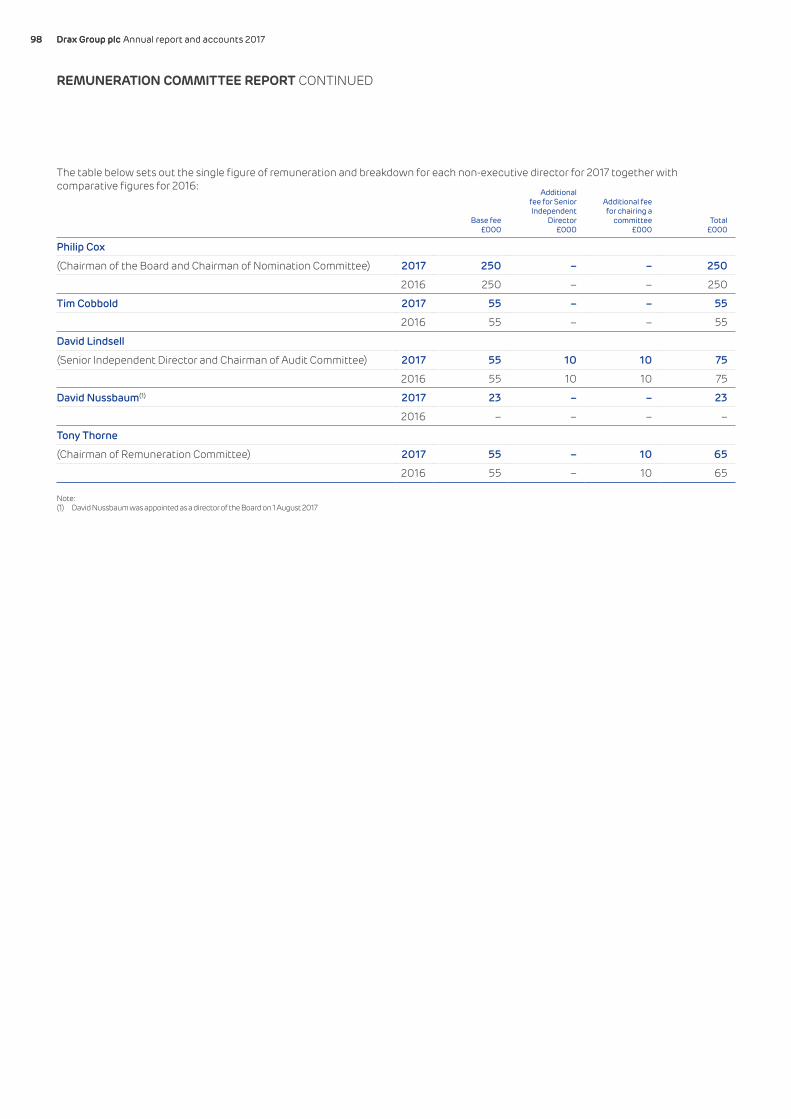
Drax Group plc Annual report and accounts 201798 Drax Group plc Annual report and accounts 201798
The table below sets out the single figure of remuneration and breakdown for each non-executive director for 2017 together with comparative figures for 2016:
Base fee£000
Additional fee for Senior Independent
Director£000
Additional fee for chairing a
committee£000
Total£000
Philip Cox
(Chairman of the Board and Chairman of Nomination Committee) 2017 250 – – 250
2016 250 – – 250
Tim Cobbold 2017 55 – – 55
2016 55 – – 55
David Lindsell
(Senior Independent Director and Chairman of Audit Committee) 2017 55 10 10 75
2016 55 10 10 75
David Nussbaum(1) 2017 23 – – 23
2016 – – – –
Tony Thorne
(Chairman of Remuneration Committee) 2017 55 – 10 65
2016 55 – 10 65
Note:(1) David Nussbaum was appointed as a director of the Board on 1 August 2017
REMUNERATION COMMITTEE REPORT CONTINUED

Drax Group plc Annual report and accounts 2017 99Drax Group plc Annual report and accounts 2017 99Strategic report
Governance
Financial statements
Shareholder information
DETAILS OF PERFORMANCE AGAINST METRICS FOR VARIABLE PAY AWARDSAnnual bonus plan outcomeA summary of the Committee’s assessment in respect of the 2017 Corporate Scorecard is set out in the following table:
Targetweighting Low target Target
Stretchtarget Outturn Score
Group – Corporate
Safety
Total recordable injury rate 5% 0.70 0.30 0.15 0.27 1.2
Finance
Group underlying earnings per share (pence) 10% 0.0 4.7 10.6 0.7 0.1
Group underlying EBITDA (£m) 10% 201 231 266 229 0.9
Group net debt (£m) 10% (562) (532) (497) (367) 2.0
Pellet quality
DBI fines at disport (%) 5% 7.5% 6.5% 4.5% 9.6% 0.0
Strategy
New strategy implementation 15% Behind plan On plan Ahead of plan Ahead of plan 1.6
Drax Biomass
Variable cost/tonne ($) 5% 71.05 69.90 65.95 76.72 0.0
Output (K tonnes) 2.5% 800 880 950 822 0.3
Drax Power
Biomass unit technical availability (%) 10% ND ND ND Below target 0.0
Value from flexibility (£m) 5% 82 97 112 88 0.4
Haven Power
Haven Power EBITDA (£m) 5% (4) 0 4 2 1.6
Implementation of new ERP 2.5% Q1 2018 Q4 2017 Q3 2017 Q2 2018 0.0
Opus Energy
Opus Energy EBITDA (£m) 5% 29 29 33 29.1 1.0
Opus Energy sales volumes (TWh) 5% 5.9 6.3 6.7 5.7 0.0
Renewal rate (%) 5% ND ND ND Above target 1.6
Total weighting 100% 0.84
Notes:The targets were aligned with the Group’s strategy and 2017 Business Plan and reviewed regularly by the Board as part of their ongoing scrutiny of business and executive performanceND – Not Disclosed. It is considered that the disclosure of detailed performance against these metrics would be commercially sensitive. It would therefore not be appropriate to disclose these figures. To do so may result in unfair competitive disadvantage to the Group and to consumers. All results were reviewed by the Committee prior to values being removed

Drax Group plc Annual report and accounts 2017100 Drax Group plc Annual report and accounts 2017100
Outlined below is a brief synopsis of the KPIs used and their strategic rationale: Group – Safety is the first priority for the business. The Total Recordable Incident Rate (TRIR) is defined as the number of incidents per 100,000
hours worked. A TRIR of 0.30 represents industry upper quartile safety performance. – Financial performance metrics are based on underlying EBITDA, underlying EPS and Net Debt. The weighting at 30% reflects the priority
given to a strong Group financial performance. – Pellet quality impacts both Drax Biomass and Drax Power. The Group’s strategic objective is 30% self-supply of high quality pellets, to fuel
its biomass generation units. The “fines” metric is used to drive pellet quality, from own supply. – New strategy implementation allows the Board to assess progress against a small number of specific strategic objectives. The weighting
demonstrates the Board’s commitment to the further development of the Group.
Drax Biomass – We remain focused on developing strong in-house pellet supply capability, able to provide up to 30% of the biomass fuel required by Drax
Power. Aside from “fines” whch are a Group issue, the focus is pellet output, particularly relevant as plants are commissioned and rise up their development curve, and pellet production costs, which have a direct impact on gross margins available from generation.
Drax Power – The value available to the Group from biomass-fuelled generation is a key driver of gross margins. Biomass unit technical availability
reflects the value that can be derived from maximising biomass unit output. – The value from operational flexibility acknowledges the changing nature of the UK’s electricity sector and the value available to
generators able to fully support the grid. This system support has emerged as a key revenue driver as coal-fuelled generation has declined.
Haven Power – During 2017 our Haven Power retail business has focused on improving profitability and making a positive financial contribution to the
Group. The EBITDA reflects this ambition. – To drive the future performance of the business it will need to engage with customers through suitable digital platforms and the
implementation of new IT systems forms part of this development.
Opus EnergyOpus Energy was acquired in February 2017 and, in the year, there has been a strong attention to its successful integration, with emphasis on maintaining its growth and profitability. The targets within the three metrics are consistent with the acquisition case.
Further details of how these individual metrics support the business strategy and drive both shareholder value and performance can be found on pages 1–57.
The Committee made an in-depth review of the score for each of the performance measures, to make sure these were individually supportable, and then reviewed the overall outcome, to determine whether to exercise its discretion and adjust the final score. The majority of the measures are quantitative but for reasons of commercial sensitivity some of the targets are not disclosed in the Annual report. The Committee aims for maximum transparency so the decision not to disclose a target is closely reviewed.
PERSONAL PERFORMANCEThe members of the Executive Committee, including the executive directors were assessed both relative to their individual contribution in driving 2017 performance, and as a team. Key to the assessment was each individual’s contribution to delivering the Group’s strategy and 2017 Business Plan plus the promotion of the Drax values.
Individual and executive team performance were both considered to be strong. This included good cooperation across the team, which was key to progressing the strategy and to the successful integration of Opus Energy.
With respect to the executive directors, areas of particular note included the: – Group CEO’s strong and effective leadership of the Group, the work on sustainability and the development, promotion and implementation
of the new strategy, which included two significant acquisitions. She also gave strong support to the new HR strategy; – Group CFO’s success in leading on the acquisition of Opus Energy, which was well integrated, the acquisition of LaSalle Bioenergy, which
increased our pellet capacity by 50% and is now successfully commissioning, the successful completion of the Group refinancing in May and a new dividend policy which was announced in June. He has also been instrumental in the overhaul of IT across the Group;
– Chief Executive of Drax Power’s strong leadership of the Drax generating plant, including good interaction with Government leading to the support for the fourth biomass unit, the acquisition of four permitted UK sites to develop as gas “peaking plants“ and the development of longer-term options for growth through coal-to-gas repowering on the Drax site.
The Committee determined that the three executive directors had performed strongly and that it was appropriate to give the same personal performance score to each. A score of 1.25 out of 1.5 was awarded.
REMUNERATION COMMITTEE REPORT CONTINUED
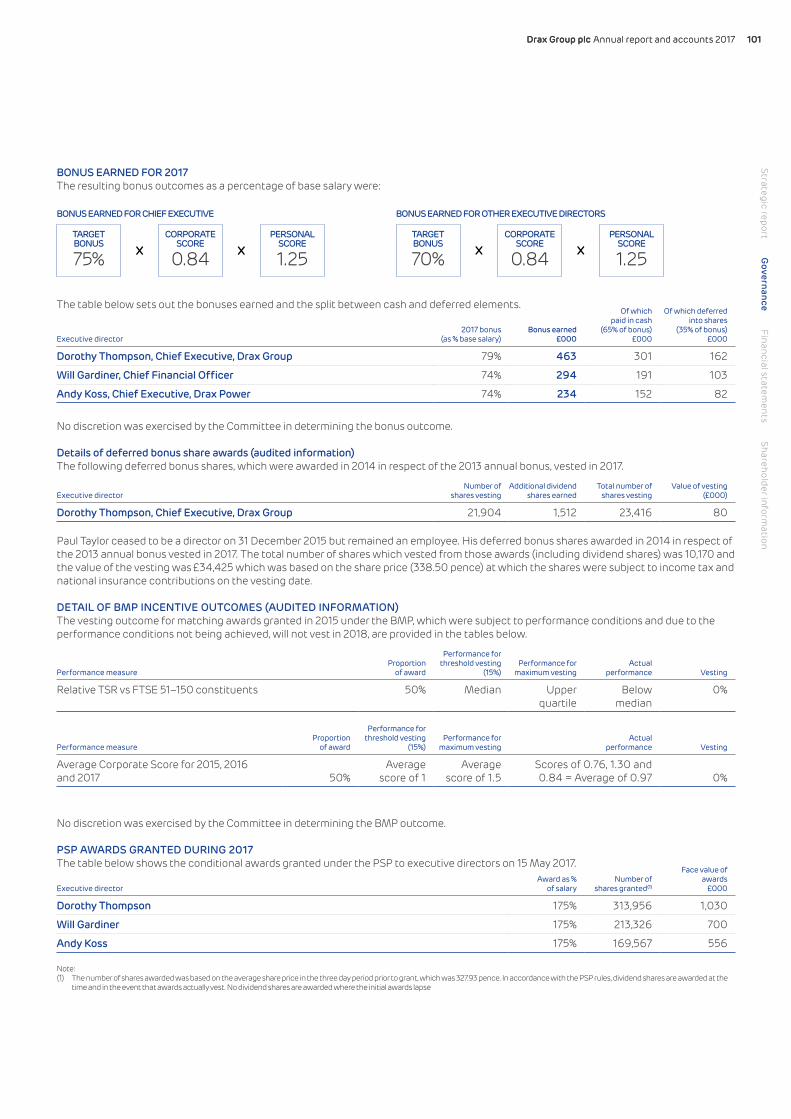
Drax Group plc Annual report and accounts 2017 101Drax Group plc Annual report and accounts 2017 101Strategic report
Governance
Financial statements
Shareholder information
BONUS EARNED FOR 2017The resulting bonus outcomes as a percentage of base salary were:
BONUS EARNED FOR CHIEF EXECUTIVE BONUS EARNED FOR OTHER EXECUTIVE DIRECTORS
TARGETBONUS
75%CORPORATE
SCORE
0.84PERSONAL
SCORE
1.25X XTARGETBONUS
70%CORPORATE
SCORE
0.84PERSONAL
SCORE
1.25X X
The table below sets out the bonuses earned and the split between cash and deferred elements.
Executive director2017 bonus
(as % base salary)Bonus earned
£000
Of which paid in cash
(65% of bonus) £000
Of which deferred into shares
(35% of bonus) £000
Dorothy Thompson, Chief Executive, Drax Group 79% 463 301 162
Will Gardiner, Chief Financial Officer 74% 294 191 103
Andy Koss, Chief Executive, Drax Power 74% 234 152 82
No discretion was exercised by the Committee in determining the bonus outcome.
Details of deferred bonus share awards (audited information)The following deferred bonus shares, which were awarded in 2014 in respect of the 2013 annual bonus, vested in 2017.
Executive directorNumber of
shares vestingAdditional dividend
shares earnedTotal number of
shares vestingValue of vesting
(£000)
Dorothy Thompson, Chief Executive, Drax Group 21,904 1,512 23,416 80
Paul Taylor ceased to be a director on 31 December 2015 but remained an employee. His deferred bonus shares awarded in 2014 in respect of the 2013 annual bonus vested in 2017. The total number of shares which vested from those awards (including dividend shares) was 10,170 and the value of the vesting was £34,425 which was based on the share price (338.50 pence) at which the shares were subject to income tax and national insurance contributions on the vesting date.
DETAIL OF BMP INCENTIVE OUTCOMES (AUDITED INFORMATION)The vesting outcome for matching awards granted in 2015 under the BMP, which were subject to performance conditions and due to the performance conditions not being achieved, will not vest in 2018, are provided in the tables below.
Performance measureProportion
of award
Performance for threshold vesting
(15%)Performance for
maximum vestingActual
performance Vesting
Relative TSR vs FTSE 51–150 constituents 50% Median Upper quartile
Below median
0%
Performance measureProportion
of award
Performance for threshold vesting
(15%)Performance for
maximum vestingActual
performance Vesting
Average Corporate Score for 2015, 2016 and 2017 50%
Average score of 1
Average score of 1.5
Scores of 0.76, 1.30 and 0.84 = Average of 0.97 0%
No discretion was exercised by the Committee in determining the BMP outcome.
PSP AWARDS GRANTED DURING 2017The table below shows the conditional awards granted under the PSP to executive directors on 15 May 2017.
Executive directorAward as %
of salaryNumber of
shares granted(1)
Face value of awards
£000
Dorothy Thompson 175% 313,956 1,030
Will Gardiner 175% 213,326 700
Andy Koss 175% 169,567 556
Note:(1) The number of shares awarded was based on the average share price in the three day period prior to grant, which was 327.93 pence. In accordance with the PSP rules, dividend shares are awarded at the
time and in the event that awards actually vest. No dividend shares are awarded where the initial awards lapse

Drax Group plc Annual report and accounts 2017102 Drax Group plc Annual report and accounts 2017102
The performance conditions that apply to the PSP awards granted in 2017 are set out below.
Performance measureProportion
of awardPerformance for
threshold vesting
Vesting at threshold
performance
Performance for 50% vesting
(Corporate Scorecard only)
Performance for maximum vesting
Relative TSR vs FTSE 350 constituents 50% Median 25% – Upper quartile
Average Corporate Score 50% Average score of 0.75
0% Average score of 1
Average score of 1.5
Straight line vesting occurs between performance levels for both conditions. Performance for both conditions is measured over three financial years to 31 December 2019.
BMP DEFERRED AWARDS GRANTED DURING 2017The table below shows the deferred share awards granted under the BMP to executive directors on 28 March 2017 in respect of bonus earned for performance in 2016. Awards will vest after three years subject to continued service only.
Executive director
Value of deferred bonus
(£000)Number of
shares granted(1)
Dorothy Thompson 265 79,611
Will Gardiner 168 50,486
Andy Koss 133 40,130
Note:(1) The number of shares awarded was based on the average share price in the five day period prior to grant, which was 332.15 pence. In accordance with the BMP rules, dividends in respect of the deferred
shares are reinvested in additional shares, which vest when the deferred shares vest
Total pension entitlements for defined contribution schemes (audited information)Executive directors are entitled to non-contributory membership of the Group’s defined contribution pension plan, with either an employer contribution of 20% of base salary, or contributions to a personal pension, or cash in lieu of pension, or a combination of any of these up to a maximum contribution of 20% of base salary.
No director was a member of the defined benefit pension scheme.
PAYMENTS TO FORMER DIRECTORSNo other payments were made to past directors during 2017.
PAYMENTS FOR LOSS OF OFFICEDorothy Thompson ceased to be a director on 31 December 2017 and her service agreement terminated on that date. For the purpose of outstanding incentive awards under the BMP and PSP, the Committee determined that Dorothy should be treated as a good leaver. Upon leaving the Company she received the following payments which were in line with the provisions of her service agreement and the Company’s Remuneration Policy which was approved by shareholders at the 2017 Annual General Meeting:
– In accordance with the relevant provisions of her service agreement, payment in lieu of the residual part of the period of 12 months’ notice commencing on 1 January 2018 and terminating on 20 September 2018, in respect of salary, pension payments and contractual benefits (the “PILON payment”). In accordance with the terms of the service agreement, the PILON payment will be made in instalments, with an initial payment of 50% of the PILON payment paid within 30 days of the termination date, a second instalment of 25% to be paid within six months of the termination date and a third instalment of 25% to be paid within nine months of the termination date;
– Annual bonus in respect of 2017 was determined in accordance with the Remuneration Policy. It is payable in early 2018 and totals £463,300. 35% of this bonus awarded for 2017 will be deferred as an award under the Deferred Share Plan (DSP) and will vest in accordance with the rules of the DSP;
– Annual bonus in respect of the unworked period of notice (1 January 2018 to 20 September 2018) will, in accordance with the service agreement and the Remuneration Policy, be determined (and will be payable in early 2019). 35% of any such bonus will be deferred as an award under the DSP and will vest in accordance with the rules of the DSP;
– Deferred bonus awards granted in 2015, 2016 and 2017 will vest in accordance with the leaver provisions of the BMP, pro-rated to the date on which employment ceased. A total of 110,667 shares will vest, as soon as practicable, with a sufficient number being sold to meet income tax and National Insurance Contributions. The value of these shares based on a share price of £2.706 as at 29 December 2017 is £299,465;
– Pro-rata vesting of performance related BMP and PSP Awards made in 2016 and 2017 to the extent that any such awards vest, subject to fulfilling performance conditions, in accordance with the rules of the BMP and PSP. These awards will vest at the normal vesting date. The PSP awards are subject to a two year post-vesting holding period in accordance with the remuneration policy and the PSP rules . A total of 216,340 shares including dividend shares were outstanding as at 31 December 2017. An estimated maximum value of these based on the closing share price on 29 December 2017 of £2.706 is 585,416; and
– Long term incentive awards will remain subject to malus and clawback provisions.
REMUNERATION COMMITTEE REPORT CONTINUED
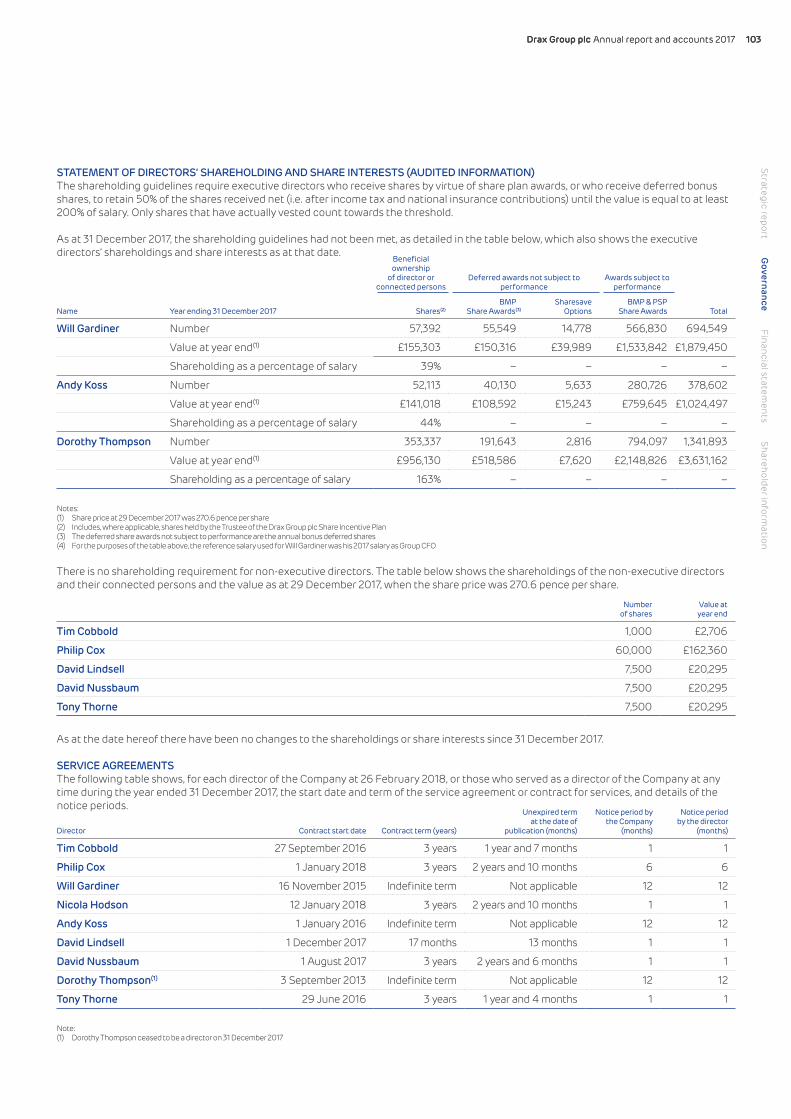
Drax Group plc Annual report and accounts 2017 103Drax Group plc Annual report and accounts 2017 103Strategic report
Governance
Financial statements
Shareholder information
STATEMENT OF DIRECTORS’ SHAREHOLDING AND SHARE INTERESTS (AUDITED INFORMATION)The shareholding guidelines require executive directors who receive shares by virtue of share plan awards, or who receive deferred bonus shares, to retain 50% of the shares received net (i.e. after income tax and national insurance contributions) until the value is equal to at least 200% of salary. Only shares that have actually vested count towards the threshold.
As at 31 December 2017, the shareholding guidelines had not been met, as detailed in the table below, which also shows the executive directors’ shareholdings and share interests as at that date.
Beneficial ownership
of director or connected persons
Deferred awards not subject to performance
Awards subject to performance
Name Year ending 31 December 2017 Shares(2)BMP
Share Awards(3)Sharesave
Options BMP & PSP
Share Awards Total
Will Gardiner Number 57,392 55,549 14,778 566,830 694,549
Value at year end(1) £155,303 £150,316 £39,989 £1,533,842 £1,879,450
Shareholding as a percentage of salary 39% – – – –
Andy Koss Number 52,113 40,130 5,633 280,726 378,602
Value at year end(1) £141,018 £108,592 £15,243 £759,645 £1,024,497
Shareholding as a percentage of salary 44% – – – –
Dorothy Thompson Number 353,337 191,643 2,816 794,097 1,341,893
Value at year end(1) £956,130 £518,586 £7,620 £2,148,826 £3,631,162
Shareholding as a percentage of salary 163% – – – –
Notes:(1) Share price at 29 December 2017 was 270.6 pence per share (2) Includes, where applicable, shares held by the Trustee of the Drax Group plc Share Incentive Plan(3) The deferred share awards not subject to performance are the annual bonus deferred shares (4) For the purposes of the table above, the reference salary used for Will Gardiner was his 2017 salary as Group CFO
There is no shareholding requirement for non-executive directors. The table below shows the shareholdings of the non-executive directors and their connected persons and the value as at 29 December 2017, when the share price was 270.6 pence per share.
Numberof shares
Value atyear end
Tim Cobbold 1,000 £2,706
Philip Cox 60,000 £162,360
David Lindsell 7,500 £20,295
David Nussbaum 7,500 £20,295
Tony Thorne 7,500 £20,295
As at the date hereof there have been no changes to the shareholdings or share interests since 31 December 2017.
SERVICE AGREEMENTSThe following table shows, for each director of the Company at 26 February 2018, or those who served as a director of the Company at any time during the year ended 31 December 2017, the start date and term of the service agreement or contract for services, and details of the notice periods.
Director Contract start date Contract term (years)
Unexpired termat the date of
publication (months)
Notice period by the Company
(months)
Notice periodby the director
(months)
Tim Cobbold 27 September 2016 3 years 1 year and 7 months 1 1
Philip Cox 1 January 2018 3 years 2 years and 10 months 6 6
Will Gardiner 16 November 2015 Indefinite term Not applicable 12 12
Nicola Hodson 12 January 2018 3 years 2 years and 10 months 1 1
Andy Koss 1 January 2016 Indefinite term Not applicable 12 12
David Lindsell 1 December 2017 17 months 13 months 1 1
David Nussbaum 1 August 2017 3 years 2 years and 6 months 1 1
Dorothy Thompson(1) 3 September 2013 Indefinite term Not applicable 12 12
Tony Thorne 29 June 2016 3 years 1 year and 4 months 1 1
Note:(1) Dorothy Thompson ceased to be a director on 31 December 2017

Drax Group plc Annual report and accounts 2017104 Drax Group plc Annual report and accounts 2017104
DRAX NINE-YEAR TSR DATA TO 31 DECEMBER 2017The following graph shows how the value of £100 invested in both the Company and the FTSE 350 Index on 31 December 2008 has changed. This index has been chosen as a suitable broad comparator against which the Company’s shareholders may judge their relative returns given that, in recent years, the Company has been a member of the FTSE 350 Index. The graph reflects the TSR (determined according to usual market practice) for the Company and the index referred to on a cumulative basis over the period from 31 December 2008 to 31 December 2017.
0
50
100
150
200
250
300
Drax FTSE 350
31 Dec2008
31 Dec2009
31 Dec2010
31 Dec2011
31 Dec2012
31 Dec2013
31 Dec2014
31 Dec2015
31 Dec2016
31 Dec2017
£
GROUP CHIEF EXECUTIVE OFFICER’S PAY IN LAST NINE FINANCIAL YEARS
Year 2009 2010 2011 2012 2013 2014 2015 2016 2017
Dorothy Thompson’s total single figure (£000) 903 1,155 1,196 1,406 3,360 1,854 1,248 1,595 1,236
Bonus % of maximum awarded 77% 100% 100% 100% 100% 73% 46% 88% 53%
BMP Matching Award % of maximum vesting – – – – 40.52% 21.66% 15.43% 0%
PERCENTAGE CHANGE IN THE GROUP CHIEF EXECUTIVE OFFICER’S REMUNERATION COMPARED WITH THE WIDER EMPLOYEE POPULATION The table below shows how the percentage change in the Group CEO’s salary, benefits and bonus between 2016 and 2017 compares with the percentage change in the average of each of those components of pay for a group of employees. The Committee has selected all Group employees below executive director level based in the UK, as these are the vast majority of Group employees and provide the most appropriate comparator.
Bonus
Salary Taxable benefits £000
Percentage increase
Percentage increase 2016 2017 % increase
Dorothy Thompson 0% 2.7% 755.7 463.3 –38.7%
Average for UK employees 2.7% 0.7% 6.6 4.3 %
RELATIVE IMPORTANCE OF SPEND ON PAYThe table below illustrates the relative importance of spend on pay compared to other disbursements from profit, namely distributions to shareholders and capital expenditure. These were the most significant outgoings from the Company in the last financial year, other than normal operating costs.
Notes:(1) Remuneration 2016 see note 6.1(2) Capital expenditure 2016 see note 3.1(3) Dividends 2017 see note 2.9
0 £50,000.000 £100,000,000 £150,000,000 £200,000,000
Dividends – 2016(3)
Dividends – 2017
Capital expenditure – 2016(2)
Capital expenditure – 2017
Remuneration – 2016(1)
Remuneration – 2017 £137.1m
£180.6m
£50.0m
£11.0m
£96.4m
£99.9m
Notes:(1) Remuneration 2017 see note 6.1 (2) Capital expenditure 2017 see note 3.1 (3) Dividends 2017 see note 2.9
REMUNERATION COMMITTEE REPORT CONTINUED

Drax Group plc Annual report and accounts 2017 105Drax Group plc Annual report and accounts 2017 105Strategic report
Governance
Financial statements
Shareholder information
STATEMENT OF IMPLEMENTATION OF THE REMUNERATION POLICY IN 2018 The remuneration policy will be implemented following its approval by shareholders at the AGM in April 2018 as follows:
The Committee will review salaries in accordance with the Policy and will take account of the increase in base pay of the collective bargaining group and other salary reviews in the Group.
CORPORATE SCORECARDThe Corporate Scorecard measures and targets for 2018 have been established for the Group and for each Group business. Details of performance against the measures will be disclosed in the 2018 Annual Report on Remuneration so far as possible, whilst maintaining commercial confidentiality.
The following table sets out the categories and a description of the measures.
Target Reasons for use
Group
Safety
TRIR The same target as previous years, focused on reducing the number of safety-related incidents, measured using the Total Recordable Incident Rate
Finance & strategy
Group EBITDA EBITDA is our principle financial metric, measuring the underlying performance of each business and the Group
Group Net Debt We use net debt as a key indicator of cash generation and effective capital allocation
Progress on delivering strategy This target focuses on project delivery, including 30% self-supply of pellets, development of new generation capacity and implementation of digital capabilities
Sustainability
People, reputation & responsibility By combining several KPIs into a single target we will seek to improve sustainability across all of our activities and businesses
DRAX BIOMASS
Fines at disport The same target as previous years, our focus remains on improving the quality of biomass pellets measured as the percentage of fines in each shipment
Cost of production Reducing the cost of production will make a positive contribution to the Group’s financial performance, in 2018 and beyond
DRAX POWER
Biomass unit technical availability Revenues from biomass units are key drivers of profitability; by maximising availability we maximise profit opportunities
Value from flexibility This targets the financial value we expect from providing flexible support services to the UK electricity grid
B2B Energy Supply
Cost to serve customers By reducing cost to serve we will increase the efficiency and effectiveness of our energy supply operations
Quality of business This target will focus on the gross margin derived from each unit of power we sell to customers
Growth in market share By growing market share, whilst controlling costs and improving margins, we expect to increase profit from the Energy Supply business
PERFORMANCE MEASURES FOR PERFORMANCE SHARE PLANThe performance measures to be used in 2018 PSP awards are as described on page 90 in the remuneration policy report.
NON-EXECUTIVE DIRECTORS’ FEESNon-executive directors’ fees will be reviewed by the Chairman and executive directors in July 2018.

Drax Group plc Annual report and accounts 2017106 Drax Group plc Annual report and accounts 2017106
SHAREHOLDER VOTING The table below shows the voting outcome for the remuneration policy and the Annual Report on Remuneration at the AGM on 13 April 2017.
For Against Total Votes withheld
Name Shares % Shares % Shares % Shares
Approval of the directors’ remuneration policy 275,998,273 77.03 82,299,718 22.97 358,297,991 100 1,496,815
Approval of the annual report on remuneration 234,597,094 66.35 118,991,937 33.65 353,589,031 100 6,205,774
The remuneration policy and the 2016 Directors’ Remuneration Report were approved by the majority of shareholders but there was a significant minority of shares voted against, particularly against the Remuneration Report. We had consulted on the new policy with the major holders of the issued share capital, representing a significant majority of the shares. Most of these investors were supportive, but not all. Feedback from investors, particularly those who did not support either or both the report and the policy, has been considered by the Remuneration Committee. Further discussion will take place with investors as part of an ongoing programme.
COMMITTEE ACTIVITY AND KEY DECISIONS IN 2017 Matters considered and decisions reached by the Committee in 2017 are shown in the table below:
January Considered the report of shareholder consultation in respect of the 2017 Remuneration Policy.
Approved the remuneration package for the new Director of Corporate Affairs.
February Considered the 2016 balanced Corporate Scorecard and decided not to exercise its discretion to adjust the score.
Adopted the 2016 balanced Corporate Scorecard for the purpose of determining relevant aspects of 2016 remuneration.
Approved executive director and senior staff personal scores and annual bonus awards for 2016.
Approved the Group Chief Executive’s personal score and annual bonus award for 2016.
Approved the vesting of the 2014 BMP awards, which was reported in the 2017 Annual Report on Remuneration.
Considered and approved the 2016 Annual Report on Remuneration.
Approved the operation of the all-employee Sharesave Share Plan in 2017.
Approved the Deferred Share Plan and Performance Share Plan.
March Approved the Long Term Incentive awards for 2017 for senior management below Board.
Noted the bonus awards to senior management below Executive Committee member level
Approved a proposal for members of the Executive Committee and senior staff salary review.
June Agreed revised remuneration for Jonathan Kini.
September Approved the remuneration terms for the outgoing Group CEO.Approved the remuneration package for the incoming Group CEO.
November Noted the performance status of outstanding share plans and approved in principle the operation of share plans in 2017.
Considered and approved the implementation of the new HR strategy.
Reviewed the fees paid to PricewaterhouseCoopers LLP (PwC) as, the Committee’s remuneration adviser, together with fees paid by the Group to PwC for other matters, and reviewed PwC’s independence.
In 2017, the members of the Remuneration Committee were Tony Thorne, Chairman of the Committee; Tim Cobbold; Philip Cox; David Lindsell; and David Nussbaum (from 1 August 2017), all of whom are independent non-executive directors. The Group Company Secretary was Secretary to the Committee.
The Group CEO was invited to attend meetings of the Committee, except when her own remuneration was discussed.
The Committee met on six occasions during the year and its members’ attendance record is set out on page 81, along with details of other attendees.
REMUNERATION COMMITTEE REPORT CONTINUED

Drax Group plc Annual report and accounts 2017 107Drax Group plc Annual report and accounts 2017 107Strategic report
Governance
Financial statements
Shareholder information
ADVISER TO THE COMMITTEEThe adviser to the Committee for the year was PwC. PwC is an independent adviser appointed by the Committee in October 2010, following a competitive tender process, to advise on market practice and remuneration of executive and non-executive directors . PwC is a member of the Remuneration Consultants Group and a signatory to its Code of Conduct. In addition, the Committee has satisfied itself that the advice it receives is objective and independent as PwC has confirmed there are no conflicts of interest.
From time to time the Group engages PwC to provide financial, taxation and related advice on specific matters. The Committee will continue to monitor such engagements in order to be satisfied that they do not affect PwC’s independence as an adviser to the Committee.
PwC was paid £233,000 during 2017 in respect of advice given to the Committee.
The Committee also considers the views of the Group Chief Executive regarding the performance and remuneration of the other executive directors and senior staff.
During 2017, the Committee has also been advised by David McCallum, the Group Company Secretary, and Samantha Brook, Head of Corporate HR.
OTHER MATTERSWider employee populationThe average pensionable pay of an executive director is 12.8 times the average of pensionable pay for all UK employees within the Group.
Past directorsPaul Taylor ceased to be a director on 31 December 2015, but he continued in employment on a part-time basis until 31 December 2017 and received a salary in respect of this role.
Remuneration received from external appointmentsRemuneration received by executive directors for service as a non-executive director elsewhere is retained by the director. Detailed below is the remuneration they received.
Fees received
Name External organisation 2016 2017
Dorothy Thompson Court of the Bank of England £15,000 £15,000
Dorothy Thompson Eaton Corporation plc (appointed 29 July 2016) £58,000 £122,873
This report was reviewed and approved by the Remuneration Committee on 26 February 2018.
TONY THORNECHAIRMAN OF THE REMUNERATION COMMITTEE

Drax Group plc Annual report and accounts 2017108 Drax Group plc Annual report and accounts 2017108
DIRECTORS’ REPORT
This report contains information which the Company is obliged to disclose and which cannot be found in the strategic, financial, sustainability or corporate governance reports of this document.
The directors present their annual report on the affairs of the Group, together with the financial statements and auditor’s report for the year ended 31 December 2017. The directors’ report required under the Companies Act 2006 is comprised of this Report, the CorporateGovernance Report and the Audit, Nomination and Remuneration Committee Reports.
The 2021 T-4 capacity market auction closed in February 2018. This Post-balance sheet event has not changed the estimates included in the financial statements. Full details are disclosed in note 5.3 on page 150. Since the year end, we have also announced the closure of our Atlanta office. Details are disclosed in note 5.4 on page 152. An indication of likely future developments in the business of the Company and details of research and development activities are included in the Strategic report on pages 1–57.
Information about the use of financial instruments by the Company and its subsidiaries is given in note 7.2 to the consolidated financial statements.
ANNUAL GENERAL MEETING (AGM)The AGM will be held at 11.30am on Wednesday 25 April 2018 at The Grand Hotel and Spa, Station Rise, York, YO1 6GD. A separate document contains the notice convening the AGM and includes an explanation of the business to be conducted at the meeting.
DIVIDENDSAn interim dividend of 4.9 pence per share was paid on 6 October 2017, to shareholders on the register on 22 September 2017.
The directors propose a final dividend of 7.4 pence per share, which will, subject to approval by shareholders at the AGM, be paid on 11 May 2018, to shareholders on the register on 20 April 2018.
Details of past dividends can be found on the Company’s website at www.drax.com/investors/financial-history/#dividend-history.
No shareholder has waived or agreed to waive dividends payable in the year or in future years.
SHARE CAPITALThe Company has only one class of equity shares, which are ordinary shares of 11 16⁄29 pence each. There are no restrictions on the voting rights of the ordinary shares.
Drax Group plc has a Premium Listing on the London Stock Exchange and currently trades as part of the FTSE 250 Index, under the symbol DRX and with the ISIN number GB00B1VNSX38.
SHARES IN ISSUE
At 1 January 2017 406,700,321
Issued in period through the Bonus Matching Plan(1) 293,057
Issued in period through the Sharesave Plan(2) 41,051
At 31 December 2017 407,034,429
Issued between 1 January and 26 February 2018 through the Sharesave Plan 467
At 26 February 2018 407,034,896
Notes:(1) 64 members of the Bonus Matching Plan with performance related awards had shares vest at
the third anniversary following the award and two members of the Bonus Matching Plan had deferred awards vest early
(2) 15 members of the Sharesave Plan exercised their options early upon retirement or redundancy
No other ordinary shares were issued during the year and the Company held no treasury shares during 2017. The position remains the same at the date of this report.
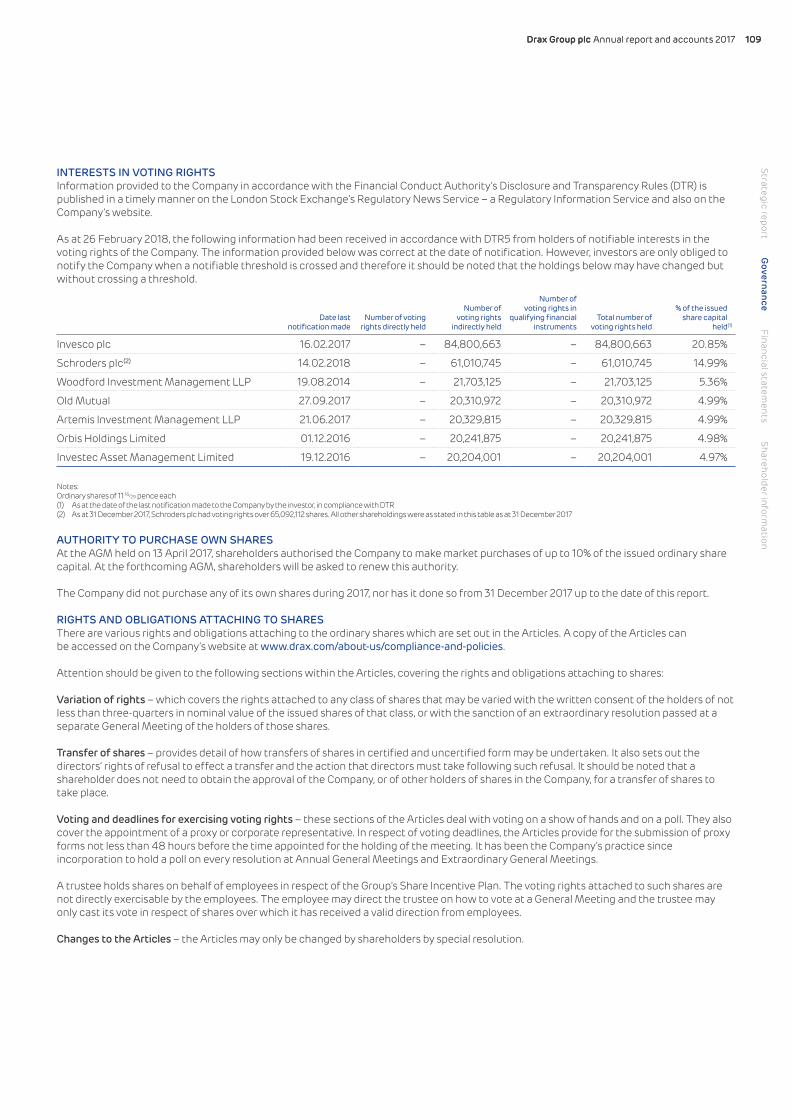
Drax Group plc Annual report and accounts 2017 109Drax Group plc Annual report and accounts 2017 109
INTERESTS IN VOTING RIGHTSInformation provided to the Company in accordance with the Financial Conduct Authority’s Disclosure and Transparency Rules (DTR) is published in a timely manner on the London Stock Exchange’s Regulatory News Service – a Regulatory Information Service and also on the Company’s website.
As at 26 February 2018, the following information had been received in accordance with DTR5 from holders of notifiable interests in the voting rights of the Company. The information provided below was correct at the date of notification. However, investors are only obliged to notify the Company when a notifiable threshold is crossed and therefore it should be noted that the holdings below may have changed but without crossing a threshold.
Date last notification made
Number of voting rights directly held
Number ofvoting rights
indirectly held
Number of voting rights in
qualifying financial instruments
Total number of voting rights held
% of the issued share capital
held(1)
Invesco plc 16.02.2017 – 84,800,663 – 84,800,663 20.85%
Schroders plc(2) 14.02.2018 – 61,010,745 – 61,010,745 14.99%
Woodford Investment Management LLP 19.08.2014 – 21,703,125 – 21,703,125 5.36%
Old Mutual 27.09.2017 – 20,310,972 – 20,310,972 4.99%
Artemis Investment Management LLP 21.06.2017 – 20,329,815 – 20,329,815 4.99%
Orbis Holdings Limited 01.12.2016 – 20,241,875 – 20,241,875 4.98%
Investec Asset Management Limited 19.12.2016 – 20,204,001 – 20,204,001 4.97%
Notes:Ordinary shares of 11 16/29 pence each(1) As at the date of the last notification made to the Company by the investor, in compliance with DTR (2) As at 31 December 2017, Schroders plc had voting rights over 65,092,112 shares. All other shareholdings were as stated in this table as at 31 December 2017
AUTHORITY TO PURCHASE OWN SHARESAt the AGM held on 13 April 2017, shareholders authorised the Company to make market purchases of up to 10% of the issued ordinary share capital. At the forthcoming AGM, shareholders will be asked to renew this authority.
The Company did not purchase any of its own shares during 2017, nor has it done so from 31 December 2017 up to the date of this report.
RIGHTS AND OBLIGATIONS ATTACHING TO SHARESThere are various rights and obligations attaching to the ordinary shares which are set out in the Articles. A copy of the Articles can be accessed on the Company’s website at www.drax.com/about-us/compliance-and-policies.
Attention should be given to the following sections within the Articles, covering the rights and obligations attaching to shares:
Variation of rights – which covers the rights attached to any class of shares that may be varied with the written consent of the holders of not less than three-quarters in nominal value of the issued shares of that class, or with the sanction of an extraordinary resolution passed at a separate General Meeting of the holders of those shares.
Transfer of shares – provides detail of how transfers of shares in certified and uncertified form may be undertaken. It also sets out the directors’ rights of refusal to effect a transfer and the action that directors must take following such refusal. It should be noted that a shareholder does not need to obtain the approval of the Company, or of other holders of shares in the Company, for a transfer of shares to take place.
Voting and deadlines for exercising voting rights – these sections of the Articles deal with voting on a show of hands and on a poll. They also cover the appointment of a proxy or corporate representative. In respect of voting deadlines, the Articles provide for the submission of proxy forms not less than 48 hours before the time appointed for the holding of the meeting. It has been the Company’s practice since incorporation to hold a poll on every resolution at Annual General Meetings and Extraordinary General Meetings.
A trustee holds shares on behalf of employees in respect of the Group’s Share Incentive Plan. The voting rights attached to such shares are not directly exercisable by the employees. The employee may direct the trustee on how to vote at a General Meeting and the trustee may only cast its vote in respect of shares over which it has received a valid direction from employees.
Changes to the Articles – the Articles may only be changed by shareholders by special resolution.
Strategic reportG
overnanceFinancial statem
entsShareholder inform
ation
Drax Group plc Annual report and accounts 2017110 Drax Group plc Annual report and accounts 2017110
OTHER SIGNIFICANT AGREEMENTSThe Group has two main financing agreements:
– A £350 million facilities agreement dated 20 December 2012 (as amended and restated on 10 December 2015 and 21 April 2017 and further amended by way of a supplemental amendment agreement dated 4 May 2017) between, amongst others, Drax Corporate Limited and Barclays Bank PLC (as facility agent) (the Facilities Agreement).
– An indenture dated 5 May 2017 between, amongst others, Drax Finco plc and BNY Mellon Corporate Trustee Services Limited (as Trustee) (the Indenture) governing (i) £350,000,000 4 ½% senior secured notes due 2022 (the Fixed Rate Notes) and £200,000,000 senior secured floating rate notes due 2022 (the Floating Rate Notes).
Under the Facilities Agreement, a change of control occurs if any person or group of persons acting in concert gains control of Drax Group plc or if Drax Group plc no longer holds directly or indirectly 100% of the issued share capital of Drax Group Holdings Limited or else if a party other than Drax Group plc becomes the beneficial owner of more than 50% of the voting rights of Drax Group plc’s direct subsidiary, Drax Group Holdings Limited. Following a change of control, if any lender requires, it may by giving notice to the relevant Group entity within 30 days of receiving notice from such Group entity that a change of control has occurred, cancel its commitments and require the repayment of its share of any outstanding amounts within three business days of such cancellation notice being given.
Under the Indenture, a change of control occurs if a party other than Drax Group plc becomes the beneficial owner of more than 50% of the voting rights of Drax Group plc’s direct subsidiary, Drax Group Holdings Limited, or else if all or substantially all of the assets of Drax Group Holdings Limited are disposed outside of the Drax corporate group. No later than 60 days after any change of control, Drax Group Holdings must offer to purchase any outstanding Fixed Rate Notes and Floating Rate Notes at 101% of the principal amount of such notes plus accrued interest and other unpaid amounts.
There are no other significant agreements to which the Group is a party that take effect, alter or terminate upon a change of control of the Group following a takeover bid.
STRATEGIC REPORTThe Strategic report on pages 1–57 contains disclosures in relation to employee participation, Greenhouse Gas emissions and third party indemnity provisions for which the Company is responsible.
DISABLED EMPLOYEESApplications for employment by disabled persons are always fully considered, bearing in mind the aptitudes of the applicant concerned.
In the event of members of staff becoming disabled, every effort is made to ensure that their employment with the Group continues, and that appropriate training is arranged. It is the policy of the Group that the training, career development and promotion of disabled persons should, so far as possible, be identical to that of other employees.
AUDITORS AND THE DISCLOSURE OF INFORMATION TO THE AUDITORSo far as each person serving as a director at the date of approving this report is aware, there is no relevant audit information, being information needed by the auditor in connection with preparing the report, of which the auditor is unaware. Having made enquiries of fellow directors, each director has taken all steps that he/she ought to have taken as a director to ascertain any relevant audit information and to establish that the auditor is aware of that information. This information is given and should be interpreted in accordance with the provisions of Section 418 of the Companies Act.
Resolutions will be proposed at the AGM for (i) the reappointment of Deloitte LLP as the auditor of the Group; and (ii) authorising the directors to determine the auditor’s remuneration. As explained, the Audit Committee reviews the appointment of the auditor, the auditor’s effectiveness and its relationship with the Group, including the level of audit and non-audit fees paid to the auditor. Further details on the work of the auditor and the Audit Committee are set out in the Audit Committee report on pages 76–80.
The directors’ report was approved by the Board on 26 February 2018 and is signed on its behalf by:
DAVID MCCALLUMGROUP COMPANY SECRETARY
Registered office:Drax Power StationSelbyNorth YorkshireYO8 8PH
DIRECTORS’ REPORT CONTINUED
Drax Group plc Annual report and accounts 2017 111Drax Group plc Annual report and accounts 2017 111
The directors are responsible for preparing the Annual report and the financial statements in accordance with applicable law and regulations.
Company law requires the directors to prepare financial statements for each financial year. Under that law the directors are required to prepare the Group financial statements in accordance with International Financial Reporting Standards (IFRSs) as adopted by the European Union and Article 4 of the IAS Regulation and have elected to prepare the Parent Company financial statements in accordance with United Kingdom Generally Accepted Accounting Practice (United Kingdom Accounting Standards and applicable law), set out in FRS 101 “Reduced Disclosure Framework”. Under company law the directors must not approve the accounts unless they are satisfied that they give a true and fair view of the state of affairs of the Company and of the profit or loss of the Company for that period.
In preparing the Parent Company financial statements, the directors are required to: – select suitable accounting policies and then apply them consistently; – make judgements and accounting estimates that are reasonable and prudent; – state whether applicable UK Accounting Standards have been followed, subject to any material departures disclosed and explained
in the financial statements; and – prepare the financial statements on the going concern basis unless it is inappropriate to presume that the Company will continue
in business.
In preparing the Group financial statements, International Accounting Standard 1 requires that directors: – properly select and apply accounting policies; – present information, including accounting policies, in a manner that provides relevant, reliable, comparable and understandable
information; – provide additional disclosures when compliance with the specific requirements in IFRSs are insufficient to enable users to understand
the impact of particular transactions, other events and conditions on the entity’s financial position and financial performance; and – make an assessment of the Company’s ability to continue as a going concern.
The directors are responsible for keeping adequate accounting records that are sufficient to show and explain the Company’s transactions and disclose with reasonable accuracy at any time the financial position of the Company and enable them to ensure that the financial statements comply with the Companies Act 2006. They are also responsible for safeguarding the assets of the Company and hence for taking reasonable steps for the prevention and detection of fraud and other irregularities.
The directors are responsible for the maintenance and integrity of the corporate and financial information included on the Company’s website. Legislation in the United Kingdom governing the preparation and dissemination of financial statements may differ from legislation in other jurisdictions.
RESPONSIBILITY STATEMENTWe confirm that to the best of our knowledge: – the financial statements, prepared in accordance with the relevant financial reporting framework, give a true and fair view of the assets,
liabilities, financial position and profit or loss of the Company and the undertakings included in the consolidation taken as a whole; – the Strategic report includes a fair review of the development and performance of the business and the position of the Company and the
undertakings included in the consolidation taken as a whole, together with a description of the principal risks and uncertainties that they face; and
– the annual report and financial statements, taken as a whole, are fair, balanced and understandable and provide the information necessary for shareholders to assess the Company’s performance, business model and strategy.
This responsibility statement was approved by the Board of directors on 26 February 2018 and is signed on its behalf by:
WILL GARDINERCHIEF EXECUTIVE, DRAX GROUP
DIRECTORS’ RESPONSIBILITIES STATEMENT
Strategic reportG
overnanceFinancial statem
entsShareholder inform
ation
Drax Group plc Annual report and accounts 2017112
REPORT ON THE AUDIT OF THE FINANCIAL STATEMENTSOpinionIn our opinion:
– the financial statements give a true and fair view of the state of the group’s and of the parent company’s affairs as at 31 December 2017 and of the group’s loss for the year then ended;
– the group financial statements have been properly prepared in accordance with International Financial Reporting Standards (IFRSs) as adopted by the European Union;
– the parent company financial statements have been properly prepared in accordance with United Kingdom Generally Accepted Accounting Practice including Financial Reporting Standard 101 “Reduced Disclosure Framework”; and
– the financial statements have been prepared in accordance with the requirements of the Companies Act 2006 and, as regards the group financial statements, Article 4 of the IAS Regulation.
We have audited the financial statements of Drax Group plc (the "parent company") and its subsidiaries ("the group") which comprise:
– the consolidated income statement; – the consolidated statement of comprehensive income; – the consolidated and parent company balance sheets; – the consolidated and parent company statements of changes in equity; – the consolidated cash flow statement; – the basis of preparation and statement of accounting policies; – the related group notes 2.1 to 8.3; and – the related parent company notes 1 to 9
The financial reporting framework that has been applied in the preparation of the group financial statements is applicable law and IFRSs as adopted by the European Union. The financial reporting framework that has been applied in the preparation of the parent company financial statements is applicable law and United Kingdom Accounting Standards, including FRS 101 “Reduced Disclosure Framework” (United Kingdom Generally Accepted Accounting Practice).
BASIS FOR OPINIONWe conducted our audit in accordance with International Standards on Auditing (UK) (ISAs (UK)) and applicable law. Our responsibilities under those standards are further described in the auditor’s responsibilities for the audit of the financial statements section of our report.
We are independent of the group and the parent company in accordance with the ethical requirements that are relevant to our audit of the financial statements in the UK, including the FRC’s Ethical Standard as applied to listed public interest entities, and we have fulfilled our other ethical responsibilities in accordance with these requirements. We confirm that the non-audit services prohibited by the FRC’s Ethical Standard were not provided to the group or the parent company.
We believe that the audit evidence we have obtained is sufficient and appropriate to provide a basis for our opinion.
SUMMARY OF OUR AUDIT APPROACH
Key audit matters The key audit matters that we identified in the current year were: – Asset impairment of Drax Power – Valuation of commodity and foreign exchange contracts – Estimation of retail unbilled revenue
Within this report, any new key audit matters are identified with and any key audit matters which are the same as the prior year identified with
Materiality The materiality that we used for the group financial statements was £6.8m (2016: £4.2m). This was determined on a blended basis taking into consideration a number of available metrics, with particular focus on Earnings before Interest, Taxation, Depreciation and Amortisation (EBITDA) and excluding unrealised gains or losses on derivative contracts and material one-off items, as this measure is of direct relevance to readers of the financial statements. Our selected materiality represents approximately 3% of EBITDA for the year.
Scoping We focused our group audit scope primarily on the audit work at four locations, being Drax Power, Haven Power, Opus Energy and Drax Biomass. All of these were subject to a full scope audit. These four locations represent the principal business units and account for virtually all of the group’s net assets, revenue and profit before tax.
Significant changes in our approach
We have completed the audit of Opus Energy for the first time, following its acquisition by the Group in February 2017. Other aspects of our audit approach remain broadly consistent to the prior year but we have continued to refine our key audit matters as detailed below.
INDEPENDENT AUDITOR’S REPORT TO THE MEMBERS OF DRAX GROUP PLC

Drax Group plc Annual report and accounts 2017 113
CONCLUSIONS RELATING TO GOING CONCERN, PRINCIPAL RISKS AND VIABILITY STATEMENT
Going concernWe have reviewed the directors’ statement on page 119 to the financial statements about whether they considered it appropriate to adopt the going concern basis of accounting in preparing them and their identification of any material uncertainties to the group’s and company’s ability to continue to do so over a period of at least 12 months from the date of approval of the financial statements.
We are required to state whether we have anything material to add or draw attention to in relation to that statement required by Listing Rule 9.8.6R(3) and report if the statement is materially inconsistent with our knowledge obtained in the audit.
We confirm that we have nothing material to report, add or draw attention to in respect of these matters.
Principal risks and viability statementBased solely on reading the directors’ statements and considering whether they were consistent with the knowledge we obtained in the course of the audit, including the knowledge obtained in the evaluation of the directors’ assessment of the group’s and the company’s ability to continue as a going concern, we are required to state whether we have anything material to add or draw attention to in relation to: – the disclosures on pages 51–57 that describe the principal risks and explain how they are being
managed or mitigated; – the directors' confirmation on page 111 that they have carried out a robust assessment of the principal
risks facing the group, including those that would threaten its business model, future performance, solvency or liquidity; or
– the directors’ explanation on page 50 as to how they have assessed the prospects of the group, over what period they have done so and why they consider that period to be appropriate, and their statement as to whether they have a reasonable expectation that the group will be able to continue in operation and meet its liabilities as they fall due over the period of their assessment, including any related disclosures drawing attention to any necessary qualifications or assumptions.
We are also required to report whether the directors’ statement relating to the prospects of the group required by Listing Rule 9.8.6R(3) is materially inconsistent with our knowledge obtained in the audit.
We confirm that we have nothing material to report, add or draw attention to in respect of these matters.
KEY AUDIT MATTERSKey audit matters are those matters that, in our professional judgement, were of most significance in our audit of the financial statements for the current period and include the most significant assessed risks of material misstatement (whether or not due to fraud) that we identified. These matters included those which had the greatest effect on: the overall audit strategy, the allocation of resources in the audit; and directing the efforts of the engagement team.
These matters were addressed in the context of our audit of the financial statements as a whole, and in forming our opinion thereon, and we do not provide a separate opinion on these matters.
We previously identified onsite biomass stocks as a key audit matter reflecting the judgement inherent in calculating the volume of biomass stocks owned by the Group. Following the reduction in biomass stock as a result of an onsite fire during December 2017, we no longer consider this to be a key audit matter.
The appropriateness of asset useful economic life assumptions is no longer considered to be a key audit matter following the reduction in the accounting lives of the coal specific assets from 1 January 2017.
The valuation and recoverability of Renewable Obligation Certificates (ROCs) is no longer considered to be a key audit matter. The ROC valuation process has historically been free from material error and it is well established.
Strategic reportG
overnanceFinancial statem
entsShareholder inform
ation
Drax Group plc Annual report and accounts 2017114
INDEPENDENT AUDITOR’S REPORT TO THE MEMBERS OF DRAX GROUP PLC CONTINUED
ASSET IMPAIRMENT OF DRAX POWER
Key audit matter description Property, plant and equipment of £1.7bn (2016: £1.6bn) is held on the balance sheet at the year end, the majority of which relates to the power generation plant. Net assets at the year end were £1.7bn (2016: £2bn) and the market capitalisation was £1.1bn (2016:£1.5bn).
Management considered indicators of impairment in respect of each Cash Generating Unit (CGU). Despite improvements in achieved spreads within key commodity markets and a period of relative stability with respect to relevant government policy, the market capitalisation of the Group continues to be below the net asset value. This is considered to be an indicator of the risk of impairment and accordingly management performed an impairment review for the Drax Power CGU in the current year, as this is the CGU which contains the majority of the Group’s assets.
As noted in the Group’s critical accounting judgements, estimates and assumptions in note 2.4 and the Audit Committee report on page 76, asset impairment has been considered a key risk by the Audit Committee. Fixed assets are disclosed in note 3.1.
The impairment testing is subject to the application of management judgement in identifying relevant CGUs and various assumptions underlying the calculation of the value in use for each CGU identified. These assumptions include the achievability of the long-term business plan. Management’s assessment also considers changes in the business which may give rise to additional CGUs, for example the acquisition of Opus Energy in February 2017.
Due to the level of management judgement involved in assessing impairment, we have identified this as a fraud risk.
The significant judgements made by management have been disclosed in note 2.4 and include: – The expected operating lives of the six generating units; – Future commodity prices beyond the horizon of existing contracted purchases, particular long-term power
prices at both baseload and peak times, and future biomass prices, particularly given that biomass is not a standardised commodity traded openly on exchanges;
– The continuance of existing biomass support regimes until 2027 and the existence of a favourable economic environment for biomass generation thereafter; and
– The discount rate applied to forecast future cashflows.
How the scope of our audit responded to the key audit matter
We evaluated the design and implementation of key controls related to asset impairment testing.
We have challenged management’s identification of CGUs, taking into consideration the independence of cash flows across key components of the business and across the power generating units.
We identified the key judgements made by management and utilised our internal valuation specialists to benchmark key market related assumptions including future commodity prices, current and future capacity and other support mechanisms and discount rates against external data where available. For example, we have compared the commodity price assumptions to the latest available Department for Business, Energy and Industrial Strategy (DBEIS) and National Grid forecasts.
We have considered the liquidity of the biomass market and the impact that Drax could have on that market as a result of the volumes of biomass it requires and its potential impact on price.
We have also challenged the underlying assumptions and significant judgements used in management’s impairment model by: – Running a range of sensitivities to assess whether an impairment would be required if a range of more
conservative assumptions were adopted; – Assessing the historical accuracy of management’s budgets and forecasts by comparing them to actual
performance; – Verifying the mathematical accuracy of the cash flow models; and – Assessing whether the disclosures in note 2.4 of the financial statements appropriately disclose the key
judgements taken so that the reader of the accounts is aware of the impact in the financial statements of changes to key assumptions that may lead to impairment.

Drax Group plc Annual report and accounts 2017 115
ASSET IMPAIRMENT OF DRAX POWER CONTINUED
Key observations We are satisfied that the discount rate is determined based on acceptable valuation methodologies. While it is lower than the ranges determined by our internal valuation specialists, increasing the discount rate to be within our range would not lead to an impairment.
Although we note that assumptions relating to long term revenues and costs are inherently difficult to assess, we believe that the assumptions used by management were reasonable, and based on the sensitivities that we performed on these assumptions, we are satisfied that no impairment is required.
VALUATION OF COMMODITY AND FOREIGN EXCHANGE CONTRACTS
Key audit matter description Unrealised losses on derivative contracts recognised in the income statement in the year are £156m (2016: unrealised gains of £177m), with related derivative assets of £366m and liabilities of £204m recognised on the balance sheet as at 31 December 2017.
The valuation of derivative contracts is complex and requires judgement in areas including the selection of appropriate valuation methodologies, and assumptions in respect of future market prices and credit risk factors.
Due to the large amount of data involved in the contract valuations, and the requirement for certain manual adjustments, we have identified a fraud risk relating to management or employees of the company valuing trades inappropriately.
Further detail of the key judgements are disclosed in the Group’s critical accounting judgements, estimates and assumptions set out on pages 119 and 120 and the Audit Committee report on pages 76 to 80. Section 7 sets out the financial risk management notes.
How the scope of our audit responded to the key audit matter
We evaluated the design and implementation and tested the operating effectiveness of key controls related to the valuation of commodity and foreign exchange contracts.
We used our internal financial instrument specialists to test management’s key judgements and calculations, including testing a sample of trades undertaken to trade tickets, confirming key contractual terms such as volumes and contracted prices.
We have assessed the valuation models used by management, including any manual adjustments to determine the fair value of the derivative instruments and performed independent valuations across a sample of both commodity and foreign exchange contracts.
We have analysed the appropriateness of management’s forward price curve assumptions by benchmarking these to third party sources and reviewed the consistency of the assumptions used across other areas of the financial statements, such as asset impairment.
We have challenged management’s approach and assumptions involved in assessing fair value adjustments such as credit risk, time value of money and spread adjustments.
Key observations From our testing, we are satisfied that the valuation of commodity and foreign exchange contracts is appropriate. We consider the valuation models used by management to be appropriate and the forward curve assumptions adopted are within an acceptable range.
Strategic reportG
overnanceFinancial statem
entsShareholder inform
ation

Drax Group plc Annual report and accounts 2017116
ESTIMATION OF RETAIL UNBILLED REVENUE
Key audit matter description The recognition of retail revenue requires an estimation of customer usage between the date of the last meter reading and year end, which is known as unbilled revenue.
Across the retail division, unbilled revenue at the balance sheet date amounted to £195 million (2016: £119 million).
The method of estimating unbilled revenues is complex and judgemental and requires assumptions for both the volumes of energy consumed by customers and the related value.
We identified a fraud risk in relation to revenue recognition in the retail business, in particular to the estimates underpinning unbilled revenue as these judgement areas could be manipulated by management to mis-report revenue.
Further detail of the key judgements are disclosed in the Group’s critical accounting judgements, estimates and assumptions set out on pages 119 and 120 and the Audit Committee report on pages 76 to 80. Accrued income is disclosed in note 3.5.
How the scope of our audit responded to the key audit matter
We evaluated the design and implementation and tested the operating effectiveness of key controls related to the estimation of unbilled revenue. This included controls over the reconciliation of meter readings provided by the energy markets, and which are used by management to estimate the power supplied. We also tested the controls over the price per unit applied in the valuation of unbilled revenue.
When external market information was not available at the balance sheet date we also obtained and considered management’s reconciliation of the volume of power purchased to their calculations of revenue supplied and completed sample tests to check that the December unbilled revenue amount was subsequently billed.
We also reviewed the aggregate unbilled revenue balance from previous periods to test that the amounts recognised were subsequently billed in line with the values accrued.
Key observations Our retrospective reviews of estimated revenues found that management have historically achieved a high level of accuracy. We considered the estimates for revenue made in the year to be appropriate.
OUR APPLICATION OF MATERIALITYWe define materiality as the magnitude of misstatement in the financial statements that makes it probable that the economic decisions of a reasonably knowledgeable person would be changed or influenced. We use materiality both in planning the scope of our audit work and in evaluating the results of our work.
Based on our professional judgement, we determined materiality for the financial statements as a whole as follows:
Group financial statements Parent company financial statements
Materiality £6.8m (2016: £4.2m) £4.1m (2016: £3.8m)
Basis for determining materiality
We have determined materiality by considering a range of possible benchmarks and the figures derived from those, with a particular focus on selecting a materiality within the range that we considered appropriate. This included EBITDA (excluding unrealised gains or losses on derivative contracts and material one-off items), profit before and after interest and tax as well as the scale of the balance sheet and the overall size of the business. The increase in materiality from prior year is primarily due to the acquisition of Opus Energy.
Our selected materiality represents approximately 3% of EBITDA for the year.
We have capped materiality at 60% of the materiality identified for the Group. This is a judgement and reflects the significant value of investments held on the balance sheet at the year end (£713m).
Rationale for the benchmark applied
When determining materiality, we have considered the size and scale of the business and the nature of its operations. We have also considered which benchmarks would be of relevance to the users of the financial statements.
When determining materiality, we considered the net assets of the company as its principal activity is as an investment holding company for the Group.
INDEPENDENT AUDITOR’S REPORT TO THE MEMBERS OF DRAX GROUP PLC CONTINUED

Drax Group plc Annual report and accounts 2017 117
We agreed with the Audit Committee that we would report to the Committee all audit differences in excess of £0.3m (2016: £0.2m) for the parent company and group, as well as differences below that threshold that, in our view, warranted reporting on qualitative grounds. We also report to the Audit Committee on disclosure matters that we identified when assessing the overall presentation of the financial statements.
AN OVERVIEW OF THE SCOPE OF OUR AUDITOur group audit was scoped by obtaining an understanding of the group and its environment, including group-wide controls, and assessing the risks of material misstatement at the group level. Based on that assessment, we focused our group audit scope primarily on the audit work at four locations (2016: three locations which excludes Opus Energy which was acquired in February 2017), being Drax Power, Haven Power, Opus Energy and Drax Biomass. All of these locations were subject to a full scope audit and they represent the principal business units and account for virtually all of the group’s net assets, revenue and profit before tax, in line with 2016. They were also selected to provide an appropriate basis for undertaking audit work to address the risks of material misstatement identified above. Our audit work at four locations was executed at levels of materiality applicable to each individual entity which were lower than group materiality and ranged from £3.5 million to £5.2 million (2015: £2.1 million to £3.8 million).
At the parent company level we also tested the consolidation process and carried out analytical procedures to confirm our conclusion that there were no significant risks of material misstatement of the aggregated financial information of the remaining components not subject to audit or audit of specified account balances.
During 2017 the Senior Statutory Auditor visited two of the four key locations being Drax Power and Drax Biomass, and other senior team members visited the remaining two.
OTHER INFORMATION
Our opinion on the financial statements does not cover the other information and, except to the extent otherwise explicitly stated in our report, we do not express any form of assurance conclusion thereon.
In connection with our audit of the financial statements, our responsibility is to read the other information and, in doing so, consider whether the other information is materially inconsistent with the financial statements or our knowledge obtained in the audit or otherwise appears to be materially misstated.
If we identify such material inconsistencies or apparent material misstatements, we are required to determine whether there is a material misstatement in the financial statements or a material misstatement of the other information. If, based on the work we have performed, we conclude that there is a material misstatement of this other information, we are required to report that fact.
In this context, matters that we are specifically required to report to you as uncorrected material misstatements of the other information include where we conclude that: – Fair, balanced and understandable – the statement given by the directors that they consider the annual
report and financial statements taken as a whole is fair, balanced and understandable and provides the information necessary for shareholders to assess the group’s position and performance, business model and strategy, is materially inconsistent with our knowledge obtained in the audit; or
– Audit committee reporting – the section describing the work of the audit committee does not appropriately address matters communicated by us to the audit committee; or
– Directors’ statement of compliance with the UK Corporate Governance Code – the parts of the directors’ statement required under the Listing Rules relating to the company’s compliance with the UK Corporate Governance Code containing provisions specified for review by the auditor in accordance with Listing Rule 9.8.10R(2) do not properly disclose a departure from a relevant provision of the UK Corporate Governance Code.
We have nothing to report in respect of these matters
RESPONSIBILITIES OF DIRECTORSAs explained more fully in the directors’ responsibilities statement, the directors are responsible for the preparation of the financial statements and for being satisfied that they give a true and fair view, and for such internal control as the directors determine is necessary to enable the preparation of financial statements that are free from material misstatement, whether due to fraud or error.
In preparing the financial statements, the directors are responsible for assessing the group’s and the parent company’s ability to continue as a going concern, disclosing as applicable, matters related to going concern and using the going concern basis of accounting unless the directors either intend to liquidate the group or the parent company or to cease operations, or have no realistic alternative but to do so.
AUDITOR’S RESPONSIBILITIES FOR THE AUDIT OF THE FINANCIAL STATEMENTSOur objectives are to obtain reasonable assurance about whether the financial statements as a whole are free from material misstatement, whether due to fraud or error, and to issue an auditor’s report that includes our opinion. Reasonable assurance is a high level of assurance, but is not a guarantee that an audit conducted in accordance with ISAs (UK) will always detect a material misstatement when it exists. Misstatements can arise from fraud or error and are considered material if, individually or in the aggregate, they could reasonably be expected to influence the economic decisions of users taken on the basis of these financial statements.
A further description of our responsibilities for the audit of the financial statements is located on the Financial Reporting Council’s website at: www.frc.org.uk/auditorsresponsibilities. This description forms part of our auditor’s report.
Strategic reportG
overnanceFinancial statem
entsShareholder inform
ation
Drax Group plc Annual report and accounts 2017118
INDEPENDENT AUDITOR’S REPORT TO THE MEMBERS OF DRAX GROUP PLC CONTINUED
USE OF OUR REPORTThis report is made solely to the company’s members, as a body, in accordance with Chapter 3 of Part 16 of the Companies Act 2006. Our audit work has been undertaken so that we might state to the company’s members those matters we are required to state to them in an auditor’s report and for no other purpose. To the fullest extent permitted by law, we do not accept or assume responsibility to anyone other than the company and the company’s members as a body, for our audit work, for this report, or for the opinions we have formed.
REPORT ON OTHER LEGAL AND REGULATORY REQUIREMENTSOpinions on other matters prescribed by the Companies Act 2006In our opinion the part of the directors’ remuneration report to be audited has been properly prepared in accordance with the Companies Act 2006.
In our opinion, based on the work undertaken in the course of the audit: – the information given in the strategic report and the directors’ report for the financial year for which the financial statements are prepared
is consistent with the financial statements; and – the strategic report and the directors’ report have been prepared in accordance with applicable legal requirements.
In the light of the knowledge and understanding of the group and of the parent company and their environment obtained in the course of the audit, we have not identified any material misstatements in the strategic report or the directors’ report.
Matters on which we are required to report by exception
Adequacy of explanations received and accounting recordsUnder the Companies Act 2006 we are required to report to you if, in our opinion: – we have not received all the information and explanations we require for our audit; or – adequate accounting records have not been kept by the parent company, or returns adequate for our
audit have not been received from branches not visited by us; or – the parent company financial statements are not in agreement with the accounting records and
returns.
We have nothing to report in respect of these matters
Directors’ remunerationUnder the Companies Act 2006 we are also required to report if in our opinion certain disclosures of directors’ remuneration have not been made or the part of the directors’ remuneration report to be audited is not in agreement with the accounting records and returns.
We have nothing to report in respect of these matters
Other matters
Auditor tenureFollowing the recommendation of the audit committee, we were appointed at the Annual General Meeting on 13 April 2017 to audit the financial statements for the year ending 31 December 2017 and subsequent financial periods. The period of total uninterrupted engagement including previous renewals and reappointments of the firm is 13 years, covering the years ending 2005 to 2017, inclusive.
Consistency of the audit report with the additional report to the audit committeeOur audit opinion is consistent with the additional report to the audit committee we are required to provide in accordance with ISAs (UK).
James Leigh FCA (Senior statutory auditor)For and on behalf of Deloitte LLPStatutory AuditorLondon, United Kingdom
26 February 2018

Drax Group plc Annual report and accounts 2017 119
INTRODUCTION The consolidated financial statements provide detailed information about the financial performance (Consolidated income statement), financial position (Consolidated balance sheet), and cash flows (Consolidated cash flow statement) of Drax Group plc (the Company) together with all of the entities controlled by the Company (collectively, the Group).
The notes to the financial statements provide additional information on the items in the Consolidated income statement, Consolidated balance sheet and Consolidated cash flow statement. The notes include explanations of the information presented. In general, the additional information in the notes to the financial statements is required by law, International Financial Reporting Standards (IFRS) or other regulations to facilitate increased understanding of the primary statements set out on pages 122–126. BASIS OF PREPARATION The financial statements have been prepared in accordance with IFRS as adopted by the European Union and therefore the consolidated financial statements comply with Article 4 of the EU IAS Regulation and the Companies Act 2006.
The financial statements have been prepared on the historical cost basis, except for certain financial assets and liabilities (principally derivative financial instruments) that have been measured at fair value.
Foreign currency transactionsTransactions in foreign currencies are translated into Sterling at the exchange rate ruling at the date of the transaction. At each balance sheet date, monetary assets and liabilities that are denominated in foreign currencies are retranslated at the rates prevailing at that date. Non-monetary items are not retranslated.
Foreign exchange gains and losses arising on such revaluations are recognised in the income statement within finance costs.
Foreign operationsThe assets and liabilities of foreign operations with a functional currency other than Sterling are translated into Sterling using published exchange rates at the reporting date. The income and expenditure of such operations are translated into Sterling using the exchange rate prevailing at the date of the transaction. Foreign exchange gains and losses resulting from the retranslation of the operation’s net assets and its results for the year are recognised in the Consolidated statement of comprehensive income.
Going concern The Group’s business activities, along with future developments that may affect its financial performance, position and cash flows, are discussed within the Strategic report on pages 1–57 of this Annual Report. In the viability statement on page 50 the directors state that they have a reasonable expectation that the Group will be able to continue in operation and meet its liabilities as they fall due over the next three years.
Consequently, the directors also have a reasonable expectation that the Group will continue in existence for the next 12 months and, therefore, have adopted the going concern basis in preparing these financial statements.
FINANCIAL STATEMENTS
Basis of consolidation These consolidated financial statements incorporate the financial results of the Company and of all entities controlled by the Company, (its subsidiaries) made up to 31 December each year. The Company owns 100% of the equity of all subsidiaries.
The Group acquired and gained control of Opus Energy on 10 February 2017 (see note 5.1). Opus Energy's financial results from this date are included in the Group's Consolidated income statement.
The Group sold its holding in Billington Bioenergy on 31 October 2017. Billington Bioenergy's financial results, until this date, are included within the Consolidated income statement.
ACCOUNTING POLICIES The significant accounting policies for the measurement of an individual item in the financial statements are described in the note to the financial statements relating to the item concerned (see contents on page 121).
No changes have been made to accounting policies in the year.
A full listing of new standards, interpretations and pronouncements under IFRS applicable to these financial statements is presented in note 8.2. The application of these new requirements has not had a material effect on the financial statements. Note 8.2 also includes the anticipated impact of IFRS 9, 15 and 16 which will affect the financial statements in future periods.
JUDGEMENTS AND ESTIMATES The preparation of financial statements requires judgement to be applied in forming the Group’s accounting policies. It also requires the use of estimates and assumptions that affect the reported amounts of assets, liabilities, income and expenses. Actual results may differ from these estimates.
Estimates and underlying assumptions are reviewed on an ongoing basis, with revisions recognised in the period in which the estimates are revised and in any future periods affected.
The judgements involving a higher degree of estimation or complexity are set out below and in more detail, including sensitivity analysis where appropriate, in the related notes.
Critical accounting judgements The following are the critical judgements, apart from those involving estimation (which are dealt with separately below), made in the process of applying the Group's accounting policies during the year that have the most significant effect on the amounts recognised in the financial statements: Accounting treatment applied to acquisition of LaSalle pellet production assets – the Group acquired the assets at the LaSalle pellet production plant on 13 April 2017. Having assessed the circumstances, notably that the plant was acquired without employees, input or output contracts and required significant investment prior to commissioning, it was concluded that the transaction represented an asset purchase and not the acquisition of a business. Accordingly, the assets have been recognised as additions to property, plant and equipment in the year.
See note 3.1 on page 138
Strategic reportG
overnanceFinancial statem
entsShareholder inform
ation

Drax Group plc Annual report and accounts 2017120
Sources of estimation uncertaintyThe following are the sources of estimation uncertainty that carry the most significant risk of a material effect on next year's accounts – that is, the items where actual outcomes in the next 12 months could vary significantly from the estimates made in determining the reported amount of an asset or liability.
Property, plant and equipment – property, plant and equipment is depreciated on a straight-line basis over its useful economic life. Useful economic lives are estimated and based on past experience, future replacement cycles and other available evidence. Useful economic lives are reviewed annually. We reduced the useful lives of coal-specific generation assets in our Power Generation business from 1 January 2017.
See note 3.1 on page 138
Intangible assets – intangible assets acquired through the purchase of Opus Energy have been recognised at their fair value. The fair value measurement of the existing customer contracts depends on a number of assumptions, and in particular requires estimates to be made about likely margins on current customer contracts, future contract renewal rates and future margins on renewed contracts. The assets are amortised over their useful economic lives, which in the case of the customer-related assets, have also been assessed based on the future contract renewal rates. The amortisation rate will change if the assumed renewal rates differ from actual experience.
See note 5.3 on page 150
Impairment – an impairment review is conducted annually of goodwill and of other assets and cash-generating units where an indicator of possible impairment exists. In 2017, an impairment assessment has been completed for three of the Group's CGUs. The assessment of future cash flows that underpins such a review is based on management’s best estimate of future commodity prices, supply volumes and economic conditions. The calculations are particularly sensitive to changes in the assumptions applied given the long time period covered by the assessment.
See note 2.4 on page 131 and note 5.2 on page 149
Derivatives – derivative financial instruments are recorded in the Group's balance sheet at fair value. The assessment of fair value is derived from assuming a market price for the instrument in question. The Group bases its assessment of market prices upon forward curves that are largely derived from readily obtainable quotations and third party sources. However, any forward curve is based at least in part upon assumptions about future transactions and market movements. Where such instruments extend beyond the liquid portion of the forward curve, the level of estimation increases as the number of observable transactions decreases.
See note 7.2 on page 164
Revenue recognition – the nature of some of the Group’s activities, particularly within the B2B Energy Supply segment, results in revenue being based on the estimated volumes of power supplied to customers at an estimated average price per unit. Assumptions that underpin these estimates are applied consistently and comparison of past estimates to final settlements suggests a high degree of accuracy. However, actual outcomes may vary from initial estimates.
See note 2.2 on page 129
Renewable Obligation Certificates (ROCs) – ROC assets generated by the Group's Power Generation business and held in the Group’s balance sheet are stated at the lower of their deemed cost at the point of generation and expected realisable value. The calculation of this value depends upon estimates of likely future sales prices.
See note 3.3 on page 140
Pensions – the Group records a liability in its balance sheet for its obligation to provide benefits under an approved defined benefit pension scheme, less the fair value of assets held by the pension scheme. The actuarial valuation of the scheme assets and liabilities is performed annually and depends on assumptions regarding interest rates, inflation, future salary and pension increases, mortality and other factors, any of which are subject to future change.
See note 6.3 on page 156
Taxation – in accounting for both current and deferred tax the Group makes assumptions regarding the likely treatment of items of income and expenditure for tax purposes. These assumptions are based on interpretation of relevant legislation and, where required, consultation with external advisers.
See note 2.6 on page 134
ALTERNATIVE PERFORMANCE MEASURES (APMs)We present two APMs (measures without formal definition in IFRS) on the face of our income statement, EBITDA and underlying earnings, to assist users of the accounts in evaluating the comparability of the Group’s financial performance and the performance against strategic objectives.
EBITDA is defined as earnings before interest, tax, depreciation, amortisation and material one-off items that do not reflect the underlying trading performance of the business. Interest, tax, depreciation and amortisation are calculated in accordance with IFRS.
EBITDA is the primary measure used by the Board and market analysts to assess our financial performance.
The purpose of EBITDA is to provide a consistent, comparable measure of the trading performance of the Group’s businesses year on year.
Underlying earnings is defined as profit after tax, as calculated in accordance with IFRS, adjusted to exclude unrealised gains and losses on derivative contracts, which introduce volatility to IFRS measures of net profitability, and material one-off items that do not reflect the underlying performance of the business.
The purpose of underlying earnings is to provide a consistent, comparable measure of the overall financial performance of the Group’s businesses year-on-year, including costs of servicing the existing debt, allocations of the cost of non-current assets and tax.
Judgement is applied in determining transactions which are not considered to reflect the underlying trading performance of the business.
EBITDA is reconciled to both gross profit and operating profit on the face of the income statement. A reconciliation of underlying earnings to profit after tax attributable to shareholders is provided in note 2.7.
FINANCIAL STATEMENTS CONTINUED

Drax Group plc Annual report and accounts 2017 121
FINANCIAL STATEMENTS CONTENTS
SECTION 1
Consolidated financial statementsConsolidated income statement 122Consolidated statement of comprehensive income 123Consolidated balance sheet 124Consolidated statement of changes in equity 125Consolidated cash flow statement 126
SECTION 2
Financial performance2.1 Segmental reporting 1272.2 Revenue 1292.3 Operating expenses and EBITDA 1312.4 Review of fixed assets for impairment 1312.5 Net finance costs 1332.6 Current and deferred taxation 1342.7 Underlying earnings 1362.8 Earnings per share and underlying
earnings per share 1362.9 Dividends 1372.10 Retained profits 137
SECTION 3
Operating assets and working capital3.1 Property, plant and equipment 1383.2 Other fixed asset investments 1403.3 ROC assets 1403.4 Inventories 1413.5 Trade and other receivables 1423.6 Trade and other payables 143
SECTION 4
Financing and capital structure4.1 Reconciliation of net debt 1444.2 Cash and cash equivalents 1444.3 Borrowings 1444.4 Cash generated from operations 1464.5 Equity and reserves 147
SECTION 5
Other assets and liabilities5.1 Acquisitions 1485.2 Goodwill 1495.3 Intangible assets 1505.4 Provisions 152
SECTION 6
Our people6.1 Employees and directors 1536.2 Share-based payments 1536.3 Retirement benefit obligations 156
SECTION 7
Risk management7.1 Financial risk management 1617.2 Derivative financial instruments 1647.3 Other financial instruments 1667.4 Hedge reserve 1677.5 Contingent liabilities 1687.6 Commitments 168
SECTION 8
Reference information8.1 General information 1698.2 Basis of preparation 1698.3 Related party transactions 171
DRAX GROUP PLC Company financial statements 172Notes to the Company financial statements 174
Strategic reportG
overnanceFinancial statem
entsShareholder inform
ation

Drax Group plc Annual report and accounts 2017122
SECTION 1Consolidated financial statements
CONSOLIDATED INCOME STATEMENT Years ended 31 December
Notes2017
£m2016
£m
Revenue 2.2 3,685.2 2,949.8
Fuel costs in respect of power generation (1,356.8) (1,154.2)
Cost of energy purchases (974.6) (907.8)
Grid charges (498.7) (379.7)
Other energy supply costs (310.1) (131.8)
Total cost of sales (3,140.2) (2,573.5)
Gross profit 545.0 376.3
Operating and administrative expenses 2.3 (316.1) (236.3)
EBITDA(1) 2.3 228.9 140.0
Depreciation 3.1 (122.7) (109.5)
Amortisation 5.3 (43.6) –
Loss on disposal(2) (15.4) (3.8)
Unrealised (losses)/gains on derivative contracts 7.2 (156.1) 176.8
Other losses (0.4) –
Acquisition-related costs(3) 2.7 (7.8) –
Operating (loss)/profit (117.1) 203.5
Foreign exchange gains and losses 2.5 (10.6) 22.0
Cost of debt restructure(4) 2.5 (24.2) –
Interest payable and similar charges 2.5 (31.5) (29.0)
Interest receivable 2.5 0.2 0.6
(Loss)/profit before tax (183.2) 197.1
Tax:
– Before effect of changes in rate of tax 2.6 47.8 (13.0)
– Effect of changes in rate of tax 2.6 (15.7) 9.8
Total tax credit/(charge) 32.1 (3.2)
(Loss)/profit for the year attributable to equity holders (151.1) 193.9
Underlying profit after tax(5) 2.7 2.7 20.5
(Loss)/earnings per share pence pence
– Basic 2.8 (37) 48
– Diluted (37) 47
All results relate to continuing operations.
Notes: (1) EBITDA is defined as: earnings before interest, tax, depreciation, amortisation and material one-off items that do not reflect the underlying trading performance of the business(2) Loss on disposal includes a £3.6 million loss on disposal of Billington Bioenergy and losses on disposal of assets in the ordinary course of business of £11.8 million(3) Acquisition-related costs reflect costs associated with the acquisition and on-boarding of Opus Energy Group Limited into the Group(4) Cost of debt restructure are one-off costs associated with the refinancing of the Group’s debt(5) Underlying profit is defined as: profit after tax, as calculated in accordance with IFRS, adjusted to exclude unrealised gains and losses on derivative contracts and material one-off items that do not reflect
the underlying performance of the business. See page 136

Drax Group plc Annual report and accounts 2017 123
CONSOLIDATED STATEMENT OF COMPREHENSIVE INCOMEYears ended 31 December
Notes2017
£m2016
£m
(Loss)/profit for the year (151.1) 193.9
Items that will not be subsequently reclassified to profit or loss:
Actuarial gains /(losses) on defined benefit pension scheme 6.3 21.4 (8.4)
Deferred tax on actuarial gains/(losses) on defined benefit pension scheme 2.6 (4.1) 1.6
Items that may be subsequently reclassified to profit or loss:
Exchange differences on translation of foreign operations 3.4 (9.1)
Fair value (losses)/gains on cash flow hedges 7.2 (219.2) 330.1
Deferred tax on cash flow hedges before tax rate changes 2.6 39.9 (62.6)
Impact of tax rate changes on deferred tax on cash flow hedges 2.6 – 3.0
Other comprehensive (expense)/income (158.6) 254.6
Total comprehensive (expense)/income for the year attributable to equity holders (309.7) 448.5
Strategic reportG
overnanceFinancial statem
entsShareholder inform
ation

Drax Group plc Annual report and accounts 2017124
SECTION 1: CONSOLIDATED FINANCIAL STATEMENTS
CONSOLIDATED BALANCE SHEETAs at 31 December
Notes2017
£m2016
£m
Assets
Non-current assets
Goodwill 5.2 169.9 14.5
Intangible assets 5.3 232.0 21.7
Property, plant and equipment 3.1 1,661.9 1,641.5
Other fixed asset investments 3.2 1.3 –
Deferred tax assets 2.6 22.7 33.5
Derivative financial instruments 7.2 190.7 486.3
2,278.5 2,197.5
Current assets
Inventories 3.4 272.1 287.5
ROC assets 3.3 145.5 257.6
Trade and other receivables 3.5 417.5 292.9
Derivative financial instruments 7.2 175.5 405.0
Current tax assets 2.6 6.2 –
Cash and cash equivalents 4.2 222.3 228.4
1,239.1 1,471.4
Liabilities
Current liabilities
Trade and other payables 3.6 736.5 591.9
Current tax liabilities 2.6 – 6.1
Borrowings 4.3 18.6 35.9
Derivative financial instruments 7.2 109.6 251.0
864.7 884.9
Net current assets 374.4 586.5
Non-current liabilities
Borrowings 4.3 571.1 286.0
Derivative financial instruments 7.2 94.2 112.5
Provisions 5.4 36.3 35.0
Deferred tax liabilities 2.6 230.0 275.2
Retirement benefit obligations 6.3 1.2 30.1
932.8 738.8
Net assets 1,720.1 2,045.2
Shareholders’ equity
Issued equity 4.5 47.0 47.0
Capital redemption reserve 4.5 1.5 1.5
Share premium 4.5 424.3 424.2
Merger reserve 4.5 710.8 710.8
Hedge reserve 7.4 126.1 305.4
Translation reserve 4.5 (6.8) (10.2)
Retained profits 2.10 417.2 566.5
Total shareholders’ equity 1,720.1 2,045.2
The consolidated financial statements of Drax Group plc, registered number 5562053, were approved and authorised for issue by the Board of directors on 26 February 2018.
Signed on behalf of the Board of directors: Will Gardiner Chief Executive

Drax Group plc Annual report and accounts 2017 125
CONSOLIDATED STATEMENT OF CHANGES IN EQUITY
Issuedequity
£m
Capitalredemption
reserve£m
Sharepremium
£m
Mergerreserve
£m
Hedgereserve
£m
Translationreserve
£m
Retainedprofits
£mTotal
£m
At 1 January 2016 46.9 1.5 424.2 710.8 34.9 (1.1) 385.2 1,602.4
Profit for the year – – – – – – 193.9 193.9
Other comprehensive income/(expense) – – – – 270.5 (9.1) (6.8) 254.6
Total comprehensive income for the year – – – – 270.5 (9.1) 187.1 448.5
Equity dividends paid (note 2.9) – – – – – – (11.0) (11.0)
Issue of share capital (note 4.5) 0.1 – – – – – – 0.1
Movement in equity associated with share-based payments (note 6.2) – – – – – – 5.2 5.2
At 31 December 2016 47.0 1.5 424.2 710.8 305.4 (10.2) 566.5 2,045.2
Loss for the year – – – – – – (151.1) (151.1)
Other comprehensive income/(expense) – – – – (179.3) 3.4 17.3 (158.6)
Total comprehensive income/(expense) for the year – – – – (179.3) 3.4 (133.8) (309.7)
Equity dividends paid (note 2.9) – – – – – – (21.6) (21.6)
Issue of share capital (note 4.5) – – 0.1 – – – – 0.1
Movement in equity associated with share-based payments (note 6.2) – – – – – – 6.1 6.1
At 31 December 2017 47.0 1.5 424.3 710.8 126.1 (6.8) 417.2 1,720.1
Strategic reportG
overnanceFinancial statem
entsShareholder inform
ation

Drax Group plc Annual report and accounts 2017126
CONSOLIDATED CASH FLOW STATEMENTYears ended 31 December
Notes2017
£m2016
£m
Cash generated from operations 4.4 375.7 213.1
Income taxes paid (14.0) (1.7)
Other (losses)/gains (0.1) 0.7
Interest paid (46.6) (21.7)
Interest received 0.2 0.4
Net cash from operating activities 315.2 190.8
Cash flows from investing activities
Purchases of property, plant and equipment (159.0) (93.2)
Purchases of software assets (15.7) –
Acquisition of subsidiaries (379.8) –
Net cash used in investing activities (554.5) (93.2)
Cash flows from financing activities
Equity dividends paid 2.9 (21.6) (11.0)
Proceeds from issue of share capital 0.1 0.1
Repayment of borrowings (493.8) –
New borrowings drawn down 768.5 –
Other financing costs paid (17.9) –
Net cash generated from/(absorbed by) financing activities 235.3 (10.9)
Net increase/(decrease) in cash and cash equivalents (4.0) 86.7
Cash and cash equivalents at 1 January 228.4 133.8
Effect of changes in foreign exchange rates (2.1) 7.9
Cash and cash equivalents at 31 December 4.2 222.3 228.4
The Group received shares with a value of £1.6 million as part-consideration for the disposal of Billington Bioenergy during 2017. The net cash disposed of in the transaction was negligible. There were no other non-cash transactions in either the current or previous year.
SECTION 1: CONSOLIDATED FINANCIAL STATEMENTS

Drax Group plc Annual report and accounts 2017 127
SECTION 2Financial performance
The financial performance section gives further information about the items in the Consolidated income statement. It includes a summary of financial performance by each of our businesses (2.1), analysis of certain income statement items (2.2–2.6) and information regarding underlying earnings, distributable profits and dividends (2.7–2.10). Further commentary on our trading and operational performance during the year, which is predominantly reflected in EBITDA, can be found in the Strategic report on pages 1–57, with particular reference to key transactions and market conditions that have affected our results.
2.1 SEGMENTAL REPORTINGThe Group is organised into three businesses, with a dedicated management team for each and a central corporate office providing certain specialist and shared functions. Our businesses are:
– Power Generation: power generation activities in the UK, including at Drax Power Station and the development of OCGT projects; – Pellet Production: production of sustainable compressed wood pellets at our processing facilities in the US; and – B2B Energy Supply: the supply of electricity and gas to business customers in the UK.
The operating segments have been renamed to align more closely with the strategy, but are consistent with the prior year, except for changes due to business combinations as noted below. Each business is an operating segment for the purpose of segmental reporting. Information reported to the Board for the purposes of assessing performance and making investment decisions is based on these three operating segments. The measure of profit or loss for each reportable segment presented to the Board on a regular basis is EBITDA (as defined on page 120).
Operating costs are allocated to segments to the extent they are directly attributable to the activities of that segment. Corporate office costs are included within central costs.
During the year, the Group acquired 100% of the share capital of Opus Energy Group Limited (see note 5.1), an energy supply business providing electricity and gas to business customers. Opus Energy’s activities are closely-related to those of the existing B2B Energy Supply business and the B2B Energy Supply management structure has been reorganised to integrate Opus Energy into the existing structure. Financial results are reported to the Board for the larger combined business. Accordingly, this new acquisition forms part of the B2B Energy Supply segment in the year ended 31 December 2017. Note 5.1 details the additional revenue and profit attributable to the Group from the new acquisition.
As noted on page 16, the Group sold its interest in Billington Bioenergy in the year. The B2B Energy Supply segment includes £6.3 million of revenue and £0.2 million EBITDA losses in respect of this business for the 10-month period to the date of disposal.
Segment revenues and resultsThe following is an analysis of the Group’s performance by reporting segment for the year ended 31 December 2017:
Year ended 31 December 2017
Power Generation
£m
B2B Energy Supply
£m
Pellet Production
£mAdjustments(1)
£mConsolidated
£m
Revenue
External sales 1,686.2 1,999.0 – – 3,685.2
Inter-segment sales 1,033.4 – 135.7 (1,169.1) –
Total revenue 2,719.6 1,999.0 135.7 (1,169.1) 3,685.2
Segment gross profit 398.4 117.4 39.0 (9.8) 545.0
Segment EBITDA 237.5 29.4 5.5 (9.8) 262.6
Central costs (33.7)
Consolidated EBITDA 228.9
Acquisition-related costs (7.8)
Depreciation and amortisation (166.3)
Other losses (0.4)
Loss on disposal (15.4)
Unrealised losses on derivative contracts (156.1)
Operating loss (117.1)
Net finance costs (66.1)
Loss before tax (183.2)
Note:(1) Adjustments represent the elimination of intra-group transactions
Strategic reportG
overnanceFinancial statem
entsShareholder inform
ation
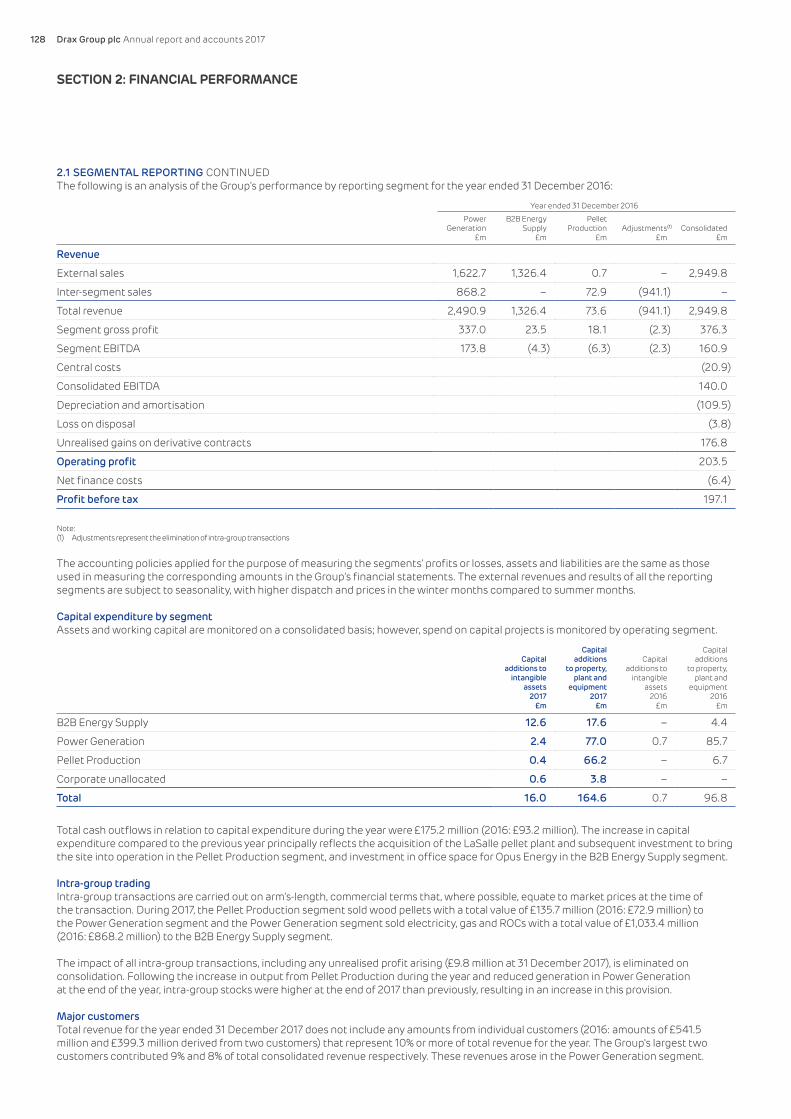
Drax Group plc Annual report and accounts 2017128
SECTION 2: FINANCIAL PERFORMANCE
2.1 SEGMENTAL REPORTING CONTINUEDThe following is an analysis of the Group’s performance by reporting segment for the year ended 31 December 2016:
Year ended 31 December 2016
Power Generation
£m
B2B Energy Supply
£m
Pellet Production
£mAdjustments(1)
£mConsolidated
£m
Revenue
External sales 1,622.7 1,326.4 0.7 – 2,949.8
Inter-segment sales 868.2 – 72.9 (941.1) –
Total revenue 2,490.9 1,326.4 73.6 (941.1) 2,949.8
Segment gross profit 337.0 23.5 18.1 (2.3) 376.3
Segment EBITDA 173.8 (4.3) (6.3) (2.3) 160.9
Central costs (20.9)
Consolidated EBITDA 140.0
Depreciation and amortisation (109.5)
Loss on disposal (3.8)
Unrealised gains on derivative contracts 176.8
Operating profit 203.5
Net finance costs (6.4)
Profit before tax 197.1
Note:(1) Adjustments represent the elimination of intra-group transactions
The accounting policies applied for the purpose of measuring the segments’ profits or losses, assets and liabilities are the same as those used in measuring the corresponding amounts in the Group’s financial statements. The external revenues and results of all the reporting segments are subject to seasonality, with higher dispatch and prices in the winter months compared to summer months.
Capital expenditure by segmentAssets and working capital are monitored on a consolidated basis; however, spend on capital projects is monitored by operating segment.
Capital additions to
intangible assets
2017£m
Capital additions
to property, plant and
equipment2017
£m
Capital additions to
intangible assets
2016£m
Capital additions
to property, plant and
equipment2016
£m
B2B Energy Supply 12.6 17.6 – 4.4
Power Generation 2.4 77.0 0.7 85.7
Pellet Production 0.4 66.2 – 6.7
Corporate unallocated 0.6 3.8 – –
Total 16.0 164.6 0.7 96.8
Total cash outflows in relation to capital expenditure during the year were £175.2 million (2016: £93.2 million). The increase in capital expenditure compared to the previous year principally reflects the acquisition of the LaSalle pellet plant and subsequent investment to bring the site into operation in the Pellet Production segment, and investment in office space for Opus Energy in the B2B Energy Supply segment.
Intra-group tradingIntra-group transactions are carried out on arm’s-length, commercial terms that, where possible, equate to market prices at the time of the transaction. During 2017, the Pellet Production segment sold wood pellets with a total value of £135.7 million (2016: £72.9 million) to the Power Generation segment and the Power Generation segment sold electricity, gas and ROCs with a total value of £1,033.4 million (2016: £868.2 million) to the B2B Energy Supply segment.
The impact of all intra-group transactions, including any unrealised profit arising (£9.8 million at 31 December 2017), is eliminated on consolidation. Following the increase in output from Pellet Production during the year and reduced generation in Power Generation at the end of the year, intra-group stocks were higher at the end of 2017 than previously, resulting in an increase in this provision.
Major customersTotal revenue for the year ended 31 December 2017 does not include any amounts from individual customers (2016: amounts of £541.5 million and £399.3 million derived from two customers) that represent 10% or more of total revenue for the year. The Group's largest two customers contributed 9% and 8% of total consolidated revenue respectively. These revenues arose in the Power Generation segment.
Drax Group plc Annual report and accounts 2017 129
2.2 REVENUEAccounting policyRevenue represents amounts receivable for goods or services provided in the normal course of business, net of trade discounts, VAT and other sales-related taxes and excluding transactions between Group companies.
Revenues from the sale of electricity from our Power Generation business are measured based upon metered output delivered at rates specified under contract terms or prevailing market rates as applicable.
Two of our biomass-fuelled generating units earn Renewable Obligation Certificates (ROCs) under the UK Government’s Renewables Obligation (RO) regime. The financial benefit of a ROC is recognised in the income statement at the point the relevant renewable biomass fuel is burnt and power dispatched as a reduction in the cost of the biomass fuel. A corresponding asset is recognised on the balance sheet (see note 3.3 on page 140). Revenue from sale of ROCs is recognised when the ROC is transferred to a third party.
The Group recognises the income or costs arising from the CfD (see below) in the income statement, as a component of revenue, at the point the flow of economic benefit becomes probable. This is considered to be the point at which the relevant generation is delivered and the payment becomes contractually due.
Revenue from the sale of electricity and gas directly to business customers through our B2B Energy Supply businesses, Haven Power and Opus Energy, is recognised on the supply of electricity or gas when a contract exists, supply has taken place, a quantifiable price has been established or can be determined and the receivables are expected to be recovered at the point of sale. Energy supplied is measured based upon metered consumption and contractual rates; however, where a supply has taken place but is not yet measured or billed, the revenue is estimated based on consumption statistics and selling price estimates and is included as accrued income on the balance sheet.
Other revenues derived from the provision of services (for example, the supply of system support services, such as black start and frequency response) to National Grid are recognised by reference to the stage of completion of the contract. Most such contracts are for the delivery of a service either continually or on an ad-hoc basis over a period of time and thus stage of completion is calculated with reference to the amount of the contract term that has elapsed. Depending on the contract terms this approach may require judgement in estimating probable future outcomes.
Other revenues derived from the sale of goods (for example, by-products from electricity generation such as ash and gypsum) are recognised at the point the risks and rewards of ownership pass to the customer, typically at the point of delivery to the customer’s premises.
CfD paymentsThe Group is party to a Contract for Difference (CfD) with the Low Carbon Contracts Company (LCCC), a Government-owned entity responsible for delivering elements of the Government’s Electricity Market Reform Programme. Under the contract, the Group makes or receives payments in respect of electricity dispatched from a specific biomass-fuelled generating unit. The payment is calculated with reference to a strike price of £100 per MWh. The base year for the strike price was 2012 and it increases each year in line with the UK Consumer Price Index and changes in system balancing costs. The strike price at 31 December 2017 was £106 per MWh.
When market prices at the point of generation are above/below the strike price, the Group makes/receives an additional payment to/from LCCC equivalent to the difference between the market power price at the point of dispatch and the strike price. Such payments are in addition to amounts received from the sale of the power in the wholesale market and either increase or limit the total income from the power dispatched from the relevant generating unit to the strike price in the CfD contract.
The year ended 31 December 2017 is the first full year of generation under the CfD contract, which commenced on 21 December 2016.
ROC salesThe generation and sale of ROCs is a key driver of the Group’s financial performance. The RO scheme started in April 2002 and places an obligation on electricity suppliers to source an increasing proportion of their electricity from renewable sources. Under the RO, ROCs are certificates issued to generators of renewable electricity which are then sold to suppliers to demonstrate that they have fulfilled their obligations under the RO. ROCs are managed in compliance periods (CPs), running from April to March annually, CP1 commenced in April 2002. At 31 December 2017 we are in CP16.
To meet its obligations a supplier can either submit ROCs or pay the “buy-out” price at the end of the CP. The buy-out price was set at £30 per ROC in CP1 and rises with inflation. The buy-out price in CP16 is £45.58. ROCs are typically procured in arm’s-length transactions with renewable generators at a market price typically slightly lower than the buy-out price for that CP. At the end of the CP, the amounts collected from suppliers paying the buy-out price form the “recycle fund”, which is distributed on a pro-rata basis to ROC generators.
The financial benefit of a ROC recognised in the income statement at the point of generation is thus comprised of two parts: the expected value to be obtained in a sale transaction with a third party supplier and the expected recycle fund benefit to be received at the end of the CP. See note 3.3 on page 140 for further details of ROCs generated and sold by our Power Generation business and those utilised by our B2B Energy Supply business in the year.
Strategic reportG
overnanceFinancial statem
entsShareholder inform
ation

Drax Group plc Annual report and accounts 2017130
SECTION 2: FINANCIAL PERFORMANCE
2.2 REVENUE CONTINUEDFurther analysis of our revenue for the year ending 31 December 2017 is provided in the table below:
Year ended 31 December 2017
External£m
Intra-group£m
Total£m
Power Generation
Electricity sales 1,030.9 774.5 1,805.4
ROC and LEC sales 367.8 258.9 626.7
CfD income 248.2 – 248.2
Ancillary services 30.7 – 30.7
Other income 8.6 – 8.6
B2B Energy Supply
Electricity and gas sales 1,933.9 – 1,933.9
Pellet sales 6.3 – 6.3
Other income 58.8 – 58.8
Pellet Production
Pellet sales – 135.7 135.7
Elimination of intra-group sales – (1,169.1) (1,169.1)
Total consolidated revenue 3,685.2 – 3,685.2
The B2B Energy Supply segment includes £6.3 million of revenue representing 10 months of sales of wood pellets into the domestic UK heat market via Billington Bioenergy (2016: £6.7 million). This business was sold on 31 October 2017.
The following is an analysis of the Group’s revenues in the year ended 31 December 2016:
Year ended 31 December 2016
External£m
Intra-group£m
Total£m
Power Generation
Electricity sales 1,193.4 686.5 1,879.9
ROC and LEC sales 366.7 181.7 548.4
CfD income 10.3 – 10.3
Ancillary services 47.3 – 47.3
Other income 5.0 – 5.0
B2B Energy Supply
Electricity and gas sales 1,319.6 – 1,319.6
Pellet sales 6.7 – 6.7
Other income 0.1 – 0.1
Biomass Supply
Pellet sales – 72.9 72.9
Other income 0.7 – 0.7
Elimination of intra-group sales – (941.1) (941.1)
Total consolidated revenue 2,949.8 – 2,949.8

Drax Group plc Annual report and accounts 2017 131
2.3 OPERATING EXPENSES AND EBITDAThis note sets out the material components of “Operating and administrative expenses” in our Consolidated income statement, page 122, and a detailed breakdown of the fees paid to our auditor, Deloitte LLP, in respect of services they provided to the Group during the year.
Years ended 31 December
2017£m
2016£m
Gross profit 545.0 376.3
The following expenditure has been charged in arriving at operating profit/EBITDA:
Staff costs (note 6.1) 137.1 99.9
Repairs and maintenance expenditure on property, plant and equipment 50.7 68.9
Other operating and administrative expenses 128.3 67.5
Total operating and administrative expenses 316.1 236.3
EBITDA 228.9 140.0
EBITDA is defined on page 120.
Operating lease costs of £2.3 million in respect of land and buildings and £5.7 million in respect of other operating leases (2016: £2.4 million and £1.3 million) are included in other operating expenses.
Auditor’s remunerationYears ended 31 December
2017£000
2016£000
Audit fees:
Fees payable for the audit of the Group’s consolidated financial statements 653 448
Fees payable for the audit of the Company’s subsidiaries 31 27
684 475
Other fees:
Review of the Group’s half-year condensed consolidated financial statements 89 71
Other services 2 2
Total audit-related fees 775 548
Other assurance services 125 610
Total non-audit fees 125 610
Total auditor’s remuneration 900 1,158
Other assurance services provided by Deloitte LLP in 2017 consist of assurance and agreed-upon procedures performed in relation to the bond finance raised in May 2017 (2016: reporting accountant services associated with the shareholder circular in relation to the Opus Energy transaction).
Non-audit services are approved by the Audit Committee in accordance with the policy set out on page 80.
2.4 REVIEW OF FIXED ASSETS FOR IMPAIRMENT Accounting policyThe Group reviews its fixed assets (or, where appropriate, groups of assets known as cash-generating units (CGUs)) whenever there is an indication that an impairment loss may have been suffered. The Group assesses the existence of indicators of impairment annually. The Group considers the smallest collections of assets that generate independent cash flows to be its operating entities (Drax Power, Haven Power, Opus Energy and Drax Biomass) and accordingly considers the Group to be comprised of four CGUs.
If an indication of potential impairment exists, the recoverable amount of the asset or CGU in question is assessed with reference to the present value of the future cash flows expected to be derived from the continuing use of the asset or CGU (value in use) or the expected price that would be received to sell the asset to another market participant (fair value less costs to sell). The initial assessment of recoverable amount is normally based on value in use.
Where value in use is calculated, the assessment of future cash flows is based on the most recent approved business plan and includes all of the necessary costs expected to be incurred to generate the cash inflows from the CGU’s assets in their current state and condition, including an allocation of centrally managed costs. Central costs are only allocated where they are necessary for and directly attributable to the CGU’s activities. Future cash flows include, where relevant, contracted cash flows arising from our cash flow hedging activities and as a result the carrying amount of each CGU includes the mark-to-market value of those cash flow hedges.
Strategic reportG
overnanceFinancial statem
entsShareholder inform
ation

Drax Group plc Annual report and accounts 2017132
SECTION 2: FINANCIAL PERFORMANCE
2.4 REVIEW OF FIXED ASSETS FOR IMPAIRMENT CONTINUEDThe additional value that could be obtained from enhancing or converting the Group’s assets is not reflected, nor the potential benefit of any future restructuring or reorganisation. In determining value in use, the estimate of future cash flows is discounted to present value using a pre-tax rate reflecting the specific risks attributable to the CGU in question.
If the recoverable amount is less than the current carrying amount in the financial statements, a provision is made to reduce the carrying amount of the asset or CGU to the estimated recoverable amount. Impairment losses are recognised immediately in the income statement.
Goodwill balances are assessed for impairment annually (see note 5.2).
Assessment of indicators of impairmentThe Group's market capitalisation has remained below the carrying value of its net assets this year. As part of the most recent annual review, the Group considered this and concluded that a potential indicator of impairment existed in respect of the Drax Power CGU. This assessment was based upon continued weakness in commodity markets, volatility in foreign exchange rates, perceived levels of regulatory uncertainty and the sensitivity of the recoverable amount of Drax Power's assets to changes in these factors.
Accordingly, an impairment review of the Drax Power CGU was undertaken at the balance sheet date. A review of other CGUs suggested no indicators of impairment.
Significant estimation uncertaintyThe assessment of the present value of future cash flows on which such a review is based is dependent upon a number of assumptions. In particular, expected future cash flows are based upon management’s estimates of future prices, output, costs, economic support for renewable energy generation and access to contracts for electricity generation and supply. Where relevant and to the fullest extent possible, the key assumptions are based on observable market information. However, observable market information is only available for a limited proportion of the remaining useful lives of the assets under review.
Impairment reviewThe carrying amount of the Drax Power CGU at 31 December 2017 was £1,430 million. The value in use of the Drax Power CGU was tested using the Group’s established planning model.
The analysis assumed that Drax Power’s three biomass-fuelled generating units will continue in operation until the end of their estimated useful lives, currently considered to be 2039. In line with our assumption that coal-fired generation will cease by 2025, applied in light of the Government's announced intention to close coal-fired generation following recent consultations, the three remaining coal-fired units were assumed to cease coal-fired generation by this date but will then be available for conversion to alternative fuels. No account has been taken of any cash inflows that could result from such a conversion (which could take place earlier than 2025) in measuring the value in use of the Drax Power CGU. This includes potential cash flows arising from the fourth unit conversion to biomass and possible repowering of the fifth and sixth units to gas.
The analysis depends on a broad range of assumptions, including the expected life of the six power generating units and the regulatory regime under which they might operate. The key assumptions (i.e. those most sensitive to a change, possibly resulting in a different outcome for impairment) are considered to be:
– the expected operating lives of the six generating units, as described above; – future commodity prices beyond the horizon of our existing contracted purchase and sale commitments – notably power prices and
biomass prices; – future foreign exchange rates beyond the horizon of our existing contracted purchase commitments; and – the continuance of existing biomass support regimes – CfD and RO – until 2027 and the existence of a favourable economic environment
for biomass generation thereafter. This includes future capacity market and system support revenues.
These assumptions are all dependent on external market movements. The historic volatility in these assumptions is reflected in the financial performance of the Group but past performance is not necessarily a reliable indicator of future values.
Where available, estimates of future prices are based on signed contracts for purchases and sales with third parties. Intra-group purchases of biomass are included at contract prices which are based on our view of future market prices. Transactions beyond contracted positions are valued using market data and forward price curves, based where possible on data points provided by a reputable third party source, independent to the Group. In particular, longer-term power prices are based on assumptions from Aurora Energy Research. The contracted period for biomass purchases is substantially longer, with the longest-dated contracts expiring in 2027. Beyond this point, estimated biomass prices are largely based on our internal models which reflect our assessment of future market prices.
Future foreign exchange rates are based on contracted foreign currency purchases to the extent possible. Beyond our contracted position, exchange rate estimates are based on market forward curves.
Current Government plans for existing renewable support mechanisms, namely the CfD and RO, assume these cease in 2027. The impairment analysis made no assumptions regarding the direct replacement of these support mechanisms beyond this date. The biomass-fuelled units that are assumed to continue to generate power do so supported by the prevailing wholesale power price, delivery of ancillary services to the UK grid and an expectation that capacity market revenues will be available to these units. Our power price forecasts reflect increased volatility between peak and baseload prices. Assumed revenues from ancillary services and the capacity market are based on projections derived from current contracts and capacity market outcomes and how we expect the market to evolve. These assumptions

Drax Group plc Annual report and accounts 2017 133
2.4 REVIEW OF FIXED ASSETS FOR IMPAIRMENT CONTINUEDreflect our expectation that Drax will be required to provide generation to support intermittent renewable power and be an essential part of the UK’s energy mix throughout the life of the units.
The expected future cash flows were discounted using a pre-tax nominal rate of 7.3%. The discount rate is supported by observable market reports and independent analysis commissioned by, and specific to the circumstances of, the Group and the Power Generation business. This indicated that the recoverable amount of the Drax Power CGU exceeded its carrying value and therefore that no provisions for impairment were required.
Sensitivity analysis indicated that, when compared to our base case assumptions, a reduction of approximately 21% in market power prices, an increase in biomass prices of approximately 31%, or a depreciation of Sterling against the US Dollar of approximately 24% throughout the 22-year term of the valuation would result in a recoverable amount for the Drax Power CGU that is lower than its carrying amount. Furthermore, the valuation includes cash flows for the period from 2027–2039 in line with the assumed useful economic lives of the assets. If the value from this period was removed in its entirety, it would not result in an impairment charge. The analysis does not consider the interaction effect of potential changes in several or all of the assumptions simultaneously, and the sensitivities do not take account of any mitigating actions that could be taken should the changes referred to materialise. In addition, in relation to central costs, no reasonable change in the method of allocation would result in an impairment charge.
2.5 NET FINANCE COSTSFinance costs reflect expenses incurred in managing our debt structure (such as interest payable on our bonds) as well as foreign exchange gains and losses, the unwinding of discounting on provisions for reinstatement of our sites at the end of their useful lives (see note 5.4) and net interest charged on the Group’s defined benefit pension scheme obligation (see note 6.3). These are offset by interest income that we generate through efficient use of short-term cash surpluses – for example through investment in money market funds.
On 5 May 2017, the Group refinanced its external debt. The resulting cost of £24.2 million (2016: £nil) reflects the costs incurred to extinguish the existing debt together with the release of the related deferred borrowing costs. As described in note 2.7, these costs have been excluded from the calculation of underlying earnings. Further information about the new finance structure can be found in note 4.3.
Years ended 31 December
2017£m
2016£m
Interest payable and similar charges:
Interest payable on borrowings (25.6) (19.4)
Unwinding of discount on provisions (note 5.4) (0.7) (4.5)
Amortisation of deferred finance costs (3.5) (2.1)
Net finance cost in respect of defined benefit scheme (note 6.3) (0.5) (0.9)
Other financing charges (1.2) (2.1)
Total interest payable and similar charges (31.5) (29.0)
Interest receivable:
Interest income on bank deposits 0.2 0.6
Total interest receivable 0.2 0.6
Foreign exchange (losses)/gains (10.6) 22.0
Total recurring net interest charge (41.9) (6.4)
One-off costs of debt restructure:
Fees to exit existing facilities (13.8) –
Acceleration of deferred costs in relation to previous facilities (10.4) –
Total one-off net interest charge (24.2) –
Total net interest charge (66.1) (6.4)
Foreign exchange gains and losses recognised in interest arise on the retranslation of non-derivative balances and investments denominated in foreign currencies to prevailing rates at the balance sheet date. Sterling strengthened against the US Dollar and Euro during 2017, resulting in losses being recognised on assets the Group holds denominated in these currencies.
Strategic reportG
overnanceFinancial statem
entsShareholder inform
ation
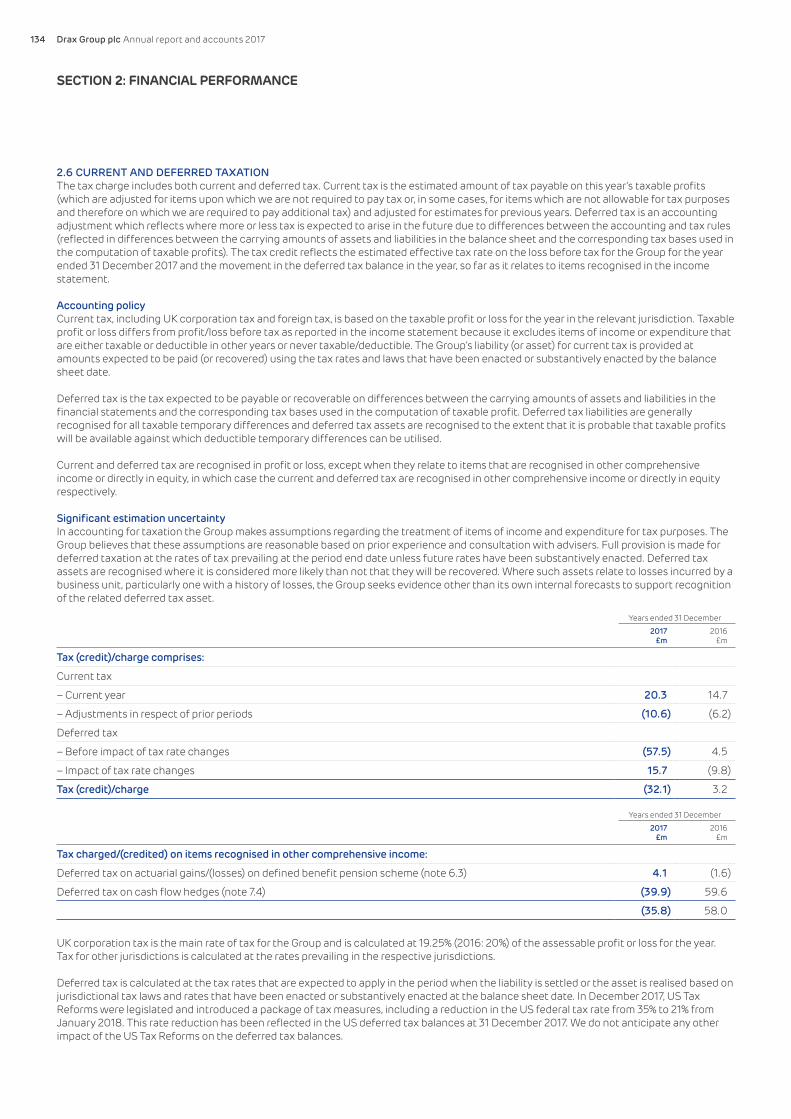
Drax Group plc Annual report and accounts 2017134
SECTION 2: FINANCIAL PERFORMANCE
2.6 CURRENT AND DEFERRED TAXATIONThe tax charge includes both current and deferred tax. Current tax is the estimated amount of tax payable on this year’s taxable profits (which are adjusted for items upon which we are not required to pay tax or, in some cases, for items which are not allowable for tax purposes and therefore on which we are required to pay additional tax) and adjusted for estimates for previous years. Deferred tax is an accounting adjustment which reflects where more or less tax is expected to arise in the future due to differences between the accounting and tax rules (reflected in differences between the carrying amounts of assets and liabilities in the balance sheet and the corresponding tax bases used in the computation of taxable profits). The tax credit reflects the estimated effective tax rate on the loss before tax for the Group for the year ended 31 December 2017 and the movement in the deferred tax balance in the year, so far as it relates to items recognised in the income statement.
Accounting policyCurrent tax, including UK corporation tax and foreign tax, is based on the taxable profit or loss for the year in the relevant jurisdiction. Taxable profit or loss differs from profit/loss before tax as reported in the income statement because it excludes items of income or expenditure that are either taxable or deductible in other years or never taxable/deductible. The Group’s liability (or asset) for current tax is provided at amounts expected to be paid (or recovered) using the tax rates and laws that have been enacted or substantively enacted by the balance sheet date.
Deferred tax is the tax expected to be payable or recoverable on differences between the carrying amounts of assets and liabilities in the financial statements and the corresponding tax bases used in the computation of taxable profit. Deferred tax liabilities are generally recognised for all taxable temporary differences and deferred tax assets are recognised to the extent that it is probable that taxable profits will be available against which deductible temporary differences can be utilised.
Current and deferred tax are recognised in profit or loss, except when they relate to items that are recognised in other comprehensive income or directly in equity, in which case the current and deferred tax are recognised in other comprehensive income or directly in equity respectively.
Significant estimation uncertaintyIn accounting for taxation the Group makes assumptions regarding the treatment of items of income and expenditure for tax purposes. The Group believes that these assumptions are reasonable based on prior experience and consultation with advisers. Full provision is made for deferred taxation at the rates of tax prevailing at the period end date unless future rates have been substantively enacted. Deferred tax assets are recognised where it is considered more likely than not that they will be recovered. Where such assets relate to losses incurred by a business unit, particularly one with a history of losses, the Group seeks evidence other than its own internal forecasts to support recognition of the related deferred tax asset.
Years ended 31 December
2017£m
2016£m
Tax (credit)/charge comprises:
Current tax
– Current year 20.3 14.7
– Adjustments in respect of prior periods (10.6) (6.2)
Deferred tax
– Before impact of tax rate changes (57.5) 4.5
– Impact of tax rate changes 15.7 (9.8)
Tax (credit)/charge (32.1) 3.2
Years ended 31 December
2017£m
2016£m
Tax charged/(credited) on items recognised in other comprehensive income:
Deferred tax on actuarial gains/(losses) on defined benefit pension scheme (note 6.3) 4.1 (1.6)
Deferred tax on cash flow hedges (note 7.4) (39.9) 59.6
(35.8) 58.0
UK corporation tax is the main rate of tax for the Group and is calculated at 19.25% (2016: 20%) of the assessable profit or loss for the year. Tax for other jurisdictions is calculated at the rates prevailing in the respective jurisdictions.
Deferred tax is calculated at the tax rates that are expected to apply in the period when the liability is settled or the asset is realised based on jurisdictional tax laws and rates that have been enacted or substantively enacted at the balance sheet date. In December 2017, US Tax Reforms were legislated and introduced a package of tax measures, including a reduction in the US federal tax rate from 35% to 21% from January 2018. This rate reduction has been reflected in the US deferred tax balances at 31 December 2017. We do not anticipate any other impact of the US Tax Reforms on the deferred tax balances.
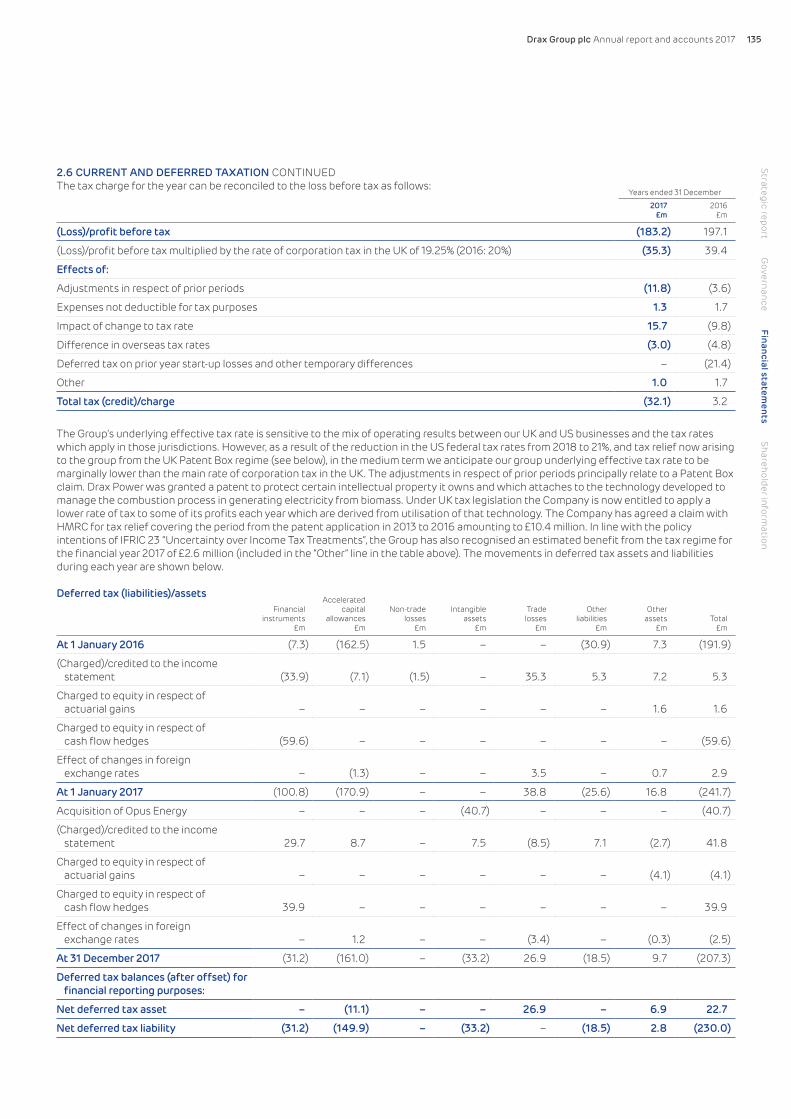
Drax Group plc Annual report and accounts 2017 135
2.6 CURRENT AND DEFERRED TAXATION CONTINUEDThe tax charge for the year can be reconciled to the loss before tax as follows:
Years ended 31 December
2017£m
2016£m
(Loss)/profit before tax (183.2) 197.1
(Loss)/profit before tax multiplied by the rate of corporation tax in the UK of 19.25% (2016: 20%) (35.3) 39.4
Effects of:
Adjustments in respect of prior periods (11.8) (3.6)
Expenses not deductible for tax purposes 1.3 1.7
Impact of change to tax rate 15.7 (9.8)
Difference in overseas tax rates (3.0) (4.8)
Deferred tax on prior year start-up losses and other temporary differences – (21.4)
Other 1.0 1.7
Total tax (credit)/charge (32.1) 3.2
The Group’s underlying effective tax rate is sensitive to the mix of operating results between our UK and US businesses and the tax rates which apply in those jurisdictions. However, as a result of the reduction in the US federal tax rates from 2018 to 21%, and tax relief now arising to the group from the UK Patent Box regime (see below), in the medium term we anticipate our group underlying effective tax rate to be marginally lower than the main rate of corporation tax in the UK. The adjustments in respect of prior periods principally relate to a Patent Box claim. Drax Power was granted a patent to protect certain intellectual property it owns and which attaches to the technology developed to manage the combustion process in generating electricity from biomass. Under UK tax legislation the Company is now entitled to apply a lower rate of tax to some of its profits each year which are derived from utilisation of that technology. The Company has agreed a claim with HMRC for tax relief covering the period from the patent application in 2013 to 2016 amounting to £10.4 million. In line with the policy intentions of IFRIC 23 “Uncertainty over Income Tax Treatments”, the Group has also recognised an estimated benefit from the tax regime for the financial year 2017 of £2.6 million (included in the “Other” line in the table above). The movements in deferred tax assets and liabilities during each year are shown below.
Deferred tax (liabilities)/assetsFinancial
instruments£m
Accelerated capital
allowances£m
Non-tradelosses
£m
Intangible assets
£m
Tradelosses
£m
Otherliabilities
£m
Otherassets
£mTotal
£m
At 1 January 2016 (7.3) (162.5) 1.5 – – (30.9) 7.3 (191.9)
(Charged)/credited to the income statement (33.9) (7.1) (1.5) – 35.3 5.3 7.2 5.3
Charged to equity in respect of actuarial gains – – – – – – 1.6 1.6
Charged to equity in respect of cash flow hedges (59.6) – – – – – – (59.6)
Effect of changes in foreign exchange rates – (1.3) – – 3.5 – 0.7 2.9
At 1 January 2017 (100.8) (170.9) – – 38.8 (25.6) 16.8 (241.7)
Acquisition of Opus Energy – – – (40.7) – – – (40.7)
(Charged)/credited to the income statement 29.7 8.7 – 7.5 (8.5) 7.1 (2.7) 41.8
Charged to equity in respect of actuarial gains – – – – – – (4.1) (4.1)
Charged to equity in respect of cash flow hedges 39.9 – – – – – – 39.9
Effect of changes in foreign exchange rates – 1.2 – – (3.4) – (0.3) (2.5)
At 31 December 2017 (31.2) (161.0) – (33.2) 26.9 (18.5) 9.7 (207.3)
Deferred tax balances (after offset) for financial reporting purposes:
Net deferred tax asset – (11.1) – – 26.9 – 6.9 22.7
Net deferred tax liability (31.2) (149.9) – (33.2) – (18.5) 2.8 (230.0)
Strategic reportG
overnanceFinancial statem
entsShareholder inform
ation
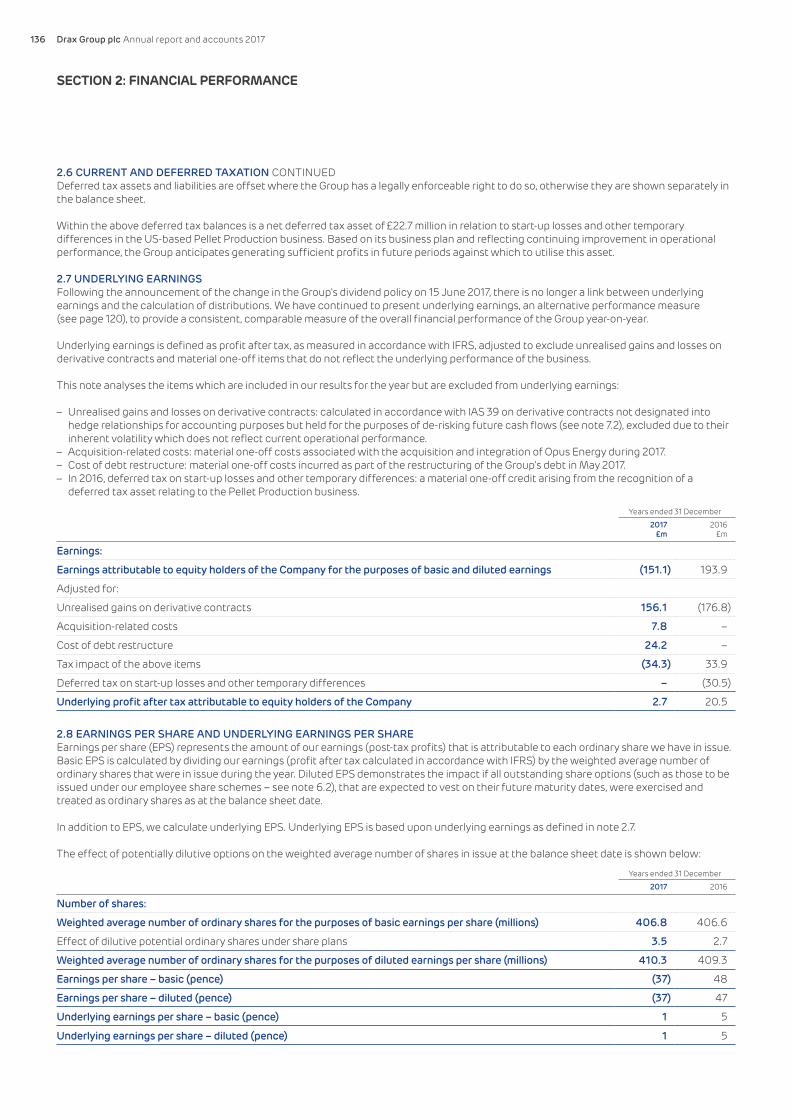
Drax Group plc Annual report and accounts 2017136
SECTION 2: FINANCIAL PERFORMANCE
2.6 CURRENT AND DEFERRED TAXATION CONTINUEDDeferred tax assets and liabilities are offset where the Group has a legally enforceable right to do so, otherwise they are shown separately in the balance sheet.
Within the above deferred tax balances is a net deferred tax asset of £22.7 million in relation to start-up losses and other temporary differences in the US-based Pellet Production business. Based on its business plan and reflecting continuing improvement in operational performance, the Group anticipates generating sufficient profits in future periods against which to utilise this asset.
2.7 UNDERLYING EARNINGSFollowing the announcement of the change in the Group's dividend policy on 15 June 2017, there is no longer a link between underlying earnings and the calculation of distributions. We have continued to present underlying earnings, an alternative performance measure (see page 120), to provide a consistent, comparable measure of the overall financial performance of the Group year-on-year.
Underlying earnings is defined as profit after tax, as measured in accordance with IFRS, adjusted to exclude unrealised gains and losses on derivative contracts and material one-off items that do not reflect the underlying performance of the business.
This note analyses the items which are included in our results for the year but are excluded from underlying earnings:
– Unrealised gains and losses on derivative contracts: calculated in accordance with IAS 39 on derivative contracts not designated into hedge relationships for accounting purposes but held for the purposes of de-risking future cash flows (see note 7.2), excluded due to their inherent volatility which does not reflect current operational performance.
– Acquisition-related costs: material one-off costs associated with the acquisition and integration of Opus Energy during 2017. – Cost of debt restructure: material one-off costs incurred as part of the restructuring of the Group's debt in May 2017. – In 2016, deferred tax on start-up losses and other temporary differences: a material one-off credit arising from the recognition of a
deferred tax asset relating to the Pellet Production business.
Years ended 31 December
2017£m
2016£m
Earnings:
Earnings attributable to equity holders of the Company for the purposes of basic and diluted earnings (151.1) 193.9
Adjusted for:
Unrealised gains on derivative contracts 156.1 (176.8)
Acquisition-related costs 7.8 –
Cost of debt restructure 24.2 –
Tax impact of the above items (34.3) 33.9
Deferred tax on start-up losses and other temporary differences – (30.5)
Underlying profit after tax attributable to equity holders of the Company 2.7 20.5
2.8 EARNINGS PER SHARE AND UNDERLYING EARNINGS PER SHAREEarnings per share (EPS) represents the amount of our earnings (post-tax profits) that is attributable to each ordinary share we have in issue. Basic EPS is calculated by dividing our earnings (profit after tax calculated in accordance with IFRS) by the weighted average number of ordinary shares that were in issue during the year. Diluted EPS demonstrates the impact if all outstanding share options (such as those to be issued under our employee share schemes – see note 6.2), that are expected to vest on their future maturity dates, were exercised and treated as ordinary shares as at the balance sheet date.
In addition to EPS, we calculate underlying EPS. Underlying EPS is based upon underlying earnings as defined in note 2.7.
The effect of potentially dilutive options on the weighted average number of shares in issue at the balance sheet date is shown below:
Years ended 31 December
2017 2016
Number of shares:
Weighted average number of ordinary shares for the purposes of basic earnings per share (millions) 406.8 406.6
Effect of dilutive potential ordinary shares under share plans 3.5 2.7
Weighted average number of ordinary shares for the purposes of diluted earnings per share (millions) 410.3 409.3
Earnings per share – basic (pence) (37) 48
Earnings per share – diluted (pence) (37) 47
Underlying earnings per share – basic (pence) 1 5
Underlying earnings per share – diluted (pence) 1 5

Drax Group plc Annual report and accounts 2017 137
2.9 DIVIDENDSYears ended 31 December
2017£m
2016£m
Amounts recognised as distributions to equity holders in the year (based on the number of shares in issue at the record date):
Interim dividend for the year ended 31 December 2017 of 4.9 pence per share paid on 4 October 2017 (2016: 2.1 pence per share paid on 7 October 2016) 20.0 8.6
Final dividend for the year ended 31 December 2016 of 0.4 pence per share paid on 12 May 2017 (2015: 0.6 pence per share paid on 13 May 2016) 1.6 2.4
21.6 11.0
As described on page 49, on 15 June 2017 we announced a new dividend policy.
At the forthcoming Annual General Meeting the Board will recommend to shareholders that a resolution is passed to approve payment of a final dividend for the year ended 31 December 2017 of 7.4 pence per share (equivalent to approximately £30 million) payable on or before 11 May 2018. The final dividend has not been included as a liability as at 31 December 2017. This would bring total dividends payable in respect of the 2017 financial year to £50 million. In future years, in determining the value of dividends the Board will take account of future investment opportunities and the less predictable cash flows from the Group’s commodity based businesses. If there is a build-up of capital in excess of the Group’s investment needs the Board will consider the most appropriate mechanism to return this to shareholders.
2.10 RETAINED PROFITSRetained profits are a component of our equity reserves. The overall balance reflects the total profits we have generated over our lifetime, reduced by the amount of that profit we have distributed to our shareholders. The table below sets out the movements in our retained profits during the year.
Years ended 31 December
2017£m
2016£m
At 1 January 566.5 385.2
(Loss)/profit for the year (151.1) 193.9
Actuarial gains/(losses) on defined benefit pension scheme (note 6.3) 21.4 (8.4)
Deferred tax on actuarial gains/(losses) on defined benefit pension scheme (note 2.6) (4.1) 1.6
Equity dividends paid (note 2.9) (21.6) (11.0)
Net movements in equity associated with share-based payments (note 6.2) 6.1 5.2
At 31 December 417.2 566.5
Distributable profitsThe capacity of the Group to make dividend payments is primarily determined by the availability of retained distributable profits and cash resources.
The immediate cash resources of the Group of £222.3 million are set out in note 4.2 and the recent history of cash generation within note 4.4. The majority of these cash resources are held centrally within the Group by Drax Corporate Limited. The Parent Company financial statements, set out on pages 172–177 of this report, disclose the Parent Company’s distributable reserves of £229.7 million. Sufficient reserves are available across the Group as a whole to make future distributions in accordance with the Group’s updated dividend policy for the foreseeable future.
The majority of the Group’s distributable reserves are held in holding and operating subsidiaries. Management actively monitors the level of distributable reserves in each company in the Group, ensuring adequate reserves are available for upcoming dividend payments and that the Parent Company has access to these reserves.
The Group's new financing facilities (see note 4.3) place certain conditions on the value of dividend payments to be made in any given year. We expect to be able to make dividend payments, in line with our new policy, within these conditions for the foreseeable future.
Strategic reportG
overnanceFinancial statem
entsShareholder inform
ation

Drax Group plc Annual report and accounts 2017138
This section gives further information on the operating assets we use to generate revenue and the short-term liquid assets and liabilities, managed during day-to-day operations, that comprise our working capital balances.
3.1 PROPERTY, PLANT AND EQUIPMENTThis note shows the cost, depreciation and net book value of the physical assets controlled by us that we use in our businesses to generate revenue. The cost of an asset is what we paid to purchase or construct the asset. Depreciation reflects the usage of the asset over time and is calculated by taking the cost of the asset, net of any residual value, to the income statement evenly over the useful economic life of the asset. An asset’s net book value is its cost less any depreciation (including impairment, if required) charged to date.
On 13 April 2017, the Group acquired the wood pellet manufacturing plant owned by Louisiana Pellets Inc, for consideration of $35 million (£27.4 million). The assets of the plant were acquired at auction through a bankruptcy court and did not constitute a business in their own right. At the point of acquisition, the plant was not operational, there was no workforce in place and no raw material contracts for it to operate as a business. In accordance with the requirements of IFRS 3 – Business combinations, the acquisition has been accounted for as an asset purchase. Since the date of acquisition, further costs totalling £20.4 million have been capitalised and the plant is expected to begin commercial operations in 2018.
Accounting policyProperty, plant and equipment are initially measured at cost. Cost comprises the purchase price (after deducting trade discounts and rebates), any directly attributable costs of bringing the asset to the location and condition necessary for it to be capable of operating in the manner intended by management, and the estimate of the present value of the costs of dismantling and removing the item and restoring the site. Property, plant and equipment are stated at cost less accumulated depreciation and any provision for impairment in value.
We construct many of our assets as part of long-term development projects. Assets that are in the course of construction are not depreciated until they are ready for us to use in the way intended.
Depreciation is provided on a straight-line basis to write down assets to their residual value evenly over the estimated useful lives (UEL) of the assets from the date of acquisition (where relevant, limited to the expected decommissioning date of the power station – currently expected to be 2039). The table below shows the range of useful lives at the date of acquisition and the average remaining useful life at the balance sheet date of the main categories of asset we own in years:
Average UELremaining
Range ofUELs
Freehold buildings 20 8–33
Plant and equipment
Electricity generation plant 14 3–33
Biomass-specific assets 20 4–26
Coal-specific assets 6 3–19
Pellet production plant 19 5–20
Other plant, machinery and equipment 13 3–33
Decommissioning asset 22 35
Plant spare parts 22 Up to 35
Freehold land held at cost is considered to have an unlimited useful life and is not depreciated.
Electricity generation plant refers to core electricity generation assets at Drax Power Station which are fuel agnostic. Biomass-specific and coal-specific assets are those assets that are only necessary to support electricity generation from the specified fuel and include fuel storage and distribution systems.
Within the plant and equipment categories shorter lives are attributed to components that are overhauled and upgraded as part of rolling outage cycles. The majority of assets within these categories have a remaining useful life in excess of 15 years.
Plant spare parts are depreciated over the remaining useful life of the power station.
Costs relating to major inspections, overhauls and upgrades to the power station are included in the asset’s carrying amount or recognised as a separate asset, as appropriate, if the recognition criteria are met; namely, when it is probable that future economic benefits associated with the item will flow to the Group and the cost of the item can be measured reliably. All other repairs and maintenance costs are expensed as incurred.
Estimated useful lives and residual values are reviewed annually, taking into account regulatory change and commercial and technological obsolescence as well as normal wear and tear. Residual values are based on prices prevailing at each balance sheet date. Any changes are applied prospectively.
SECTION 3Operating assets and working capital

Drax Group plc Annual report and accounts 2017 139
3.1 PROPERTY, PLANT AND EQUIPMENT CONTINUEDSignificant estimation uncertaintyAsset lives are reviewed annually at each balance sheet date. The estimated useful lives of coal-specific assets at Drax Power Station have been revised with effect from 1 January 2017 as a result of the Government’s announcement that all coal generation will be closed during 2025. Having considered this event, the Group concluded that coal generation will cease during 2025, but that the three existing coal units will be retained for conversion to alternative fuels in the period to 2039. This results in the useful lives of the coal-specific assets which will not be required to support generation after this date being shortened to no later than 2025. This change has been applied prospectively, from 1 January 2017, and has resulted in an increase of approximately £15 million per annum in depreciation charges in 2017 compared to 2016, which will recur in each year until 2025. The useful lives of electricity generation plant currently fuelled by biomass are unaffected by this change. No further changes to the useful economic lives of assets have been made as a result of the most recent review.
At each balance sheet date, the Group reviews its property, plant and equipment to determine whether there is any indication that these assets may be impaired. The Group's accounting policy in respect of impairment, along with details of the impairment review conducted during 2017, are set out in note 2.4.
Freehold landand buildings
£m
Plant andequipment
£m
Plantspare parts
£mTotal
£m
Cost:
At 1 January 2016 318.1 2,111.3 58.5 2,487.9
On acquisition 1.3 0.2 – 1.5
Additions at cost 0.8 84.3 10.6 95.7
Disposals (7.2) (28.1) – (35.3)
Issues/transfers (11.9) 19.0 (4.5) 2.6
Effect of foreign currency exchange differences 0.7 1.1 – 1.8
At 1 January 2017 301.8 2,187.8 64.6 2,554.2
Acquisition of Opus Energy (note 5.1) 4.9 4.1 – 9.0
Additions at cost 17.1 138.5 9.0 164.6
Disposals (6.4) (29.9) – (36.3)
Issues/transfers 0.2 9.2 (6.6) 2.8
IT software transferred to intangible assets – (39.4) – (39.4)
At 31 December 2017 317.6 2,270.3 67.0 2,654.9
Accumulated depreciation and impairment:
At 1 January 2016 54.4 762.8 16.9 834.1
Depreciation charge for the year 11.2 96.7 1.6 109.5
Disposals (6.5) (25.0) – (31.5)
Effect of foreign currency exchange differences 0.2 0.4 – 0.6
At 1 January 2017 59.3 834.9 18.5 912.7
Depreciation charge for the year 11.4 109.9 1.4 122.7
Acquisition of Opus Energy – 2.4 – 2.4
Disposals (3.4) (16.6) 0.2 (19.8)
IT software transferred to intangible assets – (25.0) – (25.0)
At 31 December 2017 67.3 905.6 20.1 993.0
Net book amount at 31 December 2016 242.5 1,352.9 46.1 1,641.5
Net book amount at 31 December 2017 250.3 1,364.7 46.9 1,661.9
Assets in the course of construction amounted to £149.2 million at 31 December 2017 (2016: £120.5 million). Additions to assets in the course of construction were £139.4 million in 2017 and include LaSalle pellet plant and the new office space for Opus Energy.
Plant and equipment includes assets held under finance lease agreements with a carrying value at 31 December 2017 of £1.1 million (2016: £1.6 million).
Strategic reportG
overnanceFinancial statem
entsShareholder inform
ation
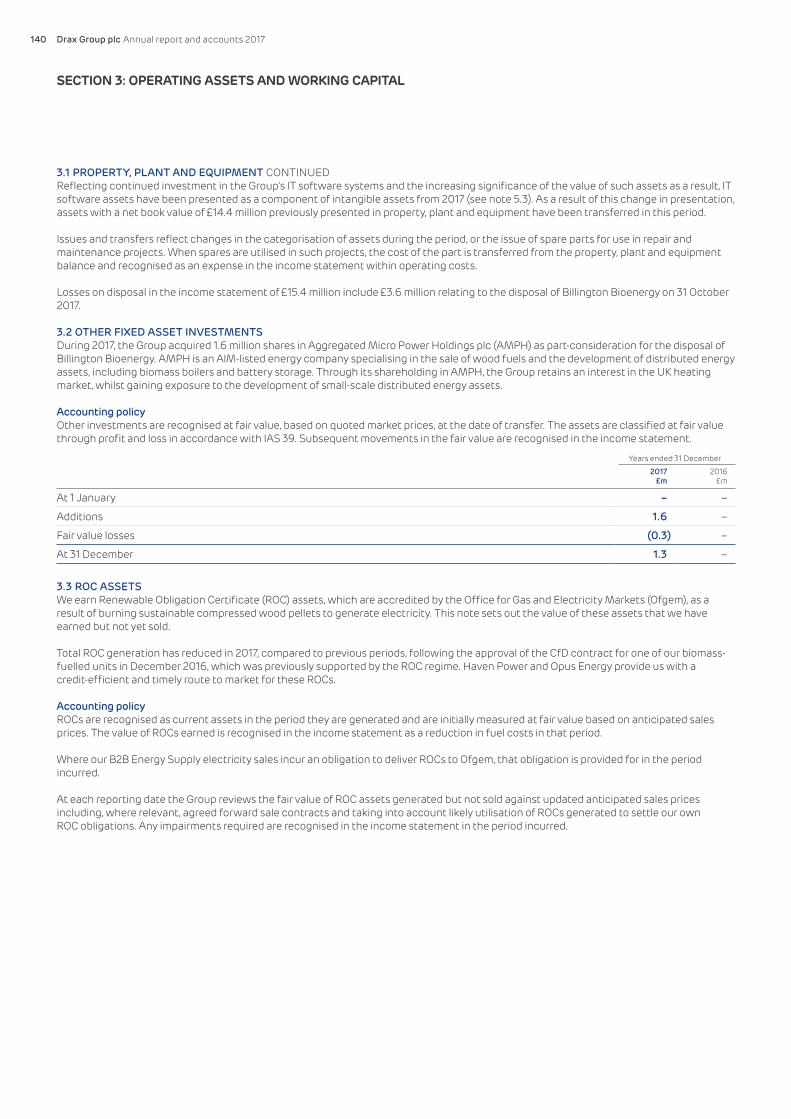
Drax Group plc Annual report and accounts 2017140
SECTION 3: OPERATING ASSETS AND WORKING CAPITAL
3.1 PROPERTY, PLANT AND EQUIPMENT CONTINUEDReflecting continued investment in the Group's IT software systems and the increasing significance of the value of such assets as a result, IT software assets have been presented as a component of intangible assets from 2017 (see note 5.3). As a result of this change in presentation, assets with a net book value of £14.4 million previously presented in property, plant and equipment have been transferred in this period.
Issues and transfers reflect changes in the categorisation of assets during the period, or the issue of spare parts for use in repair and maintenance projects. When spares are utilised in such projects, the cost of the part is transferred from the property, plant and equipment balance and recognised as an expense in the income statement within operating costs.
Losses on disposal in the income statement of £15.4 million include £3.6 million relating to the disposal of Billington Bioenergy on 31 October 2017.
3.2 OTHER FIXED ASSET INVESTMENTSDuring 2017, the Group acquired 1.6 million shares in Aggregated Micro Power Holdings plc (AMPH) as part-consideration for the disposal of Billington Bioenergy. AMPH is an AIM-listed energy company specialising in the sale of wood fuels and the development of distributed energy assets, including biomass boilers and battery storage. Through its shareholding in AMPH, the Group retains an interest in the UK heating market, whilst gaining exposure to the development of small-scale distributed energy assets.
Accounting policyOther investments are recognised at fair value, based on quoted market prices, at the date of transfer. The assets are classified at fair value through profit and loss in accordance with IAS 39. Subsequent movements in the fair value are recognised in the income statement.
Years ended 31 December
2017£m
2016£m
At 1 January – –
Additions 1.6 –
Fair value losses (0.3) –
At 31 December 1.3 –
3.3 ROC ASSETSWe earn Renewable Obligation Certificate (ROC) assets, which are accredited by the Office for Gas and Electricity Markets (Ofgem), as a result of burning sustainable compressed wood pellets to generate electricity. This note sets out the value of these assets that we have earned but not yet sold.
Total ROC generation has reduced in 2017, compared to previous periods, following the approval of the CfD contract for one of our biomass-fuelled units in December 2016, which was previously supported by the ROC regime. Haven Power and Opus Energy provide us with a credit-efficient and timely route to market for these ROCs.
Accounting policyROCs are recognised as current assets in the period they are generated and are initially measured at fair value based on anticipated sales prices. The value of ROCs earned is recognised in the income statement as a reduction in fuel costs in that period.
Where our B2B Energy Supply electricity sales incur an obligation to deliver ROCs to Ofgem, that obligation is provided for in the period incurred.
At each reporting date the Group reviews the fair value of ROC assets generated but not sold against updated anticipated sales prices including, where relevant, agreed forward sale contracts and taking into account likely utilisation of ROCs generated to settle our own ROC obligations. Any impairments required are recognised in the income statement in the period incurred.

Drax Group plc Annual report and accounts 2017 141
3.3 ROC ASSETS CONTINUEDSignificant estimation uncertaintyThe fair values and net realisable values of ROCs referred to above are calculated with reference to assumptions regarding future sales prices in the market, taking into account agreed forward sale contracts where appropriate. Historic experience indicates that the assumptions used in the valuation are reasonable; however, actual sales prices may differ from those assumed.
ROC valuations also include an estimate of the future benefit that may be obtained from the ROC recycle fund at the end of the compliance period. The recycle fund provides a benefit where supplier buy-out charges (incurred by suppliers who do not procure sufficient ROCs to satisfy their obligations) are returned to renewable generators on a pro-rata basis. The estimate is based on assumptions about likely levels of renewable generation and supply over the compliance period and is thus subject to some uncertainty. The Group utilises external sources of information in addition to its own forecasts in making these estimates. Past experience indicates that the values arrived at are reasonable but they remain subject to possible variation.
ROCs£m
Total£m
Fair value and carrying amount:
At 1 January 2016 265.7 270.1
Earned from generation 535.8 535.8
Utilised by our B2B Energy Supply business/sold to third parties (543.9) (548.3)
At 1 January 2017 257.6 257.6
Earned from generation 480.9 480.9
Purchased from third parties 33.7 33.7
Utilised by our B2B Energy Supply business/sold to third parties (626.7) (626.7)
At 31 December 2017 145.5 145.5
Recognition of revenue from sales of ROCs is described in further detail on page 129.
3.4 INVENTORIESWe hold stocks of fuels and other consumable items that we use in the process of generating electricity, and raw materials used in the production of compressed wood pellets. This note shows the cost of coal, biomass, other fuels and plant consumables that we held at the end of the year, including items at Drax Power Station, our facilities in the US and those owned by us but stored in off-site locations.
Accounting policyOur raw materials and fuel stocks are valued at the lower of the weighted average cost to purchase and net realisable value.
The cost of fuel stocks includes all direct costs and overheads incurred in bringing the fuel to its present location and condition, including the purchase price, import duties and other taxes (including amounts levied on coal under the UK carbon price support mechanism) and transport/ handling costs.
Both coal and biomass stocks are weighed when entering, moving within or exiting our sites using technology regularly calibrated to industry standards. Fuel burn in the electricity generation process is calculated using a combination of weights and thermal efficiency calculations to provide closing stock volumes. Both calibrated weighers and efficiency calculations are subject to a range of tolerable error. All fuel inventories are subject to regular surveys to ensure accuracy of these measurements.
Coal stocks are verified by an independent stock survey carried out by a suitably trained specialist, and a provision is made where the survey indicates a lower level of stock than indicated by the methods described above. Despite being an independent process, the survey depends on estimates and assumptions and as a result actual values may differ.
The characteristics of biomass require specialist handling and storage. On-site biomass at Drax Power Station is stored in sealed domes with a carefully controlled atmosphere for fire prevention purposes and thus cannot be surveyed using traditional methods. Biomass stock is surveyed using regularly calibrated state-of-the-art RADAR scanning technology.
Strategic reportG
overnanceFinancial statem
entsShareholder inform
ation

Drax Group plc Annual report and accounts 2017142
SECTION 3: OPERATING ASSETS AND WORKING CAPITAL
3.4 INVENTORIES CONTINUED
As at 31 December
2017£m
2016£m
Coal 44.5 66.4
Biomass 205.2 197.5
Other fuels and consumables 22.4 23.6
272.1 287.5
Inventories of biomass include £1.5 million of fibre and other raw materials utilised in the production of compressed wood pellets (2016: £2.3 million) and £0.1 million of work in progress (2016: £2.0 million) in our Pellet Production business.
The cost of inventories recognised as an expense in the year ended 31 December 2017 was £1,285.8 million (2016: £1,173.5 million).
3.5 TRADE AND OTHER RECEIVABLESTrade receivables represent amounts owed to us by our customers for goods or services we have provided but not yet been paid for. Other receivables include accrued income, which is income earned in the period but not yet invoiced, largely in respect of power delivered that will be invoiced the following month, and prepayments, which are amounts paid by the Group for which we are yet to receive the relevant goods or services in return (e.g. insurance premiums relating to periods after the balance sheet date).
Accounting policyTrade and other receivables, given their short tenor, are measured at cost. A provision for impairment of trade receivables is established where there is objective evidence that the Group will not be able to collect all amounts due according to the original terms of the receivable.
Years ended 31 December
2017£m
2016£m
Amounts falling due within one year:
Trade receivables 125.7 87.0
Accrued income 209.0 100.0
Prepayments and other receivables 82.8 105.9
417.5 292.9
Trade receivables and accrued income principally represent sales of energy to counterparties within both our Power Generation and B2B Energy Supply businesses. At 31 December 2017, the Group had amounts receivable from five (2016: four) significant counterparties representing 20% (2016: 46%) of total trade receivables and accrued income.
The increase in trade receivables and accrued income is principally the result of Opus Energy joining the Group in 2017.
Of total trade and other receivables at 31 December 2017, £123.9 million (2016: £33.4 million) relates to B2B Energy Supply sales. The risk profile of B2B Energy Supply debt is different from that of the Power Generation business due to a larger volume of smaller counterparties, and therefore a lower concentration of credit risk, with different payment terms.
The Group does not consider there to be any requirement for further provisions in excess of the provision for doubtful debts of £28.2 million (2016: £4.0 million). This provision, which largely relates to B2B Energy Supply receivables, has been determined with reference to past default experiences in line with our policies. Credit and counterparty risk are both discussed in further detail in note 7.1.
All past-due receivables are assessed against the Group’s credit risk policies for indicators of impairment and provisions made where appropriate.
The movement in the allowance for doubtful debts is laid out in the following table:
Years ended 31 December
2017£m
2016£m
At 1 January 4.0 4.9
Receivables written off (3.8) (3.3)
Acquisition of Opus Energy 19.7 –
Provision for receivables impairment 8.3 2.4
At 31 December 28.2 4.0
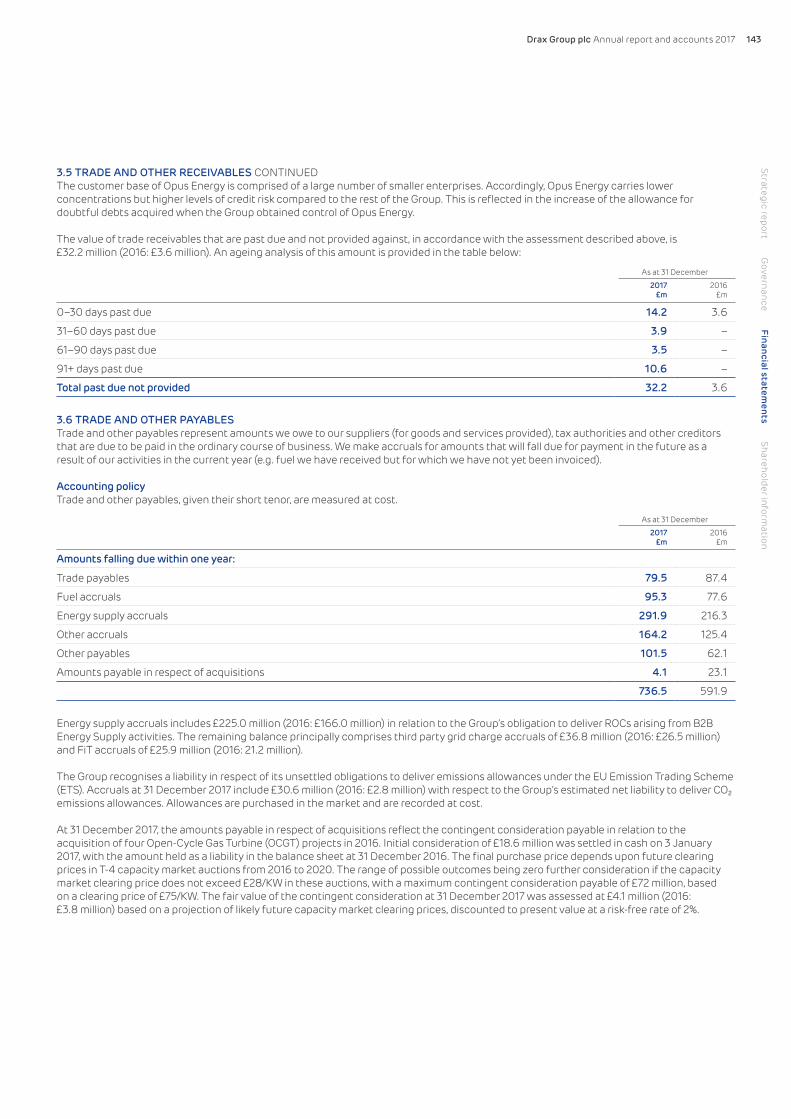
Drax Group plc Annual report and accounts 2017 143
3.5 TRADE AND OTHER RECEIVABLES CONTINUEDThe customer base of Opus Energy is comprised of a large number of smaller enterprises. Accordingly, Opus Energy carries lower concentrations but higher levels of credit risk compared to the rest of the Group. This is reflected in the increase of the allowance for doubtful debts acquired when the Group obtained control of Opus Energy.
The value of trade receivables that are past due and not provided against, in accordance with the assessment described above, is £32.2 million (2016: £3.6 million). An ageing analysis of this amount is provided in the table below:
As at 31 December
2017£m
2016£m
0–30 days past due 14.2 3.6
31–60 days past due 3.9 –
61–90 days past due 3.5 –
91+ days past due 10.6 –
Total past due not provided 32.2 3.6
3.6 TRADE AND OTHER PAYABLESTrade and other payables represent amounts we owe to our suppliers (for goods and services provided), tax authorities and other creditors that are due to be paid in the ordinary course of business. We make accruals for amounts that will fall due for payment in the future as a result of our activities in the current year (e.g. fuel we have received but for which we have not yet been invoiced).
Accounting policyTrade and other payables, given their short tenor, are measured at cost.
As at 31 December
2017£m
2016£m
Amounts falling due within one year:
Trade payables 79.5 87.4
Fuel accruals 95.3 77.6
Energy supply accruals 291.9 216.3
Other accruals 164.2 125.4
Other payables 101.5 62.1
Amounts payable in respect of acquisitions 4.1 23.1
736.5 591.9
Energy supply accruals includes £225.0 million (2016: £166.0 million) in relation to the Group’s obligation to deliver ROCs arising from B2B Energy Supply activities. The remaining balance principally comprises third party grid charge accruals of £36.8 million (2016: £26.5 million) and FiT accruals of £25.9 million (2016: 21.2 million).
The Group recognises a liability in respect of its unsettled obligations to deliver emissions allowances under the EU Emission Trading Scheme (ETS). Accruals at 31 December 2017 include £30.6 million (2016: £2.8 million) with respect to the Group’s estimated net liability to deliver CO2 emissions allowances. Allowances are purchased in the market and are recorded at cost.
At 31 December 2017, the amounts payable in respect of acquisitions reflect the contingent consideration payable in relation to the acquisition of four Open-Cycle Gas Turbine (OCGT) projects in 2016. Initial consideration of £18.6 million was settled in cash on 3 January 2017, with the amount held as a liability in the balance sheet at 31 December 2016. The final purchase price depends upon future clearing prices in T-4 capacity market auctions from 2016 to 2020. The range of possible outcomes being zero further consideration if the capacity market clearing price does not exceed £28/KW in these auctions, with a maximum contingent consideration payable of £72 million, based on a clearing price of £75/KW. The fair value of the contingent consideration at 31 December 2017 was assessed at £4.1 million (2016: £3.8 million) based on a projection of likely future capacity market clearing prices, discounted to present value at a risk-free rate of 2%.
Strategic reportG
overnanceFinancial statem
entsShareholder inform
ation

Drax Group plc Annual report and accounts 2017144
SECTION 4Financing and capital structure
This section gives further information regarding the Group’s capital structure (equity and debt financing) and cash generated from operations during the year.
4.1 RECONCILIATION OF NET DEBTNet debt is calculated by taking our borrowings (note 4.3) and subtracting cash and cash equivalents (note 4.2). The table below reconciles net debt in terms of changes in these balances across the year.
Years ended 31 December
2017£m
2016£m
Net debt at 1 January (93.5) (186.6)
(Decrease)/increase in cash and cash equivalents (4.0) 86.7
Increase in borrowings (267.8) (1.5)
Effect of changes in foreign exchange rates (2.1) 7.9
Net debt at 31 December (367.4) (93.5)
A reconciliation of the increase in borrowings during the year is set out in the table on page 145.
4.2 CASH AND CASH EQUIVALENTSCash and cash equivalents include cash held in current and other deposit accounts that are accessible on demand. It is our policy to invest available cash on hand in short-term, low-risk bank accounts or money market funds.
As at 31 December
2017£m
2016£m
Cash and cash equivalents 222.3 228.4
4.3 BORROWINGSOn 10 February 2017, the Group entered into a £375 million acquisition finance facility, of which £200 million was drawn and utilised in the purchase of Opus Energy (see note 5.1). This facility, along with the existing term loans at 1 January 2017, was repaid in full on 5 May 2017, when the Group undertook a refinancing exercise.
The new financing structure consists of £550 million of high-yield, publicly traded bonds listed on the Luxembourg exchange. This includes £350 million 4.25% fixed rate notes and £200 million floating rate notes of 4.00% above LIBOR, which all mature in April 2022.
On the same day, the Group entered into a £350 million Facility comprised of a revolving credit facility (RCF) with a value of £315 million (2016: £400 million) and an index-linked term loan of £35 million.
The RCF matures in April 2021, with an option to extend by one year, and has a margin of 150 basis points over LIBOR. At 31 December 2017, the RCF had been utilised to draw down letters of credit with a total value of £35.7 million (2016: 57.9 million).
The Group also has access to a $25 million revolving 30 day facility in the US business. This facility was fully drawn down at 31 December 2017 and had a Sterling equivalent value of £18.5 million at that date.
The term loan was fully drawn at inception and remains fully drawn at 31 December 2017 (2016: term loans of £325 million fully drawn).
The Group has no other undrawn debt facilities, although it does have access to certain non-recourse trade receivable finance facilities as described on note 4.4 which are utilised to accelerate working capital cash flows.
Accounting policyThe Group measures all debt instruments (whether financial assets or financial liabilities) initially at fair value, which equates to the principal value of the consideration paid or received. Subsequent to initial measurement, debt instruments are measured at amortised cost using the effective interest method. Transaction costs (any such costs incremental and directly attributable to the issue of the financial instrument) are included in the calculation of the effective interest rate and are amortised through the income statement over the life of the instrument.
Fees paid on the establishment of loan facilities are recognised as transaction costs of the loan to the extent that it is probable that some or all of the facility will be drawn down. Where this is the case, the fee is deferred until the draw-down occurs.

Drax Group plc Annual report and accounts 2017 145
4.3 BORROWINGS CONTINUEDAnalysis of borrowingsAn analysis of the changes in borrowings during the year is shown in the table below:
As at 31 December 2017
Borrowingsbefore
deferredfinance costs
£m
Deferredfinance costs
£m
Netborrowings
£m
Borrowings at 1 January 329.0 (7.1) 321.9
Draw-down of Opus Energy acquisition facility 200.0 (3.8) 196.2
Draw-down of US revolving facility 18.5 – 18.5
Borrowings repaid on 5 May 2017 (493.8) 10.9 (482.9)
Fixed rate loan notes drawn down 350.0 (11.4) 338.6
Floating rate loan notes drawn down 200.0 (6.5) 193.5
Indexation of linked loan 1.8 – 1.8
Amortisation of deferred finance costs (note 2.5) – 2.4 2.4
Changes in finance lease liabilities (0.3) – (0.3)
Borrowings at 31 December 605.2 (15.5) 589.7
As at 31 December 2017
Borrowingsbefore
deferredfinance costs
£m
Deferredfinance costs
£m
Netborrowings
£m
Loan notes 550.0 (15.5) 534.5
Term loans 35.9 – 35.9
US revolving facility 18.5 – 18.5
Finance lease liabilities 0.8 – 0.8
Total borrowings 605.2 (15.5) 589.7
Less current portion (18.6) – (18.6)
Non-current borrowings 586.6 (15.5) 571.1
As at 31 December 2016
Borrowingsbefore
deferredfinance costs
£m
Deferredfinance costs
£m
Netborrowings
£m
Term loans 327.9 (7.1) 320.8
Finance lease liabilities 1.1 – 1.1
Total borrowings 329.0 (7.1) 321.9
Less current portion (37.9) 2.0 (35.9)
Non-current borrowings 291.1 (5.1) 286.0
The borrowings from the refinancing exercise in May, including the term loan, the loan notes and the RCF are secured against the assets of a number of the Group’s subsidiaries, with the exception of the US subsidiary’s land and buildings.
In addition, the Group has a secured commodity trading line, which allows us to transact prescribed volumes of commodity trades without the requirement to post collateral and FX trading lines with certain banks. Counterparties to these arrangements are entitled to share in the security as described above. As at 31 December 2017, this value was £3.6 million (2016: £0.9 million).
The US revolving facility is unsecured.
Strategic reportG
overnanceFinancial statem
entsShareholder inform
ation

Drax Group plc Annual report and accounts 2017146
SECTION 4: FINANCING AND CAPITAL STRUCTURE
4.4 CASH GENERATED FROM OPERATIONSCash generated from operations is the starting point of our cash flow statement on page 126. The table below makes adjustments for any non-cash accounting items to reconcile our net profit for the year to the amount of cash we have generated from our operations.
Years ended 31 December
2017£m
2016£m
(Loss)/profit for the year (151.1) 193.9
Adjustments for:
Interest payable and similar charges 66.3 7.0
Interest receivable (0.2) (0.6)
Tax (credit)/charge (32.1) 3.2
Depreciation and amortisation 167.2 109.5
Losses on disposal 14.5 3.8
Unrealised losses/(gains) on derivative contracts 156.1 (176.8)
Other losses 0.4 –
Defined benefit pension scheme current service cost 7.3 6.0
Non-cash charge for share-based payments 6.1 5.2
Close out of currency contracts(1) (9.8) 14.0
Operating cash flows before movement in working capital 224.7 165.2
Changes in working capital:
Decrease/(increase) in inventories 15.4 (63.5)
Decrease in receivables 60.6 28.6
(Decrease)/increase in payables (22.4) 73.7
Decrease in carbon assets 0.6 11.1
Decrease in ROC assets 112.1 12.5
Total cash released from working capital 166.3 62.4
Defined benefit pension scheme contributions (15.3) (14.5)
Cash generated from operations 375.7 213.1
Note:(1) During 2016 we closed out a number of in-the-money forward foreign currency purchase contracts with a total value of £14 million. As these contracts were designated into hedge accounting
relationships under IAS 39, the benefit is being recognised in the income statement in the period the hedged transaction occurs. The net loss for 2017 includes £10 million of income in relation to the unwinding of this position, for which the cash was received in 2016.
The Group has access to a facility that enables it to accelerate the cash flows associated with trade receivables arising from B2B Energy Supply sales on a non-recourse basis. The net cash benefit derived from this facility during 2017 was £110 million (2016: £74 million) and is recognised as a reduction in receivables in the table above. We estimate that approximately 30% of this cash would have been received in the ordinary course of business by 31 December 2017 had the facility not been in place.
The Group also has access to similar non-recourse facilities to accelerate cash flows on ROC receivables. No ROC receivables have been sold through these facilities in 2017 (2016: net cash benefit of £111 million). The reduction in ROCs in the table above reflects a reduction in the number of generation units that give rise to ROCs following the approval of the CfD contract for one of our biomass-fuelled units in December 2016.

Drax Group plc Annual report and accounts 2017 147
4.5 EQUITY AND RESERVESOur ordinary share capital reflects the total number of shares in issue, which are publicly traded on the London Stock Exchange.
Accounting policyOrdinary shares are classified as equity as evidenced by their residual interest in the assets of the Company after deducting its liabilities. Incremental costs directly attributable to the issue of new shares or options are shown in equity as a deduction, net of tax, from the proceeds.
As at 31 December
2017£m
2016£m
Authorised:
865,238,823 ordinary shares of 11 16⁄29 pence each 100.0 100.0
Issued and fully paid:
2017: 407,034,429 ordinary shares of 11 16⁄29 pence each 47.0 47.0
47.0 47.0
The movement in allotted and fully paid share capital of the Company during the year was as follows:
Years ended 31 December
2017(number)
2016(number)
At 1 January 406,700,321 406,317,162
Issued under employee share schemes 334,108 383,159
At 31 December 407,034,429 406,700,321
The Company has only one class of shares, which are ordinary shares of 11 16⁄29 pence each, carrying no right to fixed income. No shareholders have waived their rights to dividends.
Shares issued under employee share schemesOn 21 December 2017, 152,169 shares were issued on early vesting of the Group’s Bonus Matching Plan (BMP) by two individuals who had retired and discretion was used to vest the shares. On 1 March 2017, 140,888 shares were issued in satisfaction of shares vesting in accordance with the rules of the Group’s BMP. Throughout January to December 2017, a total of 41,051 shares were issued in satisfaction of options vesting in accordance with the rules of the Group’s Savings-Related Share Option Plan.
Translation reserveExchange differences relating to the translation of the net assets of the Group’s US-based subsidiaries from their functional currency (US Dollar) into Sterling for presentation in these consolidated accounts recognised in the translation reserve.
Years ended 31 December
2017£m
2016£m
At 1 January (10.2) (1.1)
Exchange differences on translation of foreign operations 3.4 (9.1)
At 31 December (6.8) (10.2)
Other reservesThe share premium account reflects amounts received in respect of issued share capital that exceed the nominal value of the shares issued. Other equity reserves reflect the impact of certain historical transactions, which are described under the table below.
Capital redemption reserve Share premium Merger reserve
2017£m
2016£m
2017£m
2016£m
2017£m
2016£m
At 1 January 1.5 1.5 424.2 424.2 710.8 710.8
Issue of share capital – – 0.1 – – –
At 31 December 1.5 1.5 424.3 424.2 710.8 710.8
The capital redemption reserve arose when the Group completed a share buy-back programme in 2007.
The share premium and the merger reserve arose on the financial restructuring of the Group which took place in 2005. Movements in the share premium reserve reflects amounts received on the issue of shares under employee share schemes.
Movements in the hedge reserve, which reflect the change in fair value of derivative financial instruments designated into hedge accounting relationships in accordance with IFRS, are set out in note 7.4.
Strategic reportG
overnanceFinancial statem
entsShareholder inform
ation

Drax Group plc Annual report and accounts 2017148
SECTION 5Other assets and liabilities
This section provides information on the assets and liabilities in the Consolidated balance sheet that are not covered in other sections, including goodwill, other intangible assets and the provision for reinstatement.
5.1 ACQUISITIONSAccounting policyAcquisitions of businesses are recognised at the point the Group obtains control of the target (the acquisition date). The consideration transferred and the assets and liabilities acquired are measured at their fair value on the acquisition date. The assets and liabilities acquired are recognised in the Consolidated balance sheet and the profits of the acquired business are recognised in the Consolidated income statement from the acquisition date. Acquisition-related costs are recognised in the income statement in the period the acquisition occurs in the transaction costs line. Goodwill is measured as the excess of the fair value of the consideration transferred over the fair value of the identifiable net assets acquired.
Acquisition of Opus Energy Group Limited (Opus Energy)The acquisition of Opus Energy was approved by shareholders on 8 February 2017 and subsequently completed on 10 February 2017; the Group acquired 100% of the issued share capital on this date.
Opus Energy is a well-established B2B energy supply business serving business customers principally in the SME market, providing diversification of our retail offering and a robust platform for growth in line with our strategy. Opus Energy has contributed positively to earnings and cash flow immediately following the acquisition.
The purchase consideration was £340 million plus interest calculated on the amount of Opus Energy’s net assets from 31 March 2016 to the acquisition date. The total consideration of £367 million was funded by a combination of existing cash reserves (£167 million) and partial drawing of a £375 million acquisition facility (£200 million). This facility was repaid as part of the refinancing described in note 4.3.
Acquisition-related costs amounted to £7.8 million.
Following a detailed exercise to review the assets and liabilities, including intangible assets, the fair values acquired were as follows:
Opus Energy £m
Financial assets 213.3
Property, plant and equipment 6.7
Financial liabilities (195.4)
Intangible assets
Customer-related assets 211.0
Brand 11.3
Software 1.9
Total identifiable intangible assets 224.2
Deferred tax liability (40.7)
Total identifiable net assets 208.1
Goodwill 159.2
Fair value of consideration payable 367.3
The revenue and results of Opus Energy from the date of acquisition to the year end were as follows:
Income statement items for the period from 10 February to 31 December 2017
Revenue 610.7
EBITDA 28.9
Profit 22.5
The figures above have changed from those disclosed in the interim financial statements published on 19 July 2017. The Group has continued to review and align estimates for the B2B Energy Supply business. This process resulted in a number of remeasurements reducing the fair value of the net assets acquired by £4.4 million, with a corresponding increase in goodwill. The values shown above are now final.
Following the acquisition, the Group has been able to identify and measure the fair value of existing customer contracts, the Opus Energy brand and software. The assets will be amortised over their useful economic lives as follows:
– Existing customer contracts 11 years (reducing balance) – Brand 10 years (straight line) – Software 3 years (straight line)

Drax Group plc Annual report and accounts 2017 149
5.1 ACQUISITIONS CONTINUEDThe fair value measurement of the existing customer contracts requires assumptions to be made, in particular regarding margins on current customer contracts, future contract renewal rates and future margins on renewed contracts. The goodwill of £159 million recognised on acquisition is largely reflective of potential customer contracts and growth opportunities together with the assembled workforce. None of the goodwill is deductible for tax purposes.
The financial assets acquired include £130 million of receivables, the majority of which reflect trade receivables for energy supplied to customers. By virtue of their short tenor, the fair value of these receivables is considered to be the contractual amounts receivable less any provision for doubtful debts. The provision for doubtful debts as at the acquisition date was £20 million.
Additional financial informationThe consolidated results of the Group, assuming Opus Energy had been acquired at the beginning of the year, would show revenue of £3,775.7 million (compared to reported revenue of £3,685.2 million), EBITDA of £231.6 million (compared to the reported EBITDA of £228.9 million) and a loss after taxation of £149.0 million (compared to a reported loss after taxation of £151.1 million). This information includes the revenue and profits made by Opus Energy between 1 January 2017 and 10 February 2017, without accounting policy alignments and/or the impact of fair value uplifts resulting from acquisition accounting adjustments. This information is not necessarily indicative of the results of the combined Group that would have occurred had the acquisition actually been made at the beginning of the year, or indicative of the future results of the combined Group.
5.2 GOODWILLGoodwill arises on the acquisition of a business when the consideration paid exceeds the fair value of the assets acquired. During 2017, we recognised additional goodwill on the purchase of Opus Energy (see note 5.1), and wrote off goodwill of £3.8 million in respect of Billington Bioenergy following the sale of the business.
Accounting policyGoodwill is initially recognised and measured at the acquisition date. Goodwill is not amortised but reviewed for impairment at least annually. For the purpose of impairment testing, goodwill is allocated to the CGU to which it relates and the recoverable amount for that CGU assessed. The table below shows movements and balances:
Goodwill £m
Cost and carrying amount:
At 1 January 2016, 31 December 2016 and 1 January 2017 14.5
Acquisition of Opus Energy 159.2
Disposal of Billington Bioenergy (3.8)
At 31 December 2017 169.9
GoodwillTotal goodwill in the Consolidated balance sheet at 31 December 2017 was £170 million, with £11 million arising on the acquisition of Haven Power in 2009 attributed to the Haven Power CGU and £159 million arising on the acquisition of Opus Energy in the year (see note 5.1)attributed to the Opus Energy CGU.
The recoverable amount of the Haven Power and Opus Energy CGUs is measured annually, based on a value-in-use calculation using the Group's established planning model. The elements reflected in this calculation are the same as those used for the wider asset impairment review conducted by the Group as at 31 December 2017 and are disclosed in note 2.4. Cash flows beyond the business plan period are inflated into perpetuity using a growth rate of 1%.
The carrying amount of the Haven Power CGU at 31 December 2017 was £23 million. The expected future cash flows of the CGU were discounted using a pre-tax discount rate of 8.1% (calculated based on independent analysis commissioned by the Group, adjusted to the specific circumstances and risk factors affecting the Group's B2B Energy Supply business). We believe that this rate reflects the prospects for a well-established B2B Energy Supply business. The value in use of the Haven Power CGU, including the goodwill, was significantly in excess of its carrying amount.
The carrying amount of the Opus Energy CGU at 31 December 2017 was £366 million, including intangible assets with a net book value of £186 million as described in note 5.3. Following the acquisition in 2017, the appropriate discount rate was assessed as being higher for Opus Energy than for Haven Power. The expected future cash flows were discounted using a range of discount rates from the Group's central B2B Energy Supply assumption (8.1%) to the rate used in the valuation of Opus Energy at the acquisition date (10.7% – see note 5.3). The application of discount rates across this range does not result in a recoverable amount for Opus Energy below its carrying amount.
The Group has conducted a sensitivity analysis of the estimates of future cash flows of each CGU. This analysis indicates that any reasonably possible change in the key assumptions, which are customer margins and supply volumes, would not cause an impairment loss in respect of goodwill.
Strategic reportG
overnanceFinancial statem
entsShareholder inform
ation

Drax Group plc Annual report and accounts 2017150
SECTION 5: OTHER ASSETS AND LIABILITIES
5.3 INTANGIBLE ASSETSIntangible assets are not physical in nature but are identifiable and separable from other assets. Intangible assets can be acquired in business combinations (such as the acquisition of Opus Energy during 2017) or purchased separately. The Group routinely purchases computer software and carbon emissions allowances, which are considered intangible assets.
Accounting policyIntangibles acquired in business combinations are measured at fair value on the acquisition date. Other intangible assets are measured at cost. Cost comprises the purchase price (net of any discount or rebate) and any directly attributable costs to bring the asset into the condition and location required for use as intended by management.
Intangible assets are amortised over their anticipated useful lives. Useful lives are reviewed at each balance sheet date. No changes to useful lives were made as at 31 December 2017. Amortisation calculations are specific to each category of assets and are explained in further detail below.
Carrying amounts are assessed for indicators of impairment at each balance sheet date. The customer-related assets and brand are attributed to the Opus Energy CGU and details of the impairment test relating to this CGU are included in note 5.2.
Significant estimation uncertaintyThe valuation of the intangible assets recognised on the acquisition of Opus Energy is dependent upon a number of assumptions. The most significant of these assumptions are explained under each of the asset headings below.
Customer-related assets
£mBrand
£m
Computer software
£m
Developmentassets
£mCarbon
£mTotal
£m
Cost and carrying amount:
At 1 January 2016 – – – – 11.8 11.8
Utilised in period – – – – (11.8) (11.8)
Additions at cost – – – – 0.7 0.7
Acquisition of OCGT projects – – – 21.0 – 21.0
At 1 January 2017 – – – 21.0 0.7 21.7
Transferred from PPE – – 39.4 – – 39.4
Utilised in period – – – – (0.7) (0.7)
Additions at cost – – 16.0 – – 16.0
Acquisition of Opus Energy (note 5.1) 211.0 11.3 2.6 – – 224.9
At 31 December 2017 211.0 11.3 58.0 21.0 – 301.3
Accumulated amortisation
At 1 January 2016 – – – – – –
Charge for period – – – – – –
At 1 January 2017 – – – – – –
Transferred from PPE – – 25.0 – – 25.0
Acquisition of Opus Energy – – 0.7 – – 0.7
Charge for period 35.6 1.1 6.9 – – 43.6
At 31 December 2017 35.6 1.1 32.6 – – 69.3
Net book value
At 31 December 2016 – – – 21.0 0.7 21.7
At 31 December 2017 175.4 10.2 25.4 21.0 – 232.0

Drax Group plc Annual report and accounts 2017 151
5.3 INTANGIBLE ASSETS CONTINUEDCustomer-related assetsCustomer-related assets reflect the value of customer contracts acquired on the acquisition of Opus Energy in February 2017, which provided the Group with access to a broad customer base with contracted cash flows. The asset valuation of £211 million reflects the estimated acquisition-date value of the future cash flows associated with this customer base and is dependent upon estimates of both current and expected future contract margins and assumed customer retention rates. The cash flows have been discounted using a pre-tax discount rate of 10.7%. The asset has a useful life of 11 years, calculated based on customer churn-rate analysis, and is being amortised on a reducing balance basis to reflect the diminishing rate of contract renewals over time.
Opus Energy brandThe Opus Energy brand was acquired as part of the acquisition in February 2017 and valued at £11 million on a relief-from-royalty method. The brand is being amortised on a straight-line basis over its assumed 10 year useful life.
Computer softwareIn light of continued investment and the increased significance of the carrying amount, the Group’s software assets are presented separately within intangible assets (2016: included within tangible fixed assets, see note 3.1). Additions in the period include assets acquired in the Opus Energy acquisition in addition to those in the ordinary course of business, which principally reflect ongoing investment in business systems to support the B2B Energy Supply segment. Software assets are amortised on a straight-line basis over estimated useful lives ranging between three and five years.
Computer software assets in the course of construction of £11.1 million at 31 December 2017 (2016: £nil) were capitalised in the year.
Development assetsThe development assets arose on the acquisition of four Open Cycle Gas Turbine projects in December 2016 and reflect the value of planning and consents acquired as part of that transaction. Until operations commence, the assets are considered to have an indefinite life and thus are not amortised and will be subject to impairment testing at each balance sheet date.
At 31 December 2017, the recoverable amount of the development assets was established using a value-in-use calculation derived from the Group's established planning model, consistent with the approach described in note 2.4. The assessment incorporated assumptions related to likely capacity market clearing prices, construction costs, the ongoing revenues to be derived from the projects once constructed and the direct costs of generating those revenues. The analysis indicated a recoverable amount for the development assets in excess of their carrying amount.
Carbon assetsCarbon assets arise on the purchase of CO2 emissions allowances in excess of the amount allocated under the Emissions Trading Scheme and required for the current financial year, and are measured at cost, net of any impairment. Given their short tenor, carbon assets are not amortised.
The charge to the income statement, within fuel costs, reflects the cost of emissions allowances required to satisfy the obligation for the current year and takes into account generation and market purchases allocated to the current financial year, and to the extent further purchases are required, the market price at the balance sheet date.
Post balance sheet eventsThe 2021 T-4 capacity market auction closed in February 2018 at a clearing price of £8.40/KW. The Group secured agreements to provide a total of 1,217MW of capacity from two existing coal units, worth a total of £10 million for the period October 2021 to September 2022.
Two of the Group’s Open Cycle Gas Turbine (OCGT) projects also participated in the auction but exited above the clearing price. The Group will continue to develop these options with an expectation that they will go on to participate in the next T-4 auction. This outcome does not change the Group’s view of the recoverable amount of the existing investments in the OCGT projects (see above) or the fair value of the contingent consideration that may become payable following future capacity market outcomes (see note 3.6).
Strategic reportG
overnanceFinancial statem
entsShareholder inform
ation

Drax Group plc Annual report and accounts 2017152
SECTION 5: OTHER ASSETS AND LIABILITIES
5.4 PROVISIONSWe make provision for reinstatement to cover the estimated costs of decommissioning and demolishing our generation assets and remediating the site at the end of the useful economic lives of the assets. The amount represents the present value of the expected costs.
Accounting policyProvisions are recognised when the Group has a present obligation (legal or constructive) as a result of a past event, it is probable that the Group will be required to settle that obligation and a reliable estimate can be made of the amount of the obligation.
Specifically, provision is made for the estimated decommissioning costs at the end of the useful economic life of the Group’s generating assets, when a legal or constructive obligation arises, on a discounted basis. The amount provided represents the present value of the expected costs. In view of the uncertainty of assessing the amount of any proceeds from the disposal of the assets at the decommissioning date, no reduction in the provision is made for any such proceeds. The discount rate used is a risk-free pre-tax rate of 1.8% (2016: 1.9%), reflecting the fact that the estimated future cash flows have built-in risks specific to the liability. An amount equivalent to the discounted provision is capitalised within property, plant and equipment and is depreciated over the useful lives of the related assets. The unwinding of the discount is included in interest payable and similar charges. The balance also includes a small provision in respect of dilapidation provisions for leased offices acquired in the Opus Energy transaction in 2017.
Provisions £m
Carrying amount:
At 1 January 2017 35.0
Additions 0.3
Acquisition of Opus Energy 0.3
Adjustment for changes in assumptions 0.1
Unwinding of discount 0.6
At 31 December 2017 36.3
The decommissioning provision is based on the assumption that the decommissioning and reinstatement will take place at the end of the expected useful life of the power station in 2039, and has been estimated using existing technology at current prices based on independent third-party advice, updated on a triennial basis. The most recent update took place in December 2017.
Post balance sheet eventsSubsequent to the year end, on 8 February 2018 the Group announced its intention to close the headquarters of the Pellet Production business in Atlanta, Georgia and move these functions to a location closer to the operational sites in Monroe, Louisiana. No amounts have been included in respect of this decision in these financial statements.

Drax Group plc Annual report and accounts 2017 153
The notes in this section relate to the remuneration of our directors and employees, including our obligations under retirement benefit schemes.
6.1 EMPLOYEES AND DIRECTORSThis note provides a more detailed breakdown of the cost of our employees, including executive directors. The average number of employees in Operations (staff based at production sites), B2B Energy Supply services (employees in our B2B Energy Supply segment) and Central and administrative functions are also provided.
Further information in relation to pay and remuneration of the executive directors can be found in the report of the Remuneration Committee, starting on page 81.
The number of staff employed by the Group, and the associated costs, increased from the previous year following the purchase of Opus Energy and the expansion of our US-based Pellet Production business.
Staff costs (including executive directors)
Years ended 31 December
2017£m
2016£m
Included in other operating and administrative expenses (note 2.3)
Wages and salaries 103.7 74.3
Social security costs 11.9 8.1
Pension costs 15.4 12.3
Share-based payments (note 6.2) 6.1 5.2
137.1 99.9
Average monthly number of people employed (including executive directors)
Years ended 31 December
2017(number)
2016(number)
Power Generation operations 667 645
Pellet Production operations 186 130
B2B Energy Supply services 1,349 399
Central and administrative functions 305 293
2,507 1,467
6.2 SHARE-BASED PAYMENTSWe operate two share option schemes for our employees – the Performance Share Plan (PSP) for directors and senior executives (which replaced the Bonus Matching Plan (BMP) from 2017), and the Savings-Related Share Option Plan (SAYE) for all qualifying employees. We incur a non-cash charge in respect of these schemes in our income statement, which is set out below along with a detailed description of each scheme and the number of options outstanding.
Accounting policyAll of the Group’s share-based payments are equity settled. Equity-settled share-based payments are measured at the fair value of the equity instrument at the date of grant and are recognised in the income statement on a straight-line basis over the relevant vesting period, based on an estimate of the shares that will ultimately vest as a result of the effect of non-market-based vesting conditions, which is revised at each balance sheet date.
Costs recognised in the income statement in relation to share-based payments during the year were as follows:
Years ended 31 December
2017£m
2016£m
PSP (granted from 2017) 0.5 –
DSP (granted from 2017) 0.1 –
BMP (granted in periods prior to 2017) 1.5 2.6
SAYE 4.0 2.6
6.1 5.2
SECTION 6Our people
Strategic reportG
overnanceFinancial statem
entsShareholder inform
ation

Drax Group plc Annual report and accounts 2017154
6.2 SHARE-BASED PAYMENTS CONTINUEDShare Incentive Plan (SIP)Between 2008 and 2010, qualifying employees could buy up to £1,500 worth of Partnership Shares in any one tax year. Matching shares were awarded to employees to match any shares they bought, in a ratio of one-to-one, with the cost of matching shares borne by the Group. There have been no awards under the SIP Partnership and Matching Share plan since 2010.
Shares in the Company held under trust and under the Company’s control as a result of the SIP were as follows:
Sharesheld at
1 January2017
(number)
Sharesacquired
during year(number)
Sharestransferredduring year
(number)
Sharesheld at
31 December2017
(number)
Cost at31 December
2017£000
Nominalvalue at
31 December2017
£000
Marketvalue at
31 December2017
£000
SIP 153,034 – (95,435) 57,599 – 7 156
2017 Performance Share Plan (PSP) and Deferred Share Plan (DSP)In 2017, a new share plan was introduced for directors and senior executives, replacing the Bonus Matching Plan. Under the PSP, annual awards of performance and service-related shares are made for no consideration to executive directors and other senior executives up to a maximum of 175% of their annual bonus. Vesting of a proportion of shares is conditional upon whether the Group’s Total Shareholder Return (TSR) matches or outperforms an index (determined in accordance with the scheme rules) over three years and vesting of a proportion of shares is conditional upon performance against the internal balanced corporate scorecard. The fair value of the 2017 PSP awards of £2.8 million is being charged to the income statement on a straight-line basis over the three-year vesting period.
The fair value of PSP awards is calculated using a Monte-Carlo valuation model, which takes into account the estimated probability of different levels of vesting. The key inputs to the valuation model for the 2017 awards are the share price at the grant date (325 pence), expected volatility (44%), and risk-free interest rate (0.13%).
In addition, the Group operates the DSP, which was introduced in 2017 as a vehicle for deferring 35% of the annual bonus of executive directors, which are granted at nil cost and vest after three years subject to continued employment or “good leaver” termination provisions. The share price on the grant date of DSP awards made in 2017 was 325 pence and the fair value of these awards of £0.6 million is being charged to the income statement on a straight-line basis over the three-year vesting period.
Movements in the number of share options outstanding for the PSP and DSP awards are as follows:
2017PSP
(number)
2017DSP
(number)
At 1 January – –
Granted 1,582,309 170,227
Forfeited (292,547) (59,418)
Exercised – –
Expired – –
At 31 December 1,289,762 110,809
50% of the PSP options granted in 2017 will vest conditional on Group TSR relative to the TSR of a comparator group of companies, with the remaining 50% vesting conditional upon the internal balanced corporate scorecard. The share price on the grant date for PSP options awarded in the year was 325 pence and the weighted average fair value of the PSP options granted during the year was 177 pence.
All of the PSP options outstanding at the end of the period had an exercise price of £nil. The weighted average remaining contractual life was 28 months.
The number of options exercisable at the year end was nil.
SECTION 6: OUR PEOPLE
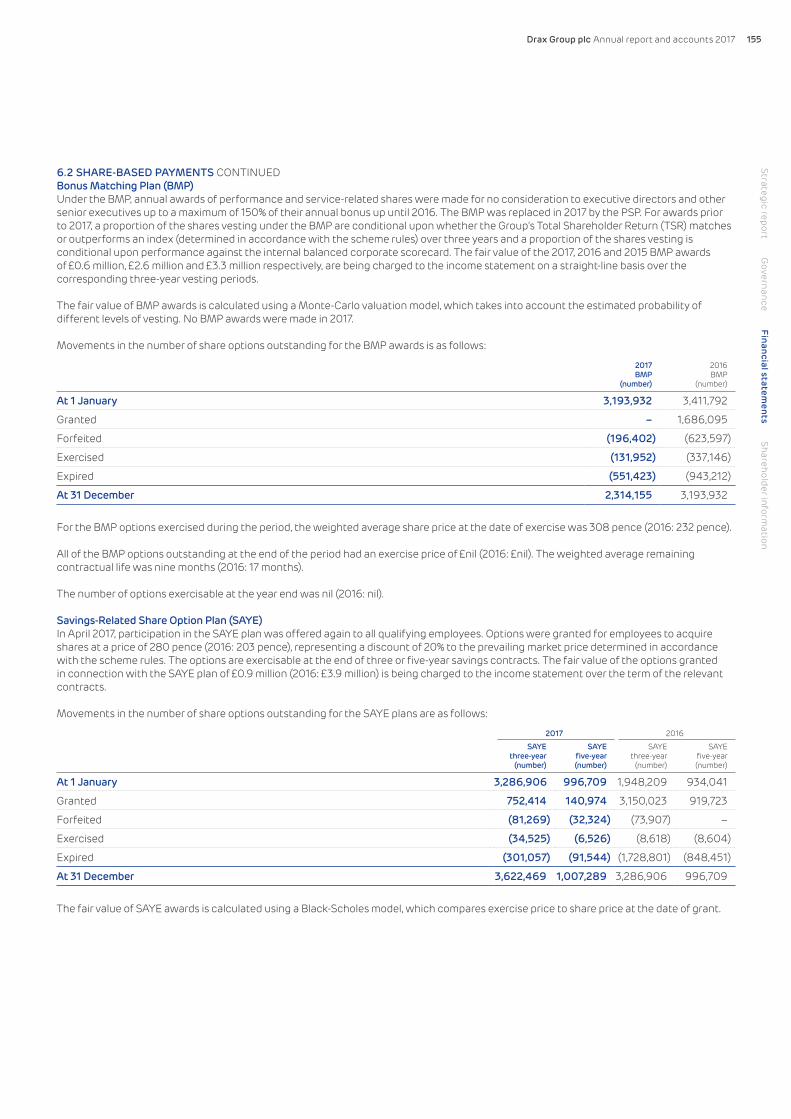
Drax Group plc Annual report and accounts 2017 155
6.2 SHARE-BASED PAYMENTS CONTINUEDBonus Matching Plan (BMP)Under the BMP, annual awards of performance and service-related shares were made for no consideration to executive directors and other senior executives up to a maximum of 150% of their annual bonus up until 2016. The BMP was replaced in 2017 by the PSP. For awards prior to 2017, a proportion of the shares vesting under the BMP are conditional upon whether the Group’s Total Shareholder Return (TSR) matches or outperforms an index (determined in accordance with the scheme rules) over three years and a proportion of the shares vesting is conditional upon performance against the internal balanced corporate scorecard. The fair value of the 2017, 2016 and 2015 BMP awards of £0.6 million, £2.6 million and £3.3 million respectively, are being charged to the income statement on a straight-line basis over the corresponding three-year vesting periods.
The fair value of BMP awards is calculated using a Monte-Carlo valuation model, which takes into account the estimated probability of different levels of vesting. No BMP awards were made in 2017.
Movements in the number of share options outstanding for the BMP awards is as follows:
2017BMP
(number)
2016BMP
(number)
At 1 January 3,193,932 3,411,792
Granted – 1,686,095
Forfeited (196,402) (623,597)
Exercised (131,952) (337,146)
Expired (551,423) (943,212)
At 31 December 2,314,155 3,193,932
For the BMP options exercised during the period, the weighted average share price at the date of exercise was 308 pence (2016: 232 pence).
All of the BMP options outstanding at the end of the period had an exercise price of £nil (2016: £nil). The weighted average remaining contractual life was nine months (2016: 17 months).
The number of options exercisable at the year end was nil (2016: nil).
Savings-Related Share Option Plan (SAYE)In April 2017, participation in the SAYE plan was offered again to all qualifying employees. Options were granted for employees to acquire shares at a price of 280 pence (2016: 203 pence), representing a discount of 20% to the prevailing market price determined in accordance with the scheme rules. The options are exercisable at the end of three or five-year savings contracts. The fair value of the options granted in connection with the SAYE plan of £0.9 million (2016: £3.9 million) is being charged to the income statement over the term of the relevant contracts.
Movements in the number of share options outstanding for the SAYE plans are as follows:
2017 2016
SAYEthree-year
(number)
SAYEfive-year(number)
SAYEthree-year
(number)
SAYEfive-year(number)
At 1 January 3,286,906 996,709 1,948,209 934,041
Granted 752,414 140,974 3,150,023 919,723
Forfeited (81,269) (32,324) (73,907) –
Exercised (34,525) (6,526) (8,618) (8,604)
Expired (301,057) (91,544) (1,728,801) (848,451)
At 31 December 3,622,469 1,007,289 3,286,906 996,709
The fair value of SAYE awards is calculated using a Black-Scholes model, which compares exercise price to share price at the date of grant.
Strategic reportG
overnanceFinancial statem
entsShareholder inform
ation

Drax Group plc Annual report and accounts 2017156
6.2 SHARE-BASED PAYMENTS CONTINUEDThe fair value of SAYE options granted and the inputs to the option pricing model used in the current and previous year are set out in the table below:
Grant date 5 April 2017 5 April 2017 5 April 2016 5 April 2016
Share price at grant date (pence) 328 328 286 286
Vesting period 3 years 5 years 3 years 5 years
Exercise price (pence) 280 280 203 203
Dividend yield 1.8% 2.5% 2.9% 5.0%
Annual risk-free interest rate 0.73% 0.90% 0.81% 0.95%
Expected volatility 41.2% 37.3% 40.0% 37.6%
Fair value of options granted (pence) 106 103 101 82
Expected volatility was determined by calculating the historical volatility of the Group’s share price over the previous three and five years respectively. The expected life used in the model has been adjusted, based on management’s best estimate, for the effects of non-transferability, exercise restrictions and behavioural considerations.
For the SAYE options exercised during the period, the weighted average share price at the date of exercise was 305 pence (2016: 337 pence).
The weighted average exercise price of SAYE options outstanding at the end of the period was 224 pence (2016: 216 pence). The weighted average remaining contractual life was 22 months (2016: 31 months).
The number of options exercisable at the year end was nil (2016: nil).
Additional information in relation to the Group’s share-based incentive plans is included in the Remuneration Committee report.
6.3 RETIREMENT BENEFIT OBLIGATIONSWe operate one defined benefit and four defined contribution pension schemes.
The Drax Power Group (DPG) section of the Electricity Supply Pension Scheme (ESPS) is a defined benefit scheme; a pension arrangement under which participating members receive a pension benefit at retirement determined by the scheme rules. Members are typically entitled to an annual pension on retirement of 1/80th of final pensionable salary for each year of service plus a tax-free lump sum of three times pension.
The Drax Group Personal Pension Plan, Haven Power Personal Pension Plan, Opus Energy Group Personal Pension Plan and Drax Biomass Inc. 401(K) Plan are defined contribution schemes, which provide a retirement benefit that is dependent upon actual contributions made by the Group and members of the relevant scheme.
Accounting policyPayments to defined contribution schemes are recognised as an expense when employees have rendered services that entitle them to the contributions. The income statement charge for the defined contribution scheme represents the contributions due to be paid by the Group in respect of the current period.
For the defined benefit pension scheme, the cost of providing benefits is determined using the projected unit credit method, with actuarial valuations being carried out at the end of each reporting period. Remeasurement of the obligation, comprising actuarial gains and losses, the effect of the asset ceiling (if applicable) and the return on scheme assets (excluding interest), is recognised immediately in the balance sheet with a charge or credit to the statement of comprehensive income in the period in which it occurs. Defined benefit costs, including current service costs, past service costs and gains and losses on curtailments and settlements are recognised in the income statement as part of operating and administrative expenses in the period in which they occur. The net interest expense is recognised in finance costs.
Significant estimation uncertaintyMeasurement of the defined benefit obligation using the projected unit credit method involves the use of key assumptions, including discount rates, inflation rates, salary and pension increases, and mortality rates. These actuarial assumptions are reviewed annually and modified as appropriate. The Group believes that the assumptions utilised in measuring obligations under the scheme are reasonable based on prior experience, market conditions and the advice of scheme actuaries. However, actual results may differ from such assumptions.
The assumptions applied in 2017 have been prepared on a consistent basis with those in the previous period and in accordance with independent actuarial advice received.
SECTION 6: OUR PEOPLE

Drax Group plc Annual report and accounts 2017 157
6.3 RETIREMENT BENEFIT OBLIGATIONS CONTINUEDDefined contribution schemesThe Group operates four defined contribution schemes, the Drax Group Personal Pension Plan, Haven Power Personal Pension Plan, Opus Energy Group Personal Pension Plan and Drax Biomass Inc. 401(K) Plan, for all qualifying employees. Pension costs for the defined contribution schemes are as follows:
Years ended 31 December
2017£m
2016£m
Total included in staff costs (note 6.1) 8.1 5.6
As at 31 December 2017, contributions of £nil (2016: £0.5 million) due in respect of the current reporting period had not been paid over to the schemes. The Group has no further payment obligations once the contributions have been paid.
Defined benefit schemeThe DPG section of the ESPS was closed to new members as from 1 January 2002 unless they qualify through being existing members of another part of the ESPS. Members who joined before this date continue to build up pension benefits as part of the scheme.
The DPG ESPS exposes the Group to actuarial and other risks, the most significant of which are considered to be:
Investment risk The scheme liabilities are calculated using a discount rate set with reference to corporate bond yields; if assets underperform this yield, this will create a deficit. The scheme holds a significant proportion of growth assets (equities, property and direct lending) which, though expected to outperform corporate bonds in the long term, create volatility and risk in the short term. The allocation to growth assets is monitored to ensure it remains appropriate given the scheme’s long-term objectives.
Discount rate risk A decrease in corporate bond yields will increase the value placed upon the scheme’s liabilities, although this will be partially offset by an increase in the value of the scheme’s bond holdings.
Longevity risk The majority of the scheme’s obligations are to provide benefits for the life of the member, so increases in life expectancy will result in an increase in the liabilities of the scheme.
Inflation risk The majority of the scheme’s obligations to pay benefits are linked to inflation, and, as such, higher inflation will lead to higher liabilities. The majority of the assets held by the scheme are either unaffected by or only loosely correlated with inflation, such that an increase in inflation will also increase the deficit. In most cases, caps on inflationary increases are in place to protect against extreme inflation.
Other risks include operational risks (such as paying out the wrong benefits), legislative risks (such as the Government increasing the burden on pension schemes through new legislation) and other demographic risks (such as making a higher proportion of members with dependants eligible to receive pensions from the Group). The Trustees insure certain benefits payable on death before retirement.
A contingent liability exists in relation to the equalisation of Guaranteed Minimum Pension (GMP). See note 7.5 for details.
The most recent funding valuation of the DPG ESPS was carried out by Aon Hewitt, a qualified independent actuary, as at 31 March 2016. The actuarial review at 31 December 2017 is based on the same membership and other data as this funding valuation. The scheme board accepted the advice of the actuary and approved the use of these assumptions for the purpose of assessing the scheme cost. Future valuations are required by law at intervals of no more than three years.
The results of the latest funding valuation at 31 March 2016 have been adjusted to the balance sheet date, taking into account experience over the period since 31 March 2016, changes in market conditions and differences in financial and demographic assumptions. The present value of the defined benefit obligation, and the related current service costs were measured using the projected unit credit method. The principal assumptions used, which reflect the nature and term of the scheme liabilities, are as follows:
As at 31 December
2017% p.a.
2016% p.a.
Discount rate 2.6 2.8
Inflation (RPI) 3.2 3.2
Rate of increase in pensions in payment and deferred pensions 3.0 3.1
Rate of increase in pensionable salaries 3.8 3.8
Mortality assumptions are based on recent actual mortality experience of scheme members and allow for expected future improvements in mortality rates. The assumptions are that a member aged 60 in 2017 will live, on average, for a further 26 years if they are male (2016: 27 years) and for a further 29 years if they are female (2016: 29 years). Life expectancy at age 60 for male and female non-pensioners currently aged 45 is assumed to be 27 and 30 years respectively (2016: 28 and 31 years respectively).
Strategic reportG
overnanceFinancial statem
entsShareholder inform
ation
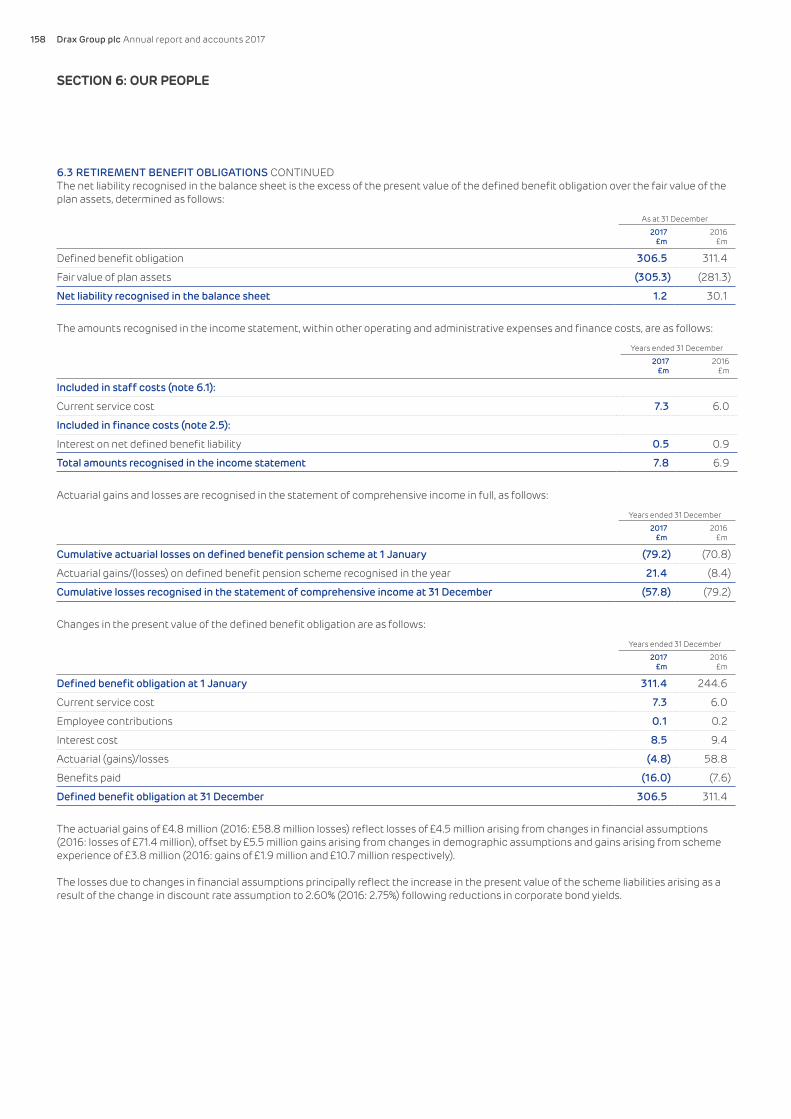
Drax Group plc Annual report and accounts 2017158
6.3 RETIREMENT BENEFIT OBLIGATIONS CONTINUEDThe net liability recognised in the balance sheet is the excess of the present value of the defined benefit obligation over the fair value of the plan assets, determined as follows:
As at 31 December
2017£m
2016£m
Defined benefit obligation 306.5 311.4
Fair value of plan assets (305.3) (281.3)
Net liability recognised in the balance sheet 1.2 30.1
The amounts recognised in the income statement, within other operating and administrative expenses and finance costs, are as follows:
Years ended 31 December
2017£m
2016£m
Included in staff costs (note 6.1):
Current service cost 7.3 6.0
Included in finance costs (note 2.5):
Interest on net defined benefit liability 0.5 0.9
Total amounts recognised in the income statement 7.8 6.9
Actuarial gains and losses are recognised in the statement of comprehensive income in full, as follows:
Years ended 31 December
2017£m
2016£m
Cumulative actuarial losses on defined benefit pension scheme at 1 January (79.2) (70.8)
Actuarial gains/(losses) on defined benefit pension scheme recognised in the year 21.4 (8.4)
Cumulative losses recognised in the statement of comprehensive income at 31 December (57.8) (79.2)
Changes in the present value of the defined benefit obligation are as follows:
Years ended 31 December
2017£m
2016£m
Defined benefit obligation at 1 January 311.4 244.6
Current service cost 7.3 6.0
Employee contributions 0.1 0.2
Interest cost 8.5 9.4
Actuarial (gains)/losses (4.8) 58.8
Benefits paid (16.0) (7.6)
Defined benefit obligation at 31 December 306.5 311.4
The actuarial gains of £4.8 million (2016: £58.8 million losses) reflect losses of £4.5 million arising from changes in financial assumptions (2016: losses of £71.4 million), offset by £5.5 million gains arising from changes in demographic assumptions and gains arising from scheme experience of £3.8 million (2016: gains of £1.9 million and £10.7 million respectively).
The losses due to changes in financial assumptions principally reflect the increase in the present value of the scheme liabilities arising as a result of the change in discount rate assumption to 2.60% (2016: 2.75%) following reductions in corporate bond yields.
SECTION 6: OUR PEOPLE
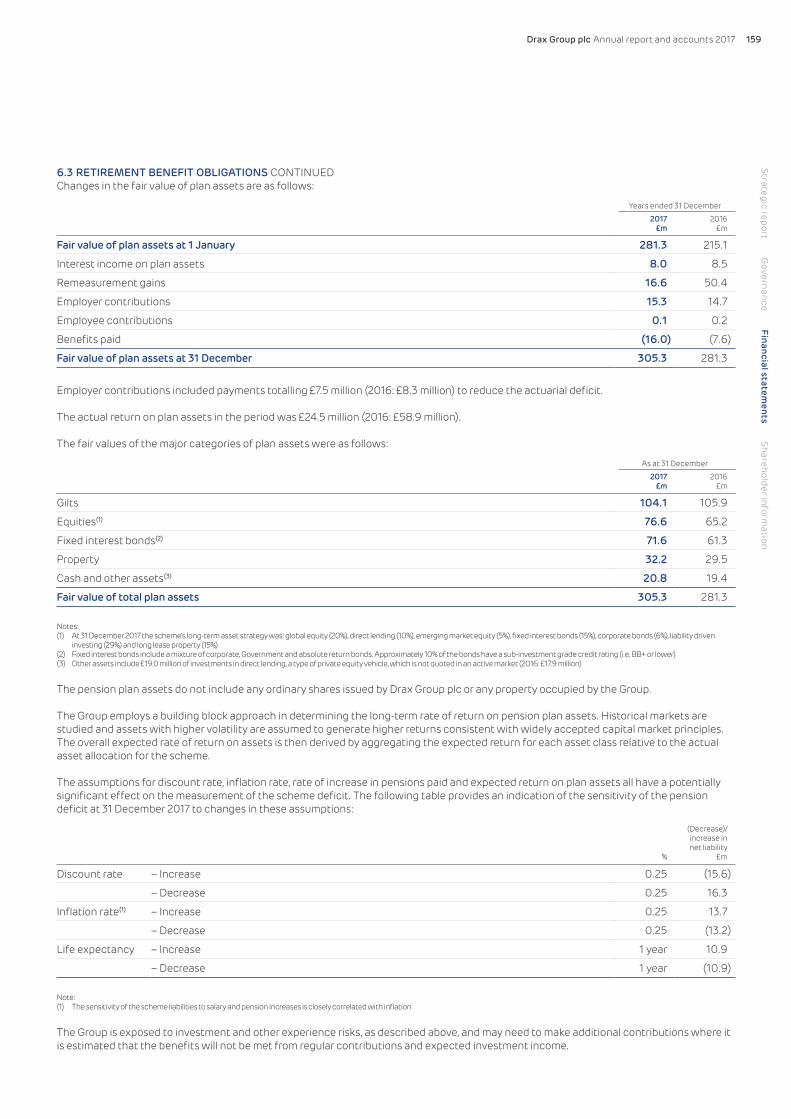
Drax Group plc Annual report and accounts 2017 159
6.3 RETIREMENT BENEFIT OBLIGATIONS CONTINUEDChanges in the fair value of plan assets are as follows:
Years ended 31 December
2017£m
2016£m
Fair value of plan assets at 1 January 281.3 215.1
Interest income on plan assets 8.0 8.5
Remeasurement gains 16.6 50.4
Employer contributions 15.3 14.7
Employee contributions 0.1 0.2
Benefits paid (16.0) (7.6)
Fair value of plan assets at 31 December 305.3 281.3
Employer contributions included payments totalling £7.5 million (2016: £8.3 million) to reduce the actuarial deficit.
The actual return on plan assets in the period was £24.5 million (2016: £58.9 million).
The fair values of the major categories of plan assets were as follows:
As at 31 December
2017£m
2016£m
Gilts 104.1 105.9
Equities(1) 76.6 65.2
Fixed interest bonds(2) 71.6 61.3
Property 32.2 29.5
Cash and other assets(3) 20.8 19.4
Fair value of total plan assets 305.3 281.3
Notes:(1) At 31 December 2017 the scheme’s long-term asset strategy was: global equity (20%), direct lending (10%), emerging market equity (5%), fixed interest bonds (15%), corporate bonds (6%), liability driven
investing (29%) and long lease property (15%)(2) Fixed interest bonds include a mixture of corporate, Government and absolute return bonds. Approximately 10% of the bonds have a sub-investment grade credit rating (i.e. BB+ or lower)(3) Other assets include £19.0 million of investments in direct lending, a type of private equity vehicle, which is not quoted in an active market (2016: £17.9 million)
The pension plan assets do not include any ordinary shares issued by Drax Group plc or any property occupied by the Group.
The Group employs a building block approach in determining the long-term rate of return on pension plan assets. Historical markets are studied and assets with higher volatility are assumed to generate higher returns consistent with widely accepted capital market principles. The overall expected rate of return on assets is then derived by aggregating the expected return for each asset class relative to the actual asset allocation for the scheme.
The assumptions for discount rate, inflation rate, rate of increase in pensions paid and expected return on plan assets all have a potentially significant effect on the measurement of the scheme deficit. The following table provides an indication of the sensitivity of the pension deficit at 31 December 2017 to changes in these assumptions:
%
(Decrease)/increase innet liability
£m
Discount rate – Increase 0.25 (15.6)
– Decrease 0.25 16.3
Inflation rate(1) – Increase 0.25 13.7
– Decrease 0.25 (13.2)
Life expectancy – Increase 1 year 10.9
– Decrease 1 year (10.9)
Note:(1) The sensitivity of the scheme liabilities to salary and pension increases is closely correlated with inflation
The Group is exposed to investment and other experience risks, as described above, and may need to make additional contributions where it is estimated that the benefits will not be met from regular contributions and expected investment income.
Strategic reportG
overnanceFinancial statem
entsShareholder inform
ation

Drax Group plc Annual report and accounts 2017160
6.3 RETIREMENT BENEFIT OBLIGATIONS CONTINUEDAs at 31 December
2017£m
2016£m
2015£m
2014£m
2013£m
Defined benefit obligation (306.5) (311.4) (244.6) (242.1) (220.9)
Fair value of plan assets 305.3 281.3 215.1 207.8 179.2
Deficit (1.2) (30.1) (29.5) (34.3) (41.7)
Experience adjustments on plan liabilities 3.8 10.7 1.7 1.6 8.7
Experience adjustments on plan assets 16.6 50.4 (4.6) 13.6 9.4
The defined benefit obligation includes benefits for current employees of the Group (60%), former employees of the Group who are yet to retire (5%) and retired pensioners (35%). The weighted-average period over which benefit payments are expected to be made, or the duration of the scheme liabilities, was assessed at the 31 March 2016 funding valuation to be 21 years.
Future contributionsThe Group expects to make regular contributions, in respect of service costs, of £10.8 million to the defined benefit pension plan during the 12 months ended 31 December 2018.
In addition to regular contributions, deficit contributions have been agreed with the Trustees based upon the Technical Provisions as at the 31 March 2016 valuation. The Technical Provisions indicate a deficit of £64 million including an estimate of the impact of future service costs, which do not meet the definition of a liability at 31 December 2017 for inclusion in the financial statements. This valuation has not changed materially between the 31 March 2016 valuation date and 31 December 2017.
The Group has agreed to make additional contributions over the period to 31 December 2025 to eliminate the deficit. At this point the scheme is expected to be self-sufficient, unless material adverse changes in economic conditions arise compared to those assumed in the valuation. The Group is confident that the additional contributions are manageable within the Group's business plan. The terms of the Trust Deed allow the Group to recover any surplus once the liabilities of the scheme have been settled, accordingly the deficit contributions will not give rise to an unrecognised surplus.
SECTION 6: OUR PEOPLE

Drax Group plc Annual report and accounts 2017 161
SECTION 7 Risk management
This section provides disclosures around financial risk management, including the financial instruments we use to mitigate such risks.
7.1 FINANCIAL RISK MANAGEMENTThe Group’s activities expose it to a variety of financial risks, including commodity price risk, interest rate risk, foreign currency risk, liquidity risk, counterparty risk and credit risk. The Group’s overall risk management programme focuses on the unpredictability of commodity and financial markets and seeks to manage potential adverse effects on the Group’s financial performance.
The Group uses derivative financial instruments to hedge certain risk exposures. Risk management is carried out by the risk management committees as explained in principal risks and uncertainties (page 51) which identify, evaluate and hedge financial risks in close coordination with the Group’s trading function under policies approved by the Board of directors.
Commodity price riskThe Group is exposed to the effect of fluctuations in commodity prices, particularly the price of electricity, the price of coal, sustainable wood fibre and pellets and other fuels, and the price of CO2 emissions allowances. Price variations and market cycles have historically influenced the financial results of the Group and are expected to continue to do so.
The Group has a policy of securing forward power sales, purchases of fuel and CO2 emissions allowances when profitable to do so. All commitments to sell power under fixed price contracts are designated as cash flow hedges as they reduce the Group’s cash flow exposure resulting from fluctuations in the price of electricity.
The Group purchases coal, sustainable biomass and other fuels under either fixed or variable priced contracts with different maturities from a variety of domestic and international sources. All international physical coal purchase contracts transacted at a fixed price, and financial coal contracts exchanging floating price coal for fixed price amounts, are designated as cash flow hedges as they reduce the Group’s cash flow exposure resulting from fluctuations in the price of coal.
The Group purchases CO2 emissions allowances under fixed price contracts with different maturity dates from a range of domestic and international sources. All commitments to purchase CO2 emissions allowances under fixed price contracts are designated as cash flow hedges as they reduce the Group’s cash flow exposure resulting from fluctuations in the price of CO2 emissions allowances.
Commodity price sensitivityThe sensitivity analysis below has been determined based on the exposure to commodity prices for outstanding monetary items at the balance sheet date. The analysis is based on the Group’s commodity financial instruments held at each balance sheet date.
If commodity prices had been 5% higher/lower and all other variables were held constant, the Group’s:
– loss after tax for the year ended 31 December 2017 would decrease/increase by £1.5 million (2016: profit after tax would increase/decrease by £3.4 million). This is mainly attributable to the Group’s exposure to oil derivatives; and
– the hedge reserve would increase/decrease by £5.6 million (2016: increase/decrease by £36.3 million) mainly as a result of the changes in the fair value of financial coal and power derivatives.
Interest rate riskThe Group is exposed to interest rate risk, principally in relation to its net debt to the extent arising from floating rate debt instruments. Historically, the Group has sought to mitigate this risk with interest rate hedges on a proportion of its debt facilities. The Group has no interest rate swaps outstanding at the balance sheet date; however, this risk management tool remains available to the Group. Information about the Group’s instruments that are exposed to interest rate risk and their repayment schedules is provided below.
Interest rate sensitivityThe sensitivity analysis below has been determined based on the exposure to interest rates for non-derivative instruments at the balance sheet date. For floating rate liabilities, the analysis is prepared assuming the amount of the liability outstanding at the balance sheet date was outstanding for the whole year.
If interest rates had been 1% higher/lower and all other variables were held constant, the Group’s loss after tax and net assets for the year ended 31 December 2017 would decrease/increase by £2.2 million (2016: profit after tax would decrease/increase by £1.8 million) as a result of the changes in interest payable during the period.
Foreign currency riskForward foreign currency exchange contracts are entered into principally in order to hedge purchases of fuel for use in the Power Generation business. These purchases are typically denominated in US Dollars, Canadian Dollars or Euros.
Exchange rate exposures are managed within approved policy parameters utilising a variety of foreign currency exchange contracts. The Group enters into both forward currency purchase and currency option contracts to manage its anticipated foreign currency requirements over a rolling five-year period for both contracted and forecast transactions.
Strategic reportG
overnanceFinancial statem
entsShareholder inform
ation

Drax Group plc Annual report and accounts 2017162
7.1 FINANCIAL RISK MANAGEMENT CONTINUEDForeign currency sensitivityIf Sterling exchange rates had been 5% stronger/weaker against other currencies and all other variables were held constant, the Group’s:
– loss after tax for the year ended 31 December 2017 would increase/decrease by £351.1 million/£285.5 million (2016: profit after tax would decrease/increase by £252.6 million/£277.7 million). This is mainly attributable to the Group’s exposure to foreign currency exchange contracts entered in relation to fuel purchase contracts; and
– other equity reserves would decrease/increase by £111.1 million/£122.8 million (2016: decrease/increase by £78.7 million/£87 million) as a result of the changes in the fair value of foreign currency exchange contracts.
Liquidity riskThe treasury function is responsible for liquidity, funding and settlement management under policies approved by the Board of directors. Liquidity needs are monitored using regular forecasting of operational cash flows and financing commitments. The Group maintains a mixture of cash and cash equivalents, and committed facilities in order to ensure sufficient funding for business requirements.
The following tables set out details of the expected contractual maturity of non-derivative financial liabilities. The tables include both interest and principal cash flows. To the extent that interest flows are floating rate, the undiscounted amount is derived from interest rate curves at the balance sheet date.
As at 31 December 2017
Within 3 months
£m
3 months–1 year
£m>1 year
£mTotal
£m
Term loan, gross value – 1.6 41.7 43.3
Revolving credit facilities, gross value 18.7 – – 18.7
Loan notes, gross value 2.2 21.9 637.2 661.3
Finance lease liabilities, carrying value – 0.1 0.8 0.9
Borrowings, contractual maturity 20.9 23.6 679.7 724.3
Trade and other payables 525.2 204.8 6.5 736.5
546.1 228.4 686.3 1,460.8
As at 31 December 2016
Within 3 months
£m
3 months–1 year
£m>1 year
£mTotal
£m
Term loans, gross value 3.0 46.7 326.7 376.4
Finance lease liabilities, carrying value 0.1 0.1 1.0 1.2
Borrowings, contractual maturity 3.1 46.8 327.7 377.6
Trade and other payables 400.1 181.7 10.1 591.9
403.2 228.5 337.8 969.5
Interest payments are calculated based on forward interest rates estimated at the balance sheet date using publicly available information.
The weighted average interest rate payable at the balance sheet date on our term loans was 4.38% (2016: 4.17%).
The following tables set out details of the expected contractual maturity of derivative financial instruments which are marked to market, based on the undiscounted net cash inflows/(outflows). Where the amount payable or receivable is not fixed, the amount disclosed has been determined by reference to projected commodity prices, or foreign currency exchange rates, as illustrated by the yield or other forward curves existing at the reporting date.
As at 31 December 2017
Within 1 year
£m1–2 years
£m>2 years
£mTotal
£m
Commodity contracts, net 161.9 69.4 16.6 247.9
Forward foreign currency exchange contracts, net 1,104.0 1,173.9 2,331.0 4,608.8
1,265.9 1,243.3 2,347.6 4,856.7
As at 31 December 2016
Within 1 year
£m1–2 years
£m>2 years
£mTotal
£m
Commodity contracts, net 78.7 (25.1) (14.2) 39.4
Forward foreign currency exchange contracts, net 903.5 870.9 1,696.5 3,470.9
982.2 845.8 1,682.3 3,510.3
SECTION 7: RISK MANAGEMENT
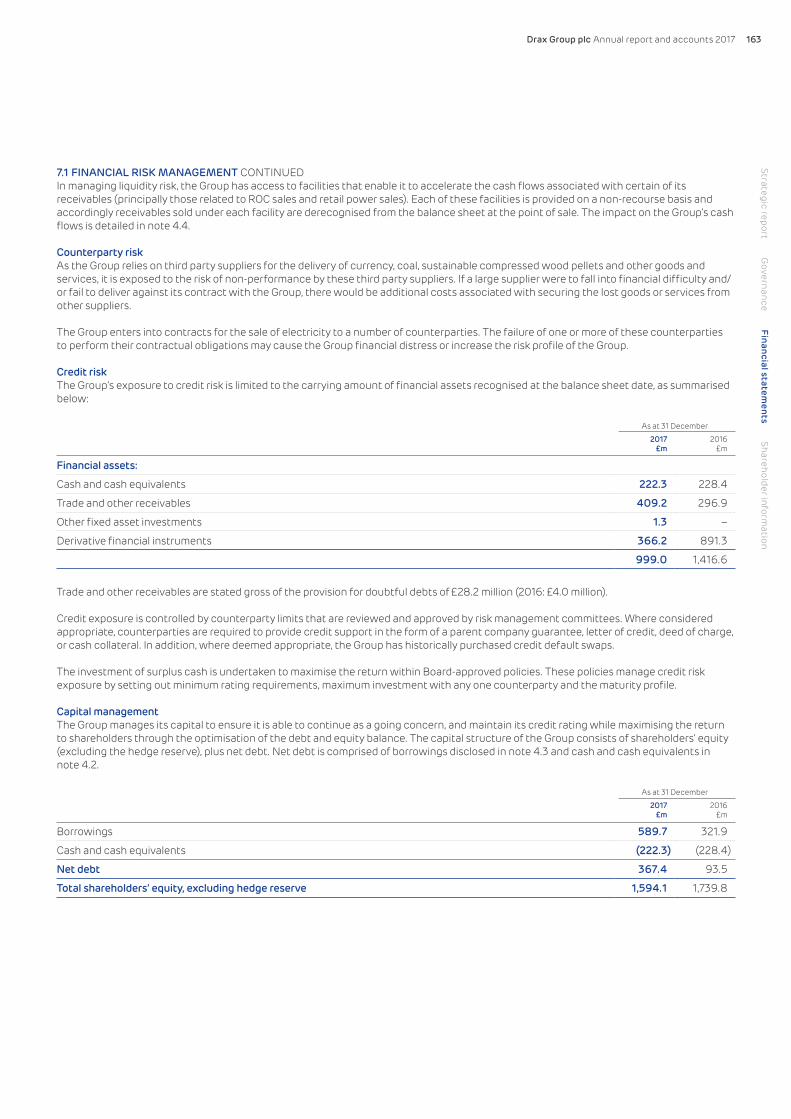
Drax Group plc Annual report and accounts 2017 163
7.1 FINANCIAL RISK MANAGEMENT CONTINUEDIn managing liquidity risk, the Group has access to facilities that enable it to accelerate the cash flows associated with certain of its receivables (principally those related to ROC sales and retail power sales). Each of these facilities is provided on a non-recourse basis and accordingly receivables sold under each facility are derecognised from the balance sheet at the point of sale. The impact on the Group’s cash flows is detailed in note 4.4.
Counterparty riskAs the Group relies on third party suppliers for the delivery of currency, coal, sustainable compressed wood pellets and other goods and services, it is exposed to the risk of non-performance by these third party suppliers. If a large supplier were to fall into financial difficulty and/or fail to deliver against its contract with the Group, there would be additional costs associated with securing the lost goods or services from other suppliers.
The Group enters into contracts for the sale of electricity to a number of counterparties. The failure of one or more of these counterparties to perform their contractual obligations may cause the Group financial distress or increase the risk profile of the Group.
Credit riskThe Group’s exposure to credit risk is limited to the carrying amount of financial assets recognised at the balance sheet date, as summarised below:
As at 31 December
2017 £m
2016 £m
Financial assets:
Cash and cash equivalents 222.3 228.4
Trade and other receivables 409.2 296.9
Other fixed asset investments 1.3 –
Derivative financial instruments 366.2 891.3
999.0 1,416.6
Trade and other receivables are stated gross of the provision for doubtful debts of £28.2 million (2016: £4.0 million).
Credit exposure is controlled by counterparty limits that are reviewed and approved by risk management committees. Where considered appropriate, counterparties are required to provide credit support in the form of a parent company guarantee, letter of credit, deed of charge, or cash collateral. In addition, where deemed appropriate, the Group has historically purchased credit default swaps.
The investment of surplus cash is undertaken to maximise the return within Board-approved policies. These policies manage credit risk exposure by setting out minimum rating requirements, maximum investment with any one counterparty and the maturity profile.
Capital managementThe Group manages its capital to ensure it is able to continue as a going concern, and maintain its credit rating while maximising the return to shareholders through the optimisation of the debt and equity balance. The capital structure of the Group consists of shareholders’ equity (excluding the hedge reserve), plus net debt. Net debt is comprised of borrowings disclosed in note 4.3 and cash and cash equivalents in note 4.2.
As at 31 December
2017 £m
2016 £m
Borrowings 589.7 321.9
Cash and cash equivalents (222.3) (228.4)
Net debt 367.4 93.5
Total shareholders’ equity, excluding hedge reserve 1,594.1 1,739.8
Strategic reportG
overnanceFinancial statem
entsShareholder inform
ation

Drax Group plc Annual report and accounts 2017164
7.2 DERIVATIVE FINANCIAL INSTRUMENTSWe enter into forward contracts for the purchase and sale of physical commodities (principally power, gas, coal, sustainable biomass and CO2 emissions allowances) to secure market level bark and dark green spreads on future electricity sales, and also financial forward and option contracts (principally currency exchange contracts and financial coal and oil derivatives) to fix Sterling cash flows.
We hold these contracts for risk management purposes, to manage key risks facing the business, including commodity price risk and foreign currency risk (see note 7.1).
A successful commercial hedging strategy is critical to our business model. Our policy is to fix exposures to commodity price movements and changes in foreign exchange rates using derivative contracts such as those described above. This strategy aims to de-risk the business, providing security and certainty over cash flows into the future. As at 31 December 2017, due to the strengthening of Sterling against the US Dollar, the fair value of our forward derivative contracts, consisting largely of forward contracts for the purchase of foreign currencies (principally for the purpose of fixing the Sterling cost of sustainable compressed wood pellet purchases), decreased to £160.0 million (2016: £527.8 million). The strengthening in Sterling during 2017 partially reversed the significant mark to market gains posted during 2016 as its value fell following the Brexit vote.
Accounting policyAt the balance sheet date all contracts (subject to certain exemptions described below) must be measured at fair value, which is in essence the difference between the price we have secured in the contract, and the price we could achieve in the market at that point in time.
Changes in fair value are recognised either within the income statement or the hedge reserve, dependent upon whether the contract in question qualifies as an effective hedge under IFRS (see note 7.4).
Where possible, the Group has taken advantage of the own-use exemption which allows qualifying contracts to be excluded from fair value mark-to-market accounting. This applies to certain contracts for physical commodities entered into and held for our own purchase, sale or usage requirements, including forward contracts for the purchase of biomass, and coal from domestic sources.
Contracts which do not qualify for the own-use exemption – principally power, gas, financial oil, financial coal, CO2 emissions allowances and forward foreign currency exchange contracts – are accounted for as derivatives in accordance with IAS 39 and are recorded in the balance sheet at fair value, with changes in fair value reflected through the hedge reserve (note 7.4) to the extent that the contracts are designated as effective hedges in accordance with IAS 39, or the income statement where the hedge accounting requirements are not met. The Group enters into forward contracts solely for the purpose of financial risk management and considers all of its contracts to be economic hedges, regardless of whether the specific criteria for hedge accounting are met.
Derivative financial instruments with a maturity date within 12 months from the balance sheet date are classified as current assets or liabilities. Instruments with a maturity date beyond 12 months are classified as non-current assets or liabilities.
The location in the consolidated financial statements of the changes in fair value of derivative contracts in 2017 is summarised in the table below:
Accounting for derivative contracts
Gains/(losses) on contracts
in 2017£m
Gains/(losses) on contracts
in 2016£m
Accounting treatment for gains/(losses) in the consolidated
financial statements
Commodity contracts
Power 3.8 (88.6) Hedge reserve
Coal from international sources (0.8) 5.6 Income statement
Coal from domestic sources n/a n/a Own-use exemption
Biomass n/a n/a Own-use exemption
CO2 emissions allowances 11.0 (2.7) Hedge reserve
Gas 0.1 (76.5) Income statement
Financial contracts
Foreign currency exchange contracts (234.6) 241.9 Income statement
(225.6) 384.1 Hedge reserve
Financial coal 12.9 (13.7) Income statement
1.5 37.3 Hedge reserve
Financial oil and other financial products 66.3 19.5 Income statement
Total net losses in hedge reserve (209.3) 330.1
Total net losses in income statement (156.1) 176.8
SECTION 7: RISK MANAGEMENT

Drax Group plc Annual report and accounts 2017 165
7.2 DERIVATIVE FINANCIAL INSTRUMENTS CONTINUEDSignificant estimation uncertaintyThe fair values of derivative instruments for commodities and foreign currency exchange contracts are determined using forward price curves. Forward price curves represent the Group’s estimates of the prices at which a buyer or seller could contract today for delivery or settlement of a commodity or foreign exchange payment or receipt, at future dates. The Group generally bases forward price curves upon readily obtainable market price quotations, as the Group’s commodity and forward foreign exchange contracts do not generally extend beyond the actively traded portion of these curves. However, the forward price curves used are only an estimate of how future prices will move and are, therefore, subjective. Where derivative financial instruments include options these are valued using an option pricing model. Inputs to the model include market commodity prices, forward price curves, the term of the option, discount rate and assumptions around volatility based on historical movements. The inputs include assumptions around future transactions and market movements, as well as credit risk and are, therefore, subjective.
Fair value accountingForward contracts for the sale of power, purchase of coal from international sources, purchase of CO2 emissions allowances, financial coal, financial oil, gas (collectively “Commodity contracts”) and foreign currency exchange contracts are recorded in the balance sheet at fair value as follows:
As at 31 December 2017 As at 31 December 2016
Assets £m
Liabilities £m
Assets £m
Liabilities £m
Commodity contracts:
Less than one year 60.5 (79.3) 91.1 (164.0)
More than one year but not more than two years 8.4 (14.4) 9.8 (51.7)
More than two years 0.5 (1.1) 1.9 (7.5)
Forward foreign currency exchange contracts:
Less than one year 115.0 (30.3) 313.9 (87.0)
More than one year but not more than two years 85.5 (20.0) 185.8 (26.0)
More than two years 96.3 (58.7) 288.8 (27.3)
Total 366.2 (203.8) 891.3 (363.5)
Less: non-current portion
Commodity contracts (8.9) 15.5 (11.7) 59.2
Forward foreign currency exchange contracts (181.8) 78.7 (474.6) 53.3
Total non-current portion 190.7 (94.2) 486.3 (112.5)
Current portion 175.5 (109.6) 405.0 (251.0)
The total reduction in the fair value of these contracts of £365.4 million (2016: £506.9 million gain) is recognised in the income statement or the hedge reserve, dependent upon whether the hedge accounting requirements of IAS 39 are met, as follows:
Years ended 31 December
2017 £m
2016 £m
Unrealised (losses)/gains on derivative contracts recognised in arriving at operating profit (156.1) 176.8
Unrealised (losses)/gains on derivative contracts recognised in the hedge reserve (note 7.4) (209.3) 330.1
Total unrealised (losses)/gains on derivative contracts (365.4) 506.9
We maintain a substantial foreign currency hedging programme to secure the Sterling cost of future purchases of fuel in foreign currencies. The vast majority of our fuel purchases, and therefore our currency exchange contracts, are denominated in US Dollars. As noted on page 164, the unrealised losses reflect the strengthening of Sterling against the US Dollar in the year.
Strategic reportG
overnanceFinancial statem
entsShareholder inform
ation

Drax Group plc Annual report and accounts 2017166
7.2 DERIVATIVE FINANCIAL INSTRUMENTS CONTINUEDA material proportion of these contracts are not designated in hedge accounting relationships under IAS 39 and thus the gains on these contracts were recognised in the income statement.
Unrealised losses recognised in the hedge reserve principally reflect losses on the portion of our forward currency exchange contracts that are designated in effective hedge relationships in accordance with IAS 39.
Fair value measurement – Commodity contracts fair value – The fair value of open commodity contracts that do not qualify for the own-use exemption is calculated
by reference to forward market prices at the balance sheet date. As contracts are generally short-term, forward market price curves are available for the duration of the contracts. The quoted market price used for financial assets held by the Group is the current bid price; the quoted price for financial liabilities is the current ask price.
– Forward foreign currency exchange contracts fair value – The fair value of forward foreign currency exchange contracts is determined using forward currency exchange market rates at the balance sheet date.
– Other financial contracts fair value – The fair value of other financial contracts that do not qualify for the own-use exemption, is calculated by reference to forward market prices at the balance sheet date. As contracts are generally short-term, forward market price curves are available for the duration of the contracts.
The fair values of all derivative financial instruments are discounted to reflect the credit risk inherent within the instrument.
The Group has reviewed all significant contracts for the presence of embedded derivatives. Where contracts were found to contain embedded derivatives, they were considered to be closely related to the economic characteristics and risks of the host contract, and therefore do not require separate valuation from their host contracts.
We are required by IFRS to categorise our financial instruments in accordance with the following hierarchy in order to explain the basis on which their fair values have been determined:
– Level 1 – fair value measurements are those derived from quoted prices (unadjusted) in active markets for identical assets or liabilities; – Level 2 – fair value measurements are those derived from inputs, other than quoted prices included within Level 1, that are observable for
the asset or liability, either directly (i.e. as prices) or indirectly (i.e. derived from prices); and – Level 3 – fair value measurements are those derived from valuation techniques that include inputs for the asset or liability that are not
based on observable market data (unobservable inputs).
Categorisation within this fair value measurement hierarchy has been determined on the basis of the lowest level input that is significant to the fair value measurement of the relevant asset or liability.
The fair value of commodity contracts, forward foreign currency exchange contracts and the contingent consideration in the Open Cycle Gas Turbine sites acquisition (see note 3.6) are largely determined by comparison between forward market prices and the contract price; therefore these contracts are categorised as Level 2.
There have been no transfers during the year between Level 1, 2 or 3 category inputs.
7.3 OTHER FINANCIAL INSTRUMENTSWe hold a variety of other non-derivative financial instruments, including cash and cash equivalents, borrowings, payables and receivables arising from our operations.
Accounting policyCash and cash equivalents (note 4.2), trade and other receivables (note 3.5), and trade and other payables (note 3.6) generally have a short time in which to mature. For this reason their carrying values, on the historical cost basis, approximate to their fair value. The Group’s borrowings are set out in detail in note 4.3.
SECTION 7: RISK MANAGEMENT
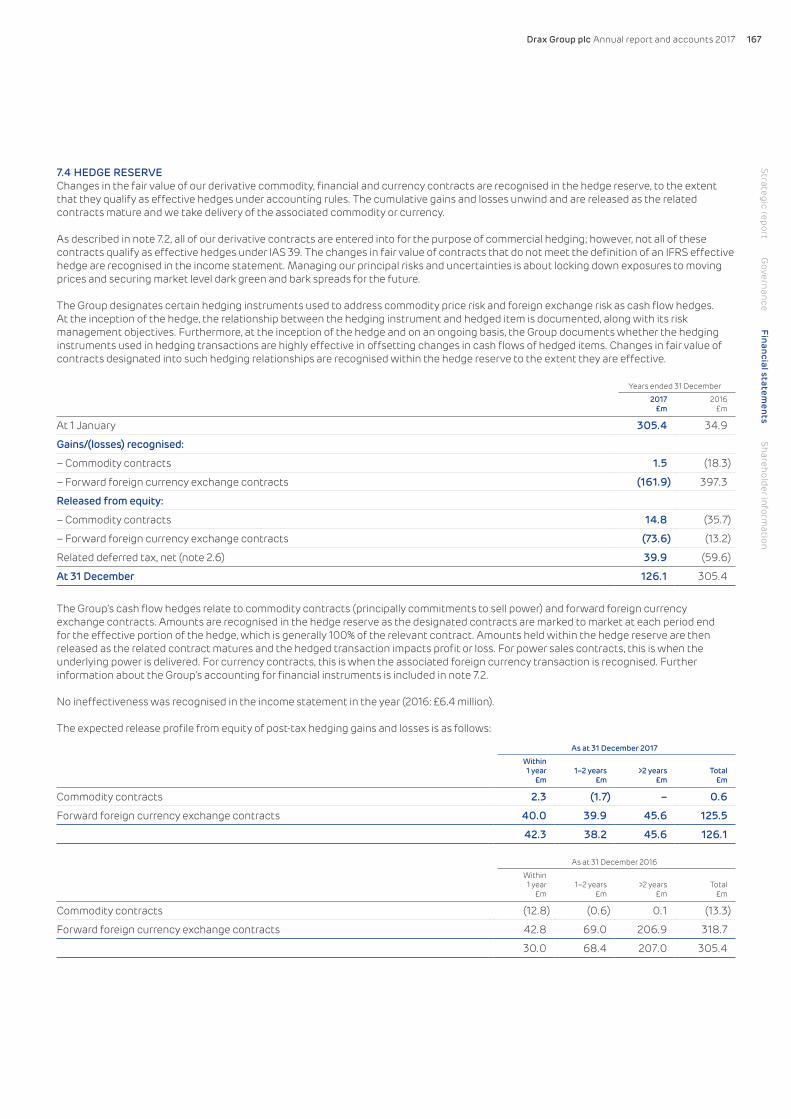
Drax Group plc Annual report and accounts 2017 167
7.4 HEDGE RESERVEChanges in the fair value of our derivative commodity, financial and currency contracts are recognised in the hedge reserve, to the extent that they qualify as effective hedges under accounting rules. The cumulative gains and losses unwind and are released as the related contracts mature and we take delivery of the associated commodity or currency.
As described in note 7.2, all of our derivative contracts are entered into for the purpose of commercial hedging; however, not all of these contracts qualify as effective hedges under IAS 39. The changes in fair value of contracts that do not meet the definition of an IFRS effective hedge are recognised in the income statement. Managing our principal risks and uncertainties is about locking down exposures to moving prices and securing market level dark green and bark spreads for the future.
The Group designates certain hedging instruments used to address commodity price risk and foreign exchange risk as cash flow hedges. At the inception of the hedge, the relationship between the hedging instrument and hedged item is documented, along with its risk management objectives. Furthermore, at the inception of the hedge and on an ongoing basis, the Group documents whether the hedging instruments used in hedging transactions are highly effective in offsetting changes in cash flows of hedged items. Changes in fair value of contracts designated into such hedging relationships are recognised within the hedge reserve to the extent they are effective.
Years ended 31 December
2017 £m
2016 £m
At 1 January 305.4 34.9
Gains/(losses) recognised:
– Commodity contracts 1.5 (18.3)
– Forward foreign currency exchange contracts (161.9) 397.3
Released from equity:
– Commodity contracts 14.8 (35.7)
– Forward foreign currency exchange contracts (73.6) (13.2)
Related deferred tax, net (note 2.6) 39.9 (59.6)
At 31 December 126.1 305.4
The Group’s cash flow hedges relate to commodity contracts (principally commitments to sell power) and forward foreign currency exchange contracts. Amounts are recognised in the hedge reserve as the designated contracts are marked to market at each period end for the effective portion of the hedge, which is generally 100% of the relevant contract. Amounts held within the hedge reserve are then released as the related contract matures and the hedged transaction impacts profit or loss. For power sales contracts, this is when the underlying power is delivered. For currency contracts, this is when the associated foreign currency transaction is recognised. Further information about the Group’s accounting for financial instruments is included in note 7.2.
No ineffectiveness was recognised in the income statement in the year (2016: £6.4 million).
The expected release profile from equity of post-tax hedging gains and losses is as follows:
As at 31 December 2017
Within 1 year
£m1–2 years
£m>2 years
£mTotal
£m
Commodity contracts 2.3 (1.7) – 0.6
Forward foreign currency exchange contracts 40.0 39.9 45.6 125.5
42.3 38.2 45.6 126.1
As at 31 December 2016
Within 1 year
£m1–2 years
£m>2 years
£mTotal
£m
Commodity contracts (12.8) (0.6) 0.1 (13.3)
Forward foreign currency exchange contracts 42.8 69.0 206.9 318.7
30.0 68.4 207.0 305.4
Strategic reportG
overnanceFinancial statem
entsShareholder inform
ation

Drax Group plc Annual report and accounts 2017168
7.5 CONTINGENT LIABILITIESContingent liabilities are potential future outflows of cash that are dependent on a future event that is outside of our control. The amount and timing of any payment is uncertain and cannot be measured reliably.
Guaranteed Minimum Pension (GMP)The UK Government intends to implement legislation to equalise the GMP, resulting in an increase in the value of GMP for males. This would correspondingly increase the defined benefit pension obligation of the Group (note 6.3). At present, the methodology for implementing the equalisation is uncertain and thus the impact cannot be reliably measured. As a result, no allowance has been made for GMP equalisation in the calculation of the defined benefit obligation within these consolidated financial statements.
GuaranteesIn addition to the amount drawn down against the bank loans, certain members of the Group guarantee the obligations of a number of banks in respect of letters of credit issued by those banks to counterparties of the Group. As at 31 December 2017, the Group’s contingent liability in respect of letters of credit issued under the revolving credit facility amounted to £35.7 million (2016: £57.9 million).
The Group also guarantees obligations in the form of surety bonds with a number of insurers amounting to £41.3 million (2016: £nil).
7.6 COMMITMENTSWe have a number of financial commitments (i.e. a contractual requirement to make a cash payment in the future) that are not recorded in our balance sheet as the contract is not yet due for delivery. Such commitments include contracts for the future purchase of coal and biomass, operating leases for land and buildings, contracts for the construction of assets and contracts for the provision of services.
As at 31 December
2017 £m
2016 £m
Contracts placed for future capital expenditure not provided in the financial statements 11.6 33.0
Future support contracts not provided in the financial statements 6.5 5.9
Future commitments to purchase fuel under fixed and variable priced contracts 5,803.5 5,194.4
The contractual maturities of the future commitments to purchase fuel are as follows:
As at 31 December
2017 £m
2016 £m
Within one year 1,054.2 873.7
Within two to five years 2,885.5 2,773.0
After five years 1,863.8 1,547.7
5,803.5 5,194.4
Commitments to purchase fuel reflect long-term forward purchase contracts with a variety of international suppliers, primarily for the delivery of sustainable wood pellets for use in electricity production at Drax Power Station over the period from 2018–2027. To the extent these contracts relate to the purchase of wood pellets, they are not reflected elsewhere in our financial statements owing to application of the “own-use” exemption from fair value accounting to such contracts (see note 7.2).
The future aggregate minimum lease payments under non-cancellable operating leases are as follows:
As at 31 December
2017 £m
2016 £m
Within one year 8.9 3.7
Within two to five years 25.5 10.8
After five years 9.1 5.2
43.5 19.7
The lease commitments principally comprise of a number of leases for office space.
SECTION 7: RISK MANAGEMENT

Drax Group plc Annual report and accounts 2017 169
SECTION 8Reference information
This section details reference information relevant to the accounts. Here we describe the general information about the Group (e.g. operations and registered office). We also set out the basis of preparation of the accounts and general accounting policies that are not specific to any one note.
8.1 GENERAL INFORMATIONDrax Group plc (the Company) is incorporated in England and Wales under the Companies Act. The Company and its subsidiaries (together, the Group) have three principal activities:
– electricity generation; – electricity supply to business customers; and – manufacturing of sustainable compressed wood pellets for use in electricity production.
The Group’s activities are principally based within the UK, with the wood pellet manufacturing activities situated in the US.
The address of the Company’s registered office and principal establishment is Drax Power Station, Selby, North Yorkshire, YO8 8PH, United Kingdom. A full list of operating companies of the Group is disclosed in note 5 to the Company’s separate financial statements, which follow these consolidated financial statements.
8.2 BASIS OF PREPARATIONAdoption of new and revised accounting standardsA number of new and amended standards became effective for the first time in 2017. The Group adopted the following from 1 January 2017:
IAS 12 (amended) – Income Taxes – effective for annual reporting periods beginning on or after 1 January 2017.
IAS 7 (amended) – Statement of Cash Flows – effective for annual periods beginning on or after 1 January 2017.
The adoption of these updates and amendments has not had a material impact on the financial statements of the Group.
At the date of authorisation of these financial statements, the following new or amended standards and relevant interpretations, which have not been applied in these financial statements, were in issue but not yet effective (and some of which were pending endorsement by the EU – marked by *):
IFRS 2 – Classification and Measurement of Share-based Payment Transactions – effective for annual periods beginning on or after 1 January 2018.
IFRS 9 – Financial Instruments – effective for annual reporting periods beginning on or after 1 January 2018.
IFRS 15 (including clarifications issued on 12 April 2016) – Revenue from Contracts with Customers – effective for annual reporting periods beginning on or after 1 January 2018.
IAS 40 (amended) – Investment Property – effective for annual reporting periods beginning on or after 1 January 2018.*
IFRIC 22 – Foreign Currency Transactions and Advance Consideration – effective for annual reporting periods beginning on or after 1 January 2018.*
IFRIC 23 – Uncertainty over Income Tax Treatments – effective for annual reports beginning on or after 1 January 2019.*
IFRS 16 (amended) – Leases – effective for annual reporting periods beginning on or after 1 January 2019.
IFRS 10 (amended) – Consolidated Financial Statements and IAS 28 (amended) – Investments in Associates and Joint Ventures (2011) – effective date deferred indefinitely.*
Adoption of the other standards in future periods is not expected to have a material impact on the financial statements of the Group, other than the three standards noted below.
IFRS 9 – Financial Instruments The Group adopted IFRS 9 with effect from 1 January 2018. IFRS 9 addresses the classification, measurement and derecognition of financial assets and financial liabilities, introduces new rules for hedge accounting and a new impairment model for financial assets, replacing the previous requirements of IAS 39.
The Group's current accounting for financial instruments is set out in further detail in note 7.2.
Strategic reportG
overnanceFinancial statem
entsShareholder inform
ation
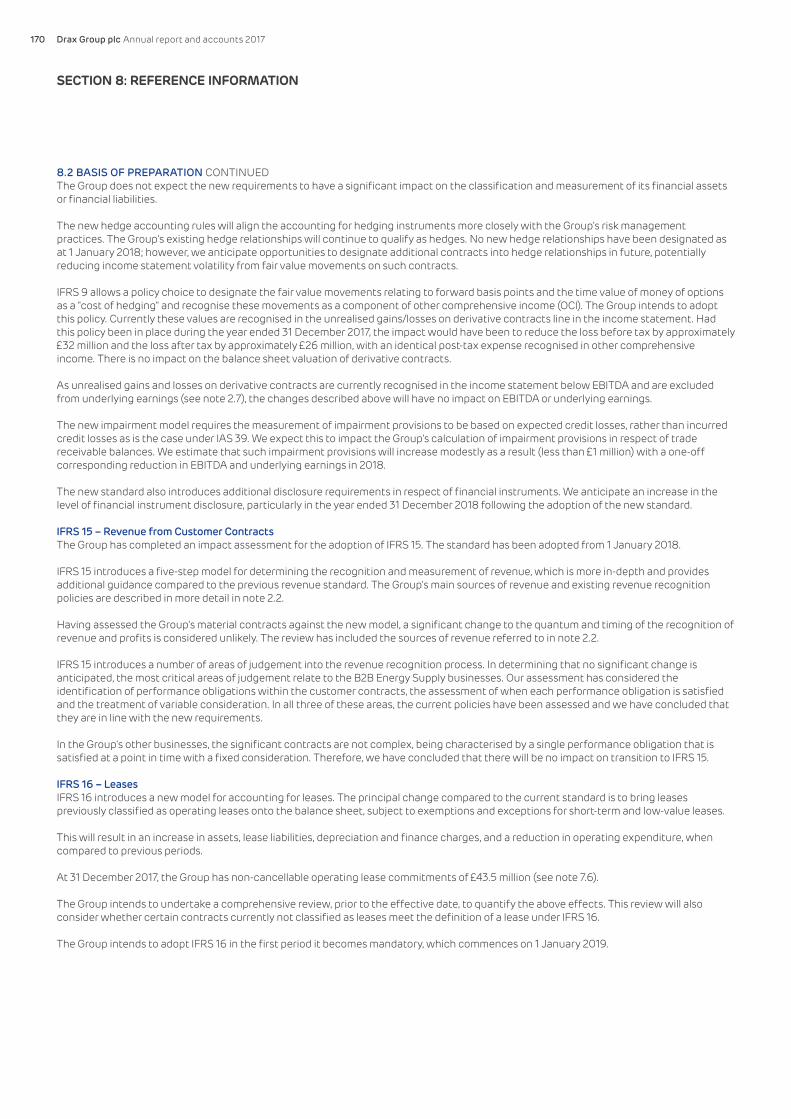
Drax Group plc Annual report and accounts 2017170
8.2 BASIS OF PREPARATION CONTINUEDThe Group does not expect the new requirements to have a significant impact on the classification and measurement of its financial assets or financial liabilities.
The new hedge accounting rules will align the accounting for hedging instruments more closely with the Group's risk management practices. The Group's existing hedge relationships will continue to qualify as hedges. No new hedge relationships have been designated as at 1 January 2018; however, we anticipate opportunities to designate additional contracts into hedge relationships in future, potentially reducing income statement volatility from fair value movements on such contracts.
IFRS 9 allows a policy choice to designate the fair value movements relating to forward basis points and the time value of money of options as a "cost of hedging" and recognise these movements as a component of other comprehensive income (OCI). The Group intends to adopt this policy. Currently these values are recognised in the unrealised gains/losses on derivative contracts line in the income statement. Had this policy been in place during the year ended 31 December 2017, the impact would have been to reduce the loss before tax by approximately £32 million and the loss after tax by approximately £26 million, with an identical post-tax expense recognised in other comprehensive income. There is no impact on the balance sheet valuation of derivative contracts.
As unrealised gains and losses on derivative contracts are currently recognised in the income statement below EBITDA and are excluded from underlying earnings (see note 2.7), the changes described above will have no impact on EBITDA or underlying earnings.
The new impairment model requires the measurement of impairment provisions to be based on expected credit losses, rather than incurred credit losses as is the case under IAS 39. We expect this to impact the Group's calculation of impairment provisions in respect of trade receivable balances. We estimate that such impairment provisions will increase modestly as a result (less than £1 million) with a one-off corresponding reduction in EBITDA and underlying earnings in 2018.
The new standard also introduces additional disclosure requirements in respect of financial instruments. We anticipate an increase in the level of financial instrument disclosure, particularly in the year ended 31 December 2018 following the adoption of the new standard.
IFRS 15 – Revenue from Customer Contracts The Group has completed an impact assessment for the adoption of IFRS 15. The standard has been adopted from 1 January 2018.
IFRS 15 introduces a five-step model for determining the recognition and measurement of revenue, which is more in-depth and provides additional guidance compared to the previous revenue standard. The Group's main sources of revenue and existing revenue recognition policies are described in more detail in note 2.2.
Having assessed the Group's material contracts against the new model, a significant change to the quantum and timing of the recognition of revenue and profits is considered unlikely. The review has included the sources of revenue referred to in note 2.2.
IFRS 15 introduces a number of areas of judgement into the revenue recognition process. In determining that no significant change is anticipated, the most critical areas of judgement relate to the B2B Energy Supply businesses. Our assessment has considered the identification of performance obligations within the customer contracts, the assessment of when each performance obligation is satisfied and the treatment of variable consideration. In all three of these areas, the current policies have been assessed and we have concluded that they are in line with the new requirements.
In the Group's other businesses, the significant contracts are not complex, being characterised by a single performance obligation that is satisfied at a point in time with a fixed consideration. Therefore, we have concluded that there will be no impact on transition to IFRS 15.
IFRS 16 – Leases IFRS 16 introduces a new model for accounting for leases. The principal change compared to the current standard is to bring leases previously classified as operating leases onto the balance sheet, subject to exemptions and exceptions for short-term and low-value leases.
This will result in an increase in assets, lease liabilities, depreciation and finance charges, and a reduction in operating expenditure, when compared to previous periods.
At 31 December 2017, the Group has non-cancellable operating lease commitments of £43.5 million (see note 7.6).
The Group intends to undertake a comprehensive review, prior to the effective date, to quantify the above effects. This review will also consider whether certain contracts currently not classified as leases meet the definition of a lease under IFRS 16.
The Group intends to adopt IFRS 16 in the first period it becomes mandatory, which commences on 1 January 2019.
SECTION 8: REFERENCE INFORMATION

Drax Group plc Annual report and accounts 2017 171
8.3 RELATED PARTY TRANSACTIONSA related party is either an individual or entity with control or significant influence over the Group, or a company that is linked to us by investment (such as an associated company or joint venture). Our primary related parties are our key management personnel.
Remuneration of key management personnelThe remuneration of the directors and Executive Committee members, who are considered to be the key management personnel of the Group, is set out below in aggregate for each of the categories specified in IAS 24 Related Party Disclosures. Further information about the remuneration of individual directors, together with the directors’ interests in the share capital of Drax Group plc, is provided in the audited part of the Remuneration Committee report.
Years ended 31 December
2017 £000
2016 £000
Salaries and short-term benefits 4,900 5,011
Aggregate amounts receivable under share-based incentive schemes 1,221 1,146
Company contributions to money purchase pension schemes 34 44
6,155 6,201
Amounts included in the table above reflect the remuneration of the 12 (2016: 10) members of the Board and Executive Committee as described on pages 81–107, including those who have resigned during the year.
Amounts receivable under incentive schemes represents the expenses arising from share-based payments included in the consolidated income statement, determined based on the fair value of the related awards at the date of grant (note 6.2), as adjusted for non-market-related vesting conditions.
There were no other transactions with directors for the periods covered by these consolidated financial statements.
Strategic reportG
overnanceFinancial statem
entsShareholder inform
ation
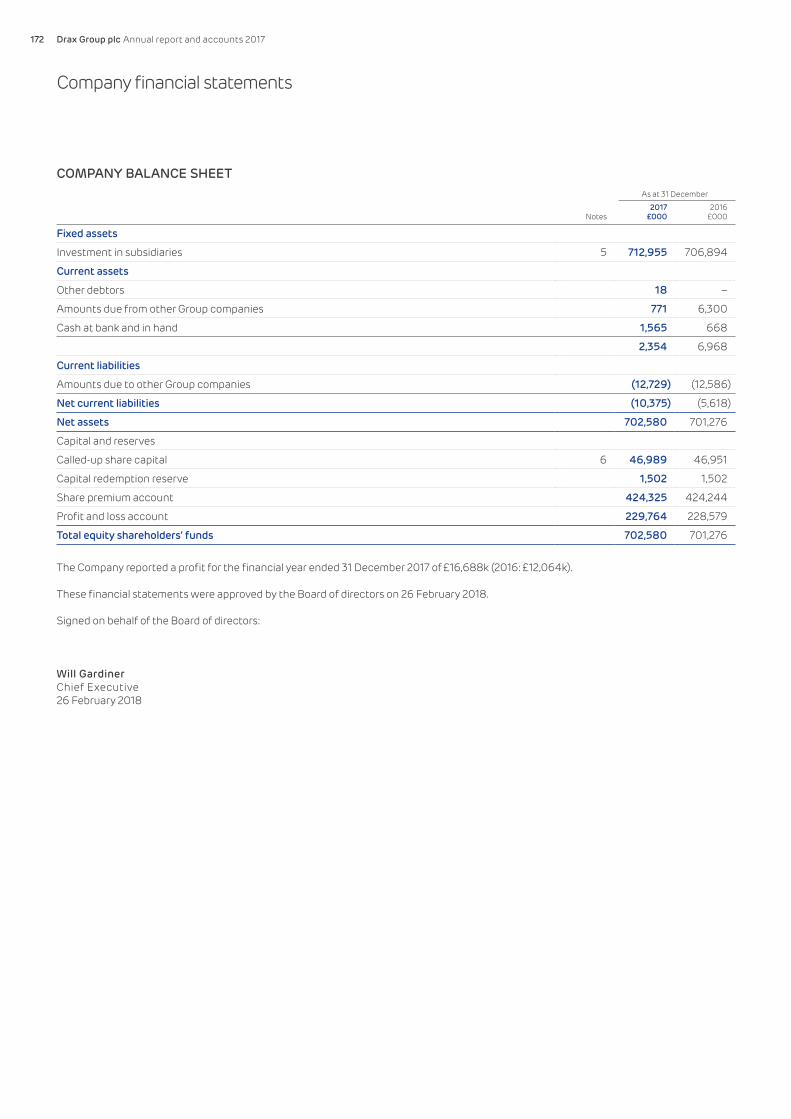
Drax Group plc Annual report and accounts 2017172
COMPANY BALANCE SHEETAs at 31 December
Notes2017
£0002016
£000
Fixed assets
Investment in subsidiaries 5 712,955 706,894
Current assets
Other debtors 18 –
Amounts due from other Group companies 771 6,300
Cash at bank and in hand 1,565 668
2,354 6,968
Current liabilities
Amounts due to other Group companies (12,729) (12,586)
Net current liabilities (10,375) (5,618)
Net assets 702,580 701,276
Capital and reserves
Called-up share capital 6 46,989 46,951
Capital redemption reserve 1,502 1,502
Share premium account 424,325 424,244
Profit and loss account 229,764 228,579
Total equity shareholders’ funds 702,580 701,276
The Company reported a profit for the financial year ended 31 December 2017 of £16,688k (2016: £12,064k).
These financial statements were approved by the Board of directors on 26 February 2018.
Signed on behalf of the Board of directors:
Will GardinerChief Executive26 February 2018
Company financial statements

Drax Group plc Annual report and accounts 2017 173
COMPANY STATEMENT OF CHANGES IN EQUITY
Share capital £000
Capital redemption
reserve £000
Share premium
£000
Profit and loss account
£000Total
£000
At 1 January 2016 46,936 1,502 424,201 222,343 694,982
Share capital issued (note 6) 15 – 43 – 58
Profit and total comprehensive income for the year – – – 12,064 12,064
Credited to equity for share-based payments – – – 5,152 5,152
Equity dividends paid (note 8) – – – (10,980) (10,980)
At 1 January 2017 46,951 1,502 424,244 228,579 701,276
Share capital issued (note 6) 38 – 81 – 119
Profit and total comprehensive income for the year – – – 16,688 16,688
Credited to equity for share-based payments – – – 6,061 6,061
Equity dividends paid (note 8) – – – (21,564) (21,564)
At 31 December 2017 46,989 1,502 424,325 229,764 702,580
Strategic reportG
overnanceFinancial statem
entsShareholder inform
ation

Drax Group plc Annual report and accounts 2017174
Notes to the Company financial statements
1. BASIS OF PREPARATIONThe separate financial statements of the Company are presented as required by the Companies Act 2006.
The Company meets the definition of a qualifying entity under Financial Reporting Standard 100 (FRS 100) issued by the Financial Reporting Council (FRC).
The financial statements have been prepared in accordance with FRS 101 (incorporating the amendments to FRS 101 issued by the FRC in July 2015 and July 2016 and the amendments to company law made by the Companies, Partnerships and Groups (Accounts and Reports) Regulations 2015).
As permitted by FRS 101, the Company has taken advantage of the disclosure exemptions available under that standard in relation to presentation of a cash flow statement, financial instruments, share-based payments, capital risk management, standards not yet effective and certain related party transactions. Where required, equivalent disclosures are given in the consolidated financial statements.
The financial statements have been prepared under the historical cost convention. The principal accounting policies adopted are summarised below, and have been consistently applied to both years presented.
2. SUMMARY OF SIGNIFICANT ACCOUNTING POLICIES(A) Fixed asset investmentsFixed asset investments in subsidiaries are stated at cost less, where relevant, provision for impairment.
(B) Financial instrumentsIssued equity – Ordinary shares are classified as equity as evidenced by their residual interest in the assets of the Company after deducting all of its liabilities. Incremental costs directly attributable to the issue of new shares or options are shown in equity as a deduction, net of tax, from the proceeds. The share premium account records amounts by which the proceeds from issuing shares exceeds the nominal value of the shares issued unless merger relief criteria within the Companies Act 2006 are met, in which case the difference is recorded in retained earnings.
Cash and cash equivalents – Cash and cash equivalents includes cash in hand, deposits held at call with banks, other short-term highly liquid investments with original maturities of three months or less, and bank overdrafts.
3. CRITICAL ACCOUNTING JUDGEMENTS(A) Critical judgements in applying the Company’s accounting policiesThe critical accounting judgements, to the extent they apply to the Company, are consistent with those of the Group described on page 119.
(B) Impairment of fixed asset investmentsDetermining whether the Company’s investments in subsidiaries have been impaired requires estimates of the investment’s values in use. The methodology for calculation of value in use is consistent with that of the Group, as described in note 2.4.
4. PROFIT AND LOSS ACCOUNTAs permitted by Section 408 of the Companies Act 2006, the Company has elected not to present its own profit and loss account for the year. The Company’s profit and loss account was approved by the Board on 27 February 2018. The profit attributable to the Company is disclosed in the statement of changes in equity.
The Company received dividend income from its subsidiary undertakings totalling £19.9 million in 2017 (2016: £14.7 million).
The Company has no employees other than the directors, whose remuneration was paid by a subsidiary undertaking and a proportion was recharged to the Company.
The auditor’s remuneration for audit services provided to the Company for the year ended 31 December 2017 was £20,500 (2016: £20,000).
5. FIXED ASSET INVESTMENTS
Years ended 31 December
2017 £000
2016 £000
Carrying amount:
At 1 January 706,894 701,728
Capital contribution 6,061 5,166
At 31 December 712,955 706,894
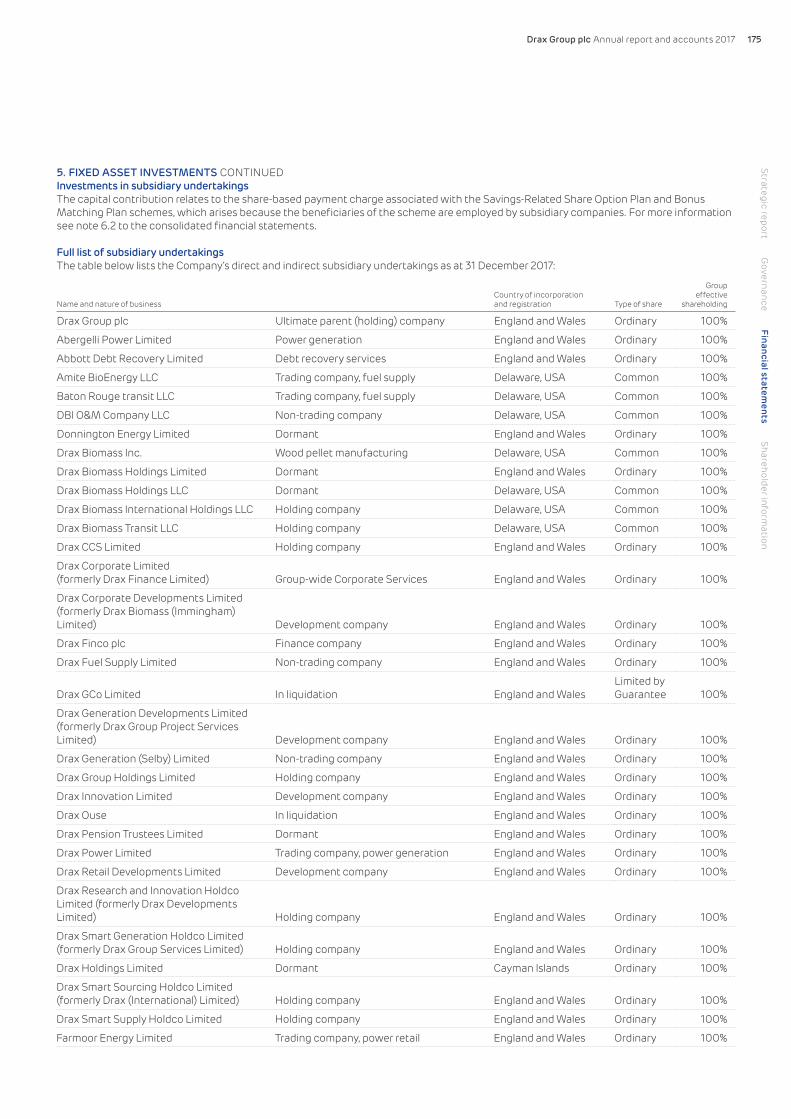
Drax Group plc Annual report and accounts 2017 175
5. FIXED ASSET INVESTMENTS CONTINUEDInvestments in subsidiary undertakingsThe capital contribution relates to the share-based payment charge associated with the Savings-Related Share Option Plan and Bonus Matching Plan schemes, which arises because the beneficiaries of the scheme are employed by subsidiary companies. For more information see note 6.2 to the consolidated financial statements.
Full list of subsidiary undertakingsThe table below lists the Company’s direct and indirect subsidiary undertakings as at 31 December 2017:
Name and nature of businessCountry of incorporation and registration Type of share
Group effective
shareholding
Drax Group plc Ultimate parent (holding) company England and Wales Ordinary 100%
Abergelli Power Limited Power generation England and Wales Ordinary 100%
Abbott Debt Recovery Limited Debt recovery services England and Wales Ordinary 100%
Amite BioEnergy LLC Trading company, fuel supply Delaware, USA Common 100%
Baton Rouge transit LLC Trading company, fuel supply Delaware, USA Common 100%
DBI O&M Company LLC Non-trading company Delaware, USA Common 100%
Donnington Energy Limited Dormant England and Wales Ordinary 100%
Drax Biomass Inc. Wood pellet manufacturing Delaware, USA Common 100%
Drax Biomass Holdings Limited Dormant England and Wales Ordinary 100%
Drax Biomass Holdings LLC Dormant Delaware, USA Common 100%
Drax Biomass International Holdings LLC Holding company Delaware, USA Common 100%
Drax Biomass Transit LLC Holding company Delaware, USA Common 100%
Drax CCS Limited Holding company England and Wales Ordinary 100%
Drax Corporate Limited (formerly Drax Finance Limited) Group-wide Corporate Services England and Wales Ordinary 100%
Drax Corporate Developments Limited (formerly Drax Biomass (Immingham) Limited) Development company England and Wales Ordinary 100%
Drax Finco plc Finance company England and Wales Ordinary 100%
Drax Fuel Supply Limited Non-trading company England and Wales Ordinary 100%
Drax GCo Limited In liquidation England and WalesLimited by Guarantee 100%
Drax Generation Developments Limited (formerly Drax Group Project Services Limited) Development company England and Wales Ordinary 100%
Drax Generation (Selby) Limited Non-trading company England and Wales Ordinary 100%
Drax Group Holdings Limited Holding company England and Wales Ordinary 100%
Drax Innovation Limited Development company England and Wales Ordinary 100%
Drax Ouse In liquidation England and Wales Ordinary 100%
Drax Pension Trustees Limited Dormant England and Wales Ordinary 100%
Drax Power Limited Trading company, power generation England and Wales Ordinary 100%
Drax Retail Developments Limited Development company England and Wales Ordinary 100%
Drax Research and Innovation Holdco Limited (formerly Drax Developments Limited) Holding company England and Wales Ordinary 100%
Drax Smart Generation Holdco Limited (formerly Drax Group Services Limited) Holding company England and Wales Ordinary 100%
Drax Holdings Limited Dormant Cayman Islands Ordinary 100%
Drax Smart Sourcing Holdco Limited (formerly Drax (International) Limited) Holding company England and Wales Ordinary 100%
Drax Smart Supply Holdco Limited Holding company England and Wales Ordinary 100%
Farmoor Energy Limited Trading company, power retail England and Wales Ordinary 100%
Strategic reportG
overnanceFinancial statem
entsShareholder inform
ation
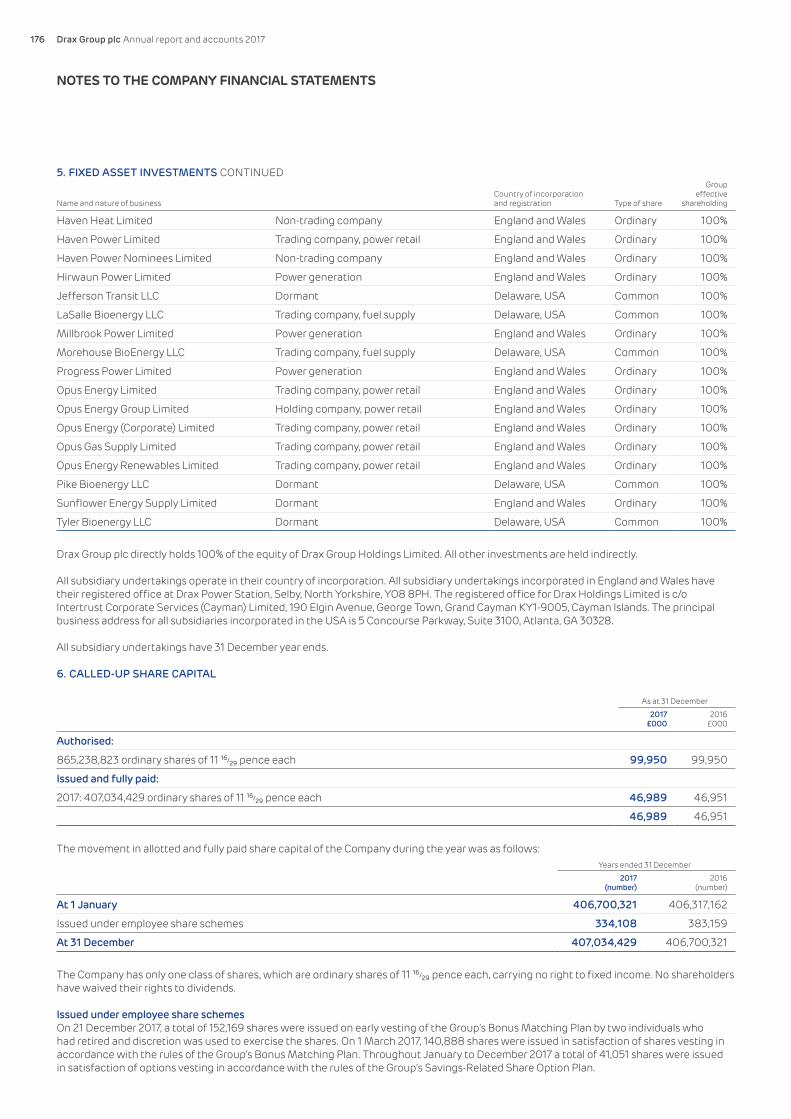
Drax Group plc Annual report and accounts 2017176
Name and nature of businessCountry of incorporation and registration Type of share
Group effective
shareholding
Haven Heat Limited Non-trading company England and Wales Ordinary 100%
Haven Power Limited Trading company, power retail England and Wales Ordinary 100%
Haven Power Nominees Limited Non-trading company England and Wales Ordinary 100%
Hirwaun Power Limited Power generation England and Wales Ordinary 100%
Jefferson Transit LLC Dormant Delaware, USA Common 100%
LaSalle Bioenergy LLC Trading company, fuel supply Delaware, USA Common 100%
Millbrook Power Limited Power generation England and Wales Ordinary 100%
Morehouse BioEnergy LLC Trading company, fuel supply Delaware, USA Common 100%
Progress Power Limited Power generation England and Wales Ordinary 100%
Opus Energy Limited Trading company, power retail England and Wales Ordinary 100%
Opus Energy Group Limited Holding company, power retail England and Wales Ordinary 100%
Opus Energy (Corporate) Limited Trading company, power retail England and Wales Ordinary 100%
Opus Gas Supply Limited Trading company, power retail England and Wales Ordinary 100%
Opus Energy Renewables Limited Trading company, power retail England and Wales Ordinary 100%
Pike Bioenergy LLC Dormant Delaware, USA Common 100%
Sunflower Energy Supply Limited Dormant England and Wales Ordinary 100%
Tyler Bioenergy LLC Dormant Delaware, USA Common 100%
Drax Group plc directly holds 100% of the equity of Drax Group Holdings Limited. All other investments are held indirectly.
All subsidiary undertakings operate in their country of incorporation. All subsidiary undertakings incorporated in England and Wales have their registered office at Drax Power Station, Selby, North Yorkshire, YO8 8PH. The registered office for Drax Holdings Limited is c/o Intertrust Corporate Services (Cayman) Limited, 190 Elgin Avenue, George Town, Grand Cayman KY1-9005, Cayman Islands. The principal business address for all subsidiaries incorporated in the USA is 5 Concourse Parkway, Suite 3100, Atlanta, GA 30328.
All subsidiary undertakings have 31 December year ends.
6. CALLED-UP SHARE CAPITAL
As at 31 December
2017 £000
2016 £000
Authorised:
865,238,823 ordinary shares of 11 16⁄29 pence each 99,950 99,950
Issued and fully paid:
2017: 407,034,429 ordinary shares of 11 16⁄29 pence each 46,989 46,951
46,989 46,951
The movement in allotted and fully paid share capital of the Company during the year was as follows:Years ended 31 December
2017 (number)
2016 (number)
At 1 January 406,700,321 406,317,162
Issued under employee share schemes 334,108 383,159
At 31 December 407,034,429 406,700,321
The Company has only one class of shares, which are ordinary shares of 11 16⁄29 pence each, carrying no right to fixed income. No shareholders have waived their rights to dividends.
Issued under employee share schemesOn 21 December 2017, a total of 152,169 shares were issued on early vesting of the Group’s Bonus Matching Plan by two individuals who had retired and discretion was used to exercise the shares. On 1 March 2017, 140,888 shares were issued in satisfaction of shares vesting in accordance with the rules of the Group’s Bonus Matching Plan. Throughout January to December 2017 a total of 41,051 shares were issued in satisfaction of options vesting in accordance with the rules of the Group’s Savings-Related Share Option Plan.
5. FIXED ASSET INVESTMENTS CONTINUED
NOTES TO THE COMPANY FINANCIAL STATEMENTS

Drax Group plc Annual report and accounts 2017 177
7. DISTRIBUTABLE RESERVESNote 8 sets out the proposed final dividend of £30 million in respect of 2017.
The Company considers its distributable reserves to be comprised of the profit and loss account with a total value of £229.8 million. Accordingly, the Company considers itself to have sufficient distributable profits from which to pay the current year final dividend. Based on a total dividend for 2017 of £50 million, the Company has sufficient distributable reserves to pay four years of dividend at the current level without generating further distributable profits. In addition to its own reserves, the Company has access to the distributable reserves of its subsidiary undertakings with which future dividend payments can be funded (see note 2.10 to the consolidated accounts for additional information).
The Company is dependent upon its subsidiaries for the provision of cash with which to make dividend payments. As shown in note 4.2 to the consolidated financial statements, the Group has sufficient cash resources with which to meet the proposed dividend.
8. DIVIDENDSYears ended 31 December
2017 £m
2016 £m
Amounts recognised as distributions to equity holders in the year (based on the number of shares in issue at the record date):
Interim dividend for the year ended 31 December 2017 of 4.9 pence per share paid on 6 October 2017 (2016: 2.1 pence per share paid on 7 October 2016) 20.0 8.6
Final dividend for the year ended 31 December 2016 of 0.4 pence per share paid on 12 May 2017 (2016: 0.6 pence per share paid on 13 May 2016) 1.6 2.4
21.6 11.0
At the forthcoming Annual General Meeting the Board will recommend to shareholders that a resolution is passed to approve payment of a final dividend for the year ended 31 December 2017 of 7.4 pence per share (equivalent to approximately £30 million) payable on or before 11 May 2018. The final dividend has not been included as a liability as at 31 December 2017.
9. CONTINGENT LIABILITIESThe Company has provided unsecured guarantees to third parties in respect of contracts held by a subsidiary company. The guarantees have been issued for £nil consideration and the Company has not charged the subsidiary for the guarantees.
The Company has granted a charge over the assets of certain of its subsidiaries, in respect of the Group’s debt (detailed in note 4.3 to the consolidated financial statements), which is guaranteed and secured directly by each of the subsidiary undertakings of the Company that is party to the security arrangement. The Company itself is not a guarantor of the Group’s debt.
Strategic reportG
overnanceFinancial statem
entsShareholder inform
ation

Drax Group plc Annual report and accounts 2017178
SHAREHOLDER INFORMATION
KEY DATES FOR 2018At the date of publication of this document, the following are the proposed key dates in the 2018 financial calendar:
Annual General Meeting 25 April
Ordinary shares marked ex-dividend 19 April
Record date for entitlement to the final dividend 20 April
Payment of final dividend 11 May
Financial half year end 30 June
Announcement of half year results 24 July
Financial year end 31 December
Other significant dates, or amendments to the proposed dates above, will be posted on the Company’s website as and when they become available.
RESULTS ANNOUNCEMENTSResults announcements are issued to the London Stock Exchange and are available on its news service. Shortly afterwards, they are available under “Regulatory news” within the Investor section on the Company’s website.
SHARE PRICEShareholders can access the current share price of Drax Group plc ordinary shares on our website at www.drax.com. During London Stock Exchange trading hours the price shown on the website is subject to a delay of approximately 15 minutes and outside trading hours it is the last available price.
The table below provides an indication of the fluctuations in the Drax Group plc share price during the course of 2017, and the graph provides an indication of the trend of the share price throughout the year.
Closing price on31 December 2016
Low during the year (6 December 2017)
High during the year (3 January 2017)
Closing price on 31 December 2017
377.9 pence 256.4 pence 384.4 pence 270.6 pence
1 January2017
1 February2017
1 March2017
1 April2017
1 May2017
1 June2017
1 July2017
1 August2017
1 September2017
1 November2017
1 October2017
1 December2017
31 December2017
0
100
200
300
400
Note:The share prices given are the middle market closing prices as derived from the London Stock Exchange Daily Official List
MARKET CAPITALISATIONThe market capitalisation, based on the number of shares in issue and the closing price at 31 December 2017, was approximately £1,101 million (2016: £1,536 million).
FINANCIAL REPORTSCopies of all financial reports we publish are available from the date of publication and can be downloaded from our website. Printed copies of reports can be requested by writing to the Company Secretary at the registered office, by clicking on “Contact Us” on our website, or direct by e-mail to [email protected].

Drax Group plc Annual report and accounts 2017 179
DRAX SHAREHOLDER QUERIESThe Company’s share register is maintained by Equiniti Limited (“Equiniti”), who is primarily responsible for updating the share register and for dividend payments.
Shareholders should contact Equiniti directly if they have a query relating to their Drax shareholding, in particular queries regarding: – transfer of shares; – change of name or address; – lost share certificates; – lost or out-of-date dividend cheques; – payment of dividends direct to a bank or building society account;
and – death of a registered shareholder.
Equiniti can be contacted as follows: – Call Equiniti on 0371 384 2030 from within the UK. Lines are open
from 8.30am to 5.30pm, Monday to Friday, excluding Bank Holidays); or +44 121 415 7047 from outside the UK.
– Write to Equiniti at Equiniti Limited, Aspect House, Spencer Road, Lancing, West Sussex BN99 6DA.
When contacting Equiniti by telephone or in writing it is advisable to have your shareholder reference to hand and quote Drax Group plc, as well as the name and address in which the shares are held.
ONLINE COMMUNICATIONSRegistering for online communications allows you to have more control over the administration of your shareholding. The registration process is easy via Equiniti’s secure website www.shareview.co.uk.
Once registered with Shareview you are able to: – elect how Drax communicates with you; – amend some of your personal details; – amend the way you receive dividends; and – buy or sell shares online.
Registering for electronic communications does not mean that you can no longer receive paper copies of documents. We are able to offer a range of services and tailor the communications to meet your needs.
A range of frequently asked shareholder questions can also be found on our website at www.drax.com/investors/faq.
TAX ON DIVIDENDSIn the 2015 Budget, the Chancellor announced changes in the way that dividends would be taxed in the future. Below is a brief summary of the guidance provided by HMRC. If you are in any doubt as to the impact on your personal circumstances, you are recommended to seek your own financial advice from a professional adviser authorised under the Financial Services and Markets Act 2000.
The long-standing system of tax credits attached to dividends was replaced with a new tax-free Dividend Allowance. This means that there is no tax to pay on the first £5,000 of dividend income, no matter what non-dividend income a shareholder may have. Dividends paid on shares held within pensions and ISAs will be unaffected, remaining tax-free.
Non-taxpayers and basic rate taxpayers who receive dividend income between £5,001 and £10,000 will need to make a declaration (to HMRC) for the first time. Individuals with dividend income of more than £10,000 are already required to be in HMRC’s Self-Assessment regime. The impact on Share Incentive Plan participants receiving cash dividends on their plan shares align with those for Shareholders. Further information and updates on tax on dividends can be found on the HMRC website at www.gov.uk/tax-on-dividends/overview.
As the Dividend Tax Credit will no longer be required it is expected that a dividend confirmation will still need to be sent to shareholders to replace the old “tax voucher”. The Company is currently considering whether to move to the practice of issuing just one dividend confirmation document towards the end of the tax year, irrespective of the number of cash payments made during the course of the year, rather than issuing a document each time a dividend is paid. Shareholders will be advised of the outcome in due course.
BENEFICIAL OWNERS AND “INFORMATION RIGHTS”If your shares are registered in the name of a third party (i.e. an ISA provider or other nominee company) you may, if you wish, receive information rights under Section 146 of the Companies Act 2006. In order for this to happen, you must contact the third party registered holder, who will then nominate you. All communications by beneficial owners of shares where the shares are held by third party registered holders must be directed to that registered holder and not to Drax or Equiniti.
SHAREGIFTShareGift (registered charity No. 1052686) is an independent charity which provides a free service for shareholders wishing to dispose charitably of small parcels of shares, which would most likely cost more to sell than they are worth. There are no capital gains tax implications (i.e. no gain or loss) on gifts of shares to charity and it is possible to obtain income tax relief. Further information can be obtained directly from the charity at www.sharegift.org.
SHARE FRAUDS (“BOILER ROOM SCAMS”)In recent years, many companies have become aware that their shareholders have received unsolicited phone calls or correspondence offering to purchase their shares at apparently inflated prices. It is often the case that the caller, or message in the correspondence claims that they represent a majority shareholder who is looking to take over the Company. At the time of this report, the Company was not the subject of a take-over attempt, hostile or otherwise, and approaches such as those outlined are usually made by unauthorised companies and individuals. Shareholders should be very wary of any unsolicited advice, offers to buy shares at a premium or offers of free reports into the Company. Below is the advice from the Financial Conduct Authority (the “FCA”).
SHAREHOLDER INFORMATION
Strategic reportG
overnanceFinancial statem
entsShareholder inform
ation
Drax Group plc Annual report and accounts 2017180
BEWARE OF SHARE FRAUDFraudsters use persuasive and high-pressure tactics to lure investors into scams. They may offer to sell shares that turn out to be worthless or non-existent, or to buy shares at an inflated price in return for upfront payment. While high profits are promised, if you buy or sell shares in this way you will probably lose your money.
How to avoid share fraud: – Keep in mind that firms authorised by the FCA are unlikely to
contact you out of the blue with an offer to buy or sell shares. – Do not get into a conversation, note the name of the person and
firm contacting you and then end the call. – Check the Financial Services Register from www.fca.org.uk to see
if the person and firm contacting you is authorised by the FCA. – Beware of fraudsters claiming to be from an authorised firm,
copying its website or giving you false contact details. – Use the firm’s contact details listed on the Register if you want to
call it back. – Call the FCA on 0800 111 6768 if the firm does not have contact
details on the Register or you are told they are out of date. – Search the list of unauthorised firms to avoid at
www.fca.org.uk/scams. – Consider that if you buy or sell shares from an unauthorised firm
you will not have access to the Financial Ombudsman Service or Financial Services Compensation Scheme.
– Think about getting independent financial and professional advice before you hand over any money.
Remember, if it sounds too good to be true, it probably is!
REPORT A SCAMIf you are approached by fraudsters please tell the FCA using the share fraud reporting form at www.fca.org.uk/scams, where you can find out more about investment scams.
You can also call the FCA Consumer Helpline on 0800 111 6768.
If you have already paid money to share fraudsters you should contact Action Fraud on 0300 123 2040.

Drax Group plc Annual report and accounts 2017 181
DRAX GROUP PLCRegistered office and trading addressDrax Power StationSelbyNorth Yorkshire YO8 8PHTelephone +44 (0)1757 618381Fax +44 (0)1757 612192www.drax.com
REGISTRATION DETAILSRegistered in England and WalesCompany Number: 5562053
COMPANY SECRETARYDavid McCallum
ENQUIRY E-MAIL ADDRESS [email protected]
COMPANY INFORMATION
PROFESSIONAL ADVISERS AND SERVICE PROVIDERS
AUDITORDeloitte LLP2 New Street Square, London EC4A 3BZ
BANKERSBarclays Bank PLC1 Churchill Place, Canary Wharf, London E14 5HP
BROKERSJ.P. Morgan Cazenove25 Bank Street, Canary Wharf, London E14 5JP
FINANCIAL PRFTI Consulting LLP200 Aldersgate, Aldersgate Street, London EC1A 4HD
REGISTRARSEquiniti LimitedAspect House, Spencer Road, Lancing, West Sussex BN99 6DA
REMUNERATION ADVISERSPricewaterhouseCoopers LLP1 Embankment Place, London WC2N 6RH
SOLICITORSSlaughter and MayOne Bunhill Row, London EC1Y 8YY
Strategic reportG
overnanceFinancial statem
entsShareholder inform
ation

Drax Group plc Annual report and accounts 2017182
ADVANTAGED FUELSFuel that gives a price advantage against standard bituminous coals. Such fuels include pond fines, off-specification coal and petcoke.
ANCILLARY SERVICESServices provided to national grid used for balancing supply and demand or maintaining secure electricity supplies within acceptable limits, for example Black Start contracts. They are described in Connection Condition 8 of the Grid Code.
AVAILABILITYAverage percentage of time the units were available for generation.
BALANCING MECHANISMThe sub-set of the market through which the system operator can call upon additional generation/consumption or reduce generation/ consumption through market participants’ bids and offers, in order to balance the system minute-by-minute.
BARK SPREADThe difference between the power price and the cost of biomass, net of renewable support.
CARBON PRICE SUPPORT MECHANISM (OR CARBON PRICE FLOOR OR CARBON TAX)A tax upon fossil fuels (including coal) used to generate electricity. It is charged as a levy on coal delivered to the power station.
CONTRACTS FOR DIFFERENCE (CFD)A mechanism to support investment in low-carbon electricity generation. The CfD works by stabilising revenues for generators at a fixed price level known as the “strike price”. Generators will receive revenue from selling their electricity into the market as usual. However, when the market reference price is below the strike price they will also receive a top-up payment from suppliers for the additional amount. Conversely if the reference price is above the strike price, the generator must pay back the difference.
DARK GREEN SPREADThe difference between the power price and the cost of coal and carbon, including CO2 allowances under the EU Emissions Trading Scheme and the UK Carbon Price Support (CPS) Mechanism.
DEPARTMENT FOR BUSINESS, ENERGY AND INDUSTRIAL STRATEGY (BEIS)The Government department bringing together the responsibilities for business, industrial strategy, science, innovation, energy and climate change (formerly DECC).
EBITDAProfit before interest, tax, depreciation, amortisation and material one-off items that do not reflect the underlying trading performance of the business.
EU ETSThe EU Emissions Trading System is a mechanism introduced across the EU to reduce emissions of CO2; the scheme is capable of being extended to cover all greenhouse gas emissions.
FEED-IN TARIFFA long-term contract set at a fixed level where variable payments are made to ensure the generator receives an agreed tariff. The feed-in tariff payment would be made in addition to the generator’s revenues from selling in the market.
FORCED OUTAGEAny reduction in plant availability, excluding planned outages.
FORCED OUTAGE RATEThe capacity which is not available due to forced outages or restrictions expressed as a percentage of the maximum theoretical capacity, less planned outage capacity.
GRID CHARGESIncludes transmission network use of system charges (TNUoS), balancing services use of system charges (BSUoS) and distribution use of system charges (DUoS).
IFRSSInternational Financial Reporting Standards.
LECSLevy Exemption Certificates. Evidence of CCL exempt electricity supplies generated from qualifying renewable sources.
LEVY CONTROL FRAMEWORKA control framework for BEIS (formerly DECC) levy-funded spending intended to make sure that BEIS achieves its fuel poverty, energy and climate change goals in a way that is consistent with economic recovery and minimising the impact on consumer bills.
LOAD FACTORNet sent out generation as a percentage of maximum sales.
LOST TIME INJURY RATE (LTIR)The frequency rate is calculated on the following basis: lost time injuries/hours worked x 100,000. Lost time injuries are defined as occurrences where the injured party is absent from work for more than 24 hours.
NET BALANCING MECHANISMNet volumes attributable to accepted bids and offers in the balancing mechanism.
NET CASH/(DEBT)Comprises cash and cash equivalents, short-term investments less overdrafts and borrowings net of deferred finance costs.
NET SALESThe aggregate of net volumes attributable to bilateral contracts, power exchange trades and net balancing mechanism.
NET SALES AT NOTIONAL BALANCING POINT (NBP)Net sales at NBP is the volume of power sold to customers by our Retail business expressed at the NBP. The NBP reflects the volume of power sold before deduction of transmission and distribution losses incurred in transporting this power from the grid to the customer meter.
GLOSSARY

The DRAX report and accounts are printed on Revive 100 Offset – a Carbon Balanced paper that has been produced from 100% post-consumer recycled fibre (FSC® Recycled certified), and awarded the EU Eco label. The carbon emissions associated with the paper’s production and distribution have been offset through the World Land Trust’s Carbon Balanced Paper scheme.
GLOSSARY
PLANNED OUTAGEA period during which scheduled maintenance is executed according to the plan set at the outset of the year.
PLANNED OUTAGE RATEThe capacity not available due to planned outages expressed as a percentage of the maximum theoretical capacity.
POWER EXCHANGE TRADESPower sales or purchases transacted on the APX UK power trading platform.
ROCsA Renewable Obligation Certificate (“ROC”) is a certificate issued to an accredited generator for electricity generated from eligible renewable sources. The Renewable Obligation (RO) is currently the main support scheme for renewable electricity projects in the UK.
SUMMERThe calendar months April to September.
SYSTEM OPERATORNational Grid Electricity Transmission. Responsible for the coordination of electricity flows onto and over the transmission system, balancing generation supply and user demand.
TOTAL RECORDABLE INJURY RATE (TRIR)The frequency rate is calculated on the following basis: (lost time injuries + worse than first aid injuries)/hours worked x 100,000.
UK NAPUK National Allocation Plan.
UNDERLYING FINANCIAL MEASURESWe report financial measures described as “underlying” such as profit after tax and earnings per share. Underlying measures are adjusted to exclude losses on derivative contracts and material one-off items that do not reflect the underlying performance of the business.
WINTERThe calendar months October to March.

WWW.DRAX.COM
Drax Group plc Drax Power Station Selby North Yorkshire YO8 8PH
T +44 (0)1757 618381