Tufts Veeva 2017 eClinical Landscape Study · Tufts –Veeva 2017 eClinical Landscape Study •...
31
Tufts – Veeva 2017 eClinical Landscape Study • Assessing Data Management Practices, Performance, and Challenges • Usage of Data Sources, Management Applications, and their Challenges
Transcript of Tufts Veeva 2017 eClinical Landscape Study · Tufts –Veeva 2017 eClinical Landscape Study •...

Tufts – Veeva 2017 eClinical
Landscape Study
• Assessing Data Management Practices, Performance,
and Challenges
• Usage of Data Sources, Management Applications,
and their Challenges

About the Tufts – Veeva 2017 eClinical Landscape Study
• Conducted online between May – July 2017
• 257 Unique Companies Responded
• Respondent Years of Experience in Clinical Data Management
– Mean of 16.5 (Median 16 years)
• 87.9% of Respondents Located in the U.S.
2
Frequent User, 26%
One of Several
Responsible, 41%
Primary Person
Responsible, 32%
Clinical Data Management Responsibility*
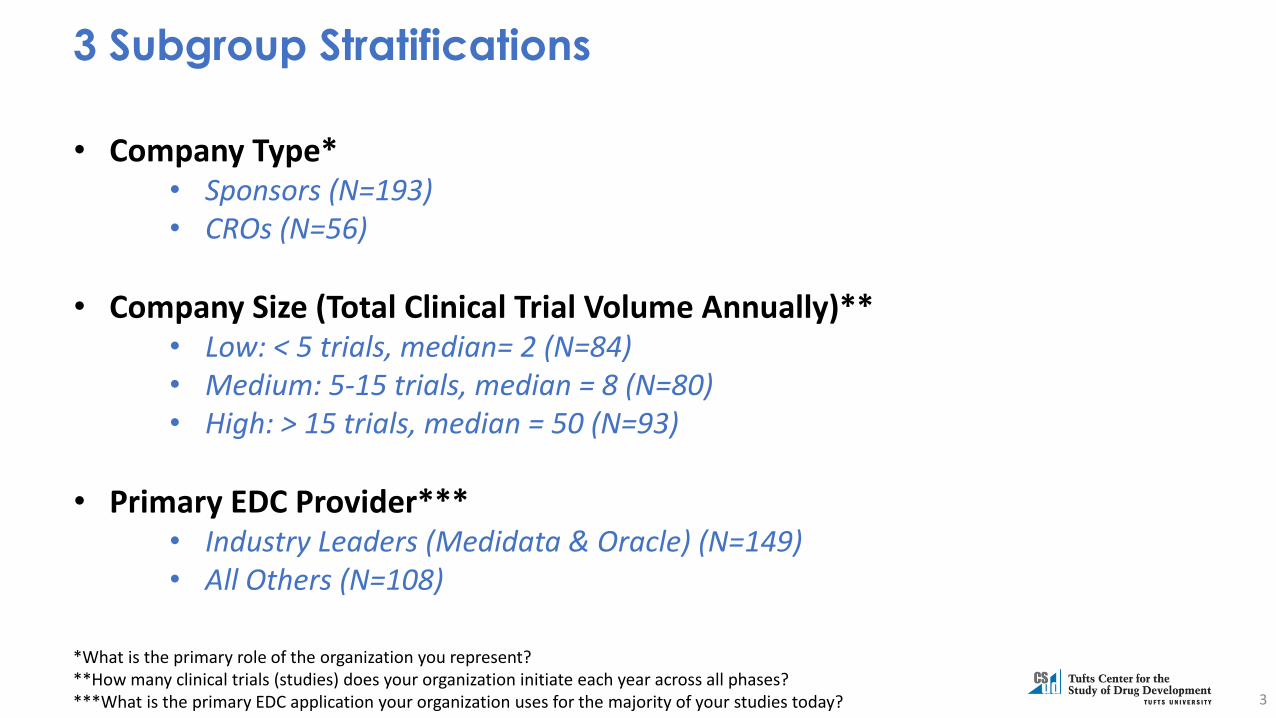
3 Subgroup Stratifications
• Company Type*• Sponsors (N=193) • CROs (N=56)
• Company Size (Total Clinical Trial Volume Annually)**• Low: < 5 trials, median= 2 (N=84)• Medium: 5-15 trials, median = 8 (N=80)• High: > 15 trials, median = 50 (N=93)
• Primary EDC Provider***• Industry Leaders (Medidata & Oracle) (N=149)• All Others (N=108)
3
*What is the primary role of the organization you represent?**How many clinical trials (studies) does your organization initiate each year across all phases?***What is the primary EDC application your organization uses for the majority of your studies today?

3.1%
14.0%
18.3%
19.5%
26.5%
32.3%
49.4%
61.1%
69.7%
70.4%
77.4%
100.0%
Other (Please Specify)
Study Start-up
Electronic Source Data Capture (eSource)
Electronic Medical Record (EHR/EMR)
Investor Grant Payments
Paper CRF
eCOA / ePRO
Clinical Trial Management System (CTMS)
Electronic Trial Master File (eTMF)
Safety/Pharmacovigilance
Randomization and Trial Supply Management
Electronic Data Capture (EDC)
Clinical Data Management Applications Used
4
Percent of companies using either proprietary or commercial applications
Do the clinical studies your organization executes (directly or through a service partner) utilize any of the following applications? Please indicate all that are currently used.

Average Number of Clinical Trial Applications Used
by Company Size
Volume of Clinical Trials Initiated Annually
Average Number of Applications Used*
Coefficient of Variation
Low 4.2 .40
Medium 5.5 .42
High 6.5 .33
5Do the clinical studies your organization executes (directly or through a service partner) utilize any of the following applications? Please indicate all that are currently used.
*Subgroup differences are significant (p<.05)
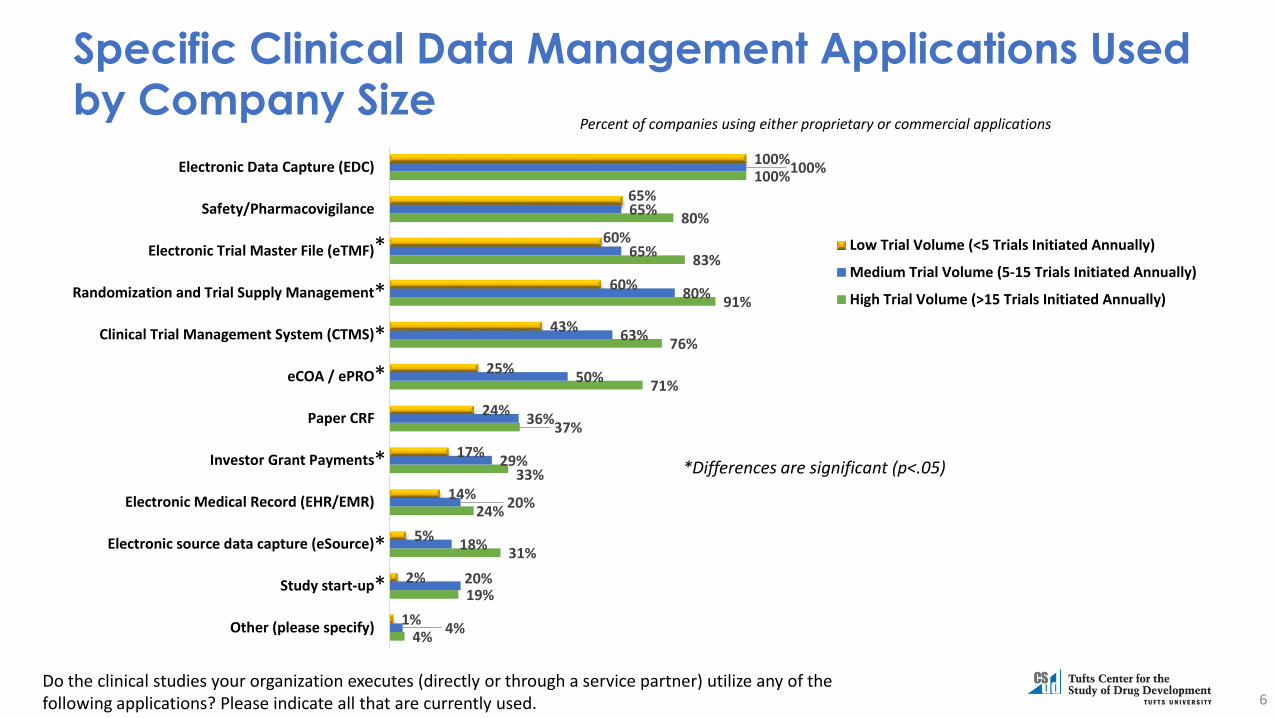
Specific Clinical Data Management Applications Used
by Company Size
6Do the clinical studies your organization executes (directly or through a service partner) utilize any of the following applications? Please indicate all that are currently used.
4%
19%
31%
24%
33%
37%
71%
76%
91%
83%
80%
100%
4%
20%
18%
20%
29%
36%
50%
63%
80%
65%
65%
100%
1%
2%
5%
14%
17%
24%
25%
43%
60%
60%
65%
100%
Other (please specify)
Study start-up
Electronic source data capture (eSource)
Electronic Medical Record (EHR/EMR)
Investor Grant Payments
Paper CRF
eCOA / ePRO
Clinical Trial Management System (CTMS)
Randomization and Trial Supply Management
Electronic Trial Master File (eTMF)
Safety/Pharmacovigilance
Electronic Data Capture (EDC)
Low Trial Volume (<5 Trials Initiated Annually)
Medium Trial Volume (5-15 Trials Initiated Annually)
High Trial Volume (>15 Trials Initiated Annually)
*Differences are significant (p<.05)
Percent of companies using either proprietary or commercial applications
*
*
*
*
*
*
*
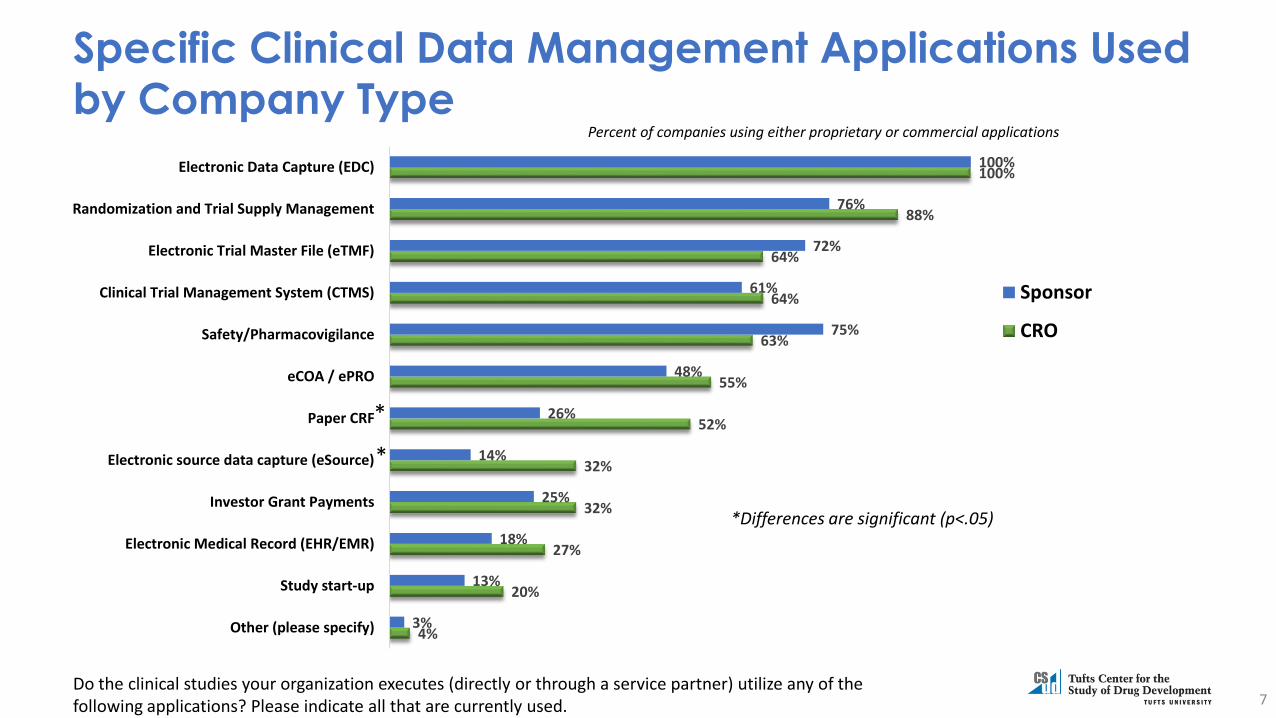
Specific Clinical Data Management Applications Used
by Company Type
7Do the clinical studies your organization executes (directly or through a service partner) utilize any of the following applications? Please indicate all that are currently used.
4%
20%
27%
32%
32%
52%
55%
63%
64%
64%
88%
100%
3%
13%
18%
25%
14%
26%
48%
75%
61%
72%
76%
100%
Other (please specify)
Study start-up
Electronic Medical Record (EHR/EMR)
Investor Grant Payments
Electronic source data capture (eSource)
Paper CRF
eCOA / ePRO
Safety/Pharmacovigilance
Clinical Trial Management System (CTMS)
Electronic Trial Master File (eTMF)
Randomization and Trial Supply Management
Electronic Data Capture (EDC)
Sponsor
CRO
Percent of companies using either proprietary or commercial applications
*
*
*Differences are significant (p<.05)

Types of Data Companies Manage in Their Primary EDC
9.7%
9.7%
20.2%
20.6%
21.4%
28.0%
33.9%
34.2%
56.8%
59.5%
59.5%
100.0%
Genomic Data
Mobile Health Data
Medical Images
eCOA Data
PharmacoDynamic Data
Biomarker Data
Pharmacokinetic Data
ePRO Data
Central Lab Data
QoL Data
Local Lab Data
eCRF Data
8What data does your organization manage in their primary EDC application? Select all that apply.
Percent of companies
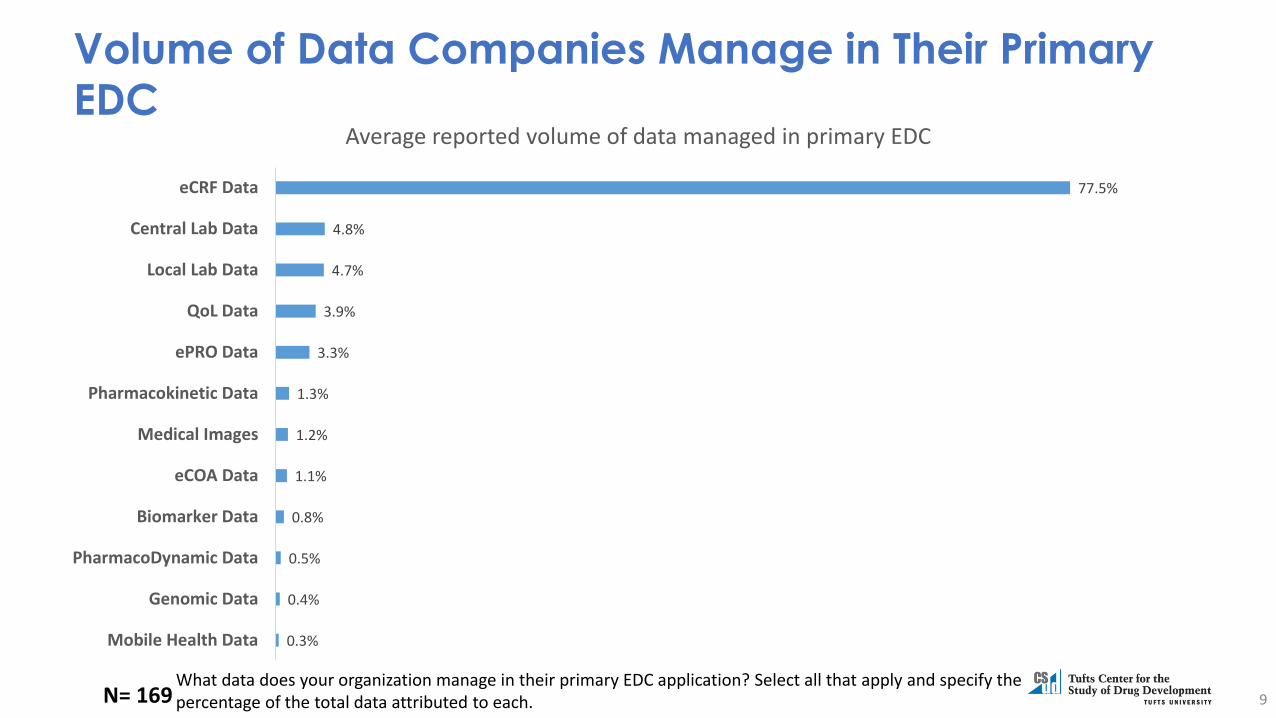
Volume of Data Companies Manage in Their Primary
EDC
0.3%
0.4%
0.5%
0.8%
1.1%
1.2%
1.3%
3.3%
3.9%
4.7%
4.8%
77.5%
Mobile Health Data
Genomic Data
PharmacoDynamic Data
Biomarker Data
eCOA Data
Medical Images
Pharmacokinetic Data
ePRO Data
QoL Data
Local Lab Data
Central Lab Data
eCRF Data
Average reported volume of data managed in primary EDC
9N= 169What data does your organization manage in their primary EDC application? Select all that apply and specify the percentage of the total data attributed to each.
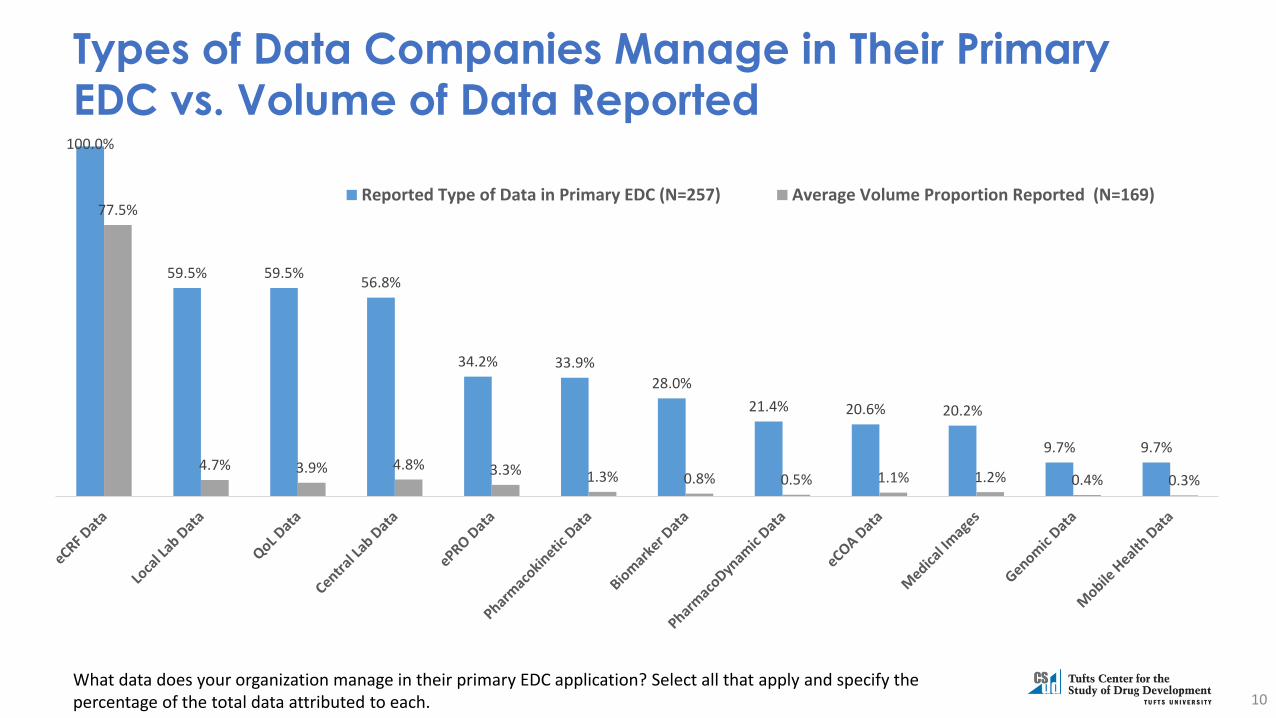
Types of Data Companies Manage in Their Primary
EDC vs. Volume of Data Reported100.0%
59.5% 59.5%56.8%
34.2% 33.9%
28.0%
21.4% 20.6% 20.2%
9.7% 9.7%
77.5%
4.7% 3.9% 4.8% 3.3% 1.3% 0.8% 0.5% 1.1% 1.2% 0.4% 0.3%
Reported Type of Data in Primary EDC (N=257) Average Volume Proportion Reported (N=169)
10What data does your organization manage in their primary EDC application? Select all that apply and specify the percentage of the total data attributed to each.

Data Sources Used Currently and Projected Use in 3
Years100.0%
30.8%
69.6%
44.8%
38.4% 40.4%
29.2%32.1% 31.9%
100.0%
92.7% 92.6% 91.6%
84.1% 82.7%
76.3%
61.8%
55.4%
EDC eInformedConsent
eCOA / ePRO Smart Phone eSource Custom Apps mHealth Personal CardiacMonitoring
Blood GlucoseMonitoring
Data Used Currently Projected Data Usage in 3 Years
11
Select the frequency with which your organization utilizes data from the following sources currently and estimate the frequency of utilization in three years. (Data source utilization corresponds to frequencies of “always”, “often”, or “sometimes”)
Percent of companies
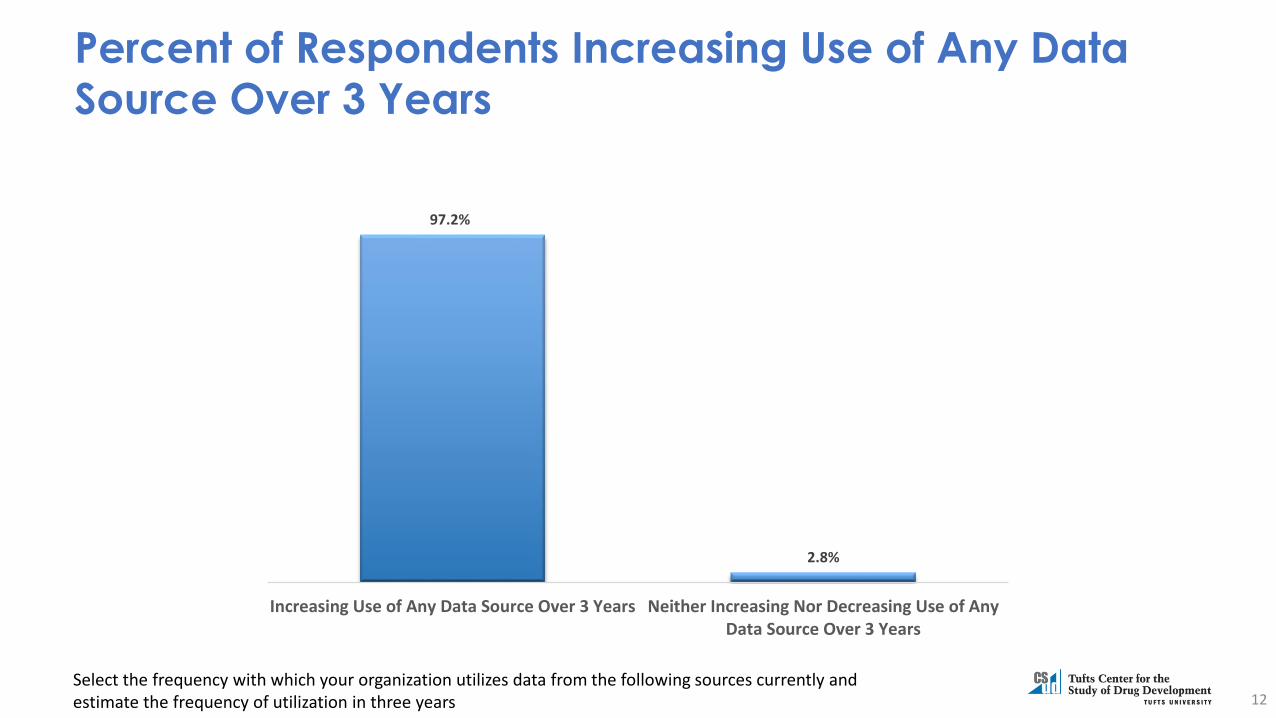
Percent of Respondents Increasing Use of Any Data
Source Over 3 Years
97.2%
2.8%
Increasing Use of Any Data Source Over 3 Years Neither Increasing Nor Decreasing Use of AnyData Source Over 3 Years
12Select the frequency with which your organization utilizes data from the following sources currently and estimate the frequency of utilization in three years

Proportion of Companies Projecting Change in Total
Data Sources Used in 3 Years
Increasing Number of Data Sources in 3 Years
69.7%
Decreasing Number of Sources in 3 Years
4.5%
No Change in Number of Sources in 3 Years
25.8%
13
Select the frequency with which your organization utilizes data from the following sources currently and estimate the frequency of utilization in three years. (Data source utilization corresponds to frequencies of “always”, “often”, or “sometimes”)
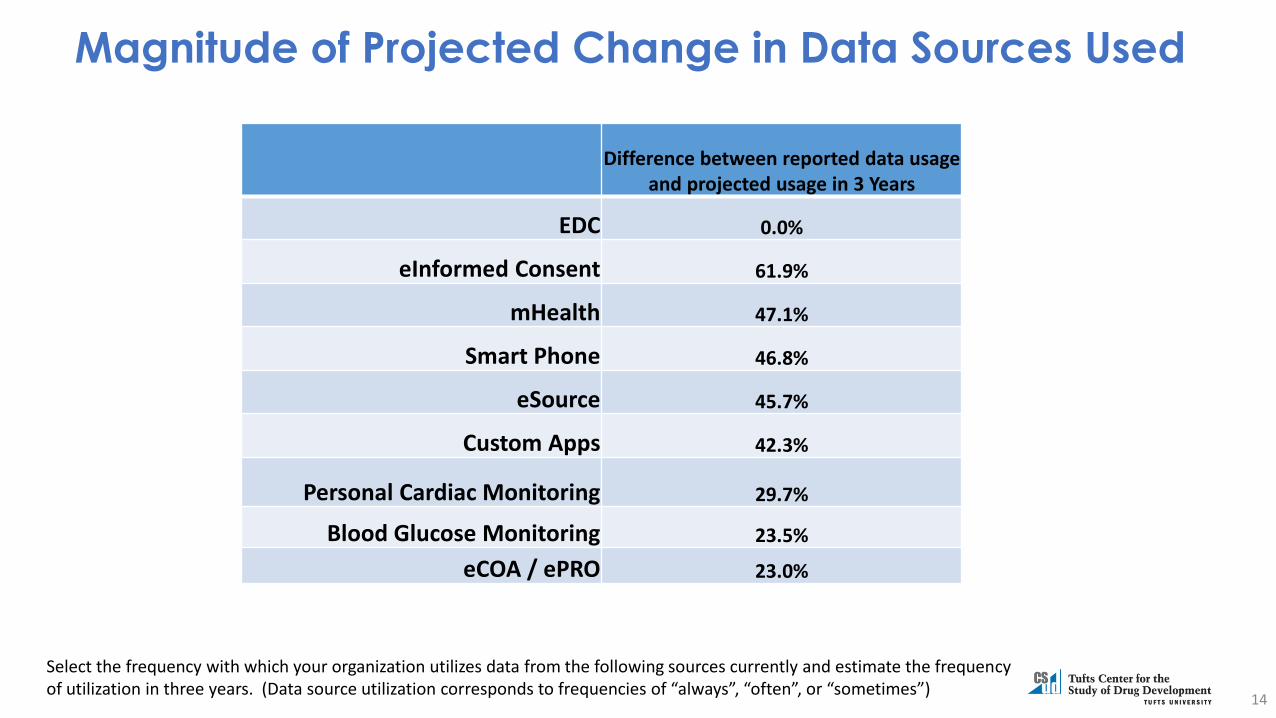
Magnitude of Projected Change in Data Sources Used
14
Difference between reported data usage and projected usage in 3 Years
EDC 0.0%
eInformed Consent 61.9%
mHealth 47.1%
Smart Phone 46.8%
eSource 45.7%
Custom Apps 42.3%
Personal Cardiac Monitoring 29.7%
Blood Glucose Monitoring 23.5%
eCOA / ePRO 23.0%
Select the frequency with which your organization utilizes data from the following sources currently and estimate the frequency of utilization in three years. (Data source utilization corresponds to frequencies of “always”, “often”, or “sometimes”)

Projected Data Sources Used in 3 Years by Company
Type96.9% 96.7% 96.7% 96.6%
89.7%86.2%
82.1% 81.5%
90.1%
81.2%
90.2% 89.9%
73.2%
80.0%
46.3%
56.0%
eCOA / ePRO eSource eInformed Consent Smart Phone mHealth Custom Apps Blood GlucoseMonitoring
Personal CardiacMonitoring
CROs Sponsors
15
**
Select the frequency with which your organization utilizes data from the following sources currently and estimate the frequency of utilization in three years. (Data source utilization corresponds to frequencies of “always”, “often”, or “sometimes”)
*Differences are significant (p<.05)
Percent of companies

Projected Data Sources Used in 3 Years by Company
Size
84.4%87.5% 88.0%
52.4%
70.7%
79.5%
37.0%
30.0%
91.1%88.9%
91.3%
79.5% 79.6%
85.0%
68.2%
57.9%
98.2% 96.6% 95.1%91.4% 91.2%
89.1%
79.6%76.5%
eInformed Consent Smart Phone eCOA / ePRO mHealth Custom Apps eSource Personal CardiacMonitoring
Blood GlucoseMonitoring
Low Clinical Trial Volume Medium Clinical Trial Volume High Clinical Trial Volume
16
* * **
Select the frequency with which your organization utilizes data from the following sources currently and estimate the frequency of utilization in three years. (Data source utilization corresponds to frequencies of “always”, “often”, or “sometimes”)
Percent of companies
*Differences are significant (p<.05)
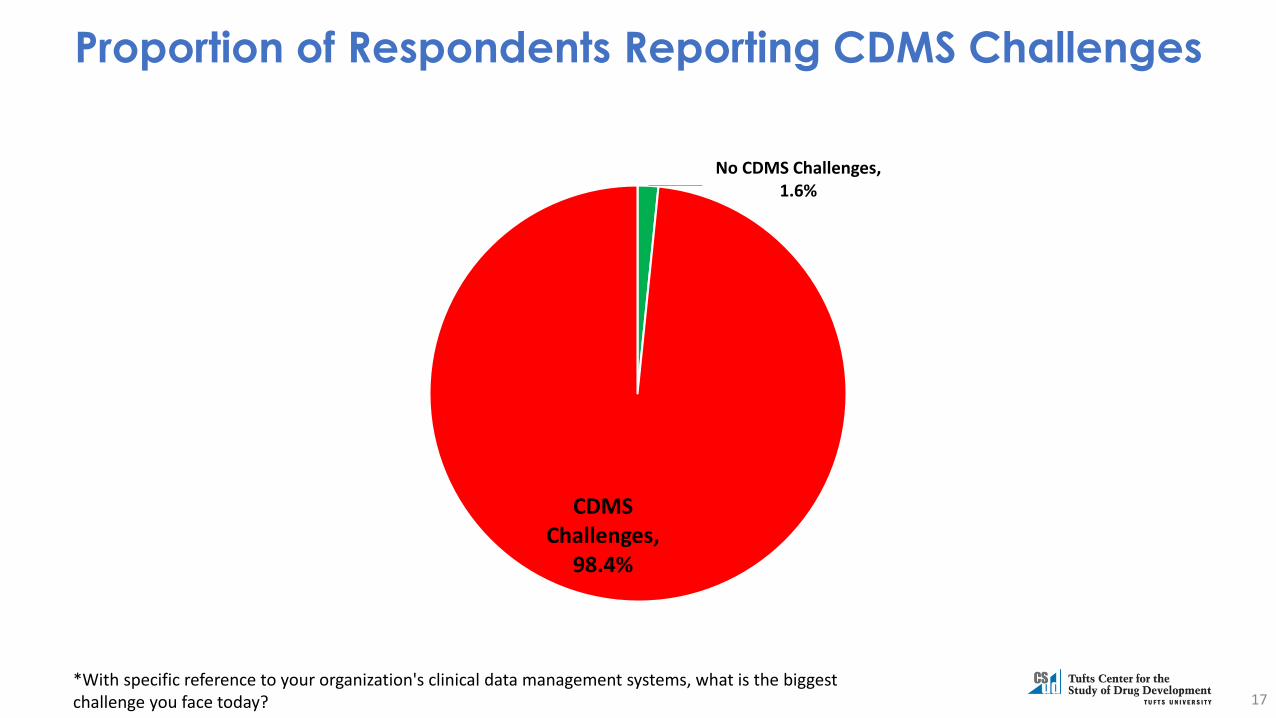
Proportion of Respondents Reporting CDMS Challenges
No CDMS Challenges, 1.6%
CDMS Challenges,
98.4%
17*With specific reference to your organization's clinical data management systems, what is the biggest challenge you face today?
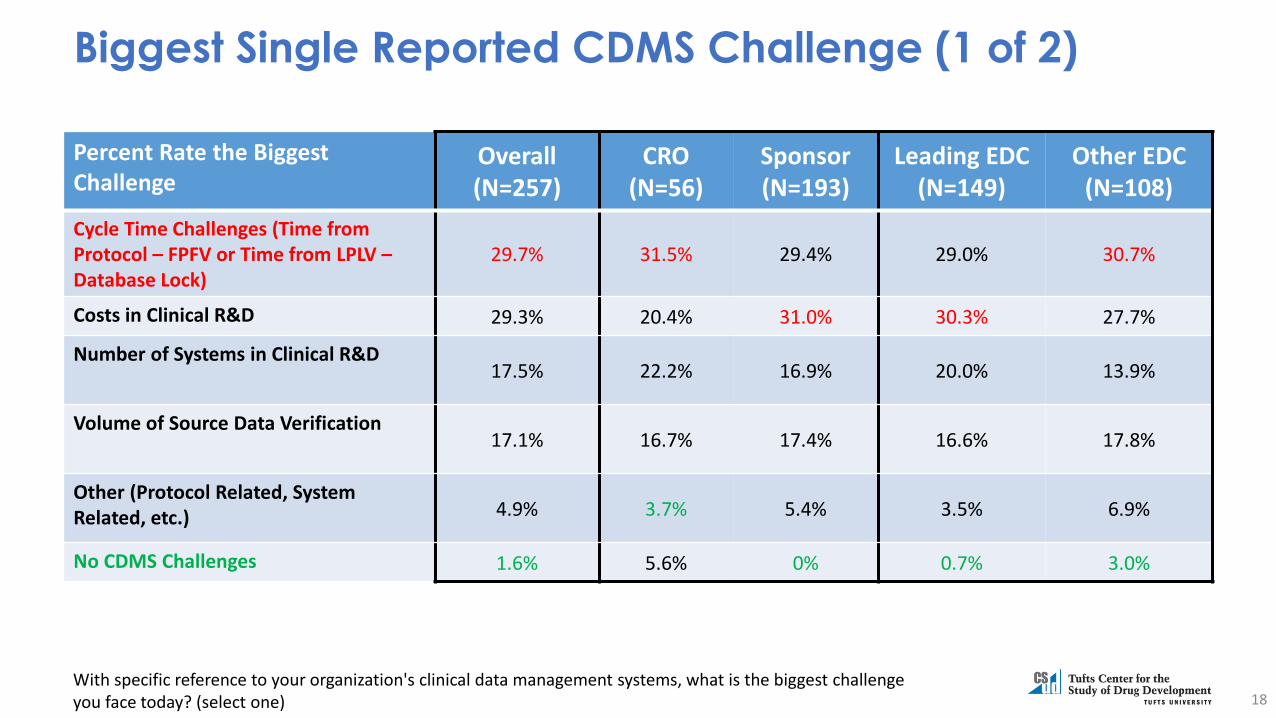
Biggest Single Reported CDMS Challenge (1 of 2)
18
Percent Rate the Biggest Challenge
Overall (N=257)
CRO (N=56)
Sponsor(N=193)
Leading EDC (N=149)
Other EDC (N=108)
Cycle Time Challenges (Time from Protocol – FPFV or Time from LPLV –Database Lock)
29.7% 31.5% 29.4% 29.0% 30.7%
Costs in Clinical R&D 29.3% 20.4% 31.0% 30.3% 27.7%
Number of Systems in Clinical R&D17.5% 22.2% 16.9% 20.0% 13.9%
Volume of Source Data Verification17.1% 16.7% 17.4% 16.6% 17.8%
Other (Protocol Related, System Related, etc.) 4.9% 3.7% 5.4% 3.5% 6.9%
No CDMS Challenges 1.6% 5.6% 0% 0.7% 3.0%
With specific reference to your organization's clinical data management systems, what is the biggest challenge you face today? (select one)
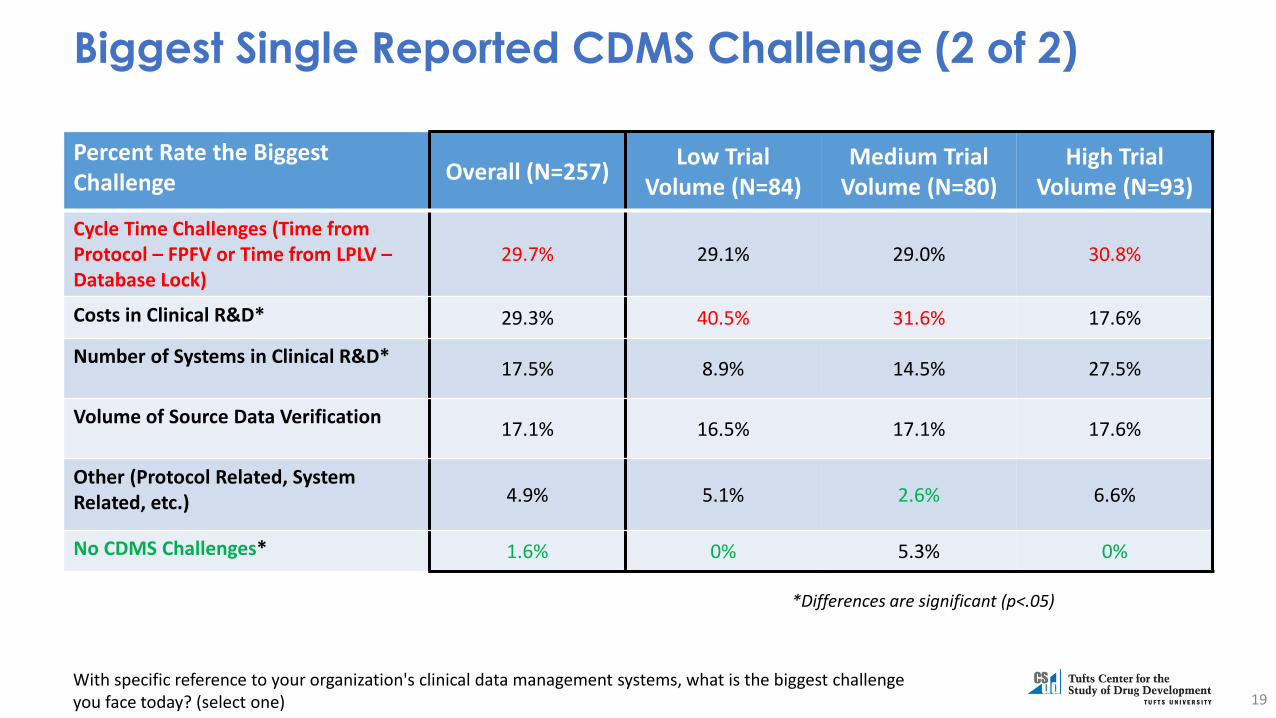
Biggest Single Reported CDMS Challenge (2 of 2)
19
Percent Rate the Biggest Challenge Overall (N=257)
Low Trial Volume (N=84)
Medium Trial Volume (N=80)
High TrialVolume (N=93)
Cycle Time Challenges (Time from Protocol – FPFV or Time from LPLV –Database Lock)
29.7% 29.1% 29.0% 30.8%
Costs in Clinical R&D* 29.3% 40.5% 31.6% 17.6%
Number of Systems in Clinical R&D*17.5% 8.9% 14.5% 27.5%
Volume of Source Data Verification17.1% 16.5% 17.1% 17.6%
Other (Protocol Related, System Related, etc.) 4.9% 5.1% 2.6% 6.6%
No CDMS Challenges* 1.6% 0% 5.3% 0%
*Differences are significant (p<.05)
With specific reference to your organization's clinical data management systems, what is the biggest challenge you face today? (select one)

Data Management Cycle Time(In Days)
68.3
8.1
36.3
Time to Build and Release StudyDatabase (N=220)*
Time from Patient Visit to DataEntered into the EDC (N=230)**
Time from Study's Last Patient LastVisit to Database Lock (N=236)***
CoV = .48
20
CoV = .93
CoV = .91
*On average, how many weeks does it take for your company to build and release a study database, including all edit checks?**On average, how many days do you estimate it takes from the patient visit to when the patient's data is entered into the EDC application?***On average for phase II and III trials, how many days do you estimate it takes from the study's last patient out (LPO)/last patient last visit (LPLV) to database lock (all data)?
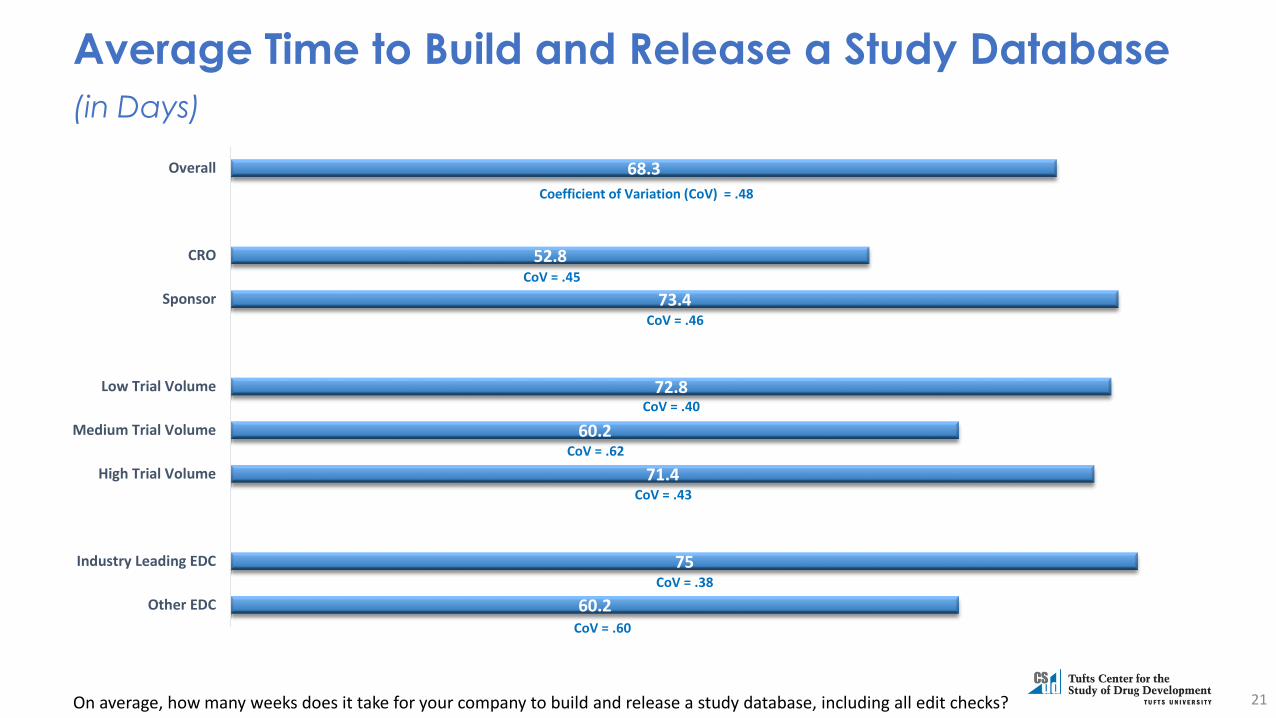
Average Time to Build and Release a Study Database
(in Days)
60.2
75
71.4
60.2
72.8
73.4
52.8
68.3
Other EDC
Industry Leading EDC
High Trial Volume
Medium Trial Volume
Low Trial Volume
Sponsor
CRO
Overall
21
Coefficient of Variation (CoV) = .48
CoV = .45
CoV = .46
CoV = .40
CoV = .62
CoV = .43
On average, how many weeks does it take for your company to build and release a study database, including all edit checks?
CoV = .38
CoV = .60

Average Time for Site Staff to Enter Patient Data
(in Days)
6.8
9
8.4
7.7
8.2
8.4
6.8
8.1
Other EDC
Industry Leading EDC
High Trial Volume
Medium Trial Volume
Low Trial Volume
Sponsor
CRO
Overall
22
CoV = .93
CoV = .66
CoV = .92
CoV = .95
CoV = 1.0
CoV = .87
On average, how many days do you estimate it takes from the patient visit to when the patient's data is entered into the EDC application?
CoV = .78
CoV = 1.18

Average Time to Lock a Study Database(in Days)
31.8
39.4
33.7
33.7
42.7
38.7
27.7
36.3
Other EDC
Industry Leading EDC
High Trial Volume
Medium Trial Volume
Low Trial Volume
Sponsor
CRO
Overall
23
CoV = .91
CoV = .75
CoV = .91
CoV = .75
CoV = .67
CoV = 1.19
On average for phase II and III trials, how many days do you estimate it takes from the study's last patient out (LPO)/last patient last visit (LPLV) to database lock (all data)?
CoV = .92
CoV = .85

Top Causes of Database Build Delays
24
Percent of Total
(N=257)
CROs (N=56)
Sponsors (N=193)
Industry Leaders (N=149)
Other EDC (N=115)
Protocol Changes 45.1% 51.8% 43.5% 47.0% 42.6%
User Acceptance Testing (Including Review and Approvals)
16.7% 12.5% 17.6% 14.1% 20.4%
Database Design Functionality 15.2% 7.1% 17.6% 12.1% 19.4%
Study Database Move from Development into Production
8.2% 7.1% 8.8% 10.7% 4.6%
Standards Management 4.3% 0% 5.7% 6.7% 0.9%
Ethics Approval Delays/Changes 1.2% 1.8% 1.0% 1.3% 0.9%
To the best of your knowledge, what is the most common cause for delays when your organization is building clinical trial databases?

Association Between Causes of Delays and Cycle
Times
Percent of Total (N=257)
*Time from LPLV to DB Lock
Coefficient of Variation
Protocol Changes 45.1% 31.8 Days .73
User Acceptance Testing (Including Review and Approvals)
16.7% 34.2 Days .90
Database Design Functionality 15.2% 50.4 Days 1.15
Study Database Move from Development into Production
8.2% 39 Days .57
Standards Management 4.3% 37.5 Days .51
Ethics Approval Delays/Changes 1.2% 33.3 Days .46
Overall 100% 36.3 Days .91
25
To the best of your knowledge, what is the most common cause for delays when your organization is building clinical trial databases?*On average for phase II and III trials, how many days do you estimate it takes from the study's last patient out (LPO)/last patient last visit (LPLV) to database lock (all data)?

Challenges Loading Data into Primary EDC
Loading Issues,
77%
No Loading Issues, 23%
26
Integration Issues, 34%
EDC System Limitations,
32%
Technical Demands
on Support Staff, 29%
Other, 5%
What, if anything, prevents your company from loading data into your organization's primary EDC application?

Specific Factors Preventing Respondents from Loading
Data into Their Primary EDC
27What, if anything, prevents your company from loading data into your organization's primary EDC application?
4.9%
5.2%
7.5%
13.9%
15.5%
18.8%
34.3%
Other
EDC System Performance Penalty
EDC System Financial Penalty
Technical Demands with External Support Staff
Technical Demands with Internal Support Staff
EDC System Limitation
Cost/Effort of Integration
Factors Selected (Multiple)
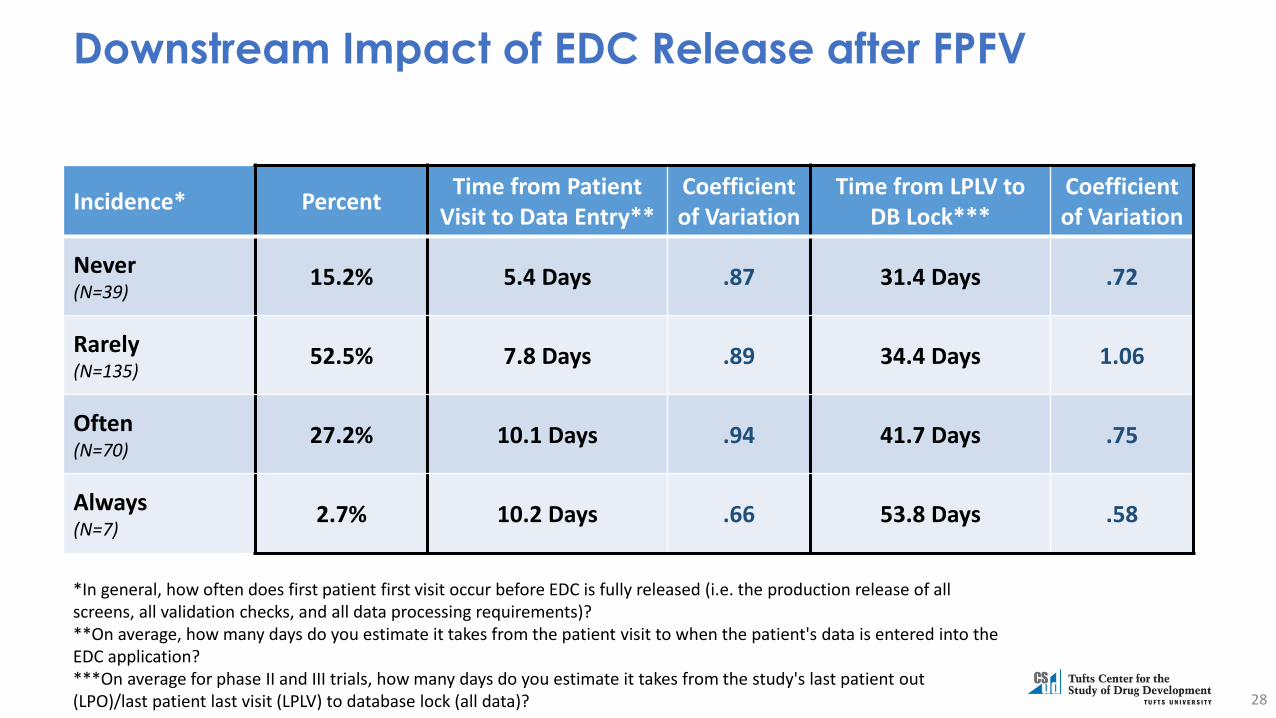
Downstream Impact of EDC Release after FPFV
28
Incidence* PercentTime from Patient
Visit to Data Entry**Coefficient of Variation
Time from LPLV to DB Lock***
Coefficient of Variation
Never(N=39)
15.2% 5.4 Days .87 31.4 Days .72
Rarely(N=135)
52.5% 7.8 Days .89 34.4 Days 1.06
Often(N=70)
27.2% 10.1 Days .94 41.7 Days .75
Always(N=7)
2.7% 10.2 Days .66 53.8 Days .58
*In general, how often does first patient first visit occur before EDC is fully released (i.e. the production release of all screens, all validation checks, and all data processing requirements)?**On average, how many days do you estimate it takes from the patient visit to when the patient's data is entered into the EDC application?***On average for phase II and III trials, how many days do you estimate it takes from the study's last patient out (LPO)/last patient last visit (LPLV) to database lock (all data)?

Incidence of EDC Release After FPFV
15.2% 15.5% 14.3% 13.1% 16.3% 16.1%
52.5% 49.7%64.3%
52.4%52.5% 52.7%
27.2% 28.5%
19.6%
28.6%28.8% 24.7%
2.7% 3.6% 4.8% 1.3% 2.2%
OVERALL SPONSOR CRO LOW MEDIUM HIGH
Never Rarely Often Always
29In general, how often does first patient first visit occur before EDC is fully released (i.e. the production release of all screens, all validation checks, and all data processing requirements)?
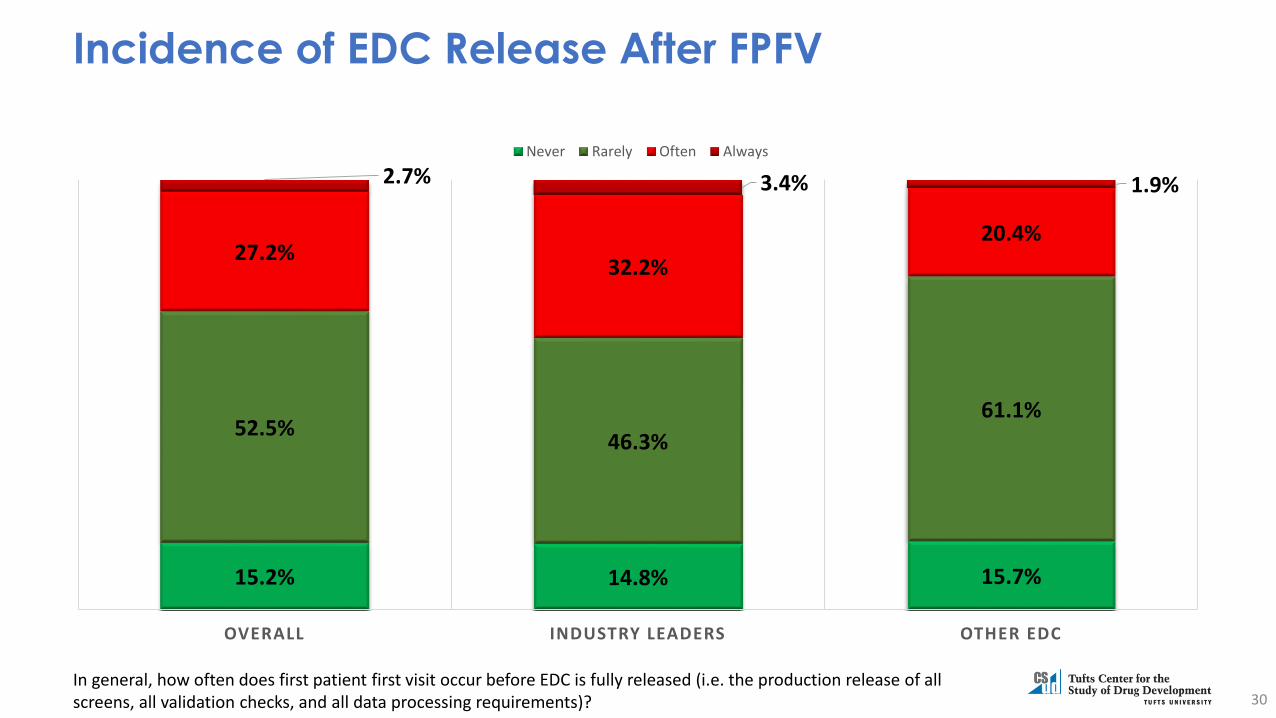
Incidence of EDC Release After FPFV
15.2% 14.8% 15.7%
52.5%46.3%
61.1%
27.2%32.2%
20.4%
2.7% 3.4% 1.9%
OVERALL INDUSTRY LEADERS OTHER EDC
Never Rarely Often Always
30In general, how often does first patient first visit occur before EDC is fully released (i.e. the production release of all screens, all validation checks, and all data processing requirements)?
About
• About the Tufts Center for the Study of Drug Development
The Tufts Center for the Study of Drug Development at Tufts University provides strategic information to help drug developers, regulators, and policy makers improve the quality and efficiency of pharmaceutical development, review, and utilization. Tufts CSDD conducts a wide range of in-depth analyses on pharmaceutical issues and hosts symposia, workshops, and public forums.
Tel: 617-636-2170 Fax: 617-636-2425
Email: [email protected] Web: http://csdd.tufts.edu
• About Veeva:Veeva Systems Inc. is a leader in cloud-based software for the global life sciences industry. Committed to innovation, product excellence, and customer success, Veeva has more than 550 customers, ranging from the world's largest pharmaceutical companies to emerging biotechs. Veeva is headquartered in the San Francisco Bay Area, with offices in Europe, Asia, and Latin America. For more information, visit veeva.com.
Tel: (925) 452-6500
Email: [email protected] Web: https://www.veeva.com
31