Transportation Performance Management Measures and Target ...
22
Transportation Performance Management Measures and Target Setting #2 Nick Donohue Deputy Secretary of Transportation May 15, 2018
Transcript of Transportation Performance Management Measures and Target ...

Transportation Performance Management
Measures and Target Setting #2
Nick Donohue
Deputy Secretary of Transportation
May 15, 2018

2
• MAP-21 Federal Law – establish performance
targets for:
– Asset Management - Pavements and Bridges
– System Performance
– Congestion
– Air Quality
– Safety
• HB2241/SB1331 – Board to establish
performance targets for surface transportation
Performance Management
Measures and Target

3
• Freight Reliability Measure
• CMAQ – Emissions Reduction
Performance Measures
Baseline Conditions
4
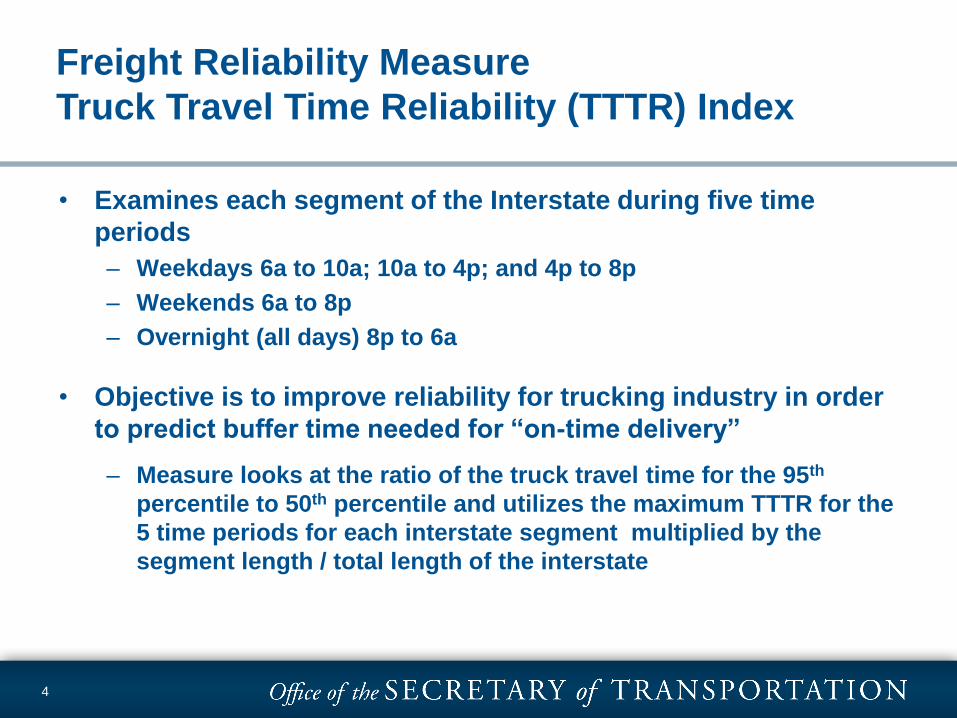
• Examines each segment of the Interstate during five time
periods
– Weekdays 6a to 10a; 10a to 4p; and 4p to 8p
– Weekends 6a to 8p
– Overnight (all days) 8p to 6a
• Objective is to improve reliability for trucking industry in order
to predict buffer time needed for “on-time delivery”
– Measure looks at the ratio of the truck travel time for the 95th
percentile to 50th percentile and utilizes the maximum TTTR for the
5 time periods for each interstate segment multiplied by the
segment length / total length of the interstate
Freight Reliability Measure
Truck Travel Time Reliability (TTTR) Index

Metropolitan Planning Organization 2016 TTTR 2017 TTTR
Winchester-Frederick County MPO 1.10 1.10
Blacksburg-Christiansburg-Montgomery Area MPO 1.09 1.09
Bristol MPO 1.11 1.13
Tri Cities Area MPO 1.12 1.14
Richmond Area MPO 1.44 1.45
Staunton-Augusta-Waynesboro MPO 1.11 1.11
Roanoke Valley MPO 1.21 1.23
National Capital Region Transportation Planning Board 2.88 2.91
Charlottesville-Albemarle MPO 1.15 1.13
Hampton Roads Transportation Planning Organization 2.03 2.05
Harrisonburg-Rockingham MPO 1.06 1.06
Fredericksburg Area MPO 2.60 2.61
5
Freight Reliability Measure Baseline
Truck Travel Time Reliability (TTTR) Index

Freight Reliability Measure
2016 TTTR Index Heat Map
6

Freight Reliability Measure
2017 TTTR Index Heat Map
7

Freight Reliability Measure
Change in TTTR Index 2016 to 2017
8
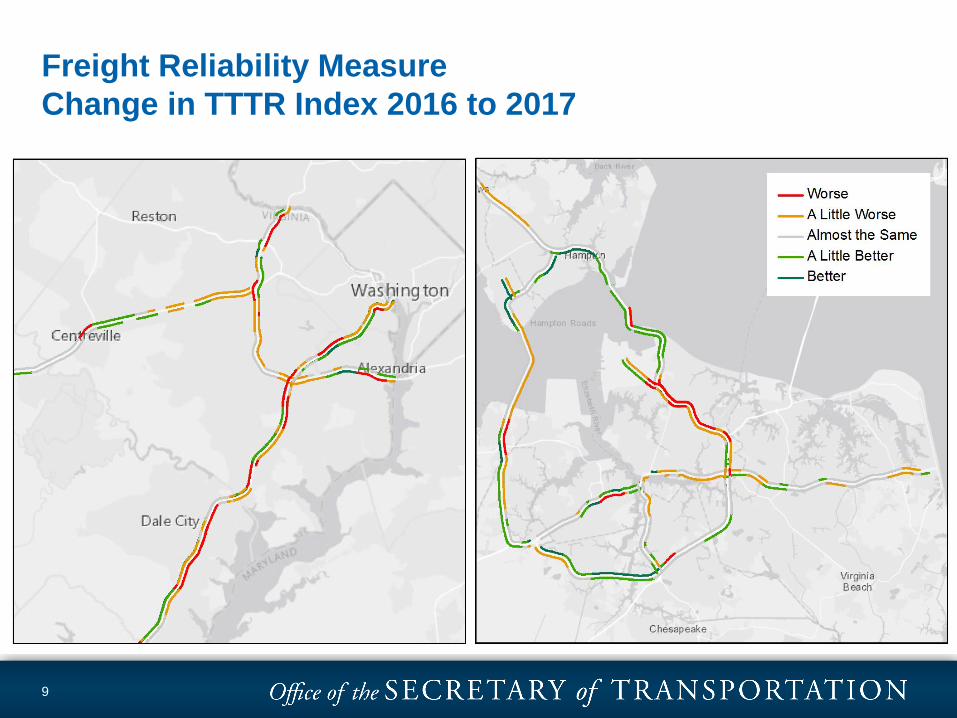
Freight Reliability Measure
Change in TTTR Index 2016 to 2017
9

CMAQ Emissions Reduction Measure
• The Total Emissions Reduction is the cumulative 2-
year and 4-year reported emission reductions for:
– All projects funded using CMAQ funds
– Applicable criteria for pollutants and or their
precursors
– Only applies to Northern Virginia (TPB)
– Applicable Pollutants: volatile organic compounds (VOC)
and nitrogen oxides (NOx)
• Applicable State DOTs and MPOs must coordinate
and collectively to establish a methodology for
developing targets

CMAQ Emissions Reduction Measure
Baseline
11
0
2
4
6
8
10
12
FY14 FY15 FY16 FY17
VOC
NOx
FY 14-17 Emission Reductions (kg/day)
12
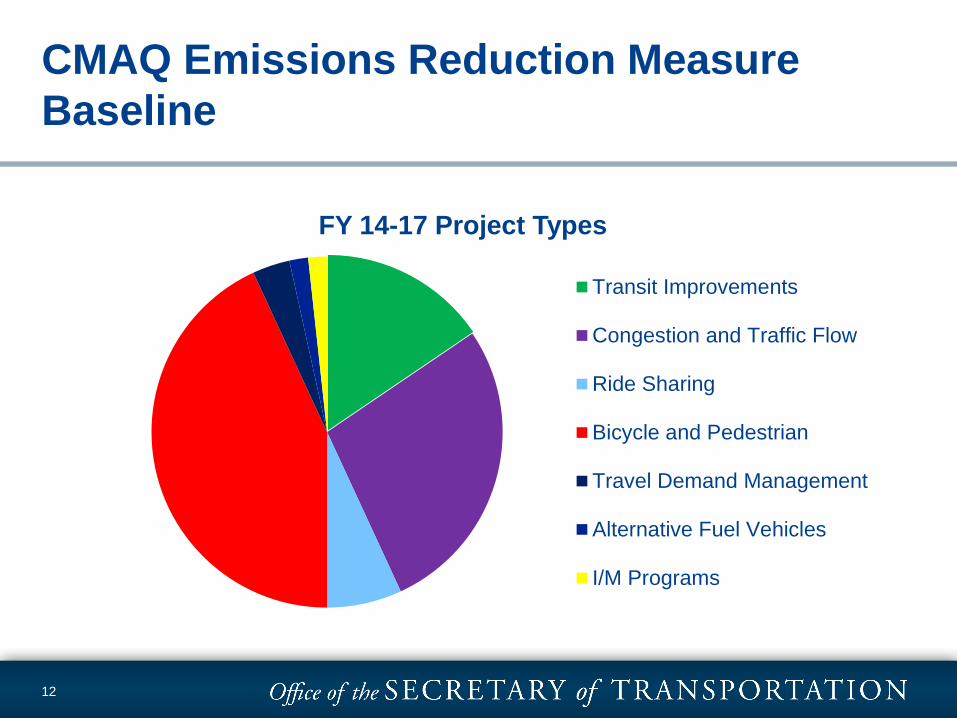
FY 14-17 Project Types
Transit Improvements
Congestion and Traffic Flow
Ride Sharing
Bicycle and Pedestrian
Travel Demand Management
Alternative Fuel Vehicles
I/M Programs
CMAQ Emissions Reduction Measure
Baseline

Target Setting Methodology
• Trends lines (straight or best fit) based on historic data to establish
future conditions
– Captures existing trends of actual performance
• Extrapolation (linear or exponential)
– Can be useful with limited data sets
• Modeling to forecast future performance
– Uses existing trends/conditions along with related indicators (deterioration
rates, projected growth, etc.) to project future conditions (i.e. Travel Demand
Models, Pavement Management System, Bridge Management System)
• Anticipated Projects
– Estimated benefits of programmed projects (i.e. CMAQ funded projects)
• Mix of the concepts above
13

Safety Performance Measures
• Safety Performance Measures
– Number of fatalities*
– Number of severe injuries*
– Rate of fatalities per 100M vehicle miles traveled*
– Rate of severe injuries per 100M vehicle miles traveled**
– Number of non-motorized fatalities and severe injuries**
• Safety Targets Due Annually
– Initial targets for 2018 established August 2017
– DMV and VDOT must agree to targets
– DMV targets due July 1, 2018
– VDOT targets due August 31, 2018
14
*Federal measure impacting VDOT and DMV
**Federal measure impacting VDOT only

2019 Fatalities Based on Trend-line
773756
745 747 747
760
776
740
703
753761
843
748
650
700
750
800
850
900
2012 2013 2014 2015 2016 2017 2018 2019 2020 2021 2022 2023
Nu
mb
er
of
Fata
litie
s
Five-Year Period EndingFive-Year Average Fatalities Annual Virginia 2019 Target DMV Trend 2012-2016 DMV Trend 2019-2023

2019 Fatalities per 100M VMT Based on
Trend-line
0.950.93
0.92 0.920.91 0.92
0.96
0.92
0.87
0.91 0.90
0.98*
0.89
0.70
0.80
0.90
1.00
1.10
2012 2013 2014 2015 2016 2017 2018 2019 2020 2021 2022 2023
Nu
mb
er
of
Fata
litie
s p
er
10
0 M
VM
T
Five-Year Period EndingFive-Year Average Fatality Rate Annual Virginia 2019 Target DMV 2012-2016 DMV 2019-2023
*Projected 2017 baseline based on 1.5% VMT growth

2019 Serious Injuries Trend-line
12,484
10,904
9,800
9,0568,494
7,994
10,126
8,643
7,5988,014 8,089
7,6247,197
2,000
4,000
6,000
8,000
10,000
12,000
14,000
2012 2013 2014 2015 2016 2017 2018 2019 2020 2021 2022
Nu
mb
er
of
Seri
ou
s In
juri
es
Five-Year Period EndingFive-Year Average Serious Injuries Annual Virginia 2019 Target DMV 2012-2016 DMV 2019-2023

15.31
13.43
12.07
11.15
10.38
9.66
12.51
10.70
9.389.70 9.60
8.92* 8.36
4
6
8
10
12
14
16
18
2012 2013 2014 2015 2016 2017 2018 2019 2020 2021 2022
Nu
mb
er
of
Seri
ou
s In
juri
es
pe
r 1
00
VM
T
Five-Year Period EndingFive-Year Average Serious Injury Rate Annual Virginia 2019 Target Linear (Five-Year Average Serious Injury Rate)
*Projected 2017 baselinewith 1.5% VMT growth
2019 Serious Injuries per 100M VMT
Based on Trend-line
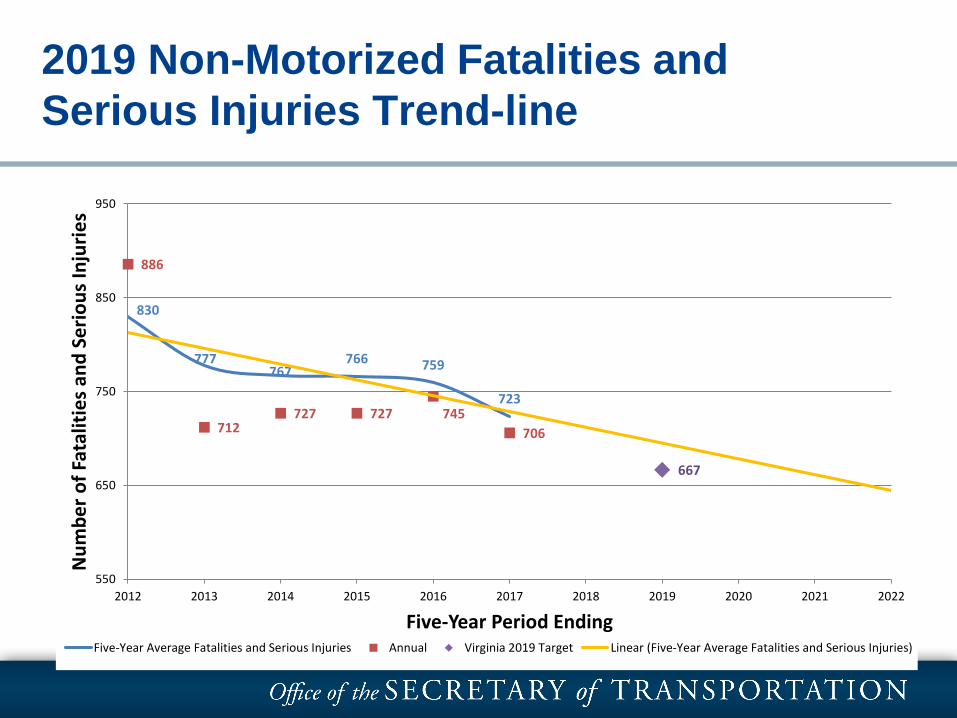
830
777767
766 759
723
886
712727 727 745
706
667
550
650
750
850
950
2012 2013 2014 2015 2016 2017 2018 2019 2020 2021 2022
Nu
mb
er
of
Fata
litie
s an
d S
eri
ou
s In
juri
es
Five-Year Period EndingFive-Year Average Fatalities and Serious Injuries Annual Virginia 2019 Target Linear (Five-Year Average Fatalities and Serious Injuries)
2019 Non-Motorized Fatalities and
Serious Injuries Trend-line

Safety Targets
National Highway Transportation Safety
Administration and FHWA recommend using trend-
line analysis to establish targets
• Trend-line analysis has a 1-2 year lag
• “5-year rolling average” includes 9 years of data, the
trends have changed during this time period
• Does not take into account new investment strategies
or laws and policies
20

Safety Targets
• Challenged staff to develop a new data-based
methodology to establishing targets
• Draft concept includes—
– Review causes of fatalities and severe injuries
– Determine which causes can be influenced by
capital improvements
– Determine whether travel will increase/decrease
– Evaluate safety impact of projects that opened to
traffic the previous year
21

• Methodology for Target Setting
Define Purpose
Set Target parameters
Assemble baseline data and analyze trends
Present remaining baseline data at following meeting
4. Develop targets for the Board’s consideration
5. Seek feedback from Board and other stakeholders
6. Provide adopted targets to USDOT by October
Next Steps