Developing Sustainable Transportation Performance Measures
218
Technical Report Documentation Page 1. Report No. FHWA/TX-09/0-5541-1 2. Government Accession No. 3. Recipient's Catalog No. 4. Title and Subtitle DEVELOPING SUSTAINABLE TRANSPORTATION PERFORMANCE MEASURES FOR TXDOT’S STRATEGIC PLAN: TECHNICAL REPORT 5. Report Date October 2008 Published: April 2009 6. Performing Organization Code 7. Author(s) Tara Ramani, Josias Zietsman, William Eisele, Duane Rosa, Debbie Spillane and Brian Bochner 8. Performing Organization Report No. Report 0-5541-1 9. Performing Organization Name and Address Texas Transportation Institute The Texas A&M University System College Station, Texas 77843-3135 10. Work Unit No. (TRAIS) 11. Contract or Grant No. Project 0-5541 12. Sponsoring Agency Name and Address Texas Department of Transportation Research and Technology Implementation Office P. O. Box 5080 Austin, Texas 78763-5080 13. Type of Report and Period Covered Technical Report: September 2006-August 2008 14. Sponsoring Agency Code 15. Supplementary Notes Research performed in cooperation with the Texas Department of Transportation and the U.S. Department of Transportation, Federal Highway Administration. Project Title: Developing Sustainable Transportation Performance Measures for TxDOT’s Strategic Plan Research Project Title: http://tti.tamu.edu/documents/0-5541-1.pdf 16. Abstract For this research project, sustainable transportation can be viewed as the provision of safe, effective, and efficient access and mobility into the future while considering economic, social, and environmental needs. This project developed a performance measurement-based sustainability evaluation methodology for the Texas Department of Transportation’s (TxDOT’s) strategic plan. The research team defined a set of objectives and performance measures that addressed the five goals of TxDOT’s strategic plan as well as sustainable transportation concerns. Researchers used a multi-criteria decision-making methodology to evaluate, benchmark, and aggregate the performance measures into a set of “sustainability index” values. The methodology, applicable at the highway corridor level, was integrated into a user-friendly, spreadsheet-based analysis tool that provided the sustainability index values (for current and future scenarios) as an output for a particular corridor. The analysis tool was used to carry out several case studies. The methodology and tool developed were found to be useful to assess progress towards TxDOT’s strategic plan goals while also addressing sustainability issues. The results and findings could be used to compare relative sustainability of different corridors, or assess the corridors over a period of time. 17. Key Words Performance Measures, Sustainability, TxDOT, Strategic Plan 18. Distribution Statement No restrictions. This document is available to the public through NTIS: National Technical Information Service 5285 Port Royal Road Springfield, Virginia 22161 19. Security Classif.(of this report) Unclassified 20. Security Classif.(of this page) Unclassified 21. No. of Pages 218 22. Price Form DOT F 1700.7 (8-72) Reproduction of completed page authorized
Transcript of Developing Sustainable Transportation Performance Measures

Technical Report Documentation Page 1. Report No. FHWA/TX-09/0-5541-1
2. Government Accession No.
3. Recipient's Catalog No.
4. Title and Subtitle DEVELOPING SUSTAINABLE TRANSPORTATION PERFORMANCE MEASURES FOR TXDOT’S STRATEGIC PLAN: TECHNICAL REPORT
5. Report Date October 2008 Published: April 2009
6. Performing Organization Code
7. Author(s) Tara Ramani, Josias Zietsman, William Eisele, Duane Rosa, Debbie Spillane and Brian Bochner
8. Performing Organization Report No. Report 0-5541-1
9. Performing Organization Name and Address Texas Transportation Institute The Texas A&M University System College Station, Texas 77843-3135
10. Work Unit No. (TRAIS) 11. Contract or Grant No. Project 0-5541
12. Sponsoring Agency Name and Address Texas Department of Transportation Research and Technology Implementation Office P. O. Box 5080 Austin, Texas 78763-5080
13. Type of Report and Period Covered Technical Report: September 2006-August 2008 14. Sponsoring Agency Code
15. Supplementary Notes Research performed in cooperation with the Texas Department of Transportation and the U.S. Department of Transportation, Federal Highway Administration. Project Title: Developing Sustainable Transportation Performance Measures for TxDOT’s Strategic Plan Research Project Title: http://tti.tamu.edu/documents/0-5541-1.pdf 16. Abstract For this research project, sustainable transportation can be viewed as the provision of safe, effective, and efficient access and mobility into the future while considering economic, social, and environmental needs. This project developed a performance measurement-based sustainability evaluation methodology for the Texas Department of Transportation’s (TxDOT’s) strategic plan. The research team defined a set of objectives and performance measures that addressed the five goals of TxDOT’s strategic plan as well as sustainable transportation concerns. Researchers used a multi-criteria decision-making methodology to evaluate, benchmark, and aggregate the performance measures into a set of “sustainability index” values. The methodology, applicable at the highway corridor level, was integrated into a user-friendly, spreadsheet-based analysis tool that provided the sustainability index values (for current and future scenarios) as an output for a particular corridor. The analysis tool was used to carry out several case studies. The methodology and tool developed were found to be useful to assess progress towards TxDOT’s strategic plan goals while also addressing sustainability issues. The results and findings could be used to compare relative sustainability of different corridors, or assess the corridors over a period of time. 17. Key Words Performance Measures, Sustainability, TxDOT, Strategic Plan
18. Distribution Statement No restrictions. This document is available to the public through NTIS: National Technical Information Service 5285 Port Royal Road Springfield, Virginia 22161
19. Security Classif.(of this report) Unclassified
20. Security Classif.(of this page) Unclassified
21. No. of Pages 218
22. Price
Form DOT F 1700.7 (8-72) Reproduction of completed page authorized


DEVELOPING SUSTAINABLE TRANSPORTATION PERFORMANCE MEASURES FOR TXDOT’S STRATEGIC PLAN: TECHNICAL REPORT
by
Tara Ramani Associate Transportation Researcher
Texas Transportation Institute
Josias Zietsman Center Director, Center for Air Quality Studies
Texas Transportation Institute
William Eisele Research Engineer
Texas Transportation Institute
Duane Rosa Professor of Economics
West Texas A&M University
Debbie Spillane Assistant Transportation Researcher
Texas Transportation Institute
and
Brian Bochner Senior Research Engineer
Texas Transportation Institute
Report 0-5541-1 Project Number 0-5541
Research Project Title: Developing Sustainable Transportation Performance Measures for TxDOT’s Strategic Plan
Sponsored by the
Texas Department of Transportation in cooperation with the
U.S. Department of Transportation and the Federal Highway Administration
October 2008 Published: April 2009
TEXAS TRANSPORTATION INSTITUTE
The Texas A&M University System College Station, Texas 77843-3135


v
DISCLAIMER
The contents of this report reflect the views of the authors, who are responsible for the facts and the accuracy of the data presented herein. The contents do not necessarily reflect the official view or policies of the Federal Highway Administration (FHWA) or the Texas Department of Transportation (TxDOT). This report does not constitute a standard, specification, or regulation. The engineer in charge was Josias Zietsman, Ph.D., P.E., (Texas, #90506).
The United States Government and the State of Texas do not endorse products or manufacturers. Trade or manufacturers’ names appear herein solely because they are considered essential to the object of this report.

vi
ACKNOWLEDGMENTS
This project was conducted in cooperation with TxDOT and FHWA. The authors would like to thank the members of the Project Monitoring Committee: Bill Knowles (Program Coordinator), Janie Temple (Project Director), Duncan Stewart and Mary Perez. The authors would also like to thank the following individuals from TxDOT that contributed to this project: Loretta Brown, Bob Appleton, and Eduardo Calvo. The authors also wish to thank the following researchers for their contributions: Bob Brydia, Jae Su Lee, Jeremy Johnson, Rob Benz, Andy Mullins, Danny Morris, David Schrank, Tim Lomax, James Bonneson, Ming-Han Li, Steve Venglar, Dale Picha, and Phillip Reeder.

vii
TABLE OF CONTENTS
Page List of Figures ................................................................................................................................ x List of Tables ................................................................................................................................ xi List of Acronyms ........................................................................................................................ xii Chapter 1: Executive Summary ................................................................................................. 1
This Project ................................................................................................................................. 1 Sustainable Transportation and Performance Measures ............................................................. 1 Development of Performance Measures ..................................................................................... 2 Application of Decision-Making Methodology .......................................................................... 3 Concluding Remarks ................................................................................................................... 4
Chapter 2: Introduction .............................................................................................................. 5 Chapter 3: Background and Research Approach..................................................................... 7
Literature Review........................................................................................................................ 7 Sustainable Transportation ...................................................................................................... 7 Performance Measures for Sustainable Transportation .......................................................... 9 Sustainability Evaluation Using Performance Measures ...................................................... 12
Scoping Exercise on Transportation Sustainability and Performance Measurement ............... 13 TxDOT State-of-the-Practice ................................................................................................ 13 State-of-the-Practice of Other Agencies ............................................................................... 16 Interviews with Key TxDOT Personnel ............................................................................... 18
Concluding Remarks ................................................................................................................. 22 Chapter 4: Developing Sustainability Objectives and Performance Measures for TxDOT’s Strategic Plan .............................................................................................................................. 25
Scope of Project ........................................................................................................................ 25 Conceptualizing Highway Sustainability .................................................................................. 25
Linking Sustainability to TxDOT’s Strategic Plan ............................................................... 26 Development of Performance Indicators .................................................................................. 27
Goal 1: Reduce Congestion .................................................................................................. 28 Goal 2: Enhance Safety ......................................................................................................... 28 Goal 3: Improve Economic Opportunity .............................................................................. 29 Goal 4: Increase the Value of Transportation Assets ............................................................ 30 Goal 5: Improve Air Quality ................................................................................................. 32
Concluding Remarks ................................................................................................................. 34 Chapter 5: Application of the MAUT for Sustainablity Evaluation ..................................... 35
Application of MAUT Methodology ........................................................................................ 35 Translating Performance Indicators to Performance Measures ............................................ 35
Quantification of Measures and Extreme Values ..................................................................... 36 Data Elements and Estimation Procedures ........................................................................... 36 Travel Time Index ................................................................................................................. 38 Buffer Index .......................................................................................................................... 39 Annual Severe Crashes per Mile ........................................................................................... 40 Percentage Lane-Miles under TMC Surveillance ................................................................. 41 Land-Use Balance ................................................................................................................. 41
viii
Truck Throughput Efficiency ............................................................................................... 42 Pavement Condition Score .................................................................................................... 42 Capacity Addition within Available ROW ........................................................................... 43 Cost Recovery from Alternate Sources ................................................................................. 43 Proportion of Total Person-Miles of Travel in Non-SOVs ................................................... 44 Daily NOx, CO, and VOC Emissions in Grams per Mile ..................................................... 45 Daily CO2 Emissions in Grams per Mile .............................................................................. 46 Attainment of Ambient Air Quality Standards ..................................................................... 47
Scaling of Performance Measures ............................................................................................ 48 Weighting and Aggregating Scaled Measures .......................................................................... 49 Concluding Remarks ................................................................................................................. 51
Chapter 6: Development of an Analysis Tool to Implement Sustainablity Evaluation Methodology ................................................................................................................................ 53
Main Features of Analysis Tool ................................................................................................ 53 Instructions and Initial Setup ................................................................................................ 53 Data Input Forms .................................................................................................................. 55 Generation of Output Data: Executive Summaries and Graphs ........................................... 56 User’s Manual ....................................................................................................................... 59
Application of Analysis Tool for Case Studies......................................................................... 59 Chapter 7: Case Study Applications of Analysis Tool ............................................................ 61
Case Study 1: US Highway 281, San Antonio ......................................................................... 61 Description of Study Section ................................................................................................ 61 Basic Analysis Components ................................................................................................. 63 Calculation and Scaling of Individual Measures .................................................................. 65 Combined Results of Sustainability Evaluation ................................................................... 73
Case Study 2: US Highway 290, Houston ................................................................................ 75 Case Study 3: Interstate Highway 27, Amarillo ....................................................................... 78 Additional Application Examples ............................................................................................. 80
Application Example 1: IH-10 (Beaumont District) – Widening of Existing Main Lanes .. 81 Application Example 2: FM-2001 (Austin District) – Construction of a 4-Lane Divided Roadway ............................................................................................................................... 83 Application Example 3: IH-30 (Dallas District) – Construction of an HOV/Managed Lane Facility .................................................................................................................................. 85
Concluding Remarks ................................................................................................................. 86 Chapter 8: Conclusions and Recommendations ..................................................................... 89
General Findings ....................................................................................................................... 89 Applying Sustainable Transportation to Highways .............................................................. 89 Linking Sustainability Assessments to Planning Goals ........................................................ 89 Performance Measure-Based Sustainability Evaluations ..................................................... 90 Analysis Tool and Case Studies ............................................................................................ 90 Possible Applications of Methodology and Analysis Tool................................................... 90
Integration into TxDOT Practice .............................................................................................. 90 Workshop Technology Transfer ........................................................................................... 91 Workshop Lesson Plan ......................................................................................................... 91
Concluding Remarks ................................................................................................................. 92 References .................................................................................................................................... 93

ix
Appendix A: Categorized Listing of Transportation Performance Measures/Indicators ....97 Appendix B: Performance Measurement Table – Other States ............................................109 Appendix C: Performance Measurement Table – Texas MPOs ...........................................129 Appendix D: Details of Crash Estimation Procedure .............................................................141 Appendix E: Details of Truck Throughput Efficiency Measure ...........................................155 Appendix F: Emissions Rates ...................................................................................................159 Appendix G: Data Collection and Entry Form for Analysis Tool.........................................165 Appendix H: Case Study Input Details ....................................................................................177 Appendix I: Workshop Lesson Plan ........................................................................................189

x
LIST OF FIGURES Page Figure 1. Conceptualization: Linking Sustainability to Planning Goals...................................... 26 Figure 2. Setup of Links and Sections for Multi-Criteria Analysis. ............................................ 35 Figure 3. MAUT Process for Sustainability Evaluation. ............................................................. 36 Figure 4. Estimation Process for Travel Time Index. .................................................................. 38 Figure 5. Crash Estimation Process for Each Link. ..................................................................... 40 Figure 6. Estimation of Daily Combined VOC, NOx, and CO Emissions................................... 46 Figure 7. Application of Weights to Aggregate-Scaled Performance Measures. ........................ 50 Figure 8. Instructions Provided in the Analysis Tool. ................................................................. 54 Figure 9. Main Menu with Hyperlinks. ....................................................................................... 54 Figure 10. Input Required to Create Data Entry Forms. .............................................................. 55 Figure 11. Example of Data Entry Sheets (Filled in). .................................................................. 56 Figure 12. Executive Summary Worksheet for Goal-Wise Performance. ................................... 57 Figure 13. Executive Summary Worksheet for Individual Links. ............................................... 57 Figure 14. Executive Summary Worksheet for Scaled Measures. ............................................... 58 Figure 15. Graph for Index Values by Link. ................................................................................ 58 Figure 16. Graph for Index Values by Goal. ............................................................................... 59 Figure 17. Location of Study Corridor for US-281 Case Study. ................................................. 62 Figure 18. Study Section near Downtown San Antonio. ............................................................. 63 Figure 19. Study Section near Bexar/Comal County Line. ......................................................... 63 Figure 20. Graphical Representation of Goal-Wise Performance for US-281 Case Study. ........ 74 Figure 21. Graphical Representation of Link-Wise Results for US-281 Case Study. ................. 75 Figure 22. Location of Study Corridor for US-290 Case Study. ................................................. 76 Figure 23. US-290 Study Corridor............................................................................................... 76 Figure 24. Link-Wise Outputs for US-290 Case Study. .............................................................. 77 Figure 25. Goal-Wise Outputs for US-290 Case Study. .............................................................. 77 Figure 26. IH-27, Amarillo, Randall County. .............................................................................. 78 Figure 27. IH-27 Study Corridor. ................................................................................................ 78 Figure 28. Link-Wise Outputs for IH-27 Case Study. ................................................................. 79 Figure 29. Goal-Wise Outputs for IH-27 Case Study. ................................................................. 80 Figure 30. Location of Additional Study Corridors. .................................................................... 81 Figure 31. IH-10 Project, Beaumont District. .............................................................................. 82 Figure 32. Analysis Tool Output for IH-10 Project. .................................................................... 83 Figure 33. FM-2001 Project, Austin District. .............................................................................. 84 Figure 34. Analysis Tool Output for FM-2001 Project. .............................................................. 85 Figure 35. IH-30 Project, Dallas District. .................................................................................... 85 Figure 36. Analysis Tool Output for IH-30. ................................................................................ 86
xi
LIST OF TABLES Page Table 1. Sustainability Objectives and Performance Measures for TxDOT’s Goals. ................... 3 Table 2. Characteristics of a Good Performance Measure. ......................................................... 11 Table 3. Example of Sustainability Objectives and Related Performance Measures. ................. 12 Table 4. States with State-of-the-Practice Applications of Performance Measures. ................... 17 Table 5. Details of Interviews Conducted for Scoping Exercise. ................................................ 19 Table 6. Sustainability-Related Objectives to Address TxDOT’s Strategic Plan. ....................... 27 Table 7. Performance Indicators for Goal 1: Reduce Congestion. .............................................. 28 Table 8. Performance Indicators for Goal 2: Enhance Safety. .................................................... 29 Table 9. Performance Indicators for Goal 3: Improve Economic Opportunity. .......................... 30 Table 10. Performance Indicators for Goal 4: Increase Value of Transportation Assets. ........... 31 Table 11. Performance Indicators for Goal 5: Improve Air Quality. ........................................... 33 Table 12. Data Elements for Quantification of Performance Measures. ..................................... 37 Table 13. Extreme Values for Annual Crashes per Mile. ............................................................ 41 Table 14. Scoring for Capacity Addition Measure. ..................................................................... 43 Table 15. Damage Costs for VOC, NOx, and CO. ....................................................................... 46 Table 16. Performance Measure Values for Ozone Nonattainment. ........................................... 47 Table 17. Details of Extreme Values and Utility Scaling for All Measures. ............................... 49 Table 18. Default Goal-Weights Used in Analysis Tool. ............................................................ 51 Table 19. Default Measure-Weights Used in Analysis Tool. ...................................................... 51 Table 20. Link Details and Lengths for US-281 Case Study. ...................................................... 64 Table 21. Traffic Volumes for Base Case and Future Case Scenarios: US-281. ......................... 64 Table 22. Travel Time Index for Base Case Scenario: US-281. .................................................. 65 Table 23. Travel Time Index for Future Case Scenario: US-281. ............................................... 65 Table 24. Measured Values and Scaled Values for Buffer Index: US-281. ................................ 66 Table 25. Measured Values and Scaled Values for Annual Severe Crashes: US-281. ............... 66 Table 26. Percentage Lane-Miles under TMC Surveillance: US-281. ........................................ 67 Table 27. Land-Use Balance for Base Case Scenario: US-281. .................................................. 67 Table 28. Land-Use Balance for Future Case Scenario: US-281. ............................................... 67 Table 29. Truck Throughput Efficiency for Base Case Scenario: US-281. ................................. 68 Table 30. Truck Throughput Efficiency for Future Case Scenario: US-281. .............................. 68 Table 31. Pavement Condition Score: US-281. ........................................................................... 69 Table 32. Capacity Addition within Available ROW: US-281. .................................................. 69 Table 33. Cost Recovery from Alternate Sources: US-281. ........................................................ 70 Table 34. Proportion of Non-SOV Travel - Base Case Scenario: US-281. ................................. 70 Table 35. Proportion of Non-SOV Travel - Future Case Scenario: US-281. .............................. 71 Table 36. VOC, NOx, and CO Emissions for the Base Case Scenario: US-281. ........................ 71 Table 37. VOC, NOx, and CO Emissions for the Future Case Scenario: US-281. ..................... 71 Table 38. Daily CO2 Emissions: US-281. .................................................................................... 72 Table 39. Attainment of Ambient Air Quality Standards: US-281. ............................................ 73 Table 40. Goal-Wise Sustainability Indicators for Entire Study Section: US-281. ..................... 73 Table 41. Link-Wise Sustainability Indicator Values for US-281 Case Study. ........................... 74
xii
LIST OF ACRONYMS
ADT – Average Daily Traffic AHP – Analytical Hierarchy Process CMS – Congestion Management System CO – Carbon Monoxide CO2 – Carbon Dioxide DOT – Department of Transportation EPA – Environmental Protection Agency FHWA – Federal Highway Administration GIS – Geographic Information Systems GPL – General-Purpose Lane GPRA– Government Performance and Reporting Act HB – House Bill HOV – High-Occupancy Vehicle HPMS – Highway Performance Monitoring System ITS – Intelligent Transportation Systems ITDTS–Intelligent Transportation System Deployment Tracking Survey LOS– Level of Service MAUT – Multi-Attribute Utility Theory MCDM – Multi-Criteria Decision-Making MIS– Major Investment Study MPO – Metropolitan Planning Organization MVMT – Million Vehicle Miles of Travel MTP – Metropolitan Transportation Plan NAAQS – National Ambient Air Quality Standards NEPA– National Environmental Policy Act NOx – Oxides of Nitrogen OECD– Organization for Economic Cooperation and Development O&M– Operation and Maintenance PMIS – Pavement Management Information System PMT – Person-Miles of Travel RHiNo – Road-Highway Inventory Network ROW – Right-of-Way RTP – Regional Transportation Plan SET – Sustainability Enhancement Tool SOV – Single Occupant Vehicle TMA – Transportation Management Area TMMP– Texas Metropolitan Mobility Plan TCI – Texas Congestion Index TMC – Traffic Monitoring Center TPP– Transportation Planning and Programming TTE– Truck Throughput Efficiency TTI – Texas Transportation Institute TUMP – Texas Urban Mobility Plan TxDOT – Texas Department of Transportation

xiii
VMT – Vehicle Miles of Travel VHT– Vehicle Hours of Travel VRH – Vehicle Revenue Hour VRM – Vehicle Revenue Mile VOC – Volatile Organic Compounds WCS – World Conservation Strategy


1
CHAPTER 1:
EXECUTIVE SUMMARY Sustainable transportation is of great importance in today’s world, due to concerns
regarding the environmental, economic, and social equity impacts of transportation systems. Sustainable development can be defined as development that meets the needs of the present, without compromising on the future ability to meet the same needs. Sustainable transportation can be considered as an expression of sustainable development in the transportation sector. There is, therefore, a need to integrate sustainable transportation concerns into the activities of transportation agencies. In particular, it is of importance to develop methodologies that address and evaluate sustainable transportation within the regular transportation planning paradigm.
THIS PROJECT
The aim of this project is to develop a performance-measurement-based approach to evaluate sustainable transportation for the Texas Department of Transportation (TxDOT). TxDOT’s strategic plan contains five goals (reduce congestion, improve safety, increase economic opportunity, enhance the value of transportation assets, and improve air quality), each of which needs to be addressed to enhance the sustainability of the transportation system. This project uses a multi-criteria decision-making (MCDM) approach as the basis for the sustainability evaluation. This approach requires the development of appropriate performance measures, which are evaluated and aggregated into a composite indicator of sustainability. The scope of this project was limited to addressing sustainability at the transportation corridor level. The main steps involved with this project were to:
• Develop an understanding of sustainable transportation. • Create a framework for using sustainable transportation performance measures based
on the types of applications that need to be supported. Develop a methodology that can be implemented in the form of a sustainability enhancement tool.
• Develop sustainable transportation performance measures to address TxDOT’s strategic plan goals. Identify data elements and data sources required to quantify the measures, and develop equations to quantify them.
• Develop a user-friendly analysis tool in the form of a spreadsheet-based calculator that can quantify the selected performance measures and apply the sustainability enhancement methodology.
• Perform pilot applications of the analysis tool for case studies representing rural and urban corridors in Texas. In each case study, data were compiled for a scenario representing current conditions and scenarios representing future projections.
• Examine how the results and findings from this project may be applied to TxDOT’s practices.
SUSTAINABLE TRANSPORTATION AND PERFORMANCE MEASURES
To formulate the research approach for this project, an extensive literature review and survey of practice were conducted relating to the use of performance measures, sustainable

2
transportation performance measures, and their applicability to TxDOT’s planning process. Interviews were also conducted with key TxDOT personnel to identify the agency’s specific needs with respect to sustainable transportation performance measures.
Sustainable transportation for the purpose of this study was defined as: the provision of safe, effective, and efficient access and mobility into the future while considering the economic, social, and environmental needs of society. Preliminary performance measures applicable to TxDOT’s strategic plan, and relating to this definition of sustainability, were identified in a day-long workshop with key TxDOT staff and members of the research team. The research team then refined these measures and applied them using an MCDM process.
DEVELOPMENT OF PERFORMANCE MEASURES
A total of 13 performance measures covering the five goals under TxDOT’s strategic plan were developed. The five specific goals identified and discussed in the strategic plan are:
• reduce congestion, • enhance safety, • expand economic opportunity, • improve air quality, and • increase the value of transportation assets.
The main challenge of this project was to develop a set of performance indicators that
reflected sustainability concerns within the scope of these goals. Workshop participants discussed how the dimensions of sustainability—economic development, environmental stewardship, and social equity—could be applicable to progress toward the goals. A set of sustainability-related objectives were defined under each of the strategic goals, and each objective was linked to a measurable indicator that could be used in the sustainability evaluation. Another constraint was limiting the performance measures to those relevant to highway corridors. Table 1 shows the goals, objectives, and performance measures developed for this project.

3
Table 1. Sustainability Objectives and Performance Measures for TxDOT’s Goals.
TxDOT Goal Sustainability-Related Objective Performance Measure
Reduce congestion Improve mobility on highways Travel time index Improve reliability of highway travel Buffer index
Enhance safety
Reduce crash rates and crash risk Annual severe crashes per mile
Improve traffic incident detection and response
Percentage lane-miles under traffic monitoring/surveillance
Expand economic opportunity
Optimize land-use mix for development potential Land-use balance
Improve road-based freight movement Truck throughput efficiency
Increase the value of transportation assets
Maintain existing highway system quality
Average pavement condition score
Reduce cost and impact of highway capacity expansion
Capacity addition within available right of way
Leverage non-traditional funding sources for highways
Cost recovery from alternative sources
Increase use of alternatives to single-occupant automobile travel
Proportion of non-single-occupant travel
Improve air quality
Reduce adverse human health impacts Daily NOx, CO, and VOC emissions per mile of roadway
Reduce greenhouse gas emissions Daily CO2 emissions per mile of roadway
Conform to emissions exposure standards
Attainment of ambient air quality standards
APPLICATION OF DECISION-MAKING METHODOLOGY
To provide a quantitative basis for evaluating sustainability using the performance measures, the project made use of an MCDM process commonly referred to as the multi-attribute utility theory (MAUT). The basic steps required in this methodology were the quantification, scaling, and weighting of individual performance measures to obtain an aggregate sustainability indicator value. This project defined the quantification procedures for individual measures, along with their data requirements, to ensure standardization of the performance measures, and comparability among different study corridors. The scaling of performance measures provided a means of assessing the specific measure’s value against benchmark (best/worst case) values. Weights that expressed the relative importance of the various performance measures were used to aggregate the scaled measures into a composite indicator of sustainability. Default sets of weights for use in urban and rural areas were developed based on discussions among TxDOT stakeholders.
The sustainability evaluation methodology when applied to highway corridors provided analysis outputs on a link-wise basis (for individual links on a study corridor) as well as for the aggregate of all links. The results were presented as a composite sustainability indicator for all
4
TxDOT’s strategic plan goals combined as well as for performance with respect to individual goals. The entire methodology developed (including the measure quantification, scaling, and aggregation) was integrated into a user-friendly spreadsheet tool that could provide a comprehensive analysis and graphical results for a case study corridor, based on certain user inputs. This tool was then used to conduct numerous case study applications as a part of this research project. The case studies included corridors on US-281 in San Antonio, US-290 in Houston, and IH-27 in Amarillo. Additional application examples for project-level analyses were conducted for locations on IH-10 in Beaumont, IH-30 in Dallas, and FM-2001 in Austin. The case studies showcase the strengths and flexibility of this methodology and identify areas for further research.
CONCLUDING REMARKS
This project studied concepts of sustainable transportation, performance measures for sustainable transportation, and how sustainability concerns can be addressed by TxDOT’s strategic plan goals. Sustainability performance measures were developed for TxDOT’s strategic plan and implemented as an MAUT-based sustainability evaluation methodology. An analysis tool was developed as part of this research, and several case study analyses were conducted. The methodology addresses sustainability in a manner that allows for its integration into the transportation planning process. The use of performance measures allows for scientific comparisons of different locations as well as the comparison of alternative planning scenarios for a given location. The performance measures and evaluation methodology have the potential for integration into TxDOT’s planning activities and can aid in sustainability enhancement efforts.

5
CHAPTER 2: INTRODUCTION
Transportation plays a major role in today’s world and is an essential extension of almost
any human activity. Concerns are being raised about the role of transportation in greenhouse gas emissions, fuel resource depletion, toxic pollution, as well as issues relating to transportation costs and the equity impacts of transportation policy. Thus, transportation sustainability must be addressed as a logical step toward overall sustainable development.
The broad goals of sustainable transportation are the provision of safe, effective, and efficient access and mobility into the future while considering economic, social, and environmental needs. While past research has addressed how to quantify or evaluate transportation sustainability, the issue of implementing sustainability assessments within the regular functions of a transportation agency has not been addressed in much detail. This issue can be of great significance especially when the goals of sustainability need to be reconciled with an agency’s strategic planning goals.
Many agencies in the U.S., such as state departments of transportation (DOTs), may not be in a position to exclusively dedicate resources to address transportation sustainability. Sustainability evaluation and enhancement can still be carried out in a scientific, reasonable, and logical manner within the general planning paradigm as a beginning to improving progress toward sustainable development over time.
This project develops a performance-measurement-based system for the Texas Department of Transportation to evaluate and achieve sustainable transportation, while addressing the agency’s strategic planning goals. The overall aim of this project is to develop sustainable transportation performance measures for TxDOT and to develop a methodology to implement a more sustainable transportation system. The following were the main objectives of this project:
• Develop an understanding of sustainable transportation. • Create a framework for using sustainable transportation performance measures based
on the types of applications that need to be supported. Develop a methodology that can be implemented in the form of a sustainability enhancement tool.
• Develop sustainable transportation performance measures to address TxDOT’s strategic plan goals. Identify data elements and data sources required to quantify the measures, and develop equations to quantify them.
• Develop a user-friendly analysis tool in the form of a spreadsheet-based calculator that can quantify the selected performance measures and apply the sustainability enhancement methodology.
• Perform pilot applications of the analysis tool for case studies representing rural and urban corridors in Texas. In each case study, data were compiled for a scenario representing current conditions and scenarios representing future projections.
• Examine how the results and findings from this project may be applied to TxDOT’s practices.
• Prepare the final deliverables including the spreadsheet-based analysis tool, user’s guide for the analysis tool, final research report, and project summary report.
The scope of the project was such that it focused on sustainable transportation with
respect to the highway mode and at the highway corridor level. After investigating a broad range
6
of performance measures, the finalized measures and framework were developed for highway corridors.
The initial stages of the project involved an extensive scoping exercise including a literature review that covered the basic concepts relating to sustainable transportation, performance measures, and transportation decision-making. A survey of practice with regard to sustainable transportation and performance measurement among state agencies, Metropolitan Planning Organizations (MPOs) and other entities, and interviews with key TxDOT personnel were also conducted to help formulate an approach to this project. Topics covered in the scoping exercise and literature review included incorporating sustainability goals into the performance-based planning process, performance measures that reflect sustainable transportation, and the state-of-the-practice in terms of transportation sustainability research. The literature review also discussed general concepts relating to multi-criteria decision-making processes that could be applied in this project.
Based on the results of the scoping exercise, a framework for this research (specifically applicable to highways) was developed consisting of performance measures defined to reflect sustainability with objectives linking the measures to higher-level strategic planning goals. An MCDM technique was then applied to the sustainability framework to create a methodology for sustainability evaluation. This methodology is developed in a manner that is cognizant of TxDOT’s strategic plan goals and is designed to address sustainability concerns as well. It makes use of local data for the scaling and evaluation of the performance measures and provides a platform on which both current and future development scenarios can be evaluated, which is a key aspect of the conceptualization of sustainability. The methodology was then used to develop the analysis tool and conduct sustainability evaluation case studies.
The significance of this project is that it demonstrates how concepts of sustainability can be incorporated into practical transportation planning, even if the scope becomes slightly narrowed in the process (for example, by addressing sustainability of highways alone as opposed to general transportation system sustainability). By targeting a level at which planning is commonly conducted by transportation agencies in the U.S. (highway planning for a single facility) and aligning the process with TxDOT’s goals, it creates more of a buy-in within the agency than if progress towards sustainability was to be achieved through a separate mandate. This project helps provide an immediate assessment of sustainability and can play a role in the development of goals for sustainable transportation planning for TxDOT in the future.
7
CHAPTER 3: BACKGROUND AND RESEARCH APPROACH
There were two major tasks performed to develop the research approach and address how sustainable performance measures could be developed for TxDOT’s strategic plan. First, a literature review was conducted covering the basic concepts related to this project. The second task involved a scoping exercise that assessed the state of the practice with respect to performance measures and sustainability evaluation in various transportation agencies around the nation. The research team also conducted interviews with key TxDOT personnel to assess TxDOT’s needs and concerns as a part of the scoping exercise.
LITERATURE REVIEW
This literature review discusses basic concepts of sustainable transportation, transportation performance measures, and the role of performance measurement in decision-making applications. This chapter presents each of these aspects in detail.
Sustainable Transportation
The World Conservation Strategy (WCS) first used the term “sustainable development” in 1980 (1). Since then the concept has found global prominence and was designated as a global mission in two key United Nations Conferences held in 1992 and 2002, respectively. Numerous authors have provided definitions for sustainable development and sustainable transportation. These definitions are mostly based on the one developed by the Bruntdland Commission, namely that “sustainable development is development that meets the needs of the present without compromising the ability of future generations to meet their own needs” (2).
As a basic concept, sustainability pertains to the recognition, evaluation, and attempted mitigation of long-term impacts of human or developmental activity. Sustainability is predominately discussed in terms of the “three pillars of sustainability,” namely environmental preservation, economic efficiency, and social equity. Sustainable transportation can be seen as an expression of sustainable development in the transportation sector, and transportation system effectiveness is an additional criterion that needs to be considered (3). Thus, sustainability of transportation systems is largely defined through the impacts of the system on the economy, environment, and general social well-being. Another conceptualization of transportation sustainability measures it according to system effectiveness and efficiency, and the impacts of the system on the natural environment (4).
Sustainable transportation has been the subject of scientific research and discussion over the past decade and earlier (5). A recent study of state DOTs in the U.S. indicates that while “sustainability” is not explicitly mentioned in the mission and vision statements of most agencies, a majority of them touch upon sustainability concerns by addressing issues such as the environment, future needs, and social equity (6). Thus, it is clear that state-level transportation agencies are giving importance to sustainability issues. This research effort is focused on refining methodologies of sustainability evaluation that are relevant at the state level and can aid in the implementation of a sustainable transportation system. Additionally, the concept of “smart growth” or “responsible growth” is of relevance when discussing sustainable transportation (7).

8
Though smart growth is not entirely synonymous with sustainability, it does address certain related concepts and is being discussed by many transportation agencies.
Constraints to Sustainability
There are certain constraints to human development such as environmental issues and the need for conservation of natural resources. These constraints act as the driving force for addressing sustainability (8), and are broadly termed as resource constraints, ecological constraints, and environmental constraints, as described below:
• Resource constraints: Non-renewable resources should not be used without enabling the production of substitutes, and renewable resources should not be used at a faster rate than they can be reproduced.
• Ecological constraints: The ecological boundaries are exceeded if more waste is dumped into the ecological system than the system can safely absorb or if the system is damaged by taking excessive amounts of good arable land to provide transportation and other infrastructure.
• Environmental constraints: Excessive pollution damages the environment and can result in ill health for humans and animals and damage to plant species. Pollution can also result in climate changes, which can cause floods, droughts, and increased diseases.
Principles and Dimensions of Sustainability
The principles of sustainable development that are implied in its definition include intergenerational equity and multi-dimensionality (8). Intergenerational equity refers to ensuring that current and future generations enjoy an acceptable quality of life. There should also be an equitable distribution of resources between communities and generations. Sustainability assessments should always be dynamic (adapt to changes over time) and represent a continuum of varying degrees of sustainability, rather than a discrete assessment of what is sustainable or unsustainable.
The three dimensions of sustainable development, social equity, economic development, and environmental stewardship, are interrelated and must be simultaneously addressed. These dimensions can be described as follows:
• Social equity:
• People must be able to interact with one another and with nature. • A safe and secure environment must be provided. • There must be equity between societies, groups, and generations. • There must be adequate access to employment and other opportunities. • It includes issues such as equity, safety, security, human health, education,
and quality of life. • Economic development:
• Resources need to be adequately maintained. • Financial and economic needs of current and future generations must be
met. • There must be adequate mobility to move people, goods, and services.

9
• It includes issues such as business activity, employment, productivity, tax issues, and trade.
• Environmental stewardship: • Use renewable resources at below their rates of regeneration and non-
renewable resources at below the rates of development of renewable substitutes.
• Provide a clean environment for current and future generations. • It includes issues such as pollution prevention, climate protection, habitat
preservation, and aesthetics.
Evaluating Sustainable Transportation
The previous sections of the literature review detailed the importance of sustainability and the need for addressing sustainable transportation. In order to implement evaluations of transportation sustainability, there is a need to define the scope and aims of the problem. The assessment of sustainable transportation is generally discussed in three steps: conceptualization, operationalization, and utilization (9). Conceptualization deals with defining what sustainability refers to in a particular context. Operationalization involves the selection of parameters to measure sustainability, while utilization deals with actually using the findings to guide further development and policy. There are two main approaches that can be used when addressing sustainable transportation. In the first approach, transportation policy is directed to address overarching sustainable development concerns. In the second, sustainable transportation is defined in a more limited sense, as having certain environmental and social constraints which are to be addressed. The scientific community considers the second approach to be more valuable in terms of practical applications of sustainability measurement.
Performance Measures for Sustainable Transportation
Performance measurement originated as a management tool used by private-sector organizations to evaluate progress toward goals using measurable results or targets (10). Performance measures translate data and statistics into succinct information that can be readily understood. Performance measures can be used across all aspects of an agency to track system performance or trends, evaluate alternatives, for project selection, and for internal and external communication. The terms “performance indicator” and “performance measure” both refer to variables that help assess this progress. Some researchers have made the distinction between the two terms (11) stating that an indicator refers to a variable used in monitoring performance, which becomes a performance measure when compared against standard or benchmark values. However, the terms are used interchangeably in this report.
With the implementation of the Government Performance and Results Act (GPRA) in 1993, all government agencies in the U.S. including transportation agencies were mandated to use performance measurement, which is when transportation-related performance measures became more commonly used. There exist numerous research and compilations regarding the use of performance measures and their role in the transportation sector in the U.S. over the years (12,13,14,15).

10
New Paradigm for Sustainability Measures
A 1997 study of 36 state DOTs conducted to review state-of-the-practice in performance measurement found that the most commonly used measures were in areas of highway maintenance, safety, highway construction, public transit, and aviation (12). Fewer numbers of DOTs used performance measures for rail and water transport, and for general administration and organizational effectiveness. However, it was suggested that performance measurement should undergo a paradigm shift to encompass measures of mobility, livability, accessibility, and sustainability. Other research has also discussed how placing an emphasis on measuring transportation-related aspects such as accessibility and mobility, as well as considering overall effectiveness and outcomes, is necessary for a more sustainable transportation system (8).
In keeping with this, there has been a significant amount of published research during the past decade relating to transportation sustainability and the paradigm shift needed to address the needs of sustainable transportation. Many authors and organizations have compiled lists of sustainable transportation performance measures. Examples of comprehensive compilations of sustainable transportation indicators used worldwide can be found in research conducted by Amekudzi and Jeon (4), Litman (2), Gudmundsson (11), Hall (16), and Zietsman (17) .
Defining Sustainability Measures for Planning Goals
In order to identify appropriate performance measures for this project, it is necessary to develop a framework within which such measures can be identified. Despite the existence of significant research into performance measurement for sustainable transportation, there is an additional issue of implementing these performance measures for specific transportation agencies. Any performance-measurement-based system, be it for organizational management, operational evaluation, or sustainability evaluation, still requires some integration with strategic or policy goals according to a predefined framework (18). A number of authors have developed frameworks or typologies for the selection and use of performance measures including frameworks termed as pressure-state-response frameworks, impact-based frameworks, influence-oriented frameworks, and frameworks based on goals, strategies, and actions (4). Research has shown that there are significant benefits to aligning performance measurement with agency policy using a framework of goals, related objectives, and performance measures (19,20). Therefore, this project proposes implementing a performance-measure-based sustainability evaluation for TxDOT within the scope of TxDOT’s strategic plan goals through the use of a framework of goals, objectives, and measures.
Selection of Good Performance Measures
The selection of appropriate performance measures is a very important task and should be based on the type of analysis (planning, operational, or strategic), level of analysis (project, network, or regional), and the specific purpose for which the measure should be used (system performance, project selection, or impact assessment). For any system of performance measures, the four-R test (measures should be relevant, robust, repeatable, and responsive) can be used to define good measures (21). Table 2 lists ten attributes of a good performance measure as categorized by the Organization for Economic Co-operation and Development (OECD) (22).

11
Table 2. Characteristics of a Good Performance Measure.
Attribute Explanation
1. Acceptable The general community must assist in identifying and developing the performance measures.
2. Accurate Must be based on accurate information, of known quality and origin.
3. Affordable Must be based on readily available data or data that can be obtained at a reasonable cost.
4. Appropriate level of detail
Must be specified and used at the appropriate level of detail and level of aggregation for the questions it is supposed to answer.
5. Have a target Must have a target level or benchmark against which to compare it.
6. Measurable The data must be available, and the tools need to exist to perform the required calculations.
7. Relevant Must be applicable and compatible with overall goals and objectives or considerations and issues.
8. Sensitive Must detect a certain level of change that occurs in the transportation system.
9. Show trends Must be able to show trends over time and provide early warnings about problems and irreversible trends.
10. Understandable Must be understandable and easy to interpret, even by the community at large.
There are numerous examples of transportation-related performance measures, and a number of these can be used within the context of sustainable transportation. Appendix A contains a comprehensive listing of transportation performance measures compiled from various sources. Table 3 shows examples of some common objectives and related performance measures that are relevant from a sustainability perspective (8).
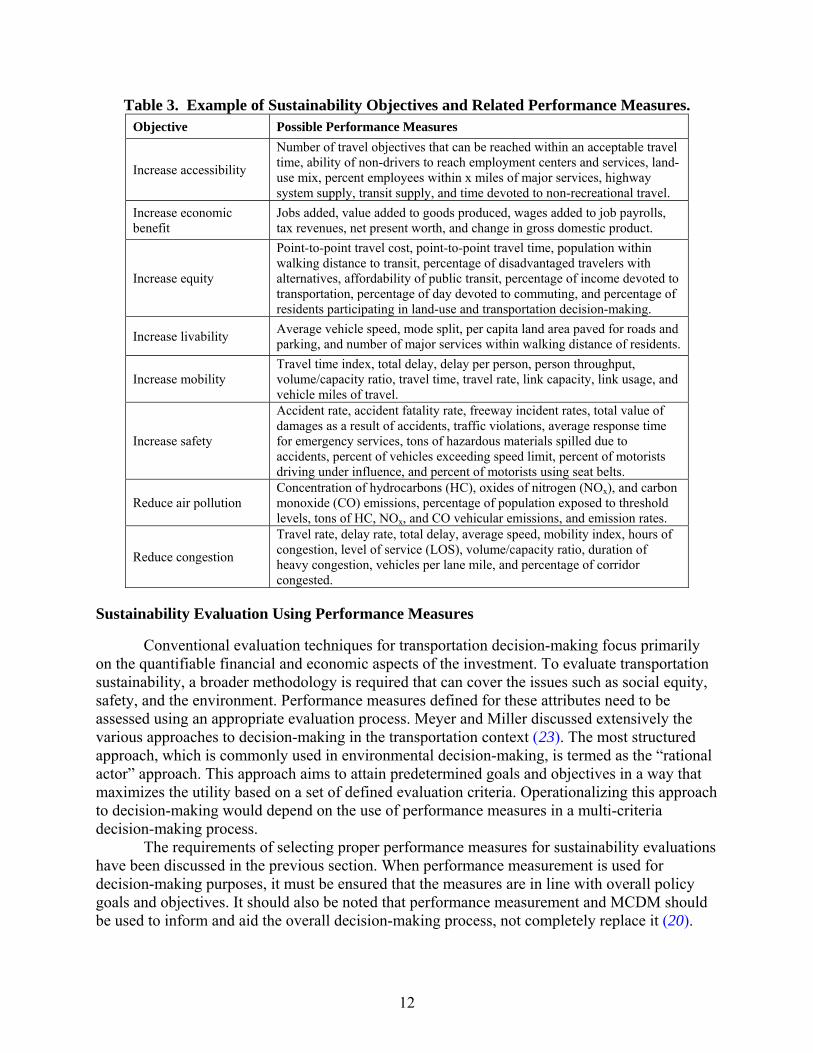
12
Table 3. Example of Sustainability Objectives and Related Performance Measures. Objective Possible Performance Measures
Increase accessibility
Number of travel objectives that can be reached within an acceptable travel time, ability of non-drivers to reach employment centers and services, land-use mix, percent employees within x miles of major services, highway system supply, transit supply, and time devoted to non-recreational travel.
Increase economic benefit
Jobs added, value added to goods produced, wages added to job payrolls, tax revenues, net present worth, and change in gross domestic product.
Increase equity
Point-to-point travel cost, point-to-point travel time, population within walking distance to transit, percentage of disadvantaged travelers with alternatives, affordability of public transit, percentage of income devoted to transportation, percentage of day devoted to commuting, and percentage of residents participating in land-use and transportation decision-making.
Increase livability Average vehicle speed, mode split, per capita land area paved for roads and parking, and number of major services within walking distance of residents.
Increase mobility Travel time index, total delay, delay per person, person throughput, volume/capacity ratio, travel time, travel rate, link capacity, link usage, and vehicle miles of travel.
Increase safety
Accident rate, accident fatality rate, freeway incident rates, total value of damages as a result of accidents, traffic violations, average response time for emergency services, tons of hazardous materials spilled due to accidents, percent of vehicles exceeding speed limit, percent of motorists driving under influence, and percent of motorists using seat belts.
Reduce air pollution Concentration of hydrocarbons (HC), oxides of nitrogen (NOx), and carbon monoxide (CO) emissions, percentage of population exposed to threshold levels, tons of HC, NOx, and CO vehicular emissions, and emission rates.
Reduce congestion
Travel rate, delay rate, total delay, average speed, mobility index, hours of congestion, level of service (LOS), volume/capacity ratio, duration of heavy congestion, vehicles per lane mile, and percentage of corridor congested.
Sustainability Evaluation Using Performance Measures
Conventional evaluation techniques for transportation decision-making focus primarily on the quantifiable financial and economic aspects of the investment. To evaluate transportation sustainability, a broader methodology is required that can cover the issues such as social equity, safety, and the environment. Performance measures defined for these attributes need to be assessed using an appropriate evaluation process. Meyer and Miller discussed extensively the various approaches to decision-making in the transportation context (23). The most structured approach, which is commonly used in environmental decision-making, is termed as the “rational actor” approach. This approach aims to attain predetermined goals and objectives in a way that maximizes the utility based on a set of defined evaluation criteria. Operationalizing this approach to decision-making would depend on the use of performance measures in a multi-criteria decision-making process.
The requirements of selecting proper performance measures for sustainability evaluations have been discussed in the previous section. When performance measurement is used for decision-making purposes, it must be ensured that the measures are in line with overall policy goals and objectives. It should also be noted that performance measurement and MCDM should be used to inform and aid the overall decision-making process, not completely replace it (20).

13
Application of Multi-Criteria Decision-Making
MCDM deals with creating a means for translating qualitative attributes into a framework that can enable choosing between various alternatives in a scientific manner. The advantage of MCDM is its ability to account for a wide range of differing, yet relevant criteria or objectives. Even if these criteria cannot be expressed in monetary terms, as is the case with externalities, comparisons can still be based on relative priorities (24). The most commonly used multi-criteria decision-making methods include (25):
• analytical hierarchy process (AHP), • multi-attribute utility theory, and • outranking method.
Of these approaches, the MAUT methodology replicates the “rational actor” approach
outlined previously. It has proved to be applicable as an evaluation process in the context of sustainability for a recent highway corridor study (17) and to evaluate alternative transportation and land-use scenarios for the Metro Atlanta Region (6). Other sustainability evaluation efforts (26,27) that are conducted at the global level also make use of utility function values to evaluate sustainability index scores, which are also loosely based on the MAUT process. The basic methodology common to all the studies cited (and any other utility-based decision process) can be summarized by the following steps:
• selection of criteria and related attributes (performance measures) that reflect sustainability concerns;
• quantifying levels of the selected attributes and scaling them to reflect relative preferences based on a “utility function” or “value function”; and
• measuring overall utility of different alternative scenarios based on scaled utility values and relative importance (weights) of the different criteria/attributes.
This project proposes an MAUT-based methodology that would evaluate individual
performance measures and combine them into a final “sustainability index” value. The results from this analysis could be used in the sustainability evaluation process for a highway corridor and to compare results from different alternate scenarios.
SCOPING EXERCISE ON TRANSPORTATION SUSTAINABILITY AND PERFORMANCE MEASUREMENT
An extensive scoping exercise was conducted to assess the state of the practice with respect to performance measurement and sustainability concerns in TxDOT and other transportation agencies across the nation. The research team also conducted interviews with key TxDOT personnel to assess TxDOT’s needs and concerns, in order to integrate these concerns into the research approach and framework developed for this project.
TxDOT State-of-the-Practice
TxDOT does not explicitly address the concepts of sustainable transportation, and this was confirmed through the interview process conducted. However, sustainable transportation does enter into consideration as a peripheral concern in some feasibility, corridor, development,

14
or environmental projects. The most frequent consideration is future economic feasibility in the form of cost/benefits or other factors, as well as environmental considerations through the National Environmental Policy Act (NEPA) requirements.
TxDOT has addressed related topics such as smart growth and context sensitive design in the past (28). The most explicit reference to the concepts of sustainable transportation is included in TxDOT’s strategic plan. TxDOT’s strategic plan for 2007-2011 contains the following mission statement: “we will work to provide, safe, efficient and effective means for the movement of people and goods throughout the state, facilitating trade and economic opportunity” (29). TxDOT’s vision is to “…deliver a 21st century, multi-modal transportation system that will enhance the quality of life for Texas citizens and increase the competitive position for Texas industry by implementing innovative and effective transportation programs.” The specific goals identified in the strategic plan are to:
• reduce congestion, • enhance safety, • expand economic opportunity, • improve air quality, and • increase the value of transportation assets.
These goals are to be achieved by following a set of broad strategies, and short, mid, and
long-term tactics outlined in the strategic plan (29).
Use of Performance Measures
Although TxDOT does not use performance measures for sustainable transportation, the agency does utilize the concept of performance measurement in many other areas across the agency. Previous versions of TxDOT’s strategic plan for 2005-2009 and 2003-2007 contained performance measures by which progress toward accomplishment could be assessed (30,31). The 2003-2007 plan contained agency objectives, each with a single measure and performance target. That plan also addressed five facets of agency activity and a total of 23 output and efficiency measures. The 2005-2009 strategic plan maintained the same objectives and a slight variation on the measures. The strategic plan for 2007-2011 does not list specific measures or targets but does specify how progress towards each of the strategic goals should be achieved (29).
In addition to the strategic plans, the state budget process also utilizes performance measures to report to the Legislative Budget Board, Governor’s Budget and Planning Office and elsewhere on how TxDOT is progressing on objectives set by the legislature. These vary from session to session. Other states use a similar approach to monitor agency performance.
TxDOT also uses performance measures in its ongoing work and projects, for example, to evaluate and prioritize projects for inclusion in long-range plans. Corridor and project plans use performance measures to evaluate project functional and environmental impacts which help to select preferred project alternatives. Various TxDOT divisions use performance measures to monitor performance and progress on transportation characteristics such as travel time and delays, level-of-service, safety, pavement condition, and maintenance levels.
A recent research project surveyed TxDOT districts to determine their use of and support for operational performance measures (32). Operational performance measurement can exist on many different levels, ranging from wide-area evaluations of congestion and delay to the

15
performance of specific equipment in the field. In general, operational performance measures can be used to support the evaluation and function of programs such as:
• arterial management, • congestion mitigation, • corridor traffic management, • emergency transportation operations, • freeway management, • freight analysis and management, • real-time traveler information, • road weather management, and • traffic incident management, etc. As a general result, the survey found that the use of operational measures within TxDOT
is limited. Where it does occur, the assessments are taking place on a wide-area scale, such as city-wide or on specific corridors. In addition, some districts are currently writing maintenance contracts that require an equipment up-time measurement and a specified timeframe for contractor response, both of which are a subset of operational performance measurement. However in the broad sense, operational performance measurement is not utilized to any significant extent. The districts appear willing to learn about the benefits and techniques for operational performance measures, but this is currently hampered by the lack of a statewide framework and/or information on how the measures would integrate into the existing activities.
Another program that contains some level of performance measurement is the Texas Urban Mobility Plan (TUMP). The TUMP is a mandate by House Bill (HB) 3588 requiring MPOs to identify the unfunded transportation needs within their area and to develop short-term priorities to solving these needs. Needs, as defined in the TUMP, will be new highway capacity for minor arterials or greater to eliminate over capacity conditions by 2030 (Level of Service F). Additionally, the reconstruction of highways and bridges older than 40 years in age by 2030 is also identified as a need. Unlike the Metropolitan Transportation Plan (MTP), there are no financial constraints associated with the TUMP.
Another program that utilizes some level of performance measurement is the Texas Metropolitan Mobility Plan (TMMP). The TMMP procedures were developed through a joint effort between TxDOT, the MPOs representing the eight transportation management areas, and the Texas Transportation Institute (TTI). The TMMP is a methodology used to estimate the magnitude of transportation system needs beyond those identified in the Regional Transportation Plan (RTP). It utilizes a performance-based measure of future transportation needs based on 2030 projections.
Historical Use of Performance Measures in Planning
Conversations with a group of people who were involved with planning for TxDOT back to the late 1970s confirmed that performance measures have been used in some form for planning applications since at least that time. Travel forecasting and network planning have used such measures as Vehicle Miles of Travel (VMT), VMT per capita, Vehicle Hours of Travel (VHT), and volume/capacity ratio by link, area type, facility type, and network for decades. These measures have been used to evaluate alternatives, estimate degree of improvement, and track growth.

16
At the project level, various measures of benefit-cost and cost-effectiveness have been used for a very long time. The measures have become more sophisticated over time. The advent of NEPA created the need to evaluate and compare alternatives using a variety of criteria, not just cost-effectiveness. Some measures were quantifiable; some were not. However, the NEPA considerations introduced sustainability considerations into the transportation planning process due to the consideration of environmental criteria, as well as local issues and conditions associated with the proposed project.
TxDOT’s process for programming improvements has changed over time. During some periods, TxDOT has used specific performance measures for project evaluation. Transportation sustainability has not been a specific consideration, but sustainability concerns have become of more significance since the advent of NEPA.
State-of-the-Practice of Other Agencies
Other State DOTs
Sustainable transportation has gradually made its way into the strategic plans of state departments of transportation. A survey of state DOTs identified that currently 15 states (Florida, Georgia, Indiana, Louisiana, Michigan, Montana, New Jersey, New York, Nevada, Oregon, Rhode Island, South Dakota, Texas, Vermont, and West Virginia) address the concept of sustainability in their mission statements (4).
In terms of performance measurement, many states use performance measures as part of their strategic plans, performance monitoring, internal communications, and reporting to the legislature or governor. Some also use measures to report progress and/or conditions to the public. For example, the Minnesota and Virginia DOTs are two of a few states using the “dashboard” method that graphically reports progress and conditions to the public as well as the agency administration and management.
Table 4 shows a list of states that have state-of-the-practice applications in using performance measures with their strategic plans, long-range plans, project selection, and project delivery (33).

17
Table 4. States with State-of-the-Practice Applications of Performance Measures. State Strategic Plans Long-Range Plans Project Selection Project Delivery
Arizona
California
Florida
Minnesota
Missouri
Montana
New Mexico
Ohio
Pennsylvania
S. Carolina
Tennessee
Texas
Virginia
Washington
Wisconsin
Most state departments of transportation and MPOs need performance measures that reflect ideas expressed in the agency goals and vision statements. However, performance measurement in these areas poses a problem in terms of “measuring outcomes of transportation policy versus the outputs” (34). Appendix B contains a comprehensive listing of how other state DOTs use performance measurement in strategic or long-range planning. The tables in the appendix highlight the state, the name of the plan, and provide detail on the mission or vision statement and the overall goals and objectives. In addition, the table identifies what gets measured from a sustainability perspective. Overall, the information in the appendix shows that a number of states are moving towards sustainability measures at the strategic planning level.
Texas Metropolitan Planning Organizations
In order for transportation agencies to ensure achievement of their goals and objectives, many have begun to introduce explicit transportation system performance measures into their policy, planning, and programming activities. Performance measurement is being applied widely in many transportation agencies and often extends well beyond the performance of the transportation system itself. Performance measures are also used to evaluate, control, and improve different organizations, departments, and individuals.

18
Appendix C to this report contains a listing similar to Appendix B but applicable to the
MPOs in Texas. This table shows a wider disparity, both in the use of performance measures in general, and in the type of performance measures utilized. While a cross-section of Texas MPOs have incorporated performance measures into various components of their MTPs, other MPOs have focused on the ability to measure the performance of a single component, such as congestion management. Examples of MPOs that incorporate performance measures into various components of their MTPs include the following:
• Austin (CAMPO) – the CAMPO Mobility 2030 Plan performance measures include
1) overall system performance; 2) motor vehicle system performance; 3) alternative mode performance; and 4) environmental factors.
• Killeen – Temple MPO – the FY 2006/2007 Unified Planning Work Program
identified the following components as performance measures and indicators: 1) mobility; 2) accessibility; 3) environment; 4) reliability; and 5) safety.
Examples of MPOs that incorporate performance measures into a specific component of
their MTPs include the following:
• Beaumont area (SETRPC) – MTP 2030 - Transit specific – Performance measures offer planning, budgeting, and cost statistics to monitor and evaluate regional transit services: 1) service effectiveness; 2) increase annual passenger trips per vehicle revenue mile (VRM) and vehicle revenue hour (VRH); 3) service efficiency; 4) decrease operating expenses per VRH and VRM; 5) cost effectiveness; and 6) decrease operating expenses per passenger trip and passenger mile.
• El Paso MPO – Gateway 2030 Metropolitan Plan - Congestion specific – The
Congestion Management System (CMS) identifies critical areas for congestion reduction using standard performance measures. El Paso MPO will “overhaul” the CMS for the region, and the process will establish new performance measures. Solutions to these specific congestion problems will be developed in the form of projects or programs that can be incorporated into the long-range metropolitan plan.
Interviews with Key TxDOT Personnel
Interviews were conducted with a cross-section of TxDOT division and district staff. The objectives of the interviews were to obtain insight regarding current TxDOT staff understanding of sustainability, the extent to which sustainability is being considered in ongoing work, and the potential value of sustainability to the TxDOT planning process. This section outlines the findings and observations from these interviews. Table 5 shows the list of interviewees and their affiliations.
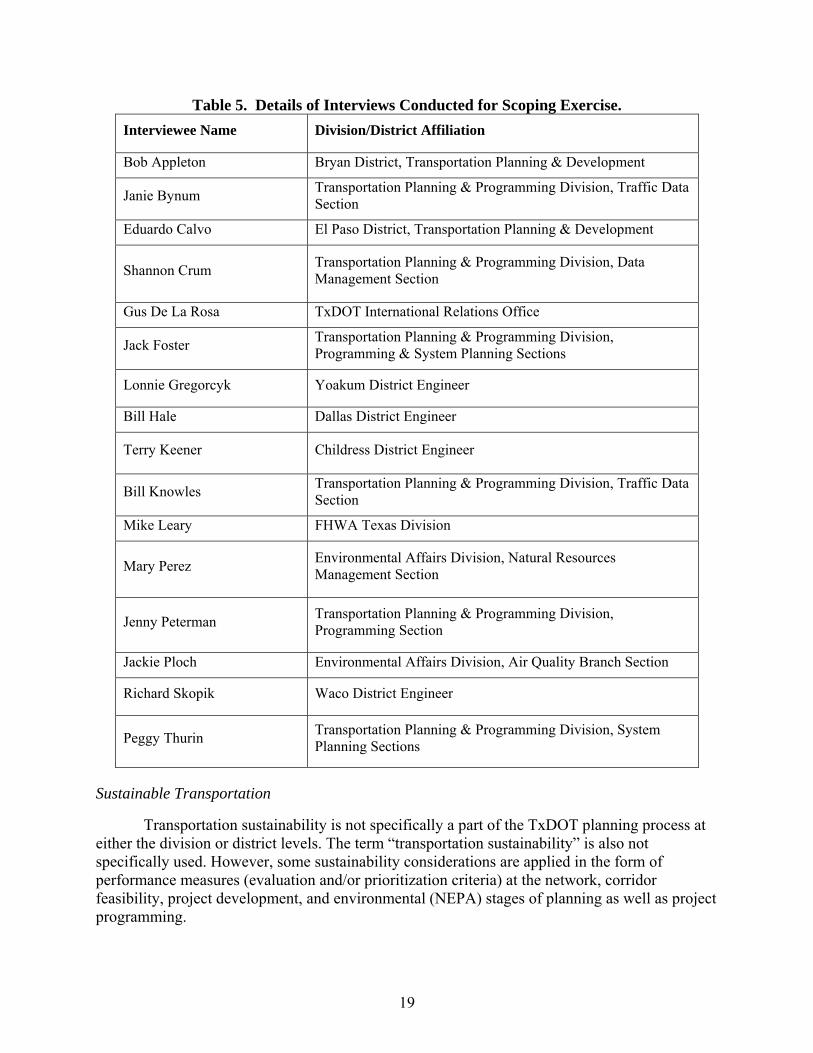
19
Table 5. Details of Interviews Conducted for Scoping Exercise. Interviewee Name Division/District Affiliation
Bob Appleton Bryan District, Transportation Planning & Development
Janie Bynum Transportation Planning & Programming Division, Traffic Data Section
Eduardo Calvo El Paso District, Transportation Planning & Development
Shannon Crum Transportation Planning & Programming Division, Data Management Section
Gus De La Rosa TxDOT International Relations Office
Jack Foster Transportation Planning & Programming Division, Programming & System Planning Sections
Lonnie Gregorcyk Yoakum District Engineer
Bill Hale Dallas District Engineer
Terry Keener Childress District Engineer
Bill Knowles Transportation Planning & Programming Division, Traffic Data Section
Mike Leary FHWA Texas Division
Mary Perez Environmental Affairs Division, Natural Resources Management Section
Jenny Peterman Transportation Planning & Programming Division, Programming Section
Jackie Ploch Environmental Affairs Division, Air Quality Branch Section
Richard Skopik Waco District Engineer
Peggy Thurin Transportation Planning & Programming Division, System Planning Sections
Sustainable Transportation
Transportation sustainability is not specifically a part of the TxDOT planning process at either the division or district levels. The term “transportation sustainability” is also not specifically used. However, some sustainability considerations are applied in the form of performance measures (evaluation and/or prioritization criteria) at the network, corridor feasibility, project development, and environmental (NEPA) stages of planning as well as project programming.

20
Performance Measures
The Transportation Planning and Programming (TPP) Data Management Section assembles and maintains databases of highway system operational performance data for use by others but does not apply the data itself. Examples of the types of data that the section maintains (on a yearly basis) are number of roads by type and length, safety statistics, right-of-way, traffic volumes by vehicle classification, etc.
At the network planning level, TPP’s Traffic Analysis Section produces travel (traffic volumes) forecasts and summaries of current and projected network performance. The outputs feed into various summary statistics, such as projected traffic volumes, speeds, travel times, levels of service, VMT, etc. Those statistics are used to report network performance and statewide system performance. While these measures can be used to begin to evaluate transportation sustainability over the long range, there is no specific network level sustainability evaluation at this time.
For the eight Texas Transportation Management Areas (TMAs), TxDOT and the respective MPOs have produced the Texas Metropolitan Mobility Plan, which uses the Texas Congestion Index (TCI) to evaluate congestion/mobility over the forecast period, which is a possible measure of sustainability. TxDOT and the other 17 MPO areas have developed the Texas Urban Mobility Plan, which also uses the TCI as its primary measure of performance. As with the TPP network travel forecasting and planning, the TMMP and TUMP are done at the network level. Available data sets are used for the TCI. National data sources such as Intelligent Transportation System Deployment Tracking Survey (ITDTS) and the Highway Performance Monitoring System (HPMS) can also be used.
The TPP System Planning Section then performs corridor feasibility studies for each segment of the state highway system that appears to warrant improvement over the planning horizon period. This step is to verify that an improvement is both needed and appears feasible to be implemented. Benefit/cost is a major criterion and is used per the Federal Highway Administration (FHWA) corridor feasibility requirements. While not explicitly addressed, sustainability considerations are included in corridor visioning and environmental reviews (when done at this stage). Economic development considerations are sometimes addressed for some projects; the information used is open to interpretation and is dependent on assumptions that are not always verifiable.
Once network and initial corridor feasibility steps are completed and segments that need improvement are identified and designated, most planning passes to the district level. At this stage, project segments are designated for further planning in the project development stages. For segments wholly within TxDOT districts, this work is conducted by the local district. For multi-district and multi-state segments, planning is performed by the TPP System Planning Section as the project development process.
This work can be considered to have two different steps: project planning and environmental analysis. Project needs drive the planning step. Environmental considerations and the NEPA requirements drive the environmental analysis step. The two steps are usually interactive and comprise project development. These steps are really where sustainability considerations can be considered in detail.
While many sustainability factors are considered in project planning (as objectives) and environmental analysis (as evaluation or sufficiency criteria), sustainability is not now specifically considered as such. Under current practice, performance measures (evaluation criteria) are customized for each project according to project objectives and local conditions and
21
issues as defined as the planning is initiated and in the project scoping process. The objectives/criteria must meet NEPA requirements at the minimum but can reflect additional considerations. The criteria can be quantitative or qualitative; data availability and accuracy are two determinants of whether the criteria will be quantified, but level of effort and comprehensibility can also be factors (sometimes a “Consumer Reports” gradation of qualitative ratings is used).
Most project planning and environmental processes do consider a range of sustainability factors (e.g., long-term level of service, life-cycle costs, value of travel time saved, maintenance, safety, community and environmental benefits and impacts). Air quality must be specifically considered and a conformity determination is needed for projects in nonattainment areas.
TxDOT’s Environmental Affairs Division considers sustainability factors as part of the NEPA process but not specifically to address sustainability. They use a checklist for evaluation of performance criteria to verify consideration of the necessary factors. Some projects that are proposed for the purpose of generating economic development include more sustainability considerations.
While performance measure estimation tools are developed for most projects at this stage, there is currently no tool that is used agency wide. Consultants perform most planning and environmental work and each has its own processes and tools.
Project programming is currently done mainly at the district level once the corridors are deemed appropriate for further work by TPP. Districts are allocated an amount of funding, and each district (MPO for urban areas over 50,000 populations) prioritizes projects. There are currently no standard formulas or criteria for that prioritization.
Finally, performance measures are occasionally used in response to legislative inquiries. Sustainability was not reported to be something that has been specifically requested or needed to date. TxDOT Goal Evaluation and the “Indices” Project
TxDOT has adopted five agency-wide goals as a part of the 2007-2011 strategic plan: • reduce congestion, • increase safety, • expand economic opportunity, • improve air quality, and • improve value of transportation assets.
Each of these goals can be linked to sustainability concerns. Integration of the five
TxDOT agency goals into the planning process will provide an opportunity and an impetus for at least some additional sustainability considerations to enter all stages of planning. However, as of the time the interviews were conducted (December 2006-February 2007), the five goals were just beginning to be placed into most of the planning and programming processes, and only one respondent (in the TPP System Planning Section) reported ongoing use of these goals. A project referred to as the goal evaluation “indices” project, was an initiative undertaken to address the issue of TxDOT’s goal evaluation at the project level.

22
Interest in Sustainability
Almost all TxDOT staff interviewed understands the value of sustainability to TxDOT and its customers. TPP System Planning uses the five goals within its feasibility study evaluation matrices except when the goals are not applicable to the projects (e.g., air quality is often omitted at feasibility stage if the project is not in a nonattainment area). A few respondents reported that they have been considering addition of some sustainability considerations to their project development work, but there is no formal effort to do so. Most of those interviewed also understood how sustainability could be applied to the planning stages through performance measures or indicators.
One respondent suggested that with TxDOT becoming more involved in multimodal projects and planning it would be helpful to broaden planning considerations and evaluation criteria to include some of the sustainability factors as well as factors related to transit and other modes. Another respondent suggested that TxDOT could benefit from an estimation tool that computes performance measures for “all” goals, objectives, environmental factors, and other normal considerations. The measures could be used selectively according to project specifics as well as local conditions and considerations and adapt availability. Another respondent also made a related comment stating that since decision matrices were often used in the planning process anyway, it would be desirable to incorporate traditional project evaluation measures into any new application that is created.
Challenges to Expanding Performance Measures to Add Sustainability
Obtaining applicable and complete data (baseline and forecast conditions) was viewed as the biggest challenge to using performance measures for sustainability evaluation. While some data are usually available, many are not and have to be obtained and forecasted in order to be used. This requires time and resources which may not be available. Further consideration of sustainability was viewed as a desirable addition to the planning process if there is interest from MPOs, TxDOT management, and district engineers. Some interviewees felt that in order to be effective, a better understanding of sustainability among TxDOT staff will be needed. Other challenges as noted by interview respondents include:
• selecting performance measures for which data can be readily obtained; • selecting measures that quantify performance related to the issue or objective being
considered; • maintaining a steady flow and archiving more data; and • producing credible forecasts for the performance measures.
CONCLUDING REMARKS
Transportation sustainability as a concept is often all-encompassing, which can prove to be a limitation when implementing a methodology to evaluate the concept. While there is a lot of research discussing sustainable transportation, indicators for sustainable transportation, and, more recently, decision-making methodologies to evaluate transportation sustainability, a missing aspect is in aligning the sustainability evaluations to the existing planning framework of a transportation agency. In this case, the performance measurement framework for sustainability must be developed for TxDOT’s planning goals. The MAUT has been identified as the most
23
suitable MCDM process; this project proposes a methodology for implementing it. The following is a list of conclusions/observations from the literature review and scoping exercise that was used to define the final scope and direction of the project:
• Sustainable transportation for the purpose of this study can be defined as: the provision of safe, effective, and efficient access and mobility into the future while considering the economic, social, and environmental needs of society.
• The goals of sustainable transportation are rarely adequately or specifically addressed on a consistent basis within state departments of transportation, and TxDOT is no exception.
• For sustainable transportation to be successfully implemented it is essential that the concepts are adequately understood, quantified, and applied.
• Performance measures can be used in quantifying and applying the concepts of sustainable transportation.
• Conventional evaluation techniques for transportation decision-making focus primarily on the quantifiable financial and economic aspects of the investment. For sustainable transportation a broader methodology is required that can cover the sustainability issues such as social equity, safety, and the environment. An appropriate evaluation process is the multi-criteria decision-making method.
• TxDOT does not explicitly address the concept of sustainable transportation. However, it does enter into consideration on the periphery in some feasibility, corridor, development, or environmental projects.
• The Texas Transportation Commission has developed a set of goals that are related to the goals from the strategic plan but that are more specific to the current project delivery needs. These goals do address the three dimensions of sustainability—social, economic, and environmental—to a limited extent, and are as follows: reduced congestion, improved safety, economic opportunity, improved air quality, and increased value in state’s assets.
• Although TxDOT does not explicitly address sustainable transportation, the agency does utilize the related concept of performance measurement in many areas across the agency.
• Sustainable transportation has gradually made its way into the strategic plans of state departments of transportation. Currently 15 states (Florida, Georgia, Indiana, Louisiana, Michigan, Montana, New Jersey, New York, Nevada, Oregon, Rhode Island, South Dakota, Texas, Vermont, and West Virginia) capture the concept of sustainability in their mission statements.
• Almost all TxDOT staff interviewed understands the value of sustainability to TxDOT and its customers and recognizes the need for implementing sustainability concerns into the planning process.


25
CHAPTER 4: DEVELOPING SUSTAINABILITY OBJECTIVES AND PERFORMANCE
MEASURES FOR TXDOT’S STRATEGIC PLAN
SCOPE OF PROJECT
The scientific and professional community agrees that sustainability of transportation systems is of great importance. As discussed in the introductory section, this project seeks to create a methodology (to be implemented as an analysis tool) for sustainability evaluation for TxDOT. It was agreed that the project scope be limited as follows:
• The analysis tool should be applied at the planning level for transportation corridors. • The analysis tool should be applied for the highway mode although transit operating
on the highways or within the corridor should also be considered. • The analysis tool should not be a decision-making tool, but rather a “sustainability-
enhancement” tool and not linked to the budgeting process. This chapter discusses the process of developing a performance-measurement framework
for the implementation of sustainability enhancement specific to highways, including the selection of sustainability indicators within the confines of strategic planning goals. Subsequent chapters discuss the quantification of the performance measures, application of a decision-making process, and issues of data availability and data collection.
CONCEPTUALIZING HIGHWAY SUSTAINABILITY
Based on the discussion of findings in the literature review, it can be argued that the range of interpretations and definitions for sustainable transportation can sometimes impede progress toward actually implementing assessments of sustainability. Also, there are difficulties involved with changing the direction of strategic planning goals for a transportation agency to address sustainability. Thus, it is preferable to develop a framework for sustainability evaluation that is instead aligned with the strategic planning goals of the concerned agency.
For purposes of this research, sustainable highway transportation is conceptualized as a highway system that maintains or improves its quality of service while mitigating aspects of highway development that have an adverse effect on sustainability. Restricting the scope of the sustainability evaluation to a single highway section or corridor rather than an entire region has some drawbacks in that it results in a narrow definition of sustainability. It can be argued that assessing highways only, without consideration of other modes, is in itself antithetical to sustainability. This is supported by the observation that the single most important factor that could lead to a more environmentally sustainable transportation system is the reduction in automobile vehicle miles traveled (35). However, it is of value to reconcile sustainable planning with the realities of transportation in the U.S. The personal automobile is the most commonly used form of transportation for all types of trips, and consequently, a majority of the work carried out by state DOTs involves highway corridor planning. While considering a single highway for the analysis creates a lack of demographic, equity, and employment data that could prove useful for sustainability evaluations in the more traditional sense, the value of this exercise lies in being able to link sustainability to the existing transportation planning process.

26
Linking Sustainability to TxDOT’s Strategic Plan
The rationale for this project approach is that transportation planning is inherently political in nature; thus, implementing a sustainability assessment within already-defined planning goals would result in it being given greater importance and raising awareness. The sustainability indicators/performance measures selected for this research were aligned with TxDOT’s strategic plan. TxDOT’s strategic plan for 2007-2011 (29) outlines the mission, vision, and goals for the entire agency. The five specific goals identified and discussed in the strategic plan are:
• reduce congestion, • enhance safety, • expand economic opportunity, • improve air quality, and • increase the value of transportation assets. The main challenge of this project was to develop a set of performance indicators that
reflected sustainability concerns within the scope of the strategic plan. To facilitate this, a workshop was held with key TxDOT personnel, representing stakeholders and potential users of the final research product. Workshop participants discussed how the dimensions of sustainability—economic development, environmental stewardship, and social equity—could be applicable to progress toward the goals. Initially to facilitate ideas and discussion, the five goals were classified under the most appropriate “sustainability dimension” (environmental, economic, and social). Following this, a set of objectives was defined under each of the strategic goals, and each objective was linked to a measurable indicator that could be used in the sustainability evaluation. Figure 1 shows the steps involved, including further steps of defining, quantifying, and evaluating the performance measures.
Figure 1. Conceptualization: Linking Sustainability to Planning Goals.
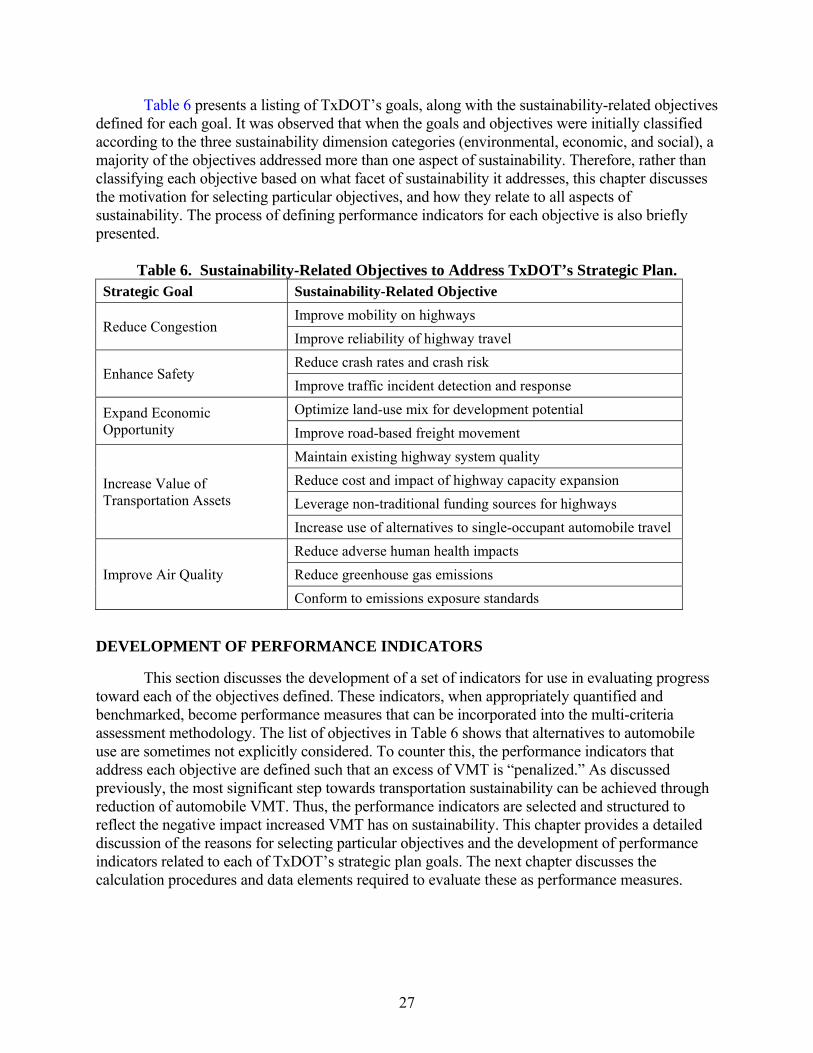
27
Table 6 presents a listing of TxDOT’s goals, along with the sustainability-related objectives defined for each goal. It was observed that when the goals and objectives were initially classified according to the three sustainability dimension categories (environmental, economic, and social), a majority of the objectives addressed more than one aspect of sustainability. Therefore, rather than classifying each objective based on what facet of sustainability it addresses, this chapter discusses the motivation for selecting particular objectives, and how they relate to all aspects of sustainability. The process of defining performance indicators for each objective is also briefly presented.
Table 6. Sustainability-Related Objectives to Address TxDOT’s Strategic Plan.
Strategic Goal Sustainability-Related Objective
Reduce Congestion Improve mobility on highways Improve reliability of highway travel
Enhance Safety Reduce crash rates and crash risk Improve traffic incident detection and response
Expand Economic Opportunity
Optimize land-use mix for development potential Improve road-based freight movement
Increase Value of Transportation Assets
Maintain existing highway system quality Reduce cost and impact of highway capacity expansion Leverage non-traditional funding sources for highways Increase use of alternatives to single-occupant automobile travel
Improve Air Quality Reduce adverse human health impacts Reduce greenhouse gas emissions Conform to emissions exposure standards
DEVELOPMENT OF PERFORMANCE INDICATORS
This section discusses the development of a set of indicators for use in evaluating progress toward each of the objectives defined. These indicators, when appropriately quantified and benchmarked, become performance measures that can be incorporated into the multi-criteria assessment methodology. The list of objectives in Table 6 shows that alternatives to automobile use are sometimes not explicitly considered. To counter this, the performance indicators that address each objective are defined such that an excess of VMT is “penalized.” As discussed previously, the most significant step towards transportation sustainability can be achieved through reduction of automobile VMT. Thus, the performance indicators are selected and structured to reflect the negative impact increased VMT has on sustainability. This chapter provides a detailed discussion of the reasons for selecting particular objectives and the development of performance indicators related to each of TxDOT’s strategic plan goals. The next chapter discusses the calculation procedures and data elements required to evaluate these as performance measures.

28
Goal 1: Reduce Congestion
This goal is fairly self-explanatory and addresses the need for reducing traffic congestion on highways. Congestion reduction can have benefits in terms of saving time, lowering emissions and fuel consumption, as well as impacting safety. While a partial solution to congestion is adding highway capacity, political and institutional realities in the recent past have shown that this is not a practical solution. Congestion management and mitigation are also significant from a system effectiveness standpoint, especially when comparing alternative scenarios or considering future increases in traffic.
Thus, maintaining or improving upon levels of congestion over time is desirable as it can indicate reduced VMT and a reduced requirement for highway capacity expansions. Table 7 shows the objectives and indicators proposed for this goal. These cover the two aspects that are generally considered when referring to traffic congestion. The first addresses the actual travel time increases caused by congestion, while the second examines how these increases affect the reliability of travel assessed over a longer time frame.
Table 7. Performance Indicators for Goal 1: Reduce Congestion. Sustainability-Related Objective Performance Indicator
Improve mobility on highways Travel Time Index
Improve reliability of highway travel Buffer Index
Both of the selected indicators are used for congestion monitoring in the Texas
Transportation Institute’s Urban Mobility Report (36). The following sections discuss these measures individually.
Travel Time Index
The Travel Time Index is a measure that indicates the extent of delays caused in travel due to traffic congestion alone. It is generally quantified as a ratio between the peak period travel times and off-peak travel times for a given roadway section.
Buffer Index
The Buffer Index is an indicator of travel time reliability that provides an estimate of the variation of observed travel times over a period of time. It indicates the extent to which the 95th percentile travel time for a roadway exceeds the mean travel time. In the absence of long-term data to judge the distribution of travel times for a given roadway, there are also empirical relationships derived between the Travel Time Index and Buffer Index that can be used to estimate the Buffer Index values. This relationship has been used in this research and is provided in the next chapter.
Goal 2: Enhance Safety
This goal is mainly concerned with fatalities or crashes that result in severe injuries. With respect to this goal, two objectives are laid out. The first is to reduce crash frequency and crash risk, while the second relates to having surveillance systems in place for monitoring traffic and
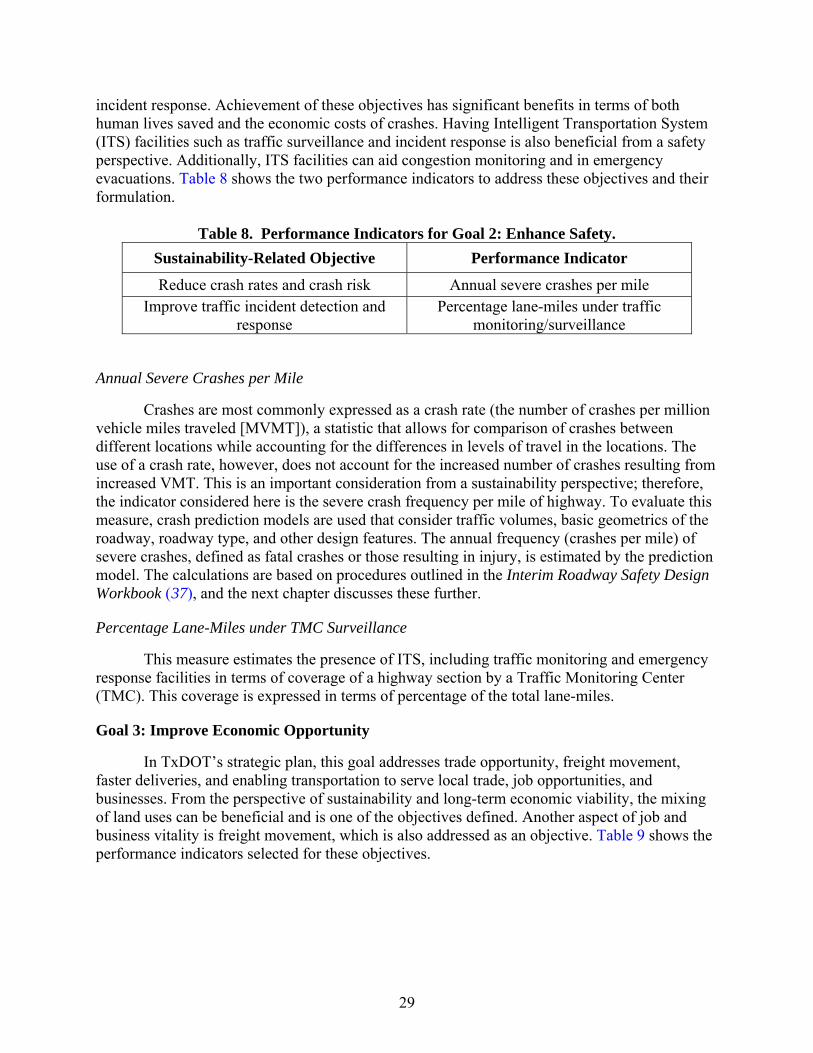
29
incident response. Achievement of these objectives has significant benefits in terms of both human lives saved and the economic costs of crashes. Having Intelligent Transportation System (ITS) facilities such as traffic surveillance and incident response is also beneficial from a safety perspective. Additionally, ITS facilities can aid congestion monitoring and in emergency evacuations. Table 8 shows the two performance indicators to address these objectives and their formulation.
Table 8. Performance Indicators for Goal 2: Enhance Safety. Sustainability-Related Objective Performance Indicator
Reduce crash rates and crash risk Annual severe crashes per mile Improve traffic incident detection and
response Percentage lane-miles under traffic
monitoring/surveillance
Annual Severe Crashes per Mile
Crashes are most commonly expressed as a crash rate (the number of crashes per million vehicle miles traveled [MVMT]), a statistic that allows for comparison of crashes between different locations while accounting for the differences in levels of travel in the locations. The use of a crash rate, however, does not account for the increased number of crashes resulting from increased VMT. This is an important consideration from a sustainability perspective; therefore, the indicator considered here is the severe crash frequency per mile of highway. To evaluate this measure, crash prediction models are used that consider traffic volumes, basic geometrics of the roadway, roadway type, and other design features. The annual frequency (crashes per mile) of severe crashes, defined as fatal crashes or those resulting in injury, is estimated by the prediction model. The calculations are based on procedures outlined in the Interim Roadway Safety Design Workbook (37), and the next chapter discusses these further.
Percentage Lane-Miles under TMC Surveillance
This measure estimates the presence of ITS, including traffic monitoring and emergency response facilities in terms of coverage of a highway section by a Traffic Monitoring Center (TMC). This coverage is expressed in terms of percentage of the total lane-miles.
Goal 3: Improve Economic Opportunity
In TxDOT’s strategic plan, this goal addresses trade opportunity, freight movement, faster deliveries, and enabling transportation to serve local trade, job opportunities, and businesses. From the perspective of sustainability and long-term economic viability, the mixing of land uses can be beneficial and is one of the objectives defined. Another aspect of job and business vitality is freight movement, which is also addressed as an objective. Table 9 shows the performance indicators selected for these objectives.

30
Table 9. Performance Indicators for Goal 3: Improve Economic Opportunity. Sustainability-Related Objective Performance Indicator
Optimize land-use mix for development potential Land-use balance
Improve road-based freight movement Truck throughput efficiency
Land-Use Balance
This measure is a formulation that examines a mix of land uses in a half-mile zone along the highway section. The land area is classified into three categories: Residential, Commercial/Industrial, and Institutional/Public. Cervero and Kockelman proposed an estimation of land-use entropy used to evaluate diversity of land use in a region, and this performance measure is based on it (38). It is formulated to have the highest value when all categories of land use are equally distributed and the lowest values when all the land uses are concentrated into any one category. While this measure does not explicitly examine economic growth or progress, the presence of an adequate area devoted to commercial establishments balanced with residential land-use types ensures a positive impact on economic vitality of an area, when compared to having land occupied by a single land use or land that is completely vacant. It can be argued that having a mix of land uses around a highway does not necessarily reflect the true characteristics of the mix in terms of accessibility or walkability (which are important sustainability concerns), and may promote sprawl. However, these aspects cannot be addressed given the scope of analysis, and it is felt that the area for which this measure is evaluated (half a mile to either side of the highway) is large enough to benefit from having a level of non-homogeneity in land uses, which will also reflect in the use of the highway under consideration.
Truck Throughput Efficiency
This measure is a reflection of truck volumes along the highway section combined with the travel speeds on the links. Freight movement is a key economic benefit of highways, and the objective in this analysis is to maximize freight throughput without affecting highway performance. The basis of this formulation is that the positive impact of having trucks on a corridor (in terms of economic benefits) should be measured while considering possible reductions in travel speeds due to excessive truck volumes or existing low speeds along the corridor. Thus, a measure that examines a combination of truck volumes and speeds as an output, rather than truck percentages alone, is proposed.
Goal 4: Increase the Value of Transportation Assets
This goal seeks to reduce the impacts of declining fuel tax revenue on the existing highway infrastructure and on the possibility of new highway projects. The focus is on preserving and maintaining existing assets while leveraging the maximum possible funding from all available sources.
The approach used to define the objectives for this goal was to consider more sustainable ways of improving and maintaining TxDOT’s existing highway system. First, the quality of

31
existing highways should be maintained. Second, leveraging of non-traditional funding sources for highways can help free up state DOT funds to promote other modes of transportation. When alternative funding encompasses tolled roads, it could indicate that a greater portion of true user costs is being paid for by automobile users themselves (39). Another objective examines mitigating the impact of highway capacity expansion. While expansion can often be desirable from the point of view of easing traffic congestion, there are negative externalities associated with it in terms of the actual costs and impacts of the land acquisition and construction. The final objective deals with the provision of other mobility options, which can also include non-single-occupant vehicle (SOV) automobile travel. Table 10 shows the performance indicators addressing this goal and the objectives.
Table 10. Performance Indicators for Goal 4: Increase Value of Transportation Assets.
Sustainability-Related Objective Performance Indicator
Maintain existing highway system quality Average pavement condition score
Reduce cost and impact of highway capacity expansion Capacity addition within available right-of-way
Leverage non-traditional funding sources for highways Cost recovery from alternative sources
Increase use of alternatives to SOV automobile travel Proportion of non-SOV travel
Average Pavement Condition Score
TxDOT monitors the condition of the pavements in the road network by considering factors such as surface distress, rutting, and ride quality. The data for the entire network are collected in a Pavement Management Information System (PMIS), which combines these factors into a pavement condition score expressed on a scale of 0 to 100. This is proposed as a performance measure that indicates the quality of maintenance of a road section.
Capacity Expansion Possible within Available Right-of-Way
While having increased highway capacity could be beneficial from the standpoint of improving the value of the highway system, there are reasons why simply adding miles of pavement is not completely sustainable. This measure addresses the issue by only considering expansion that is possible within existing right-of-way (ROW), which represents value addition at a lesser social, environmental, and economic cost than acquiring land solely for the purpose of highway construction. Though the impact of increased traffic due to a capacity expansion is not reflected in this performance measure, it will affect the value of other measures relating to congestion levels, crash numbers, and emissions rates. Thus, capacity expansion within certain constraints can be an indication of highway sustainability and is measured in terms of the number of lanes that can be added to a given highway section within the available ROW.

32
Cost Recovery from Non-DOT Sources
The expenditure on a highway can be classified as the initial capital cost required for construction and the recurring (annual) cost for operation and maintenance (O&M). When some of these costs are contributed from sources external to the DOT, it can be considered a positive occurrence, as discussed previously. This performance measure is structured to consider the proportion of capital costs, as well as the proportion of the current annual O&M cost that is contributed from external sources. In this research, external sources are considered to include funds from local/municipal agencies, toll revenue recovered, or roads that are built or operated by the private sector.
Proportion of Person Miles of Travel Occurring in Non-SOVs
The rationale behind selecting this measure (as an indicator of reducing overall VMT) has been discussed previously. It evaluates the higher occupancies achieved by carpooling, use of bus transit or parallel rail facilities. This measure is calculated by accounting for non-SOVs in the general-purpose lanes (GPLs), high-occupancy vehicle (HOV) lanes, buses, and parallel rail facilities.
Goal 5: Improve Air Quality
This goal specifically addresses air quality, which is a major concern, especially in urban areas. The U.S. Environmental Protection Agency (EPA) has set out standards for air quality. The National Ambient Air Quality Standards (NAAQS) and the regulation of motor vehicle emissions are very important to achieving those standards. While evaluating air quality alone does not address the whole gamut of environmental issues associated with road transportation, motor vehicle emissions is considered as the most significant issue for an existing highway. In terms of emissions, the impacts can be broadly divided into two aspects – first, toxic pollutants and ozone precursors that affect human health, and second, emissions of greenhouse gases. Each of these is addressed by an individual objective. The emissions monitoring programs in the state of Texas generally consider the emissions of carbon monoxide (CO), oxides of nitrogen (NOx), and volatile organic compounds (VOCs) in terms of human-health impacts. CO is a toxic gas that is lethal to humans, while NOx and VOCs are considered as ozone precursors (they create ozone in the presence of sunlight). Ozone, when present in the lower levels of the atmosphere, also causes respiratory problems for humans.
Though the state of Texas does not ordinarily consider carbon dioxide (CO2) emissions as part of its environmental monitoring or mitigation program, CO2 emissions were given consideration in this project. Given the growing concern about greenhouse gases and the ultimate impacts of global warming, the researchers felt that addressing CO2 emissions was a necessary part of a sustainability evaluation. The final objective relating to this goal examines the impact of air quality in terms of exposure levels that cause harm to humans and the environment. It considers problem areas that represent the “worst case” for emissions exposure in terms of the NAAQS. Table 11 shows the performance indicators developed for each of these objectives.

33
Table 11. Performance Indicators for Goal 5: Improve Air Quality.
Sustainability-Related Objective Performance Indicator
Reduce adverse human health impacts Daily NOx, CO, and VOC emissions per mile of roadway
Reduce greenhouse gas emissions Daily CO2 emissions per mile of roadway
Conform to emissions exposure standards Attainment of ambient air quality standards
Daily NOx, CO, and VOC Emissions
NOx, CO, and VOCs are the mobile-source emissions usually considered in terms of human-health impacts. The rate of emissions for a vehicle depends upon the operating speed and varies by vehicle type. These rates can be obtained from emissions estimation models (MOBILE6, the EPA’s model used in this research). For the purposes of this study, the total quantity of emissions is expressed in grams per mile of roadway, which is dependent upon the vehicle fleet mix, vehicle operating speed, as well as the total traffic volumes. The final measure is the sum total of the three pollutant emissions, weighted according to their relative damage costs.
Daily CO2 Emissions
CO2 is a gas emitted from burning fossil fuels, which is associated with global warming. Vehicular emissions are the most significant anthropogenic source of CO2 (35), and these must be considered while assessing the sustainability of transportation systems. Emissions rates are obtained from an emissions model, as in the previous measure, and are expressed as the daily emissions of CO2 in grams per mile of roadway.
Attainment of Ambient Air Quality Standards
While the other two performance indicators addressing air quality provide an idea of the relative levels of emissions, this measure examines the actual impact in terms of attainment of ambient air quality standards. As mentioned earlier, the EPA sets out standards for air quality for certain “criteria pollutants,” as specified in the NAAQS. The levels of these pollutants are monitored regularly. Based on the duration and level of non-conformance, a region can be classified as being in nonattainment for specific pollutants. Since the ambient air quality does not depend solely upon automobile emissions, but is also affected by industries and other sources of pollution, the attainment status for a region cannot be directly correlated to automobile emissions or estimated in the future.
This performance indicator is developed to address this for the case of ozone nonattainment, which is a problem faced by many counties in Texas. As mentioned earlier, NOx

34
and VOC represent ozone precursors, whose emissions can be linked to increased levels of ozone. This performance indicator attempts to address this link by examining two factors – first, the current level of attainment of ozone standards (whether in attainment, or in marginal, moderate, severe, or extreme nonattainment) and second, the estimated levels of VOC and NOx emissions. Thus, the performance indicator is quantified as a score based on the current level of nonattainment for ozone according to the NAAQS. For the evaluation of a future case (where the attainment status cannot be predicted), this score is adjusted based on the relative level of reduction in ozone precursor (combined NOx and VOC) emissions.
CONCLUDING REMARKS
Many sustainability indicators are not practically implemented at the highway corridor level but can be more easily considered at the aggregate level (of a county/city). Examples of this include measures of equity such as employment access or income distributions. Given the constraints of restricting the evaluation to highway segments alone, it is felt that the performance measures selected are adequate, without being impractical to evaluate. This research effort also captures another aspect of sustainability: the consideration of changes over time. Future and present conditions are evaluated on a common ground, rather than making allowances or accepting that future conditions would be worse. This is a key sustainability concern (i.e., future conditions should be better than today) that has been addressed. The references for sustainable transportation indicators mentioned in the literature review (3,4,8,9,16) provide a comprehensive listing of resources and indicator sets that relate to sustainable transportation. These references show that the indicator set proposed here provides a fairly complete view of issues that need to be addressed in terms of sustainability. The following chapters deal with the quantification of these performance measures, their combination into an aggregate sustainability indicator, and the application of this evaluation methodology as an analysis tool to perform case studies.

35
CHAPTER 5: APPLICATION OF THE MAUT FOR SUSTAINABLITY EVALUATION
APPLICATION OF MAUT METHODOLOGY
As previously discussed, the framework for performance-based evaluation of highway sustainability has been developed to assess a single highway facility, termed as a “section.” The analysis does consider corridor-level information, such as parallel rail facilities or land use. However, the term “section” is used rather than “corridor” to describe the level of analysis. This is done because the term “corridor” can include multiple parallel road facilities, whereas this research only discusses a single facility and its impact.
The section under consideration is divided into smaller links, and the calculation methodology can be applied to individual links, as well as to the aggregate highway section. Figure 2 shows a schematic setup. Thus, the results for a specific link are comparable with any other link or with the entire section. This allows for the identification of problem areas on a given section and to determine how each link measures up compared to the average. Also, this assessment can be used to compare different highways or different proposed projects for a single highway.
Figure 2. Setup of Links and Sections for Multi-Criteria Analysis.
The selected performance indicators described in the previous chapter are to be quantified, scaled, and aggregated into a final index value representing the result of the sustainability evaluation.
Translating Performance Indicators to Performance Measures
The distinction between a performance indicator and performance measure in this research has been discussed in the literature review. When sustainability indicators are quantified and benchmarked for a specific evaluation, they become performance measures. The sustainability indicators proposed in the previous chapter are quantified as performance measures as the first step in the MAUT methodology. Figure 3 shows the steps involved in this process. Each of these steps is performed for individual links, as well as for the aggregated study section. This chapter discusses the process of performing each of these steps in detail. The methodology for aggregation of these measures into a “sustainability index” value using the MAUT is also presented.
Study Section
Link 1 Link 2 Link 3 Link 4 Link 5

36
Selected Sustainability Indicators
Quantified Performance Measures
Scaled Performance Measures
Aggregated Sustainability Index
Estimation of Indicator Values for Study Section
Scaling Based on Extreme Values
Weighted Sum of Scaled Measures
Selected Sustainability Indicators
Quantified Performance Measures
Scaled Performance Measures
Aggregated Sustainability Index
Estimation of Indicator Values for Study Section
Scaling Based on Extreme Values
Weighted Sum of Scaled Measures
Figure 3. MAUT Process for Sustainability Evaluation.
QUANTIFICATION OF MEASURES AND EXTREME VALUES
Data Elements and Estimation Procedures
The previous chapter detailed the rationale for selecting the particular performance indicators and the general procedures used to evaluate them. Table 12 provides a summary of the performance measures, the data elements required to quantify them, and the units of expression for each performance measure. Each of these measures is evaluated for the existing conditions, as well as for a projected future scenario(s) in the analysis tool.
Based on the data elements, the performance measures can be quantified for individual links and for the overall study section. This chapter explains the estimation processes for each of the measures.
Definition of Extreme Values for the Selected Measures
Each of the performance measures discussed in the previous section need certain benchmark values for comparison to indicate the specific performance measure’s value (good or bad). This is expressed by the “scaling” or “normalizing” of the performance measure. To perform the scaling, however, it is necessary to define two extremes that represent the best and

37
worst possible values for a given performance measure. These extreme values are defined to represent plausible scenarios relating to the performance measure and not necessarily the theoretical maximums or minimums. This section also discusses the selection or calculation of these extreme values to be used for scaling the measures.
Table 12. Data Elements for Quantification of Performance Measures.
Reference Number Performance Indicator Data Elements for Quantification Unit
1a Travel Time Index Daily volumes (ADT)
Number of lanes Speed limits
Dimensionless
1b Buffer Index Travel Time Index Percentage
2a Annual severe crashes per mile
Roadway type ADT
Geometrics
Severe crashes per
mile per year
2b Percentage lane-miles under TMC surveillance
Whether individual link is monitored by a TMC
Percentage of total lane-
miles
3a Land-use balance Area allocated to different land-use classifications in zone half-mile to
either side of highway section Dimensionless
3b Truck throughput efficiency Truck percentages
Daily traffic volumes Number of lanes
Truck-miles per hour per
lane
4a Pavement condition score Score from TxDOT’s PMIS database Dimensionless
4b Capacity addition within ROW
Number of lanes that can be added to a link within available ROW
Number of lanes
4c Cost recovery from alternate sources
Project capital costs and sources Annual operating and maintenance
costs and sources Dimensionless
4d Proportion of total person-miles of travel for non-SOVs
ADT GPL occupancy
HOV lanes and usage Details of bus and rail service
Percentage of total PMT
5a Daily NOx, CO, and VOC emissions in grams per mile
Emissions rates (emissions model) Peak and off-peak volumes
Operating Speeds
Grams per mile per day
5b Daily CO2 emissions in grams per mile (As above) Grams per
mile per day
5c Attainment of ambient air quality standards
Classification for NAAQS eight-hour ozone standards
Ozone precursor emissions Dimensionless
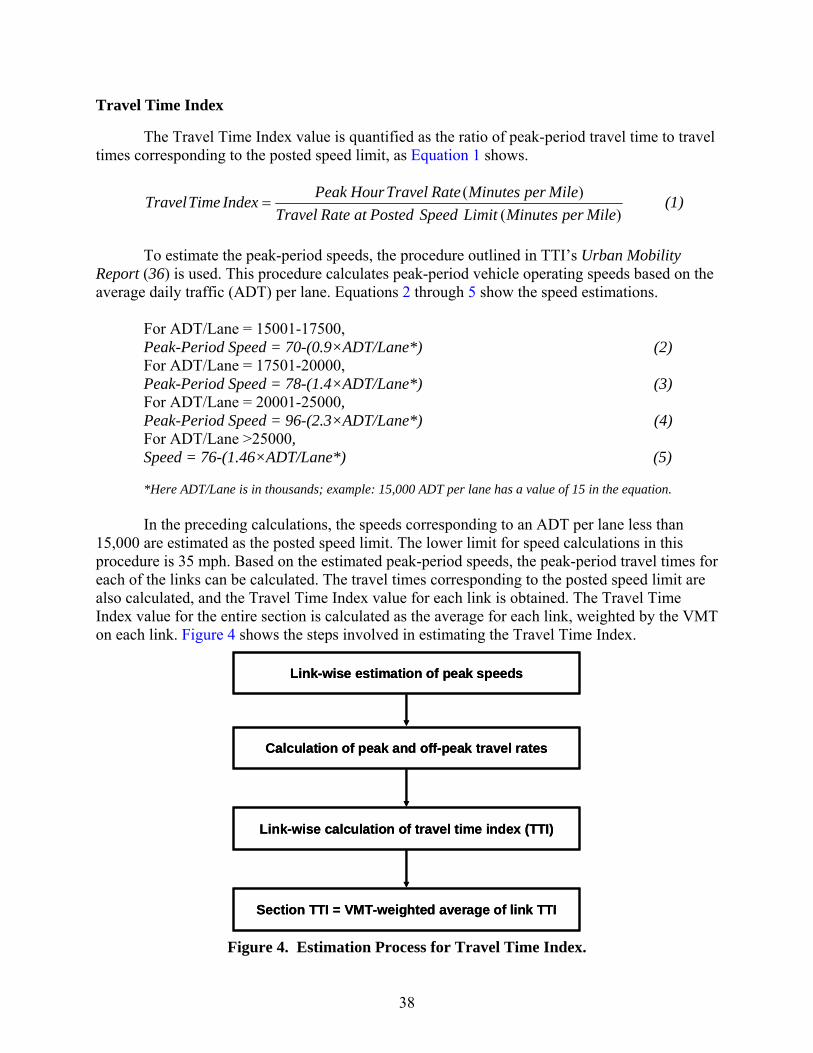
38
Travel Time Index
The Travel Time Index value is quantified as the ratio of peak-period travel time to travel times corresponding to the posted speed limit, as Equation 1 shows.
)()(
MileperMinutesLimitSpeedPostedatRateTravelMileperMinutesRateTravelHourPeakIndexTimeTravel = (1)
To estimate the peak-period speeds, the procedure outlined in TTI’s Urban Mobility
Report (36) is used. This procedure calculates peak-period vehicle operating speeds based on the average daily traffic (ADT) per lane. Equations 2 through 5 show the speed estimations.
For ADT/Lane = 15001-17500, Peak-Period Speed = 70-(0.9×ADT/Lane*) (2) For ADT/Lane = 17501-20000, Peak-Period Speed = 78-(1.4×ADT/Lane*) (3) For ADT/Lane = 20001-25000, Peak-Period Speed = 96-(2.3×ADT/Lane*) (4) For ADT/Lane >25000, Speed = 76-(1.46×ADT/Lane*) (5) *Here ADT/Lane is in thousands; example: 15,000 ADT per lane has a value of 15 in the equation. In the preceding calculations, the speeds corresponding to an ADT per lane less than
15,000 are estimated as the posted speed limit. The lower limit for speed calculations in this procedure is 35 mph. Based on the estimated peak-period speeds, the peak-period travel times for each of the links can be calculated. The travel times corresponding to the posted speed limit are also calculated, and the Travel Time Index value for each link is obtained. The Travel Time Index value for the entire section is calculated as the average for each link, weighted by the VMT on each link. Figure 4 shows the steps involved in estimating the Travel Time Index.
Link-wise estimation of peak speeds
Calculation of peak and off-peak travel rates
Link-wise calculation of travel time index (TTI)
Section TTI = VMT-weighted average of link TTI
Link-wise estimation of peak speeds
Calculation of peak and off-peak travel rates
Link-wise calculation of travel time index (TTI)
Section TTI = VMT-weighted average of link TTI
Figure 4. Estimation Process for Travel Time Index.
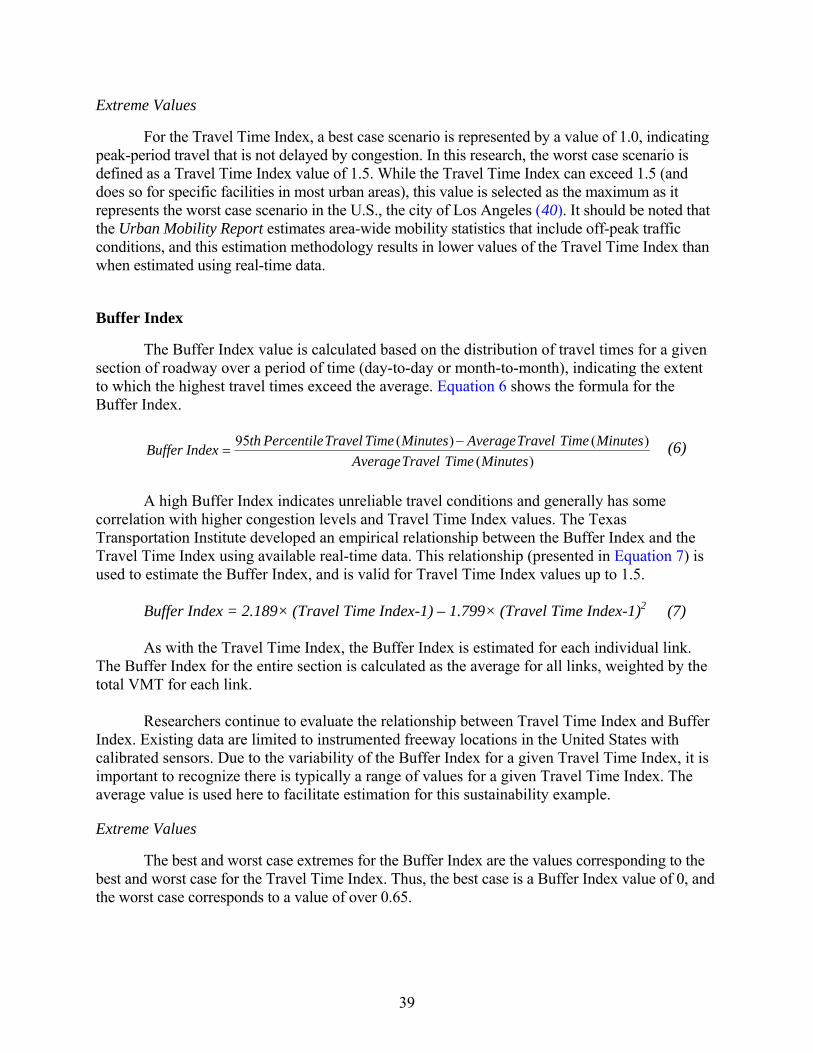
39
Extreme Values
For the Travel Time Index, a best case scenario is represented by a value of 1.0, indicating peak-period travel that is not delayed by congestion. In this research, the worst case scenario is defined as a Travel Time Index value of 1.5. While the Travel Time Index can exceed 1.5 (and does so for specific facilities in most urban areas), this value is selected as the maximum as it represents the worst case scenario in the U.S., the city of Los Angeles (40). It should be noted that the Urban Mobility Report estimates area-wide mobility statistics that include off-peak traffic conditions, and this estimation methodology results in lower values of the Travel Time Index than when estimated using real-time data.
Buffer Index
The Buffer Index value is calculated based on the distribution of travel times for a given section of roadway over a period of time (day-to-day or month-to-month), indicating the extent to which the highest travel times exceed the average. Equation 6 shows the formula for the Buffer Index.
)()()(95
MinutesTimeTravelAverageMinutesTimeTravelAverageMinutesTimeTravelPercentilethIndexBuffer −
= (6)
A high Buffer Index indicates unreliable travel conditions and generally has some
correlation with higher congestion levels and Travel Time Index values. The Texas Transportation Institute developed an empirical relationship between the Buffer Index and the Travel Time Index using available real-time data. This relationship (presented in Equation 7) is used to estimate the Buffer Index, and is valid for Travel Time Index values up to 1.5.
Buffer Index = 2.189× (Travel Time Index-1) – 1.799× (Travel Time Index-1)2 (7) As with the Travel Time Index, the Buffer Index is estimated for each individual link.
The Buffer Index for the entire section is calculated as the average for all links, weighted by the total VMT for each link.
Researchers continue to evaluate the relationship between Travel Time Index and Buffer
Index. Existing data are limited to instrumented freeway locations in the United States with calibrated sensors. Due to the variability of the Buffer Index for a given Travel Time Index, it is important to recognize there is typically a range of values for a given Travel Time Index. The average value is used here to facilitate estimation for this sustainability example.
Extreme Values
The best and worst case extremes for the Buffer Index are the values corresponding to the best and worst case for the Travel Time Index. Thus, the best case is a Buffer Index value of 0, and the worst case corresponds to a value of over 0.65.

40
Annual Severe Crashes per Mile
The crash estimation procedure is based on the Interim Roadway Safety Design Workbook (37). The procedure for calculating total number of crashes accounts for the roadway type, length, ADT, and number of lanes. Using this, a base crash frequency (annual severe crashes) is calculated. Then accident modification factors for features such as the grade, lane width, shoulder width, and median type are applied to this base crash frequency to obtain the total number of annual severe crashes. In the case of roads that have at-grade access, crash estimations for intersections are performed and added to the roadway crash frequency. This total crash frequency is then divided by roadway length to obtain the final performance measure. Figure 5 summarizes the process conducted for each link. The performance measure for the entire section is calculated as the average for the individual links, weighted by link lengths. Appendix D presents the formulas and details of the crash estimation methodology and accident modification factors used.
Total severe crashes for roadway length
Total severe crashes for intersections
Total severe crashes for link
Divide by link length
Severe crashes per mile
Crash estimation for roadway length
Crash estimation for at-grade intersections
Total severe crashes for roadway length
Total severe crashes for intersections
Total severe crashes for link
Divide by link length
Severe crashes per mile
Crash estimation for roadway length
Crash estimation for at-grade intersections
Figure 5. Crash Estimation Process for Each Link.
Extreme Values
For this measure, the best and worst case values were determined based on crash frequency datasets for a three-year period in the U.S. Based on detailed analysis of the data set, Table 13 shows the suggested extreme values for different road classifications and the proposed number of lanes. Appendix D also presents the scatter plots of the data used to determine these scaling values.
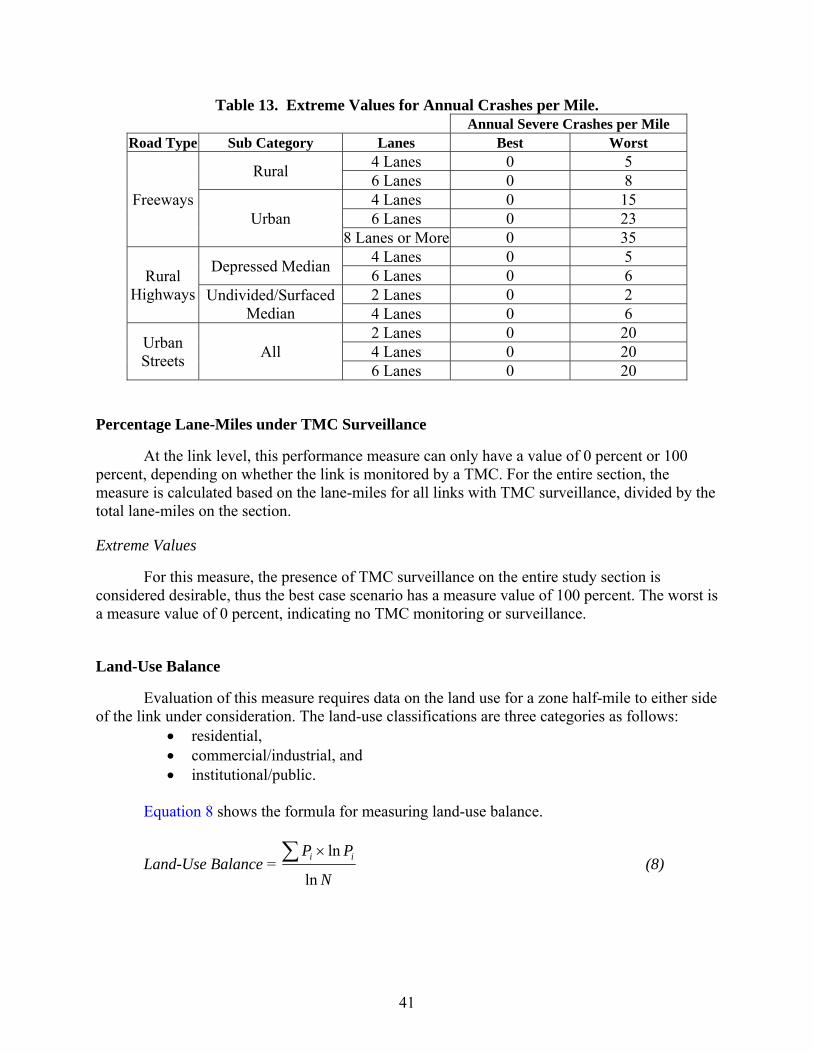
41
Table 13. Extreme Values for Annual Crashes per Mile. Annual Severe Crashes per Mile
Road Type Sub Category Lanes Best Worst
Freeways
Rural 4 Lanes 0 5 6 Lanes 0 8
Urban 4 Lanes 0 15 6 Lanes 0 23
8 Lanes or More 0 35
Rural Highways
Depressed Median 4 Lanes 0 5 6 Lanes 0 6
Undivided/Surfaced Median
2 Lanes 0 2 4 Lanes 0 6
Urban Streets All
2 Lanes 0 20 4 Lanes 0 20 6 Lanes 0 20
Percentage Lane-Miles under TMC Surveillance
At the link level, this performance measure can only have a value of 0 percent or 100 percent, depending on whether the link is monitored by a TMC. For the entire section, the measure is calculated based on the lane-miles for all links with TMC surveillance, divided by the total lane-miles on the section.
Extreme Values
For this measure, the presence of TMC surveillance on the entire study section is considered desirable, thus the best case scenario has a measure value of 100 percent. The worst is a measure value of 0 percent, indicating no TMC monitoring or surveillance.
Land-Use Balance
Evaluation of this measure requires data on the land use for a zone half-mile to either side of the link under consideration. The land-use classifications are three categories as follows:
• residential, • commercial/industrial, and • institutional/public.
Equation 8 shows the formula for measuring land-use balance.
Land-Use Balance = N
PP ii
ln
ln∑ × (8)

42
Where, Pi = the proportion of total land area allocated to each land-use classification; and N = total number of land-use categories considered (N=3 in this research). The area of land currently occupied by each of these uses is considered for this measure
and may be obtained using Geographic Information Systems (GIS) maps or data. For future scenarios, the areas can be calculated based on a future land-use plan. In the absence of a land-use plan for the region, appropriate assumptions may be made based on growth patterns and the general direction of development. This measure is calculated by applying the formula for individual links, as well as for the entire section.
Extreme Values
The calculation of this measure results in a value of 0 when a single land-use classification occupies the entire area, while the measure equals 1 when equal land areas are allocated to each land-use type. Thus, the best and worst case scenarios for this measure are defined as 0 and 1 respectively.
Truck Throughput Efficiency
Equation 9 shows the truck throughput efficiency (TTE), which is calculated as the product of daily truck volumes per lane and the truck operational speed.
TTE = Daily truck volumes per lane × Truck operational speed (9) The calculation for this measure is based on truck percentages, total daily traffic volumes
per lane, and the operational speeds for trucks. Research indicates that trucks, on average, travel 6 percent slower than passenger cars in the traffic stream (41). Thus, a reduced truck operational speed was considered. This performance measure is estimated for individual links, and the length-weighted average of these measures is calculated as the section’s performance measure.
Extreme Values
The performance measure is estimated for a range of traffic volumes and for truck percentages incremented from 2 percent (considered a plausible minimum) to 20 percent (considered a desirable maximum). Based on the range of performance measure values generated, the best and worst case scenarios were identified as 170,700 and 5,600 daily truck miles per hour per lane, respectively. Appendix E shows the calculation of these extreme values and the process of optimizing this measure.
Pavement Condition Score
This score is obtained from TxDOT’s PMIS database and is expressed on a scale of 0 to 100. Thus, the best case scenario for this measure is a score of 100, while the worst corresponds to a score of 0. However, this score cannot be predicted for the future. It is assumed that in the case of any capacity addition in the future, an improved pavement quality is expected and the
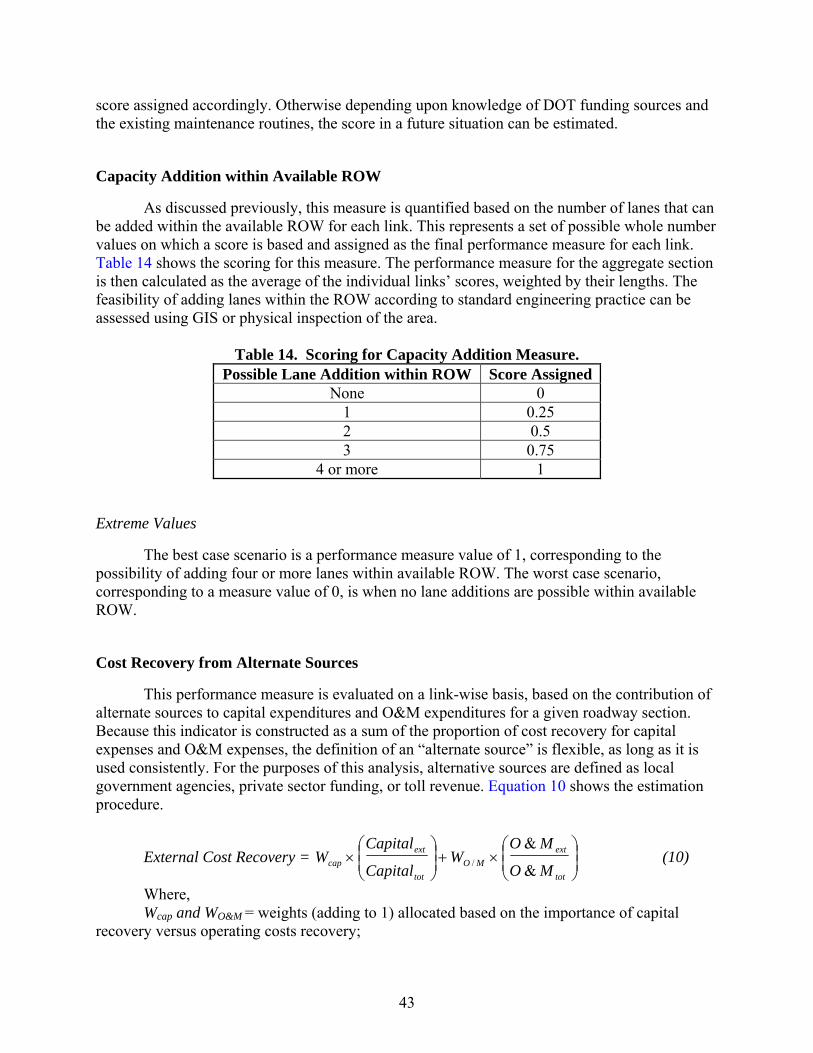
43
score assigned accordingly. Otherwise depending upon knowledge of DOT funding sources and the existing maintenance routines, the score in a future situation can be estimated.
Capacity Addition within Available ROW
As discussed previously, this measure is quantified based on the number of lanes that can be added within the available ROW for each link. This represents a set of possible whole number values on which a score is based and assigned as the final performance measure for each link. Table 14 shows the scoring for this measure. The performance measure for the aggregate section is then calculated as the average of the individual links’ scores, weighted by their lengths. The feasibility of adding lanes within the ROW according to standard engineering practice can be assessed using GIS or physical inspection of the area.
Table 14. Scoring for Capacity Addition Measure. Possible Lane Addition within ROW Score Assigned
None 0 1 0.25 2 0.5 3 0.75
4 or more 1
Extreme Values
The best case scenario is a performance measure value of 1, corresponding to the possibility of adding four or more lanes within available ROW. The worst case scenario, corresponding to a measure value of 0, is when no lane additions are possible within available ROW.
Cost Recovery from Alternate Sources
This performance measure is evaluated on a link-wise basis, based on the contribution of alternate sources to capital expenditures and O&M expenditures for a given roadway section. Because this indicator is constructed as a sum of the proportion of cost recovery for capital expenses and O&M expenses, the definition of an “alternate source” is flexible, as long as it is used consistently. For the purposes of this analysis, alternative sources are defined as local government agencies, private sector funding, or toll revenue. Equation 10 shows the estimation procedure.
External Cost Recovery = ⎟⎟⎠
⎞⎜⎜⎝
⎛×+⎟
⎟⎠
⎞⎜⎜⎝
⎛×
tot
extMO
tot
extcap MO
MOW
Capital
CapitalW
&
&/ (10)
Where, Wcap and WO&M = weights (adding to 1) allocated based on the importance of capital
recovery versus operating costs recovery;
44
Capitalext = capital costs contributed by external sources for the highway section being analyzed;
Capitaltot = total capital costs for the highway section being analyzed; O&Mext = amount contributed from external sources to current annual O&M expenditure
for the highway section being analyzed; and O&Mtot = total current annual O&M expenditure for the highway section being analyzed. In the case of O&M costs, recovery of the most recent annual expenditure is considered.
However, for the capital expenditure, if major investments have occurred at different years, the costs are translated to present value before examining the proportion of overall capital recovery.
The recovery proportions for capital expenses and O&M expenses are combined as a weighted sum to quantify the final performance indicator. In this analysis, a higher weight is given to O&M expense recovery than to capital expenditure recovery (60 percent to 40 percent). This is because increasing maintenance costs are of greater concern to DOTs, as they are recurring expenses that often require a majority of available funding. However, this weight allocation may be adjusted according to local priorities as necessary. This measure is assessed for each link, and the performance measure for the entire section is defined as the length-weighted average of the measure for individual links.
Extreme Values
This performance measure has a value of 1 when the entire capital and operating expenses for a link or section are recovered from alternate funding sources, and a value of 0 when no expenses are recovered. Thus, the best and worst case scenarios for this measure are defined as 1 and 0, respectively.
Proportion of Total Person-Miles of Travel in Non-SOVs
The automobile is the most common mode of transport in the U.S., with Single Occupant Vehicle travel being the most prevalent, especially during commute times. This measure examines the proportion of person-miles of travel (PMT) in non-SOVs, which includes shared travel in general-purpose lanes, carpooling to make use of high-occupancy vehicle requirements, as well as bus services running on a link, and rail service paralleling the link. Equation 11 shows how this measure is quantified.
Proportion of Non-SOV Travel = total
railbusHOV
PMT
PMTPMTPMT ++ (11)
Where, PMTHOV = daily person-miles of travel in automobiles with occupancy of 2 or more in the
study section; PMTbus = daily person-miles of travel on bus service in the study section; PMTrail = daily person-miles of travel on rail facilities running parallel to the study
section; and PMT total = total daily person-miles of travel in the study section.
45
For transit services, such as bus and rail, the PMT is calculated for each link from the length, frequency of service, and average ridership details. In the case of HOV lanes, the PMT is estimated based on minimum-occupancy requirements. In addition to this, the average occupancy for automobiles is used to estimate the PMT in a non-SOV in the GPLs. For example, if average automobile occupancy in a region is 1.1, it would imply that every 100 vehicles traveling a section of roadway carried 110 persons on average. This implies that at a minimum, 20 persons rode with another person (which then qualifies as a non-SOV), and that 20 out of every 110 PMT (approximately 18 percent of total PMT) in the GPLs are in non-SOVs, even without taking into account any HOV restrictions.
Extreme Values
For this measure, the best and worst possible values are defined as being equivalent to attaining specific GPL occupancy levels. Thus, the presence of higher-occupancy modes will make it easier to attain a higher equivalent GPL occupancy. The worst case scenario is assumed to be equivalent to having an overall occupancy of 1.14 and the best case equivalent to an overall occupancy of 1.63. These occupancies correspond to information from the most recent National Household Travel Survey (42) as the average occupancy levels for commute trips and general-purpose trips, respectively. These occupancy values correspond to proportions of non-SOV PMT of 25 percent and 77 percent, which are considered to be the worst and best case scenarios, respectively. It should be noted that there are locations where occupancy levels are well below 1.14. However, using lower worst-case occupancy values (1 is the theoretical minimum) can skew the comparison by improving the value of the estimated measure for a majority of cases. Thus, a decision was made to consider any occupancy below 1.14 as the worst case scenario.
Daily NOx, CO, and VOC Emissions in Grams per Mile
The emissions rate per equivalent ADT for NOx, CO, and VOC are obtained from the MOBILE6 model. The MOBILE6 model provides emissions rates that vary by speed. The total daily emissions of each pollutant are estimated based on peak and off-peak speeds and the proportion of the ADT occurring under peak and off-peak conditions. Equation 12 shows the daily emissions for each pollutant that are then aggregated into a single performance measure based on the relative damage costs for each.
Daily NOx, CO, and VOC emissions = VOCOCxNOx WVOCWCOWNO ×+×+× (12) Where, NOx = daily NOx emissions in grams per mile of roadway; CO = daily CO emissions in grams per mile of roadway; VOC = daily VOC emissions in grams per mile of roadway; and WNOx, WCO, WVOC = weights (adding to 1) assigned to each pollutant based on its
estimated damage costs. The Highway Economic Requirements System (43) provides these damage cost values,
which are shown in Table 15, along with the relative weights calculated based on these costs. Thus, the performance measure is obtained for individual links and is aggregated as a length-

46
weighted average to obtain the measure for the entire section. Figure 6 illustrates the process of calculating this performance measure. Appendix F shows the MOBILE6 emissions rates used in this analysis.
Table 15. Damage Costs for VOC, NOx, and CO. Pollutant Damage Costs ($/ton) Weight
VOC 2,750 0.42 NOx 3,625 0.56 CO 100 0.02
MOBILE6 emissions rates (grams per mile per ADT)
Daily link emissions for peak speeds
and volumes (grams per mile)
Total daily link emissions (grams per mile)
Total emissions weighted by pollutant type = Performance measure for link (grams per mile)
Daily link emissions for off-peak speeds
and volumes (grams per mile)
Performance measure for section = Length-weighted average of link performance measure
Figure 6. Estimation of Daily Combined VOC, NOx, and CO Emissions.
Extreme Values
The extreme values for this measure are based on emissions for a range of ADT values, and different distributions of peak and off-peak conditions. The best case and worst case values for this measure are calculated to be 1.3 kilograms per mile and 181 kilograms per mile, respectively. Appendix F shows the process for calculating these extreme values.
Daily CO2 Emissions in Grams per Mile
Total CO2 emissions are calculated as a separate performance measure for individual links and for the entire study section. The calculation methodology is similar to the previous measure and uses peak and off-peak speeds and volumes to estimate total emissions. The results

47
from a study conducted by TTI were used to obtain the emissions rates used for the estimation of CO2. Appendix F contains details of these emissions rates.
Extreme Values
Calculating extreme values for this measure is similar to the previous measure. The best and worst case emissions rates for CO2 were calculated to be 3,000 kilograms per mile and 92,700 kilograms per mile, respectively.
Attainment of Ambient Air Quality Standards
This measure has different estimation procedures for the current and future situations, as discussed in the previous chapter. Equations 13 and 14, respectively, show the formula for estimating this measure for a current situation and in the future.
Measure (Current) = Score (on scale of 0-1) based on nonattainment level (13)
Measure (Future) = Score for current scenario + VOCNOXMAX
VOCNOX
,
,
−Δ
Δ (14)
Where, ΔNOx,VOC = Projected reduction in combined VOC and NOx emissions from the current
scenario; and ΔMAX-NOx,VOC = Maximum possible reduction in combined VOC and NOx emissions from
the current scenario (Estimation of this quantity is described in Appendix C). Depending on the level of nonattainment (44), the performance measure for the current
scenario can be estimated as shown in Table 16. The performance measure for the entire section is calculated as the length-weighted average of the measure for individual links.
Table 16. Performance Measure Values for Ozone Nonattainment. Nonattainment Status Performance Measure Value
In Attainment 1 Basic Deferred/Early Action Compact 0.8
Marginal Nonattainment 0.6 Moderate Nonattainment 0.4
Serious or Severe Nonattainment 0.2 Extreme Nonattainment 0
However, the nonattainment status for a region cannot be predicted with certainty in the
future. To calculate the performance measure value for the future, the value for the current scenario is adjusted based on the reduction in emissions of ozone precursors (VOC and NOx) relative to the maximum possible reduction in their combined emissions. Appendix F presents the calculation of the maximum possible reduction in combined VOC and NOx emissions, which is estimated to be 165 kilograms per mile.

48
Extreme Values
This performance measure is expressed on a scale of 0 to 1 for the current scenario. For the future case, the measure values are also expressed on the same scale. For example, if an area that is currently in attainment further reduces NOx and VOC emissions, the value of the performance measure remains 1. If an area currently in extreme nonattainment experiences a further increase in emissions, the measure value remains at 0. Thus, the best and worst case values for this measure are 1 and 0 respectively.
SCALING OF PERFORMANCE MEASURES
For each of the performance measures, a “scaled utility value” that represents the measure on a scale ranging from 0 to 1 must be obtained. These utility values are to be aggregated together as a weighted sum to obtain the overall sustainability evaluation result. The estimation of the best and worst case values (or scaling extremes) for each of the performance measures has been discussed in the previous section. Certain performance measures are already expressed as a percentage value or on a 0-1 scale. In these cases, the measures themselves are considered to represent the scaled utility value.
For other performance measures, a utility function must be constructed for scaling. The utility function (or utility curve) expresses the variation in the scaled utility value for the range of values of the performance measure itself. So for each performance measure, there are two points that are fixed on the utility curve, the first corresponding to the best possible value of the performance measure (which would be assigned a utility value =1) and the second corresponding to the worst possible value of the performance measure (which would be assigned a utility value =0) . Deriving a utility function involves fitting a curve through these two fixed points. The most commonly assumed and simple utility function is a straight line, which is referred to as “linear utility scaling.” If any other shape or functional form is assumed, the scaling is deemed to be “non-linear.” Research findings have indicated that the use of linear or non-linear utility functions in an MAUT analysis is primarily a matter of the analyst’s choice (45). In this research, only linear utility functions are assumed. Table 17 summarizes the performance measures, their extreme values, and whether utility scaling is required for each.

49
Table 17. Details of Extreme Values and Utility Scaling for All Measures. Reference Number Performance Measure Extreme Values Type of Utility Scaling
Best Worst
1a Travel Time Index 1.00 1.50 Linear scaling of utilities
1b Buffer Index 0.00 0.65 Linear scaling of utilities
2a Annual severe crashes per mile
Depends on roadway type and number of lanes Linear scaling of utilities
2b Percentage lane-miles under TMC surveillance 100% 0% Measure represents utility value
3a Land-use balance 1.00 0.00 Measure represents utility value
3b Truck Throughput Efficiency
170,704 daily truck miles/hour
5,640 daily truck
miles/hour Linear scaling of utilities
4a Pavement condition score 100 0 Measure represents utility value
4b Capacity addition within ROW 1.00 0.00 Measure represents utility value
4c Cost recovery from alternate sources 1.00 0.00 Measure represents utility value
4d Proportion of total person-
miles of travel on non-SOVs
77% 25% Linear scaling of utilities
5a Daily NOx, CO, and VOC emissions
1.28 kilograms per mile
180.5 kilograms per mile
Linear scaling of utilities
5b Daily CO2 emissions 2,993
kilograms per mile
92,702 kilograms per mile
Linear scaling of utilities
5c Attainment of ambient air quality standards 1.00 0.00 Measure represents utility value
WEIGHTING AND AGGREGATING SCALED MEASURES
While applying the MAUT to a set of performance measures, an aggregate indicator value is obtained as the weighted sum of the individually scaled measures. This results in a composite indicator that is also expressed on the same scale, in this case from 0 to 1. The weights for individual measures are allocated such that they add to 1, with the measures that are deemed more important by the decision makers being given a higher weight. Two sets of weights are used, termed as goal-weights and measure-weights. Because the strategic plan has five goals, each addressed by a set of performance measures, the performance measures corresponding to each goal were first assigned individual weights (termed as measure-weights). This enables calculation of goal-wise performance to evaluate which goals are being sufficiently addressed

50
from a sustainability perspective and which require further improvement. The set of goal-weights then define the relative importance assigned to TxDOT’s five goals, and the aggregate indicators for each goal can be combined into a final sustainability evaluation index. Figure 7 illustrates this process.
In the analysis tool, two sets of default/recommended weights are defined (a set of goal weights and measure weights for rural areas and another set of each for urban areas). These default weights are applied based on the location of the study corridor. These weights may also be replaced on a case-specific basis if required. The default weights were obtained through a group decision-making process in a workshop held with TxDOT staff and members of the research team. Table 18 shows the default goal-weights (for urban and rural areas) provided in the analysis tool. Table 19 shows the default measure-weights.
Scaled Performance Measures
Goal-Wise Sustainability Indicators
Overall Sustainability Indicator
Application of Measure-Weights
Application of Goal-Weights
Scaled Performance Measures
Goal-Wise Sustainability Indicators
Overall Sustainability Indicator
Application of Measure-Weights
Application of Goal-Weights
Figure 7. Application of Weights to Aggregate-Scaled Performance Measures.
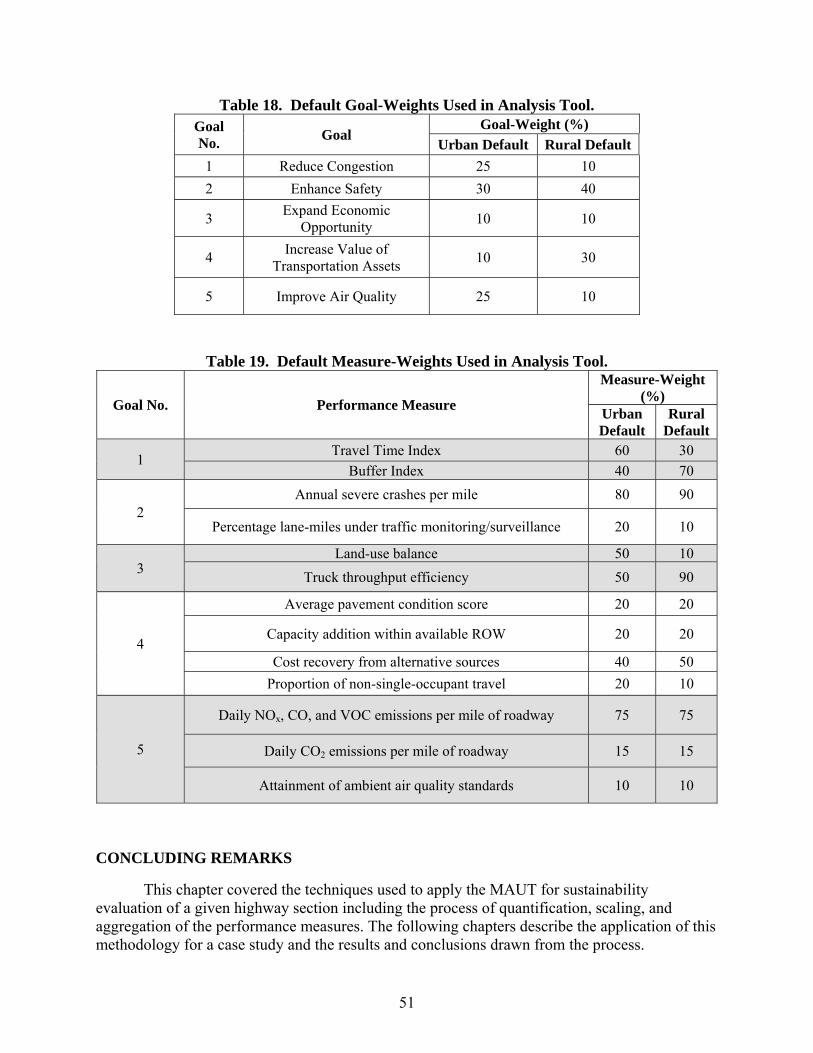
51
Table 18. Default Goal-Weights Used in Analysis Tool. Goal No. Goal
Goal-Weight (%) Urban Default Rural Default
1 Reduce Congestion 25 10 2 Enhance Safety 30 40
3 Expand Economic Opportunity 10 10
4 Increase Value of Transportation Assets 10 30
5 Improve Air Quality 25 10
Table 19. Default Measure-Weights Used in Analysis Tool.
Goal No. Performance Measure
Measure-Weight (%)
Urban Default
Rural Default
1 Travel Time Index 60 30 Buffer Index 40 70
2 Annual severe crashes per mile 80 90
Percentage lane-miles under traffic monitoring/surveillance 20 10
3 Land-use balance 50 10
Truck throughput efficiency 50 90
4
Average pavement condition score 20 20
Capacity addition within available ROW 20 20
Cost recovery from alternative sources 40 50 Proportion of non-single-occupant travel 20 10
5
Daily NOx, CO, and VOC emissions per mile of roadway 75 75
Daily CO2 emissions per mile of roadway 15 15
Attainment of ambient air quality standards 10 10
CONCLUDING REMARKS
This chapter covered the techniques used to apply the MAUT for sustainability evaluation of a given highway section including the process of quantification, scaling, and aggregation of the performance measures. The following chapters describe the application of this methodology for a case study and the results and conclusions drawn from the process.


53
CHAPTER 6:
DEVELOPMENT OF AN ANALYSIS TOOL TO IMPLEMENT SUSTAINABLITY EVALUATION METHODOLOGY
The previous chapters in this report discussed the process of defining the project scope,
understanding how sustainable transportation can be addressed within TxDOT’s goals and developing a set of sustainable transportation performance measures for highway corridors. The methodology for computation of the performance measures for a study corridor and the scaling and aggregation of measures were also discussed.
The research team developed an analysis tool to serve as a standardized platform for evaluating the performance measures and final sustainability index values. The tool is created as a menu-driven spreadsheet in Microsoft’s Excel® application. Based on user inputs of relevant data for a specific study corridor, the performance measures are evaluated. These measures are also automatically scaled (expressed on a 0-1 scale) and aggregated (based on weights assigned to each measures) to obtain the final index values, which are presented as outputs. This chapter provides a brief overview of the main features of the calculator. A detailed user manual was developed with instructions and examples and may be referred to for further details.
MAIN FEATURES OF ANALYSIS TOOL
The main aim of creating the Excel-based calculator is to combine the entire sustainability evaluation into an analysis tool that:
• is user-friendly, • is menu driven, • has clear data entry fields, • performs all the necessary computations, and • produces results in a simple and user-friendly manner.
As discussed in Chapter 5, the performance measurement framework and MAUT analysis
used in this project is applied for a corridor-level analysis to a highway “section” that is subdivided into smaller “links.” Thus, the computations and results will be presented for the entire section, as well as for individual links. In order to set up an analysis, certain initial parameters are required to be provided, such as the limits of the analysis section, number of links it is subdivided into, link lengths, and the links’ start/end points.
Based on the preliminary parameters, the analysis tool will generate data input forms that need to be filled in by the user. Using the information entered, the values of the performance measures and relevant index values will be calculated. The analysis tool produces the results summarized as tables and graphs.
Instructions and Initial Setup
The tool has a set of instructions (shown in Figure 8) that explain how to get started with the analysis. The instructions explain the color-coding scheme used to distinguish between cells that require an input value, those that are optional inputs, and those which are calculated automatically. A menu with hyperlinks (that link directly to the various worksheets in the

54
calculator) allows the user to easily access all the worksheets. Figure 9 illustrates the setup of the menu system.
Figure 8. Instructions Provided in the Analysis Tool.
Figure 9. Main Menu with Hyperlinks.
The calculator is designed to conduct the analysis for a “base case” scenario (corresponding
to existing conditions) and a “future case” scenario, and has the capability of analyzing up to three

55
future cases. Another input parameter is the number of links the roadway section is divided into for the analysis. Up to ten links can be specified. Figure 10 shows the initial step where the number of future cases, as well as the number of links, is input by the user. Then, by clicking on “create forms,” the user will be shown a set of data input forms for the required number of links and future cases.
Figure 10. Input Required to Create Data Entry Forms.
Data Input Forms
The input data need to be entered by the user into the appropriate data entry cells. Certain data elements (such as link details, lengths, ADT) are required inputs, while certain other data elements are optional inputs that the calculator has default values for. A data element entry form has been developed to aid the user in collecting the relevant data before performing the analysis. The form summarizes the data requirements and can be printed out and filled in by the user for convenience. It indicates the type of data needed, whether each data element is optional or required, and provides clarifying details where necessary. Appendix G contains a sample data entry form. Figure 11 is a screenshot of a part of a data entry sheet on the calculator. Another important user input is for the weights assigned for the individual performances measures (measure-weights), as well as for TxDOT’s strategic goals (goal-weights). The user has the option of using the default set of weights by specifying if the study area is urban or rural or providing another set of weights.

56
Figure 11. Example of Data Entry Sheets (Filled in).
Generation of Output Data: Executive Summaries and Graphs
Once all the necessary data have been entered, the calculator performs all the calculations and generates the output. The individual performance measure values, the scaled performance measures, as well as the aggregated index values are calculated and tabulated for the base and future cases. The results are provided for individual links, as well as for the entire section. Goal-wise indices are also generated to enable analysis of whether specific TxDOT goals are being achieved in a sustainable manner. The results are summarized and presented in the form of “executive summary tables” and also displayed graphically.
There are three types of executive summary tables, one for goal-wise performance (Figure 12), one that summarizes link-wise measure values (Figure 13), and another that summarizes the scaled measure values (Figure 14). The summaries for link-wise and scaled measure values also indicate whether the future values of the measures have increased or decreased with the use of colored arrows (red/green) that indicate whether the change is for the better or worse. The graphical outputs from the analysis tool include graphs for the aggregate index value for each link (Figure 15) and the goal-wise index values (Figure 16).

57
Figure 12. Executive Summary Worksheet for Goal-Wise Performance.
Figure 13. Executive Summary Worksheet for Individual Links.

58
Figure 14. Executive Summary Worksheet for Scaled Measures.
Figure 15. Graph for Index Values by Link.
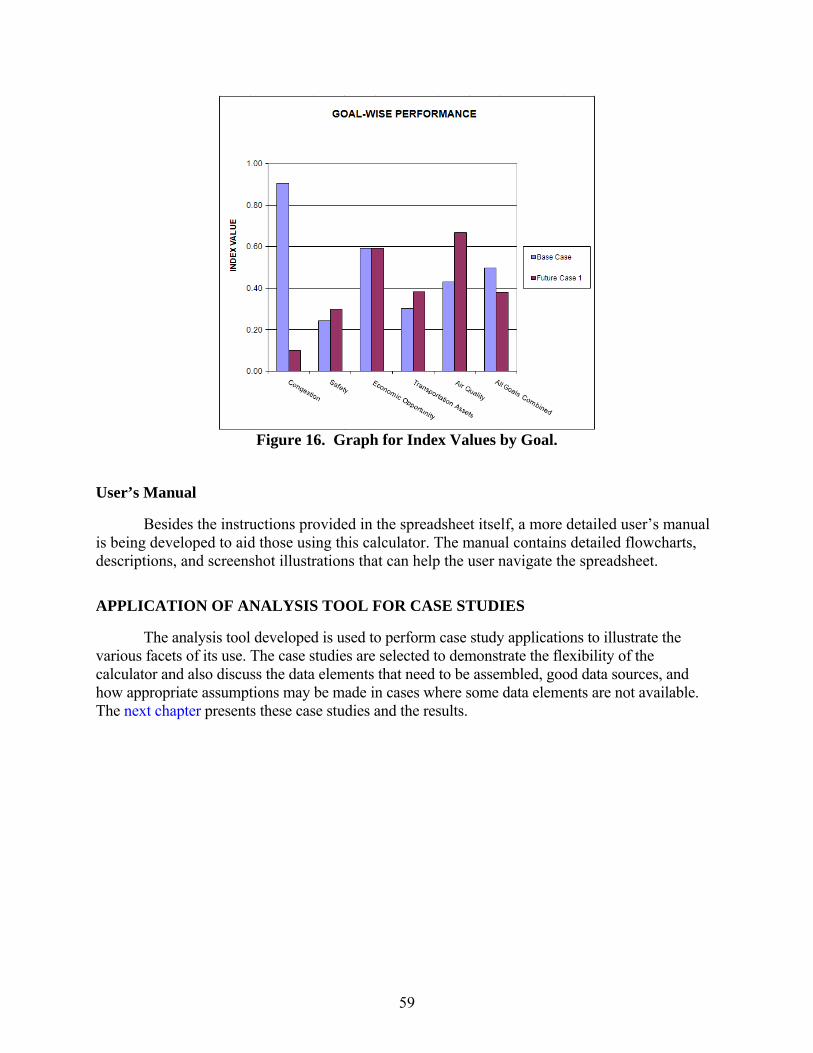
59
Figure 16. Graph for Index Values by Goal.
User’s Manual
Besides the instructions provided in the spreadsheet itself, a more detailed user’s manual is being developed to aid those using this calculator. The manual contains detailed flowcharts, descriptions, and screenshot illustrations that can help the user navigate the spreadsheet.
APPLICATION OF ANALYSIS TOOL FOR CASE STUDIES
The analysis tool developed is used to perform case study applications to illustrate the various facets of its use. The case studies are selected to demonstrate the flexibility of the calculator and also discuss the data elements that need to be assembled, good data sources, and how appropriate assumptions may be made in cases where some data elements are not available. The next chapter presents these case studies and the results.

61
CHAPTER 7: CASE STUDY APPLICATIONS OF ANALYSIS TOOL
A total of three case studies were performed as initial pilot applications for the analysis
tool. The aim of these case studies was to illustrate how data are to be assembled and the use of the analysis tool. Conducting the pilot tests allowed examination of the outputs, in terms of both specific performance measures and the overall index values. The pilot tests also illustrated how the data requirements can be approached and how reasonable assumptions may be made in cases where complete data are not available. Three pilot corridors were selected: one which is mostly rural in nature, one which is in a highly urbanized setting, and another with both rural and urban components. The pilot corridors were selected based on discussions with the PMC and are as follows:
• A 15-mile stretch of US Highway 281 (US-281) in San Antonio, Texas; • A 13-mile stretch of US Highway 290 (US-290), in Houston, Texas; and • A 14-mile stretch of Interstate Highway 27 (IH-27), in Amarillo, Texas.
The following sections discuss the setup and results from each of these case studies. The
findings from the first case study conducted, for US-281 in San Antonio, are presented in great detail. Since the other two case studies follow a similar methodology as the US-281 case, the individual inputs and results are presented in brief with a comprehensive discussion of findings.
On completion of the three case studies, it was observed that the performance measures used for the congestion goal were not very sensitive when nearing the “worst case scenario” (for example, in the Houston case study). Also, it was felt that conducting these analyses in a project-specific manner and looking at “build” versus “no-build” alternatives in the future would be a useful exercise. So, the research team made slight modifications to the scaling of the congestion measure and performed three application examples for the use of the analysis tool. This section also describes the findings from these additional applications.
CASE STUDY 1: US HIGHWAY 281, SAN ANTONIO
Description of Study Section
A 15-mile section of US-281 in San Antonio, Texas, was chosen as the study corridor. The sustainability evaluation was performed for this highway using the analysis tool. Figure 17 shows a map of the study section.

62
Figure 17. Location of Study Corridor for US-281 Case Study.
The study section on US-281 is entirely located in Bexar County, Texas. It stretches from
IH-410 in downtown San Antonio in the south to the Comal/Bexar county line in the north. The section from IH-410 to Loop 1604 (a distance of approximately seven miles) is fully access controlled, comprised of three lanes per direction with a concrete barrier in the median. The remaining section from Loop 1604 to the Comal/Bexar county line is a divided facility with limited at-grade access, having three lanes per direction for two miles and two lanes per direction beyond that point. Next to the San Antonio International Airport, the corridor is predominately dense commercial development. North of Loop 1604, the development becomes less dense with pockets of commercial development (mainly retail). At the northern end of the corridor, at the Bexar/Comal county line, the development becomes sparser with occasional lower density residential developments and small retail outlets. Figures 18 and 19 illustrate how the character of the study section changes farther away from downtown San Antonio.
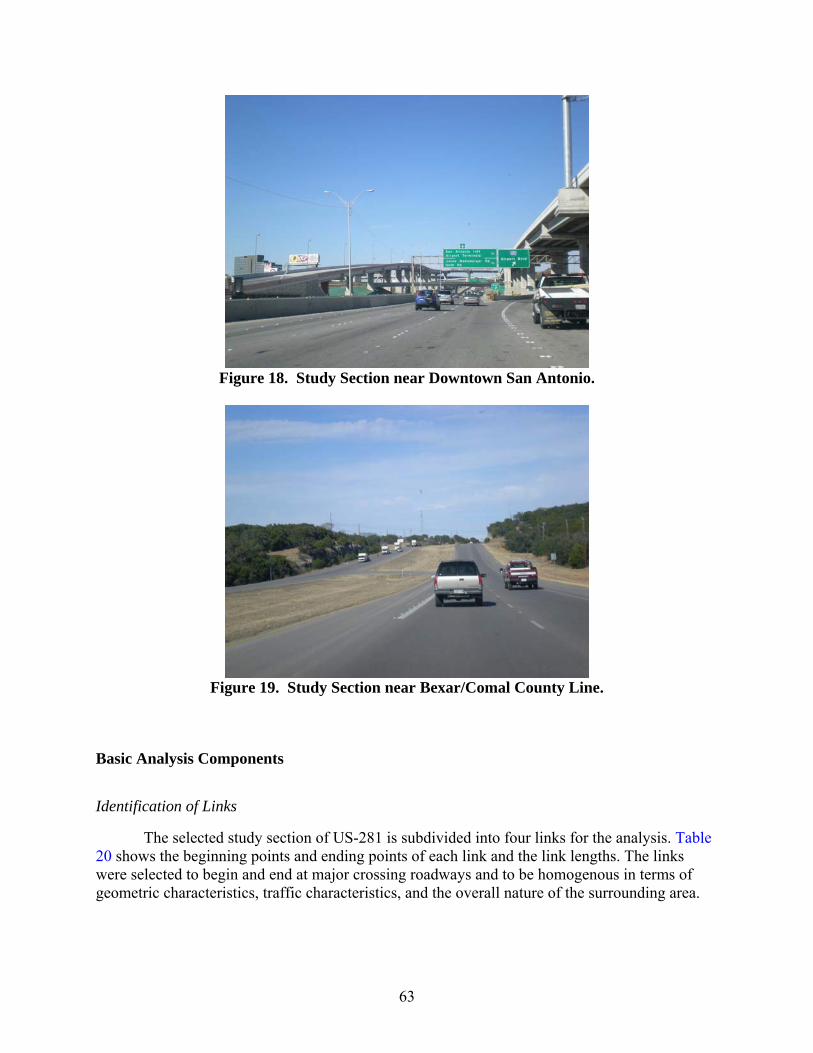
63
Figure 18. Study Section near Downtown San Antonio.
Figure 19. Study Section near Bexar/Comal County Line.
Basic Analysis Components
Identification of Links
The selected study section of US-281 is subdivided into four links for the analysis. Table 20 shows the beginning points and ending points of each link and the link lengths. The links were selected to begin and end at major crossing roadways and to be homogenous in terms of geometric characteristics, traffic characteristics, and the overall nature of the surrounding area.
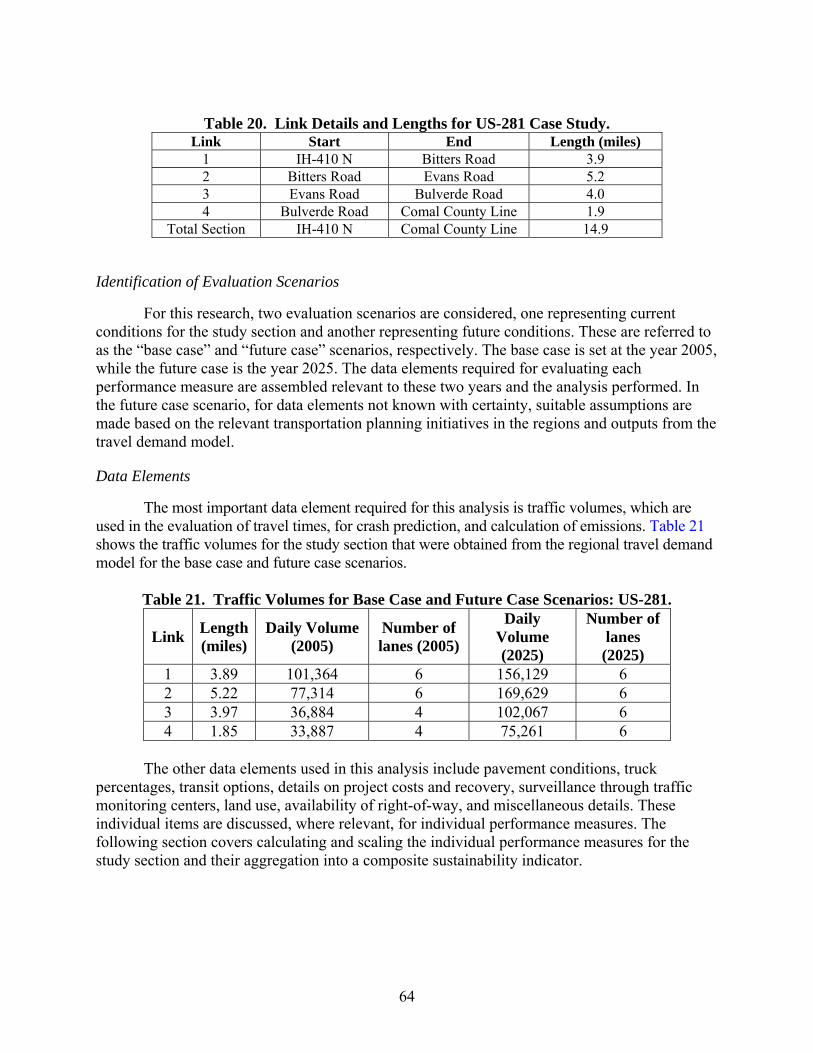
64
Table 20. Link Details and Lengths for US-281 Case Study.
Link Start End Length (miles) 1 IH-410 N Bitters Road 3.9 2 Bitters Road Evans Road 5.2 3 Evans Road Bulverde Road 4.0 4 Bulverde Road Comal County Line 1.9
Total Section IH-410 N Comal County Line 14.9
Identification of Evaluation Scenarios
For this research, two evaluation scenarios are considered, one representing current conditions for the study section and another representing future conditions. These are referred to as the “base case” and “future case” scenarios, respectively. The base case is set at the year 2005, while the future case is the year 2025. The data elements required for evaluating each performance measure are assembled relevant to these two years and the analysis performed. In the future case scenario, for data elements not known with certainty, suitable assumptions are made based on the relevant transportation planning initiatives in the regions and outputs from the travel demand model.
Data Elements
The most important data element required for this analysis is traffic volumes, which are used in the evaluation of travel times, for crash prediction, and calculation of emissions. Table 21 shows the traffic volumes for the study section that were obtained from the regional travel demand model for the base case and future case scenarios.
Table 21. Traffic Volumes for Base Case and Future Case Scenarios: US-281.
Link Length (miles)
Daily Volume (2005)
Number of lanes (2005)
Daily Volume (2025)
Number of lanes (2025)
1 3.89 101,364 6 156,129 6 2 5.22 77,314 6 169,629 6 3 3.97 36,884 4 102,067 6 4 1.85 33,887 4 75,261 6
The other data elements used in this analysis include pavement conditions, truck
percentages, transit options, details on project costs and recovery, surveillance through traffic monitoring centers, land use, availability of right-of-way, and miscellaneous details. These individual items are discussed, where relevant, for individual performance measures. The following section covers calculating and scaling the individual performance measures for the study section and their aggregation into a composite sustainability indicator.

65
Calculation and Scaling of Individual Measures
Travel Time Index
Speed estimation procedures are used to calculate the peak travel speeds for individual links, and the estimates are used to derive the peak travel times. Tables 22 and 23 show the calculated and scaled performance measures for the base case and future case, respectively.
Table 22. Travel Time Index for Base Case Scenario: US-281.
Link Travel Time for
Posted Speed Limit (mins)
Travel Time for Peak Conditions
(mins)
Travel Time Index
Scaled Measure
1 3.89 4.26 1.09 0.81 2 4.82 4.82 1.00 1.00 3 3.66 3.66 1.00 1.00 4 1.71 1.71 1.00 1.00
Total Section 1.04 0.92
Table 23. Travel Time Index for Future Case Scenario: US-281.
Link Travel Time for
Posted Speed Limit (mins)
Travel Time for Peak Conditions
(mins)
Travel Time Index
Scaled Measure
1 3.89 6.14 1.58 0.00 2 4.82 8.95 1.86 0.00 3 3.66 4.36 1.19 0.62 4 1.71 1.85 1.08 0.83
Total Section 1.52 0.00
The tables show that the Travel Time Index values are much higher for the future case scenario, which is expected due to the higher traffic volumes. Also, for the base case scenario, the Travel Time Index values obtained from the speed curves indicate uncongested travel for Links 2, 3, and 4. If real travel time data were to be used, the calculated travel time indices would be slightly higher. This difference is due to the macroscopic nature of the speed estimation model. However, the speed estimation used here is preferred over measuring travel times, as it provides a common methodology for the base case and future case scenarios, allowing for comparison of the two.
Buffer Index
The Buffer Index is calculated based on the relationship with the Travel Time Index. Table 24 shows the calculated Buffer Index values and the scaled performance measures. Similar to the Travel Time Index, the Buffer Index is also higher for the future case scenario, indicating decreased reliability of travel.

66
Table 24. Measured Values and Scaled Values for Buffer Index: US-281.
Link Base Case Future Case Buffer Index Scaled Value Buffer Index Scaled Value
1 0.19 0.71 0.64 0.01 2 0.00 1.00 0.64 0.01 3 0.00 1.00 0.35 0.46 4 0.00 1.00 0.17 0.74
Total Section 0.08 0.88 0.51 0.21
Annual Severe Crashes per Mile
The analysis of crashes is based on the roadway type. For the base case scenario, Links 3 and 4 (Evans Road to Comal County Line) were evaluated as rural highways, while Links 1 and 2 were evaluated as freeways. Links 3 and 4 represent the portions that currently have at-grade access and lower traffic volumes. For the future case scenario, the travel demand model outputs show increased volumes by considering an increased number of lanes for Links 3 and 4. Additionally, regional transportation plans have indicated that the entire section of US-281 to the Comal County line will be upgraded to expressway standards in the future. Thus, in the future case scenario, all links are assumed as freeways. Table 25 shows the performance measures and the scaled values.
Table 25. Measured Values and Scaled Values for Annual Severe Crashes: US-281.
Link
Base Case Future Case Annual Severe
Crashes per Mile
Scaled Measure
Annual Severe Crashes per
Mile
Scaled Measure
1 13.32 0.42 20.52 0.11 2 10.16 0.56 22.29 0.03 3 11.31 0.00 13.41 0.42 4 7.80 0.00 9.89 0.57
Total Section 10.99 0.30 17.93 0.22
The results show that safety performance is improved in the future, despite increased traffic volumes in the study section. This is mainly due to the increased number of lanes on Links 3 and 4. It can be seen that for Links 3 and 4, despite an increase in overall crashes, the scaled measure values are improved. This is because the scaling extremes are based on the number of lanes, and Links 3 and 4 have an increased number of lanes in the future scenario, resulting in higher number of crashes for the corresponding worst case.
Percentage Lane-Miles under TMC Surveillance
The TMC monitoring program in San Antonio, TransGuide, currently covers US-281 only south of the study section. However, the ultimate coverage area for TransGuide extends to the north of Loop 1604 on US-281 (corresponding to Links 1 and 2). Thus for evaluating this performance measure, no TMC surveillance was considered for the base case scenario, and

67
surveillance was considered as present for Links 1 and 2 in the future case scenario. Table 26 shows the tabulated and scaled measure values.
Table 26. Percentage Lane-Miles under TMC Surveillance: US-281.
Link Base Case Future Case
Measure Value Scaled Value Measure Value Scaled Value 1 0.00 0.00 100.00 1.00 2 0.00 0.00 100.00 1.00 3 0.00 0.00 0.00 0.00 4 0.00 0.00 0.00 0.00
Total Section 0.00 0.00 61.02 0.61
Land-Use Balance
The input details for the base case are obtained from parcel-based GIS data of current land use. In this data, certain unoccupied land areas are classified as “developable” and sub-classified as “commercial” or “residential”. In the base case, this land is classified as “Institutional/Public”, and in the absence of a future land-use plan, it is assumed that all of this land is occupied by the designated use in the future scenario (i.e., it becomes fully developed as per the land-use plan). Thus, the land use shifts to a greater proportion of commercial and residential uses. Tables 27 and 28, respectively, show the land-use details and calculated measures for the base case and future case scenarios. In this case, the calculated performance measure also represents the scaled value.
Table 27. Land-Use Balance for Base Case Scenario: US-281.
Link Area in Half-Mile to Either Side (sq. miles) Land-Use
Balance Residential Commercial/ Industrial
Institutional/ Public
1 0.68 2.23 0.50 0.80 2 2.41 1.37 0.66 0.89 3 1.63 1.10 1.00 0.98 4 0.75 0.09 0.95 0.78
Total Section 5.48 4.80 3.11 0.98
Table 28. Land-Use Balance for Future Case Scenario: US-281.
Link Area in Half-Mile to Either Side (sq. miles) Land-Use
Balance Residential Commercial/ Industrial
Institutional/ Public
1 0.69 2.27 0.45 0.78 2 2.49 1.71 0.25 0.78 3 1.81 1.65 0.27 0.82 4 0.79 0.19 0.81 0.87
Total Section 5.79 5.83 1.78 0.90
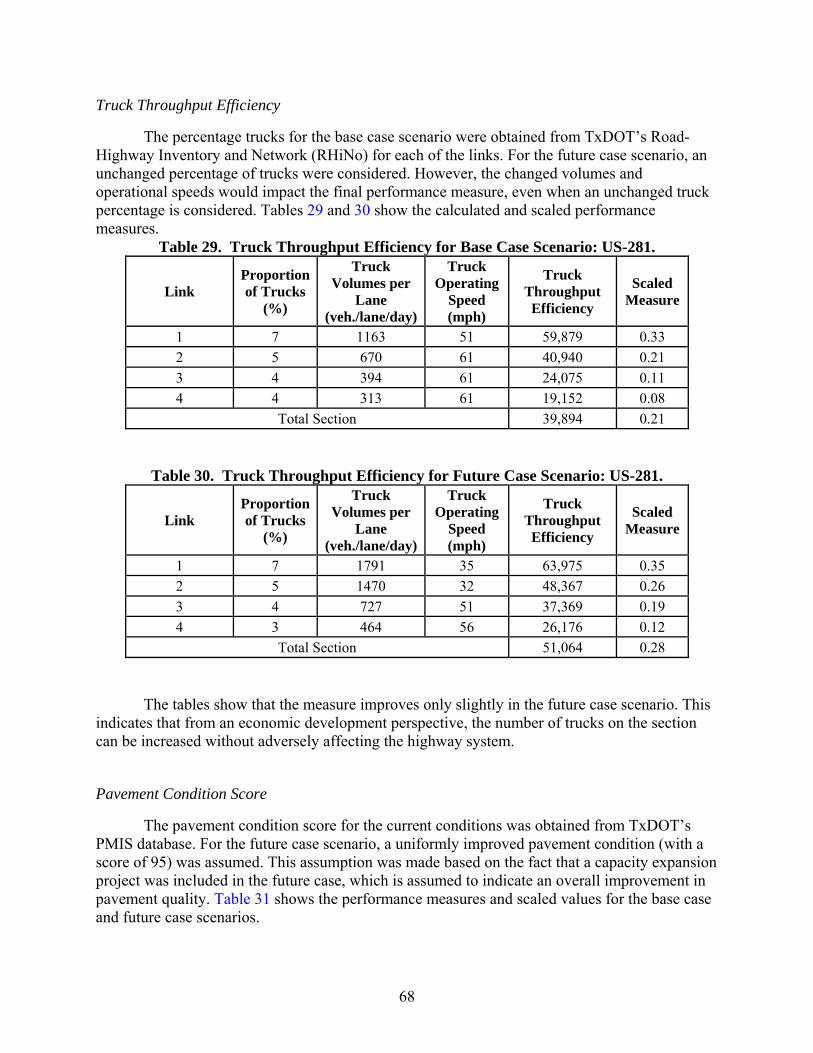
68
Truck Throughput Efficiency
The percentage trucks for the base case scenario were obtained from TxDOT’s Road-Highway Inventory and Network (RHiNo) for each of the links. For the future case scenario, an unchanged percentage of trucks were considered. However, the changed volumes and operational speeds would impact the final performance measure, even when an unchanged truck percentage is considered. Tables 29 and 30 show the calculated and scaled performance measures.
Table 29. Truck Throughput Efficiency for Base Case Scenario: US-281.
Link Proportion of Trucks
(%)
Truck Volumes per
Lane (veh./lane/day)
Truck Operating
Speed (mph)
Truck Throughput Efficiency
Scaled Measure
1 7 1163 51 59,879 0.33 2 5 670 61 40,940 0.21 3 4 394 61 24,075 0.11 4 4 313 61 19,152 0.08
Total Section 39,894 0.21
Table 30. Truck Throughput Efficiency for Future Case Scenario: US-281.
Link Proportion of Trucks
(%)
Truck Volumes per
Lane (veh./lane/day)
Truck Operating
Speed (mph)
Truck Throughput Efficiency
Scaled Measure
1 7 1791 35 63,975 0.35 2 5 1470 32 48,367 0.26 3 4 727 51 37,369 0.19 4 3 464 56 26,176 0.12
Total Section 51,064 0.28
The tables show that the measure improves only slightly in the future case scenario. This indicates that from an economic development perspective, the number of trucks on the section can be increased without adversely affecting the highway system.
Pavement Condition Score
The pavement condition score for the current conditions was obtained from TxDOT’s PMIS database. For the future case scenario, a uniformly improved pavement condition (with a score of 95) was assumed. This assumption was made based on the fact that a capacity expansion project was included in the future case, which is assumed to indicate an overall improvement in pavement quality. Table 31 shows the performance measures and scaled values for the base case and future case scenarios.

69
Table 31. Pavement Condition Score: US-281.
Link Base Case Future Case
Measure Value Scaled Value Measure Value Scaled Value 1 89 0.89 95 0.95 2 77 0.77 95 0.95 3 100 1.00 95 0.95 4 100 1.00 95 0.95
Total Section 89 0.89 95 0.95
Capacity Addition within ROW
Capacity addition within the available ROW is not possible for Links 1 and 2 (which have a raised barrier median and fairly dense development along the roadway). Links 3 and 4, however, have adequate median width for capacity addition. For the future case scenario, it is assumed that some of this area is used for added capacity, thereby reducing the available area in the future. It can be noted that in this analysis, the trade-off between safety performance and loss of median width would be reflected by the respective performance measures if the crash estimation makes use of the accident modification factor for median width (discussed in further detail in Appendix D). Table 32 shows the possible lane additions and the calculated performance measure values for the base case and future case scenarios. In this case, the performance measure value also represents the scaled measure.
Table 32. Capacity Addition within Available ROW: US-281.
Link Number of Lanes that can be added within available ROW Performance Measure Value
Base Case Future Case Base Case Future Case 1 0 0 0 0 2 0 0 0 0 3 3 1 0.75 0.25 4 4 2 1 0.5
Total Section 0.32 0.13
Cost Recovery from Alternate Sources
The roadway is currently a free roadway operated by TxDOT. There are future plans to expand the section of the road beyond Loop 1604 and operate it as a toll road. The project cost is estimated at $300 million, of which over $100 million is to be contributed by the local MPO. Significant toll revenue is expected to be generated from this project (46). Based on these details, the measure is estimated for the base case and future case scenarios. Table 33 shows the measure values for the base case and future case scenarios. The measure improves in the future owing to recovery of expenses through tolling for Links 3 and 4. The estimation of this performance measure results in a recovery factor value (a proportion of costs) that is on a 0 to 1 scale. Thus, the measure can be estimated for the entire section as the length-weighted average of the individual link values, even if the actual costs incurred are significantly different for different links.

70
Table 33. Cost Recovery from Alternate Sources: US-281.
Link
Base Case Future Case Proportion of Capital Covered
Proportion of O&M Covered
Measure Value
Proportion of Capital Covered
Proportion of O&M Covered
Measure Value
1 0 0 0.00 0 0 0.00 2 0 0 0.00 0 0 0.00 3 0 0 0.00 0.25 1 0.7 4 0 0 0.00 0.25 1 0.7
Total Section 0.00 0.27
Proportion of Total Person-Miles of Travel in Non-SOVs
Currently, the San Antonio metropolitan transportation agency (VIA Transit) provides a regular bus service on Links 1 and 2 of the study section. The route runs from approximately 5:45 a.m. to 8:30 p.m., with a daily frequency of approximately 30 buses. (The average occupancy assumed for each bus is obtained from the 2005 National Transit Database statistics for VIA Transit. It is calculated as the ratio of total passenger miles traveled to total vehicle revenue miles for the agency, which approximately equals 9.5.) For the future case scenario, an extended bus service for all links is considered, with the same frequency of service. Rail facilities are not considered in either scenario. For both scenarios, general-purpose lane occupancy of 1.25 is considered to calculate person-miles of non-SOV travel. Tables 34 and 35, respectively, show the calculated measure and scaled values for the base case and future case scenarios. It can be seen that the added transit service provides an almost negligible contribution to the total person-miles of travel in the study compared to non-SOV auto travel, as indicated by the fact that the measure does not vary much from link to link or from the base and the future.
Table 34. Proportion of Non-SOV Travel - Base Case Scenario: US-281.
Link
Total Daily SOV PMT
Total Daily Non-SOV PMT
Proportion of PMT by Non-SOV
Scaled Measure
1 295,730 198,262 40% 0.29 2 302,685 203,278 40% 0.29 3 109,823 73,216 40% 0.29 4 47,018 31,345 40% 0.29
Total Section 755,256 506,100 40% 0.29

71
Table 35. Proportion of Non-SOV Travel - Future Case Scenario: US-281.
Link
Total Daily SOV PMT
Total Daily Non-SOV
PMT
Proportion of PMT by Non-SOV
Scaled Measure
1 455,505 304,779 40% 0.29 2 664,099 444,220 40% 0.29 3 303,905 203,735 40% 0.29 4 104,424 70,143 40% 0.29
Total Section 1,527,934 1,022,878 40% 0.29
Daily NOx, CO, and VOC Emissions
The emissions are calculated based on emissions rates obtained from MOBILE6, peak and off-peak traffic speeds, and the split of traffic between peak and off-peak times. The emissions for each of the pollutants are combined based on their damage costs to obtain a composite measure. For the base case scenario, it is estimated that 35 percent of the traffic occurs during peak conditions (these data are obtained from analysis of hourly traffic counts along the corridor), while for the future case scenario, 50 percent of the traffic occurs during peak conditions (owing to increased congestion). Tables 36 and 37 show the calculated measure values and the scaled measure values.
Table 36. VOC, NOx, and CO Emissions for the Base Case Scenario: US-281.
Link
Total Daily Emissions (grams/mile) Combined
Emissions (grams/
mile)
Scaled Measure VOC NOx CO
Relative Weight 0.42 0.56 0.02
1 26,802 192,204 805,097 131,422 0.13 2 18,545 176,126 678,235 116,954 0.22 3 8,847 84,024 323,566 55,796 0.63 4 8,128 77,196 297,270 51,261 0.67
Total Section 16,827 143,566 569,774 96,321 0.36
Table 37. VOC, NOx, and CO Emissions for the Future Case Scenario: US-281.
Link
Total Daily Emissions (grams/mile) Combined
Emissions (grams/
mile)
Scaled Measure VOC NOx CO
Relative Weight 0.42 0.56 0.02
1 20,027 43,118 571,937 41,478 0.73 2 21,483 48,919 642,904 46,440 0.70 3 11,227 30,414 419,367 28,272 0.82 4 8,038 22,919 317,706 21,152 0.87
Total Section 16,710 39,265 524,678 37,183 0.76
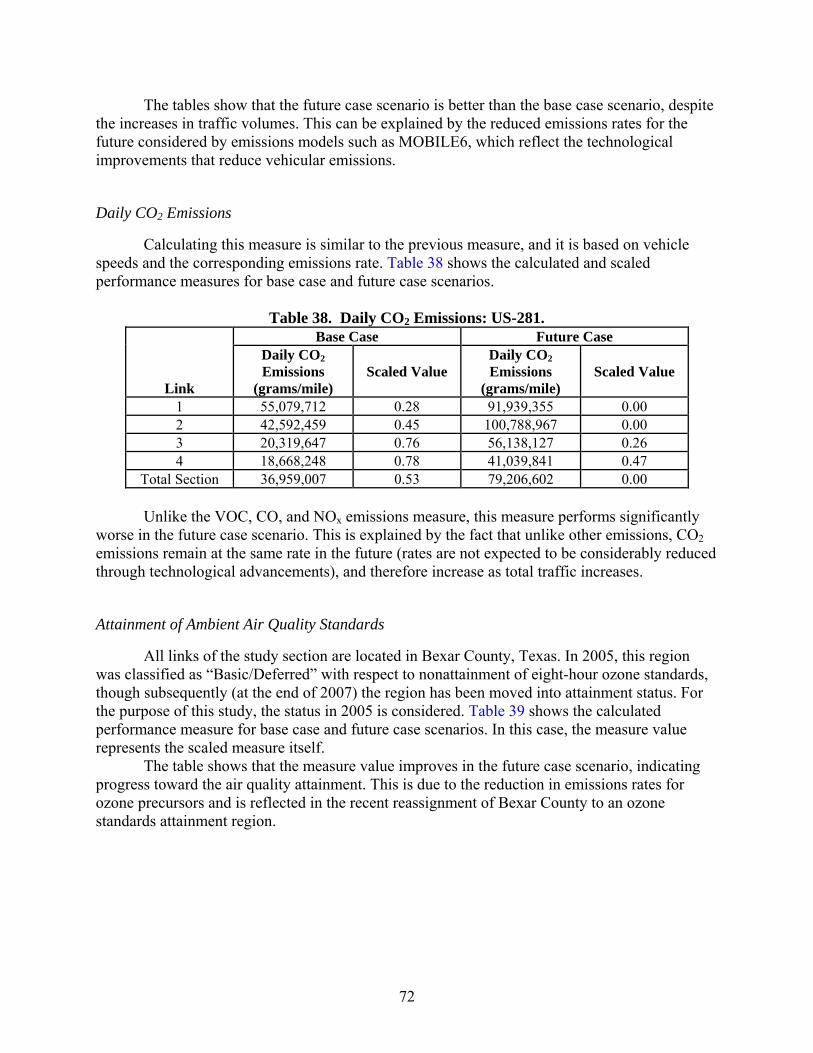
72
The tables show that the future case scenario is better than the base case scenario, despite the increases in traffic volumes. This can be explained by the reduced emissions rates for the future considered by emissions models such as MOBILE6, which reflect the technological improvements that reduce vehicular emissions.
Daily CO2 Emissions
Calculating this measure is similar to the previous measure, and it is based on vehicle speeds and the corresponding emissions rate. Table 38 shows the calculated and scaled performance measures for base case and future case scenarios.
Table 38. Daily CO2 Emissions: US-281.
Link
Base Case Future Case Daily CO2 Emissions
(grams/mile) Scaled Value
Daily CO2 Emissions
(grams/mile) Scaled Value
1 55,079,712 0.28 91,939,355 0.00 2 42,592,459 0.45 100,788,967 0.00 3 20,319,647 0.76 56,138,127 0.26 4 18,668,248 0.78 41,039,841 0.47
Total Section 36,959,007 0.53 79,206,602 0.00
Unlike the VOC, CO, and NOx emissions measure, this measure performs significantly worse in the future case scenario. This is explained by the fact that unlike other emissions, CO2 emissions remain at the same rate in the future (rates are not expected to be considerably reduced through technological advancements), and therefore increase as total traffic increases.
Attainment of Ambient Air Quality Standards
All links of the study section are located in Bexar County, Texas. In 2005, this region was classified as “Basic/Deferred” with respect to nonattainment of eight-hour ozone standards, though subsequently (at the end of 2007) the region has been moved into attainment status. For the purpose of this study, the status in 2005 is considered. Table 39 shows the calculated performance measure for base case and future case scenarios. In this case, the measure value represents the scaled measure itself.
The table shows that the measure value improves in the future case scenario, indicating progress toward the air quality attainment. This is due to the reduction in emissions rates for ozone precursors and is reflected in the recent reassignment of Bexar County to an ozone standards attainment region.

73
Table 39. Attainment of Ambient Air Quality Standards: US-281.
Link Current Measure
Value
Reduction in Daily Ozone Precursor
Emissions in Future
(grams/mile)
Maximum Possible Daily
Reduction (grams/mile)
Relative Reduction in
Emissions
Future Measure
Value
1 0.8 87,697 165,963 0.53 1.00 2 0.8 71,066 165,963 0.43 1.00 3 0.8 29,458 165,963 0.18 0.97 4 0.8 30,902 165,963 0.19 0.98
Total Section 0.8 - - - 0.99
Combined Results of Sustainability Evaluation
The individual scaled performance measures (each expressed on a 0 to 1 scale) are combined as weighted sums to obtain overall sustainability evaluation results. To obtain goal-wise performance, the measure-weights are applied to individual measures within each goal. The default weights for urban case provided in the analysis tool were used. The goal-wise index values are then combined based on the goal weights to obtain an overall sustainability evaluation.
Table 40 shows the results of the goal-wise evaluation for the entire section, and Figure 20 shows these results graphically. The table shows that the performance on the safety goal, value of transportation assets and air quality goal improves, while goal 3 (expand economic opportunity) remains almost unchanged. The goal area experiencing the most significant reduction in performance is the congestion goal, indicating that steps need to be taken toward congestion mitigation on this study corridor.
Table 40. Goal-Wise Sustainability Indicators for Entire Study Section: US-281.
Goal Reduce Congestion
Enhance Safety
Expand Economic
Opportunity
Increase Value of Transportation
Assets
Improve Air Quality
All Goals Combined
Base Case 0.91 0.24 0.59 0.30 0.43 0.50 Future Case 0.08 0.30 0.59 0.38 0.67 0.37
Percentage Change -90.7% 22.3% -0.4% 27.1% 55.0% -24.5%

74
GOAL-WISE PERFORMANCE
0.00
0.20
0.40
0.60
0.80
1.00
Congestion Safety EconomicOpportunity
TransportationAssets
Air Quality
IND
EX V
ALU
E
Base CaseFuture Case
Figure 20. Graphical Representation of Goal-Wise Performance for US-281 Case Study.
Goal-weights and measure-weights can also be applied to the scaled measures for
individual links to assess performance by link. Table 41 shows the overall sustainability indicator values for the base and future cases for individual links. Figure 21 shows this performance graphically. The results show that there is a reduction in the overall sustainability indicator value for the future case scenario when compared to the base case scenario for the first two links, which are closer to downtown San Antonio. While these links are the most congested and have the highest volumes, the fact that they are located closer to the city center makes it easier to address the issue of sustainability by providing alternate transportation facilities. The final two links have a better sustainability indicator value for the future scenario than for the current. This is possibly due to lower traffic volumes affecting the economic-related measures in the base case. Also, the increase in volumes in the future may not have been to an extent that adversely impacts safety, congestion, or environmental factors.
Table 41. Link-Wise Sustainability Indicator Values for US-281 Case Study. Link Base Case Future Case
1 0.43 0.33 2 0.54 0.30 3 0.51 0.54 4 0.51 0.65
Total Section 0.50 0.37

75
AGGREGATE INDEX VALUES-BY LINK
0.00
0.20
0.40
0.60
0.80
1.00
1 2 3 4 TotalSection
LINK NUMBER
IND
EX V
ALU
E
Base Case
Future Case
Figure 21. Graphical Representation of Link-Wise Results for US-281 Case Study.
From a sustainability perspective, the most damaging aspect in the future case scenario is
due to the increase in traffic volumes that affect congestion, safety, and greenhouse gas emissions. However, there is some mitigation of these impacts due to technological advancements that reduce toxic emissions and due to the expansion of ITS facilities. Addition of more transit facilities, leveraging of alternate funding, and the importance of asset management are also highlighted in the results. For the case study corridor, links that performed worse than average are identified. Goal-wise progress was assessed to see which goals were not being met and help identify how to achieve them in a sustainable manner.
CASE STUDY 2: US HIGHWAY 290, HOUSTON
The study section runs approximately northwest-southeast, from the interchange with FM 1960 at one end to the interchange with IH-610 at the other. This case study is a highly urbanized setting. The entire section has 3 lanes in each direction, with a median HOV lane and controlled access throughout. The location is characterized by high traffic volumes and fairly dense land uses in the surrounding areas. The entire corridor is located in Harris County, Texas. Figure 22 contains a map highlighting the corridor location. Figure 23 shows recent photographs of the study corridor.

76
Figure 22. Location of Study Corridor for US-290 Case Study.
The base case evaluation used data from 2006. The traffic volumes and other relevant elements were obtained from TxDOT’s inventory data. For this case study, data for the future case scenarios were obtained from a Major Investment Study (MIS) conducted for the corridor by TxDOT’s Houston District (47). Two future case scenarios were evaluated, corresponding to two conceptual alternatives outlined in the MIS report. The first alternative considered retaining the HOV lane with increased bus service on it, while the second considered addition of high-capacity transit (assumed as light rail) along the corridor. Both future alternatives involved
Figure 23. US-290 Study Corridor.

77
addition of one through lane in each direction. Appendix H provides further details on the data inputs for this case study.
Figures 24 and 25 indicate the graphical results from the analysis tool for the US-290 case study. It can be seen that the results for individual links do not vary much when compared to the results from the US-281 case study (where different links exhibited vastly different results). This is due to the entire section being in a highly urbanized area and having very similar traffic characteristics. In terms of goal-wise performance, the performance with respect to congestion was the worst (=0) for base, as well as future cases, despite the added capacity and enhanced transit in the future. The only goal that significantly improved is the air quality. This can be attributed to the reduced emissions rates considered for future cases, which negated the effect of increased traffic volumes. It can be seen that there was not much of a difference between the two alternate future cases considered, both from a link-wise and goal-wise perspective.
AGGREGATE INDEX VALUES-BY LINK
0.00
0.20
0.40
0.60
0.80
1.00
1 2 3 4 5 TotalSection
LINK NUMBER
IND
EX V
ALU
E
Base Case
Future Case 1 Future Case 2
Figure 24. Link-Wise Outputs for US-290 Case Study.
GOAL-WISE PERFORMANCE
0.00
0.20
0.40
0.60
0.80
1.00
Congestion Safety EconomicOpportunity
TransportationAssets
Air Quality All GoalsCombined
INDE
X VA
LUE
Base CaseFuture Case 1Future Case 2
Figure 25. Goal-Wise Outputs for US-290 Case Study.

78
CASE STUDY 3: INTERSTATE HIGHWAY 27, AMARILLO
This corridor runs approximately north-south, from the interchange with Western Street in the north to the interchange with State Highway 217 in the south. The entire section is two lanes in each direction with controlled access through interchanges. The location is from the city of Amarillo in the north to outside the city limits in the south and was selected as the rural case study. The surrounding areas are characterized by very sparse and low-density development. Traffic volumes in this corridor range from moderately low closer to the city of Amarillo to low volumes at the southern end. Figure 26 shows a map highlighting the corridor location. The entire study corridor is located in Randall County, Texas. Figure 27 shows photographs of the study corridor.
Figure 26. IH-27, Amarillo, Randall County.
Figure 27. IH-27 Study Corridor.

79
For this case study, the daily traffic volumes were obtained from a traffic analysis report for the study corridor conducted by TxDOT for the 2002 (base case) to 2022 (future case) period. For the base conditions, a small section on the north of the study corridor had three lanes in each direction, while the rest of the section had two lanes in each direction. There is an expansion planned to increase the number of lanes to three in each direction for the entire study section. This expanded configuration was considered for the future case. Other data required were assembled from various sources and appropriate assumptions/inferences made. Appendix H provides further details on the data inputs for this case study.
Figures 28 and 29 show the graphical results from the analysis tool for the IH-27 case study. As with the US-290 case, the results did not vary much between the links, which is indicative of the relative homogeneity of the link characteristics. In terms of goal-wise performance, congestion was not an issue for both the base and future cases, due to the relatively low traffic volumes. Overall there was a slight reduction in the future index values, though the performance with respect to each goal did not change significantly in the future. The results indicate that sustainability, especially with respect to the goals of safety and maintaining value of transportation assets, must be addressed in the future.
AGGREGATE INDEX VALUES-BY LINK
0.00
0.200.40
0.600.80
1.00
1 2 3 4 5 6 7 8 9
Total S
ectio
n
LINK NUMBER
IND
EX V
ALU
E
Base CaseFuture Case
Figure 28. Link-Wise Outputs for IH-27 Case Study.

80
GOAL-WISE PERFORMANCE
0.00
0.20
0.40
0.60
0.80
1.00
Congestion Safety EconomicOpportunity
TransportationAssets
Air Quality All GoalsCombined
IND
EX V
ALU
E
Base Case
Future Case
Figure 29. Goal-Wise Outputs for IH-27 Case Study.
ADDITIONAL APPLICATION EXAMPLES
As mentioned previously, the research team also used the analysis tool to conduct project-level studies for three selected roadways, as highlighted in Figure 30. Since they involved specific projects, the study sections were not split up into individual links. Each analysis included a base scenario for the current roadway conditions (referred to as the base case), a future scenario that takes into account future growth in traffic volumes, but with the same roadway configuration as the base year (referred to as the no-build future case) and a future scenario that also analyzes the new/proposed construction project (referred to as the future case/future project case). The application examples selected represent fairly high-priority projects for TxDOT. Due to the lack of sensitivity noted for the congestion measures while conducting case studies, the scaling limit (worst case) for the Travel Time Index value was changed from 1.5 to 2 for these three application examples. The graphical outputs obtained from the analysis tool are presented here to provide an overview of the results. The results indicated that the revision of scaling limits resulted in greater sensitivity at the congested end of the spectrum.
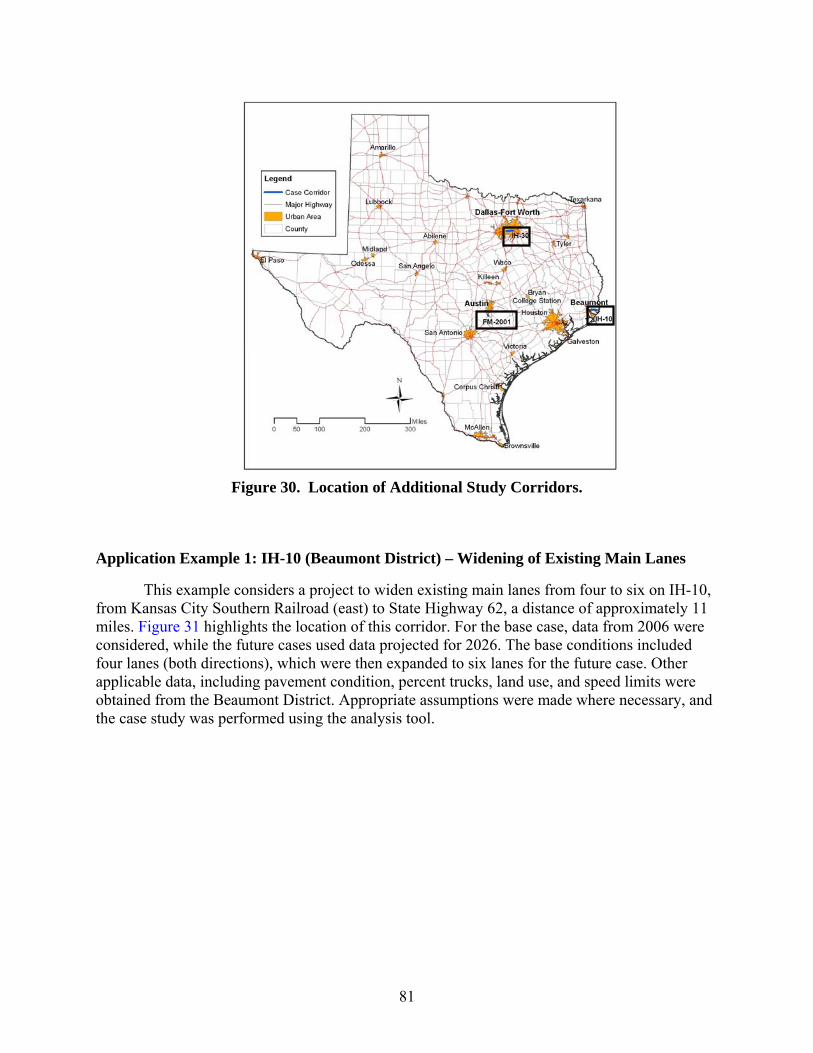
81
Figure 30. Location of Additional Study Corridors.
Application Example 1: IH-10 (Beaumont District) – Widening of Existing Main Lanes
This example considers a project to widen existing main lanes from four to six on IH-10, from Kansas City Southern Railroad (east) to State Highway 62, a distance of approximately 11 miles. Figure 31 highlights the location of this corridor. For the base case, data from 2006 were considered, while the future cases used data projected for 2026. The base conditions included four lanes (both directions), which were then expanded to six lanes for the future case. Other applicable data, including pavement condition, percent trucks, land use, and speed limits were obtained from the Beaumont District. Appropriate assumptions were made where necessary, and the case study was performed using the analysis tool.

82
Source: Googlemaps
Figure 31. IH-10 Project, Beaumont District.
Analysis Tool Outputs
Figure 32 shows the analysis tool output for goal-wise performance. It illustrates that there is a small improvement in the overall index value for the future year when compared to the base case, even for the no-build scenario. The performance with respect to the congestion goal reduces for the no-build case on account of the increase traffic volumes; and for the future project scenario, it is almost unchanged from the base case, despite the increase in the number of lanes. In terms of safety, the performance declines for both the no-build and future cases, largely on account of the increased traffic volumes. The economic opportunity measures perform well in the base case due to high levels of freight movement. However, they are reduced in both the future cases due to worsening land-use balance. The value of transportation assets remains almost unchanged and is slightly increased for the future case with the added lanes when compared to the no-build. This is because the positive impact of lane additions, the preservation of available right-of-way, is offset by zero cost recovery from alternate funding sources, and the lack of alternative/high-occupancy modes of transportation.

83
GOAL-WISE PERFORMANCE
0.00
0.20
0.40
0.60
0.80
1.00
Congestion Safety EconomicOpportunity
TransportationAssets
Air Quality All GoalsCombined
IND
EX V
ALU
E
Base CaseNo Build Future CaseFuture Case
Figure 32. Analysis Tool Output for IH-10 Project.
Figure 32 also shows that the performance with respect to the air quality measure is considerably improved in the future, regardless of the lane additions (build vs. no-build). This is largely due to the reduced emissions rates for the future case, which are a reflection of improved engine technologies in the future. This then results in an overall emissions reduction despite an increase in traffic volumes. Currently, Orange County, where the corridor is located, is in marginal nonattainment of ozone standards. Thus, the reduced future emissions have a positive impact with respect to this aspect as well. Overall it can be seen that for the future cases, there is only a marginal improvement for the future case with the added lanes over the no-build, with only the congestion goal showing any significant difference between the two.
Application Example 2: FM-2001 (Austin District) – Construction of a 4-Lane Divided Roadway
This case study considers Farm-to-Market Road 2001 (FM 2001) in Hays County, from 645 feet of the IH-35 frontage road to 960 feet south of Hillside Terrace, a distance of approximately 2.5 miles. Figure 33 highlights the study section. The roadway is currently a 2-lane rural highway, and the proposed future project will upgrade the cross section to a 4-lane divided roadway. Thus, a 2-lane roadway with traffic volumes and other data corresponding to 2006 were used for the base case. The proposed 4-lane cross-section, with projected volumes and other data for 2026, was selected for the future case. Other applicable data, including pavement condition, percent trucks, land uses, and speed limits were obtained from the Austin District. Appropriate assumptions were made where necessary, and the case study was performed using the analysis tool.

84
Source: Googlemaps
Figure 33. FM-2001 Project, Austin District.
Analysis Tool Outputs
Figure 34 shows the output from the analysis tool. It can be seen that there is an improvement in the overall index value for the future case with the added lanes when compared to the base case and to the no-build future case. The performance in terms of the congestion goal is fairly good in the base case and declines considerably for the no-build. However, the performance exceeds base levels for the future case due to the increased number of lanes. However, in terms of safety, the performance of both the base case and no-build case is zero (attributable to the 2-lane cross-section and high driveway density), and it is only improved marginally in the future case with the 4-lane divided cross-section and reduced access. The economic opportunity measures show an improved performance in the future due to increased freight movement and improved balance of land uses, though the improvement is greater for the 4-lane case than for the no-build. The value of transportation assets also increases slightly for the future case compared to the base and the no-build, due to improved pavement quality and preservation of right-of-way, despite a lack of cost recovery from alternate sources and the absence of high-occupancy modes of transportation. The air quality measures improve for both future cases, which is due to the reduced overall emissions caused by the consideration of lower emissions rates for the future as a reflection of technological improvements.
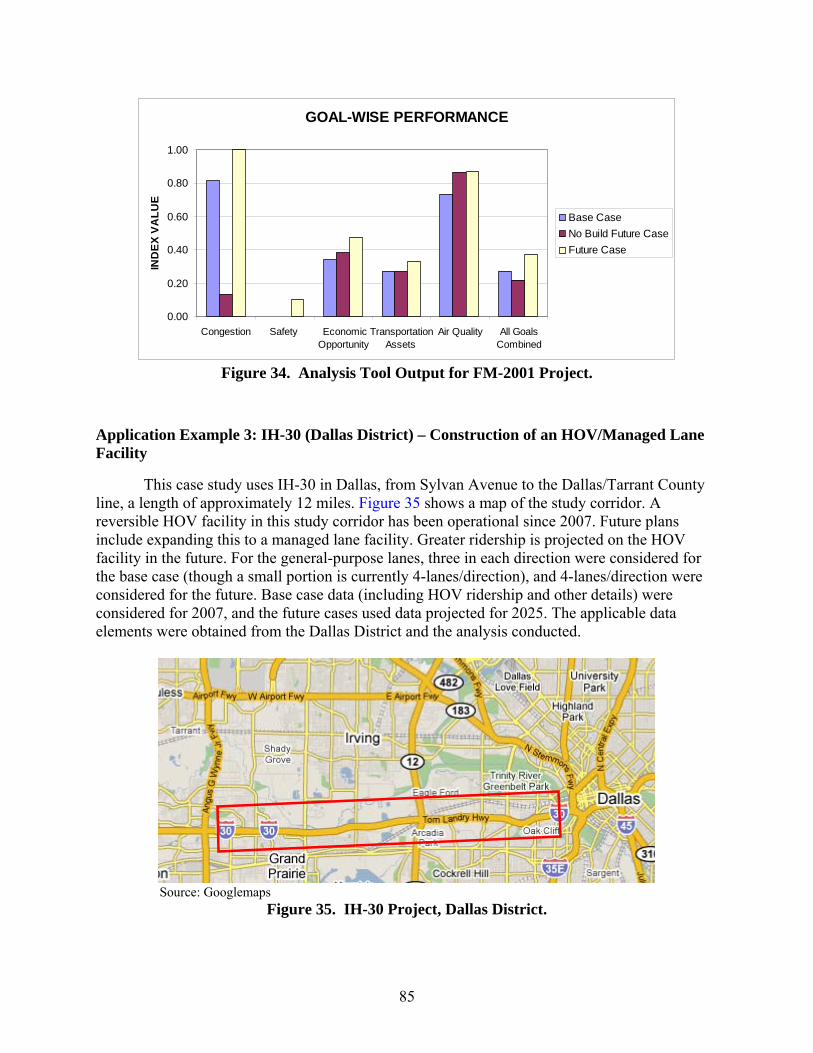
85
GOAL-WISE PERFORMANCE
0.00
0.20
0.40
0.60
0.80
1.00
Congestion Safety EconomicOpportunity
TransportationAssets
Air Quality All GoalsCombined
IND
EX V
ALU
E
Base CaseNo Build Future CaseFuture Case
Figure 34. Analysis Tool Output for FM-2001 Project.
Application Example 3: IH-30 (Dallas District) – Construction of an HOV/Managed Lane Facility
This case study uses IH-30 in Dallas, from Sylvan Avenue to the Dallas/Tarrant County line, a length of approximately 12 miles. Figure 35 shows a map of the study corridor. A reversible HOV facility in this study corridor has been operational since 2007. Future plans include expanding this to a managed lane facility. Greater ridership is projected on the HOV facility in the future. For the general-purpose lanes, three in each direction were considered for the base case (though a small portion is currently 4-lanes/direction), and 4-lanes/direction were considered for the future. Base case data (including HOV ridership and other details) were considered for 2007, and the future cases used data projected for 2025. The applicable data elements were obtained from the Dallas District and the analysis conducted.
Source: Googlemaps
Figure 35. IH-30 Project, Dallas District.
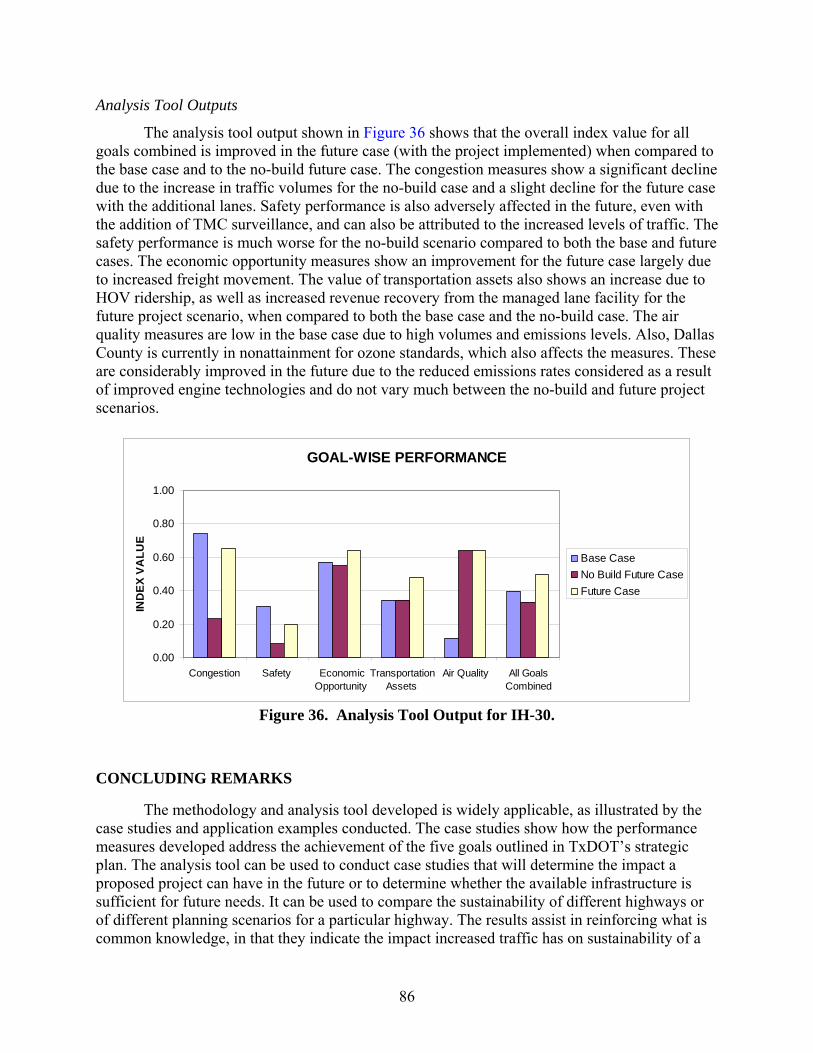
86
Analysis Tool Outputs
The analysis tool output shown in Figure 36 shows that the overall index value for all goals combined is improved in the future case (with the project implemented) when compared to the base case and to the no-build future case. The congestion measures show a significant decline due to the increase in traffic volumes for the no-build case and a slight decline for the future case with the additional lanes. Safety performance is also adversely affected in the future, even with the addition of TMC surveillance, and can also be attributed to the increased levels of traffic. The safety performance is much worse for the no-build scenario compared to both the base and future cases. The economic opportunity measures show an improvement for the future case largely due to increased freight movement. The value of transportation assets also shows an increase due to HOV ridership, as well as increased revenue recovery from the managed lane facility for the future project scenario, when compared to both the base case and the no-build case. The air quality measures are low in the base case due to high volumes and emissions levels. Also, Dallas County is currently in nonattainment for ozone standards, which also affects the measures. These are considerably improved in the future due to the reduced emissions rates considered as a result of improved engine technologies and do not vary much between the no-build and future project scenarios.
GOAL-WISE PERFORMANCE
0.00
0.20
0.40
0.60
0.80
1.00
Congestion Safety EconomicOpportunity
TransportationAssets
Air Quality All GoalsCombined
IND
EX V
ALU
E
Base CaseNo Build Future CaseFuture Case
Figure 36. Analysis Tool Output for IH-30.
CONCLUDING REMARKS
The methodology and analysis tool developed is widely applicable, as illustrated by the case studies and application examples conducted. The case studies show how the performance measures developed address the achievement of the five goals outlined in TxDOT’s strategic plan. The analysis tool can be used to conduct case studies that will determine the impact a proposed project can have in the future or to determine whether the available infrastructure is sufficient for future needs. It can be used to compare the sustainability of different highways or of different planning scenarios for a particular highway. The results assist in reinforcing what is common knowledge, in that they indicate the impact increased traffic has on sustainability of a

87
highway. By examining a set of indicators and providing a detailed analysis of goal-wise and link-wise performance, however, steps to maximize the progress toward sustainability can be identified. The steps involved in the analysis provide a logical and scientific method of translating concerns about sustainability into a measurable indicator of progress on the basis of a set of goals, objectives, and performance measures.
With respect to specific performance measures, it was noted that the improvement in the performance measures for the air quality goal in the future cases could be mostly attributed to the reduced emissions rates considered in the future years. These reduced rates are a reflection of technological improvements and are the driving force behind the reduced overall emissions, rather than reduced VMT. It is also noted that the performance measures for the value of transportation assets do not reflect the added value of capacity expansion projects or the value of existing infrastructure in terms of the number of lanes of highway. However, the value of existing or added infrastructure is reflected in other measures, such as congestion and safety. While the issues with these specific measures do not have a ready solution, they may be addressed in future research efforts in a more comprehensive manner.


89
CHAPTER 8: CONCLUSIONS AND RECOMMENDATIONS
The primary goal of this project was to develop performance measures and to create a
methodology for evaluating sustainability in TxDOT’s strategic plan. The methodology was designed to be implemented for a specific highway, to make its application more relevant to the regular transportation planning process. An application of the MAUT was developed for this project, consisting of a framework of performance measures that are scaled and aggregated to obtain an indicator of sustainability. An Excel-based analysis tool was created to implement this methodology, and several case study analyses were conducted. This chapter presents a brief summary of the findings and observations from the entire process. This chapter also discusses the potential for integrating the project findings into TxDOT’s planning practice through workshops on the use of the analysis tool.
GENERAL FINDINGS
Applying Sustainable Transportation to Highways
The need to address sustainability of transportation systems is widely discussed and is of increasing significance, as seen in the literature review and survey of current practices. Different transportation agencies and research initiatives present differing views of how sustainability is to be defined and addressed. However, there is a general consensus regarding what common elements are to be addressed in terms of transportation sustainability. Another issue to be considered is whether sustainability can be addressed for highways alone. It is generally recognized that for sustainability goals to be met, an overall reduction of automobile travel is desirable. However, there are many other aspects that can contribute to making the existing highway infrastructure more sustainable, ranging from land use, air quality impacts, transit availability, asset management, and funding sources. It is valuable to address these factors given that highway travel is the predominant mode of transportation in the United States, and a majority of TxDOT’s work involves highway planning and construction.
Linking Sustainability Assessments to Planning Goals
A disconnect exists between the regular transportation planning process and sustainable transportation planning in most state-level transportation agencies. This barrier to the implementation of sustainable planning is addressed in this project by linking TxDOT’s strategic plan goals to sustainability-related objectives. While this may narrow the scope of the sustainability objectives and performance measures developed, it creates the opportunity to address progress toward agency goals in a sustainable manner, which is a valuable step toward making transportation planning more sustainable. The importance of the sustainability-related objectives developed in this research must be emphasized, as these objectives help guide the planning process in a more sustainable direction. While this may not represent a total solution to sustainability issues, it provides a starting point for TxDOT to understand and further apply principles of sustainability.

90
Performance Measure-Based Sustainability Evaluations
Performance measures are useful for evaluating progress toward set targets or goals. Significant research regarding performance indicators for sustainable transportation exists, though these are primarily aimed at higher-level policy making. While there are sustainability indicators and performance measures proposed for highways, these are not combined in a framework that can address transportation planning for individual facilities. The use of performance measures provided a beginning point for evaluating highway sustainability within the transportation planning paradigm.
Multi-criteria decision-making deals with creating means of comparing attributes that may be expressed in different terms to aid in decisions that involve a variety of considerations. For a set of selected performance measures, MCDM is useful to express all indicators on a common platform to evaluate the relative sustainability of different planning scenarios. For this research, a process termed as the MAUT was used. The steps involved in the MAUT process included the evaluation of performance measures, scaling each performance measure to obtain a utility value, and aggregating the scaled measures into an indicator of sustainability.
Analysis Tool and Case Studies
An Excel-based spreadsheet tool was developed to implement the sustainability evaluation methodology into a user-friendly platform which can be used to evaluate different case studies. Several case studies representing different roadways and base/future scenarios were conducted using the analysis tool, and the results discussed. The progress toward sustainability with respect to each of the strategic plan goals, as well as for individual links on the study section was evaluated in each of the case study analyses.
Possible Applications of Methodology and Analysis Tool
The methodology developed in this research has wide applicability. It can be used to identify specific links on a given roadway that perform worse with respect to sustainability. Different projects or alternative future scenarios can be compared, or the relative levels of sustainability can be assessed for different highways. This project also demonstrates how sustainability can be approached and assessed scientifically. Thus, this research can also serve to create awareness among transportation agencies and provide a platform for further research.
Another aspect to be noted here is that this methodology is not the whole solution for a transportation agency to achieve goals of sustainability. The most significant progress can be achieved when sustainability is incorporated into the goals themselves. However, the process of a transportation agency redefining its goals is not very easily achieved. Thus, research that attempts to address sustainability for existing goals is a valuable contribution that can also provide feedback and raise awareness about how transportation agencies can further address sustainability issues.
INTEGRATION INTO TXDOT PRACTICE
The research team also investigated the possibility of integrating the methodology and analysis tool developed under this project into current TxDOT practices. Researchers

91
investigated TxDOT practices where the implementation of sustainable transportation performance measures could be integrated. Through conversations with the project director and project coordinator, as well as their current understanding and experiences with TxDOT procedures, the research team determined that the analysis tool developed, referred to as the Sustainability Enhancement Tool (SET), would assist TxDOT staff with a number of activities. SET is valuable for project screening in the very early stages of project evaluation. SET seems most applicable to identifying the extent of sustainability integration into TxDOT practices at the “sketch-planning” level. Obviously, there are a myriad of factors that should be incorporated into project prioritization, process selection, and decision-making. SET focuses on sustainability considerations. One need that was also expressed is for the tool to be used as project ranking method so that these rankings can be compared with what the districts provide.
Workshop Technology Transfer
A key element of the success of implementing this research will be ensuring that 1) it is understood by TxDOT staff, and 2) it can be incorporated into the decision-making process. Early project screening and “sketch-planning” will typically be performed at area or district offices of TxDOT. Members of the research team have been very successful in implementing research results through the use of workshops across the state of Texas at district offices. Typically a workshop is held at the district office, and the area engineer (and other necessary staff) travels to the district office.
The research team proposes a similar process for the technology transfer of SET. The subject lends itself very well to instruction through a workshop environment. Through an implementation project, SET can be introduced through a set of workshops to key TxDOT districts. The workshops will serve as an opportunity to obtain input from the practitioners to enhance the tool further before possible broader distribution of the workshops.
It is proposed that workshops be held in the Houston, Dallas, and San Antonio districts, and the target audience will be district planning engineers and their staff. Workshop materials would include PowerPoint® presentations for the workshop sessions, binders of PowerPoint® slides, interactive exercises, and Excel software to run the analysis tool.
Workshop Lesson Plan
Appendix I contains a draft of the Lesson Plan with all the necessary details for the proposed workshops. The Lesson Plan includes:
• course organization (with agenda); • course coordination; • class size; • workshop equipment requirements; • target audience; • workshop learning objectives; and • details for each lesson, including:
• lesson number, • lesson title, • learning objectives, • instructional method, • instructional day,
92
• time allocation, and • evaluation plan.
CONCLUDING REMARKS
This research provides a means of evaluating sustainable progress toward TxDOT’s strategic plan goals. While the scope of the analysis is restricted to highways, the methodology provides insight into how the sustainability of an existing highway can be improved, and the impact a more multimodal transportation system could have on the sustainability of a particular highway. A scientific approach is used for the development of the MAUT-based evaluation methodology. Several case study analyses were conducted, and these indicated how the methodology could be used to identify goals that need to be addressed with respect to sustainability, as well as identify problematic links along a study section.
In conclusion, the research conducted creates a robust multi-criteria decision-making methodology for sustainability evaluation. The methodology addresses sustainability in a manner that allows for its integration into the transportation planning process. The use of performance measures allows for scientific comparisons of different locations, as well as the comparison of alternative planning scenarios for a given location. The methodology has potential for integration into TxDOT’s planning practices to aid in future sustainability enhancement efforts.

93
REFERENCES
1. Sustainable Transportation: Priorities for Policy Reform. The World Bank, Washington, D.C., May 1996. 2. World Commission on Environment and Development (Bruntdland Commission), Our Common Future. Oxford University Press, Oxford, England, 1987. 3. Litman, T. Well Measured: Developing Indicators for Comprehensive and Sustainable Transportation Planning. Victoria Transportation Policy Institute, Victoria, British Columbia, Canada, June 2005. 4. Jeon, C. and A. Amekudzi. Addressing Sustainability in Transportation Systems: Definitions, Indicators, and Metrics. Journal of Infrastructure Systems, ASCE, March 2005. pp, 31-50. 5. Black, J.A., A. Paez, and P.A. Suthanaya. Sustainable Urban Transportation: Performance Indicators and Some Analytical Approaches. Journal of Urban Planning and Development, Vol. 128, Issue 4, December 2002, pp. 184-209. 6. Amekudzi, A., and C.M. Jeon. Evaluating Transport Systems Sustainability: Atlanta Metropolitan Region. Presented at 86th Annual Meeting of the Transportation Research Board, Washington, D.C., 2007. 7. Bochner, B. Smart Growth? Sensible Growth? Sustainable Growth? Balanced Growth?...Responsible Growth: What are the Transportation Needs to Achieve This Growth? ITE Journal, Institute of Transportation Engineers, Washington, D.C., April 2000. 8. Zietsman, J. and L. Rilett. Sustainable Transportation: Conceptualization and Performance Measures. Report SWUTC/02/167403-1, Southwest Region University Transportation Center, The Texas A&M University System, College Station, Texas, March 2002. 9. Gudmundsson, H. Sustainable Transport and Performance Indicators. Issues in Environmental Science and Technology. No. 20, 2004, pp. 35-63. 10. Performance Measures for the Operational Effectiveness of Highway Segments. NCHRP Synthesis 311. National Cooperative Highway Research Program, Transportation Research Board, Washington, D.C., 2003. 11. Gudmundsson, H. Indicators and Performance Measures for Transportation, Environment, and Sustainability in North America. Report from the German Marshall Fund Fellowship, National Environmental Research Institute, Roskilde, Denmark, October 2000.
94
12. Poister, T.H. Performance Measurement in State Departments of Transportation. NCHRP Synthesis 238. National Cooperative Highway Research Program, Transportation Research Board, Washington, D.C., 1997. 13. Performance Measures and Targets for Transportation Asset Management. NCHRP Report 551. National Cooperative Highway Research Program, Transportation Research Board, Washington, D.C., 2006. 14. Kassoff, H. Implementing Performance Measurement in Transportation Agencies. In Conference Proc. 26: Performance Measures to Improve Transportation Systems and Agency Operations. Transportation Research Board, National Research Council, Washington, D.C., 2001, pp. 47-58. 15. A Guidebook for Performance-Based Transportation Planning. NCHRP Report 446. National Cooperative Highway Research Program, Transportation Research Board, Washington, D.C., 2000. 16. Hall, R. Understanding and Applying the Concept of Sustainable Development to Transportation Planning and Decision-Making in the U.S. Ph.D. Dissertation, Massachusetts Institute of Technology, 2006. 17. Zietsman, J., L.R. Rilett, and S. Kim. Sustainable Transportation Performance Measures for Developing Communities. SWUTC/03/167128-1. Southwest Region University Transportation Center, The Texas A&M University System, College Station, Texas, 2003. 18. Strategic Performance Measures for State Departments of Transportation: A Handbook for CEOs and Executives. Final Report prepared for the National Cooperative Highway Research Program, Transportation Research Board, Washington D.C., June 2003. 19. Falcocchio, J.C. Performance Measures For Evaluating Transportation Systems: A Stakeholder Perspective. 83rd TRB Annual Meeting. Transportation Research Board, Washington, D.C., 2004. 20. Pickerell, S., and L. Neumann. Use of Performance Measures in Transportation Decision Making. Conference Proc. 26: Performance Measures to Improve Transportation Systems and Agency Operations. Transportation Research Board, National Research Council, Washington, D.C., 2001, pp 17-32. 21. Falls, L.C. and R. Jurgens. Four R’s of Performance Measurement: the Alberta Case Study. 83rd TRB Annual Meeting. Transportation Research Board, Washington, D.C., 2004. 22. Houghton, N. Ecologically Sustainable Development: Indicators and Decision Process. Report 319, ARRB Transportation Research, Vermont South, Australia, March 1998.

95
23. Meyer, M. and E. Miller. Urban Transportation Planning: A Decision Oriented Approach. McGraw-Hill Higher Education, New York, 2001. 24. Nijkamp, P., and A. van Delft. Multi-Criteria Analysis and Regional Decision-Making. Interprint, Leiden, Netherlands, 1977. 25. Olson, D. L. Decision Aids for Selection Problems. Springer, New York, 1996. 26. Black, W.R. Toward a Measure of Transport Sustainability. Presented at the 79th Annual Meeting of the Transportation Research Board, Washington, D.C., 2000. 27. 2005 Environmental Sustainability Index: Benchmarking National Environmental Stewardship. Yale Center for Environmental Law and Policy, Yale University. http://www.yale.edu/esi/ESI2005_Main_Report.pdf. Accessed October 2, 2007. 28. Bochner B. S., L. L. Higgins, C. A. Lewis, R. I. Rabinowitz, and J. Zietsman. Introducing Smart Growth To Texas: Summary Report. Report 4238-S, Texas Department of Transportation. Austin, Texas, September 2002. 29. TxDOT has a Plan: Strategic Plan for 2007-2011. Texas Department of Transportation. ftp://ftp.dot.state.tx.us/pub/txdot-info/lao/strategic_plan2007.pdf. Accessed September 2008. 30. TxDOT Strategic Plan for 2005-2009. Texas Department of Transportation. ftp://ftp.dot.state.tx.us/pub/txdot-info/lao/strategic_plan2005.pdf. Accessed September 2008. 31. TxDOT Strategic Plan for 2003-2007. Texas Department of Transportation. ftp://ftp.dot.state.tx.us/pub/txdot-info/lao/strategic_plan2003.pdf. Accessed September 2008. 32. Brydia, B. et al. Operations-Oriented Performance Measures for Freeway Management Systems, Report 0-5292-1, Texas Transportation Institute, The Texas A&M University System, College Station, Texas, 2007. 33. Larson, M. Organizing for Performance Management. Performance Measures to Improve Transportation Systems: Second National Conference on Performance Measurement, Conference Proceedings 36, Transportation Research Board, National Research Council, Washington, D.C., 2005. 34. Meyer, M. Measuring That Which Cannot be Measured- At Least According To Conventional Wisdom. Performance Measures to Improve Transportation Systems and Agency Operations, Conference Proceedings 26, National Academy Press, Washington, D.C., 2001. 35. Ewing, R. Growing Cooler: The Evidence on Urban Development and Climate Change. Urban Land Institute, Washington, D.C., 2007.

96
36. 2007 Annual Urban Mobility Report. Texas Transportation Institute, The Texas A&M University System, College Station, Texas, September 2007. 37. Bonneson, J., K. Zimmerman, and K. Fitzpatrick. Interim Roadway Safety Design Workbook. Project Report, Texas Transportation Institute, The Texas A&M University System, College Station, Texas, April 2006. 38. Cervero, R. and K. Kockelman. Travel Demand and the 3Ds: Density, Diversity, and Design. Transportation Research D, Vol. 2, Elsevier Science, Amsterdam, The Netherlands, 1997, pp. 199-219. 39. Litman, T. Transportation Market Reforms for Sustainability. 79th TRB Annual Meeting. Transportation Research Board, Washington, D.C., 2000. 40. National Congestion Tables, Key Mobility Measures. http://mobility.tamu.edu/ums/congestion_data/tables/los_angeles.pdf. Accessed May 2008. 41. Eisele, W.L., L.R. Rilett, K.B. Mhoon, and C. Spiegelman. Using Intelligent Transportation Systems Travel-Time Data for Multimodal Analyses and System Monitoring. In Transportation Research Record: Journal of the Transportation Research Board, No. 1768, Transportation Research Board, National Research Council, Washington, D.C., 2001, pp. 148-156. 42. Hu, P., and T.R. Reuscher. Summary of Travel Trends: 2001 National Household Travel Survey. December 2004. http://nhts.ornl.gov/2001/pub/STT.pdf . Accessed May 2008. 43. Highway Economic Requirements System- State Version: Technical Report. U.S. Department of Transportation, Washington D.C., 2002. 44. EPA Ozone Designations: Frequently Asked Questions. http://www.epa.gov/ozonedesignations/faq.htm#10. Accessed May 2008. 45. Leleur, S., and N. Berg. The COSIMA Approach to Transport Decision Making: Combining Cost-Benefit and Multi-Criteria Analysis for Comprehensive Project Appraisal. Presented at the Korean Development Institute & World Bank Conference, Seoul, South Korea, May 2007. 46. US 281Factsheet –Texas Department of Transportation. http://www.recsanantonio.com/Download%20Area/US%20281%20FACT%20SHEET.pdf. Accessed May 2008. 47. US 290 Corridor Major Investment Study, Report for TxDOT Houston District, Kimley-Horn and Associates, January 2003.
97
APPENDIX A: CATEGORIZED LISTING OF TRANSPORTATION PERFORMANCE
MEASURES/INDICATORS

99
The following is a list of performance measures that can be used to evaluate transportation systems from different perspectives. Accessibility
Average trip length Accessibility index Percent work trips within specific travel time Percent labor force within specified distances of job location(s) Percentage of employment sites within x miles of major highway Percentage of population within x minutes of y percentage of employment sites Percentage of region’s mobility impaired who can reach specific activities by public
transportation Intercity travel time
- Peak-hour average travel speeds on major highway routes between regional centers - Shipper point-to-point travel time
Freight travel time to global markets - Travel time to major regional, national, and global markets by rail, air, water, and
truck Connectivity to intermodal facilities (% within 5 miles [1 mile for metropolitan]) Connectivity index (by week) Dwelling unit proximity (% within 5 miles [1 mile for metropolitan]) Employment proximity (% within 5 miles [1 mile for metropolitan]) Industrial and warehouse facility proximity (% within 5 miles) % of miles bicycle accommodations (% of miles with bike lane/shoulder coverage) % of miles pedestrian accommodations (% of miles with sidewalk coverage) Coverage (percentage of person minutes served) Frequency (buses per hour) Span (hours of service per day) VMT per capita Average work trip commute time and distance Parking spaces per 1,000 workers Transit availability and affordability
Mobility
Average speed or travel time Commute cost Commute time Short trips made by auto Per capita VMT Vehicle miles traveled by congestion level Lost time or delay due to congestion Delay per ton-mile Level of service or volume-to-capacity ratios Vehicle hours traveled or VMT per capita

100
Person-hours traveled Person-miles traveled per VMT PMT per capita or worker Frequency of transit service Overall mode split by facility or route Transfer time between modes Passenger trips per household Peak hour occupancy Light duty/2-wheel vehicles Percentage of low emission vehicles Percent walking or using bike by trip type Predictable, competitive metro-area travel time
- Metro freeway travel time by route and time of day - Average speed on metro freeways by route and time of day - Congestion level compared with other major metropolitan areas
Bottlenecks and impediments - Number of design impediments to freight traffic by mode and type (at-grade rail
crossings, restricted roads, deficient bridges, etc.) Timely access to intermodal terminals Number of design impediments slowing access to truck, rail, air, waterways terminals Quality of service (transit)
- Average speed - Average headway (minutes) - Average age of fleet (years) - Number of incidents - Revenue service interruptions - Revenue miles between incidents - Revenue miles between interruptions - Ridership and customer services (complaints and commendations per 1,000
passengers) Quality of travel
- Average speed (average speed weighted by PMT) - Delay (average delay) - Average travel time (distance/speed) - Average trip time (door-to-door trip travel time) - Reliability (% of acceptable travel times) - Maneuverability (vehicles per hour per lane) - Auto to transit travel time ratio (door-to-door trip time) - Reliability (on-time performance)
System Utilization
- % of system heavily congested (% of miles at LOS [level of service] E or F) - % of travel heavily congested (% of daily VMT at LOS E or F) - Vehicles per lane mile (AADT[annual average daily traffic] *length/lane-miles) - Duration of congestion (lane-mile-hours at LOS E or F) - Load factor (percentage of seats occupied)

101
Non-auto mode split Non-auto trips Transit speed relative to auto Service miles of transit Miles of separate bikeways Reliability
- Probability that users will arrive at destinations on time - Emergency medical response time
Economic Development
Population GDP (GDP/Unit of Energy Used) Green GDP Transportation Intensity (passengers or ton-miles per unit GDP) Percentage of wholesale, retail, and commercial centers served with unrestricted (vehicle)
weight roads Jobs created or supported (directly or indirectly) Percentage of region’s unemployed or low income that cite transportation access as
principle barrier to seeking employment Tax base increase (property tax) Sales tax increase Change in property value New jobs created New construction jobs created New wages/revenues created Employment Employment to population ratio in central areas Tax revenues Public expenditure Growth potential Fuel prices and tax collection from fuel Overall expenditure on roads and transit
Economics/Costs
Economic cost of crashes Economic cost of lost time Real change in the cost of transport Fleet composition Cost-benefit measures Average cost per lane-mile constructed Economic cost-benefit ratio
- Cost-benefit ratio of major state transportation projects Transportation investment
- State’s transportation investment and spending as percentage of gross state product Competitiveness of shipping rates
- Shipment cost per mile by ton or value by mode for major commodities

102
Crash rate and cost comparison - Dollar value of crashes and crash cost comparison by mode - Crash rate per mile traveled (or other basis) by freight mode
Cost efficiency - Operating expenses per capita - Operating expenses per peak vehicle - Operating expenses per passenger trip - Operating expenses per passenger mile - Operating expenses per vehicle mile - Operating expenses per revenue mile - Operating expenses per revenue hour - Maintenance expenses per revenue mile - Maintenance expenses per operating expenses - Maintenance expenses as percentage of operating expenses or agency budget - Cost of travel time saved - Operating cost saved
Operating ratios (transit) - Farebox recovery - Local revenue per operating expenses - Operating revenue per operating expenses
Fare collection - Fare receipts versus budget - Fare recovery ratio - Operating subsidy per passenger trip - Average fare per passenger trip
Finance (budget) - Operating expenses: actual versus budget by line item, capital expenses by project, by
grant, by general ledger number - Revenues: actual versus budget
Cost recovery for transit Annual ridership Aircraft departures
Environmental Resource Consumption and Depletion
Fuel consumption per VMT or PMT Sprawl
- Difference between change in urban household density and suburban household density
- Percentage of land occupied by developed parcels - Acres/percentage of formerly agricultural/open land lost to urbanization - Percentage greenfield development - Percentage development on urban fringe
Wetlands displaced Wetlands created Loss or segregation of fauna habitat Agricultural land

103
Agricultural land at urban fringe Green space per capita Percentage of urban redevelopment Number of transit-oriented developments Percentage of development that is infill Percentage development that is redevelopment Density of population and employment
Environmental Quality and Impacts
Tons of pollution Number of days in air quality noncompliance Number of good air days Tons of waste per household Total water consumption Energy consumed Quality of water in rivers Biodiversity Area of greenfield sites Energy use and air quality
- Total energy use per capita - Energy cost per dollar output - Proportion of alternative fuels - Total pollutant emissions per capita - Total greenhouse gas emissions (or emission of CO, CO2, ozone, NOx, VOCs,
hydrocarbon, SO2) - Days meeting air standards - Average fuel consumption - Vehicles failing emissions test - Household noise complaints - Black smoke emissions
Water, materials, and waste - Total water use per capita - Days meeting quality standards - Sewage treated to reusable standards - Sewage discharged to streams - Consumption of building materials - Consumption of paper and packaging - Amount of solid waste - Organic waste returned to soil
Number of noise-sensitive sites potentially affected Length of noise wall required Developable areas subjected to unacceptable noise level Land reclaimed

104
Air quality - Air pollution concentrations - Emissions per capita - Acute respiratory deaths
Water quality - Percentage of wastewater treated - Percentage of BOD (biological oxygen demand) removed - Treatment cost - Lowering of water table - Wastewater recycled - Level of treatment
Energy use - Energy use per person - Renewable energy use
Neighborhoods impacted Number of hospitals impacted Number of schools/students impacted Number of churches impacted Number of accidents involving hazardous waste Alternative fuels used Toxic substances in urban air Oil spills Incidents involving hazardous material Investments dedicated to environmental protection
Safety
Number of accidents per VMT, PMT, year, trip, ton-mile, and capita Cost of accidents Cost of collisions Number of high accident locations Response time to accidents Accident risk index Customer perception of safety Percentage of roadway pavement rated good or better Construction-related fatalities Accidents at major intermodal locations (e.g., railroad crossings) Pedestrian-bicycle accidents Crashes per 1,000 people
Quality of Life
Lost time due to congestion Accidents per VMT or PMT Tons of pollution generated Customer perception of safety Customer perception of urban quality Average number of hours spent traveling – non-recreational travel

105
Percentage of population exposed to noise above certain threshold Compatibility with adjacent development Delivery services and transit facilities for mobility impaired % HH expenditure on transportation
Livability and Social Development
Miles of pedestrian-friendly streets Mixed land use Inequity of user costs and benefits Areas above a certain value not separated by a motorway Residents participation in decision-making Customer perception of quality ADA requirements conformance Percentage of travel in congested conditions Percentage area occupied by transportation infrastructure Proportions of city with urban design guidelines Proportion of city allowing mixed-use, higher-density development Net density
− Of dwelling units − Population − Jobs − Persons per household or dwelling unit
Amount of litter on streets Miles of traffic-calmed streets Number within walking distance of social service agencies Percentage voting in elections Number of sport facilities Number of seats for arts and culture Number of historic building listings Number of art collections open to public
System Efficiency and Preservation
Cost for transportation system services Total investment in maintenance Origin-destination travel times Average travel time Average speed Percentage of projects rated good to excellent Volume-to-capacity ratios Operating cost per ton-mile Customer satisfaction Percentage of on-time transit Transit services
- Miles between road calls Ease/cost of enforcement

106
Percentage of VMT on roads with deficient ride quality Percentage of roads and bridges below standard condition Remaining service life Maintenance costs Roughness index for pavement Service miles between road calls for transit vehicles Vehicle age distribution
General Performance Indicators
Service area population Network
- Length - Extent - Density - Lengths of arterial, expressway, and HOV lanes - Parking facilities - Rail lengths where applicable
Percentage of service area population served (within x minutes of service or destination) Service area size Passenger trips Passenger-miles Vehicle-miles Ton-Miles of freight Per capita auto use (car/truck sales) Total traffic volumes for road, rail, ship and air Total passenger volumes for road, rail, ship and air Transit use Average home-work trip distance/time taken Subsidies to transportation Percentage of pavement meeting performance standards Revenue miles Vehicle-hours Revenue hours Route miles Total operating expenses Total maintenance expenses Total capital expenses Federal contribution State contribution Total local revenue Local contribution Directly generated non-fare revenue Passenger fare revenue Total employees Transportation operating employees

107
Maintenance employees Administrative employees Vehicles available for maximum service Vehicles operated in maximum service Spare ratio Parking spaces for employees off the road Seat miles during peak and off peak Road utilization index (vehicle miles/lane miles) Total gallons consumed Total energy consumed (kW-h)
- Vehicle—miles per gallon - Vehicle—miles per kW-h
Quantity of travel - Person-miles traveled (AADT*length*vehicle occupancy) - Truck-miles traveled (AADT*length*%of trucks) - Vehicle-miles traveled (AADT*length) - Person trips (total person trips) - Ridership (total passenger trips)
Transit Availability, Utilization, and Performance
Vehicle-miles per capita Integration of transit with other modes Public transportation performance Cost of transit relative to cost of gas Transit operating ratio (revenue/operating cost) Weekday span of service (hours) Route miles per square mile of service area Vehicle-miles per peak vehicle Vehicle-hours per peak vehicle Revenue miles per vehicle-mile Revenue miles per total vehicles Revenue hours per total vehicles Revenue hours per employee Passenger trips per employee Average fare Miles between road calls/incidents Miles per unit of fuel and power Maintenance cost per mile Vehicles out of service
Project Progress and Delivery
% complete versus % scheduled % spent versus % budgeted

108
DBE (disadvantaged business enterprise) participation – also known as HUB (historically underutilized businesses)
Major variances and exceptions Grant revenue status
Engineering
Estimated costs - Construction - Row - Utilities - Relocations - Environmental mitigation - Life cycle cost
Number of design exceptions required Exceptions to access management policy No. driveways
- Relocated - Closed - Combined - With newly restricted access (lost) - Left turn inbound - Left turn outbound - Throughs - Right turns
Number of percent of at-grade railroad crossings Amount of ROW required Number of relocations Ease of maintaining traffic Ease of maintenance Emergency/detour capability Adequacy of sight distances
- Stopping - Intersection - Decision
109
APPENDIX B: PERFORMANCE MEASUREMENT TABLE – OTHER STATES

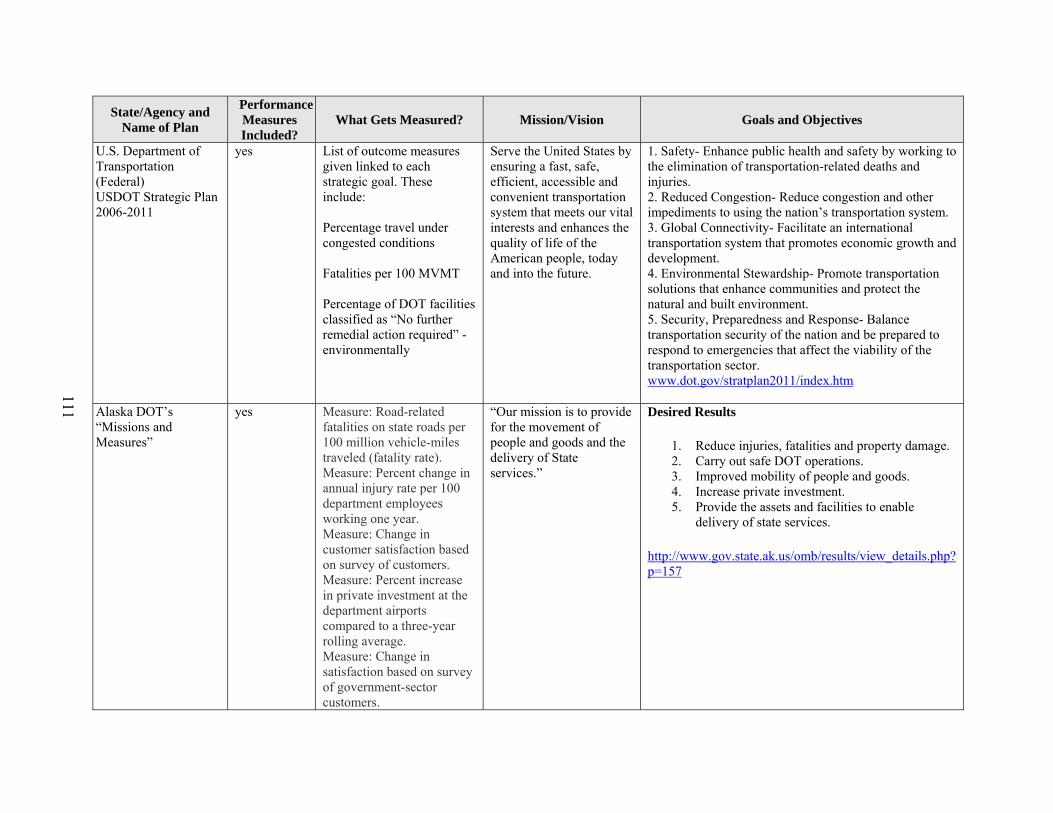
111
State/Agency and Name of Plan
Performance Measures Included?
What Gets Measured? Mission/Vision Goals and Objectives
U.S. Department of Transportation (Federal) USDOT Strategic Plan 2006-2011
yes List of outcome measures given linked to each strategic goal. These include: Percentage travel under congested conditions
Fatalities per 100 MVMT Percentage of DOT facilities classified as “No further remedial action required” - environmentally
Serve the United States by ensuring a fast, safe, efficient, accessible and convenient transportation system that meets our vital interests and enhances the quality of life of the American people, today and into the future.
1. Safety- Enhance public health and safety by working to the elimination of transportation-related deaths and injuries. 2. Reduced Congestion- Reduce congestion and other impediments to using the nation’s transportation system. 3. Global Connectivity- Facilitate an international transportation system that promotes economic growth and development. 4. Environmental Stewardship- Promote transportation solutions that enhance communities and protect the natural and built environment. 5. Security, Preparedness and Response- Balance transportation security of the nation and be prepared to respond to emergencies that affect the viability of the transportation sector. www.dot.gov/stratplan2011/index.htm
Alaska DOT’s “Missions and Measures”
yes Measure: Road-related fatalities on state roads per 100 million vehicle-miles traveled (fatality rate). Measure: Percent change in annual injury rate per 100 department employees working one year. Measure: Change in customer satisfaction based on survey of customers. Measure: Percent increase in private investment at the department airports compared to a three-year rolling average. Measure: Change in satisfaction based on survey of government-sector customers.
“Our mission is to provide for the movement of people and goods and the delivery of State services.”
Desired Results
1. Reduce injuries, fatalities and property damage. 2. Carry out safe DOT operations. 3. Improved mobility of people and goods. 4. Increase private investment. 5. Provide the assets and facilities to enable
delivery of state services.
http://www.gov.state.ak.us/omb/results/view_details.php?p=157

112
State/Agency and Name of Plan
Performance Measures Included?
What Gets Measured? Mission/Vision Goals and Objectives
Arizona (ADOT) “Move Arizona: Long Range Transp. Plan” – Final Tech Memo (2004)
yes Measures were selected to identify and monitor performance and gauge the ability of proposed projects to satisfy ADOT’s goals, which can be described by eight different performance factors: 1. Mobility; 2. Economic Competitiveness; 3. Connectivity; 4. Preservation; 5. Reliability; 6. Safety; 7. Accessibility; and 8. Resource Conservation.
To support Arizona’s quality of life, the MoveAZ Plan will provide a safe, reliable, and efficient transportation system for people and goods that strengthens our economic vitality; assures access to services and recreational opportunities; preserves the beauty and health of our natural environment; and blends into our urban and rural landscapes. To achieve these ends, the Move AZ Plan will: • Be fiscally responsible; • Provide citizens with transportation choices; • Emphasize accountability; • Be responsive to change; • Harmonize with Arizona’s proud heritage and unique diversity; • Encourage coordination of transportation and land use planning at the state, regional, and local level; and • Address air, transit, rail, highway, bicycle, and pedestrian travel. http://www.countysupervisors.org/uploads/MoveAZ%20Part%20I.pdf
California Department of Transportation (Caltrans) California Transp. Plan 2025; also, the 1998 Transportation System Performance Measures Report that provided a blueprint for developing performance measures, defined desired outcomes, and identified mode-neutral candidate measures or indicators.
yes
Measures still under development. Suggested are measures that include: Travel Time Travel Delay Accessibility Throughput Pavement/Bridge quality Injury rates Total number of injuries Number of days exceeding air quality standards
Caltrans Improves Mobility Across California
Integration of performance measures into long-range planning is critical to the continued success of performance measures implementation. As we endeavor to develop a more balanced and sustainable system, the evaluation of transportation objectives and related performance measures will continue. Additional efforts are already being focused towards finding measures appropriate for rural areas. The next step will be to determine what types of performance measures can be developed and used that will accurately reflect system performance in rural areas of the state. http://www.dot.ca.gov/hq/tsip/tspm/tspmdocs/pm4_99conffinal.doc http://www.dot.ca.gov/hq/tpp/offices/osp/ctp.htm

113
State/Agency and Name of Plan
Performance Measures Included?
What Gets Measured? Mission/Vision Goals and Objectives
California (Caltrans) Implementing PM for Transp. System Users in California (Oct. 2000)
yes
Caltrans has identified nine performance measures for use throughout the state in accordance with legislative requirements:
•Mobility/Accessibility •Reliability •Cost Effectiveness •Sustainability •Environmental Quality •Safety/Security •Equity •Customer Satisfaction •Economic Well Being
This prototype demonstrates how the tested performance measures work, and how the performance measures information can be communicated. The prototype is not intended as a statewide decision-making tool, since it does not cover the entire state or contain performance trends. Rather, it serves as a vehicle to solicit feedback and advice to ensure the usefulness and acceptance by decision makers and transportation stakeholders.” http://www.dot.ca.gov/hq/tsip/tspm/tspmdocs/pm4_99conffinal.doc
California/ California Transportation Plan
California has a safe, sustainable transportation system that is environmentally sound, socially equitable, economically viable, and developed through collaboration; it provides for the mobility and accessibility of people, goods, services, and information through an integrated, multimodal network.
1. Improve mobility and accessibility. 2. Preserve the transportation system. 3. Support the economy. 4. Enhance public safety and security. 5. Enhance the environment. www.dot.ca.gov/hq/tpp/offices/osp/ctp.htm
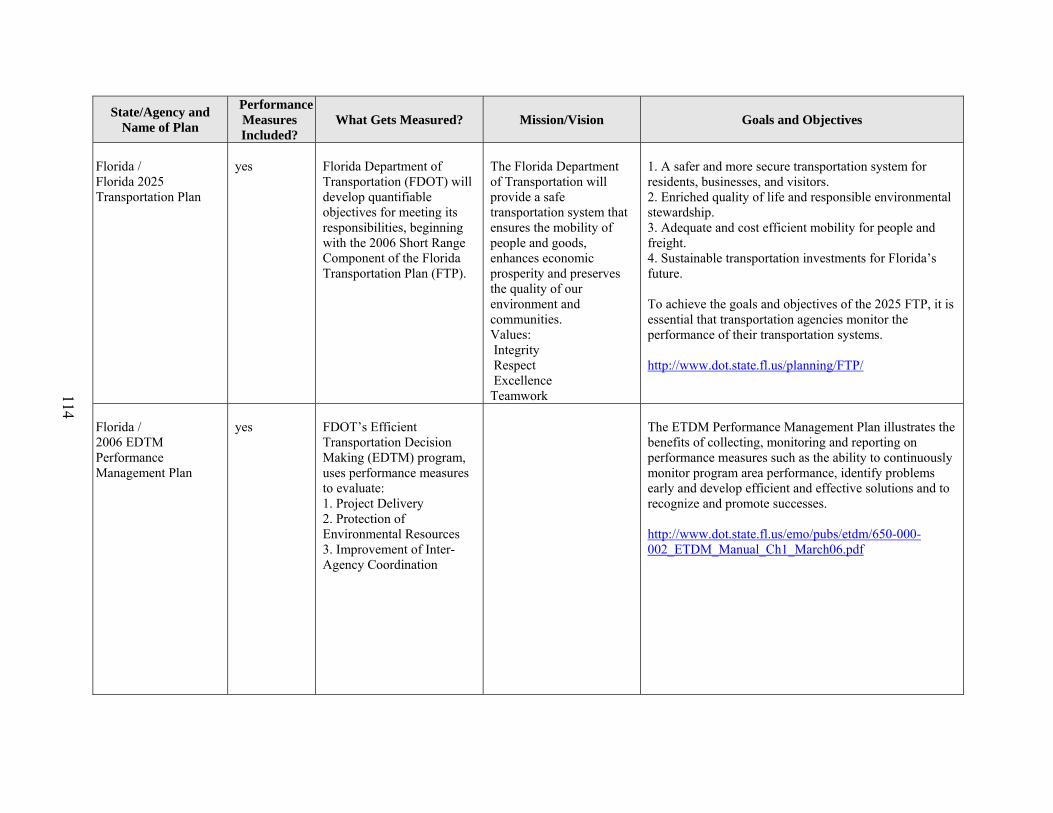
114
State/Agency and Name of Plan
Performance Measures Included?
What Gets Measured? Mission/Vision Goals and Objectives
Florida / Florida 2025 Transportation Plan
yes
Florida Department of Transportation (FDOT) will develop quantifiable objectives for meeting its responsibilities, beginning with the 2006 Short Range Component of the Florida Transportation Plan (FTP).
The Florida Department of Transportation will provide a safe transportation system that ensures the mobility of people and goods, enhances economic prosperity and preserves the quality of our environment and communities. Values: Integrity Respect Excellence Teamwork
1. A safer and more secure transportation system for residents, businesses, and visitors. 2. Enriched quality of life and responsible environmental stewardship. 3. Adequate and cost efficient mobility for people and freight. 4. Sustainable transportation investments for Florida’s future. To achieve the goals and objectives of the 2025 FTP, it is essential that transportation agencies monitor the performance of their transportation systems. http://www.dot.state.fl.us/planning/FTP/
Florida / 2006 EDTM Performance Management Plan
yes
FDOT’s Efficient Transportation Decision Making (EDTM) program, uses performance measures to evaluate: 1. Project Delivery 2. Protection of Environmental Resources 3. Improvement of Inter-Agency Coordination
The ETDM Performance Management Plan illustrates the benefits of collecting, monitoring and reporting on performance measures such as the ability to continuously monitor program area performance, identify problems early and develop efficient and effective solutions and to recognize and promote successes. http://www.dot.state.fl.us/emo/pubs/etdm/650-000-002_ETDM_Manual_Ch1_March06.pdf

115
State/Agency and Name of Plan
Performance Measures Included?
What Gets Measured? Mission/Vision Goals and Objectives
Georgia / 2005-2035 Georgia Statewide Transportation Plan Update (Jan. 2006)
no The Georgia Department of Transportation provides a safe, seamless and sustainable transportation system that supports Georgia’s economy and is sensitive to its citizens and environment.
1. Preserve the existing (transportation) system in good working order. 2. Enhance safety on all transportation systems. 3. Reduce congestion and improve levels of service. 4. Facilitate connections among the various regions of the state. 5. Improve access and mobility for all citizens. 6. Support economic growth. 7. Enhance the quality of life. http://www.dot.state.ga.us/INFORMATIONCENTER/programs/transportation/Pages/swtp.aspx
Indiana / Indiana Department of Transportation (INDOT) Strategic Plan
no Our mission is to provide our customers with the best transportation system that enhances mobility, stimulates economic growth, and integrates safety, efficiency and environmental sensitivity.
1. Strive to develop an efficient and well-integrated multimodal transportation system. 2. Work to ensure that safety is considered and implemented in all phases of transportation planning, design, construction, maintenance and operations. 3. Develop a transportation system that responds to demographic change and contributes to the quality of life. 4. Sustain and foster Indiana’s economy. 5. Establish and maintain a transportation system that is consistent with the state’s commitment to protect the environment. http://www.state.in.us/indot/files/Vision-2002.pdf
Maryland/Maryland DOT (MDOT) Smart Growth Initiatives (1992-2002)
no The visions of the Planning Act are: 1. Development is concentrated in suitable areas. 2. Sensitive areas are protected. 3. In rural areas, growth is directed to existing population centers and resource areas are
MDOT has addressed the following in conjunction with Smart Growth: 1. Smart Growth, Smart Transportation- Smart Growth Transit Program. 2. System Preservation- Preservation performance measures indicate MDOT maintaining or improving condition of existing infrastructure. 3. Transportation facilities and System Performance- MDOT is challenged to meet increasing demand for use of all facilities. 4. Safety and Security- MDOT continues to invest in
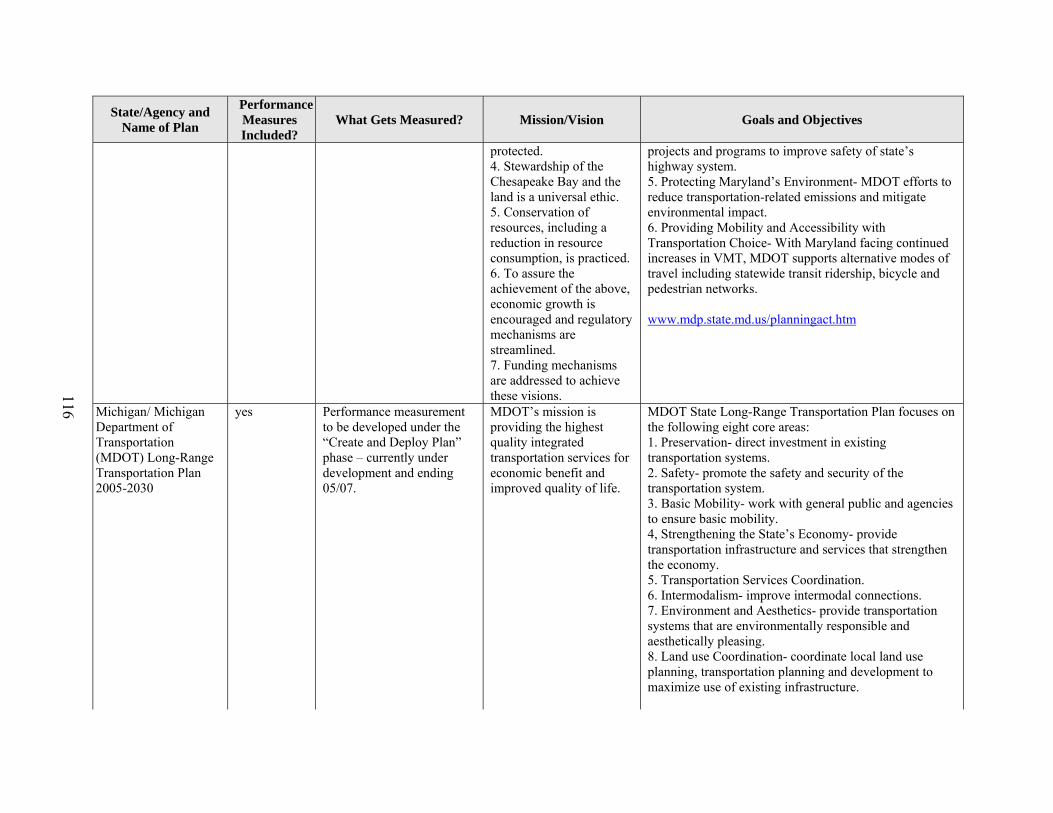
116
State/Agency and Name of Plan
Performance Measures Included?
What Gets Measured? Mission/Vision Goals and Objectives
protected. 4. Stewardship of the Chesapeake Bay and the land is a universal ethic. 5. Conservation of resources, including a reduction in resource consumption, is practiced. 6. To assure the achievement of the above, economic growth is encouraged and regulatory mechanisms are streamlined. 7. Funding mechanisms are addressed to achieve these visions.
projects and programs to improve safety of state’s highway system. 5. Protecting Maryland’s Environment- MDOT efforts to reduce transportation-related emissions and mitigate environmental impact. 6. Providing Mobility and Accessibility with Transportation Choice- With Maryland facing continued increases in VMT, MDOT supports alternative modes of travel including statewide transit ridership, bicycle and pedestrian networks. www.mdp.state.md.us/planningact.htm
Michigan/ Michigan Department of Transportation (MDOT) Long-Range Transportation Plan 2005-2030
yes Performance measurement to be developed under the “Create and Deploy Plan” phase – currently under development and ending 05/07.
MDOT’s mission is providing the highest quality integrated transportation services for economic benefit and improved quality of life.
MDOT State Long-Range Transportation Plan focuses on the following eight core areas: 1. Preservation- direct investment in existing transportation systems. 2. Safety- promote the safety and security of the transportation system. 3. Basic Mobility- work with general public and agencies to ensure basic mobility. 4, Strengthening the State’s Economy- provide transportation infrastructure and services that strengthen the economy. 5. Transportation Services Coordination. 6. Intermodalism- improve intermodal connections. 7. Environment and Aesthetics- provide transportation systems that are environmentally responsible and aesthetically pleasing. 8. Land use Coordination- coordinate local land use planning, transportation planning and development to maximize use of existing infrastructure.
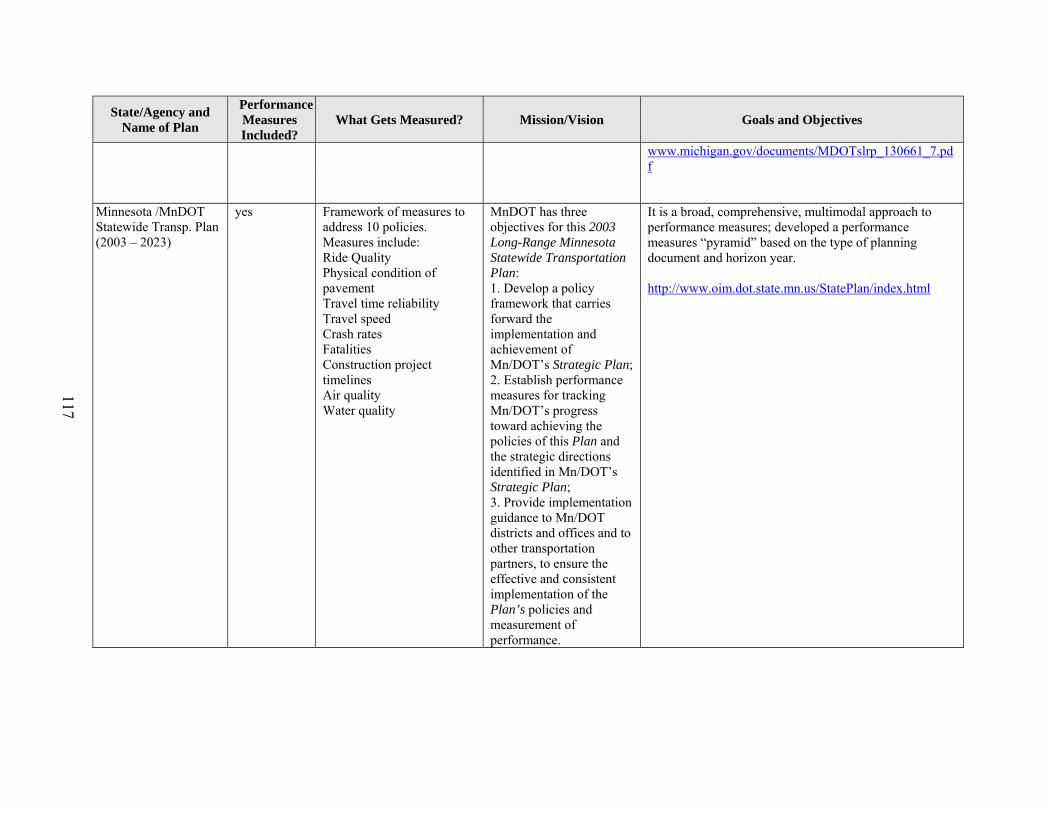
117
State/Agency and Name of Plan
Performance Measures Included?
What Gets Measured? Mission/Vision Goals and Objectives
www.michigan.gov/documents/MDOTslrp_130661_7.pdf
Minnesota /MnDOT Statewide Transp. Plan (2003 – 2023)
yes Framework of measures to address 10 policies. Measures include: Ride Quality Physical condition of pavement Travel time reliability Travel speed Crash rates Fatalities Construction project timelines Air quality Water quality
MnDOT has three objectives for this 2003 Long-Range Minnesota Statewide Transportation Plan: 1. Develop a policy framework that carries forward the implementation and achievement of Mn/DOT’s Strategic Plan; 2. Establish performance measures for tracking Mn/DOT’s progress toward achieving the policies of this Plan and the strategic directions identified in Mn/DOT’s Strategic Plan; 3. Provide implementation guidance to Mn/DOT districts and offices and to other transportation partners, to ensure the effective and consistent implementation of the Plan’s policies and measurement of performance.
It is a broad, comprehensive, multimodal approach to performance measures; developed a performance measures “pyramid” based on the type of planning document and horizon year. http://www.oim.dot.state.mn.us/StatePlan/index.html

118
State/Agency and Name of Plan
Performance Measures Included?
What Gets Measured? Mission/Vision Goals and Objectives
Minnesota / Statewide Highway Systems Operation Plan (HSOP) MnDOT April 2005
yes “Maintenance performance measures” developed in the following areas: Infrastructure maintenance and preservation Supporting infrastructure management User mobility and travel reliability Snow and ice management Safety
Defining performance measures and establishing performance targets has allowed Mn/DOT to track performance and to evaluate whether it is achieving the targets. Mn/DOT has made a significant effort to develop performance measures and track performance of key activities. The HSOP provides an opportunity to formally document and improve existing measures, identify new measures, and assess data and reporting issues. http://www.oim.dot.state.mn.us/Final-HSOP.pdf
Minnesota (MnDOT) Performance Management Cycle (presented at TRB Workshop 115, 1-21-2007)
Performance management, not performance measures
*Plan – Performance-based Project Selection and Development
*Do – Track, Predict, and Analyze Performance Results
*Report – Identify Course of Action
*Act – Adjusts Plans and Programs
Strategic Directions: 1. Safeguard what exists. 2. Make the transportation network operate better. 3. Make the Mn/DOT work better.

119
State/Agency and Name of Plan
Performance Measures Included?
What Gets Measured? Mission/Vision Goals and Objectives
Missouri (MoDOT) “TRACKER” (July 2006)
Yes
Measures address the following criteria: • Uninterrupted Traffic Flow • Smooth and Unrestricted Roads and Bridges • Safe Transportation System • Roadway Visibility • Personal, Fast, Courteous and Understandable Response to Customer Requests (Inbound) • Partner With Others to Deliver Transportation Services • Leverage Transportation to Advance Economic Development • Innovative Transportation Solutions • Fast Projects That Are of Great Value • Environmentally Responsible • Efficient Movement of Goods • Easily Accessible Modal Choices • Customer Involvement in Transportation Decision-Making • Convenient, Clean and Safe Roadside Accommodations • Best Value for Every Dollar Spent
MoDOT Mission: “…to provide a world-class transportation experience that delights our customers and promotes a prosperous Missouri..” MoDOT Value Statements represent the fundamental principles and philosophy of the agency and guide the agency's behavior. MoDOT’s Mission and Value Statements provide the basis for the Tracker. Each performance measure (18 of them) listed on the Tracker is designed to help focus on successfully achieving those measures.
The Tracker will be available in a printed format and on MoDOT’s website at www.modot.org to ensure accountability and allow customers to see the progress towards the results they expect. http://www.modot.org/about/general_info/Tracker.htm http://www.modot.mo.gov/about/general_info/strategicplan.htm

120
State/Agency and Name of Plan
Performance Measures Included?
What Gets Measured? Mission/Vision Goals and Objectives
• Attractive Roadsides • Advocate for Transportation Issues • Accurate, Timely, Understandable and Proactive Transportation Information (Outbound)
Montana /Montana Department of Transportation (MDT) TranPlan21-Long-Range Transportation Policy Plan
no MDT’s mission is to serve the public by providing a transportation system and services that emphasize quality, safety, cost, effectiveness, economic vitality, and sensitivity to the environment.
1.Establish explicit priorities for roadway improvements. 2. Preserve mobility for people and industry in Montana. 3. Improve productivity of the roadway system. 4. Preserve efficient functioning of the transportation system used by export-oriented industries. 5. Monitor and address capacity needs arising from economic growth trends. 6. Support state and local economic development initiatives. 7. Support the tourism industry through promoting access. 8. Improve traveler safety and reduce number and severity of traffic crashes. 9. Improve corridor level access management. 10. Institutionalize bicycle and pedestrian modes. 11. Promote and support increased use of public transportation systems. www.mdt.mt.gov/pubinvolve/tranplan21.shtml
New Jersey /New Jersey Department of Transportation (NJDOT) Transportation Choices 2025
no NJDOT’s mission is to provide reliable, environmentally and socially responsible transportation and motor vehicle networks and services to support and improve the safety and mobility of people and goods in New Jersey.
Initiatives developed to coordinate transportation improvements revitalization and economic development: 1. Access Management- major expansion of transit facilities. 2. Value Pricing- innovative ways to reduce congestion by modifying travel demand patterns. 3. Transit Villages- promote the use of multimodal means of transportation and serve as a catalyst for local economic revitalization. 4. Scenic Byways- promote awareness of one of state’s
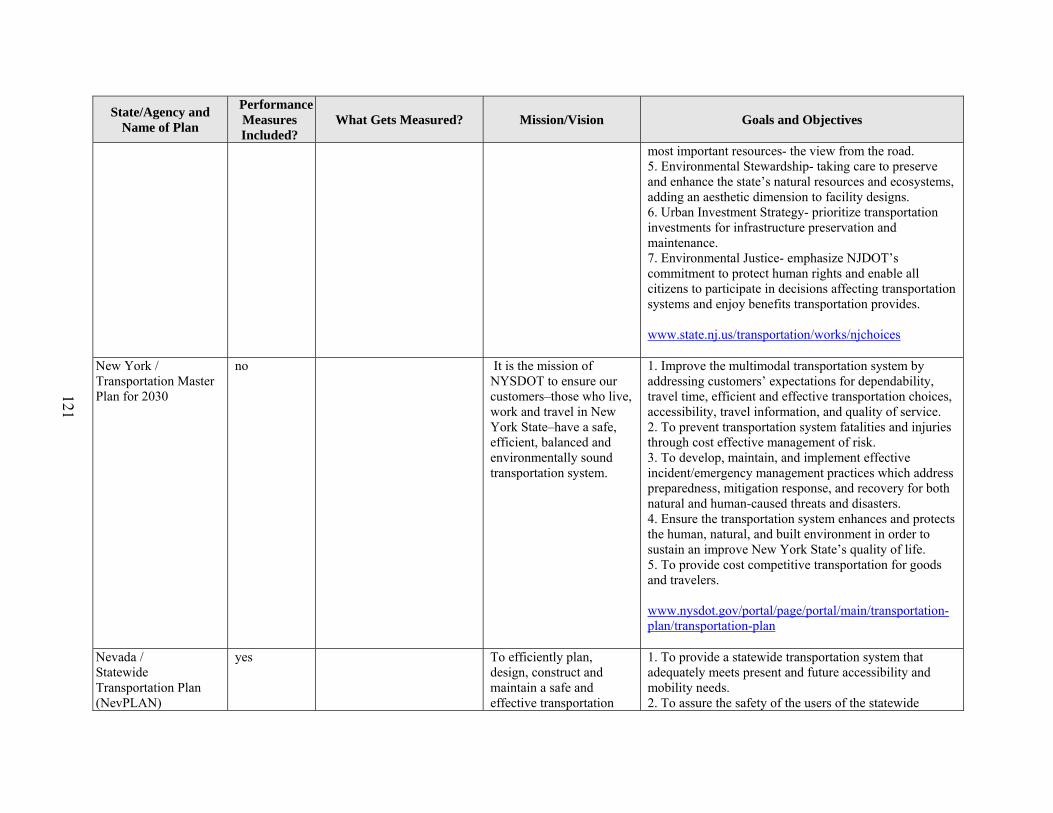
121
State/Agency and Name of Plan
Performance Measures Included?
What Gets Measured? Mission/Vision Goals and Objectives
most important resources- the view from the road. 5. Environmental Stewardship- taking care to preserve and enhance the state’s natural resources and ecosystems, adding an aesthetic dimension to facility designs. 6. Urban Investment Strategy- prioritize transportation investments for infrastructure preservation and maintenance. 7. Environmental Justice- emphasize NJDOT’s commitment to protect human rights and enable all citizens to participate in decisions affecting transportation systems and enjoy benefits transportation provides. www.state.nj.us/transportation/works/njchoices
New York / Transportation Master Plan for 2030
no It is the mission of NYSDOT to ensure our customers–those who live, work and travel in New York State–have a safe, efficient, balanced and environmentally sound transportation system.
1. Improve the multimodal transportation system by addressing customers’ expectations for dependability, travel time, efficient and effective transportation choices, accessibility, travel information, and quality of service. 2. To prevent transportation system fatalities and injuries through cost effective management of risk. 3. To develop, maintain, and implement effective incident/emergency management practices which address preparedness, mitigation response, and recovery for both natural and human-caused threats and disasters. 4. Ensure the transportation system enhances and protects the human, natural, and built environment in order to sustain an improve New York State’s quality of life. 5. To provide cost competitive transportation for goods and travelers. www.nysdot.gov/portal/page/portal/main/transportation-plan/transportation-plan
Nevada / Statewide Transportation Plan (NevPLAN)
yes To efficiently plan, design, construct and maintain a safe and effective transportation
1. To provide a statewide transportation system that adequately meets present and future accessibility and mobility needs. 2. To assure the safety of the users of the statewide
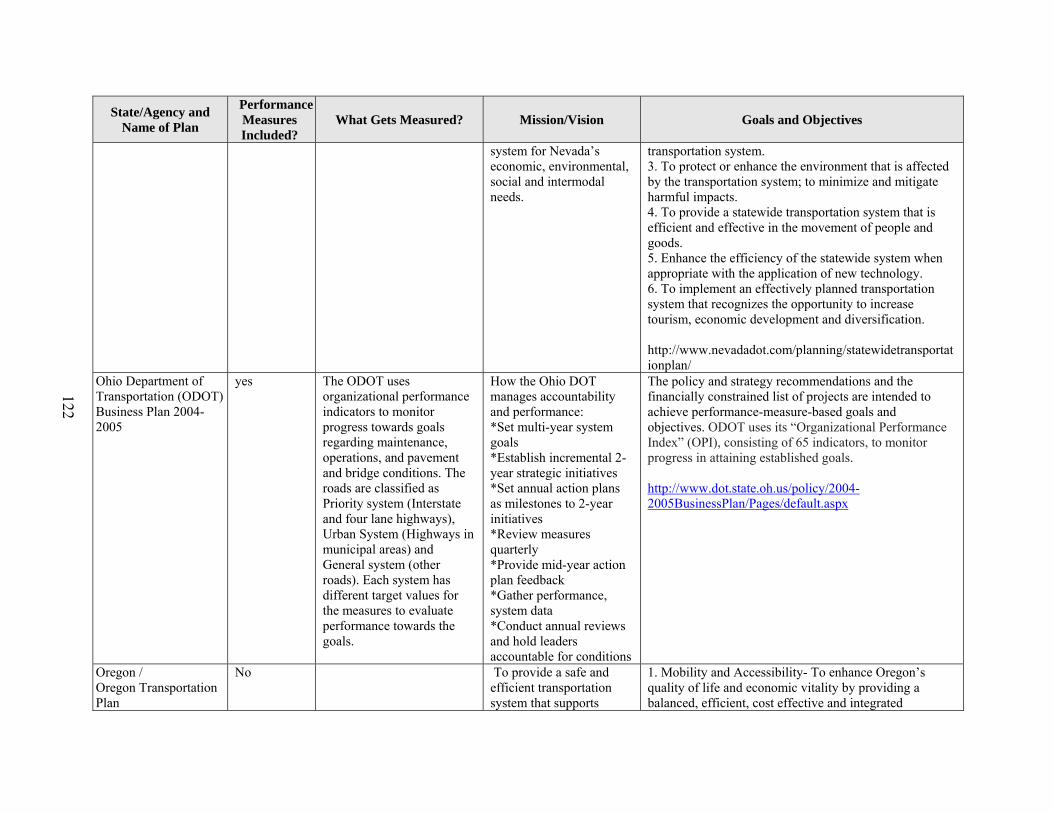
122
State/Agency and Name of Plan
Performance Measures Included?
What Gets Measured? Mission/Vision Goals and Objectives
system for Nevada’s economic, environmental, social and intermodal needs.
transportation system. 3. To protect or enhance the environment that is affected by the transportation system; to minimize and mitigate harmful impacts. 4. To provide a statewide transportation system that is efficient and effective in the movement of people and goods. 5. Enhance the efficiency of the statewide system when appropriate with the application of new technology. 6. To implement an effectively planned transportation system that recognizes the opportunity to increase tourism, economic development and diversification. http://www.nevadadot.com/planning/statewidetransportationplan/
Ohio Department of Transportation (ODOT) Business Plan 2004-2005
yes The ODOT uses organizational performance indicators to monitor progress towards goals regarding maintenance, operations, and pavement and bridge conditions. The roads are classified as Priority system (Interstate and four lane highways), Urban System (Highways in municipal areas) and General system (other roads). Each system has different target values for the measures to evaluate performance towards the goals.
How the Ohio DOT manages accountability and performance: *Set multi-year system goals *Establish incremental 2-year strategic initiatives *Set annual action plans as milestones to 2-year initiatives *Review measures quarterly *Provide mid-year action plan feedback *Gather performance, system data *Conduct annual reviews and hold leaders accountable for conditions
The policy and strategy recommendations and the financially constrained list of projects are intended to achieve performance-measure-based goals and objectives. ODOT uses its “Organizational Performance Index” (OPI), consisting of 65 indicators, to monitor progress in attaining established goals. http://www.dot.state.oh.us/policy/2004-2005BusinessPlan/Pages/default.aspx
Oregon / Oregon Transportation Plan
No To provide a safe and efficient transportation system that supports
1. Mobility and Accessibility- To enhance Oregon’s quality of life and economic vitality by providing a balanced, efficient, cost effective and integrated
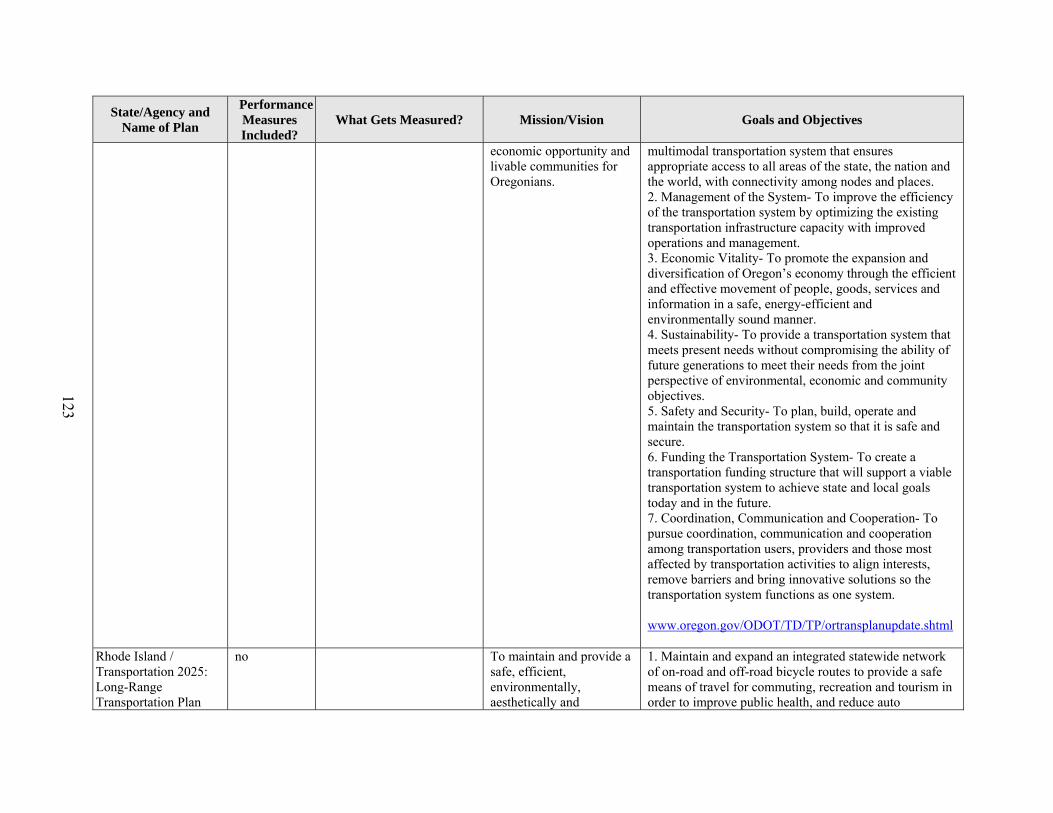
123
State/Agency and Name of Plan
Performance Measures Included?
What Gets Measured? Mission/Vision Goals and Objectives
economic opportunity and livable communities for Oregonians.
multimodal transportation system that ensures appropriate access to all areas of the state, the nation and the world, with connectivity among nodes and places. 2. Management of the System- To improve the efficiency of the transportation system by optimizing the existing transportation infrastructure capacity with improved operations and management. 3. Economic Vitality- To promote the expansion and diversification of Oregon’s economy through the efficient and effective movement of people, goods, services and information in a safe, energy-efficient and environmentally sound manner. 4. Sustainability- To provide a transportation system that meets present needs without compromising the ability of future generations to meet their needs from the joint perspective of environmental, economic and community objectives. 5. Safety and Security- To plan, build, operate and maintain the transportation system so that it is safe and secure. 6. Funding the Transportation System- To create a transportation funding structure that will support a viable transportation system to achieve state and local goals today and in the future. 7. Coordination, Communication and Cooperation- To pursue coordination, communication and cooperation among transportation users, providers and those most affected by transportation activities to align interests, remove barriers and bring innovative solutions so the transportation system functions as one system. www.oregon.gov/ODOT/TD/TP/ortransplanupdate.shtml
Rhode Island / Transportation 2025: Long-Range Transportation Plan
no To maintain and provide a safe, efficient, environmentally, aesthetically and
1. Maintain and expand an integrated statewide network of on-road and off-road bicycle routes to provide a safe means of travel for commuting, recreation and tourism in order to improve public health, and reduce auto
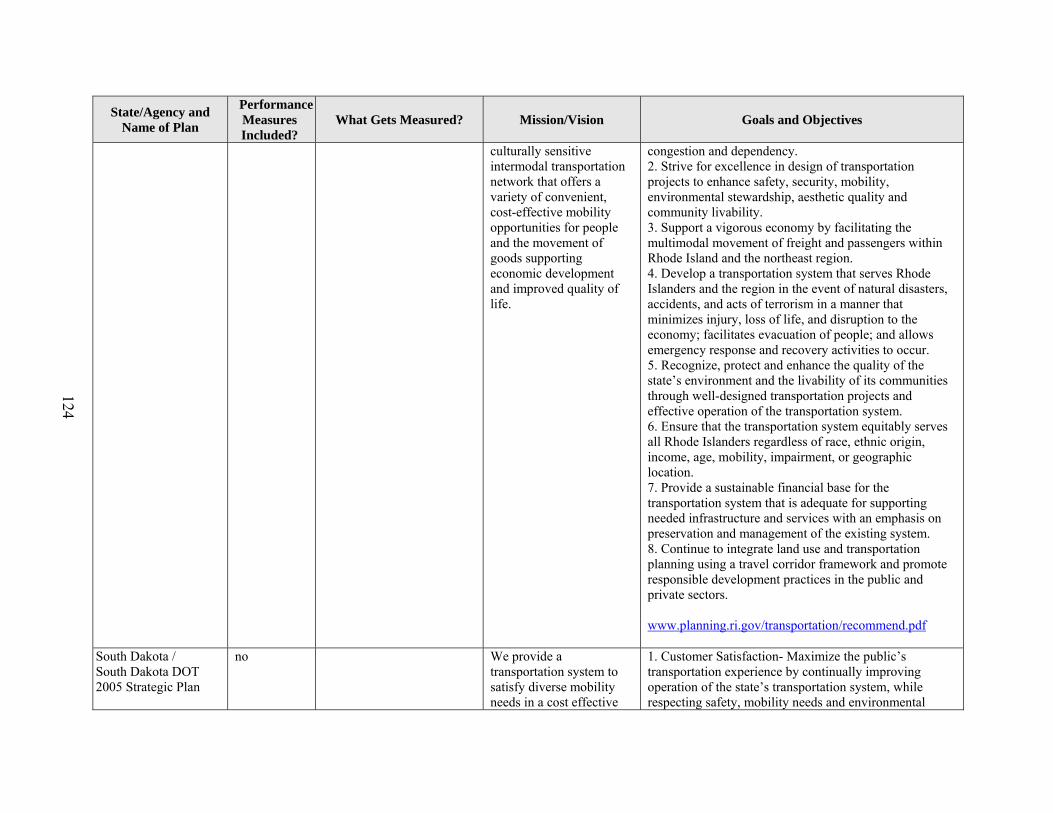
124
State/Agency and Name of Plan
Performance Measures Included?
What Gets Measured? Mission/Vision Goals and Objectives
culturally sensitive intermodal transportation network that offers a variety of convenient, cost-effective mobility opportunities for people and the movement of goods supporting economic development and improved quality of life.
congestion and dependency. 2. Strive for excellence in design of transportation projects to enhance safety, security, mobility, environmental stewardship, aesthetic quality and community livability. 3. Support a vigorous economy by facilitating the multimodal movement of freight and passengers within Rhode Island and the northeast region. 4. Develop a transportation system that serves Rhode Islanders and the region in the event of natural disasters, accidents, and acts of terrorism in a manner that minimizes injury, loss of life, and disruption to the economy; facilitates evacuation of people; and allows emergency response and recovery activities to occur. 5. Recognize, protect and enhance the quality of the state’s environment and the livability of its communities through well-designed transportation projects and effective operation of the transportation system. 6. Ensure that the transportation system equitably serves all Rhode Islanders regardless of race, ethnic origin, income, age, mobility, impairment, or geographic location. 7. Provide a sustainable financial base for the transportation system that is adequate for supporting needed infrastructure and services with an emphasis on preservation and management of the existing system. 8. Continue to integrate land use and transportation planning using a travel corridor framework and promote responsible development practices in the public and private sectors. www.planning.ri.gov/transportation/recommend.pdf
South Dakota / South Dakota DOT 2005 Strategic Plan
no We provide a transportation system to satisfy diverse mobility needs in a cost effective
1. Customer Satisfaction- Maximize the public’s transportation experience by continually improving operation of the state’s transportation system, while respecting safety, mobility needs and environmental
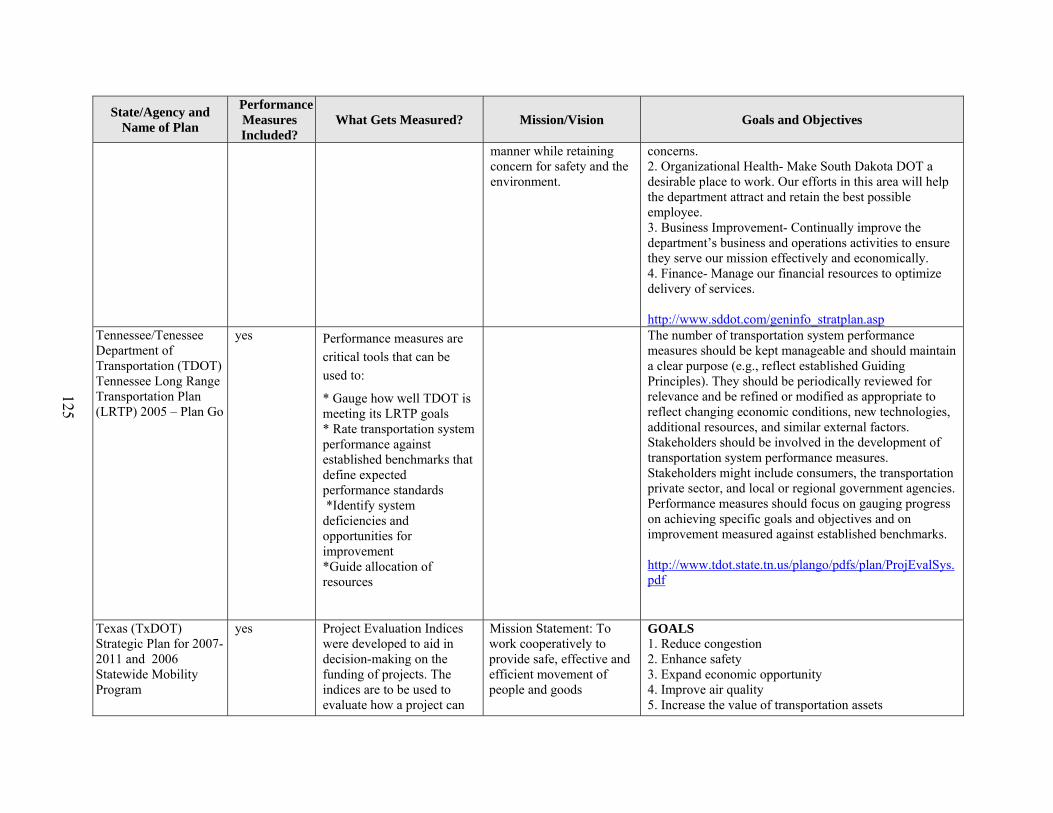
125
State/Agency and Name of Plan
Performance Measures Included?
What Gets Measured? Mission/Vision Goals and Objectives
manner while retaining concern for safety and the environment.
concerns. 2. Organizational Health- Make South Dakota DOT a desirable place to work. Our efforts in this area will help the department attract and retain the best possible employee. 3. Business Improvement- Continually improve the department’s business and operations activities to ensure they serve our mission effectively and economically. 4. Finance- Manage our financial resources to optimize delivery of services. http://www.sddot.com/geninfo_stratplan.asp
Tennessee/Tenessee Department of Transportation (TDOT) Tennessee Long Range Transportation Plan (LRTP) 2005 – Plan Go
yes Performance measures are critical tools that can be used to:
* Gauge how well TDOT is meeting its LRTP goals * Rate transportation system performance against established benchmarks that define expected performance standards *Identify system deficiencies and opportunities for improvement *Guide allocation of resources
The number of transportation system performance measures should be kept manageable and should maintain a clear purpose (e.g., reflect established Guiding Principles). They should be periodically reviewed for relevance and be refined or modified as appropriate to reflect changing economic conditions, new technologies, additional resources, and similar external factors. Stakeholders should be involved in the development of transportation system performance measures. Stakeholders might include consumers, the transportation private sector, and local or regional government agencies. Performance measures should focus on gauging progress on achieving specific goals and objectives and on improvement measured against established benchmarks. http://www.tdot.state.tn.us/plango/pdfs/plan/ProjEvalSys.pdf
Texas (TxDOT) Strategic Plan for 2007-2011 and 2006 Statewide Mobility Program
yes Project Evaluation Indices were developed to aid in decision-making on the funding of projects. The indices are to be used to evaluate how a project can
Mission Statement: To work cooperatively to provide safe, effective and efficient movement of people and goods
GOALS 1. Reduce congestion 2. Enhance safety 3. Expand economic opportunity 4. Improve air quality 5. Increase the value of transportation assets

126
State/Agency and Name of Plan
Performance Measures Included?
What Gets Measured? Mission/Vision Goals and Objectives
and Biennal Report to Legislative Budget Board
help achieve goals outlined in the DOT’s Strategic Plan. In addition, TxDOT already uses performance measures to prioritize new projects and maintenance work, as part of the Statewide Mobility Program (SMP). Each category of maintenance/development is given criteria by which the project can be evaluated.
Vision:
1.Providing comfortable, safe, durable, cost-effective, environmentally sensitive and aesthetically appealing transportation systems that work together,
2.Ensuring a safe and desirable workplace which creates a diverse team of all kinds of people and professions,
3.Using efficient and cost-effective work methods that encourage innovation and creativity, and
4.Promoting a higher quality of life through partnerships with the citizens of Texas and all branches of government by being receptive, responsible and cooperative
http://www.dot.state.tx.us/about_us/mission.htm
Vermont /Vermont Agency of Transportation (VTran) Long-Range Transportation Plan – Summary Report 2006
no VTran’s mission is to preserve, develop, and enhance an integrated transportation system to support Vermont’s quality of life and economic well-being.
1. Support and maintain Vermont’s transportation system and promote efficient operations of that system. 2. Promote and support the use and connection of appropriate forms of transportation. 3. Support Vermont’s economy by providing appropriate transportation access to all areas of the state. 4. Cooperate with Vermont residents, towns, regions,

127
State/Agency and Name of Plan
Performance Measures Included?
What Gets Measured? Mission/Vision Goals and Objectives
other state agencies, and interested parties in making transportation decisions that balance the needs of human and natural environments. 5. Seek adequate, stable funding and staffing to support mission requirements. 6. Provide employee training and skills enhancement to build a strong, professional work force. 7. Encourage and recognize innovation, flexibility, and excellence. 8. Foster communication and promote teamwork. www.aot.state.vt.us/planning/Documents/LRTPfinal.pdf
Washington State Department of Transportation (WSDOT) MAP Team (Multi-Agency Permitting team)
yes Investments in early project coordination are being tracked through eight performance measures in three categories: Time Cost Changes in Business Practices
The eight PMs are: 1. WSDOT Pre-Permit Application Process 2. Early Project Coordination Meeting 3. MAP Team Agencies Submit Permit Responsibility/ Expectations 4. WSDOT Submits Permit Application 5. MAP Team Reviews Permit Application for Regulatory Consistency 6. MAP Team Processes the Permit Application 7. WSDOT Submits Additional Information 8. MAP Team Agencies Render Individual Agency Permit Decisions
The MAP Team is a pilot program, co-locating five agencies in a common office, with one primary goal – providing permit services for a selected set of WSDOT projects. Secondary goals include: improving environmental mitigation associated with project impacts, assessing and cooperatively resolving project risks, and actively seeking improvement opportunities. In the process of doing so, the MAP Team identifies potential permitting risks, develops cooperative processes and solutions, and provides a unified package of environmental information to the project manager early enough to make a difference. This process can reduce environmental impacts and provide a structured environmental permitting process resulting in efficient project delivery. http://www.wsdot.wa.gov/environment/mapteam/

128
State/Agency and Name of Plan
Performance Measures Included?
What Gets Measured? Mission/Vision Goals and Objectives
WSDOT Measures, Markers, and Mileposts (The Gray Notebook, quarterly report to the Governor and Transportation Commission) 9/30/2006
yes Some examples of related accountability and performance products include:
• Statewide Benchmarks (for 8 PMs)
• Congestion Measures
• Business Directions
• Budget Activities • Washington
Transp. Plan • Research &
Development
The Gray Notebook is the foundation for agency performance assessment and reporting as well as public and legislative communication. The Gray Notebook uses a special style of reporting called “Performance Journalism.” PJ is the combination of quantitative reporting using charts, tables, and measurements and storytelling in the form of special features, text, and pictures.
The purpose of The Gray Notebook is to keep WSDOT accountable to the governor, Washington State citizens, legislators, and transportation organizations. It is also an important internal management and integration tool….Agency-wide performance reporting is a high priority at WSDOT. http://www.wsdot.wa.gov/accountability/

129
APPENDIX C: PERFORMANCE MEASUREMENT TABLE – TEXAS MPOS


131
MPO or Responsible
Agency Name of Plan
Performance Measures
included in Plan?
What gets measured? Goals and Objectives
Austin area (CAMPO - Capital Area Metropolitan Planning Organization)
CAMPO Mobility 2030 Plan
yes *Overall System Performance:
Average Weekday Trips
Vehicle-Miles Traveled
*Motor Vehicle System Performance:
Percent of roadways experiencing congestion
Total motor vehicle-hours of travel
Total motor vehicle-hours of delay
Texas Congestion Index
Average network travel speed (miles per hour)
*Alternative Mode Performance:
Walk trips; Bicycle trips;
Carpool trips; Transit trips; Single-Occupant Vehicle trips
*CAMPO Journey to Work Trips in 2030 vs. Big Sister14 Cities in 2000
*Public Transportation System Performance
*Environmental Factors
Fuel Consumption
Air Emissions
The Metropolitan Transportation Plan (MTP) analyzes the future performance of the transportation system by comparing the performance of three alternate transportation systems:
• 2000 transportation system - baseline
• The 2030 “No-Build” transportation system - theoretical future transportation system where no regional transportation improvements are built.
• The 2030 “Financially Constrained” transportation system - demonstrates what conditions in the region could be like in 2030 if the projects called for by this plan are constructed.
http://www.campotexas.org/

132
MPO or Responsible
Agency Name of Plan
Performance Measures
included in Plan?
What gets measured? Goals and Objectives
Abilene MPO FY 2006 Unified Planning Work Program (UPWP)
Abilene Urban Transportation Study
yes Sustainability Measures Include:
*Displacement of businesses or residents allocated by groups and communities;
*Eminent domain actions allocated by groups and communities;
*Availability of scheduled transit service to minority and low-income areas;
*Availability of demand-response transit service to minority and low-income groups and communities;
*Availability of alternative transportation systems, such as pedestrian and bicycle routes, allocated by groups and communities;
*Disruption or improvement of neighborhood connectivity created by proposed transportation investments allocated by groups and communities; and
*Disruption or improvement of safety or physical design and operation of system created by proposed transportation investments allocated by groups and communities.
The MPO will refine its use of various analysis tools related to Title VI and will continue to develop strategies for evaluation of Title VI conformity in project selection on selected performance measures and indicators as selected by the MPO. Also, the MPO will analyze the existing system and proposed improvements for Title VI compliance.
http://www.abilenetx.com/TransportationPlanning/index.htm
Amarillo MPO Amarillo Metropolitan Transportation Plan 2005-2030
yes In the interest of trying to maintain a uniform statewide performance standard the MPO will utilize a Level Of Service Standard (LOSS) for the CMS work plan. The LOSS has established various categories of service based on average daily traffic volumes for different types of roadways.
The MPO developed a Congestion Management System (CMS) designed to be used as a systematic process to provide information on existing and future transportation system performance.

133
MPO or Responsible
Agency Name of Plan
Performance Measures
included in Plan?
What gets measured? Goals and Objectives
http://www.amarillompo.org/
Beaumont area (Jefferson/ Orange/Hardin counties) (Southeast Texas Regional Planning Comission [SETRPC])
FY 2005 Metropolitan Plan - 2030
Transit only
TRANSIT - Performance measures are useful tools that provide insight into a system’s ability to meet specific transit goals and objectives. Federal Transit Administration (FTA) statistical data can be used to make strategic decisions regarding future transit service. More specifically, these performance measures offer planning, budgeting, and cost statistics to monitor and evaluate regional transit services.
Trends seen in the years 1995 to 2004 have been reviewed for each performance measure.
Each measure and its goal are defined below:
− Service Effectiveness
− Increase Annual Passenger Trips (APT) per vehicle revenue mile (VRM) and vehicle revenue hour (VRH)
− Service Efficiency
− Decrease operating expenses per VRH and VRM
− Cost Effectiveness
− Decrease operating expenses per APT and passenger mile
http://www.setrpc.org/images/stories/Transportation/Planning/2005%20mtp%202030%20050211.pdf

134
MPO or Responsible
Agency Name of Plan
Performance Measures
included in Plan?
What gets measured? Goals and Objectives
Brownsville MPO
(MTP not available online for review)
Bryan – College Station MPO
2005-2030 MTP
no http://www.bcsmpo.org/pdffiles/FINAL%20MTP%20-%20LL%20-%20FOR%20PUBLISHING.pdf
Corpus Christi 2007 – 2030 MTP
no http://www.corpuschristi-mpo.org/MPO_MTP.html
Dallas-Ft. Worth
(NCTCOG)
The Metropolitan Mobility Plan 2025
(amended 4/2005)
yes
Utilizes performance measures regarding:
• traffic congestion;
• regional system performance;
• project-specific system performance;
• effectiveness of congestion-reduction strategies;
• financial and air quality impacts and constraints.
These performance measures were also used to evaluate regional system performance, as well as project-specific system performance, in conjunction with the effectiveness of congestion reduction strategies.
http://www.nctcog.org/trans/mtp/previous/mob2025.asp
El Paso area Gateway 2030 Metropolitan Plan
yes *To better evaluate environmental justice principles, the MPO applies a strong quantitative approach that utilizes travel time as a performance measure and executes a number of tests in which the key variable is income level. The objective is to determine the average travel time to connect households of different income levels to locations that provide basic services or activities throughout the region.
http://www.elpasompo.org/ (large file)

135
MPO or Responsible
Agency Name of Plan
Performance Measures
included in Plan?
What gets measured? Goals and Objectives
* The Congestion Management System identifies critical areas for congestion reduction using standard performance measures. The CMS evaluates roadways and intersections by level of service.
*The El Paso MPO will complete the overhaul of the Congestion Management System for the region by next year. The process will establish new performance measures and analyze traffic flows to locate pockets of congestion within the region. Solutions to these specific congestion problems will be developed in the form of projects or programs that can be incorporated into the long-range metropolitan plan.
Harlingen – San Benito
2005-2030 MTP
(unknown; only a project listing and map are available online)
http://www.myharlingen.us/
Hidalgo County (McAllen-Pharr-Edinburg)
2030 MTP The CMS’s goal is to optimize the performance of existing transportation system elements and plan for the optimal performance of future transportation system elements through thoughtful and efficient utilization of a congestion management
One of the most basic of the Procedural Factors is the requirement to preserve the existing system and utilize it to its fullest. This factor encourages MPOs to consider all means of improving the performance of existing facilities before considering

136
MPO or Responsible
Agency Name of Plan
Performance Measures
included in Plan?
What gets measured? Goals and Objectives
monitoring system.
constructing new facilities or making considerable capital improvements to existing facilities.
http://www.lrgvdc.org/mtp.html
Houston - Galveston
2025 Regional Transportation Plan (RTP)
Houston-Galveston Area
yes For the 2025 RTP, system benefits are measured as follows:
System Vehicle-Miles Traveled
System Vehicles-Hours Traveled
Transit Passenger-Miles Traveled
System Average Speed
Three major policies are recommended to achieve the vision of the 2025 RTP:
1. Increase highway and transit system capacity (where feasible and affordable).
2. Improve operations management of existing facilities.
3. Manage the demand for peak-period travel.
These policies include systematic improvements that are applicable in all areas, such as:
System Capacity (Increasing highway and transit system capacity where feasible and affordable):
• provide relief to bottlenecks and gaps through added-capacity
• increase freight rail capacity to reduce truck use of highways
• geometric improvements to roads and intersections
Operations Management (improving the operations management of existing

137
MPO or Responsible
Agency Name of Plan
Performance Measures
included in Plan?
What gets measured? Goals and Objectives
facilities):
• improve traffic incident response
• reduce conflicts with freight operations
• reduce crashes in “hot spots”
• improve the management of work zones
• grade separate congested intersections
Demand Management (managing the demand for peak-period traffic):
• provide incentives to reduce driving during peak-periods of traffic, such as:
• promote teleworking, vanpooling, carpooling and transit
• use peak-period pricing through the use of fees in managed lanes
http://www.wallercounty.org/downloads/2025_RTP.pdf

138
MPO or Responsible
Agency Name of Plan
Performance Measures
included in Plan?
What gets measured? Goals and Objectives
Killeen – Temple MPO
Mobility 2030 MTP; FY 2006/2007 UPWP
yes Performance Measures and Indicators:
* Mobility – Ease of movement of people and goods
* Accessibility – Access to opportunities (jobs, medical care, emergency service, shopping, etc.)
* Environment – Sustainable development and preservation of the existing system and the environment
* Reliability – System reliability
* Safety – Physical design and operation of system
http://www.ktuts.org/upwp.html
http://www.ktuts.org/mobility.html
Laredo MPO Laredo MTP 2005-2030
yes Assists in Travel Demand Modeling analysis http://www.ci.laredo.tx.us/city-planning/planning-zoning/MPO/Laredo_Metropolitan_Transportation_Plan_2030.pdf
Longview MPO
MTP 1998-2030
no http://www.ci.longview.tx.us/services/metropolitan_planning_organization_mpo.html
Lubbock MTP 2030 no http://mpo.ci.lubbock.tx.us/publications.aspx
Midland-Odessa MPO
MOTOR MTP (not available for review on website)
http://www.motormpo.com/
San Angelo San Angelo MTP 2005-
no http://www.sanangelompo.org/pdf/mtp/MTP_MainDoc.pdf

139
MPO or Responsible
Agency Name of Plan
Performance Measures
included in Plan?
What gets measured? Goals and Objectives
2030
San Antonio (MPO)
Mobility 2030 San Antonio – Bexar County
yes In the Congestion Management section of the MTP, programs have been developed to provide methods to monitor and evaluate the performance of the multi-modal transportation system, identify and evaluate alternative actions, provide information supporting the implementation of actions, and evaluate the efficiency and effectiveness of implemented actions.
Congestion Management System guidelines require “establishment of a program for data collection and system performance monitoring to define the extent and duration of congestion, to help determine the causes of congestion, and to evaluate the efficiency and effectiveness of implemented actions.”
http://www.sametroplan.org/pages/Programs_Plans/MTP/mtp.html
Sherman – Denison MPO
2030 MTP no http://www.sdmpo.org/Publications/2030%20MTP%20appvd%20120104.pdf
Texarkana
Draft Texarkana Regional Mobility Plan
July 2006 (MTP not found online)
References the Texas Congestion Index as a performance measure
The TUMP, while a good first step in identifying the issues and problems we face in developing solutions to fund the true transportation needs of the Texarkana region, should not be viewed as an endorsement of the TCI as a single performance measure. Multiple screening factors should be developed that address each of the five planning factors identified in The TxDOT Plan.
http://www.texarkanampo.org/documents/program-documents/TxkRMP_Final_DRAFT_2006_07_18.pdf
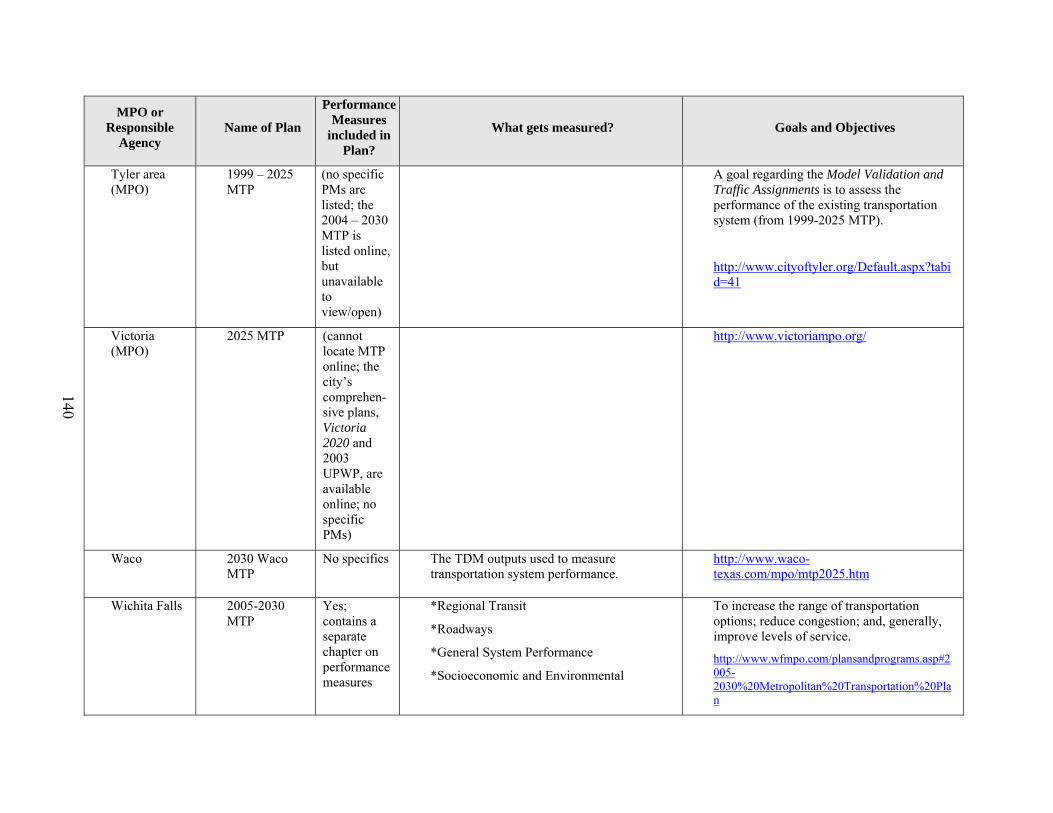
140
MPO or Responsible
Agency Name of Plan
Performance Measures
included in Plan?
What gets measured? Goals and Objectives
Tyler area (MPO)
1999 – 2025 MTP
(no specific PMs are listed; the 2004 – 2030 MTP is listed online, but unavailable to view/open)
A goal regarding the Model Validation and Traffic Assignments is to assess the performance of the existing transportation system (from 1999-2025 MTP).
http://www.cityoftyler.org/Default.aspx?tabid=41
Victoria (MPO)
2025 MTP (cannot locate MTP online; the city’s comprehen-sive plans, Victoria 2020 and 2003 UPWP, are available online; no specific PMs)
http://www.victoriampo.org/
Waco 2030 Waco MTP
No specifics The TDM outputs used to measure transportation system performance.
http://www.waco-texas.com/mpo/mtp2025.htm
Wichita Falls 2005-2030 MTP
Yes; contains a separate chapter on performance measures
*Regional Transit
*Roadways
*General System Performance
*Socioeconomic and Environmental
To increase the range of transportation options; reduce congestion; and, generally, improve levels of service.
http://www.wfmpo.com/plansandprograms.asp#2005-2030%20Metropolitan%20Transportation%20Plan

141
APPENDIX D: DETAILS OF CRASH ESTIMATION PROCEDURE


143
SCALING VALUES FOR CRASH ESTIMATION
• The following plots represent crash frequencies (annual severe crashes per mile) for a 3-year period from 1999 to 2001 on Texas roadways.
• The crash frequencies are plotted versus ADT for different road types and lane widths and used to estimate the scaling values for the analysis.
• The scaling values selected are shown in Chapter 5. Figures D1 to D12 show the scatter plots that formed the basis for selecting these values.
Rural Freeways - 4 Lanes
0
2
4
6
8
10
0 20000 40000 60000 80000 100000 120000
ADT
Ann
ual S
ever
e C
rash
es p
erM
ile
Figure D1. Plot of Crash Frequencies for 4-Lane Rural Freeways.
Rural Freeways - 6 Lanes
0
2
46
8
1012
14
0 20000 40000 60000 80000 100000 120000
ADT
Ann
ual S
ever
e C
rash
es p
erM
ile
Figure D2. Plot of Crash Frequencies for 6-Lane Rural Freeways.
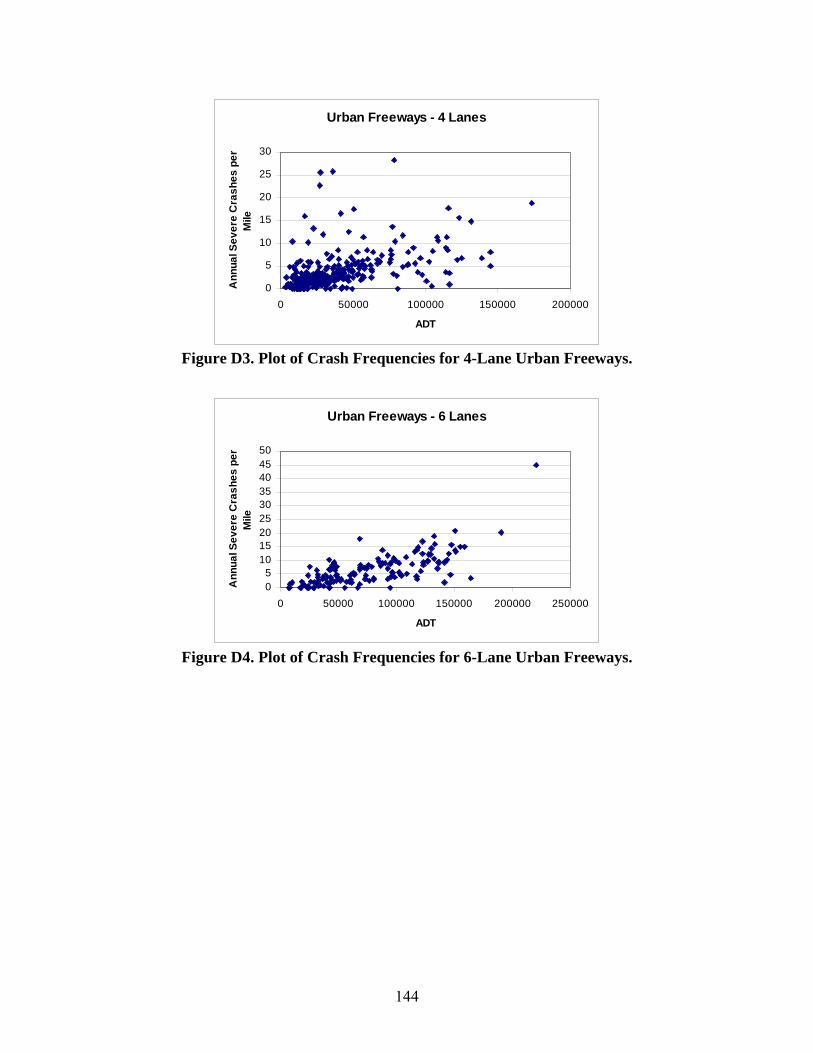
144
Urban Freeways - 4 Lanes
0
5
10
15
20
25
30
0 50000 100000 150000 200000
ADT
Ann
ual S
ever
e C
rash
es p
erM
ile
Figure D3. Plot of Crash Frequencies for 4-Lane Urban Freeways.
Urban Freeways - 6 Lanes
05
101520253035404550
0 50000 100000 150000 200000 250000
ADT
Ann
ual S
ever
e C
rash
es p
erM
ile
Figure D4. Plot of Crash Frequencies for 6-Lane Urban Freeways.

145
Urban Freeways - 8 Lanes or More
0
10
20
30
40
50
60
0 50000 100000 150000 200000 250000 300000 350000
ADT
Ann
ual S
ever
e C
rash
es p
erM
ile
Figure D5. Plot of Crash Frequencies for 8-Lane Urban Freeways.
Rural Highways- Undivided - 2 Lanes
0123456789
0 10000 20000 30000 40000
ADT
Ann
ual C
rash
es/M
ile
Figure D6. Plot of Crash Frequencies for 2-Lane Undivided Rural Highways.
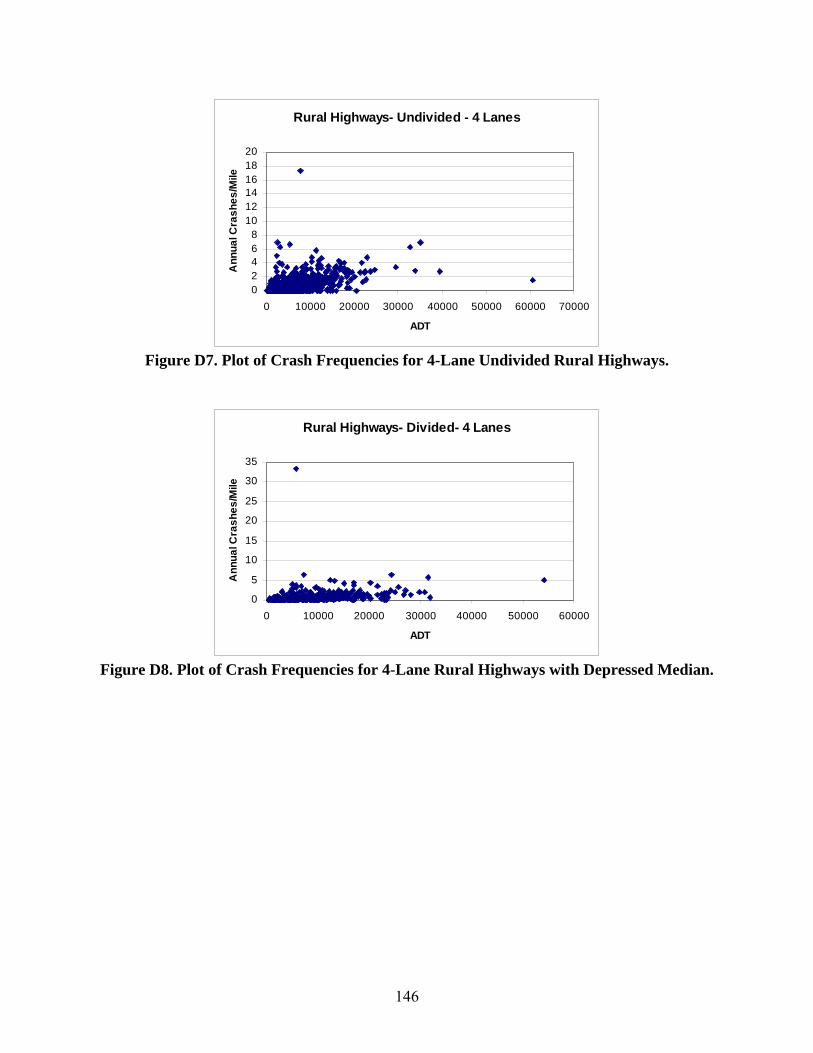
146
Rural Highways- Undivided - 4 Lanes
02468
101214161820
0 10000 20000 30000 40000 50000 60000 70000
ADT
Ann
ual C
rash
es/M
ile
Figure D7. Plot of Crash Frequencies for 4-Lane Undivided Rural Highways.
Rural Highways- Divided- 4 Lanes
0
5
10
15
20
25
30
35
0 10000 20000 30000 40000 50000 60000
ADT
Ann
ual C
rash
es/M
ile
Figure D8. Plot of Crash Frequencies for 4-Lane Rural Highways with Depressed Median.

147
Rural Highways- Divided - 6 or 8 Lanes
02468
1012141618
0 10000 20000 30000 40000 50000 60000 70000
ADT
Ann
ual C
rash
es/M
ile
Figure D9. Plot of Crash Frequencies for 6-8-Lane Rural Highways with Depressed
Median.
Urban Streets - 2 Lanes
0
5
10
15
20
25
30
0 10000 20000 30000 40000 50000 60000 70000
ADT
Ann
ual S
ever
e C
rash
es/M
ile
Figure D10. Plot of Crash Frequencies for 2-Lane Urban Streets.

148
Urban Streets - 4 Lanes
0102030405060708090
0 20000 40000 60000 80000 100000 120000
ADT
Ann
ual S
ever
e C
rash
es/M
ile
Figure D11. Plot of Crash Frequencies for 4-Lane Urban Streets.
Urban Streets - 6 Lanes
0
20
40
60
80
100
120
0 20000 40000 60000 80000 100000 120000
ADT
Ann
ual S
ever
e C
rash
es/M
ile
Figure D12. Plot of Crash Frequencies for 6-Lane Urban Streets.

149
CRASH ESTIMATION PROCEDURE
• The crash estimation procedure is based on the Interim Roadway Safety Design Workbook and is carried out for three roadway types: freeways, urban streets, and rural highways.
• The procedure used in this research has three steps: o Estimate annual severe crashes along roadway length. o Estimate annual severe crashes for all at-grade intersections along length of
roadway. o Combine the roadway and intersection crashes and divide by roadway length to
obtain annual frequency of severe crashes (annual severe crashes per mile). Estimating Crashes along Roadway Length
The formula for estimating crashes along a roadway length is given in Equation D.1. The base crash rates for freeways, rural highways, and urban streets are given in Tables D1-D3.
Total Annual Severe Crashes = 0.000365×Base×ADT×L (D.1) Where,
Base = base crash rate (crashes per million VMT) ADT= average daily traffic L= roadway length
Table D1. Base Crash Rates for Freeways.
Area Type Attributes Base Crash Rate, severe crashes/MVMT
Through Lanes 4 6 8-10 Urban 0.24 0.36 0.54 Rural 0.14 0.21 -
Table D2. Base Crash Rates for Rural Highways.
Median Type Attributes Base Crash Rate, severe crashes/MVMT
Through Lanes 2 4 6 Undivided/Surfaced 0.2 0.3 -
Depressed - 0.21 0.32-

150
Table D3. Base Crash Rates for Urban Streets.
Adjacent Land Use
Attributes Base Crash Rate, severe crashes/MVMT
Median Type Undivided or Two Way Left Turn Lane Median
Raised-Curb Median
Through Lanes 2 4 6 4 6 Undivided/Surfaced 0.95 1.04 1.15 0.75 0.83
Depressed 0.41 0.45 0.5 0.41 0.45
Application of Accident Modification Factors
Accident modification factors (AMFs) are used to reflect the impact certain geometric or design features have on the base crash rate. The base crash rate is adjusted by multiplying it by a set of AMFs. The value of the AMF for a particular feature depends upon how much it deviates from a standard defined value and takes a default value (=1).
In this research, AMFs have been considered for a range of features for each road type. However, this particular set of calculations does not incorporate these AMFs, but instead assumes the existence of default characteristics (such as standard lane widths and shoulder widths, etc). The list of possible AMFs that can be applied is given below. These may be used when a more detailed analysis of crashes is warranted.
• For freeways– o Grade o Lane width o Outside shoulder width o Inside shoulder width o Median width
• For rural highways– o Grade o Lane width o Outside shoulder width o Inside shoulder width o Median width o Presence of a two way left turn lane o Driveway density
• For urban streets– o Lane width o Shoulder width o Driveway density o Presence of a two way left turn lane o Truck percentage
Estimating Crashes at Intersections
Intersection crashes are considered only for at-grade intersections (rural highways or urban streets). The formula for estimating crashes for each intersection is given in Equation D.2.

151
The base crash rates for intersections on rural highways and urban streets, for three-leg and four-leg intersections are given in Tables D4 to D7.
Total Annual Severe Crashes = 0.000365×Base×(Qmajor+Qminor) (D.2) Where,
Base = base crash rate (crashes per million entering vehicles) Qmajor= ADT on major road Qminor= ADT on minor road
Table D4. Base Intersection Crash Rates for 3-Leg Rural Intersections.
For Unsignalized Intersections (crashes per MEV)
ADT Ratio of Minor to Major ADT 0.05 0.1 0.15 0.2 0.25
5000 0.1 0.14 0.16 0.18 0.19 10000 0.13 0.18 0.21 0.23 0.25 15000 0.15 0.2 0.24 0.26 0.28 20000 0.17 0.23 0.23 0.26 0.28
>25000 0.18 0.2 0.25 0.28 0.3 For Signalized Intersections (crashes per MEV)
ADT
Ratio of Minor to Major ADT0.05 0.1 0.15 0.2 0.25
5000 0.08 0.11 0.14 0.16 0.17 10000 0.1 0.15 0.18 0.2 0.22 15000 0.12 0.17 0.21 0.23 0.25 20000 0.13 0.19 0.23 0.26 0.28 25000 0.14 0.2 0.25 0.28 0.3 30000 0.15 0.22 0.26 0.3 0.33 40000 0.17 0.24 0.29 0.33 0.36
>50000 0.18 0.26 0.32 0.36 0.39

152
Table D5. Base Intersection Crash Rates for 4-Leg Rural Intersections.
For Unsignalized Intersections (crashes per MEV) Ratio of Minor to Major ADT
ADT 0.1 0.3 0.5 0.7 0.9 5000 0.18 0.26 0.3 0.31 0.32
10000 0.2 0.3 0.34 0.36 0.36 15000 0.22 0.33 0.37 0.39 0.4 20000 0.23 0.32 0.37 0.4 0.42
> 25000 0.25 0.33 0.39 0.42 0.44 For Signalized Intersections (crashes per MEV)
ADT
Ratio of Minor to Major ADT0.1 0.3 0.5 0.7 0.9
5000 0.15 0.24 0.28 0.3 0.31 10000 0.17 0.28 0.32 0.35 0.36 15000 0.18 0.3 0.35 0.38 0.39 20000 0.2 0.32 0.37 0.4 0.42 25000 0.2 0.33 0.39 0.42 0.44 30000 0.21 0.35 0.41 0.44 0.45 40000 0.23 0.37 0.43 0.46 0.48
>50000 0.24 0.38 0.45 0.49 0.5

153
Table D6. Base Intersection Crash Rates for 3-Leg Urban Intersections.
For Unsignalized Intersections (crashes per MEV)
Ratio of Minor to Major ADT 0.05 0.1 0.15 0.2 0.25 0.18 0.21 0.22 0.22 0.23 For Signalized Intersections (crashes per
MEV) Ratio of Minor to Major ADT
0.05 0.1 0.15 0.2 0.25 0.12 0.15 0.17 0.18 0.19
Table D7. Base Intersection Crash Rates for 4-Leg Urban Intersections.
For Unsignalized Intersections (crashes per MEV) Ratio of Minor to Major ADT
ADT 0.1 0.3 0.5 0.7 0.9 5000 0.25 0.29 0.28 0.27 0.26
10000 0.23 0.26 0.26 0.25 0.24 15000 0.22 0.24 0.24 0.23 0.22 20000 0.21 0.2 0.21 0.21 0.21
> 25000 0.2 0.19 0.2 0.21 0.2 For Signalized Intersections (crashes per MEV)
ADT
Ratio of Minor to Major ADT0.1 0.3 0.5 0.7 0.9
5000 0.19 0.24 0.26 0.26 0.26 10000 0.17 0.22 0.23 0.23 0.23 15000 0.16 0.21 0.22 0.22 0.22 20000 0.15 0.2 0.21 0.21 0.21 25000 0.15 0.19 0.2 0.21 0.2 30000 0.14 0.19 0.2 0.2 0.2 40000 0.14 0.18 0.19 0.19 0.19
>50000 0.13 0.17 0.18 0.19 0.18

155
APPENDIX E: DETAILS OF TRUCK THROUGHPUT EFFICIENCY MEASURE


157
CALCULATION OF EXTREME VALUES FOR TRUCK THROUGHPUT EFFICIENCY
• In order to obtain the extreme values for scaling of the truck throughput efficiency, the measure was calculated for a range of ADTs and truck percentages.
• The range of ADT considered was from 5000 to 25,000 ADT per lane. The range of truck percentages considered was from 2 percent to 20 percent.
• Based on the calculation of throughput efficiency (daily truck-miles per hour per lane), the minimum and maximum values were assigned as the worst and best case scenarios respectively. These values are calculated as 5640 and 170,704 daily truck-miles per hour per lane, as shown in Table E1.
• It can be observed that the optimum value for truck throughput does not correspond to the maximum truck percentage. This indicates the effect increased traffic and truck volumes have on the speed.
• Figure E1 shows how the throughput efficiency varies with truck percentage for different ADT per lane values. It can be seen that the marginal gain in the throughput efficiency decreases as ADT increases, and that the values corresponding to an ADT per lane of 20,000 are more than those corresponding to an ADT per lane of 25,000. Thus, this performance measure does optimize truck throughput and is not merely a surrogate measure for truck percentages.
020000400006000080000
100000120000140000160000180000
2 5 10 15 20
Percentage Trucks (%)
Truc
k Th
roug
hput
Effi
cien
cy
(Tru
ck-m
iles
per h
our p
er la
ne)
ADT-5000ADT-10000ADT-15000ADT-20000ADT-25000
Figure E1. Variation of Truck Throughput Efficiency.

158
Table E1. Calculation of Truck Throughput Efficiency for Different ADT and Percent
Trucks.
ADT/lane Truck Percentage
No. of Trucks/lane
Equivalent ADT/lane
(considering 1 truck = 1.5 pce)
Traffic Operat-
ing Speed (mph)
Truck Speed- 6% less (mph)
Truck Throughput Efficiency
(Daily truck-miles
per hour per lane)
5000
2 100 5050 60.0 56.4 5,640 5 250 5125 60.0 56.4 14,100
10 500 5250 60.0 56.4 28,200 15 750 5375 60.0 56.4 42,300 20 1000 5500 60.0 56.4 56,400
10000
2 200 10,100 60.0 56.4 11,280 5 500 10,250 60.0 56.4 28,200
10 1000 10,500 60.0 56.4 56,400 15 1500 10,750 60.0 56.4 84,600 20 2000 11,000 60.0 56.4 112,800
15000
2 300 15,150 56.4 53.0 15,895 5 750 15,375 56.2 52.8 39,595
10 1500 15,750 55.8 52.5 78,713 15 2250 16,125 55.5 52.2 117,356 20 3000 16,500 55.2 51.8 155,523
20000
2 400 20,200 49.5 46.6 18,627 5 1000 20,500 48.9 45.9 45,919
10 2000 21,000 47.7 44.8 89,676 15 3000 21,500 46.6 43.8 131,271 20 4000 22,000 45.4 42.7 170,704
25000
2 500 25,250 39.1 36.8 18,393 5 1250 25,625 38.6 36.3 45,340
10 2500 26,250 37.7 35.4 88,536 15 3750 26,875 36.8 34.6 129,588 20 5000 27,500 35.9 33.7 168,495
Minimum Value 5,640 Maximum Value 170,704

159
APPENDIX F: EMISSIONS RATES


161
MOBILE6 EMISSIONS RATES – FOR NOX, CO, AND VOC
• The emissions rates considered for the base and future cases, obtained from the MOBILE6 emissions model are presented in Table F1 and Table F2, respectively.
• The emissions rates are expressed as grams per ADT, accounting for the fleet mix and emissions rates for individual vehicle types.
Table F1. MOBILE6 Emissions Rates for Base Case (2005).
Speed (mph) Total Emissions per ADT (grams/mile) VOC NOx CO
2.5 6.62 3.05 27.03 5 2.27 2.68 15.35
10 1.04 2.06 8.98 15 0.70 1.72 7.08 20 0.55 1.63 6.42 25 0.47 1.56 6.17 30 0.42 1.53 6.04 35 0.37 1.52 6.11 40 0.34 1.54 6.50 45 0.31 1.60 6.91 50 0.29 1.69 7.34 55 0.27 1.82 7.79 60 0.25 2.01 8.27 65 0.24 2.28 8.77
Table F2. MOBILE6 Emissions Rates for Future Case (2025).
Speed (mph) Total Emissions per ADT (grams/mile) VOC NOx CO
2.5 2.40 0.61 14.82 5 0.89 0.52 8.49
10 0.43 0.35 4.90 15 0.29 0.27 3.77 20 0.22 0.26 3.33 25 0.19 0.26 3.20 30 0.17 0.25 3.11 35 0.15 0.25 3.11 40 0.14 0.25 3.32 45 0.13 0.26 3.53 50 0.12 0.27 3.75 55 0.11 0.28 3.97 60 0.11 0.30 4.22 65 0.10 0.33 4.47
Emissions Rates for CO2
• While the MOBILE6 model does provide emissions rates for CO2, these rates are not commonly used in emissions modeling applications.

162
• The CO2 emissions rates used in this study are obtained from emissions testing conducted by the Texas Transportation Institute.
• Based on emissions rates for various vehicle types and knowledge of the fleet mix, emissions rates are obtained, as shown in Table C.3. The CO2 emissions rates are considered to be the same for the base and future cases.
Table F3. Emissions Rates for CO2.
Speed (mph) Total Emissions per ADT (grams/mile)
2.5 1137.90 5 1084.38
10 984.87 15 895.36 20 815.86 25 746.38 30 686.90 35 637.44 40 597.99 45 568.55 50 549.12 55 539.70 60 540.30 65 550.90
CALCULATION OF EXTREME VALUES FOR DAILY EMISSIONS
• To obtain the extremes for the scaling of emissions measures, the daily emissions were calculated for a range of ADT values.
• Peak and off-peak operating speeds to obtain the emissions rates were considered to be 35 mph and 60 mph respectively (corresponding to the extreme values that can be obtained in the speed estimation process). The emissions rate for each pollutant for peak and off-peak conditions are shown in Table F4.
• For each level of ADT, two daily emissions values were calculated – a low estimate, in which 20 percent of the total ADT occurs under peak conditions, and a high estimate, where 40 percent of the total ADT occurs under peak conditions.
• The range of ADT values used was from 5000 (considered to represent traffic on a rural road) to 150,000 (considered to represent a 6-lane, high-volume facility). Based on this, daily emissions were estimated. To obtain combined emissions for the case of VOC, NOx, and CO, and for ozone precursors (VOC and NOx only), the individual emissions were combined based on weights derived from their respective damage costs.
• The calculated high and low estimates for combined VOC, NOx and CO emissions, for CO2 emissions, and for ozone precursor (NOx and VOC) emissions are shown in Table F5 and Table F6 for base and future case, respectively.

163
Table F4. Peak and Off-Peak Emissions.
Base Case Emissions at Peak Speed (gm/ADT/mile) VOC NOx CO CO2 0.25 2.01 8.27 540.30
Base Case Emissions at Off-Peak Speed (gm/ADT/mile) VOC NOx CO CO2 0.37 1.52 6.11 637.44
Future Case Emissions at Peak Speed (gm/ADT/mile) VOC NOx CO CO2 0.11 0.30 4.22 540.30
Future Case Emissions at Off-Peak Speed (gm/ADT/mile) VOC NOx CO CO2 0.15 0.25 3.11 637.44
Table F5. Calculation of Total Daily Emissions for Scaling – Base Case.
ADT
Combined NOx, VOC, CO (grams/mile) CO2 (grams/mile) Combined Ozone
Precursors (grams/mile) Low
Estimate High
Estimate Low
Estimate High
Estimate Low
Estimate High
Estimate 5,000 5,761 6,019 3,090,065 2,992,920 5,338 5,56715,000 17,283 18,058 9,270,195 8,978,759 16,015 16,70125,000 28,805 30,097 15,450,325 14,964,598 26,692 27,83535,000 40,327 42,136 21,630,455 20,950,437 37,368 38,96945,000 51,849 54,175 27,810,585 26,936,276 48,045 50,10355,000 63,370 66,214 33,990,715 32,922,115 58,722 61,23765,000 74,892 78,253 40,170,846 38,907,954 69,398 72,37175,000 86,414 90,291 46,350,976 44,893,793 80,075 83,50585,000 97,936 102,330 52,531,106 50,879,632 90,751 94,63995,000 109,458 114,369 58,711,236 56,865,472 101,428 105,773
105,000 120,980 126,408 64,891,366 62,851,311 112,105 116,907115,000 132,502 138,447 71,071,496 68,837,150 122,781 128,041125,000 144,024 150,486 77,251,626 74,822,989 133,458 139,175150,000 172,828 180,583 92,701,951 89,787,587 160,150 167,010

164
Table F6. Calculation of Total Daily Emissions for Scaling – Future Case.
ADT
Combined NOx, VOC, CO (grams/mile) CO2 (grams/mile)
Combined Ozone Precursors
(grams/mile) Low
Estimate High
Estimate Low
Estimate High
Estimate Low
Estimate High
Estimate 5,000 1,289 13,15 3,090,065 2,992,920 1,048 1,05715,000 3,866 39,45 92,70,195 8,978,759 3,143 3,17125,000 6,444 65,76 15,450,325 14,964,598 5,239 5,28635,000 9,022 92,06 21,630,455 20,950,437 7,334 7,40045,000 11,599 11,836 27,810,585 26,936,276 9,429 9,51455,000 14,177 14,467 33,990,715 32,922,115 11,525 11,62965,000 16,754 17,097 40,170,846 38,907,954 13,620 13,74375,000 19,332 19,727 46,350,976 44,893,793 15,716 15,85785,000 21,910 22,358 52,531,106 50,879,632 17,811 17,97195,000 24,487 24,988 58,711,236 56,865,472 19,906 20,086
105,000 27,065 27,618 64,891,366 62,851,311 22,002 22,200115,000 29,642 30,249 71,071,496 68,837,150 24,097 24,314125,000 32,220 32,879 77,251,626 74,822,989 26,193 26,429150,000 38,664 39,455 92,701,951 89,787,587 31,431 31,714
• From Table F5 and Table F6, the following scaling extremes are obtained:
o Combined VOC, NOx, and CO Emissions: Best – 1289 grams/mile/day Worst– 180,583 grams/mile/day
o CO2 Emissions: Best – 2,992,920 grams/mile/day Worst– 92,701,951 grams/mile/day
o Ozone Precursor Emissions: Best – 1048 grams/mile/day Worst – 167,011 grams/mile/day Maximum Difference– 165,963 grams/mile/day
165
APPENDIX G: DATA COLLECTION AND ENTRY FORM FOR ANALYSIS TOOL

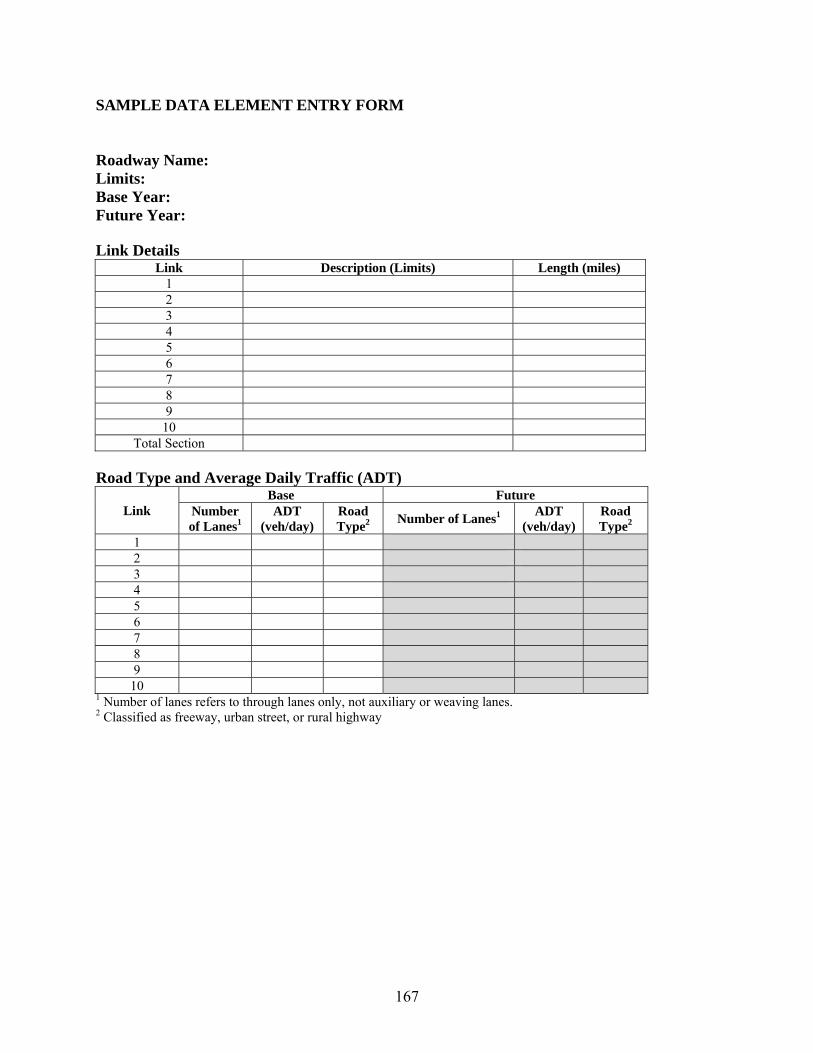
167
SAMPLE DATA ELEMENT ENTRY FORM
Roadway Name: Limits: Base Year: Future Year: Link Details
Link Description (Limits) Length (miles) 1 2 3 4 5 6 7 8 9
10 Total Section
Road Type and Average Daily Traffic (ADT)
Link Base Future
Number of Lanes1
ADT (veh/day)
Road Type2 Number of Lanes1 ADT
(veh/day) Road Type2
1 2 3 4 5 6 7 8 9
10 1 Number of lanes refers to through lanes only, not auxiliary or weaving lanes. 2 Classified as freeway, urban street, or rural highway
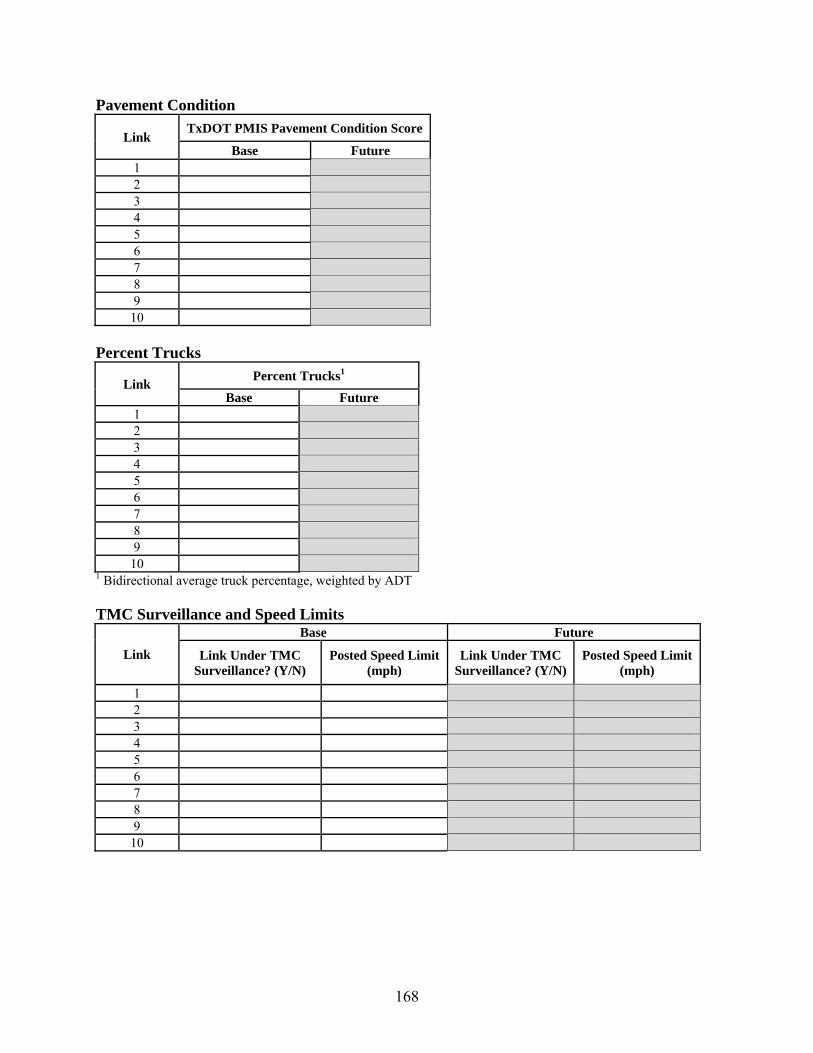
168
Pavement Condition
Link TxDOT PMIS Pavement Condition Score
Base Future 1 2 3 4 5 6 7 8 9
10 Percent Trucks
Link Percent Trucks1 Base Future
1 2 3 4 5 6 7 8 9
10 1 Bidirectional average truck percentage, weighted by ADT TMC Surveillance and Speed Limits
Link
Base Future
Link Under TMC Surveillance? (Y/N)
Posted Speed Limit (mph)
Link Under TMC Surveillance? (Y/N)
Posted Speed Limit (mph)
1 2 3 4 5 6 7 8 9
10
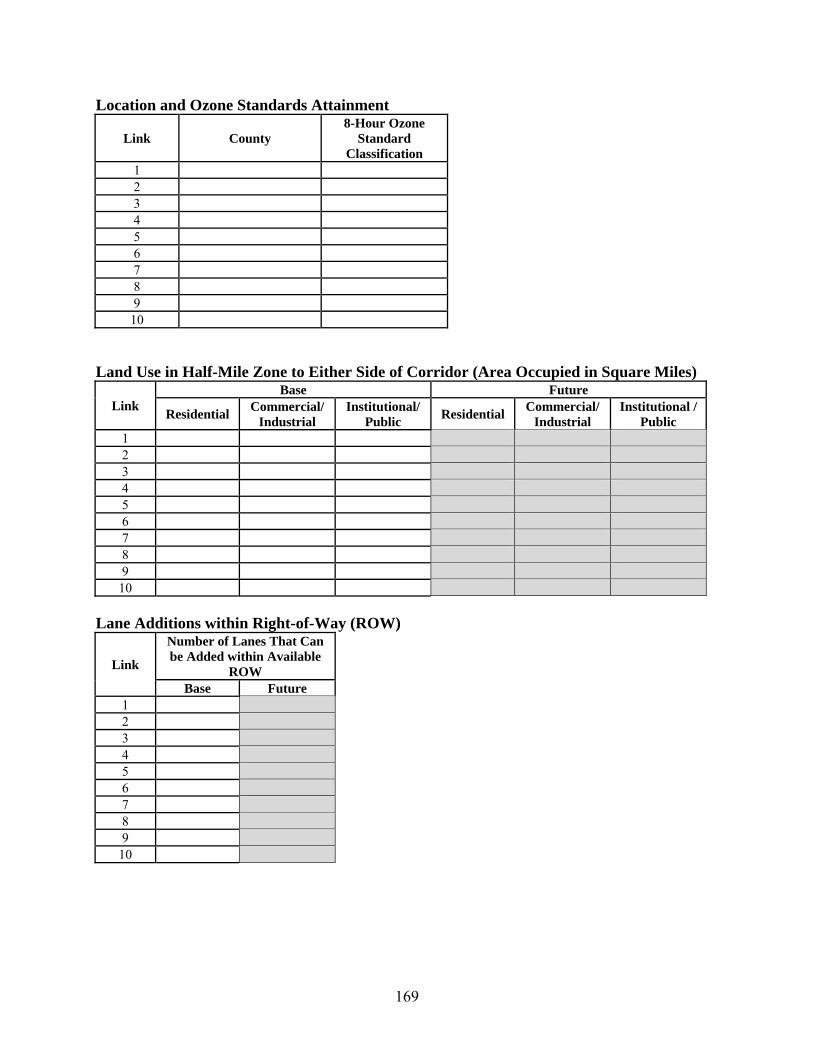
169
Location and Ozone Standards Attainment
Link County 8-Hour Ozone
Standard Classification
1 2 3 4 5 6 7 8 9
10 Land Use in Half-Mile Zone to Either Side of Corridor (Area Occupied in Square Miles)
Link Base Future
Residential Commercial/ Industrial
Institutional/ Public Residential Commercial/
Industrial Institutional /
Public 1 2 3 4 5 6 7 8 9
10 Lane Additions within Right-of-Way (ROW)
Link
Number of Lanes That Can be Added within Available
ROW Base Future
1 2 3 4 5 6 7 8 9
10

170
TRANSIT/HOV OPTIONS Average General-Purpose Lane Occupancy: Base: _________ Future: _________
Link
Base Future
Are There Lanes with
High-Occupancy
Vehicle Restrictions
(Y/N)
Is There Bus or
Bus Rapid
Transit Service
on Link? (Y/N)
Is There Rail
Service Paralleling
This Link? (Y/N)
Are There Lanes with
High-Occupancy
Vehicle Restrictions
(Y/N)
Is There Bus or
Bus Rapid
Transit Service
on Link? (Y/N)
Is There Rail
Service Paralleling
This Link? (Y/N)
1 2 3 4 5 6 7 8 9
10 Data on HOV Lanes (if applicable)
Link
Base Future
Minimum Occupancy
Requirement
Estimated veh/day on HOV lanes
during restricted times
Minimum Occupancy
Requirement
Estimated veh/day on HOV lanes
during restricted times
1 2 3 4 5 6 7 8 9
10
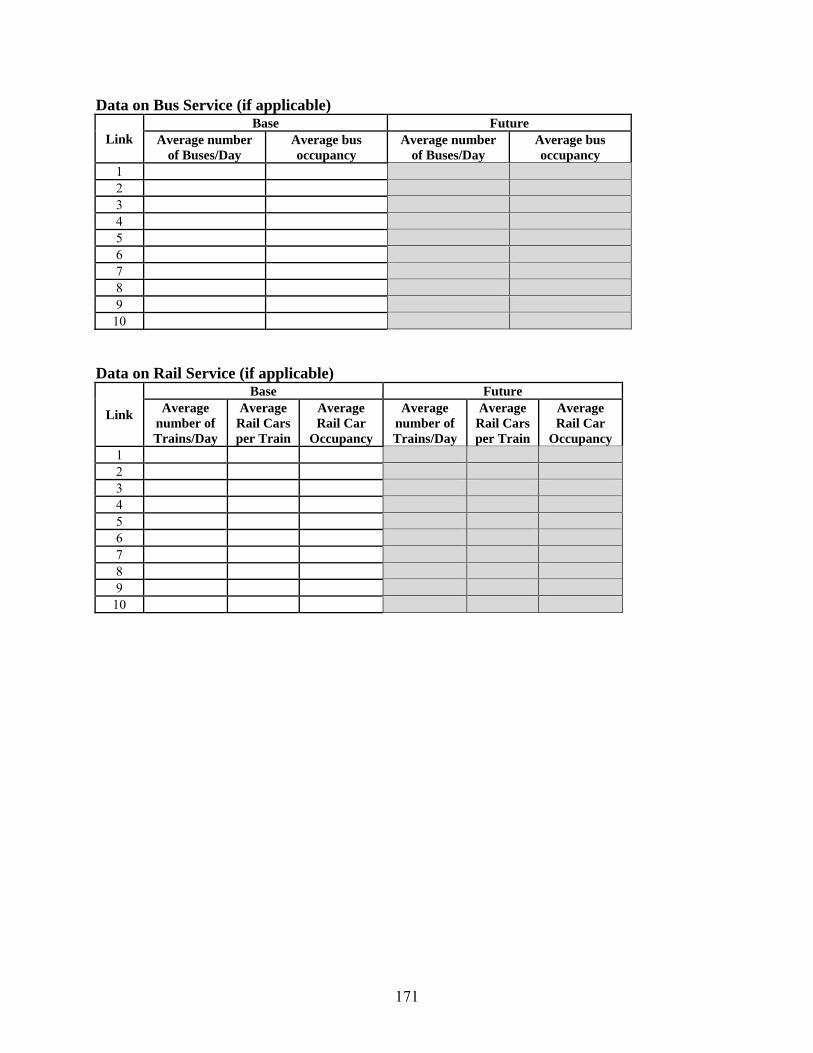
171
Data on Bus Service (if applicable)
Link Base Future
Average number of Buses/Day
Average bus occupancy
Average number of Buses/Day
Average bus occupancy
1 2 3 4 5 6 7 8 9
10 Data on Rail Service (if applicable)
Link
Base Future Average
number of Trains/Day
Average Rail Cars per Train
Average Rail Car
Occupancy
Average number of Trains/Day
Average Rail Cars per Train
Average Rail Car
Occupancy 1 2 3 4 5 6 7 8 9
10

172
COST RECOVERY Operations and Maintenance Costs
Link Proportion of Most Recent Year’s O&M
Expenditure Covered by Alternate Sources1 Base Future
1 2 3 4 5 6 7 8 9
10 1 Alternate sources defined as: non-state/non-federal (i.e., municipal funds, toll revenue, private-sector funding) Capital Costs (If Expenditures are Not Readily Available)
Link Proportion of total capital expenditure to
date, covered by alternate sources1 Base Future
1 2 3 4 5 6 7 8 9
10 1 Alternate sources defined as: non-state/non-federal (i.e., municipal funds, toll revenue, private-sector funding)

173
INTERSECTION DETAILS (FOR CRASH ESTIMATION) (Fill in only for Urban Streets or Rural Highways) 4-Leg Intersections
Link
Base Future
Number of Unsignalized
Number of
Signalized
Avg Minor Road ADT1
(veh/day)
Number of Unsignalized
Number of
Signalized
Avg Minor Road ADT1 (veh/day)
1 2 3 4 5 6 7 8 9
10 1 Average minor road ADT for both signalized and unsignalized intersections
3-Leg Intersections
Link
Base Future
Number of Unsignalized
Number of
Signalized
Avg Minor Road ADT1
(veh/day)
Number of Unsignalized
Number of
Signalized
Avg Minor Road ADT1 (veh/day)
1 2 3 4 5 6 7 8 9
10 1 Average minor road ADT for both signalized and unsignalized intersections

174
DETAILED GEOMETRIC CHARACTERISTICS (FOR CRASH ESTIMATION) (Fill in data only where applicable/available) Grade and Lane Widths
Link Base Future
Grade (%) Lane Width (ft) Grade (%) Lane Width
(ft) 1 2 3 4 5 6 7 8 9
10 Median Type and Widths
Link Base Future
Median Type1 Median Width (ft)
Median Type
Median Width (ft)
1 2 3 4 5 6 7 8 9
10 1 Median Type Options:
For Freeways- Depressed or Surfaced For Rural Highways – Depressed, Surfaced, or TWLTL For Urban Streets – Raised Curb, Undivided, or TWLTL
Shoulder Widths
Link Base Future
Outside Shoulder1 (ft)
Inside Shoulder (ft)
Outside Shoulder1 (ft)
Inside Shoulder (ft)
1 2 3 4 5 6 7 8 9
10 1 For urban streets, indicate use of a curb and gutter section with “C/G”

175
Driveway Density – Only for Rural Highways/Urban Streets
Link Driveway Density (driveways/ mile)
Base Future 1 2 3 4 5 6 7 8 9
10
Area Characterization- Only for Freeways
Link Area Classification1 Base Future
1 2 3 4 5 6 7 8 9
10 1 Classified as urban or rural Land Use Characterization- Only for Urban Streets
Link Predominant Land Use 1 Base Future
1 2 3 4 5 6 7 8 9
10 1 Indicate “C” for commercial, business, or office; “R” for residential or industrial.


177
APPENDIX H: CASE STUDY INPUT DETAILS

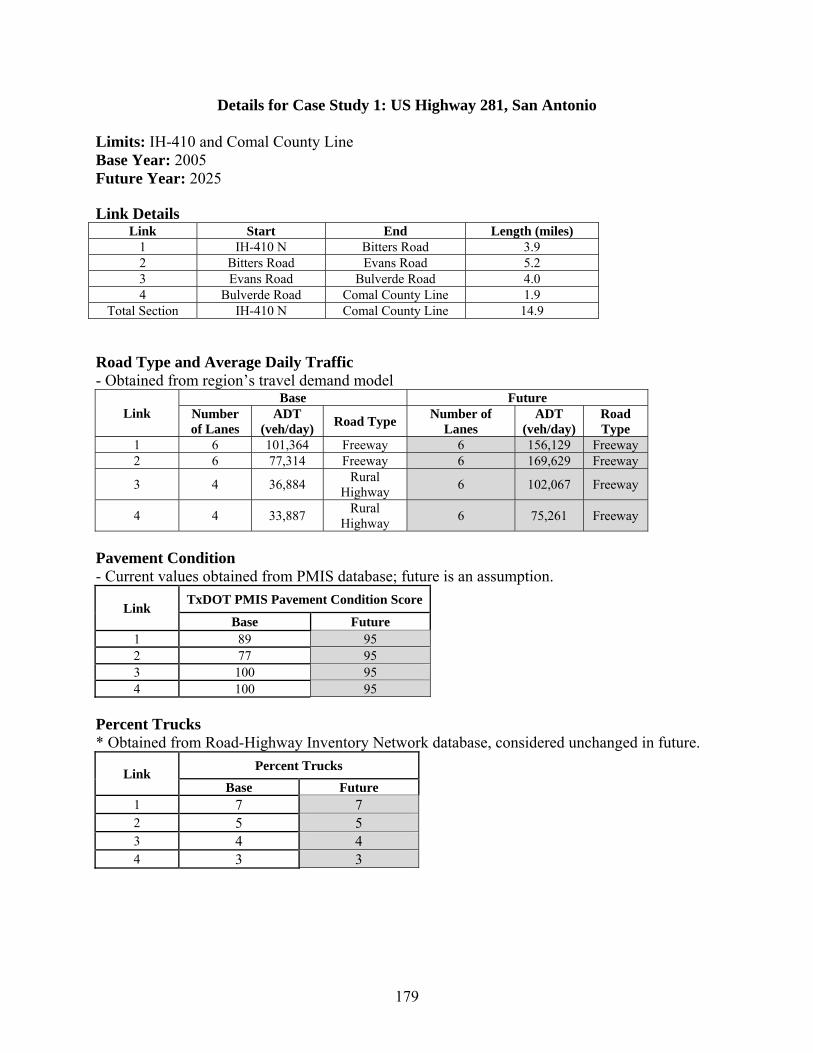
179
Details for Case Study 1: US Highway 281, San Antonio Limits: IH-410 and Comal County Line Base Year: 2005 Future Year: 2025 Link Details
Link Start End Length (miles) 1 IH-410 N Bitters Road 3.9 2 Bitters Road Evans Road 5.2 3 Evans Road Bulverde Road 4.0 4 Bulverde Road Comal County Line 1.9
Total Section IH-410 N Comal County Line 14.9 Road Type and Average Daily Traffic - Obtained from region’s travel demand model
Link Base Future
Number of Lanes
ADT (veh/day) Road Type Number of
Lanes ADT
(veh/day) Road Type
1 6 101,364 Freeway 6 156,129 Freeway 2 6 77,314 Freeway 6 169,629 Freeway
3 4 36,884 Rural Highway 6 102,067 Freeway
4 4 33,887 Rural Highway 6 75,261 Freeway
Pavement Condition - Current values obtained from PMIS database; future is an assumption.
Link TxDOT PMIS Pavement Condition Score
Base Future 1 89 95 2 77 95 3 100 95 4 100 95
Percent Trucks * Obtained from Road-Highway Inventory Network database, considered unchanged in future.
Link Percent Trucks Base Future
1 7 7 2 5 5 3 4 4 4 3 3

180
TMC Surveillance and Speed Limits - TRANSGUIDE surveillance currently covers highway south of study section. Future based on plan for expanded coverage area
Link
Base Future
Link Under TMC Surveillance? (Y/N)
Posted Speed Limit (mph)
Link Under TMC Surveillance? (Y/N)
Posted Speed Limit (mph)
1 N 60 Y 60 2 N 65 Y 65 3 N 65 N 65 4 N 65 N 65
Location and Ozone Standards Attainment - Status in 2005 considered
Link County 8-Hour Ozone
Standard Classification
1 Bexar Basic/Deferred 2 Bexar Basic/Deferred 3 Bexar Basic/Deferred 4 Bexar Basic/Deferred
Land Use in Half-Mile Zone to Either Side of Corridor (Area Occupied in Square Miles) - Obtained from parcel-based GIS data
Link Base Future
Residential Commercial/ Industrial
Institutional/ Public Residential Commercial/
Industrial Institutional/
Public 1 0.68 2.23 0.50 0.69 2.27 0.45 2 2.41 1.37 0.66 2.49 1.71 0.25 3 1.63 1.10 1.00 1.81 1.65 0.27 4 0.75 0.09 0.95 0.79 0.19 0.81
Lane Additions within Right-of-Way - Future case considers usage of ROW to accommodate the additional lanes
Link
Number of Lanes That Can be Added within Available
ROW Base Future
1 0 0 2 0 0 3 3 1 4 4 2

181
TRANSIT/HOV OPTIONS - Average automobile occupancies assumed as 1.25
Link
Base Future
Are There Lanes with
High-Occupancy
Vehicle Restrictions
(Y/N)
Is There Bus or
Bus Rapid
Transit Service
on Link? (Y/N)
Is There Rail
Service Paralleling
This Link? (Y/N)
Are There Lanes with
High-Occupancy
Vehicle Restrictions
(Y/N)
Is There Bus or
Bus Rapid
Transit Service
on Link? (Y/N)
Is There Rail
Service Paralleling
This Link? (Y/N)
1 N Y N N Y N 2 N Y N N Y N 3 N N N N Y N 4 N N N N Y N
Data on Bus Service
Link Base Future
Average number of Buses/Day
Average bus occupancy
Average number of Buses/Day
Average bus occupancy
1 30 9.5 30 9.5 2 30 9.5 30 9.5 3 N/A N/A 30 9.5 4 N/A N/A 30 9.5
COST RECOVERY Operations and Maintenance Costs
Link Proportion of Most Recent Year’s O&M
Expenditure Covered by Alternate Sources Base Future
1 0 0 2 0 0 3 0 1 4 0 1
Capital Costs
Link Proportion of total capital expenditure to
date, covered by alternate sources Base Future
1 0 0 2 0 0 3 0 0.25 4 0 0.25

182
DETAILS FOR CRASH ESTIMATION
Link Description Base Case Future Case
Roadway Type Intersection Details Roadway Type Intersection Details
1 410-Bitters Urban Freeway – 6 lanes N/A Urban Freeway – 6
lanes N/A
2 Bitters-Evans
Urban Freeway – 6 lanes N/A Urban Freeway – 6
lanes N/A
3 Evans-Bulverde
Rural Highway– 4 lanes, depressed median
Evans: 4-leg signalized Stone Oak: 4-leg signalized Overlook: 3-leg unsginalized Summerglen: 3-leg unsignalized Mountain Lodge: 4-leg unsignalized Marshall: 4-leg unsignalized
Urban Freeway – 6 lanes N/A
4 Bulverde-Comal County
Rural Highway– 4 lanes, depressed median
Bulverde: 4-leg signalized Borgfeld: 3-leg signalized
Urban Freeway – 6 lanes N/A

183
Details for Case Study 2: US Highway 290, Houston
Limits: IH-610 and FM 1960 Base Year: 2006 Future Year: 2025 Link Details
Link Description (Limits) Length (miles) 1 IH-610- Bingle Road 3.6 2 Bingle Road-Fairbanks N Houston Road 2.9
3 Fairbanks N. Houston Road- Sam Houston Tollway 2.2
4 Sam Houston Tollway- Jones Road 2.1 5 Jones Road- FM 1960 2.6
Total Section IH-610 - FM 1960 13.4 Road Type and Average Daily Traffic - Road type is classified as freeway for all links and all cases - For future cases, ADT obtained from screenline volumes in the Major Investment Study (MIS) report. These volumes represent only a 3-hour AM peak and are converted to ADT based on knowledge of daily distribution of traffic on corridor.
Link
Base Future
Number of Lanes
ADT (veh/day)
Number of Lanes
Case 1: ADT
(veh/day)
Case 2: ADT
(veh/day) 1 6 215110 8 262110 294035 2 6 175202 8 234325 255915 3 6 160422 8 234325 255915 4 6 155100 8 212110 246385 5 6 122600 8 186805 215655
Pavement Condition
Link TxDOT PMIS Pavement Condition Score
Base Future Cases (Both) 1 62 80 2 89 803 79 804 59 805 70 80

184
Percent Trucks - Obtained from RHiNo database, considered unchanged in future.
Link Percent Trucks
1 6.86% 2 7.23% 3 7.44% 4 7.50% 5 8.14%
TMC Surveillance and Speed Limits
Link Link Under TMC Surveillance? (Y/N)
Posted Speed Limit (mph)
1 Y 60 2 Y 60 3 Y 65 4 Y 65 5 Y 65
Location and Ozone Standards Attainment - Entire corridor is located in Harris County – nonattainment status is severe Land Use in Half-Mile Zone to Either Side of Corridor (Area Occupied in Square Miles) - Obtained from parcel-based GIS data
Link Base Future (Both Cases)
Residential Commercial/ Industrial
Institutional/ Public Residential Commercial /
Industrial Institutional /
Public 1 1.02 1.49 0.68 1.12 1.72 0.36 2 0.47 1.10 0.55 0.53 1.30 0.28 3 0.06 0.88 0.69 0.08 1.11 0.44 4 0.28 0.79 0.60 0.32 0.96 0.40 5 0.52 1.02 1.09 0.58 1.33 0.71
Lane Additions within Right-of-Way
Link
Number of Lanes That Can be Added within Available
ROW
Base Future (Both Cases)
1 5 3 2 4 2 3 4 2 4 4 2 5 4 2
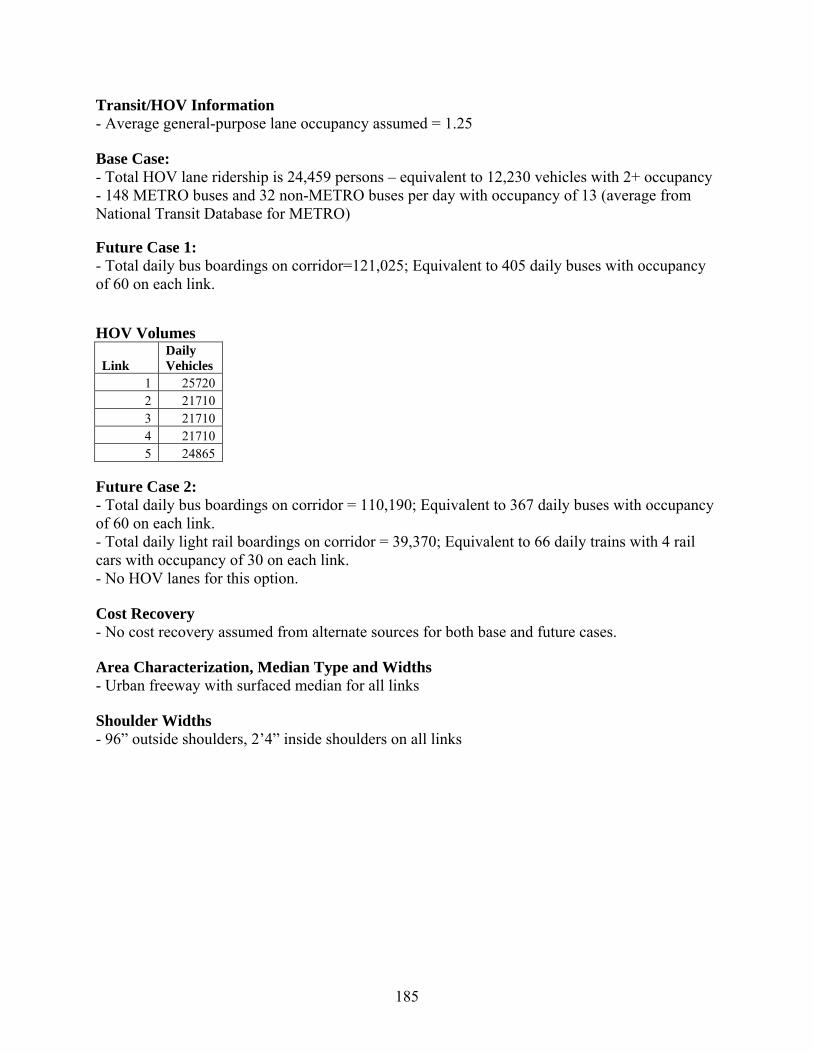
185
Transit/HOV Information - Average general-purpose lane occupancy assumed = 1.25 Base Case: - Total HOV lane ridership is 24,459 persons – equivalent to 12,230 vehicles with 2+ occupancy - 148 METRO buses and 32 non-METRO buses per day with occupancy of 13 (average from National Transit Database for METRO) Future Case 1: - Total daily bus boardings on corridor=121,025; Equivalent to 405 daily buses with occupancy of 60 on each link. HOV Volumes
Link Daily Vehicles
1 25720 2 21710 3 21710 4 21710 5 24865
Future Case 2: - Total daily bus boardings on corridor = 110,190; Equivalent to 367 daily buses with occupancy of 60 on each link. - Total daily light rail boardings on corridor = 39,370; Equivalent to 66 daily trains with 4 rail cars with occupancy of 30 on each link. - No HOV lanes for this option.
Cost Recovery - No cost recovery assumed from alternate sources for both base and future cases.
Area Characterization, Median Type and Widths - Urban freeway with surfaced median for all links Shoulder Widths - 96” outside shoulders, 2’4” inside shoulders on all links

186
Details for Case Study 3: Interstate Highway 27, Amarillo Limits: Western Street and State Highway 217 Base Year: 2002 Future Year: 2022 Link Details
Link Description (Limits) Length (miles) 1 Western to Bell 1.5 2 Bell to Loop 335 1.0 3 Loop 335 to Sundown Lane 1.2 4 Sundown Lane to McCormick Road 1.8 5 McCormick Road to FM 2219 1.0 6 FM 2219 to Hwy 87/60 3.5 7 Hwy 87/60 to Buffalo Road 1.0 8 Buffalo Road to FM 3331 1.0 9 FM 3331 to Hwy 217 1.5
Total Section 13.5 Road Type and Average Daily Traffic - ADTs obtained from TxDOT traffic analysis for base and future years
Link Base Future
Number of Lanes
ADT (veh/day)
Road Type
Number of Lanes
ADT (veh/day)
Road Type
1 4 50200 Freeway 6 72300 Freeway 2 4 27600 Freeway 6 40000 Freeway 3 4 30400 Freeway 6 44100 Freeway 4 4 39400 Freeway 6 57400 Freeway 5 4 37000 Freeway 6 53800 Freeway 6 4 37000 Freeway 6 53800 Freeway 7 4 10500 Freeway 6 17600 Freeway 8 4 10500 Freeway 6 17600 Freeway 9 4 10500 Freeway 6 17600 Freeway
Pavement Condition - Future value is assumed unchanged.
Link TxDOT PMIS
Pavement Condition Score
1 84.75 2 84.75 3 84.75 4 84.75 5 84.75 6 84.75 7 84.75 8 84.75 9 84.75

187
Percent Trucks - Obtained from the RHiNo (Road Highway Inventory Network) database, considered unchanged in future
Link Percent Trucks
1 11.20% 2 10.87% 3 10.60% 4 10.50% 5 10.50% 6 12.52% 7 19.80% 8 20.30% 9 20.60%
TMC Surveillance and Speed Limits - Posted speed limits are 60 mph on links 1 and 2, 70 mph for rest - Limited ITS facilities present from north end up to Hollywood/Loop 335 (Links 1 and 2) Location and Ozone Standards Attainment - Entire corridor located in Randall County, which is in attainment Land Use in Half-Mile Zone to Either Side of Corridor (Area Occupied in Square Miles) - Obtained from GIS data
Link Base Future
Residential Commercial/ Industrial
Institutional/ Public Residential Commercial/
Industrial Institutional/
Public 1 0.73 0.01 0.91 0.80 0.58 0.26 0.21 0.00 0.55 0.21 0.44 0.11
3 0.00 0.00 0.89 0.00 0.89 0.00 4 0.19 0.01 1.70 0.35 1.43 0.13 5 0.17 0.02 0.68 0.31 0.50 0.06 6 0.56 0.00 1.52 0.75 1.09 0.23 7 0.02 0.00 0.29 0.02 0.07 0.21 8 0.07 0.00 1.49 0.09 1.03 0.43 9 0.30 0.00 1.46 0.57 1.16 0.03
Lane Additions within Right-of-Way - Currently, two additional lanes possible on all links. For future case, this will be reduced according to lane additions assumed. Transit and Cost Recovery Details - Currently, no transit service assumed for both base and future. Future case assumption may be revised in final report. - No costs recovered from alternate sources for both base and future cases.

188
Grade and Lane Widths
Link Grade (%) Lane Width (ft)
1 2% 12 2 2% 12 3 2% 12 4 2% 12 5 2% 12 6 2% 12 7 3% 12 8 3% 12 9 3% 12
Median Type and Widths - Depressed median of 36 ft width for all links Shoulder Widths - 10 ft outside shoulder, 4 ft inside shoulder width. Assumed unchanged for future. Area Characterization for Crash Estimation - Links 1-3 considered as urban, rest considered as rural

189
APPENDIX I: WORKSHOP LESSON PLAN


191
Workshop on the Sustainability Enhancement Tool (SET)
Lesson Plan
August 2008
Prepared by:
192
INTRODUCTION The Workshop on the Sustainability Enhancement Tool (SET) was developed by the Texas Transportation Institute (TTI) for the Texas Department of Transportation (TxDOT). The course is delivered by either a qualified instruction team or TxDOT staff from the Transportation Planning and Programming Division (TPP). The workshop serves as an introduction to the SET developed by TTI through research project 0-5541 “Developing Sustainable Transportation Measures for TxDOT’s Strategic Plan.” Participants will learn about key sustainability performance measurements that relate directly back to TxDOT’s strategic goals. Participants will also learn to use the SET to evaluate projects based upon sustainability considerations. The workshop is intended for TxDOT district and division staff involved in transportation planning. COURSE ORGANIZATION The one-day course will be presented by qualified instructors using the curriculum materials including an Instructor Manual, a Participant Notebook, Guidebook for Enhancing Sustainability of Highway Corridors, and supporting visual aids and exercises. All participants receive a copy of the Participant Notebook containing copies of all presentation slides and charts at the workshop. Participants will also receive a copy of the Guidebook for Enhancing Sustainability of Highway Corridors and the associated SET software at the workshop. The notebook and Guidebook will be used extensively during the workshop learning modules. The course is divided into 6 lessons. An agenda is included in the Participant Notebook and is shown on the following page. The course is designed to run from 9:30 a.m. to 3:45 p.m. It can be modified to allow for two half-days of instruction, if needed. In this case, time must be allotted on the second half-day for review of the previous day’s material.

193
Day 1
Lesson Title Min Start EndWorkshop Introduction 25 9:30 AM 9:55 AM
1 Strategic Goals and Sustainability 20 9:55 AM 10:15 AM2 Introduction to Performance Measures 30 10:15 AM 10:45 AM
Break 10 10:45 AM 10:55 AM
3 Introduction to Sustainability Enhancement Tool 45 10:55 AM 11:40 AM
Lunch 60 11:40 AM 12:40 PM
4 Urban Corridor Application 60 12:40 PM 1:40 PM5 Interactive Exercise 75 1:40 PM 2:55 PM
Break 10 2:55 PM 3:05 PM
6 Rural Corridor Application 25 3:05 PM 3:30 PMFinal Comments and Evaluation 15 3:30 PM 3:45 PM
COURSE COORDINATION Facilities, equipment, and scheduling should be coordinated through instruction team and the TxDOT Transportation Planning and Programming Division. CLASS SIZE The maximum class size to achieve the learning objectives of the workshop is 30 people. Instructors will ensure 30 copies of the Participant Notebook and an equal number of the Guidebook for Enhancing Sustainability of Highway Corridors are available for the course instruction. WORKSHOP EQUIPMENT REQUIREMENTS Audio/Visual Equipment Requirements Workshop visual aids will be delivered through computerized slides projected by an LCD projector and the use of wall charts. The following equipment is needed for presenting the visual aids:
• Computer (LCD) projector with minimum 1024x768 resolution, located so that the image fills the screen without obstructions. A backup projector should be available;
• Large projection screen (7 ft width minimum); • Pointing device (electronic or mechanical);

194
• Several (4-6) large, black marking pens for student name tents; • Blackboard or whiteboard or flipcharts, with appropriate markers; and • Mounting tape and/or thumb tacks for the wall charts.
Instructors will provide all of this equipment for the workshops. Instructor’s Workstation Requirements The instructor’s workstation must meet all the requirements listed:
• Computer with at least: 300MHz CPU, 32MB RAM, 100MB hard-disk space available, sound card, speakers, and external mouse;
• MS PowerPoint 2000 or later; and • World Wide Web access (desirable, but not essential).
Classroom Requirements The classroom should be a large room, a conference room, or similar room, preferably with a flat floor. It must contain sufficient tables and chairs for the number of expected participants plus two instructors. Ceiling height must be adequate to permit visual aids to clearly be seen from all points in the room. There must be enough desktop space for each student to lay a 3-ring binder flat and to flip the pages and take notes on the pages in the binders. Whenever possible, the tables and chairs should be arranged in “classroom” style, with all students facing the front of the room, but arranged in a manner to allow easy rearrangement for group exercises. Preferably, there should be a clear aisle in the middle of the room and on each side of the room to permit the instructor to move among the students for a high level of interaction. All students should face the front of the room. A presentation table/podium must be placed at the front of the room. A table or cart with the electronic projector and the instructor’s computer workstation must be positioned so that the image fills the screen without distortion. A large projection screen (7 ft width minimum) that is entirely visible from every seat must be placed in the front of the room. There must be no visual obstructions. It is essential that all students can see both the entire project screen and the upper half of the instructor, from a comfortable seated position. Heating, ventilation and air conditioning (HVAC) should be sufficient to handle the needs of the participants without creating excessive noise. The students should be able to hear normal speech across the full length of the room while the HVAC system is operating at the highest speed. The room must have a lighting system that does not directly illuminate the projection screen. Preferably, it should also permit convenient dimming of the lights, especially in the area of the room near the projection screen. Participant Requirements Participants will be required to bring a tablet for note taking, a pen/pencil, and a calculator. Prior to the workshop, instructors will contact participants to identify those individuals who can bring laptop computers with a USB drive for the exercise in Lesson 5.

195
TARGET AUDIENCE The workshop is intended for new and experienced technical staff in TxDOT headquarters, district, and area offices to better understand how sustainability performance measures can be used at the sketch-planning level of project consideration. The workshop provides an overview of sustainability measures as well as how they can be computed with the SET. WORKSHOP LEARNING OBJECTIVES Upon completion of the workshop, participants will be able to:
• Tie sustainability objectives to TxDOT’s strategic goals; • Identify and describe sustainability performance measures, and how they tie to sustainability
objectives; • Describe the concept of weighting and scaling sustainability performance measures; • Negotiate and understand the input and output features of the SET; • Apply the SET to an urban and rural corridor; • Describe the sensitivity of the SET; • Describe output from the SET for decision-making.

196
AGENDA
Day 1
Lesson Title Min Start EndWorkshop Introduction 25 9:30 AM 9:55 AM
1 Strategic Goals and Sustainability 20 9:55 AM 10:15 AM2 Introduction to Performance Measures 30 10:15 AM 10:45 AM
Break 10 10:45 AM 10:55 AM
3 Introduction to Sustainability Enhancement Tool 45 10:55 AM 11:40 AM
Lunch 60 11:40 AM 12:40 PM
4 Urban Corridor Application 60 12:40 PM 1:40 PM5 Interactive Exercise 75 1:40 PM 2:55 PM
Break 10 2:55 PM 3:05 PM
6 Rural Corridor Application 25 3:05 PM 3:30 PMFinal Comments and Evaluation 15 3:30 PM 3:45 PM

197
Lesson Number: NA Lesson Title: Workshop Introduction Learning Objectives: Overview of course and expected outcomes Instructional Method: This opening session acquaints instructors and participants with each
other, covers ground rules, and concludes by explaining the workshop objectives. The instructors introduce themselves. The participants introduce themselves and share information about their work responsibilities and expectations for this workshop. Instructors will capture these expectations on a flip chart for review at the end of the workshop. The expectations will be posted in the room for the duration of the workshop. Instructors cover the workshop ground rules, i.e., discussion etiquette, breaks, cell phones. Instructors will direct participants to location of restrooms and water fountain. Instructors will stress timely breaks be observed by participants to keep to the agenda. Instructors will encourage the participants to actively engage in the discussion. Instructors identify and explain the workshop materials, workshop notebook and Guidebook. Instructors will review the workshop learning objectives and the workshop agenda.
Instructional Day: Day 1 - AM Time Allocation: Introductions 15 minutes Ground Rules, Objectives Workshop materials and resources 10 minutes Total: 25 minutes Evaluation Plan: Not applicable

198
Lesson Number: 1 Lesson Title: Strategic Goals and Sustainability Learning Objectives: Participants will be able to:
• Identify TxDOT strategic goals; and • Tie sustainability objectives to TxDOT strategic goals.
Instructional Method: Participants receive an introduction to the completed research
through which the SET was developed. Instructors provide background to the research need, and appropriate sketch-planning application of the tool. Instructors will review TxDOT’s strategic goals. Instructors will provide an overview of sustainability objectives, and how they relate directly to TxDOT strategic goals. Instructors will use polling techniques of participants to solicit feedback on the extent of their current use and consideration of sustainability measures in project development. The instructor will use question and answer techniques to draw additional information from participants.
Instructional Day: Day 1 - AM Time Allocation: Lecture 15 minutes Discussion 5 minutes Total: 20 minutes Evaluation Plan: Instructors will ask questions of the participants to gauge their
comprehension of the lesson material. Participants should express an understanding of how the key objectives tie to each of TxDOT’s strategic goals. Participants can discuss differences and commonalities in how they incorporate the sustainability objectives into project development.

199
Lesson Number: 2 Lesson Title: Introduction to Performance Measures Learning Objectives: Participants will be able to:
• Identify and describe sustainability performance measures; • Discuss how measures tie to objectives; and • Describe the concept of weighting and scaling performance
measures. Instructional Method: Introduce the participants to the various sustainability performance
measures included in the Guidebook. Discuss the development and rationale for each sustainability measure. Discuss how each measure ties to the objectives described in Lesson 2. Ask the participants to what extent they currently quantify these, or similar, measures in project planning. Ask the participants which measures they find more important or relevant in their district, area office, or for specific projects. Discuss the concepts of weighting and scaling of performance measures. Engage the participants in discussing how they would set about putting weights and scales on the measures. Describe the default goal weights and measure weights used in the SET. Instructors will step through a basic example of how weighting and scaling are used for the performance measures. The presentation at this time should be very general.
Instructional Day: Day 1 - AM Time Allocation: Lecture 15 minutes Discussion 5 minutes Exercise 10 minutes
Total: 30 minutes Evaluation Plan: A written exercise will gauge the participant’s comprehension. The
written exercise will have participants list and describe 3 to 5 sustainability performance measures, and identify to which objectives the measures relate. Further, the written exercise will provide an opportunity for the participants to demonstrate their knowledge of how weighting and scaling of performance measures is performed.
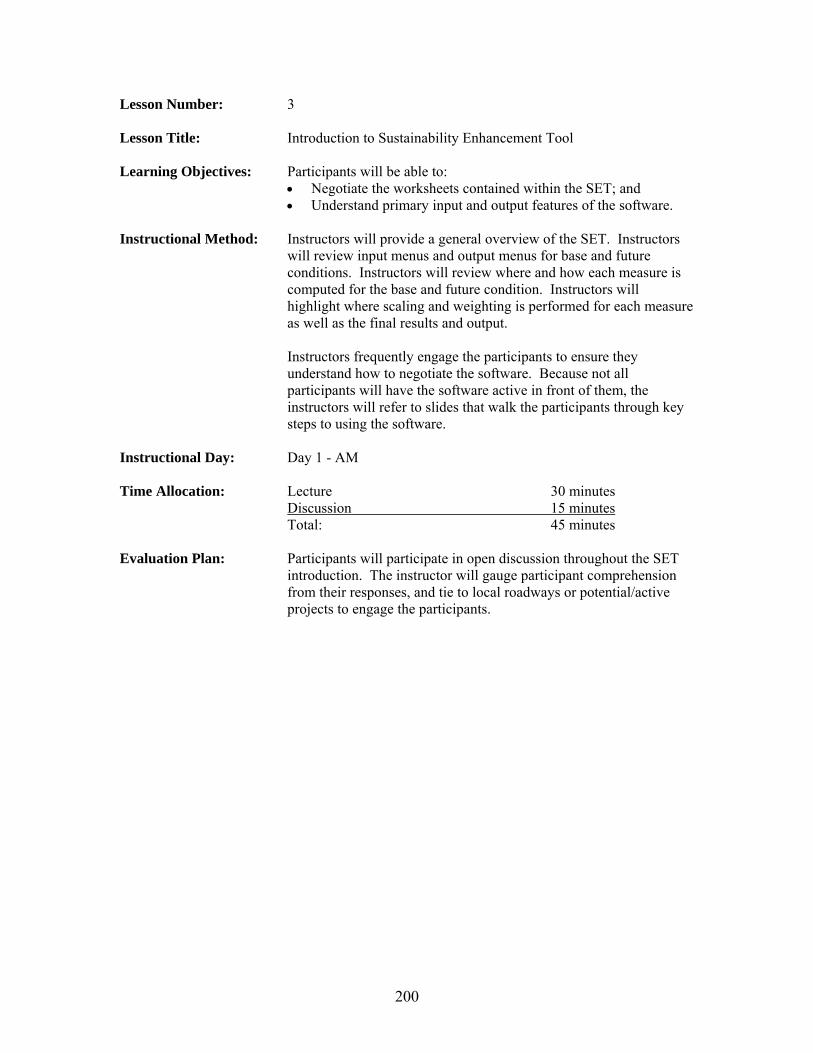
200
Lesson Number: 3 Lesson Title: Introduction to Sustainability Enhancement Tool Learning Objectives: Participants will be able to:
• Negotiate the worksheets contained within the SET; and • Understand primary input and output features of the software.
Instructional Method: Instructors will provide a general overview of the SET. Instructors
will review input menus and output menus for base and future conditions. Instructors will review where and how each measure is computed for the base and future condition. Instructors will highlight where scaling and weighting is performed for each measure as well as the final results and output.
Instructors frequently engage the participants to ensure they
understand how to negotiate the software. Because not all participants will have the software active in front of them, the instructors will refer to slides that walk the participants through key steps to using the software.
Instructional Day: Day 1 - AM Time Allocation: Lecture 30 minutes Discussion 15 minutes
Total: 45 minutes Evaluation Plan: Participants will participate in open discussion throughout the SET
introduction. The instructor will gauge participant comprehension from their responses, and tie to local roadways or potential/active projects to engage the participants.

201
Lesson Number: 4 Lesson Title: Urban Corridor Application Learning Objectives: Participants will be able to:
• Input data into the SET; and • Apply the SET to an urban corridor.
Instructional Method: Instructors will introduce an urban corridor that has previously been
analyzed using the SET. The urban corridor will be either US 290 in Houston or US 281 in San Antonio depending upon the district being instructed.
Instructors will provide an overview of the key characteristics of the
corridor. Instructors will review the input data collection forms that summarize the input data for the corridor. Instructors will review how data are input into the spreadsheet using the general procedures highlighted in Lesson 3.
Instructors will discuss the calculation of the measures, the output,
and an interpretation of the output. Impacts on decision-making will be described by the instructors.
Instructional Day: Day 1 - PM Time Allocation: Lecture 40 minutes Discussion 20 minutes
Total: 60 minutes Evaluation Plan: Participants will participate in open discussion throughout the
description of the urban corridor application. The instructor will gauge participant comprehension from their responses, and tie experiences/feedback to local roadways or potential/active projects to further engage the participants.

202
Lesson Number: 5 Lesson Title: Interactive Exercise Learning Objectives: Participants will be able to:
• Perform “hands-on” input of data into the SET; • Describe the sensitivity of the SET; and • Describe output from the SET decision-making.
Instructional Method: Participants will be broken up into 5-6 groups. Each group will be
provided with the SET software and a laptop computer. Participants will be given a fictitious urban corridor and key geometric, operational, and other data necessary for input into the SET. Instructors will be available to answer questions while the groups work on inputting and analyzing their corridor data. The groups will be given different combinations of operational and geometric data so they can obtain an understanding of SET sensitivity.
Instructors will ask team spokespersons of each group to report on
their output and findings.
Instructional Day: Day 1 - PM Time Allocation: Lecture 5 minutes Group Exercise/Discussion 70 minutes
Total: 75 minutes Evaluation Plan: Divide participants into small groups. Provide background
information for an exercise to input data into the SET for an urban corridor. Approximately 50 minutes into the session, save each group’s completed analysis to USB, and put it on the main laptop being projected. Ask selected group spokespersons to discuss their findings. Instructors ask questions of groups to ensure there is an understanding of how to input data into the tool, the sensitivity of the tool, and the output from the tool.
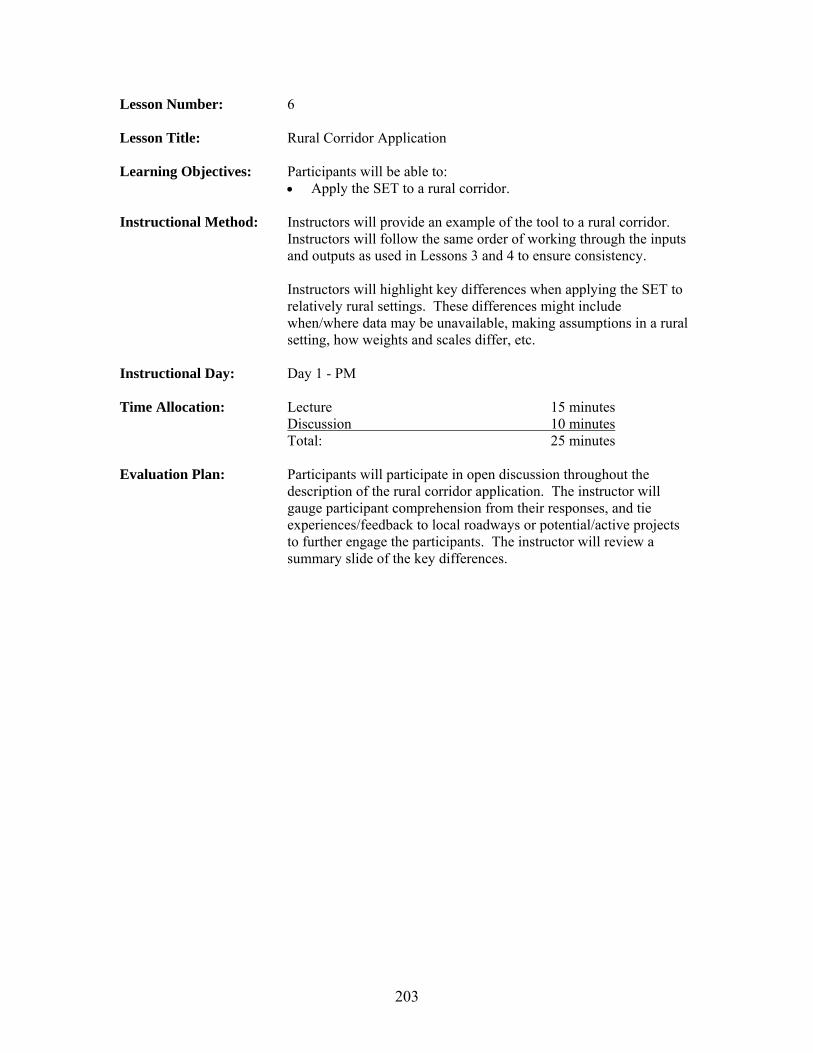
203
Lesson Number: 6 Lesson Title: Rural Corridor Application Learning Objectives: Participants will be able to:
• Apply the SET to a rural corridor.
Instructional Method: Instructors will provide an example of the tool to a rural corridor. Instructors will follow the same order of working through the inputs and outputs as used in Lessons 3 and 4 to ensure consistency.
Instructors will highlight key differences when applying the SET to
relatively rural settings. These differences might include when/where data may be unavailable, making assumptions in a rural setting, how weights and scales differ, etc.
Instructional Day: Day 1 - PM Time Allocation: Lecture 15 minutes Discussion 10 minutes
Total: 25 minutes Evaluation Plan: Participants will participate in open discussion throughout the
description of the rural corridor application. The instructor will gauge participant comprehension from their responses, and tie experiences/feedback to local roadways or potential/active projects to further engage the participants. The instructor will review a summary slide of the key differences.
204
Lesson Number: NA Lesson Title: Final Comments and Evaluation Learning Objectives: Review of course and outcomes Instructional Method: Instructors summarize the key lessons and learning objectives of the
course. Instructors ask leading questions to generate any final questions from the participants.
After answering any final questions, the instructors discuss the
importance of the workshop evaluation. Instructors answer any questions regarding the evaluation form, and collect them from participants after they are finished.
Instructional Day: Day 1 - PM Time Allocation: Final Comments/Discussion 10 minutes Workshop assessment 5 minutes Total 15 minutes Evaluation Plan: Participants ask any final questions, and instructors provide answers. Participants are asked to fill out a questionnaire regarding the various
aspects of the workshop, its usefulness to the participant, and the effectiveness of the instructor(s).