Developing, Implementing, and Visualizing Performance Measures in the Metropolitan Transportation...
19
Developing, Implementing, and Visualizing Performance Measures in the Metropolitan Transportation Planning Process May 7, 2013 Andy Taylor, AICP Amelia Costanzo Daniel Eisenberg
-
Upload
russell-pleasant -
Category
Documents
-
view
214 -
download
1
Transcript of Developing, Implementing, and Visualizing Performance Measures in the Metropolitan Transportation...

Developing, Implementing, and Visualizing Performance Measures in the Metropolitan Transportation Planning Process
May 7, 2013Andy Taylor, AICPAmelia CostanzoDaniel Eisenberg

What we have to cover:Development of Goals, Objectives and Targets
Measure Progress
Show Progress

Development of Goals, Objectives, Targets
6 Broad Goals
16 System Objectives
25 Measures13 Targets
www.morpc.org/tplan


Goals Objectives Performance Measures

MTP Target Topics:• Congestion• Air Quality• Bridge Condition• Pavement
Condition• Safety• Disadvantaged
Population Travel• Bikeway Miles
• Bikeway Proximity• Transit Proximity• Local Complete
Streets Policies• Density along
Arterials• Ridesharing• Multi-Jurisdictional
Studies

MAP-21 Target Topics:• Congestion• Air Quality• Bridge Condition• Pavement
Condition• Safety• Reliability• Freight Movement
Topics identified for performance measurement by Congress through MAP-21}

Example: Safety
Objective Measure 2012 Benchmark
2016 Target 2035 Target
Increase safety of central Ohio residents
• A 15 percent reduction by 2035 in crashes for all travelers per million vehicle miles traveled on collector or above roadways.
Goal: Use public investments to benefit the health, safety and welfare of people

Example: Safety
Objective Measure 2012 Benchmark
2016 Target 2035 Target
Increase safety of central Ohio residents
Crashes for all travelers, per million vehicle miles traveled, on collector or above roadways • A 15 percent reduction by 2035 in
crashes for all travelers per million vehicle miles traveled on collector or above roadways.
Goal: Use public investments to benefit the health, safety and welfare of people

Example: Safety
Objective Measure 2012 Benchmark
2016 Target 2035 Target
Increase safety of central Ohio residents
Crashes for all travelers, per million vehicle miles traveled, on collector or above roadways
2.31 crashes per million VMT
2.25 crashes per million VMT
2.00 crashes per million VMT
• A 15 percent reduction by 2035 in crashes for all travelers per million vehicle miles traveled on collector or above roadways.
Goal: Use public investments to benefit the health, safety and welfare of people

Lessons Learned• Make a good
foundation• Outcomes vs.
Outputs• System
Performance vs. Impact
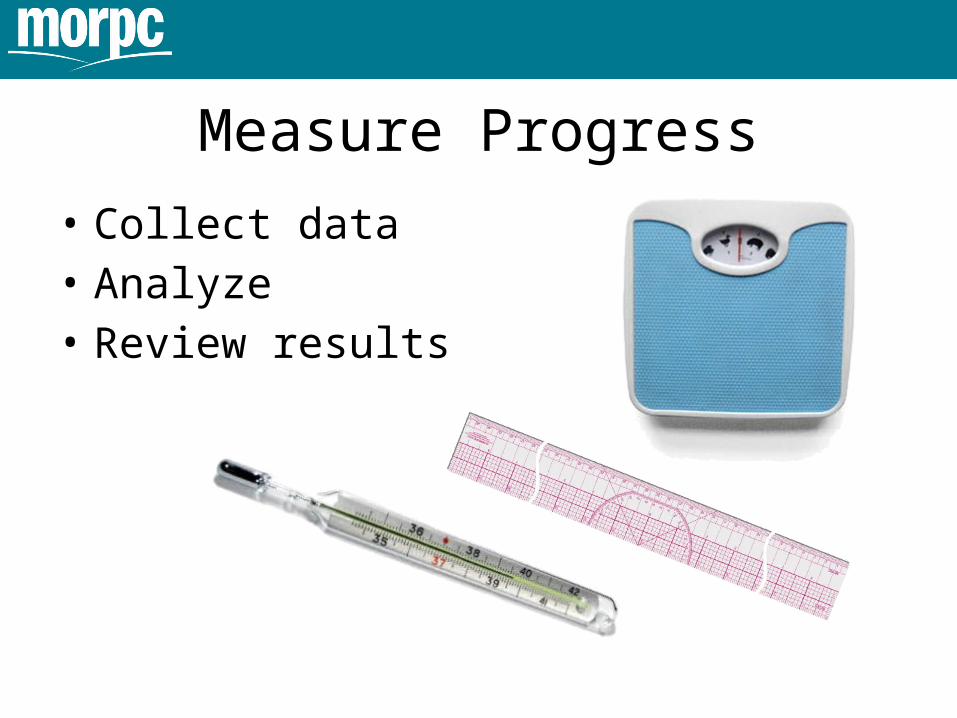
Measure Progress
• Collect data• Analyze• Review results
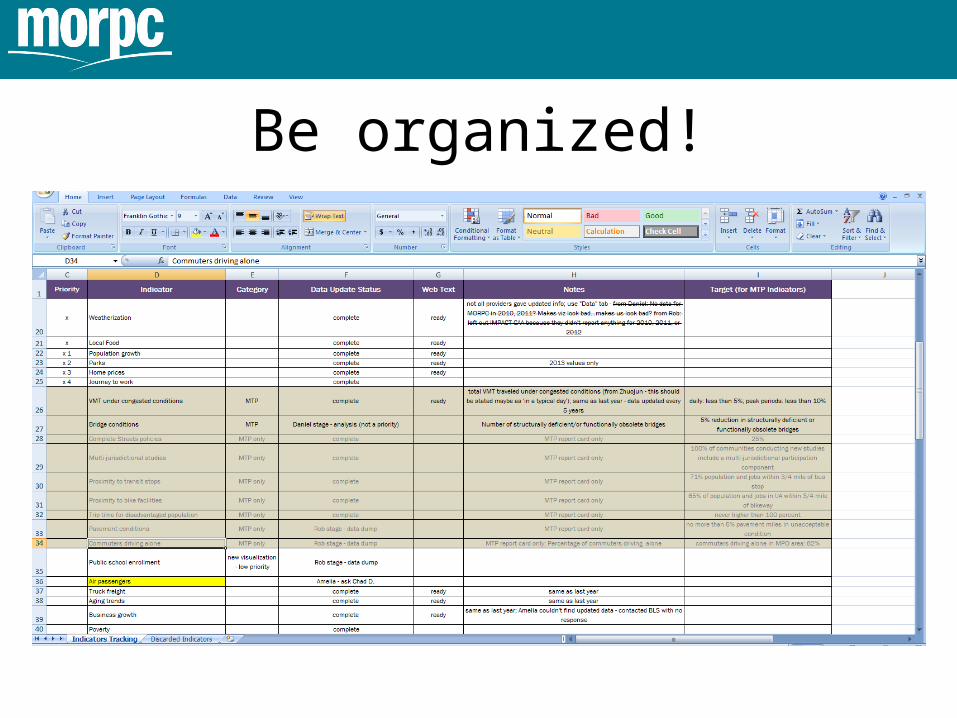
Be organized!

Lessons Learned
• Documentation• Communication

Showing Progress: Report Card• Targets and
progress reported on website
Meets target
On track to meet target
Not on track to meet target
http://weave.morpc.org/sotr/indicators.html?ct=Transportation

Show Progress: Report Card
• Targets creation process
Meets target
On track to meet target
Not on track to meet target
?

Interactive Visualizations• “Visualize” data
over time• Weave software• Weave has the
ability to tie together a piece of data across different charts
http://weave.morpc.org/sotr/indicators.html?ct=Transportation

Lessons Learned• Choose symbols
that make sense, and are easily legible
• Don’t be afraid to reevaluate – the result will likely be stronger
• Sketch it out before committing

Questions?• Contact info:
- Andy Taylor: [email protected] Amelia Costanzo: [email protected] Daniel Eisenberg:
• MTP: www.morpc.org/tplan• State of the Region:
www.morpc.org/stateoftheregion• Open Indicators Consortium:
www.oicweave.org
Links