Developing Sustainable Transportation Performance Measures ...
52
By Dr. Houssam A. Toutanji (PI), Dr. Michael Anderson (Co-PI) Dr. Kathleen M. Leonard (Co-PI) Department of Civil, & Environmental Engineering The University of Alabama in Huntsville Huntsville, Alabama Prepared by UTCA University Transportation Center for Alabama The University of Alabama, The University of Alabama at Birmingham, and The University of Alabama in Huntsville UTCA Report Number 12302 June 2013 Developing Sustainable Transportation Performance Measures for ALDOT UTCA Theme: Management and Safety of Transportation Systems
Transcript of Developing Sustainable Transportation Performance Measures ...

By
Dr. Houssam A. Toutanji (PI), Dr. Michael Anderson (Co-PI)
Dr. Kathleen M. Leonard (Co-PI) Department of Civil, & Environmental Engineering
The University of Alabama in Huntsville Huntsville, Alabama
Prepared by
UTCA University Transportation Center for Alabama
The University of Alabama, The University of Alabama at Birmingham, and The University of Alabama in Huntsville
UTCA Report Number 12302
June 2013
Developing Sustainable Transportation Performance
Measures for ALDOT
UTCA Theme: Management and Safety of Transportation Systems
About UTCA The University Transportation Center for Alabama (UTCA) is headquartered in the
Department of Civil, Construction, and Environmental Engineering at the University of Alabama (UA).
Interdisciplinary faculty members perform research, education, and technology-transfer projects using funds
provided by UTCA and external sponsors.
Mission Statement and Strategic Plan The mission of UTCA is “to advance the technology and
expertise in the multiple disciplines that comprise transportation through the mechanisms of education,
research, and technology transfer while serving as a university-based center of excellence.”
The UTCA strategic plan contains six goals that support this mission:
Education – conduct a multidisciplinary program of coursework and experiential learning that
reinforces the theme of transportation;
Human Resources – increase the number of students, faculty and staff who are attracted to and
substantively involved in the undergraduate, graduate, and professional programs of UTCA;
Diversity – develop students, faculty and staff who reflect the growing diversity of the US workforce
and are substantively involved in the undergraduate, graduate, and professional programs of
UTCA;
Research Selection – utilize an objective process for selecting and reviewing research that
balances the multiple objectives of the program;
Research Performance – conduct an ongoing program of basic and applied research, the products
of which are judged by peers or other experts in the field to advance the body of knowledge in
transportation; and
Technology Transfer – ensure the availability of research results to potential users in a form that
can be directly implemented, utilized or otherwise applied.
Theme The UTCA theme is “MANAGEMENT AND SAFETY OF TRANSPORTATION SYSTEMS.” UTCA concentrates
upon the highway and mass transit modes but also conducts projects featuring rail, waterway, air, and other
transportation modes as well as intermodal issues.
Disclaimer The contents of this report reflect the views of the authors, who are responsible for the facts
and the accuracy of the data presented herein. The contents do not necessarily reflect the official views or
policies of Alabama DOT, the University of Alabama, or UTCA, and they assume no liability for the contents
or use thereof. This report does not constitute a standard, specification, or regulation. Comments contained
in this report related to specific testing equipment and materials should not be considered an endorsement
of any commercial product or service; no such endorsement is intended or implied.
University Transportation Center for Alabama
i
DEVELOPING SUSTAINABLE TRANSPORTATION PERFORMANCE MEASURES FOR ALDOT
By
Dr. Houssam A. Toutanji (PI), Dr. Michael Anderson (Co-PI)
Dr. Kathleen M. Leonard (Co-PI) Department of Civil & Environmental Engineering
The University of Alabama in Huntsville Huntsville, Alabama
Prepared by
UTCA University Transportation Center for Alabama The University of Alabama, The University of Alabama at Birmingham,
and The University of Alabama in Huntsville
UTCA Report Number 12302 June 2013

i
Technical Report Documentation Page 1. Report No.
2. Government Accession No. 3. Recipient Catalog No.
4. Title and Subtitle
Developing Sustainable Transportation Performance
Measures for ALDOT
5. Report Date
June 2013
6. Performing Organization Code
7. Authors
Dr. Houssam A. Toutanji
Dr. Michael Anderson
Dr. Kathleen Leonard
8. Performing Organization Report No.
UTCA Final Report Number 12302
9. Performing Organization Name and
Address
Department of Civil and Environmental Eng.
TH-S201, Technology Hall
The University of Alabama in Huntsville
Huntsville, AL 35899
10. Work Unit No.
11. Contract or Grant No.
12. Sponsoring Agency Name and Address
University Transportation Center for Alabama
The University of Alabama
Box 870205
Tuscaloosa, AL 35487-0205
13. Type of Report and Period Covered
1/1/2012 – 12/31/2012
14. Sponsoring Agency Code
15. Supplementary Notes
16. Abstract
Sustainable transportation is generally used to refer to transportation that contributes to the sustainable development
of the community that owns and uses the system. The Transportation Research Board defines sustainability as:
“Sustainability is not about threat analysis; sustainability is about systems analysis. Specifically, it is about how
environmental, economic and social systems interact to their mutual advantage or disadvantage at various space-
based scales of operation.” The research project was designed to establish a baseline understanding of the potential
for using sustainability performance measures in the Alabama Department of Transportation. Quite a number of
sustainability initiatives have discussed various definitions and performance measures of sustainable transportation
systems, but very few regional agencies have developed planning tools that successfully incorporate sustainability in
the transportation sector. This study develops a working definition of sustainability from various proposed
definitions, and demonstrates a feasible methodology for evaluating and quantifying sustainability performance
measures, thus incorporating sustainability considerations into the regional transportation decision-making process.
17. Key Words
Sustainability, Measurement, Environment; Greenhouse
Gas Emissions
18. Distribution Statement
19. Security
Classification (of this
report)
Unclassified
20. Security Classification
(of this page)
Unclassified
21. No of Pages
48 22. Price
Form DOT F1700.7 (8-72)
ii
Table of Contents
Table of Contents ............................................................................................................................ ii
List of Tables ................................................................................................................................. iii
Executive Summary ....................................................................................................................... iv
1.0 Introduction ................................................................................................................................1
1.1 Background ..........................................................................................................................1
1.2 Project Objectives ................................................................................................................3
1.3 Work Tasks ..........................................................................................................................3
2.0 Literature Review.......................................................................................................................4
2.1 Integrating Sustainability Concepts into Transportation planning ......................................6
2.2 Sustainability Performance Measures by other DOT’s .......................................................8
3.0 Sustainability Performance-Measurement Framework............................................................30
3.1 Sustainability Indicators.....................................................................................................30
3.2 Performance Measures Currently Used by ALDOT ..........................................................33
3.3 Selection of Performance Measures ...................................................................................33
4.0 Conclusion ...............................................................................................................................37
5.0 Acknowledgements ..................................................................................................................38
6.0 References ................................................................................................................................39
7.0 Appendix A ..............................................................................................................................41
iii
List of Tables
1-1 Sustainable Transportation Issues .............................................................................................2
2-1 Sustainability in the Missions of State Departments of Transportation (U.S.) .........................4
2-2 Project Development by criteria Scorecard by FHWA’s ..........................................................8
2-3 Credit Scorecard (Complete List of Credits) ...........................................................................11
2-4 Greenroads Listing by Category ..............................................................................................12
2-5 GreenLITES Project Environmental Sustainability Rating System Scorecard .......................15
2-6 I-LAST Project Environmental Sustainability Rating System Scorecard ...............................17
3-1 Timeline of Indicator Development ........................................................................................30
3-2 Potential Sustainability Indicators in General .........................................................................31
3-3 Sustainable Performance Measures to be adopted by ALDOT ...............................................34
iv
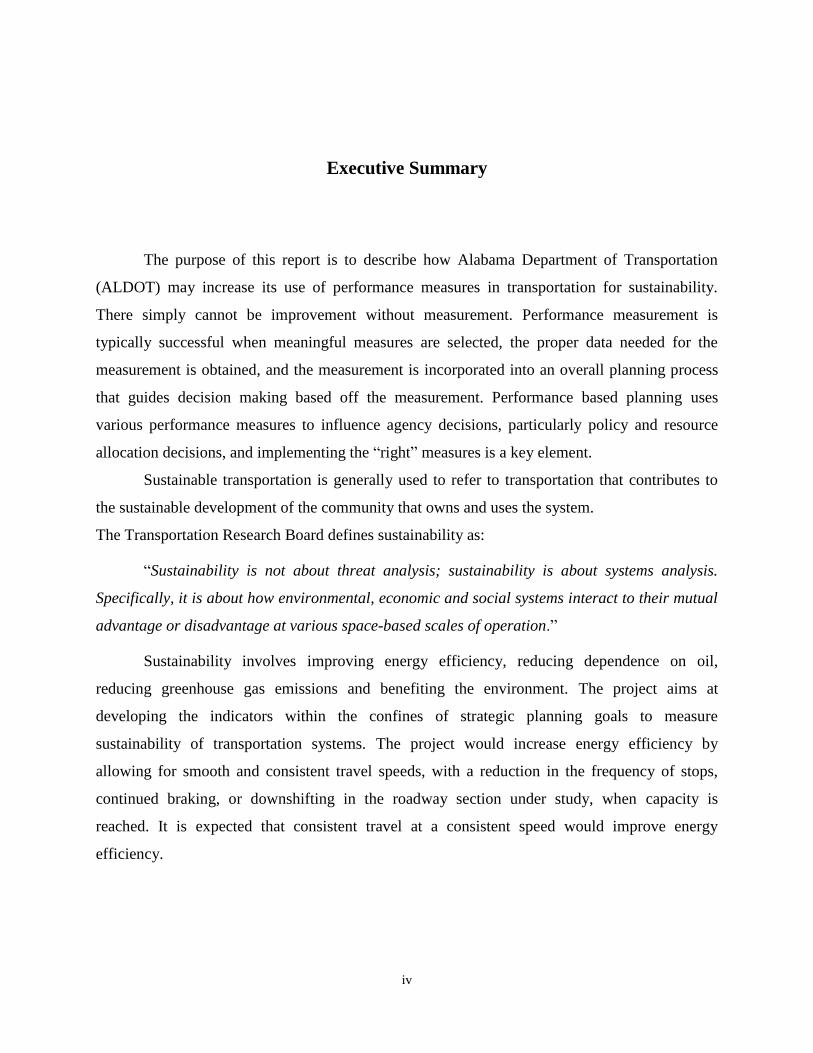
Executive Summary
The purpose of this report is to describe how Alabama Department of Transportation
(ALDOT) may increase its use of performance measures in transportation for sustainability.
There simply cannot be improvement without measurement. Performance measurement is
typically successful when meaningful measures are selected, the proper data needed for the
measurement is obtained, and the measurement is incorporated into an overall planning process
that guides decision making based off the measurement. Performance based planning uses
various performance measures to influence agency decisions, particularly policy and resource
allocation decisions, and implementing the “right” measures is a key element.
Sustainable transportation is generally used to refer to transportation that contributes to
the sustainable development of the community that owns and uses the system.
The Transportation Research Board defines sustainability as:
“Sustainability is not about threat analysis; sustainability is about systems analysis.
Specifically, it is about how environmental, economic and social systems interact to their mutual
advantage or disadvantage at various space-based scales of operation.”
Sustainability involves improving energy efficiency, reducing dependence on oil,
reducing greenhouse gas emissions and benefiting the environment. The project aims at
developing the indicators within the confines of strategic planning goals to measure
sustainability of transportation systems. The project would increase energy efficiency by
allowing for smooth and consistent travel speeds, with a reduction in the frequency of stops,
continued braking, or downshifting in the roadway section under study, when capacity is
reached. It is expected that consistent travel at a consistent speed would improve energy
efficiency.
1
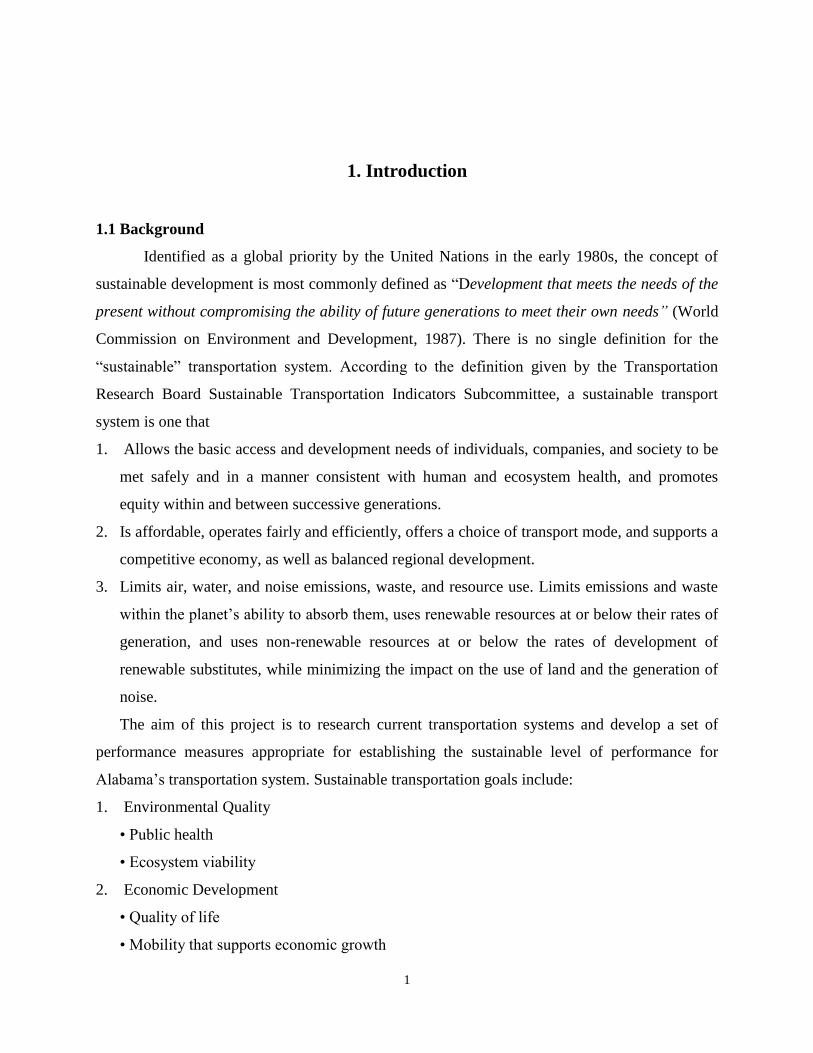
1. Introduction
1.1 Background
Identified as a global priority by the United Nations in the early 1980s, the concept of
sustainable development is most commonly defined as “Development that meets the needs of the
present without compromising the ability of future generations to meet their own needs” (World
Commission on Environment and Development, 1987). There is no single definition for the
“sustainable” transportation system. According to the definition given by the Transportation
Research Board Sustainable Transportation Indicators Subcommittee, a sustainable transport
system is one that
1. Allows the basic access and development needs of individuals, companies, and society to be
met safely and in a manner consistent with human and ecosystem health, and promotes
equity within and between successive generations.
2. Is affordable, operates fairly and efficiently, offers a choice of transport mode, and supports a
competitive economy, as well as balanced regional development.
3. Limits air, water, and noise emissions, waste, and resource use. Limits emissions and waste
within the planet’s ability to absorb them, uses renewable resources at or below their rates of
generation, and uses non-renewable resources at or below the rates of development of
renewable substitutes, while minimizing the impact on the use of land and the generation of
noise.
The aim of this project is to research current transportation systems and develop a set of
performance measures appropriate for establishing the sustainable level of performance for
Alabama’s transportation system. Sustainable transportation goals include:
1. Environmental Quality
• Public health
• Ecosystem viability
2. Economic Development
• Quality of life
• Mobility that supports economic growth
2
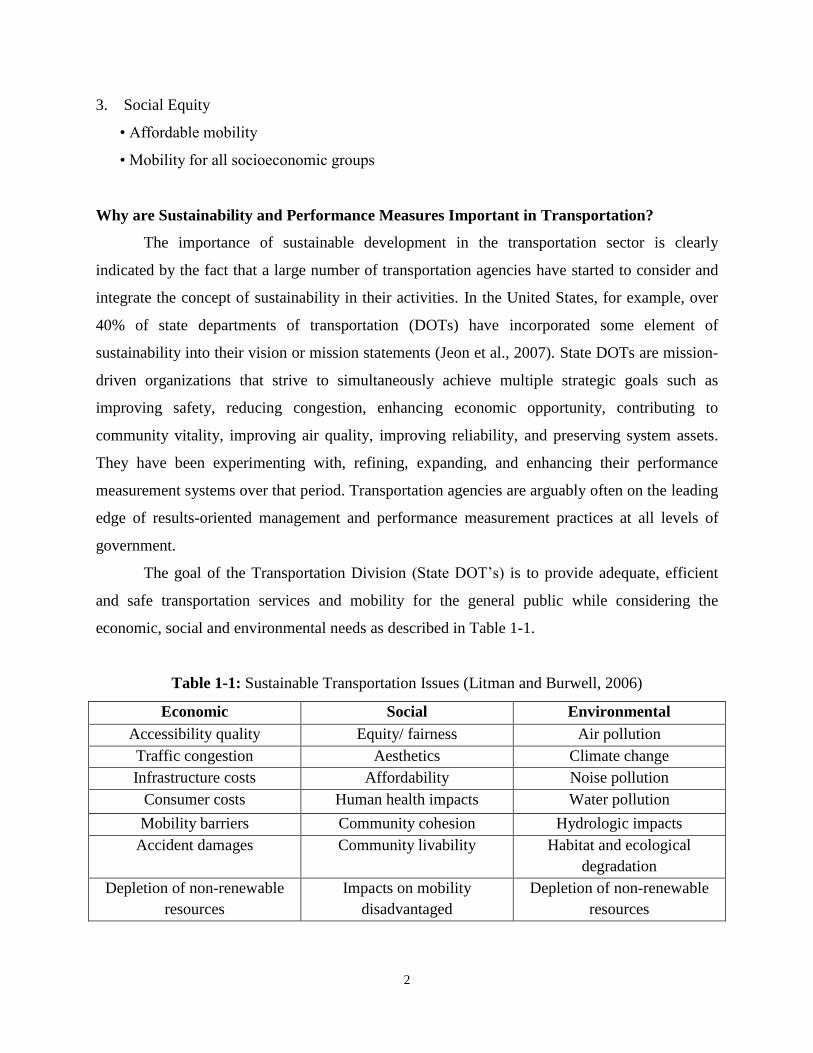
3. Social Equity
• Affordable mobility
• Mobility for all socioeconomic groups
Why are Sustainability and Performance Measures Important in Transportation?
The importance of sustainable development in the transportation sector is clearly
indicated by the fact that a large number of transportation agencies have started to consider and
integrate the concept of sustainability in their activities. In the United States, for example, over
40% of state departments of transportation (DOTs) have incorporated some element of
sustainability into their vision or mission statements (Jeon et al., 2007). State DOTs are mission-
driven organizations that strive to simultaneously achieve multiple strategic goals such as
improving safety, reducing congestion, enhancing economic opportunity, contributing to
community vitality, improving air quality, improving reliability, and preserving system assets.
They have been experimenting with, refining, expanding, and enhancing their performance
measurement systems over that period. Transportation agencies are arguably often on the leading
edge of results-oriented management and performance measurement practices at all levels of
government.
The goal of the Transportation Division (State DOT’s) is to provide adequate, efficient
and safe transportation services and mobility for the general public while considering the
economic, social and environmental needs as described in Table 1-1.
Table 1-1: Sustainable Transportation Issues (Litman and Burwell, 2006)
Economic Social Environmental
Accessibility quality Equity/ fairness Air pollution
Traffic congestion Aesthetics Climate change
Infrastructure costs Affordability Noise pollution
Consumer costs Human health impacts Water pollution
Mobility barriers Community cohesion Hydrologic impacts
Accident damages Community livability Habitat and ecological
degradation
Depletion of non-renewable
resources
Impacts on mobility
disadvantaged
Depletion of non-renewable
resources
3
1.2 Objectives
The following are the main objectives of this project:
1. Develop an understanding of sustainable transportation.
2. Review major studies and initiatives of sustainable transportation.
3. Create a framework for using sustainable transportation performance measures based on
the types of applications that need to be supported.
4. Develop a methodology that can be implemented in the form of a sustainability
enhancement tool.
5. Develop sustainable transportation performance measures to address ALDOT’s strategic
plan goals.
6. Identify data elements and data sources required to quantify the measures.
1.3 Work Tasks
The state of Alabama is a leader in providing an opportunity for researchers. The project is
organized into the following sequential tasks:
Task 1. Literature and Information Collection
The first task for the study is to conduct a literature review and summarize relevant
literature and ongoing relevant research, including that related to independent sustainability and
environmental stewardship certification systems.
Task 2. Developing Sustainability Objectives and performance parameters of Importance
for Alabama
After completing Task 1, the team will develop a performance-measurement framework
for the implementation of sustainability enhancement specific to highways.
Task 3. Developing sustainable transportation performance measures
The items identified in Tasks 1 & 2 will be analyzed and related to sustainable
performance measures that can be applied to ALDOT. Task 3 objectives are to identify best
practices used by other transportation departments that have incorporated sustainability in their
goals and objectives.

4
2. Literature Review
In order to effectively determine which performance measures were appropriate for
Alabama’s transportation infrastructure, it was necessary to examine the existing research and
literature on performance measures. Several other state DOTs have well‐established performance
measurement systems and mission statements (Table 2-1) from which best practices can be
learned.
Table 2-1 [5]
: Sustainability in the Missions of State Departments of Transportation (U.S.)
Departments/States Mission Statement
U.S. Department of
Transportation
(Sep. 21. 2007)
“Serve the United States by ensuring a fast, safe, efficient, accessible,
and convenient transportation system that meets our vital national
interests and enhances the quality of life of the American people, today
and into the future.”
Alabama
“To provide a safe, efficient, environmentally sound intermodal
transportation system for all users, especially the taxpayers of Alabama.
To also facilitate economic and social development and prosperity
through the efficient movement of people and goods and to facilitate
intermodal connections within Alabama.”
Florida
(Sep. 21, 2007)
“The Department will provide a safe transportation system that ensures
the mobility of people and goods, enhances economic prosperity and
preserves the quality of our environment and communities.”
Georgia
(Sep. 21, 2007)
“The Georgia Department of Transportation provides a safe, seamless,
and sustainable transportation system that supports Georgia’s economy
and is sensitive to its citizens and environment.”
Hawaii
“To provide a safe, efficient, accessible, and inter-modal transportation
system that ensures the mobility of people and goods, and enhances
and/or preserves economic prosperity and the quality of life.”
Indiana
(Sep. 21, 2007)
“INDOT will build, maintain, and operate a superior transportation
system enhancing safety, mobility and economic growth.”
Louisiana “To deliver transportation and public works systems that enhances
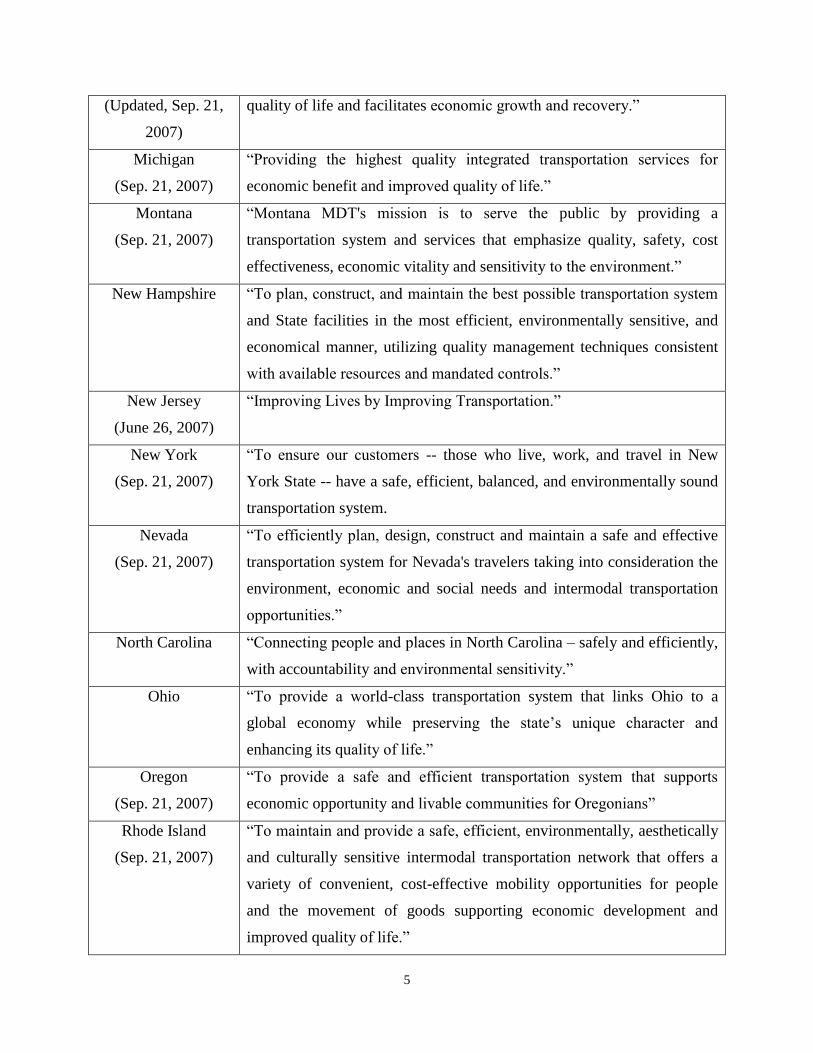
5
(Updated, Sep. 21,
2007)
quality of life and facilitates economic growth and recovery.”
Michigan
(Sep. 21, 2007)
“Providing the highest quality integrated transportation services for
economic benefit and improved quality of life.”
Montana
(Sep. 21, 2007)
“Montana MDT's mission is to serve the public by providing a
transportation system and services that emphasize quality, safety, cost
effectiveness, economic vitality and sensitivity to the environment.”
New Hampshire
“To plan, construct, and maintain the best possible transportation system
and State facilities in the most efficient, environmentally sensitive, and
economical manner, utilizing quality management techniques consistent
with available resources and mandated controls.”
New Jersey
(June 26, 2007)
“Improving Lives by Improving Transportation.”
New York
(Sep. 21, 2007)
“To ensure our customers -- those who live, work, and travel in New
York State -- have a safe, efficient, balanced, and environmentally sound
transportation system.
Nevada
(Sep. 21, 2007)
“To efficiently plan, design, construct and maintain a safe and effective
transportation system for Nevada's travelers taking into consideration the
environment, economic and social needs and intermodal transportation
opportunities.”
North Carolina
“Connecting people and places in North Carolina – safely and efficiently,
with accountability and environmental sensitivity.”
Ohio
“To provide a world-class transportation system that links Ohio to a
global economy while preserving the state’s unique character and
enhancing its quality of life.”
Oregon
(Sep. 21, 2007)
“To provide a safe and efficient transportation system that supports
economic opportunity and livable communities for Oregonians”
Rhode Island
(Sep. 21, 2007)
“To maintain and provide a safe, efficient, environmentally, aesthetically
and culturally sensitive intermodal transportation network that offers a
variety of convenient, cost-effective mobility opportunities for people
and the movement of goods supporting economic development and
improved quality of life.”
6
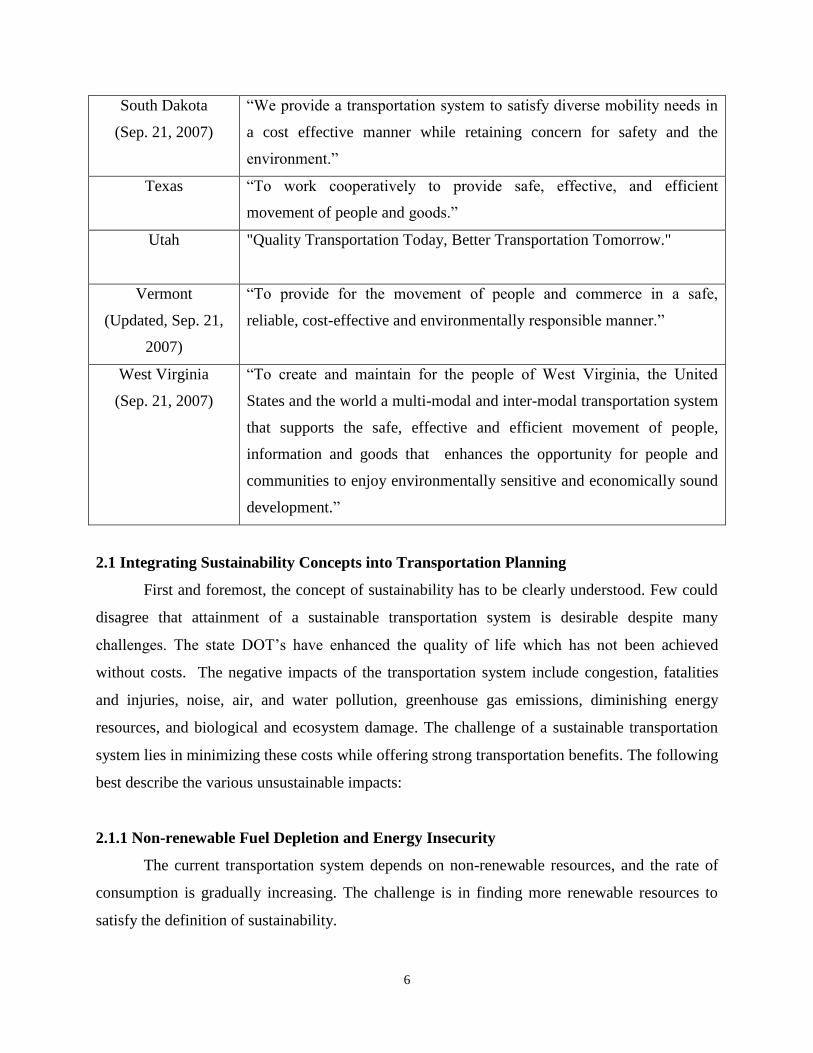
South Dakota
(Sep. 21, 2007)
“We provide a transportation system to satisfy diverse mobility needs in
a cost effective manner while retaining concern for safety and the
environment.”
Texas
“To work cooperatively to provide safe, effective, and efficient
movement of people and goods.”
Utah
"Quality Transportation Today, Better Transportation Tomorrow."
Vermont
(Updated, Sep. 21,
2007)
“To provide for the movement of people and commerce in a safe,
reliable, cost-effective and environmentally responsible manner.”
West Virginia
(Sep. 21, 2007)
“To create and maintain for the people of West Virginia, the United
States and the world a multi-modal and inter-modal transportation system
that supports the safe, effective and efficient movement of people,
information and goods that enhances the opportunity for people and
communities to enjoy environmentally sensitive and economically sound
development.”
2.1 Integrating Sustainability Concepts into Transportation Planning
First and foremost, the concept of sustainability has to be clearly understood. Few could
disagree that attainment of a sustainable transportation system is desirable despite many
challenges. The state DOT’s have enhanced the quality of life which has not been achieved
without costs. The negative impacts of the transportation system include congestion, fatalities
and injuries, noise, air, and water pollution, greenhouse gas emissions, diminishing energy
resources, and biological and ecosystem damage. The challenge of a sustainable transportation
system lies in minimizing these costs while offering strong transportation benefits. The following
best describe the various unsustainable impacts:
2.1.1 Non-renewable Fuel Depletion and Energy Insecurity
The current transportation system depends on non-renewable resources, and the rate of
consumption is gradually increasing. The challenge is in finding more renewable resources to
satisfy the definition of sustainability.
7
2.1.2 Greenhouse gas emissions
The burning of fossil fuels and petroleum products to run vehicles emit greenhouse gases
contributes to global warming. Improved fuel efficiency and use of alternative fuels reduce the
greenhouse effect.
2.1.3 Global Climate Change
Increased emission of greenhouse gases will have significant impacts on sea level,
climate, and agriculture. Rise in the sea level causes flooding of the land. It appears to be too late
to prevent or completely reverse the climate change.
2.1.4 Local Air Quality
The vehicles emit carbon dioxide which significantly contributes to local air pollution.
Poor air quality has various health impacts. Therefore, air quality regulations should be made for
substantial air quality improvements.
2.1.5 Fatalities and Injuries
Gruesome fatalities and injuries occur on the highways. Sustainability argues for a
decrease in fatalities and injuries.
2.1.6 Congestion
Congestion is a great sustainability issue because it worsens motorized mobility. It
negatively affects the economic and social health of the nation, but it also has some positive
implications for sustainability because congested highways cause some people to choose
alternative modes of transportation.
2.1.7 Noise Pollution
The transportation system is a significant source of noise. Despite the progress that has
been made, new methods, technologies and policies to reduce noise pollution are required.
2.1.7 Low Mobility
A reasonable level of mobility is an essential characteristic of a sustainable transportation
system. Transportation must be available to all members of the community, including people
with low income, physically challenged, the elderly, and children.
2.1.8 Ecosystem Damage
Transportation activities can cause biological damage. With the increase in population
and travel volume, very little care is taken towards endangered species. A continuous effort
should be made to maintain and improve on areas of wildlife habitat.

8
2.1.9 Lack of equity
Intergenerational and social equity are the overarching aims of a sustainable
transportation system. Properly planned transportation systems can play a central role in
promoting sustainability.
2.2 Sustainability Performance Measures by other DOT’s
Another application of sustainability performance measures in the transportation sector
involves the use of rating systems for sustainability. In general, a rating system for transportation
sustainability provides a framework for scoring and evaluating various projects or alternatives
that contain a checklist of potentially sustainable practices.
The following lists selected transportation sustainability rating systems that were
reviewed as part of this research:
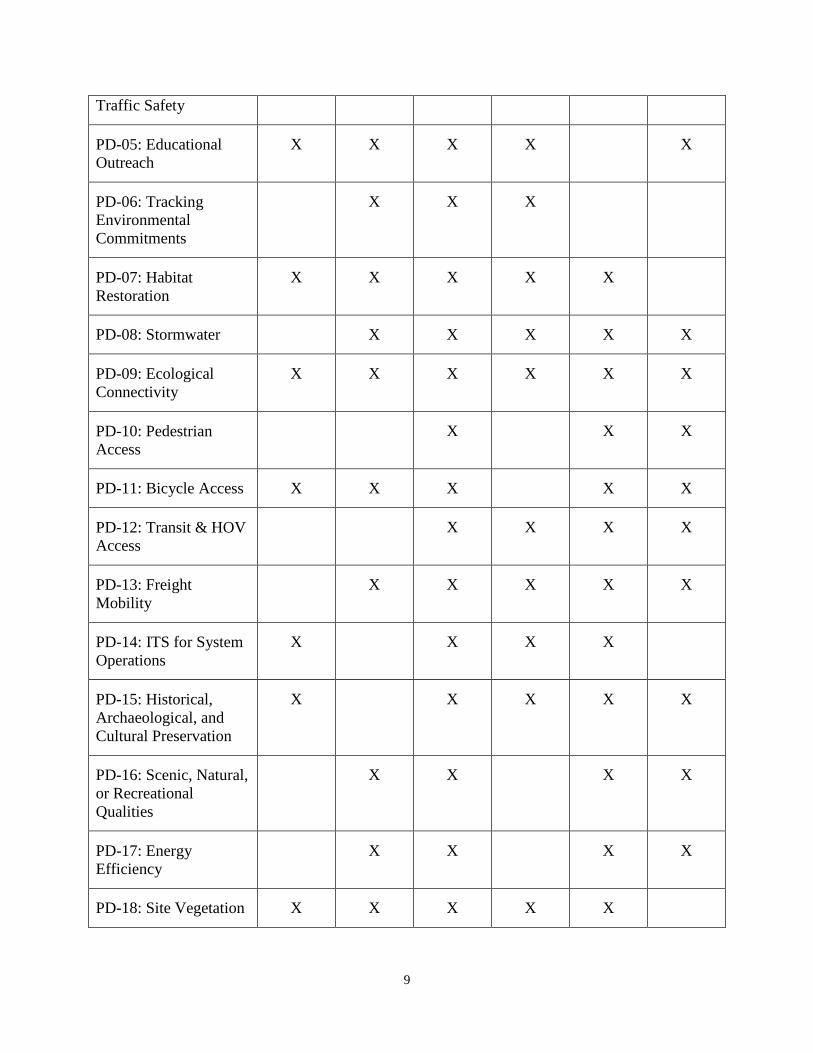
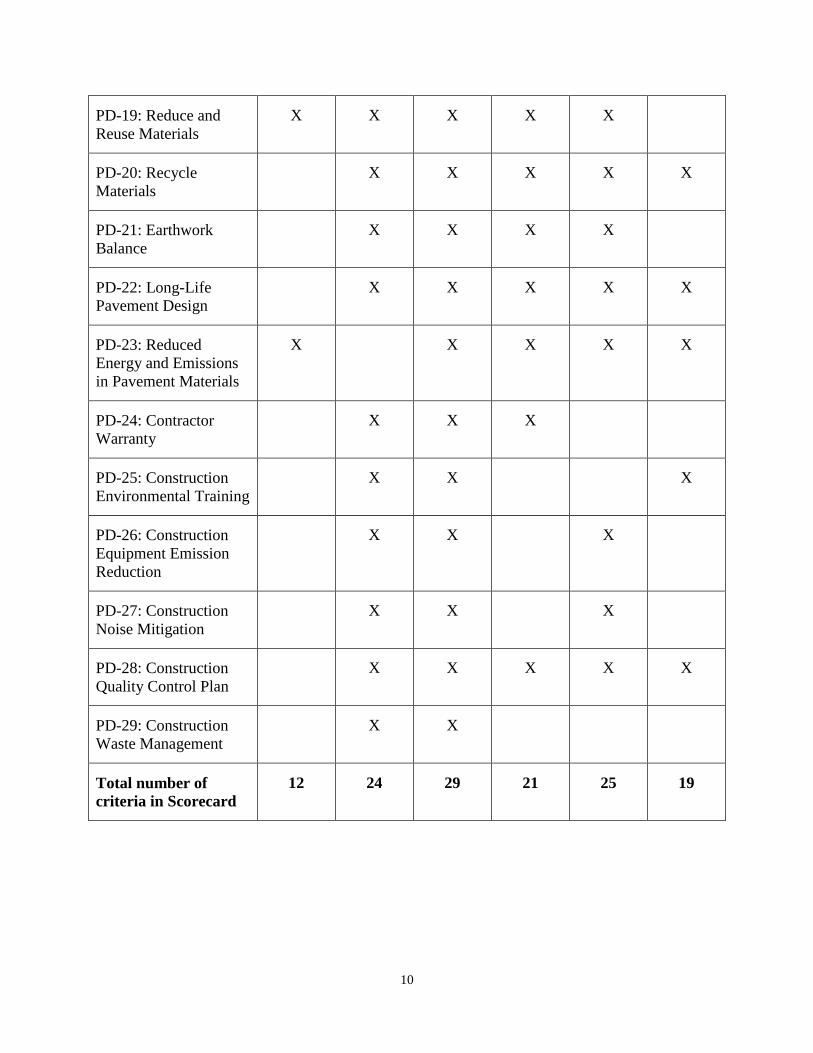
2.2.1 Federal Highway Administration’s (FHWA’s) Sustainable Highways
FHWA developed INVEST (Infrastructure Voluntary Evaluation Sustainability Tool) as
a tool, called criteria, to help transportation agencies integrate sustainability into their programs.
There are 60 criteria within INVEST organized into three modules – System Planning, Project
Development, and Operations and Maintenance. There is a scorecard for each module, and the
scorecard for Project Development is shown in Table 2-2.
Table 2-2[19]
: Project Development by criteria scorecard by FHWA’s
Pav
ing
Bas
ic
Rura
l
Bas
ic
Urb
an
Exte
nded
Rura
l
Exte
nded
Urb
an
Cust
om
PD-01: Economic
Analyses
X X X X
PD-02: Life-Cycle Cost
Analyses
X X X X X X
PD-03: Context
Sensitive Project
Development
X X X X X X
PD-04: Highway and X X X X X X
9
Traffic Safety
PD-05: Educational
Outreach
X X X X X
PD-06: Tracking
Environmental
Commitments
X X X
PD-07: Habitat
Restoration
X X X X X
PD-08: Stormwater X X X X X
PD-09: Ecological
Connectivity
X X X X X X
PD-10: Pedestrian
Access
X X X
PD-11: Bicycle Access X X X X X
PD-12: Transit & HOV
Access
X X X X
PD-13: Freight
Mobility
X X X X X
PD-14: ITS for System
Operations
X X X X
PD-15: Historical,
Archaeological, and
Cultural Preservation
X X X X X
PD-16: Scenic, Natural,
or Recreational
Qualities
X X X X
PD-17: Energy
Efficiency
X X X X
PD-18: Site Vegetation X X X X X
10
PD-19: Reduce and
Reuse Materials
X X X X X
PD-20: Recycle
Materials
X X X X X
PD-21: Earthwork
Balance
X X X X
PD-22: Long-Life
Pavement Design
X X X X X
PD-23: Reduced
Energy and Emissions
in Pavement Materials
X X X X X
PD-24: Contractor
Warranty
X X X
PD-25: Construction
Environmental Training
X X X
PD-26: Construction
Equipment Emission
Reduction
X X X
PD-27: Construction
Noise Mitigation
X X X
PD-28: Construction
Quality Control Plan
X X X X X
PD-29: Construction
Waste Management
X X
Total number of
criteria in Scorecard
12 24 29 21 25 19
11
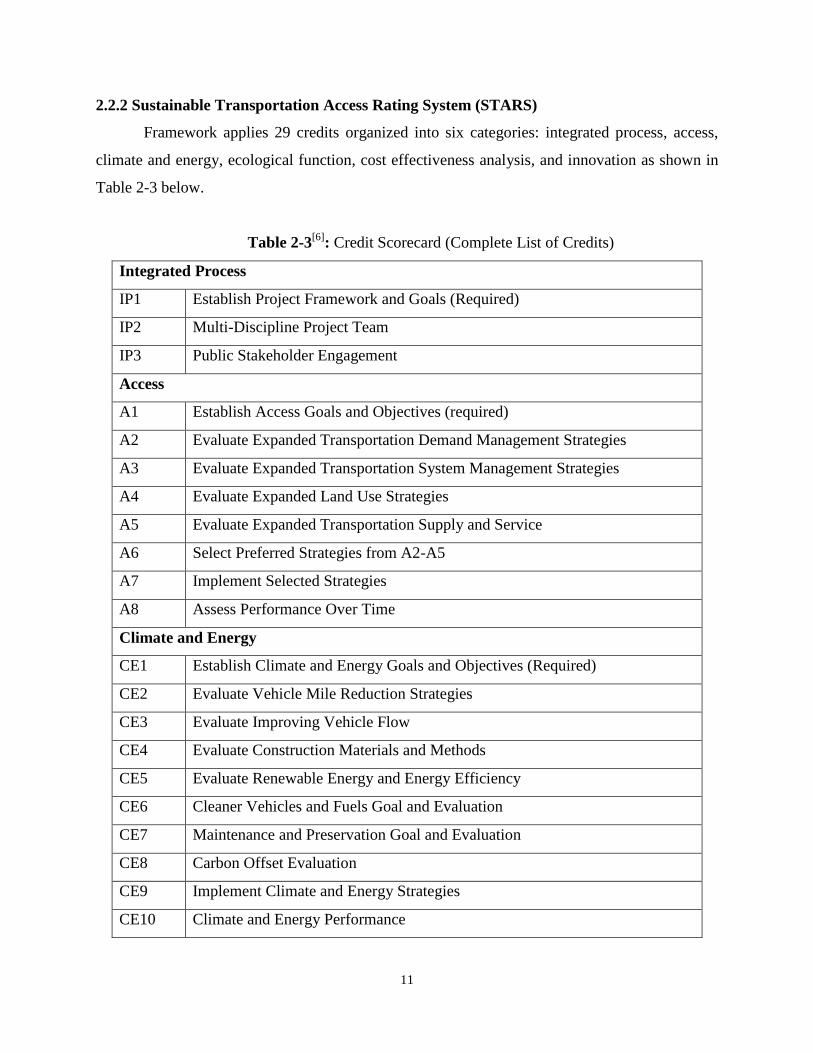
2.2.2 Sustainable Transportation Access Rating System (STARS)
Framework applies 29 credits organized into six categories: integrated process, access,
climate and energy, ecological function, cost effectiveness analysis, and innovation as shown in
Table 2-3 below.
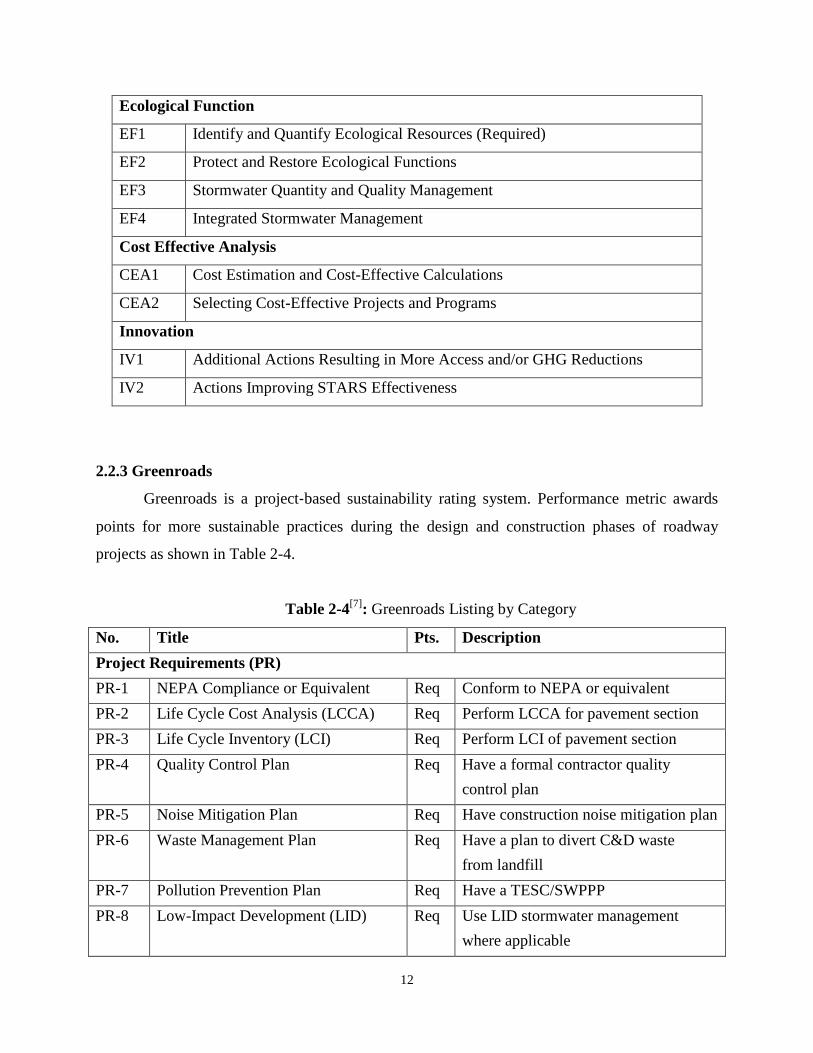
Table 2-3[6]
: Credit Scorecard (Complete List of Credits)
Integrated Process
IP1 Establish Project Framework and Goals (Required)
IP2 Multi-Discipline Project Team
IP3 Public Stakeholder Engagement
Access
A1 Establish Access Goals and Objectives (required)
A2 Evaluate Expanded Transportation Demand Management Strategies
A3 Evaluate Expanded Transportation System Management Strategies
A4 Evaluate Expanded Land Use Strategies
A5 Evaluate Expanded Transportation Supply and Service
A6 Select Preferred Strategies from A2-A5
A7 Implement Selected Strategies
A8 Assess Performance Over Time
Climate and Energy
CE1 Establish Climate and Energy Goals and Objectives (Required)
CE2 Evaluate Vehicle Mile Reduction Strategies
CE3 Evaluate Improving Vehicle Flow
CE4 Evaluate Construction Materials and Methods
CE5 Evaluate Renewable Energy and Energy Efficiency
CE6 Cleaner Vehicles and Fuels Goal and Evaluation
CE7 Maintenance and Preservation Goal and Evaluation
CE8 Carbon Offset Evaluation
CE9 Implement Climate and Energy Strategies
CE10 Climate and Energy Performance
12
Ecological Function
EF1 Identify and Quantify Ecological Resources (Required)
EF2 Protect and Restore Ecological Functions
EF3 Stormwater Quantity and Quality Management
EF4 Integrated Stormwater Management
Cost Effective Analysis
CEA1 Cost Estimation and Cost-Effective Calculations
CEA2 Selecting Cost-Effective Projects and Programs
Innovation
IV1 Additional Actions Resulting in More Access and/or GHG Reductions
IV2 Actions Improving STARS Effectiveness
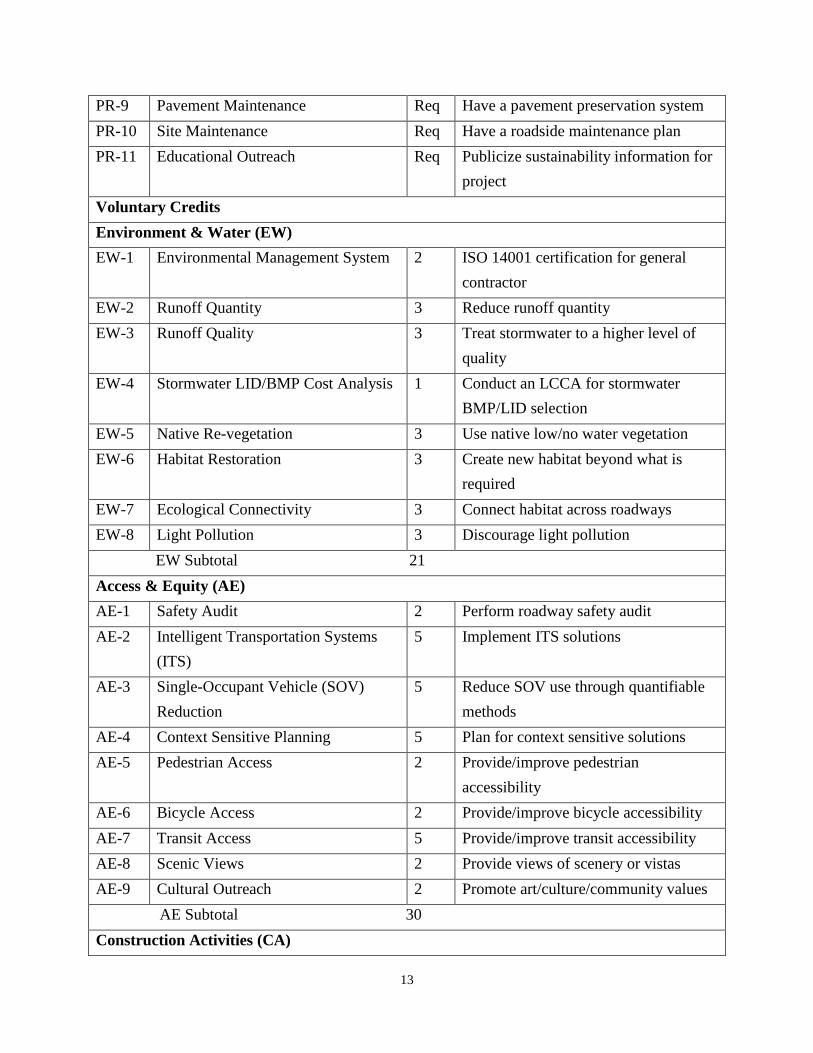
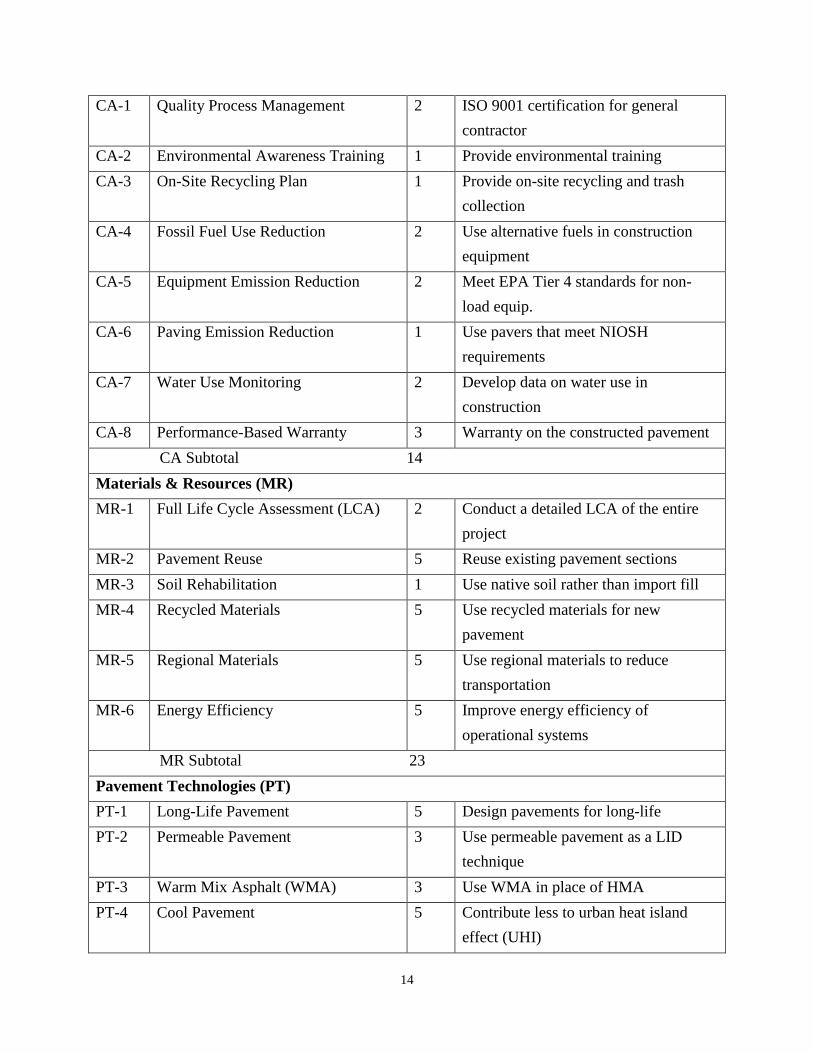
2.2.3 Greenroads
Greenroads is a project‐based sustainability rating system. Performance metric awards
points for more sustainable practices during the design and construction phases of roadway
projects as shown in Table 2-4.
Table 2-4[7]
: Greenroads Listing by Category
No. Title Pts. Description
Project Requirements (PR)
PR-1 NEPA Compliance or Equivalent Req Conform to NEPA or equivalent
PR-2 Life Cycle Cost Analysis (LCCA) Req Perform LCCA for pavement section
PR-3 Life Cycle Inventory (LCI) Req Perform LCI of pavement section
PR-4 Quality Control Plan Req Have a formal contractor quality
control plan
PR-5 Noise Mitigation Plan Req Have construction noise mitigation plan
PR-6 Waste Management Plan Req Have a plan to divert C&D waste
from landfill
PR-7 Pollution Prevention Plan Req Have a TESC/SWPPP
PR-8 Low-Impact Development (LID) Req Use LID stormwater management
where applicable
13
PR-9 Pavement Maintenance Req Have a pavement preservation system
PR-10 Site Maintenance Req Have a roadside maintenance plan
PR-11 Educational Outreach Req Publicize sustainability information for
project
Voluntary Credits
Environment & Water (EW)
EW-1 Environmental Management System 2 ISO 14001 certification for general
contractor
EW-2 Runoff Quantity 3 Reduce runoff quantity
EW-3 Runoff Quality 3 Treat stormwater to a higher level of
quality
EW-4 Stormwater LID/BMP Cost Analysis 1 Conduct an LCCA for stormwater
BMP/LID selection
EW-5 Native Re-vegetation 3 Use native low/no water vegetation
EW-6 Habitat Restoration 3 Create new habitat beyond what is
required
EW-7 Ecological Connectivity 3 Connect habitat across roadways
EW-8 Light Pollution 3 Discourage light pollution
EW Subtotal 21
Access & Equity (AE)
AE-1 Safety Audit 2 Perform roadway safety audit
AE-2 Intelligent Transportation Systems
(ITS)
5 Implement ITS solutions
AE-3 Single-Occupant Vehicle (SOV)
Reduction
5 Reduce SOV use through quantifiable
methods
AE-4 Context Sensitive Planning 5 Plan for context sensitive solutions
AE-5 Pedestrian Access 2 Provide/improve pedestrian
accessibility
AE-6 Bicycle Access 2 Provide/improve bicycle accessibility
AE-7 Transit Access 5 Provide/improve transit accessibility
AE-8 Scenic Views 2 Provide views of scenery or vistas
AE-9 Cultural Outreach 2 Promote art/culture/community values
AE Subtotal 30
Construction Activities (CA)
14
CA-1 Quality Process Management 2 ISO 9001 certification for general
contractor
CA-2 Environmental Awareness Training 1 Provide environmental training
CA-3 On-Site Recycling Plan 1 Provide on-site recycling and trash
collection
CA-4 Fossil Fuel Use Reduction 2 Use alternative fuels in construction
equipment
CA-5 Equipment Emission Reduction 2 Meet EPA Tier 4 standards for non-
load equip.
CA-6 Paving Emission Reduction 1 Use pavers that meet NIOSH
requirements
CA-7 Water Use Monitoring 2 Develop data on water use in
construction
CA-8 Performance-Based Warranty 3 Warranty on the constructed pavement
CA Subtotal 14
Materials & Resources (MR)
MR-1 Full Life Cycle Assessment (LCA) 2 Conduct a detailed LCA of the entire
project
MR-2 Pavement Reuse 5 Reuse existing pavement sections
MR-3 Soil Rehabilitation 1 Use native soil rather than import fill
MR-4 Recycled Materials 5 Use recycled materials for new
pavement
MR-5 Regional Materials 5 Use regional materials to reduce
transportation
MR-6 Energy Efficiency 5 Improve energy efficiency of
operational systems
MR Subtotal 23
Pavement Technologies (PT)
PT-1 Long-Life Pavement 5 Design pavements for long-life
PT-2 Permeable Pavement 3 Use permeable pavement as a LID
technique
PT-3 Warm Mix Asphalt (WMA) 3 Use WMA in place of HMA
PT-4 Cool Pavement 5 Contribute less to urban heat island
effect (UHI)
15
PT-5 Quiet Pavement 3 Use a quiet pavement to reduce noise
PT-6 Pavement Performance Monitoring 1 Relate construction to performance data
PT Subtotal 20
Voluntary Credit Total
Custom Credits (CC)
CC-1 Custom Credits 10 Design your own credit
CC Subtotal 10
Greenroads Total 118
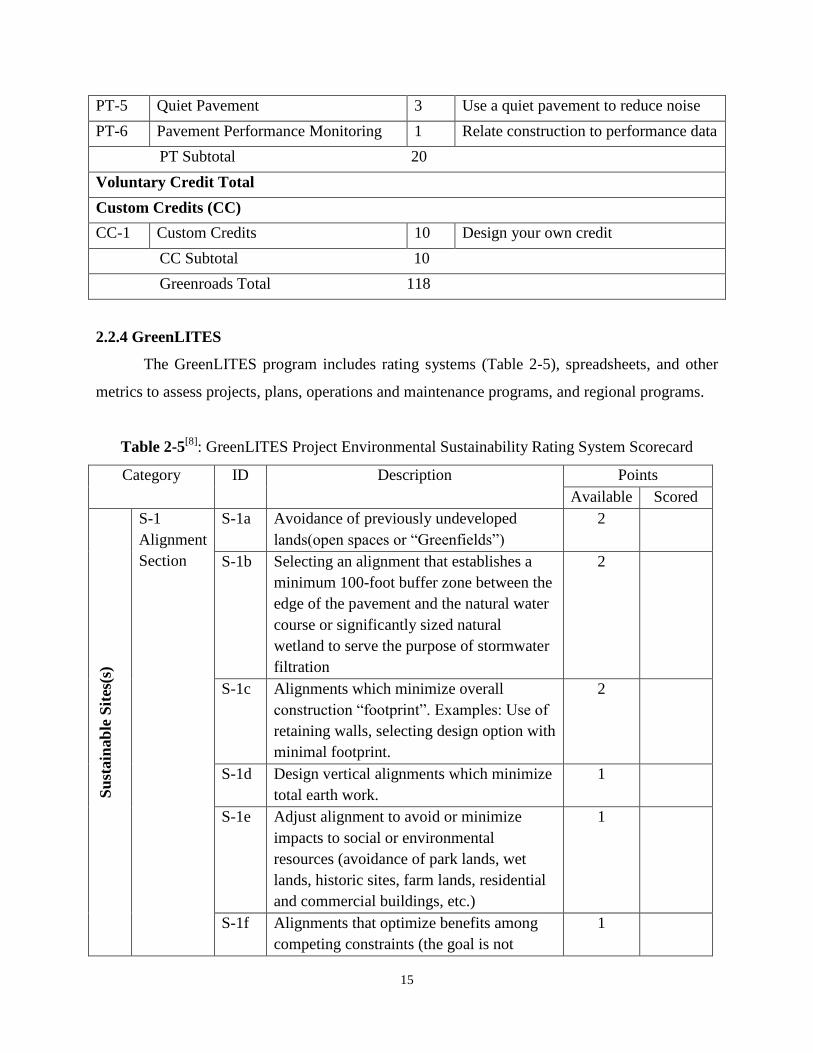
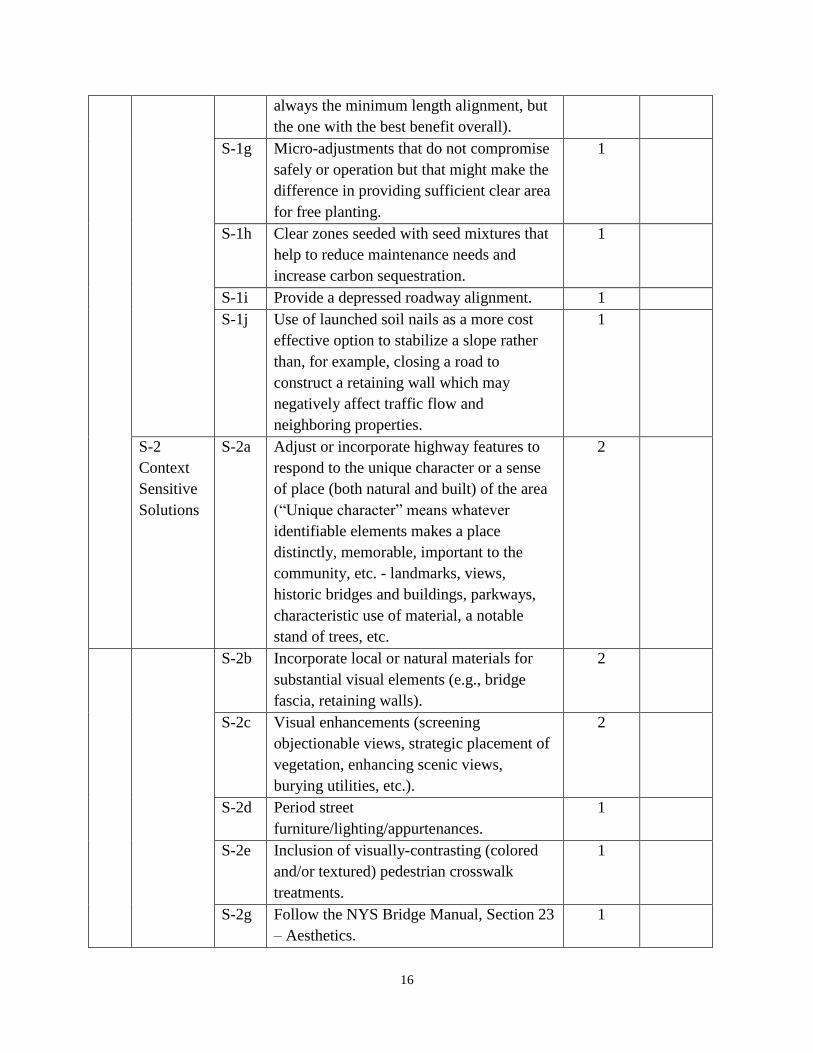
2.2.4 GreenLITES
The GreenLITES program includes rating systems (Table 2-5), spreadsheets, and other
metrics to assess projects, plans, operations and maintenance programs, and regional programs.
Table 2-5[8]
: GreenLITES Project Environmental Sustainability Rating System Scorecard
Category ID Description Points
Available Scored
Su
stain
ab
le S
ites
(s)
S-1
Alignment
Section
S-1a Avoidance of previously undeveloped
lands(open spaces or “Greenfields”)
2
S-1b Selecting an alignment that establishes a
minimum 100-foot buffer zone between the
edge of the pavement and the natural water
course or significantly sized natural
wetland to serve the purpose of stormwater
filtration
2
S-1c Alignments which minimize overall
construction “footprint”. Examples: Use of
retaining walls, selecting design option with
minimal footprint.
2
S-1d Design vertical alignments which minimize
total earth work.
1
S-1e Adjust alignment to avoid or minimize
impacts to social or environmental
resources (avoidance of park lands, wet
lands, historic sites, farm lands, residential
and commercial buildings, etc.)
1
S-1f Alignments that optimize benefits among
competing constraints (the goal is not
1
16
always the minimum length alignment, but
the one with the best benefit overall).
S-1g Micro-adjustments that do not compromise
safely or operation but that might make the
difference in providing sufficient clear area
for free planting.
1
S-1h Clear zones seeded with seed mixtures that
help to reduce maintenance needs and
increase carbon sequestration.
1
S-1i Provide a depressed roadway alignment. 1
S-1j Use of launched soil nails as a more cost
effective option to stabilize a slope rather
than, for example, closing a road to
construct a retaining wall which may
negatively affect traffic flow and
neighboring properties.
1
S-2
Context
Sensitive
Solutions
S-2a Adjust or incorporate highway features to
respond to the unique character or a sense
of place (both natural and built) of the area
(“Unique character” means whatever
identifiable elements makes a place
distinctly, memorable, important to the
community, etc. - landmarks, views,
historic bridges and buildings, parkways,
characteristic use of material, a notable
stand of trees, etc.
2
S-2b Incorporate local or natural materials for
substantial visual elements (e.g., bridge
fascia, retaining walls).
2
S-2c Visual enhancements (screening
objectionable views, strategic placement of
vegetation, enhancing scenic views,
burying utilities, etc.).
2
S-2d Period street
furniture/lighting/appurtenances.
1
S-2e Inclusion of visually-contrasting (colored
and/or textured) pedestrian crosswalk
treatments.
1
S-2g Follow the NYS Bridge Manual, Section 23
– Aesthetics.
1
17
S-2h Site material selection & detailing to reduce
overall urban “heat island” effect.
1
S-2i Permanently protect view sheds via
environmental or conversation easements.
1
S-2j Color anodizing of aluminum elements
(ITS cabinets, non-decorative light poles,
etc.)
1
S-2k Decorative bridge fencing (in lieu of
standard chain link).
1
S-2l Use of concrete from liners (for bridge
approach barriers, parapet walls, retaining
walls, noise walls, bridge piers &
abutments, etc.)
1
S-2m Imprinted concrete/asphalt mow strips,
gores and/or snow storage areas.
1
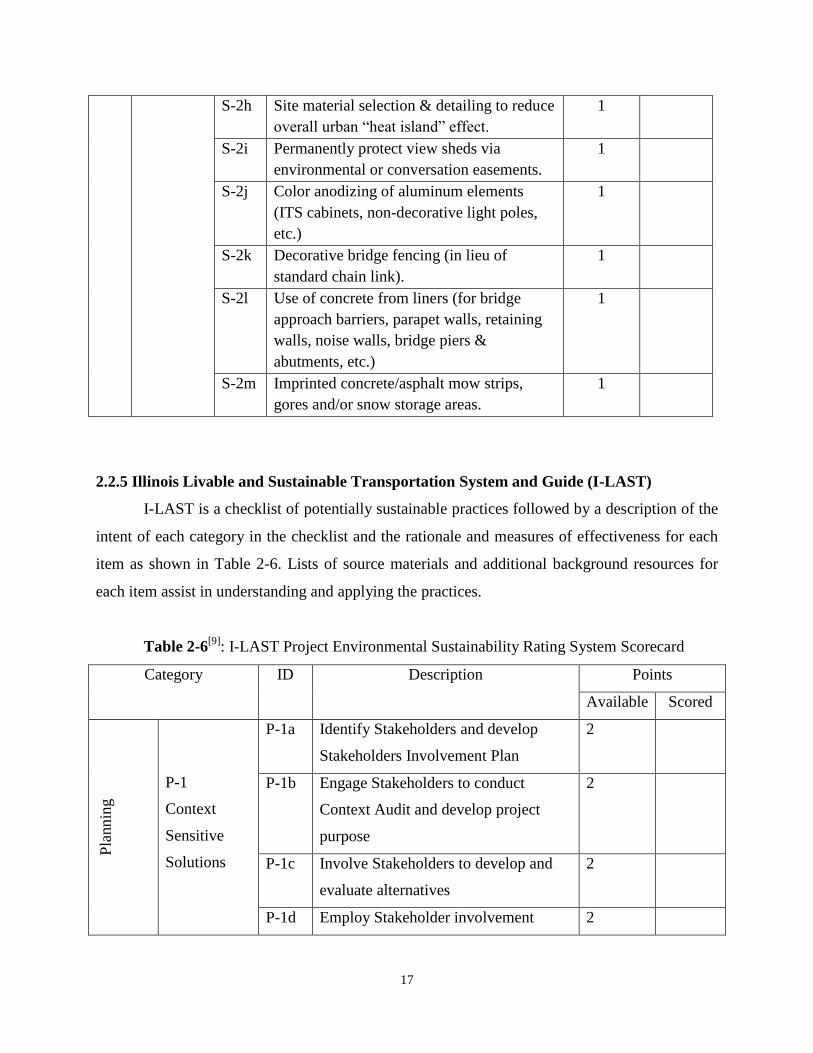
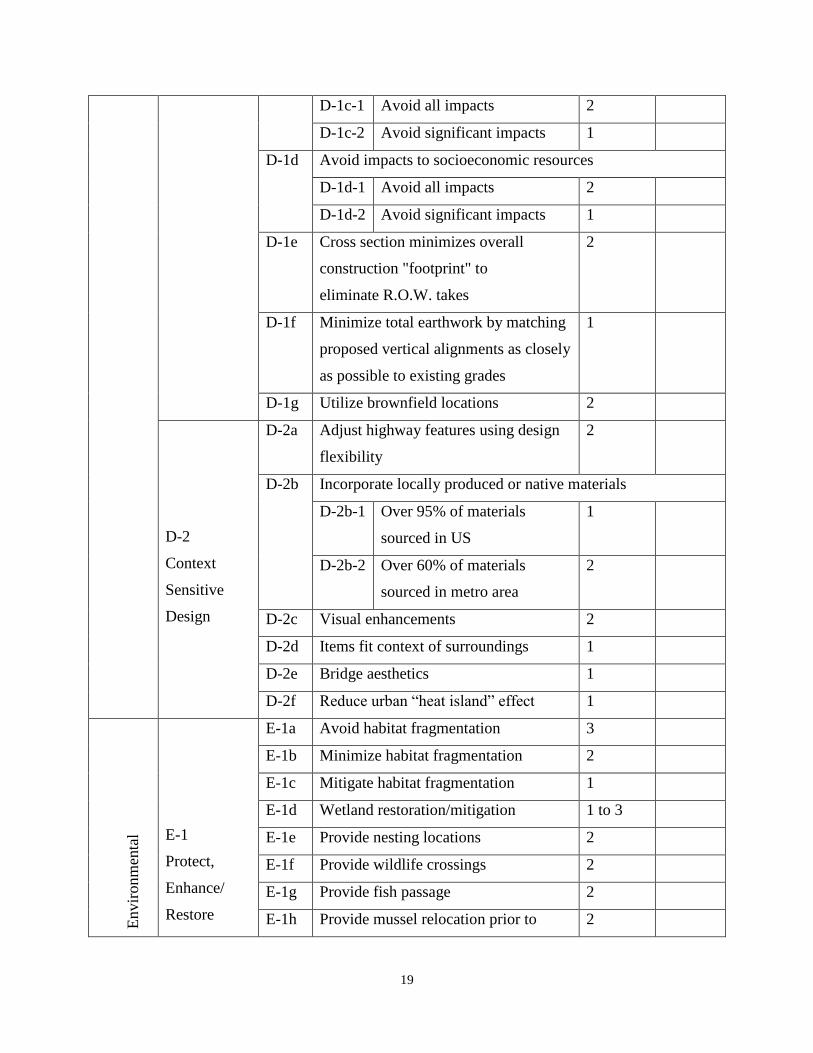
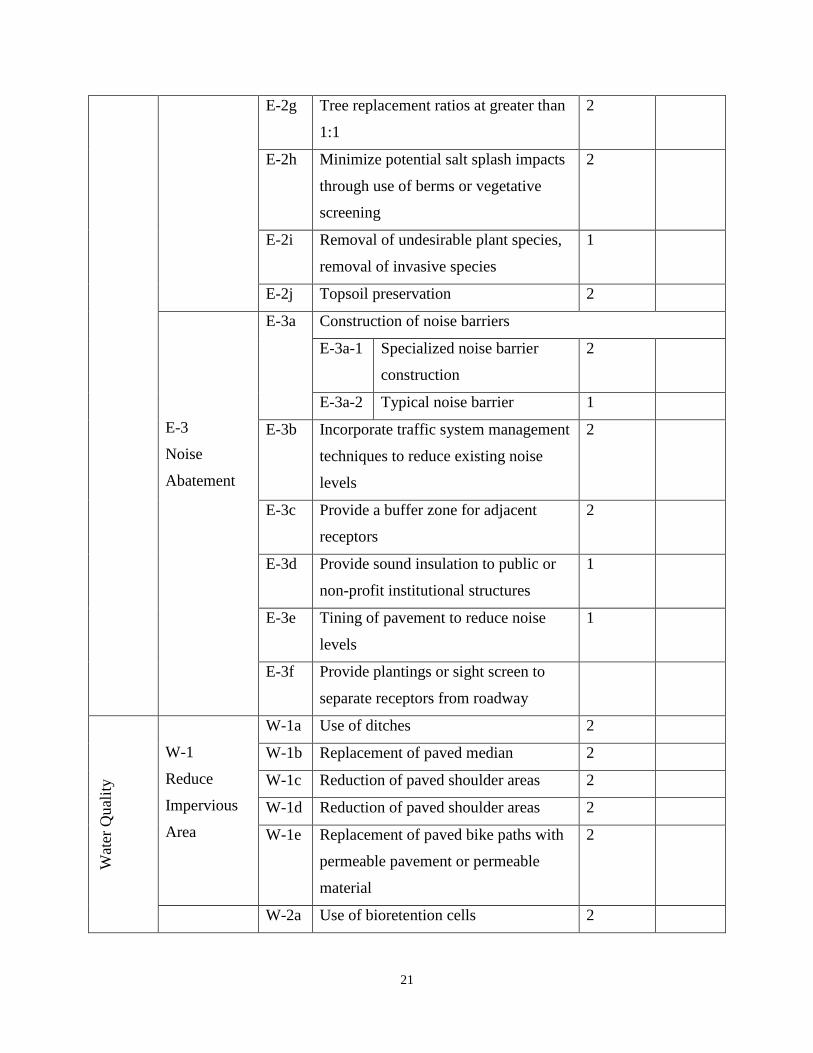
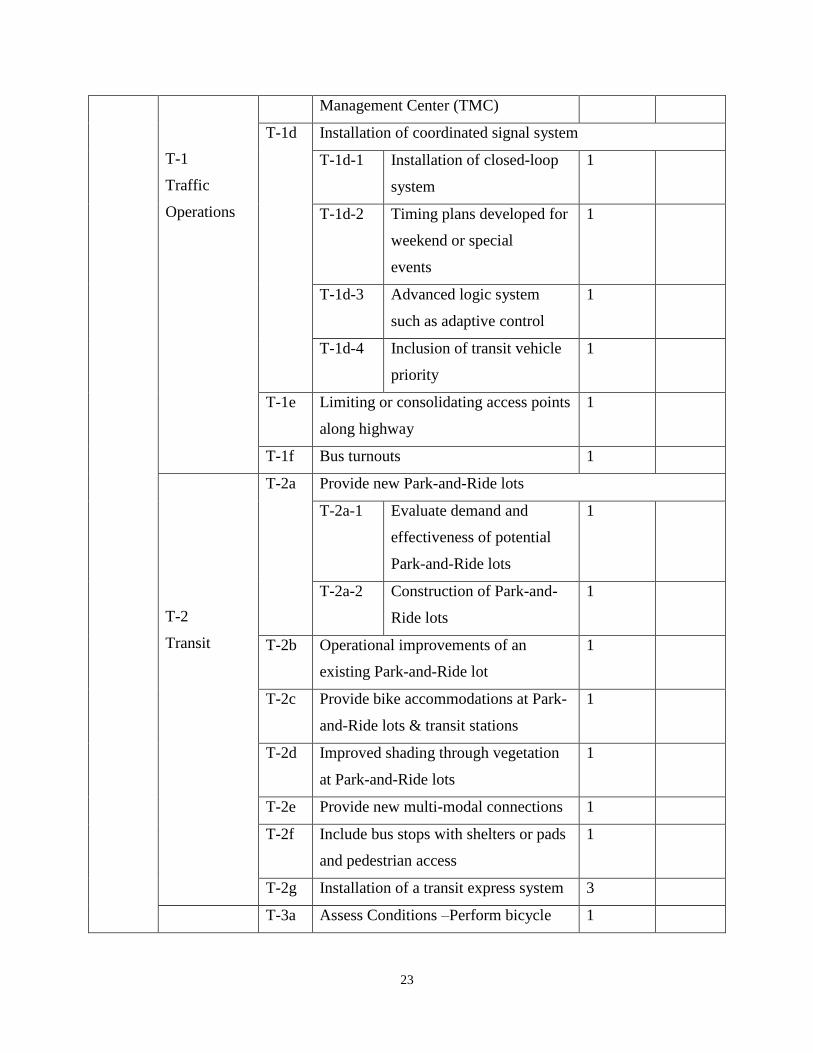
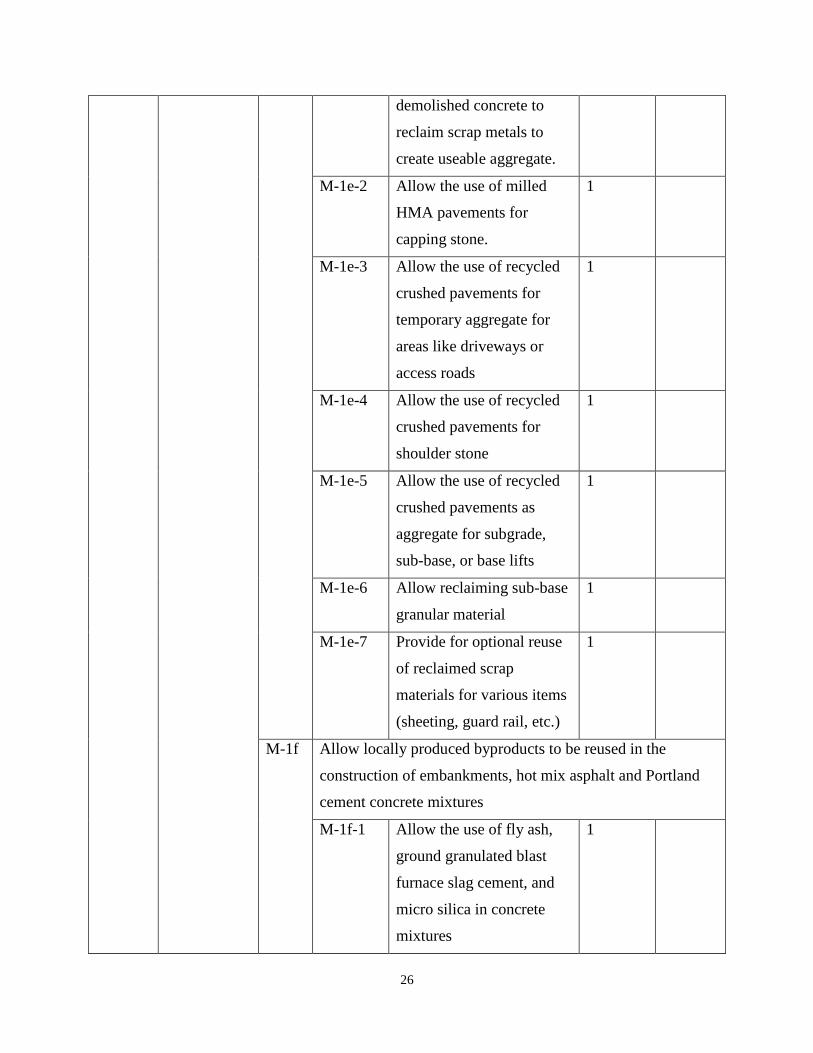
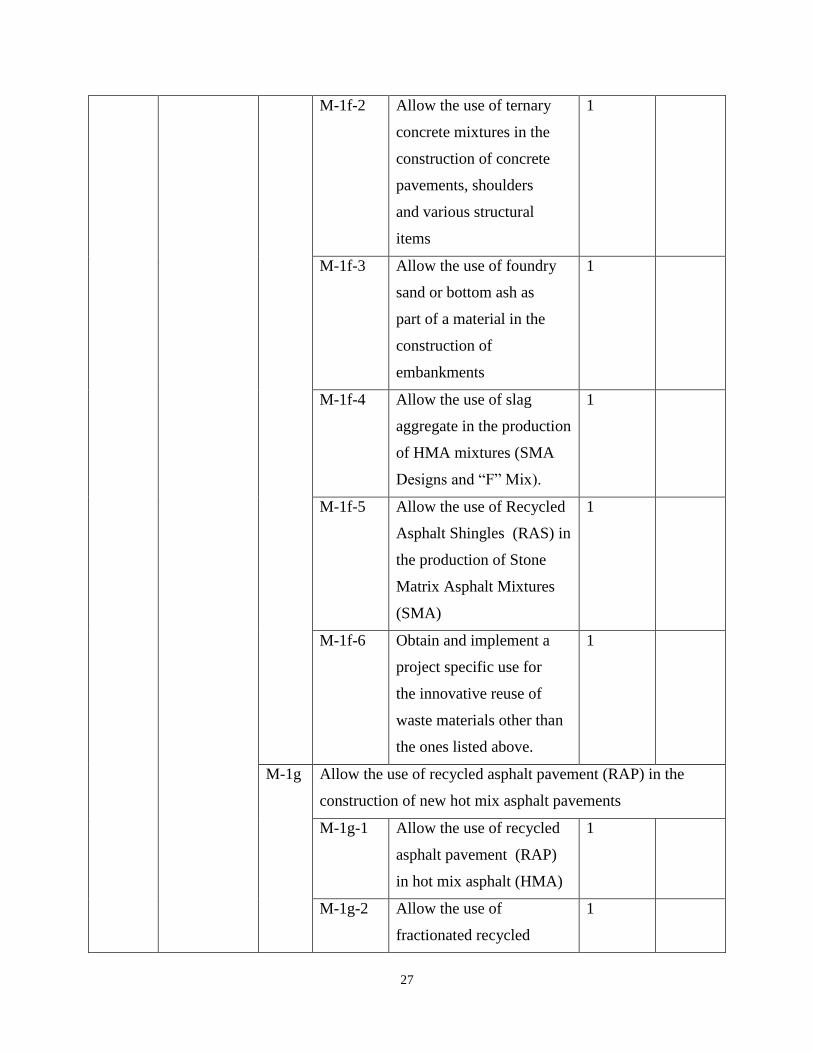
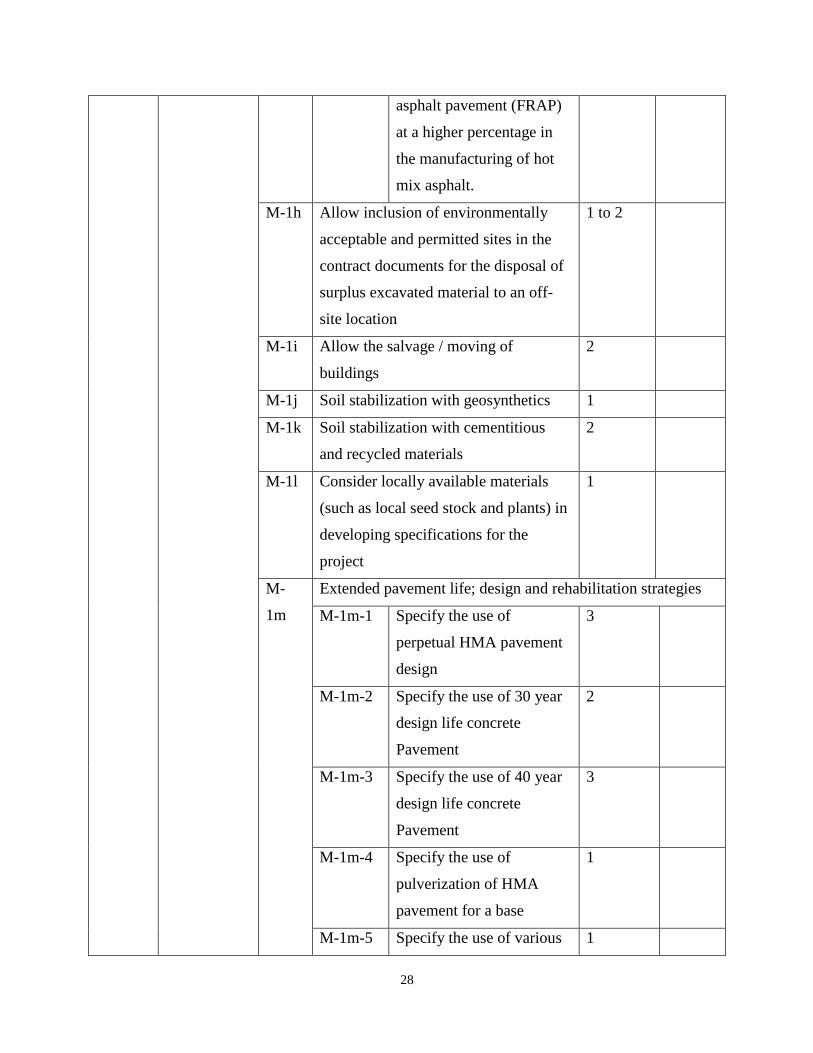
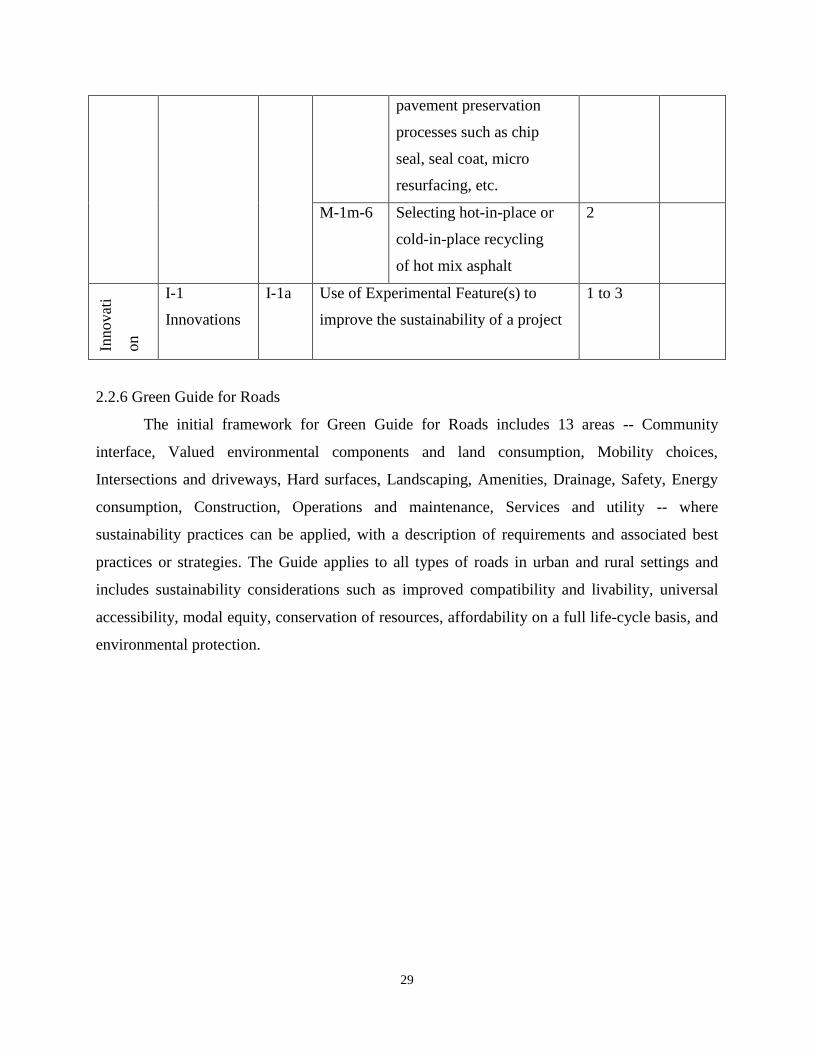
2.2.5 Illinois Livable and Sustainable Transportation System and Guide (I-LAST)
I-LAST is a checklist of potentially sustainable practices followed by a description of the
intent of each category in the checklist and the rationale and measures of effectiveness for each
item as shown in Table 2-6. Lists of source materials and additional background resources for
each item assist in understanding and applying the practices.
Table 2-6[9]
: I-LAST Project Environmental Sustainability Rating System Scorecard
Category ID Description Points
Available Scored
Pla
nnin
g
P-1
Context
Sensitive
Solutions
P-1a Identify Stakeholders and develop
Stakeholders Involvement Plan
2
P-1b Engage Stakeholders to conduct
Context Audit and develop project
purpose
2
P-1c Involve Stakeholders to develop and
evaluate alternatives
2
P-1d Employ Stakeholder involvement 2

18
techniques to achieve consensus for
Preferred Project Alternative
P-2
Land Use /
Community
Planning
P-2a Promote reduction in vehicle trips by
accommodating increased use of
public transit
2
P-2b Accommodate multi-modal
transportation uses (e.g. transit riders,
pedestrians, and bicyclists)
2
P-2c Increase transportation efficiencies for
moving freight through features such
as dedicated rail or intermodal
facilities
2
P-2d Partnerships that provide
environmental or technological
advancements while promoting
environmental stewardship
2
P-2e Project is consistent with regional
plans and local managed growth-based
Master or Comprehensive Plans
2
P-2f Project is compatible with local efforts
for Transit Oriented Design
1
Des
ign
D-1
Alignment
Selection
D-1a Avoid impacts to high quality undeveloped lands
D-1a-1 Avoid all impacts 2
D-1a-2 Avoid significant impacts 1
D-1b Provide buffer between highway and high quality
wetlands/water resources
D-1b-1 Provide 100 foot buffer to
resources
2
D-1b-2 Avoid resource with less than
100 foot buffer
1
D-1c Avoid impacts to environmental resources, such as INAI sites
and sites with threatened or endangered species
19
D-1c-1 Avoid all impacts 2
D-1c-2 Avoid significant impacts 1
D-1d Avoid impacts to socioeconomic resources
D-1d-1 Avoid all impacts 2
D-1d-2 Avoid significant impacts 1
D-1e Cross section minimizes overall
construction "footprint" to
eliminate R.O.W. takes
2
D-1f Minimize total earthwork by matching
proposed vertical alignments as closely
as possible to existing grades
1
D-1g Utilize brownfield locations 2
D-2
Context
Sensitive
Design
D-2a Adjust highway features using design
flexibility
2
D-2b Incorporate locally produced or native materials
D-2b-1 Over 95% of materials
sourced in US
1
D-2b-2 Over 60% of materials
sourced in metro area
2
D-2c Visual enhancements 2
D-2d Items fit context of surroundings 1
D-2e Bridge aesthetics 1
D-2f Reduce urban “heat island” effect 1
Envir
on
men
tal
E-1
Protect,
Enhance/
Restore
E-1a Avoid habitat fragmentation 3
E-1b Minimize habitat fragmentation 2
E-1c Mitigate habitat fragmentation 1
E-1d Wetland restoration/mitigation 1 to 3
E-1e Provide nesting locations 2
E-1f Provide wildlife crossings 2
E-1g Provide fish passage 2
E-1h Provide mussel relocation prior to 2

20
Wildlife
and its
Habitat
construction
E-1i Provide right-of-way wildlife barriers 1
E-1j Provide mowing markers 1
E-1k Schedule construction to avoid wildlife
disruption
1
E-2a Avoidance/protection of individual and
contiguous stands of specimen trees
and localized areas of established,
desirable
vegetation
2
E-2
Trees and
Plant
Communities
E-2b Designs which demonstrate an anticipated ultimate net
increase in tree species
E-2b-1 Increase tree species through
preservation and new
planting
2
E-2b-2 Coordination with local
stakeholders to create a plant
palette in context with
community
2
E-2b-3 Historic native plantings are
re-established
1
E-2c Re-establish/expand native vegetation
in reclaimed work areas or abandoned
old alignments
2
E-2d Use of plant material in lieu of or
enhance structural such as living snow
fences, sight screens (viburnum,
dogwood, etc.)
1
E-2e Use of native species for plugs, seed
mixes, perennial and other plantings
2
E-2f Planting trees, shrubs and/or native
plant material in highway right-of-way
2
21
E-2g Tree replacement ratios at greater than
1:1
2
E-2h Minimize potential salt splash impacts
through use of berms or vegetative
screening
2
E-2i Removal of undesirable plant species,
removal of invasive species
1
E-2j Topsoil preservation 2
E-3
Noise
Abatement
E-3a Construction of noise barriers
E-3a-1 Specialized noise barrier
construction
2
E-3a-2 Typical noise barrier 1
E-3b Incorporate traffic system management
techniques to reduce existing noise
levels
2
E-3c Provide a buffer zone for adjacent
receptors
2
E-3d Provide sound insulation to public or
non-profit institutional structures
1
E-3e Tining of pavement to reduce noise
levels
1
E-3f Provide plantings or sight screen to
separate receptors from roadway
Wat
er Q
ual
ity
W-1
Reduce
Impervious
Area
W-1a Use of ditches 2
W-1b Replacement of paved median 2
W-1c Reduction of paved shoulder areas 2
W-1d Reduction of paved shoulder areas 2
W-1e Replacement of paved bike paths with
permeable pavement or permeable
material
2
W-2a Use of bioretention cells 2

22
W-2
Stormwater
Treatment
W-2b Use of constructed wetlands 2
W-2c Use of bioswales 2
W-2d Use of mechanical stormwater
treatment systems
2
W-2e Use of catch basins 1
W-2f Use of infiltration trenches 1
W-2g Use of rain gardens 1
W-2h Use of sand filters 1
W-2i Use of ditch checks 1
W-2j Use of sediment traps and forebays 1
W-3
Construction
Practices to
Protect
Water
Quality
W-3a Analysis of pollutants in stormwater 1
W-3b Stream bank restoration 2
W-3c Practices to protect highly erodible soils
W-3c-1 Special provisions for soil
erosion control at stream
crossings
2
W-3c-2 Meet NPDES requirements 1
W-3d Implementation of erosion control
practices
1
W-3e Staging construction to minimize soil
exposure
1
W-3f Provide stormwater detention 1
W-3g Reduce use of fertilizers and herbicides 1
W-3h Protection from materials entering
waterway on bridge demolition and
construction
1
Tra
nsp
ort
atio
n
T-1a Special use lane: High Occupancy
Vehicle, reversible
2
T-1b Innovative intersection/interchange
design
2
T-1c Expansion of or connection to a Traffic 2
23
T-1
Traffic
Operations
Management Center (TMC)
T-1d Installation of coordinated signal system
T-1d-1 Installation of closed-loop
system
1
T-1d-2 Timing plans developed for
weekend or special
events
1
T-1d-3 Advanced logic system
such as adaptive control
1
T-1d-4 Inclusion of transit vehicle
priority
1
T-1e Limiting or consolidating access points
along highway
1
T-1f Bus turnouts 1
T-2
Transit
T-2a Provide new Park-and-Ride lots
T-2a-1 Evaluate demand and
effectiveness of potential
Park-and-Ride lots
1
T-2a-2 Construction of Park-and-
Ride lots
1
T-2b Operational improvements of an
existing Park-and-Ride lot
1
T-2c Provide bike accommodations at Park-
and-Ride lots & transit stations
1
T-2d Improved shading through vegetation
at Park-and-Ride lots
1
T-2e Provide new multi-modal connections 1
T-2f Include bus stops with shelters or pads
and pedestrian access
1
T-2g Installation of a transit express system 3
T-3a Assess Conditions –Perform bicycle 1

24
T-3
Improve
Bicycle and
Pedestrian
Facilities
and pedestrian Level of
Service analysis within the roadway
corridor
T-3b Improved intersection designs for
pedestrians
1 to 2
T-3c Provide new or rehabilitate existing sidewalks or bikeways
T-3c-1 Provide new sidewalks or
bikeways
2
T-3c-2 Rehabilitate sidewalks or
bikeways
1
T-3d Sidewalk or bikeway widening
T-3d-1 Widen sidewalk or bikeway 1
T-3d-2 Provide parkway separation 1
T-3e Designated space for cyclists (shared
lanes)
1
T-3f Striped bike lanes within roadway 2
T-3g Restore or pave shoulders for bicycling 2
T-3h Create parallel bike routes 1
T-3i Align the roadway to facilitate the
development of future multi-
use paths and facilities
1
T-3j Provide new grade-separated (bridge
or underpass) bike/pedestrian crossing
structure
3
T-3k Install bikeway signs 1
T-3l Install bicycle racks 1
Lig
hti
ng
L-1a Use of alternative energy source to
power street lighting, warning signs,
and remote Intelligent Transportation
Systems
(ITS) components
2

25
L-1
Reduce
Electrical
Consumption
L-1b Retrofit existing street lighting with
high efficiency types
2
L-1c Replace signs with retro reflective
signs to eliminate sign lighting
2
L-1d Retrofit existing sign lighting with
high efficiency types
1
L-1e Use of high efficiency street lighting
on new installations
2
L-1f Use of alternative energy source for
bus stops
2
L-1g Use of high efficiency (such as LED)
traffic signals
1
L-2
Stray light
Reduction
L-2a Retrofit existing roadway lighting
fixtures using cut off or full cut off
fixtures
2
L-2b New roadway lighting using cut off or
full cut off fixtures
2
Mat
eria
ls
M-1
Materials
M-1a Reuse of top soil 1
M-1b Balance cuts and fills
M-1b-1 Balance cuts and fills for
the project
1
M-1b-2 Balance cuts and fills per
stage
1
M-1c Reuse spoils within project corridor to
minimize material in and out of site
2
M-1d Allow rubblization of concrete
shoulder and concrete pavements
1
M-1e Allow flexibility in design with the use of recycled or
salvaged
non-hazardous material
M-1e-1 Allow the processing of 1
26
demolished concrete to
reclaim scrap metals to
create useable aggregate.
M-1e-2
Allow the use of milled
HMA pavements for
capping stone.
1
M-1e-3
Allow the use of recycled
crushed pavements for
temporary aggregate for
areas like driveways or
access roads
1
M-1e-4
Allow the use of recycled
crushed pavements for
shoulder stone
1
M-1e-5 Allow the use of recycled
crushed pavements as
aggregate for subgrade,
sub-base, or base lifts
1
M-1e-6 Allow reclaiming sub-base
granular material
1
M-1e-7 Provide for optional reuse
of reclaimed scrap
materials for various items
(sheeting, guard rail, etc.)
1
M-1f Allow locally produced byproducts to be reused in the
construction of embankments, hot mix asphalt and Portland
cement concrete mixtures
M-1f-1 Allow the use of fly ash,
ground granulated blast
furnace slag cement, and
micro silica in concrete
mixtures
1
27
M-1f-2 Allow the use of ternary
concrete mixtures in the
construction of concrete
pavements, shoulders
and various structural
items
1
M-1f-3 Allow the use of foundry
sand or bottom ash as
part of a material in the
construction of
embankments
1
M-1f-4 Allow the use of slag
aggregate in the production
of HMA mixtures (SMA
Designs and “F” Mix).
1
M-1f-5 Allow the use of Recycled
Asphalt Shingles (RAS) in
the production of Stone
Matrix Asphalt Mixtures
(SMA)
1
M-1f-6 Obtain and implement a
project specific use for
the innovative reuse of
waste materials other than
the ones listed above.
1
M-1g Allow the use of recycled asphalt pavement (RAP) in the
construction of new hot mix asphalt pavements
M-1g-1 Allow the use of recycled
asphalt pavement (RAP)
in hot mix asphalt (HMA)
1
M-1g-2 Allow the use of
fractionated recycled
1
28
asphalt pavement (FRAP)
at a higher percentage in
the manufacturing of hot
mix asphalt.
M-1h Allow inclusion of environmentally
acceptable and permitted sites in the
contract documents for the disposal of
surplus excavated material to an off-
site location
1 to 2
M-1i Allow the salvage / moving of
buildings
2
M-1j Soil stabilization with geosynthetics 1
M-1k Soil stabilization with cementitious
and recycled materials
2
M-1l Consider locally available materials
(such as local seed stock and plants) in
developing specifications for the
project
1
M-
1m
Extended pavement life; design and rehabilitation strategies
M-1m-1 Specify the use of
perpetual HMA pavement
design
3
M-1m-2 Specify the use of 30 year
design life concrete
Pavement
2
M-1m-3 Specify the use of 40 year
design life concrete
Pavement
3
M-1m-4 Specify the use of
pulverization of HMA
pavement for a base
1
M-1m-5 Specify the use of various 1
29
pavement preservation
processes such as chip
seal, seal coat, micro
resurfacing, etc.
M-1m-6 Selecting hot-in-place or
cold-in-place recycling
of hot mix asphalt
2
Innovat
i
on
I-1
Innovations
I-1a Use of Experimental Feature(s) to
improve the sustainability of a project
1 to 3
2.2.6 Green Guide for Roads
The initial framework for Green Guide for Roads includes 13 areas -- Community
interface, Valued environmental components and land consumption, Mobility choices,
Intersections and driveways, Hard surfaces, Landscaping, Amenities, Drainage, Safety, Energy
consumption, Construction, Operations and maintenance, Services and utility -- where
sustainability practices can be applied, with a description of requirements and associated best
practices or strategies. The Guide applies to all types of roads in urban and rural settings and
includes sustainability considerations such as improved compatibility and livability, universal
accessibility, modal equity, conservation of resources, affordability on a full life-cycle basis, and
environmental protection.
30
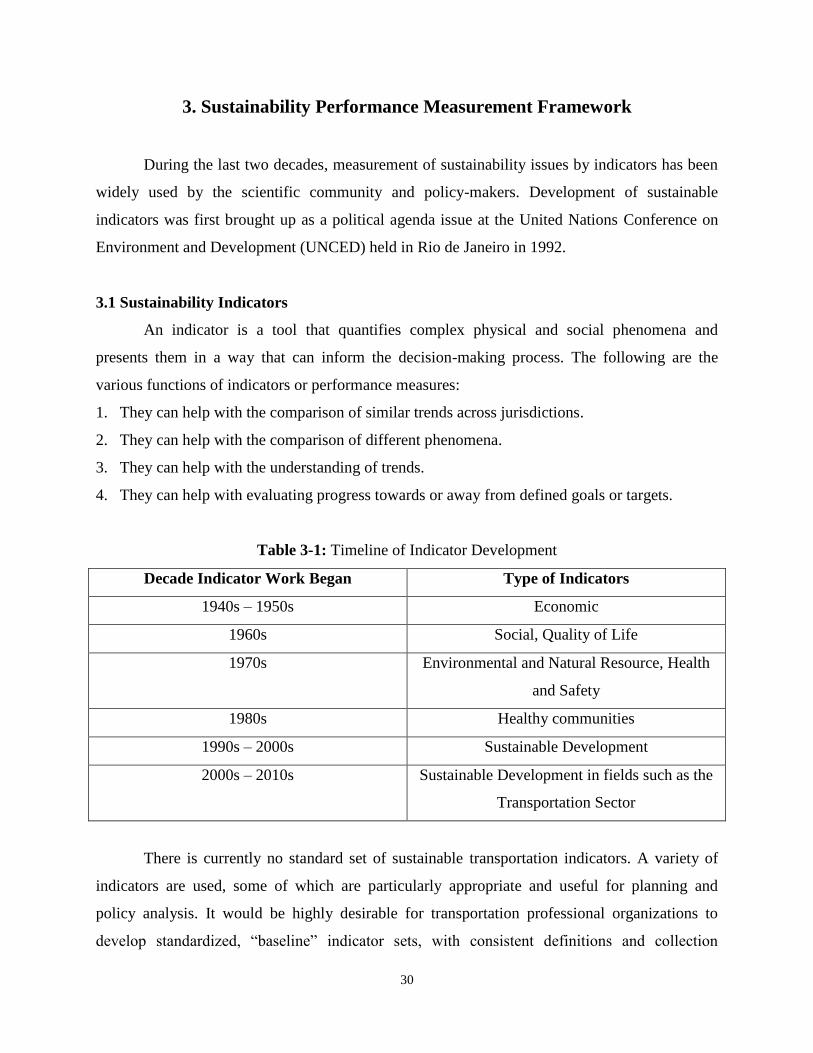
3. Sustainability Performance Measurement Framework
During the last two decades, measurement of sustainability issues by indicators has been
widely used by the scientific community and policy-makers. Development of sustainable
indicators was first brought up as a political agenda issue at the United Nations Conference on
Environment and Development (UNCED) held in Rio de Janeiro in 1992.
3.1 Sustainability Indicators
An indicator is a tool that quantifies complex physical and social phenomena and
presents them in a way that can inform the decision-making process. The following are the
various functions of indicators or performance measures:
1. They can help with the comparison of similar trends across jurisdictions.
2. They can help with the comparison of different phenomena.
3. They can help with the understanding of trends.
4. They can help with evaluating progress towards or away from defined goals or targets.
Table 3-1: Timeline of Indicator Development
Decade Indicator Work Began Type of Indicators
1940s – 1950s Economic
1960s Social, Quality of Life
1970s Environmental and Natural Resource, Health
and Safety
1980s Healthy communities
1990s – 2000s Sustainable Development
2000s – 2010s Sustainable Development in fields such as the
Transportation Sector
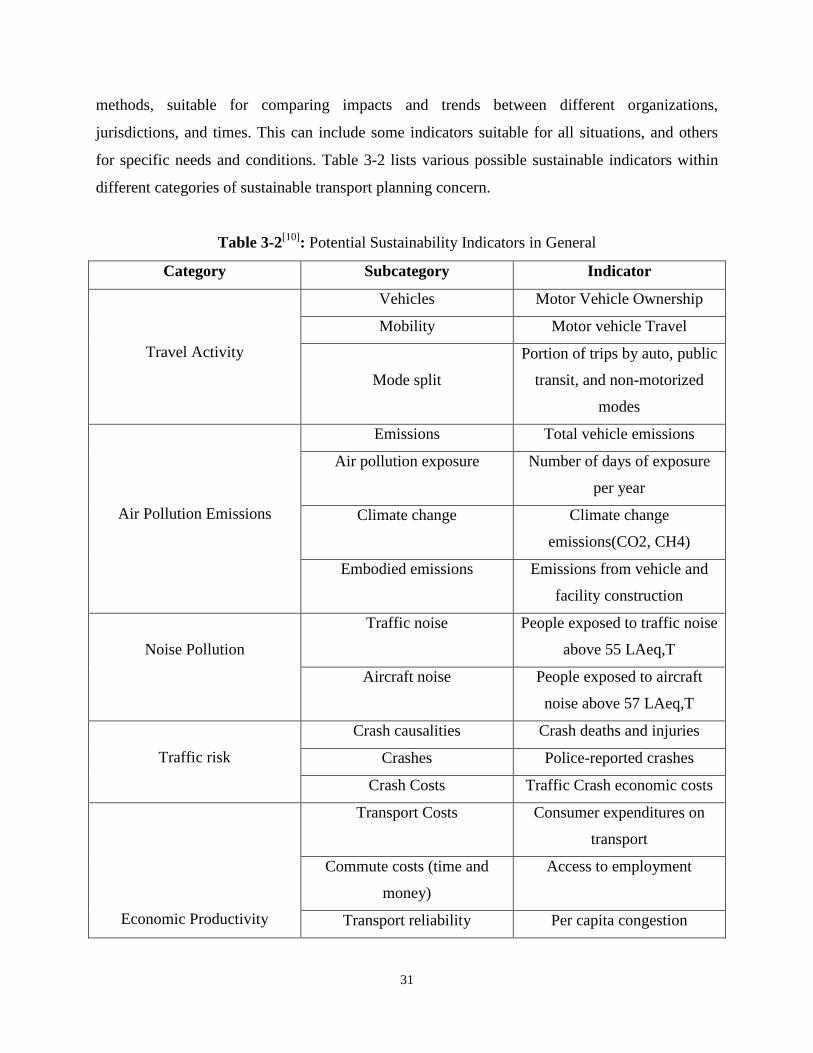
There is currently no standard set of sustainable transportation indicators. A variety of
indicators are used, some of which are particularly appropriate and useful for planning and
policy analysis. It would be highly desirable for transportation professional organizations to
develop standardized, “baseline” indicator sets, with consistent definitions and collection
31
methods, suitable for comparing impacts and trends between different organizations,
jurisdictions, and times. This can include some indicators suitable for all situations, and others
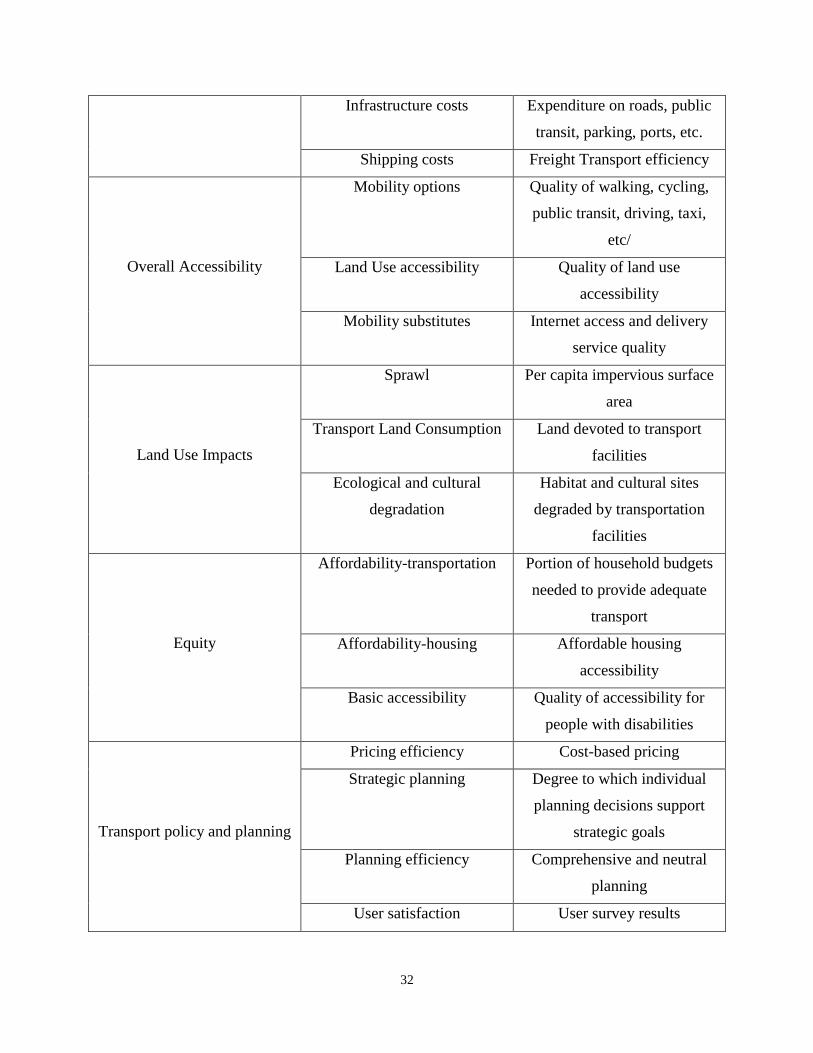
for specific needs and conditions. Table 3-2 lists various possible sustainable indicators within
different categories of sustainable transport planning concern.
Table 3-2[10]
: Potential Sustainability Indicators in General
Category Subcategory Indicator
Travel Activity
Vehicles Motor Vehicle Ownership
Mobility Motor vehicle Travel
Mode split
Portion of trips by auto, public
transit, and non-motorized
modes
Air Pollution Emissions
Emissions Total vehicle emissions
Air pollution exposure Number of days of exposure
per year
Climate change Climate change
emissions(CO2, CH4)
Embodied emissions Emissions from vehicle and
facility construction
Noise Pollution
Traffic noise People exposed to traffic noise
above 55 LAeq,T
Aircraft noise People exposed to aircraft
noise above 57 LAeq,T
Traffic risk
Crash causalities Crash deaths and injuries
Crashes Police-reported crashes
Crash Costs Traffic Crash economic costs
Economic Productivity
Transport Costs Consumer expenditures on
transport
Commute costs (time and
money)
Access to employment
Transport reliability Per capita congestion
32
Infrastructure costs Expenditure on roads, public
transit, parking, ports, etc.
Shipping costs Freight Transport efficiency
Overall Accessibility
Mobility options Quality of walking, cycling,
public transit, driving, taxi,
etc/
Land Use accessibility Quality of land use
accessibility
Mobility substitutes Internet access and delivery
service quality
Land Use Impacts
Sprawl Per capita impervious surface
area
Transport Land Consumption Land devoted to transport
facilities
Ecological and cultural
degradation
Habitat and cultural sites
degraded by transportation
facilities
Equity
Affordability-transportation Portion of household budgets
needed to provide adequate
transport
Affordability-housing Affordable housing
accessibility
Basic accessibility Quality of accessibility for
people with disabilities
Transport policy and planning
Pricing efficiency Cost-based pricing
Strategic planning Degree to which individual
planning decisions support
strategic goals
Planning efficiency Comprehensive and neutral
planning
User satisfaction User survey results
33
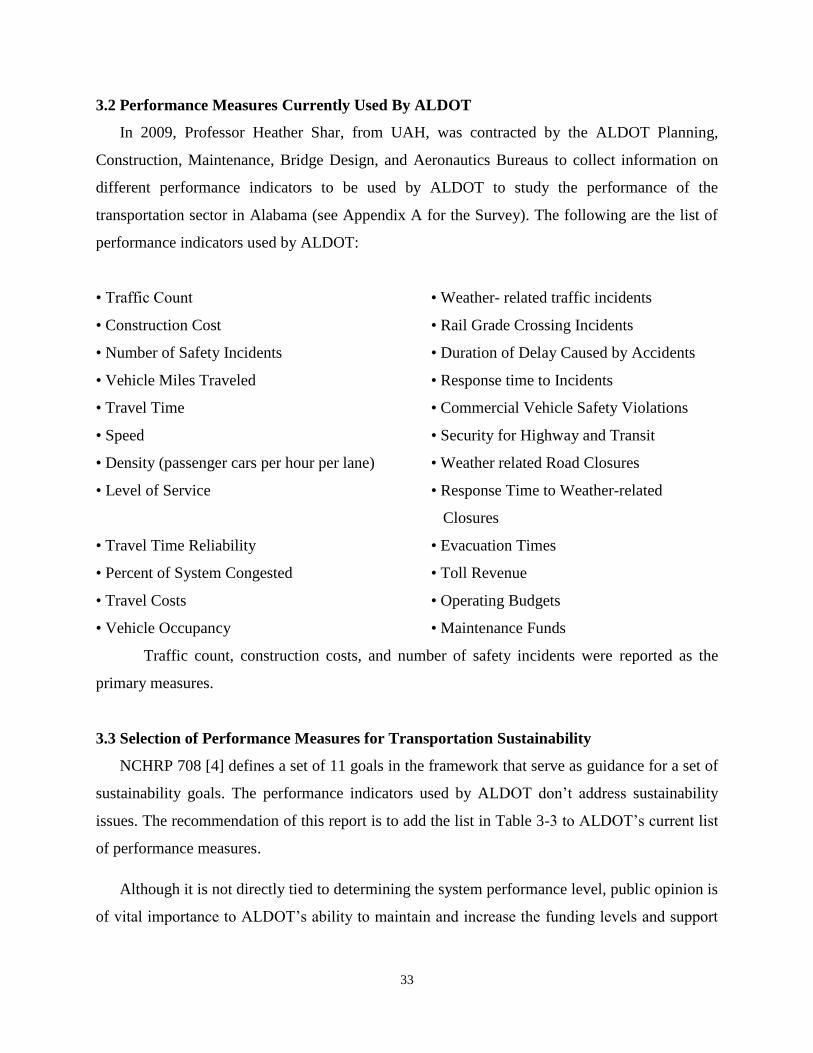
3.2 Performance Measures Currently Used By ALDOT
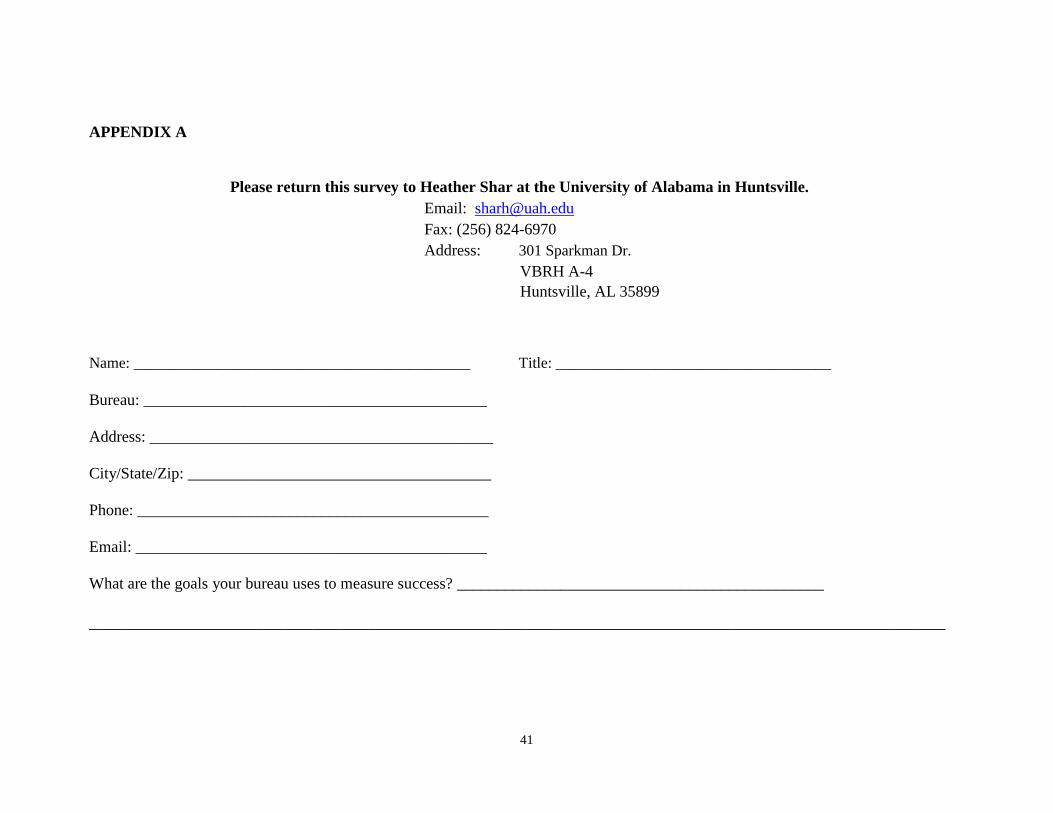
In 2009, Professor Heather Shar, from UAH, was contracted by the ALDOT Planning,
Construction, Maintenance, Bridge Design, and Aeronautics Bureaus to collect information on
different performance indicators to be used by ALDOT to study the performance of the
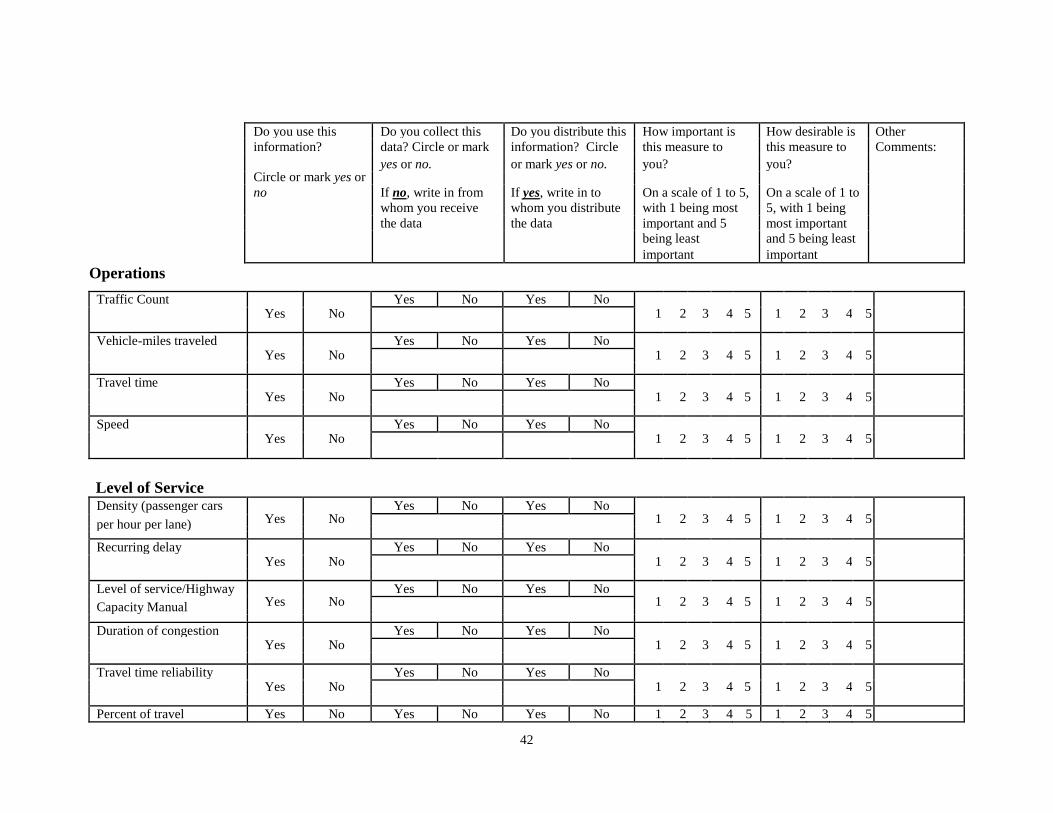
transportation sector in Alabama (see Appendix A for the Survey). The following are the list of
performance indicators used by ALDOT:
• Traffic Count • Weather- related traffic incidents
• Construction Cost • Rail Grade Crossing Incidents
• Number of Safety Incidents • Duration of Delay Caused by Accidents
• Vehicle Miles Traveled • Response time to Incidents
• Travel Time • Commercial Vehicle Safety Violations
• Speed • Security for Highway and Transit
• Density (passenger cars per hour per lane) • Weather related Road Closures
• Level of Service • Response Time to Weather-related
Closures
• Travel Time Reliability • Evacuation Times
• Percent of System Congested • Toll Revenue
• Travel Costs • Operating Budgets
• Vehicle Occupancy • Maintenance Funds
Traffic count, construction costs, and number of safety incidents were reported as the
primary measures.
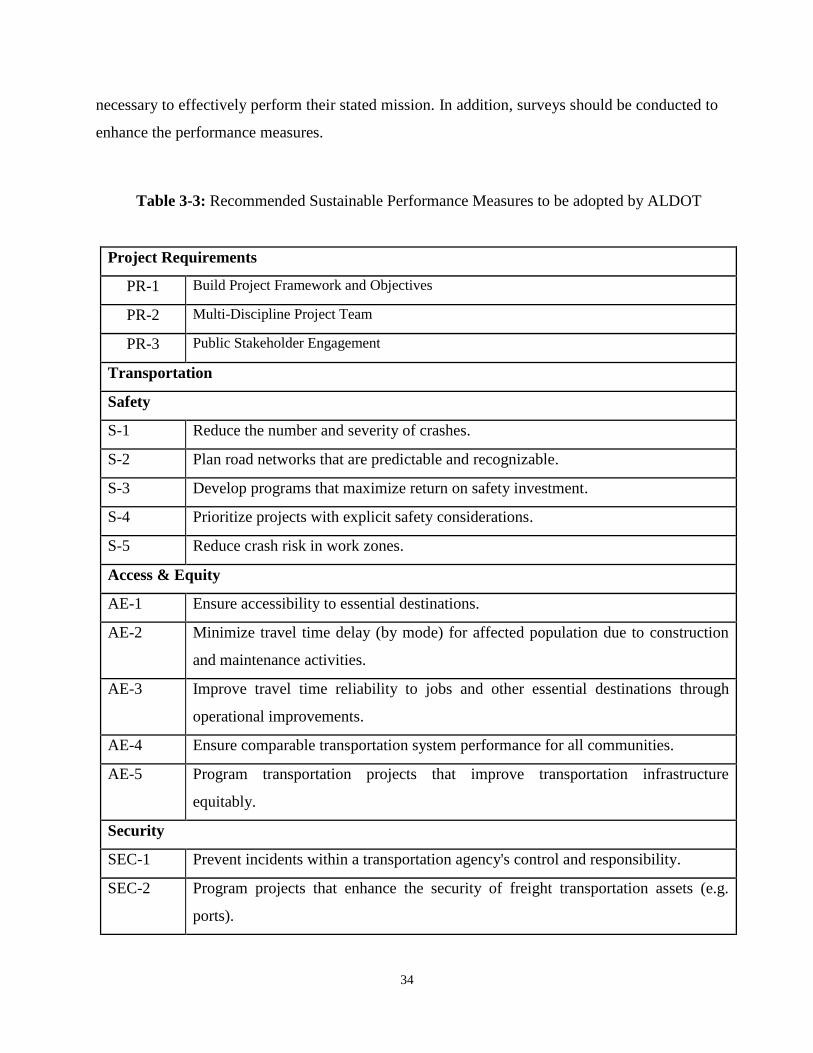
3.3 Selection of Performance Measures for Transportation Sustainability
NCHRP 708 [4] defines a set of 11 goals in the framework that serve as guidance for a set of
sustainability goals. The performance indicators used by ALDOT don’t address sustainability
issues. The recommendation of this report is to add the list in Table 3-3 to ALDOT’s current list
of performance measures.
Although it is not directly tied to determining the system performance level, public opinion is
of vital importance to ALDOT’s ability to maintain and increase the funding levels and support
34
necessary to effectively perform their stated mission. In addition, surveys should be conducted to
enhance the performance measures.
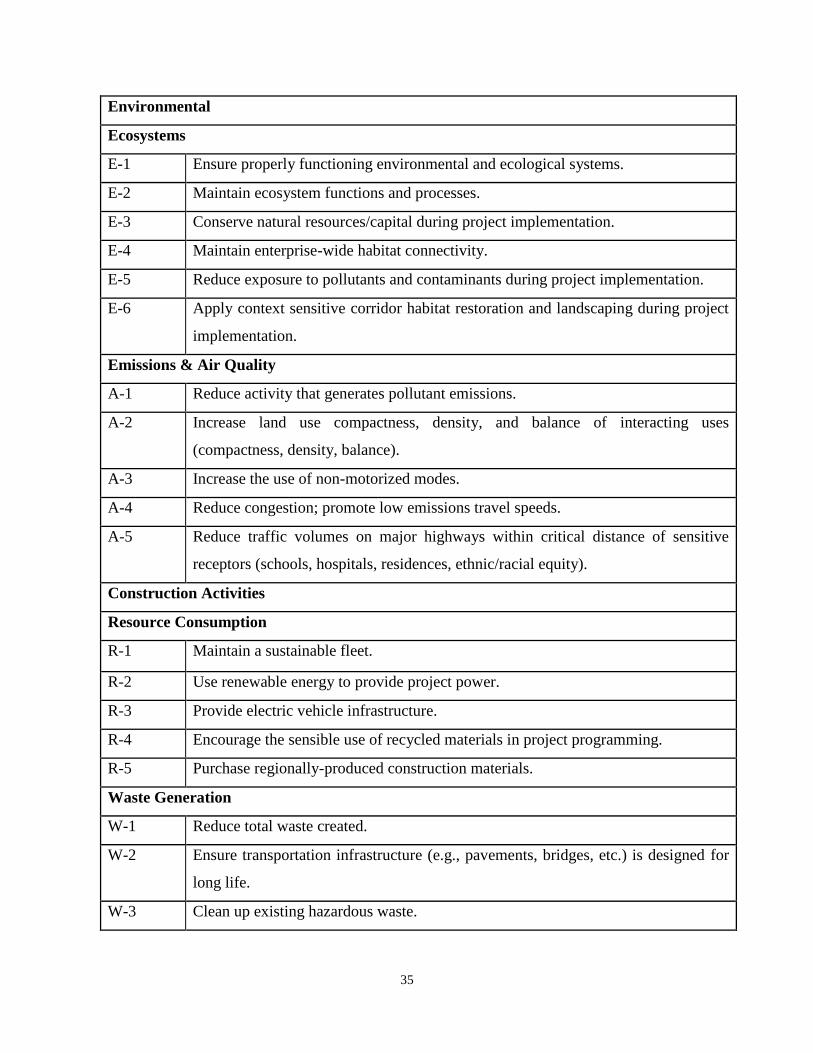
Table 3-3: Recommended Sustainable Performance Measures to be adopted by ALDOT
Project Requirements
PR-1 Build Project Framework and Objectives
PR-2 Multi-Discipline Project Team
PR-3 Public Stakeholder Engagement
Transportation
Safety
S-1 Reduce the number and severity of crashes.
S-2 Plan road networks that are predictable and recognizable.
S-3 Develop programs that maximize return on safety investment.
S-4 Prioritize projects with explicit safety considerations.
S-5 Reduce crash risk in work zones.
Access & Equity
AE-1 Ensure accessibility to essential destinations.
AE-2 Minimize travel time delay (by mode) for affected population due to construction
and maintenance activities.
AE-3 Improve travel time reliability to jobs and other essential destinations through
operational improvements.
AE-4 Ensure comparable transportation system performance for all communities.
AE-5 Program transportation projects that improve transportation infrastructure
equitably.
Security
SEC-1 Prevent incidents within a transportation agency's control and responsibility.
SEC-2 Program projects that enhance the security of freight transportation assets (e.g.
ports).
35
Environmental
Ecosystems
E-1 Ensure properly functioning environmental and ecological systems.
E-2 Maintain ecosystem functions and processes.
E-3 Conserve natural resources/capital during project implementation.
E-4 Maintain enterprise-wide habitat connectivity.
E-5 Reduce exposure to pollutants and contaminants during project implementation.
E-6 Apply context sensitive corridor habitat restoration and landscaping during project
implementation.
Emissions & Air Quality
A-1 Reduce activity that generates pollutant emissions.
A-2 Increase land use compactness, density, and balance of interacting uses
(compactness, density, balance).
A-3 Increase the use of non-motorized modes.
A-4 Reduce congestion; promote low emissions travel speeds.
A-5 Reduce traffic volumes on major highways within critical distance of sensitive
receptors (schools, hospitals, residences, ethnic/racial equity).
Construction Activities
Resource Consumption
R-1 Maintain a sustainable fleet.
R-2 Use renewable energy to provide project power.
R-3 Provide electric vehicle infrastructure.
R-4 Encourage the sensible use of recycled materials in project programming.
R-5 Purchase regionally-produced construction materials.
Waste Generation
W-1 Reduce total waste created.
W-2 Ensure transportation infrastructure (e.g., pavements, bridges, etc.) is designed for
long life.
W-3 Clean up existing hazardous waste.

36
W-4 Change in average design life of infrastructure [by major component] due to
program.
Social & Economic
System Efficiency
SE-1 Ensure that the transportation system is functional for all users.
SE-2 Ensure that the existing transportation system achieves and maintains a state of
good repair.
SE-3 Program projects that maintain or improve the efficiency of the transportation
system for all users.
SE-4 Maintain the functionality of the transportation system during construction
activities.
Prosperity
P-1 Support growth in jobs and income by improving travel efficiency/reducing
congestion.
P-2 Program projects that reduce freight transportation costs.
Economic Viability
EV-1 Ensure the expected value of social and economic benefits created by proposed
transportation projects exceeds their costs.
EV-2 Ensure the selection of the lowest cost project alternative.
EV-3 Ensure construction costs are within planned budget.
EV-4 Ensure maintenance costs are within planned budget.
EV-5 Ensure operation costs are within planned budget.

37
4. Conclusion
The research project, carried out over a 12 month period, was designed to establish a
baseline understanding of the potential for using sustainability performance measures in the
Alabama Department of Transportation. Quite a number of sustainability initiatives have
discussed various definitions and performance measures of sustainable transportation systems,
but very few regional agencies have developed planning tools that successfully incorporate
sustainability in transportation sector. This study develops a framework of sustainability
performance measures, and incorporating sustainability considerations into the ALDOT’s
decision-making process. The recommended performance measures are found in Table 3-3.
The literature review indicates that the present status of addressing sustainability in
transportation planning is more focused on the effectiveness and efficiency of transportation
systems as well as the resulting environmental impacts, and less on economic and social impacts.
The proposed framework should help decision-makers in transportation planning consider
sustainability issues by identifying better plans for readily available objectives.
Future Research
Future research should proceed to incorporate broader environmental, economic, social
impacts of transportation systems by modeling the interactions among these sustainability
dimensions. Public opinion is to be considered and surveys should be conducted to enhance the
performance measures. Further development and quantification of sustainability measures will
help to incorporate the sustainability considerations more fully.
38
Acknowledgments
This project was supported by the University Transportation Center for Alabama under
project 12302, “Developing Sustainable Transportation Performance Measures for ALDOT”.

39
References
1. Christine Ratekin. “Smart Mobility: A Survey of Current Practice and Related Research.”
Caltrans Division of Transportation Planning, April 25, 2011.
2. “Guide to Sustainable Transportation Performance Measures.” EPA 231-K-10-004, August
2011.
3. “Integrating Sustainability into the Transportation Planning Process.” Transportation
Research Board of the National Academies, Conference proceedings 37, 2005.
4. “A Guidebook for Sustainability Performance Measurement for Transportation Agencies.”
Transportation Research Board, NCHRP 708.
5. Yi Lin Pei, Adjo A. Amekudzi, Michael D. Meyer, Elise M. Barrella, Catherine L. Ross,
“Performance Measurement Frameworks and the Development of Effective Sustainable
Transport Strategies and Indicators.” TRB 2010 Annual Meeting.
6. “Sustainable Transportation Access Rating System (STARS)” Pilot Project Application
Manual, Version 1.0, November 23, 2010.
7. Stephen T. Muench, Jeralee L. Anderson, “Greenroads: A Sustainability Performance Metric
for Roadway Design and Construction.” Transportation Northwest - Report No. TNW2009-
13, December 2009.
8. “NSYDOT Sustainability and GreenLITES.” New York State Department of Transportation.
9. “I-LAST, Illinois - Livable and Sustainable Transportation Rating System and Guide”,
Illinois Department of transportation, January 8, 2010.
10. Todd Litman and David Burwell (2006), “Issues in Sustainable Transportation,” International
Journal of Global Environmental Issues, Vol. 6, No. 4, pp. 331-347.
11. Tara Ramani, Josias Zietsman, William Eisele, Duane Rosa, Debbie Spillane and Brian
Bochner, “Developing Sustainable Transportation Performance Measures for TxDOT’s
Strategic Plan.” April 2009.
12. Josias Zietsman and Tara Ramani, “Sustainable Performance Measures for State DOT’s and other
Transportation Agencies.” July 2011.
13. Richard Gilbert, Neal Irwin, Brian Hollingsworth, and Pamela Blais, “Sustainable
Transportation Performance Indicators (STPI).”
14. “Sustainable Transportation Indicators.” Sustainable Transportation Indicators Subcommittee of
the Transportation Research Board (ADD40 [1]), 10 November 2008.
40
15. Christy Mihyeon Jeon “Incorporating Sustainability into Transportation Planning and
Decision Making: Definitions, Performance Measures and Evaluation.”
16. “Establishing Performance Measures for Alabama’s Transportation System,” Final Report:
ALDOT Project 930‐698.
17. Johns, R., et al., “Impact of Performance Measures on Internal and External relationships,”
Conference Proceedings 36: Performance Measures to Improve Transportation Systems.
Washington DC: National Academic Press, 2005.
18. Pickrell, S., & L, Neumann, “Use of Performance Measures in Transportation Decision
Making, Conference Proceedings 26: Performance Measures to Improve Transportation
Systems and Agency Operations. Washington DC: National Academic Press, 2001.
19. https://www.sustainablehighways.org/
41
APPENDIX A
Please return this survey to Heather Shar at the University of Alabama in Huntsville. Email: [email protected] Fax: (256) 824-6970 Address: 301 Sparkman Dr.
VBRH A-4 Huntsville, AL 35899
Name: ____________________________________________ Title: ____________________________________
Bureau: ___________________________________________
Address: ___________________________________________
City/State/Zip: ______________________________________
Phone: ____________________________________________
Email: ____________________________________________
What are the goals your bureau uses to measure success? ______________________________________________
____________________________________________________________________________________________
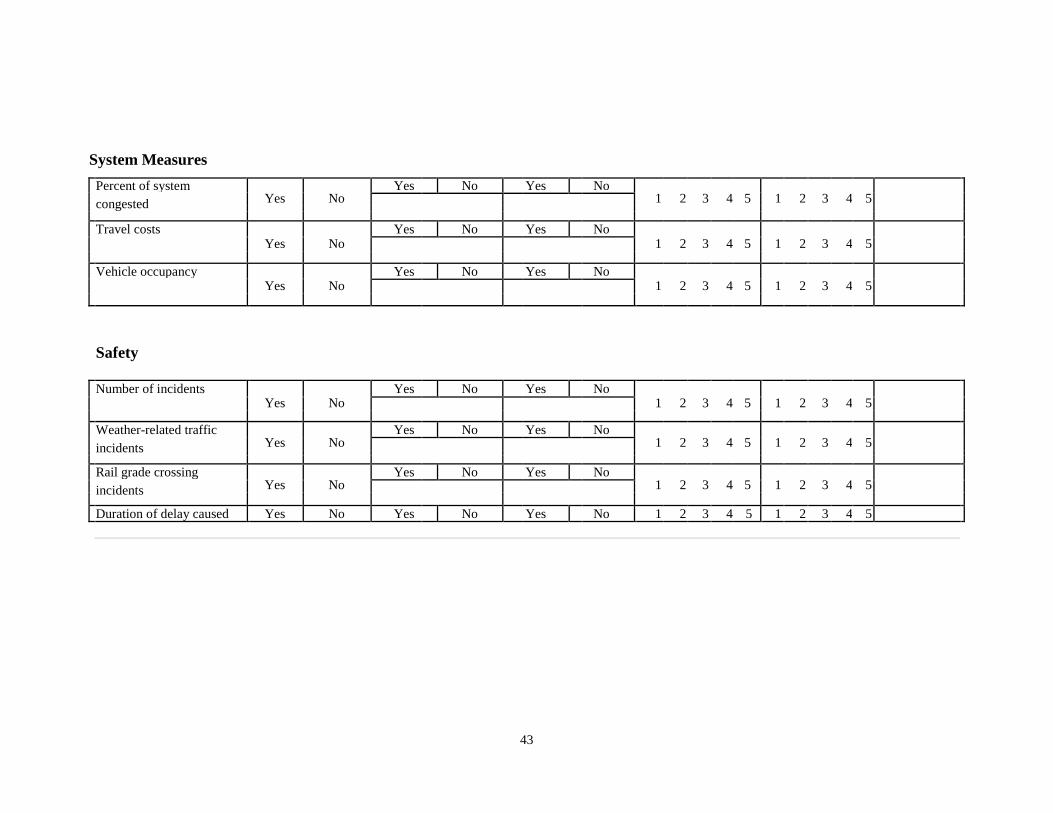
42
Do you use this Do you collect this Do you distribute this How important is How desirable is Other
information? data? Circle or mark information? Circle this measure to this measure to Comments:
Circle or mark yes or yes or no. or mark yes or no. you? you?
If no, write in from If yes, write in to
no On a scale of 1 to 5, On a scale of 1 to
whom you receive whom you distribute with 1 being most 5, with 1 being
the data the data important and 5 most important
being least and 5 being least
important important
Operations
Traffic Count Yes No
Yes No Yes No 1 2 3 4 5 1 2 3 4 5
Vehicle-miles traveled Yes No
Yes No Yes No 1 2 3 4 5 1 2 3 4 5
Travel time Yes No
Yes No Yes No 1 2 3 4 5 1 2 3 4 5
Speed Yes No
Yes No Yes No 1 2 3 4 5 1 2 3 4 5
Level of Service
Density (passenger cars Yes No
Yes No Yes No 1 2 3 4 5 1 2 3 4 5
per hour per lane)
Recurring delay Yes No
Yes No Yes No 1 2 3 4 5 1 2 3 4 5
Level of service/Highway Yes No
Yes No Yes No 1 2 3 4 5 1 2 3 4 5
Capacity Manual
Duration of congestion Yes No
Yes No Yes No 1 2 3 4 5 1 2 3 4 5
Travel time reliability Yes No
Yes No Yes No 1 2 3 4 5 1 2 3 4 5
Percent of travel Yes No Yes No Yes No 1 2 3 4 5 1 2 3 4 5
43
System Measures
Percent of system Yes No
Yes No Yes No 1 2 3 4 5 1 2 3 4 5
congested
Travel costs Yes No
Yes No Yes No 1 2 3 4 5 1 2 3 4 5
Vehicle occupancy Yes No
Yes No Yes No 1 2 3 4 5 1 2 3 4 5
Safety
Number of incidents Yes No
Yes No Yes No 1 2 3 4 5 1 2 3 4 5
Weather-related traffic Yes No
Yes No Yes No 1 2 3 4 5 1 2 3 4 5
incidents
Rail grade crossing Yes No
Yes No Yes No 1 2 3 4 5 1 2 3 4 5
incidents
Duration of delay caused Yes No Yes No Yes No 1 2 3 4 5 1 2 3 4 5
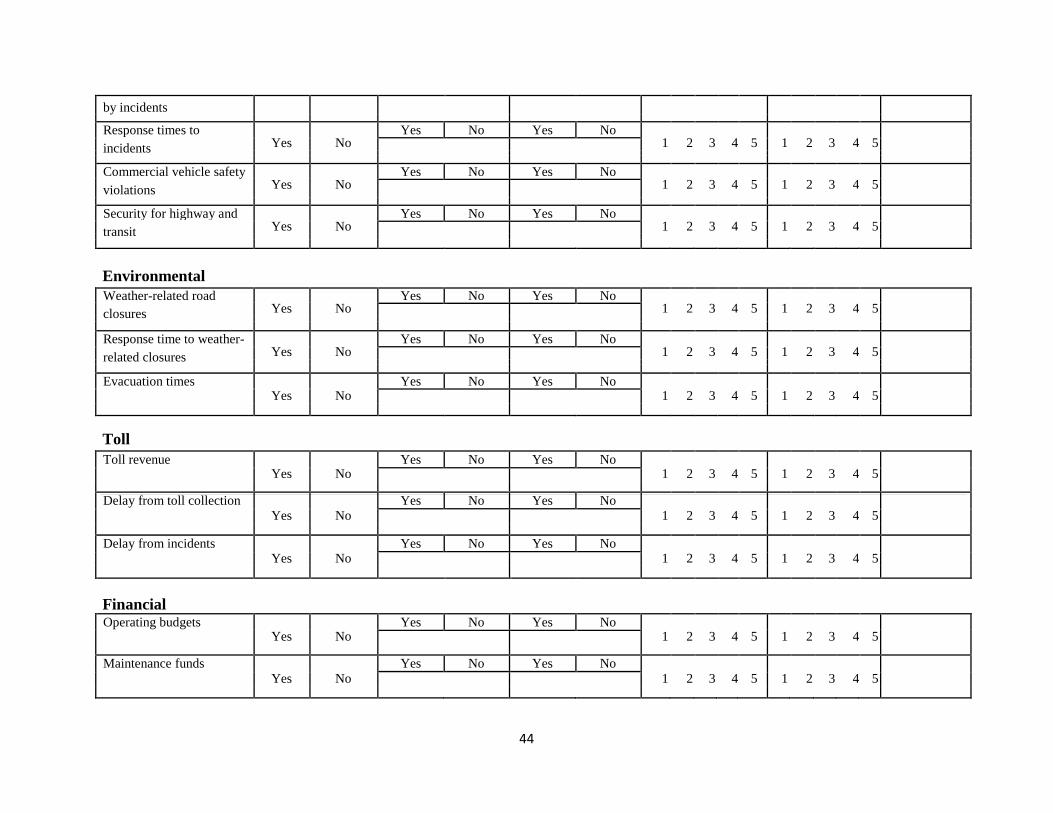
44
by incidents
Response times to Yes No
Yes No Yes No 1 2 3 4 5 1 2 3 4 5
incidents
Commercial vehicle safety Yes No
Yes No Yes No 1 2 3 4 5 1 2 3 4 5
violations
Security for highway and Yes No
Yes No Yes No 1 2 3 4 5 1 2 3 4 5
transit
Environmental Weather-related road
Yes No Yes No Yes No
1 2 3 4 5 1 2 3 4 5
closures
Response time to weather- Yes No
Yes No Yes No 1 2 3 4 5 1 2 3 4 5
related closures
Evacuation times Yes No
Yes No Yes No 1 2 3 4 5 1 2 3 4 5
Toll Toll revenue
Yes No Yes No Yes No
1 2 3 4 5 1 2 3 4 5
Delay from toll collection Yes No
Yes No Yes No 1 2 3 4 5 1 2 3 4 5
Delay from incidents Yes No
Yes No Yes No 1 2 3 4 5 1 2 3 4 5
Financial
Operating budgets Yes No
Yes No Yes No 1 2 3 4 5 1 2 3 4 5
Maintenance funds Yes No
Yes No Yes No 1 2 3 4 5 1 2 3 4 5

2010-2012 Advisory Board Mr. Steve Ostaseski, Chair Regional Planning Commission of Greater Birmingham Mr. Mark Bartlett, Vice-Chairman Division Administrator Federal Highway Administration Mr. Don Arkle Assistant Chief Engineer for Policy and Planning Alabama Department of Transportation Mr. James R. Brown Transportation Engineer Gonzales-Strength & Associates, Inc. Mr. Randy Cole Engineer Shelby County (AL) Highway Department Mr. George Conner State Maintenance Engineer Alabama Department of Transportation Mr. Eddie Curtis Traffic Management Specialist Federal Highway Administration Mr. Larry Lockett Bureau Chief, Materials & Tests Alabama Department of Transportation Mr. James Moore Municipal Transportation Planner City of Huntsville (AL) Mr. Billy Norrell Executive Director Alabama Road Builders Association Mr. Joe Robinson Engineer City of Tuscaloosa (AL)
Executive Committee Dr. Jay K. Lindly, Director UTCA The University of Alabama Dr. Michael Hardin, Associate Director UTCA The University of Alabama Dr. Fouad H. Fouad, Associate Director UTCA The University of Alabama at Birmingham Dr. Houssam A. Toutanji, Associate Director UTCA The University of Alabama in Huntsville
Staff Ms. Connie Harris, Secretary UTCA
Contact Information University Transportation Center for Alabama
1105 Bevill Building Box 870205
Tuscaloosa, AL 35487-0205 (205) 348-9925
(205) 348-6862 fax
[email protected] http://utca.eng.ua.edu
University Transportation Center for Alabama