Transmission Capital & Asset Strategy Workshop
140
B O N N E V I L L E P O W E R A D M I N I S T R A T I O N 1 2010 Integrated Program Review Transmission Capital & Asset Strategy Workshop May 17, 2010 9-12 and 1-4
Transcript of Transmission Capital & Asset Strategy Workshop

B O N N E V I L L E P O W E R A D M I N I S T R A T I O N
12010 Integrated Program Review
Transmission Capital & Asset Strategy Workshop
May 17, 20109-12 and 1-4
2010 Integrated Program Review 2
B O N N E V I L L E P O W E R A D M I N I S T R A T I O N
Table of Contents
Topic Slide # Presenter
9:00Background, Objectives and ScheduleFollow-up items from May 10th Workshop –
Staffing (p135-137)2-4 Larry Bekkedahl
9:15 Capital Overview 5-7 Larry Bekkedahl
• Capital Forecast
9:45 Asset Management 8-13 Hardev Juj
• Strategy Overview • Advancing Asset Management
10:00
Sustain Capital Program & StrategySystem Replacements
• Wood Lines• Steel Lines• Power System Control (PSC) and Communications• System Protection Control (SPC)• Substation -
AC• Substation -
DC• Control Centers• Tool and Equipment Acquisition Program (TEAP)• Rights of Way (ROW)
14-1920-2829-3637-4445-5051-5758-6364-7071-7778-86
Kevin Carman

2010 Integrated Program Review 3
B O N N E V I L L E P O W E R A D M I N I S T R A T I O N
Table of Contents
Topic Slide # Presenter
12:00- 1:00 Lunch
1:00Upgrades & AdditionsEnvironment
87-9091-93
Kevin Carman
1:30 Expansion Program - Main Grid 94-103 Kendall Rydell
2:00 Network Open Season (NOS) Program Highlights 104-113 Larry Bekkedahl
2:30 Expansion Program- Area and Customer Service 114-116 Kendall Rydell
3:00Expansion Program – PFIA
Customer Line Load Generation Customer Interconnection Generation Expansion Projects
117-126 Paul Fiedler
3:30Summary
AFUDC and IndirectsAccomplishing the Capital Program
127-130131-140
Larry Bekkedahl
3:45 Wrap-Up, Questions & Answers ~

2010 Integrated Program Review 4
B O N N E V I L L E P O W E R A D M I N I S T R A T I O N
Transmission Strategy Map: FY 2010-2016
Stakeholder Perspective
Internal Operations Perspective
People & Culture Perspective
Financial Perspective
ENVIRONMENTAL STEWARDSHIPLOW RATESSYSTEM
RELIABILITYREGIONAL
ACCOUNTABILITY
T.S1Policy & Regional Actions
Transmission's policies result in regional actions that ensure
adequate, efficient, environmentally responsible, and
reliable regional transmission [S1, S5, S7, S8]
T. S4Transmission Access &
RatesBPA provides open,non-discriminatory
transmission services[S4]
T.F1Capital Access
Working with Corporate Finance, Transmission’s cash liquidity &
access to capital are sufficient to meet Agency & Transmission Services vision and strategy
[F1, F3]
T.F2Cost Recovery
Transmission consistently recovers its costs over
time and meets expense and revenue targets
[F2]
T.I5Technology Innovation
BPA solves business challenges and
enables breakthroughs using a program of disciplined research
and technology innovation that is recognized to deliver high value to
the region[I5]
T.I4Asset Management
BPA maximizes the long-termvalue of FCRPS power and transmission assets through
integrated asset management practices
[I4]
T.I3Governance & Internal ControlsBPA’s governance and internal controls are robust, balanced
and adhered to across the organization
[I3]
T.I1Systems & Processes
BPA meets the demands of business operations efficiently
and effectively through standardized, continuously-
improved systems and processes
[I1]
T.S2FCRPS Operations & Expansion
Operation and expansion of FCRPS
power and transmission facilities meet availability and reliability
standards in the most regionally cost-effective manner
[S2, S8]
T.S6 Renewable Energy
BPA actively enables renewable resource integration
and development through cost-effective, innovative
Solutions[S6]
T.I7Risk-Informed Decision Making &
TransparencyTransmission’s processes, decision
making and performance support One BPA and are transparent, risk-informed and
based on structured analysis[I2,I7]
T.I6Collaboration
BPA strengthens collaborative relationships internally and externally to
support achievement of objectives[i6]
T.P1Performance
Leaders set clear expectationsand all individuals accept accountability and
are recognized for quality performance[P1]
T.P2Talent & Development
BPA’s workforce is highly skilled and talented to achieve
agency objectives[P2]
T.P3Engagement
BPA has a highly engaged workforce
[P3]
T.P4T.P4Work EnvironmentWork Environment
BPA has a safe and positive work environment
[P4]
T.S9 Stakeholder Satisfaction Customer, constituent and tribal satisfaction
with BPA is high[S9]

2010 Integrated Program Review 5
B O N N E V I L L E P O W E R A D M I N I S T R A T I O N
$0
$100
$200
$300
$400
$500
$600
$700
$800
Capital Project Spending $330 $332 $222 $186 $248 $228 $377 $619 $552 $687 $747 $707 $539 $463 $586
FY03 FY04 FY05 FY06 FY07 FY08 FY09 FY10 FY11 FY12 FY13 FY14 FY15 FY16 FY17
$ in Millions
Transmission Capital1 : FY2003 - FY2017
Internal resource capacity
FY03–09 = Actuals
FY10= SOY Budget
FY11-17= IPR
1Proposed Capital Levels (FY10-17) do not include lapse factor.

2010 Integrated Program Review 6
B O N N E V I L L E P O W E R A D M I N I S T R A T I O N
1
Transmission Capital includes a 15% lapse factor.
Transmission Proposed Capital Spending Levels1
Transmission Capital by Program 2009 Actuals 2010 SOY
2011 TR-10 Rate Case 2011 IPR 2012 IPR 2013 IPR 2014 IPR 2015 IPR 2016 IPR 2017 IPR
Main Grid 58,152,911 128,073,598 189,938,700 110,011,000 213,390,800 270,144,700 255,011,100 138,247,400 86,879,000 189,404,200 Area & Customer Service 11,452,179 37,103,360 6,255,900 6,025,300 11,324,900 9,470,100 10,749,200 16,156,700 17,130,600 28,295,400 System Replacements 115,722,167 137,146,004 138,423,175 131,671,687 157,248,543 169,430,778 188,319,480 172,039,290 160,873,183 159,372,689 Upgrades & Additions 56,899,513 103,321,871 112,584,640 103,562,730 137,432,400 122,839,000 81,191,300 51,937,700 45,280,300 46,965,100
Environment Capital 3,369,545 5,530,189 5,752,088 5,752,088 5,868,854 5,983,884 6,101,169 6,320,000 6,446,000 6,575,300 PFIA 36,784,922 106,605,296 102,286,449 86,792,200 44,431,800 43,714,500 29,693,600 22,309,700 22,649,500 22,986,700
Total Direct Capital 282,381,237 517,780,318 555,240,952 443,815,005 569,697,297 621,582,962 571,065,849 407,010,791 339,258,583 453,599,389
Capital Indirects 74,631,576 80,412,502 81,052,210 83,437,257 86,053,465 87,540,257 88,872,135 90,530,781 92,624,746 94,250,895 Transmission AFUDC 19,676,227 21,300,000 22,467,500 24,624,000 31,157,000 38,075,000 46,890,000 41,400,000 31,521,000 37,771,000
Total Indirect Capital 94,307,803 101,712,502 103,519,710 108,061,257 117,210,465 125,615,257 135,762,135 131,930,781 124,145,746 132,021,895
Total Capital Program 376,689,040 619,492,820 658,760,662 551,876,262 686,907,762 747,198,219 706,827,984 538,941,572 463,404,329 585,621,284
Transmission Lapse Factor - (105,117,600) (109,902,416) (81,678,935) (102,158,664) (111,179,733) (105,101,698) (79,896,236) (68,543,149) (86,853,193)
Total Capital with Lapse Factor 376,689,040 514,375,220 548,858,246 470,197,327 584,749,098 636,018,486 601,726,286 459,045,336 394,861,180 498,768,091

2010 Integrated Program Review 7
B O N N E V I L L E P O W E R A D M I N I S T R A T I O N
($ in Millions)
Main Grid$241.77, 40%
Environment$5.93, 1%
Customer Financed/Credits/
PFIA/Radio Spectrum $44.07, 7%
System Replacements $163.34, 27%
Upgrades and Additions
$130.14, 22%
Area & Customer Service
$10.40, 2%
Total FY12-FY13 Average = $596M* includes Corporate Facilities Capital
* includes Corporate Security Enhancement and IT Capital
Average Direct Transmission Capital Expenditures1: FY2012- FY2013
1Proposed Capital Levels do not include lapse factor.

B O N N E V I L L E P O W E R A D M I N I S T R A T I O N
82010 Integrated Program Review
ASSET MANAGEMENT
2010 Integrated Program Review 9
B O N N E V I L L E P O W E R A D M I N I S T R A T I O N
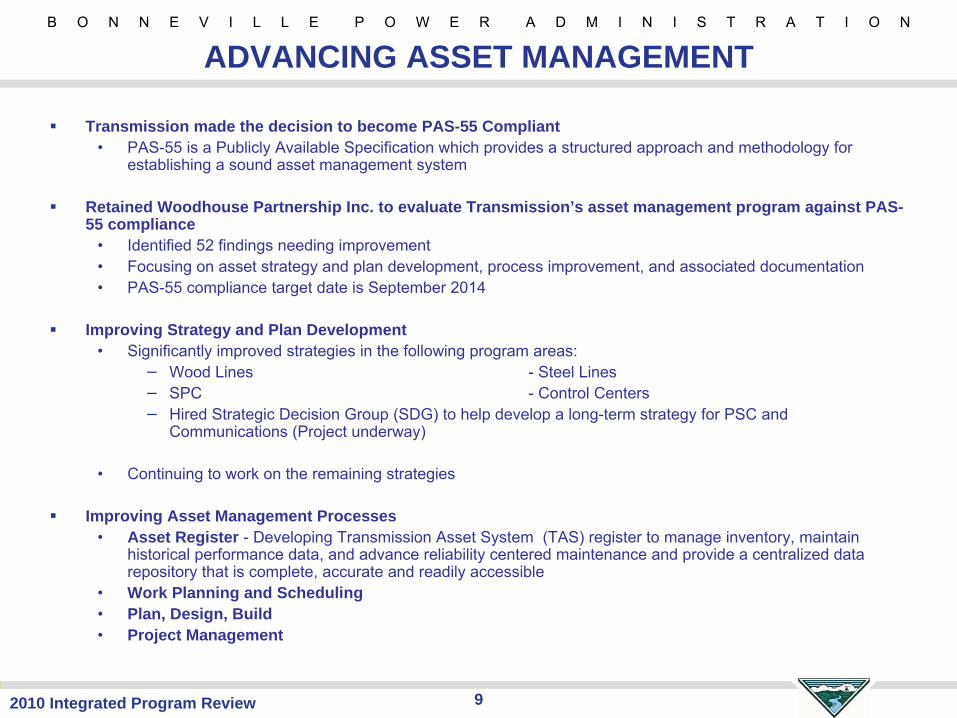
ADVANCING ASSET MANAGEMENT
Transmission made the decision to become PAS-55 Compliant•
PAS-55 is a Publicly Available Specification which provides a structured approach and methodology for establishing a sound asset management system
Retained Woodhouse Partnership Inc. to evaluate Transmission’s asset management program against PAS-55 compliance
•
Identified 52 findings needing improvement•
Focusing on asset strategy and plan development, process improvement, and associated documentation•
PAS-55 compliance target date is September 2014
Improving Strategy and Plan Development•
Significantly improved strategies in the following program areas:−
Wood Lines
-
Steel Lines−
SPC
-
Control Centers−
Hired Strategic Decision Group (SDG) to help develop a long-term strategy for PSC and Communications (Project underway)
•
Continuing to work on the remaining strategies
Improving Asset Management Processes•
Asset Register -
Developing Transmission Asset System (TAS) register to manage inventory, maintain historical performance data, and advance reliability centered maintenance and provide a centralized data repository that is complete, accurate and readily accessible
•
Work Planning and Scheduling•
Plan, Design, Build•
Project Management

2010 Integrated Program Review 10
B O N N E V I L L E P O W E R A D M I N I S T R A T I O N
Advancing Asset ManagementRe-organizing to centralize Transmission’s asset management program under Planning and Asset Management (in line with industry best practice)
Established Program Manager positions in the following asset management program areas:•
Sustain−
Wood Lines
-
Steel Lines−
System Protection & Controls (SPC)
-
Power System Controls (PSC)−
Control Centers
-
Substations -
AC−
Substations –
DC
-
TEAP (Fleet and Tools and Equipment)−
Rights of Ways (Access Roads, Land Acquisition, and Veg. Management)•
Expansion−
Main Grid
-
Communications−
Area and Customer Service, including Projects Funded In Advance (PFIA)
Established a Contract Management Office

2010 Integrated Program Review 11
B O N N E V I L L E P O W E R A D M I N I S T R A T I O N

2010 Integrated Program Review 12
B O N N E V I L L E P O W E R A D M I N I S T R A T I O N
Transmission Long-Term Goals
ExpandLoad service obligations and customer service requests meet standards and tariff requirements
An integrated regional expansion planning process is implemented
A robust grid that effectively and efficiently integrates diverse energy resources
Inter-regional transfer capacity meets reliability standards and commercial needs
Fuller, more optimal use is made of existing transmission capacity through technological, policy and process change
SustainInformation on asset attributes (condition, performance, costs) is complete, accurate, and readily accessible
Assets are proactively maintained and replaced• Maintenance, replacements and sparing integrated• Priority given to critical assets at greatest risk• Reliability and other standards met at
least life-cycle cost
Maintenance is reliability-centered (condition-based)
Long-term GoalsFor managing transmission assets
Improving PracticesAsset management practices conform with leading practices
Expansion, replacement, and maintenance are integrated, prioritized in terms of asset criticality and risk, and directed at meeting reliability and other standards at least life cycle cost
Asset management plans deliver on the strategy, and projects are completed on time, within scope and on budget
VisionStrategic Objectives

2010 Integrated Program Review 13
B O N N E V I L L E P O W E R A D M I N I S T R A T I O N
Asset Management Strategy DevelopmentStrategies are designed to:
•
Convert the agency’s mission, vision, and strategic objectives into long-term investment and maintenance strategies
•
Seek to:−
Ensure the critical assets operate reliably, meet availability requirements and provide adequate capacity into the future
−
Ensure long-term asset costs will be prudent and economic
•
Designed to answer these questions:−
What objectives should be set for asset performance?−
How are these assets performing today?−
What are the risks to meeting the objectives?−
What should investment and maintenance strategies be to meet the
objectives?−
What are the anticipated costs?
Improved planning levels for capital investment and maintenance
Developing detailed asset management plans spanning 10 years•
Establishing asset performance objectives•
Priority to most critical assets at greatest risk

2010 Integrated Program Review 14
B O N N E V I L L E P O W E R A D M I N I S T R A T I O N
Sustain Strategies

2010 Integrated Program Review 15
B O N N E V I L L E P O W E R A D M I N I S T R A T I O N
Transmission Net PlantBPA Transmission System
Access Roads , 85, 2%
Airplane, 15, 0%
Celilo , 179, 5%Control Center , 71, 2%
Facilities , 214, 6%
Land Rights , 121, 3%Land , 24, 1%
Other, 11, 0%PSC, 176, 5%
SPC, 248, 7%
Steel, 1047, 28%
Substation, 1219, 34%
TEAP, 41, 1%Wood, 230, 6%
Classifications are based on asset management's sustaining portfolios. PeopleSoft financials does not track assets with regard to these portfolios.
Proration of accumulated depreciation for each sustaining portfolio was based on the FERC investment by location & profile ID over the total FERC investment. Critical decisions should not be based on this allocation as the group depreciation method does not allow for the concept of a true Net Book Value.Total Net Book Value is $ 3,681
Net Plant by Asset Program(Gross investment less accumulated
depreciation) As of September 30, 2009
($ Millions, % of Total)

2010 Integrated Program Review 16
B O N N E V I L L E P O W E R A D M I N I S T R A T I O N
Transmission Capital – System ReplacementsProgram Description
Replacement of high-risk, obsolete and maintenance-intensive facilities and equipment to reduce the chance of equipment failure affecting the safety and reliability of the transmission system. Replacements are based on transmission asset management strategy and plans, findings and recommendations. This program also includes the Transmission capital dollars associated with the plan, design and construction of new facilities, replacement of existing facilities; hazardous materials abatement; and demolition of buildings no longer useful to BPA.
Strategic Objectives- S2 –
FCRPS Operations and Expansion, S9 –
Stakeholder Satisfaction, I4 –
Asset Management , 17 –
Risk-Informed Decision Making and Transparency
Key Products and OutputsKeep the existing transmission assets operating in accordance with safety, reliability and security requirementsImprove asset health and therefore maintain and/or improve system performanceFacilities Asset Management key products and output include plan, design, and build new facilities as required by BPA business activities, hazmat abatement, and asset decommissioning.

2010 Integrated Program Review 17
B O N N E V I L L E P O W E R A D M I N I S T R A T I O N
Transmission Capital – System Replacements
Capital - System Replacements2009
Actuals 2010 SOY2011 TR-10 Rate Case 2011 IPR 2012 IPR 2013 IPR
TOOLS & WORK EQUIPMENT - - 7,000,000 - - - LINES - STEEL HARDWARE REPLCMT 10,872,669 19,918,776 - 16,091,300 20,551,800 12,772,300 LINES - WOOD POLE LN REBUILDS 13,838,339 19,397,648 - 42,296,900 41,537,100 43,447,800 MISC FACILITIES- NON-ELECTRIC 1,109,875 22,750,000 - 11,679,287 17,818,743 18,737,478 MISC. REPLACEMENT PROJECTS 5,782,238 16,666,155 114,058,381 - - - PSC - FIN/OP NETWORKS - 300,000 - 185,100 235,500 240,200 PSC - SCADA/TELEMTRY/SUP CNTRL 372,788 782,000 - 3,605,300 4,618,800 4,909,200 PSC - TELEPHONE SYSTEMS 30,299 945,000 - 625,800 540,600 305,700 PSC - TLECOM TRANSPORT 1,394,959 1,484,000 - 1,514,500 1,156,000 1,179,000 PSC - TRANSFER TRIP 556 6,069,000 - 8,413,700 5,137,900 6,113,300 PSC- TELECOM SUPPORT EQUIPMENT 925,821 1,060,301 - 1,809,000 1,250,200 1,414,800 SPC - DFRS 1,015,572 2,977,800 - 3,510,600 251,500 - SPC - METERING 898 372,225 - 262,900 535,200 545,800 SPC - RELAYS 1,370,149 4,457,804 - 2,835,400 10,410,800 22,313,400 SPC - SER 802,110 744,450 - 1,407,200 3,341,800 3,235,700 SUB CAPACITORS - 921,000 - 724,600 - - SUB CIRCUIT BREAKER REPLACMENT 8,137,351 11,123,820 - 10,054,400 20,213,500 21,985,000 SUB CVT/PT/CT REPLACEMENT 534,338 1,165,004 - 1,490,300 1,523,200 1,504,300 SUB DC 12,672,539 5,814,141 - 1,304,100 5,309,200 7,052,100 SUB LOW VOLTAGE AUX. 2,502,121 2,913,762 - 4,802,100 5,651,700 5,075,100 SUB NON-ELECTRIC PLANT 671,419 563,914 - 485,900 750,400 691,000 SUB TRANSFORMERS & REACTORS 31,924,553 3,709,021 - 5,351,100 5,710,600 5,900,400 TEAP - EQUIPMENT 16,792,383 12,060,000 - 12,170,500 9,633,600 10,916,500 TEAP - TOOLS 1,114,906 950,183 - 1,051,700 1,070,400 1,091,700 TL SPACER DAMPER REPLACEMENT - - 10,852,996 - - - TL WOOD POLE REPLACEMENTS - - 6,511,798 - - -
Total 115,722,167 137,146,004 138,423,175 131,671,687 157,248,543 169,430,778
1
1
Due to changes to the data structure historical spending is not
available at the same level of detail. 2
Dollars reported are direct dollars
2

2010 Integrated Program Review 18
B O N N E V I L L E P O W E R A D M I N I S T R A T I O N
FY 2014-2017 Drivers of Proposed Spending ForecastSame drivers as identified for FY 2012-2013Increased spending in circuit breakers and switchgear, capacitors FY14, and relays FY14-FY17 consistent with asset strategies
Transmission Capital – System Replacements
Capital - System Replacements 2013 IPR 2014 IPR 2015 IPR 2016 IPR 2017 IPRTOOLS & WORK EQUIPMENT - - - - - LINES - STEEL HARDWARE REPLCMT 12,772,300 13,032,800 13,288,900 13,542,400 13,794,000 LINES - WOOD POLE LN REBUILDS 43,447,800 41,660,300 42,138,200 40,164,200 43,032,600 MISC FACILITIES- NON-ELECTRIC 18,737,478 27,316,180 22,530,390 20,232,483 20,390,189 MISC. REPLACEMENT PROJECTS - - 0 - - PSC - FIN/OP NETWORKS 240,200 245,100 374,800 382,000 389,100 PSC - SCADA/TELEMTRY/SUP CNTRL 4,909,200 5,844,700 5,959,500 6,941,400 7,070,300 PSC - TELEPHONE SYSTEMS 305,700 345,300 408,900 416,700 424,400 PSC - TLECOM TRANSPORT 1,179,000 1,203,000 1,635,600 1,666,800 1,697,700 PSC - TRANSFER TRIP 6,113,300 6,683,500 6,814,800 6,944,800 7,073,900 PSC- TELECOM SUPPORT EQUIPMENT 1,414,800 1,755,500 1,790,000 1,939,900 1,976,000 SPC - DFRS - - - - - SPC - METERING 545,800 557,000 567,900 578,700 589,500 SPC - RELAYS 22,313,400 31,387,800 32,004,600 32,615,200 25,733,500 SPC - SER 3,235,700 3,301,600 3,366,500 3,430,700 3,494,500 SUB CAPACITORS - - - - - SUB CIRCUIT BREAKER REPLACMENT 21,985,000 19,200,200 14,630,300 9,109,300 9,137,100 SUB CVT/PT/CT REPLACEMENT 1,504,300 1,258,700 1,249,400 1,273,200 1,385,300 SUB DC 7,052,100 13,077,300 2,271,600 - - SUB LOW VOLTAGE AUX. 5,075,100 2,283,500 3,373,300 2,826,500 3,259,900 SUB NON-ELECTRIC PLANT 691,000 931,200 539,500 - - SUB TRANSFORMERS & REACTORS 5,900,400 5,982,800 5,465,500 4,919,200 5,187,500 TEAP - EQUIPMENT 10,916,500 11,139,100 12,493,800 12,732,200 13,558,200 TEAP - TOOLS 1,091,700 1,113,900 1,135,800 1,157,500 1,179,000 TL SPACER DAMPER REPLACEMENT - - - - - TL WOOD POLE REPLACEMENTS - - - - -
Total 169,430,778 188,319,480 172,039,290 160,873,183 159,372,689 2
Dollars reported are direct dollars
2

2010 Integrated Program Review 19
B O N N E V I L L E P O W E R A D M I N I S T R A T I O N
FY 2012-13 Program Spending DriversWood Pole Line Rebuilds Steel Hardware Replacements Various Substation Replacements (circuit breakers, switchgear, CVT/PT/CT, low voltage, transformers & reactors, capacitors, non-electric plant) Power System Control (PSC) (VHF, telecom transport, SCADA/telemetry/sup control, FIN/OP networks, transfer trip, telephone systems) System Protection and Control (SPC) (relays, RAS, metering, DFR, SER, Tools and equipment) Misc. Facilities
Potential RiskCapital funding, identified in the previous IPR process for FY12-13, is not adequate to support required replacements as identified by the updated FY10 asset management strategies and plans. Failure to fund programs as identified will result in further degradation of system performance and health. Delays to construction could also increase overall construction costs due to inflation of materials and labor rates.
Transmission Capital – System Replacements

B O N N E V I L L E P O W E R A D M I N I S T R A T I O N
202010 Integrated Program Review
WOOD LINES

2010 Integrated Program Review 21
B O N N E V I L L E P O W E R A D M I N I S T R A T I O N
Assets within program – Wood LinesApproximately 5,000 miles of low voltage transmission lines with predominately wood poles
•
75,000 wood poles•
Over 500,000 insulators•
Oldest lines on BPA system
Line assets include the following:•
Poles, conductor, insulators•
Cross arms•
Guys•
Hardware, connectors•
Counterpoise and switches
Types of poles, conductor and insulators:•
Poles: cedar, douglas-fir, larch, various treatment types•
Conductor: ACC, ASCR, ACC/TW, ASCR/TW, Copper and specials•
Insulators: porcelain, glass, and composite
Program does not include:•
access roads•
vegetation management•
right-of-ways or fiber optic cable
Includes hardware to attach fiber optic cables

2010 Integrated Program Review 22
B O N N E V I L L E P O W E R A D M I N I S T R A T I O N
Asset objectives – Wood Lines (1 of 2)Reliability objective
Frequency of unplanned outages•
Performance objective: Minimize the number of unplanned transmission line outages on the most critical wood pole transmission lines (categories 1 through 4, 1 being most critical).
•
Measure: System Average Interruption Frequency Index (SAIFI) –
average number of automatic outages by BPA Line Category
•
End-stage Target: Control Chart violation per year:−
No more than 1 control chart violation per year for Wood Pole Transmission classified lines (typically line importance categories 3 and 4).
Duration of unplanned outages•
Performance objective: Minimize the duration of unplanned transmission line outages on the most critical wood pole transmission lines (categories 1 through 4, 1 being most critical).
•
Measure: System Average Interruption Duration Index (SAIDI) –
average number of automatic outage minutes by BPA Line Category
•
End-stage Target: Control Chart violation per year:−
No more than 1 control chart violation per year for wood pole transmission classified lines (typically line importance categories 3 and 4).
For both SAIFI and SAIDI, a control chart violation is defined as follows:−
Latest fiscal year above the Upper Control Limit (short-term degradation)−
2 of last 3 fiscal years above the Upper Warning Limit (mid-term degradation)−
Continuous worsening trend in the last six fiscal years (long-term degradation)
Availability objective•
Performance Objective: Optimize availability of service from BPA’s transmission lines.•
Measure: Line availability percentage (includes planned outages)•
End-stage Target:−
BPA’s most important transmission lines (Category 1 and 2) are available for service at least 98.0 percent of the time.
−
BPA’s next most important transmission lines (Category 3 and 4, and generally primarily wood pole structure type) are available for service at least (XX) percent of the time.

2010 Integrated Program Review 23
B O N N E V I L L E P O W E R A D M I N I S T R A T I O N
Asset objectives – Wood Lines (2 of 2)Adequacy objective
•
Performance Objective: Provide adequate transmission capacity to serve future customer load growth.
•
Measures: Forecasted peak load on transmission line segments.•
End-Stage Targets: Mitigate risk of overload transmission lines (category 3 and 4) to a less than 1 in 20 chance.
•
Key driver: Agency 20 year load forecasts
Compliance objective•
Performance objective: Maintain and inspect wood pole transmission lines in accordance with NERC/WECC requirements.
•
Measures: Transmission Maintenance & Inspection Plan (TMIP) is reviewed and revised annually; Wood pole lines are maintained in accordance with the TMIP; Maintenance records are maintained as required by the TMIP
•
End-Stage Targets: BPA wood pole line
maintenance & inspection practices comply with NERC/WECC standard PRC-STD-005-1
Safety objective•
No public safety event or injuries.•
No BPA or contracted employee fatalities or injuries.

2010 Integrated Program Review 24
B O N N E V I L L E P O W E R A D M I N I S T R A T I O N
Asset assessment – Wood Lines
Over 2,000 miles of Wood Pole Transmission lines or 40% are over 50 years old (aging asset problem)
Expected life of wood pole transmission line is approximately 60 years on average
Overall performance of these lines is currently acceptable but at increasing risk of unacceptable performance as these lines continue to age
Over 20,000 wood poles (out of a total of 75,000) are currently classified for priority replacement due to condition and/or age
Over 500 miles of transmission lines currently have obsolete copper conductor that is difficult to repair and replace after a conductor failure
Oldest lines typically have the original hardware, insulators, guying and counterpoise in place and condition of these assets in many cases is unknown
Constraints limit the level of line maintenance and construction activity each year due to availability of planned outages and environmental issues
Over past decade wood pole program focus has been on replacing poles >60 years of age and not addressing other components such as guys, hardware and insulators
Program needs to ramp up to address possible future bow wave of line rebuild work and reduce risk of future decline in system reliability
2010 Integrated Program Review 25
B O N N E V I L L E P O W E R A D M I N I S T R A T I O N
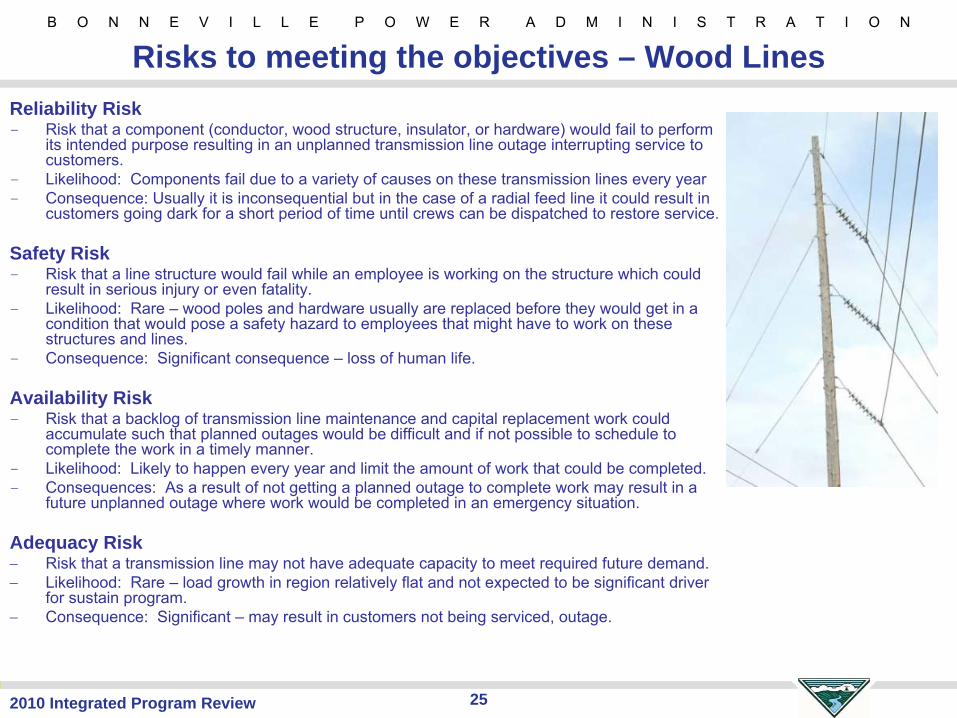
Risks to meeting the objectives – Wood LinesReliability Risk- Risk that a component (conductor, wood structure, insulator, or hardware) would fail to perform
its intended purpose resulting in an unplanned transmission line
outage interrupting service to customers.
- Likelihood: Components fail due to a variety of causes on these
transmission lines every year- Consequence: Usually it is inconsequential but in the case of a radial feed line it could result in
customers going dark for a short period of time until crews can be dispatched to restore service.
Safety Risk- Risk that a line structure would fail while an employee is working on the structure which could
result in serious injury or even fatality. - Likelihood: Rare –
wood poles and hardware usually are replaced before they would get in a condition that would pose a safety hazard to employees that might have to work on these structures and lines.
- Consequence: Significant consequence –
loss of human life.
Availability Risk- Risk that a backlog of transmission line maintenance and capital
replacement work could accumulate such that planned outages would be difficult and if not possible to schedule to complete the work in a timely manner.
- Likelihood: Likely to happen every year and limit the amount of
work that could be completed.- Consequences: As a result of not getting a planned outage to complete work may result in a
future unplanned outage where work would be completed in an emergency situation.
Adequacy Risk−
Risk that a transmission line may not have adequate capacity to meet required future demand.−
Likelihood: Rare –
load growth in region relatively flat and not expected to be significant driver for sustain program.
−
Consequence: Significant –
may result in customers not being serviced, outage.
2010 Integrated Program Review 26
B O N N E V I L L E P O W E R A D M I N I S T R A T I O N
Asset strategy – Wood Lines
Systematic replacement of aging line assets. Asset replacement program evolves from a wood pole condition-centric program to a comprehensive approach that considers health of all line components, line performance (actual and anticipated) and criticality.
•
Worst Performing Circuits. When overall condition and performance of lines deteriorate to
the point that it poses an unacceptable risk to meeting asset objectives, then these lines are targeted for future replacement. Transmission lines will be prioritized for replacement based on condition, performance and line importance and criticality.
•
Obsolete components will be replaced. Opportunities to replace obsolete components with standard components in conjunction with other scheduled work and replacement opportunities will be considered. For example, copper conductor
no longer manufactured and difficult to repair and find spare parts.
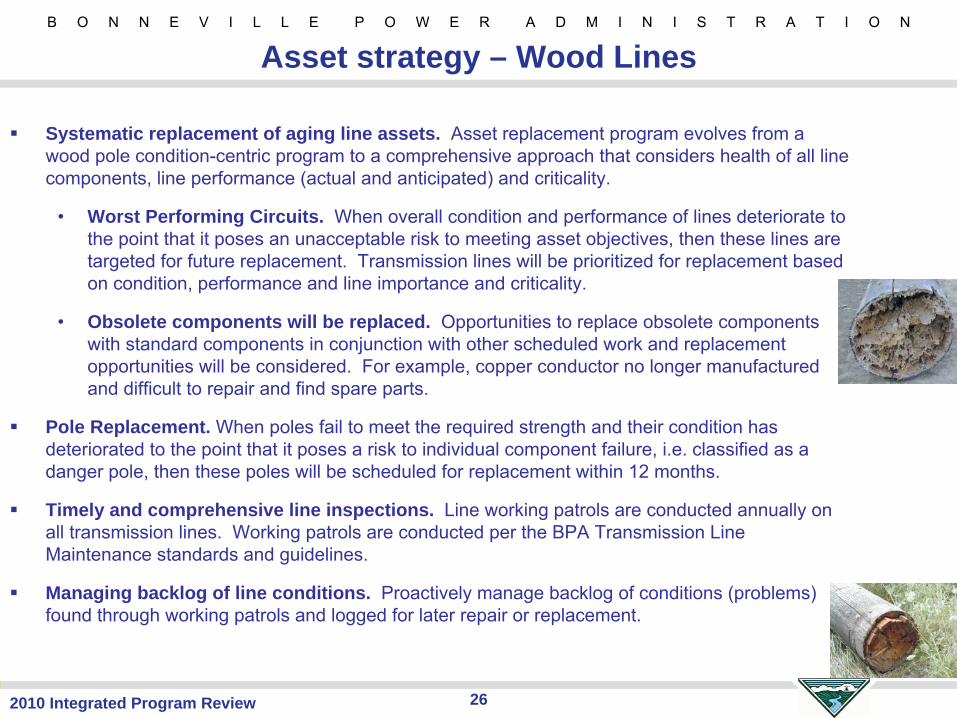
Pole Replacement. When poles fail to meet the required strength and their condition has deteriorated to the point that it poses a risk to individual component failure, i.e. classified as a danger pole, then these poles will be scheduled for replacement within 12 months.
Timely and comprehensive line inspections. Line working patrols are conducted annually on all transmission lines. Working patrols are conducted per the BPA Transmission Line Maintenance standards and guidelines.
Managing backlog of line conditions. Proactively manage backlog of conditions (problems) found through working patrols and logged for later repair or replacement.

2010 Integrated Program Review 27
B O N N E V I L L E P O W E R A D M I N I S T R A T I O N
Asset strategy – Wood Lines
Transmission line rebuild execution strategy:•
Standardization of replacement components. Standardization of structures, conductor and insulators when rebuilding. Components stock items and quicker to restore service in the event of an unplanned outage.
•
Utilize Owner/Engineers. Design work, for existing line rebuilds will be contracted to Owners/ Engineers when the workload for design exceeds what can be done with BPA design resources.
•
Contract rebuilds. With the exception of small rebuild jobs, most of this work will be performed by contractors.
Identify additional asset health data needs and develop a process to collect, store and analyze the data.
•
Develop short-term plan that fills the asset health data gaps on specific line
components where data is lacking. Assess retired component health.
•
Develop a long-term plan for collecting asset condition assessment data for all
line components•
TAS is an important part of these plans
Fiber optic cable replacement and maintenance. In conjunction with partial and major line rebuild projects, fiber optic cable, if present, will be evaluated and assessed for replacement.
2010 Integrated Program Review 28
B O N N E V I L L E P O W E R A D M I N I S T R A T I O N
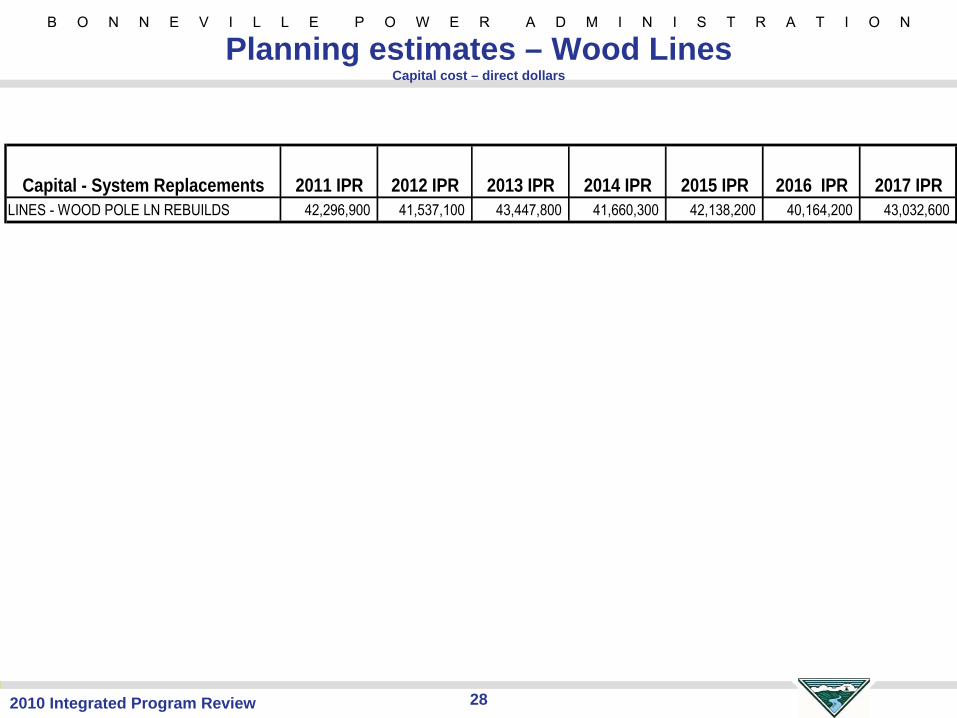
Planning estimates – Wood Lines Capital cost – direct dollars
Capital - System Replacements 2011 IPR 2012 IPR 2013 IPR 2014 IPR 2015 IPR 2016 IPR 2017 IPRLINES - WOOD POLE LN REBUILDS 42,296,900 41,537,100 43,447,800 41,660,300 42,138,200 40,164,200 43,032,600

B O N N E V I L L E P O W E R A D M I N I S T R A T I O N
292010 Integrated Program Review
STEEL LINES

2010 Integrated Program Review 30
B O N N E V I L L E P O W E R A D M I N I S T R A T I O N
Assets within program – Steel Lines
BPA’s steel transmission lines consists of about 10,800 circuit miles on approximately 43,200 steel lattice towers, steel lattice poles and engineered steel poles. This includes the DC intertie (~260 circuit miles), all of the 500 kV grid (~4500 circuit miles including the AC interties) along with about 80 percent of the 230-
345 kV system (~5200 circuit miles) and about 13 percent of the 115 kV system (~900 circuit miles.)
Assets consist of:- Lattice towers- Lattice poles- Engineered steel poles- Footings: concrete pier, rock, grillage, plate, pile- Guying systems: guy anchors, rods, guy strands, guy insulators- Conductor: AAC, AACTW, ACSR, ACSRTW, copper, specials - Conductor insulators assemblies and associated hardware: insulator string (ceramic, glass, NCI),
suspension shoes, armor rod, vibration dampers, jumpers and jumper attachment hardware, shunts
- Spacers and spacer dampers- Ground wire and associated hardware- Fiber optic cables and associated hardware (maintenance currently managed by Transmission
Line Maintenance- Airway warning: lighting, marker balls
Asset systems consist of:- Network critical transmission lines- Interties- Key points of interconnection with many of our load serving wholesale full and partial
requirements customers

2010 Integrated Program Review 31
B O N N E V I L L E P O W E R A D M I N I S T R A T I O N
Asset objectives – Steel LinesReliability Objective
Performance Objective: Reduce or avoid unplanned outages on BPA’s most important steel transmission lines (category 1 and 2) due to equipment condition or age related failures.Measures: Outage frequency (SAIFI) and duration (SAIDI) due to equipment condition or age related failureEnd-stage Targets: Maintain SAIDI and SAIFI at or below historic averages:
−
Zero Control Chart Violations for SAIDI and SAIFI for category 1
& 2 lines−
No more than one control chart violation per year for line categories 3 & 4
Availability Objective•
Performance Objective: Ensure BPA’s steel transmission lines meet availability targets.•
Measures: Duration of planned outages for maintenance•
End-stage Target: BPA's most important transmission lines (Category
1 and 2) are available for service at least 98.0% of the time.
Safety Objective•
Performance Objective: BPA transmission lines are maintained and operated in a way that limits risk to health and safety of employees working on the lines and to the public
•
Measures: Frequency of lost-time accidents and near misses
•
End-Stage Target: Lost-time accident frequency rate ≤
1.5 per 100,000 hours worked, No fatalities occur to BPA employees or contract employees working on BPA facilities

2010 Integrated Program Review 32
B O N N E V I L L E P O W E R A D M I N I S T R A T I O N
Asset assessment – Steel Lines
Sixty percent of our 10,800 circuit miles of steel lines are 40 years or older and many still have the original hardware in place.
Theoretical life expectancy of the most critical active components is 40 years.
In the 5 year period between 2005 through 2009, we experienced 37outages in excess of 240 minutes that were likely due to material failure.
The advanced age of components is assumed to increase their likelihood of failure during severe weather.
We are experiencing material failures that indicate that active components (connectors, insulators, dampers, spacers, airway warnings) have a finite lifespan and are approaching that limit; reliability and availability of the operating line will decrease as a result.
Failing components could result in extended line outages and possibly a multiple line outage if a span crossing over other lines fails.
We need to be proactive in addressing these aging assets and avoid putting ourselves in a reactive mode with regard to material failure on our transmission lines.
Maintenance costs to repair or replace failing components in a piece meal fashion will be less cost effective than a proactive whole line component replacement approach.

2010 Integrated Program Review 33
B O N N E V I L L E P O W E R A D M I N I S T R A T I O N
Risks to meeting the objectives – Steel LinesReliability Risk–
Components which are approaching or have reached their end-of-life begin to fail and continue to fail in increasing numbers, resulting in an increased likelihood of unplanned outages.
–
Likelihood: Very likely. Line components that experience mechanical load cycles have a finite lifespan; eventual failure is inevitable, even more so for those components considered to be a
high risk of failure.–
Consequence: Significant•
Reliability of the operating line will decrease•
SAIFI and SAIDI end-stage targets will increasingly not be met•
Failing components could result in extended line outages•
Maintenance costs to repair or replace failing components in a piece meal fashion will be less cost effective than a proactive whole line component replacement approach
•
Station equipment will experience increased duty with increasing
automatic outages •
Staff will be diverted from implementing planned program work
Availability Risk–
The anticipated increase of replacement work will lead to an increasing frequency of planned outages resulting in decreased transmission line availability.
–
Likelihood: Likely. Line components that experience mechanical load cycles have a finite life expectancy; eventual failure is inevitable and without a systematic approach to preemptive replacement, the failure rate will likely be unmanageable from a maintenance perspective.
–
Consequence: Significant•
Maintenance backlog will increase to an unsustainable level.•
Maintenance costs to repair or replace failing components in a piece meal fashion will be less cost effective than a proactive whole line component replacement approach.
•
Availability of the operating line will decrease overtime, until
enough hardware has been replaced to move the line out of a high maintenance category.
Safety–
Age-related deterioration of line components results in component failure during maintenance activities, storm events, etc, leading to injury or death.
–
Likelihood: Low. Depending on the failure mechanism, it may be
difficult for field personnel to readily identify materials, like insulators, that have severely deteriorated strength capacity.
–
Consequence: Significant –
Potential injury or loss of human life

2010 Integrated Program Review 34
B O N N E V I L L E P O W E R A D M I N I S T R A T I O N
Asset strategy – Steel LinesInsulator Assemblies and Associated Hardware (planned to start 2011) Capital
Replace the entire insulator assembly and associated hardware, shunt deadends and jumper connections. Background: Unlike the spacer damper replacement program where
there were obvious physical indicators of components having reached the end of their service
life, the condition of the insulator assemblies and associated hardware is not always obvious and can
be difficult to ascertain by field observation alone. An on-going strategy for testing retired components will give us the data necessary to appropriately target and pace the program.
Phase One •
Replace the full insulator assembly and any associated hardware on discrete line sections.•
Shunt compression fittings at deadends •
Based on age of asset, field observation of condition, weather exposure, frequency of material caused outages, line criticality and outage availability, a group of line sections is targeted for the first three years of the program, this list will evolve as new information becomes available.
•
Determine construction resources available and skill enhancement
necessary to address hard to take out lines, which are often our most critical.
•
Replacement assemblies will have been reviewed and revised as necessary to meet our current policy to standardize hardware components when ever possible.
•
As insulator assemblies and associated hardware are replaced, a statistically significant sampling of the retired population must be evaluated to determine actual component condition, help refine service life predictions and identify predictors of urgency.
•
These evaluations will give us the data necessary to determine the pace at which this effort should move forward over the long term.
•
TAS implementation is critical to the sustain programs

2010 Integrated Program Review 35
B O N N E V I L L E P O W E R A D M I N I S T R A T I O N
Asset strategy – Steel LinesInsulator Assemblies and Associated Hardware (continued)
Phase Two (on-going:)•
Reevaluate the strategy for insulator assembly and associated hardware replacement for the next multi-year program period based on retired component analysis and other phase one program lessons learned.
•
Structure the next three to five year program according to urgency and critical indicators uncovered in phase one.
•
Continue to refine condition data collection efforts to best meet asset management needs
Airway Marking (currently underway) Expense•
Program started in 2004•
Theoretical lifespan is 10 years for the fixture and 2-4 years for the flashtube.•
Region expense budgets may allow between two and six towers per year (between $5K and $60K)•
Program cost to date is about $3 million•
Replacements prioritized based on criticality, condition and maintenance frequency and complexity•
Standardizing around low maintenance, self-contained fixtures•
Replace marker balls in conjunction with spacer replacement when
possible•
Program tracking is currently done by the PM on a locally maintained list, TAS will be taking over this function eventually.
Steel Tower Components (strategy development to begin 2011) Expense/Capital- A steel transmission tower has a theoretical lifespan of 100 years, and footings up to 80 years.- Underground components may have corrosion issues that shorten this lifespan- Points of interface between the tower and the insulator string may experience accelerated wear.- Develop a systematic way to assess, document and track over time
the condition of these passive components and their more vulnerable subparts. The expectation is that TAS will provide the means for collecting, storing and tracking this information.

2010 Integrated Program Review 36
B O N N E V I L L E P O W E R A D M I N I S T R A T I O N
Asset strategy – Steel Lines
Developing and Implementing assessment strategies for all transmission line components.•
Working with our utility partners to share information, the entire industry is facing this issue•
Developing and validating testing and assessment methods•
Determining what parameters should be documented by TLM in TAS•
Determining condition thresholds that will guide program schedule.•
Component testing, assessment and tracking
Other replacement and maintenance activities•
Tower steel repair•
Footing repair and protection•
Guying repair or replacement•
Conductor splice reinforcement –
shunting•
Premature spacer replacement due to material quality issues
Capital - System Replacements 2011 IPR 2012 IPR 2013 IPR 2014 IPR 2015 IPR 2016 IPR 2017 IPRLINES - STEEL HARDWARE REPLCMT 16,091,300 20,551,800 12,772,300 13,032,800 13,288,900 13,542,400 13,794,000
2
Dollars reported are direct dollars
2

B O N N E V I L L E P O W E R A D M I N I S T R A T I O N
372010 Integrated Program Review
POWER SYSTEM CONTROL (PSC) AND COMMUNICATIONS
2010 Integrated Program Review 38
B O N N E V I L L E P O W E R A D M I N I S T R A T I O N
Assets within program – PSC/CommunicationsApproximately 3,000 miles of fiber optic cable (predominately overhead)
•
Predominately ADSS with some OPGW•
External customers on leased dark fiber•
Oldest fiber installed in 1995Analog/Digital Telecom backbone
•
Analog system at the end of its life. No longer supported by manufacturer•
SONET based with 106+ optical nodes•
Over 4,000 circuits on backbone•
Covers entire BPA service area•
Used for Operational purposesMobile Radio System
•
65 repeater sites, over 1,000 handheld/mobile units •
Based on analog system and not supported by manufacturers•
Used for Operational purposesOMET (Optical Ethernet)
•
New transport providing Ethernet connectivity for SMART GridControl and data functions enabling power system reliability:
•
Transfer Trip/RAS•
SCADA•
Telemetering•
Supervisory Control
Auxiliary systems supporting people, safety, and control systems:•
AC/DC Systems•
Telephone systems•
PA, Annunciator, audible warning systems•
GPS, Fault Locator•
Amplifiers, signal distribution
2010 Integrated Program Review 39
B O N N E V I L L E P O W E R A D M I N I S T R A T I O N
Asset objectives – PSC/Communications
Reliability Objective•
Performance objective: Minimize the number and frequency of unplanned communications or control outages that impact power system operation.
•
Frequency of unplanned outages –
Outage frequency does not impede power system operations•
Duration of unplanned outages –
Outage lengths do not result in de-rating of transmission facilities•
Misoperations
–
potential sources of misoperations
are managed to minimize risk of a major event
Availability Objective•
Performance objective: Optimize availability of service from BPA’s communications and control systems.
•
Measure: WECC availability criteria for critical circuits•
End-stage Target: BPA’s communication and control systems support power system reliability
Safety Objective•
Performance objective: The lost-time accident frequency rate is ≤
1.5 incidents per 100,000 hours worked. No fatalities occur to BPA employees or contract employees working on BPA facilities
•
Measures: Lost-time accident frequency rate and near misses•
End-Stage Target: Set agency-wide at less than or equal to 1.5 accident per 100,000 hours worked.
•
Reliable voice communications is available to work crews

2010 Integrated Program Review 40
B O N N E V I L L E P O W E R A D M I N I S T R A T I O N
Asset assessment – PSC/CommunicationsApproximately 22% of communications and control systems are over 20 years old (aging asset problem.)
Expected life is 7 – 12 years averaging across all equipment types.
Competing priorities in the last several years has resulted in a huge replacement backlog.
Overall performance of these assets is degrading leading to an exponentially increasing risk of reliability concerns and major event risks triggered by aging equipment.
The analog microwave system has reached end of life with no manufacturer support. Large quantities of analog terminal equipment do not operate reliably on digital communications, resulting in system reliability, major event, and security risks triggered by misoperations.
False trips have occurred due to incompatibility issues between analog and digital.
Sections of fiber cable system have limited capacity remaining and no longer supported by manufacturer.
Constraints limit the level of maintenance and construction activity each year due to availability of resources and planned outages.
Resource constraints with the continued expansion of the communication system for support of generation integration.
Acquiring and maintaining adequate levels of funding, FTE resources, skills and materials to achieve a long-term sustainable replacement program focused on supporting power system reliability.
2010 Integrated Program Review 41
B O N N E V I L L E P O W E R A D M I N I S T R A T I O N
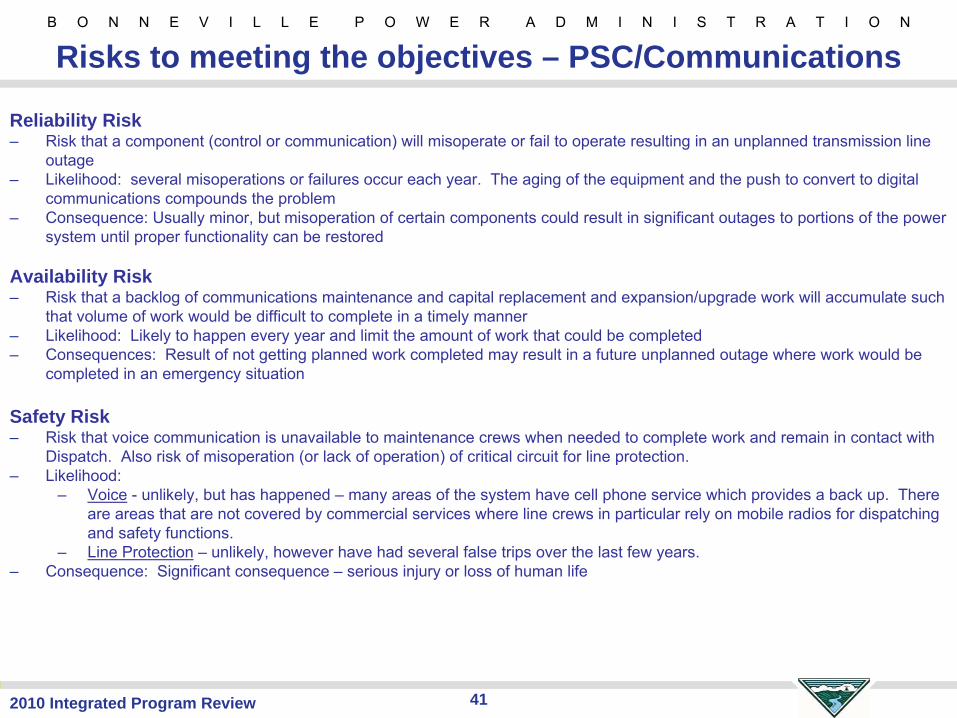
Risks to meeting the objectives – PSC/Communications
Reliability Risk–
Risk that a component (control or communication) will misoperate
or fail to operate resulting in an unplanned transmission line outage
–
Likelihood: several misoperations
or failures occur each year. The aging of the equipment and the push to convert to digital communications compounds the problem
–
Consequence: Usually minor, but misoperation
of certain components could result in significant outages to portions of the power system until proper functionality can be restored
Availability Risk–
Risk that a backlog of communications maintenance and capital replacement and expansion/upgrade work will accumulate such that volume of work would be difficult to complete in a timely manner
–
Likelihood: Likely to happen every year and limit the amount of
work that could be completed–
Consequences: Result of not getting planned work completed may result in a future unplanned outage where work would be completed in an emergency situation
Safety Risk –
Risk that voice communication is unavailable to maintenance crews when needed to complete work and remain in contact with Dispatch. Also risk of misoperation
(or lack of operation) of critical circuit for line protection.–
Likelihood: –
Voice
-
unlikely, but has happened –
many areas of the system have cell phone service which provides
a back up. There are areas that are not covered by commercial services where line
crews in particular rely on mobile radios for dispatching and safety functions.
–
Line Protection
–
unlikely, however have had several false trips over the last few years.–
Consequence: Significant consequence –
serious injury or loss of human life

2010 Integrated Program Review 42
B O N N E V I L L E P O W E R A D M I N I S T R A T I O N
Asset strategy – PSC/CommunicationsSystematic Replacement of aging communications and control assets. Asset replacement program evolves from a “do what you can” program to a comprehensive approach that considers health and performance of all system components to maximize value of replacement work to power system reliability (actual and anticipated)
•
Worst Performing Components. Focus replacement efforts on transitioning most critical functions from analog to digital terminal equipment on digital communications
•
Obsolete components will be replaced. Opportunities to replace obsolete components with current standard components in conjunction with other scheduled work and
replacement opportunities will be considered. For example, coordinating with relay and protection
projects
Managing backlog. Proactively manage backlog of conditions to minimize impacts to power system reliability
Communications replacement execution strategy•
Standardization of replacement components. Standardizes components and systems to the extent possible. Improves interoperability of components and minimizes
spares and training costs. Components stock items and quicker to restore
•
Utilize Contract resources for Plan/Design/Build process. Volume of work to reduce replacement backlog exceeds BPA internal staffing resources in all areas of the Plan/Design/Build process. Significant contract resources will be required to meet the expected workload
Indentify Asset Health data needs and develop process to collect the data. Identify data needs and develop a process for collecting asset condition assessment data communications and control system components
•
Intermediate plan that supports the Transmission Asset System effort and fills in data gaps needed for replacement planning
•
Long-term plan for establishing and maintaining consistent data upkeep practices

2010 Integrated Program Review 43
B O N N E V I L L E P O W E R A D M I N I S T R A T I O N
Asset Strategy – PSC/CommunicationsAsset Strategy Development Process for Telecommunications Upgrades/Additions and PSC Replacement
•
A project is currently underway to develop a comprehensive Asset
Strategy for Telecommunications/PSC to address the backlog of replacements and growth needs of the system.
−
Telecom Planning Lead and PSC Sustain Program Manager are working with Agency Asset Management and consultant to evaluate the current program and develop alternatives to meet the challenges of the additions and replacement needs
−
Develop a comprehensive model of the variables impacting the strategy decision
−
Evaluate the alternatives
−
Select the strategy that best balances power system reliability,
communications and control system needs and ability to execute the strategy
−
The end goal is a strategy with long-term momentum for funding, FTE resources, skills, materials and project management that supports power system reliability and is positioned for future system needs

2010 Integrated Program Review 44
B O N N E V I L L E P O W E R A D M I N I S T R A T I O N
Planning estimates – PSC and Communications Capital cost – direct dollars
Capital - System Replacements 2011 IPR 2012 IPR 2013 IPR 2014 IPR 2015 IPR 2016 IPR 2017 IPRPSC - FIN/OP NETWORKS 185,100 235,500 240,200 245,100 374,800 382,000 389,100 PSC - SCADA/TELEMTRY/SUP CNTRL 3,605,300 4,618,800 4,909,200 5,844,700 5,959,500 6,941,400 7,070,300 PSC - TELEPHONE SYSTEMS 625,800 540,600 305,700 345,300 408,900 416,700 424,400 PSC - TLECOM TRANSPORT 1,514,500 1,156,000 1,179,000 1,203,000 1,635,600 1,666,800 1,697,700 PSC - TRANSFER TRIP 8,413,700 5,137,900 6,113,300 6,683,500 6,814,800 6,944,800 7,073,900 PSC- TELECOM SUPPORT EQUIPMENT 1,809,000 1,250,200 1,414,800 1,755,500 1,790,000 1,939,900 1,976,000 TOTAL PSC 16,153,400 12,939,000 14,162,200 16,077,100 16,983,600 18,291,600 18,631,400
PSC Sustain Planning Estimates
Communications Upgrades and Additions Planning Estimates
Capital - Upgrades & Additions 2011 IPR 2012 IPR 2013 IPR 2014 IPR 2015 IPR 2016 IPR 2017 IPRFIBER OPTICS AND TERMINALS 21,560,200 39,001,300 35,260,400 32,126,500 16,014,800 5,208,600 6,248,600

B O N N E V I L L E P O W E R A D M I N I S T R A T I O N
452010 Integrated Program Review
SYSTEM PROTECTION AND CONTROL (SPC)

2010 Integrated Program Review 46
B O N N E V I L L E P O W E R A D M I N I S T R A T I O N
Assets within program - SPCProtective relays: provide protection for all power system components including transmission lines, substation busses, transformers, etc. from 12.5kV to 500kV
•
1315 electro-mechanical and electronic (non-micro processor) relay terminals•
1674 digital (micro processor) relay terminals•
Remedial action schemes (RAS) are special protection schemes included in this category; RAS equipment within the SPC program consists of input/output (I/O) relays for line loss logic and generation and load dropping, power rate relays, and logic controllers
Sequential event recorders (SER): gathers and time stamps discrete data on substation equipment status
•
140 SER units in BPA’s more critical substations•
Provides real time and historical data locally and remotely to the control centers via SCADA
Digital fault recorders (DFR): monitors power system equipment voltage and current waveforms and records this data during disturbances
•
105 DFR units in BPA’s more critical substations•
Provides historical data for disturbance analysis and troubleshooting
Meters:•
Approximately 1600 revenue and interchange meters are in operation at BPA and customer owned facilities•
Data from revenue meters is used by BPA’s billing organization to account for power entering and leaving
the BPA power system
•
Interchange meters measure power entering or leaving the BPA balancing authority area•
Some revenue meters and all interchange meters provide data for automatic generation control (AGC)
Control and indication: •
Control equipment includes auto sectionalizing, dead bus clearing, auto synchronizing schemes and synchronous control units (SCU)
•
Indicating equipment includes phasor measurement units (PMU), panel meters, control consoles, transformer temperature monitors, recording voltmeters, battery voltmeters, battery ground monitors, SCADA transducers and relay communication processors
2010 Integrated Program Review 47
B O N N E V I L L E P O W E R A D M I N I S T R A T I O N
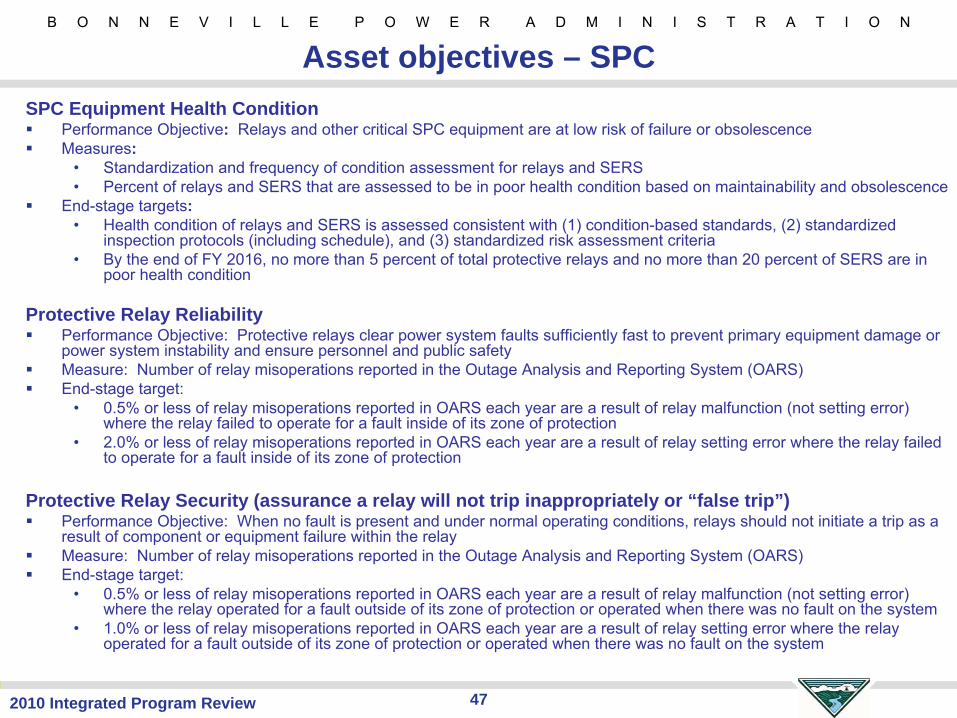
Asset objectives – SPCSPC Equipment Health Condition
Performance Objective: Relays and other critical SPC equipment are at low risk of failure or obsolescenceMeasures:
•
Standardization and frequency of condition assessment for relays
and SERS•
Percent of relays and SERS that are assessed to be in poor health condition based on maintainability and obsolescenceEnd-stage targets:
•
Health condition of relays and SERS is assessed consistent with (1) condition-based standards, (2) standardized inspection protocols (including schedule), and (3) standardized risk assessment criteria
•
By the end of FY 2016, no more than 5 percent of total protective relays and no more than 20 percent of SERS are in poor health condition
Protective Relay ReliabilityPerformance Objective: Protective relays clear power system faults sufficiently fast to prevent primary equipment damage or power system instability and ensure personnel and public safetyMeasure: Number of relay misoperations reported in the Outage Analysis and Reporting System (OARS)End-stage target:
•
0.5% or less of relay misoperations
reported in OARS each year are a result of relay malfunction (not setting error) where the relay failed to operate for a fault inside of its zone
of protection•
2.0% or less of relay misoperations
reported in OARS each year are a result of relay setting error where the relay failed to operate for a fault inside of its zone of protection
Protective Relay Security (assurance a relay will not trip inappropriately or “false trip”)Performance Objective: When no fault is present and under normal operating conditions, relays should not initiate a trip as a result of component or equipment failure within the relayMeasure: Number of relay misoperations reported in the Outage Analysis and Reporting System (OARS)End-stage target:
•
0.5% or less of relay misoperations
reported in OARS each year are a result of relay malfunction (not setting error) where the relay operated for a fault outside of its zone of protection or operated when there was no fault on the system
•
1.0% or less of relay misoperations
reported in OARS each year are a result of relay setting error where the relay operated for a fault outside of its zone of protection or operated when there was no fault on the system

2010 Integrated Program Review 48
B O N N E V I L L E P O W E R A D M I N I S T R A T I O N
Asset objectives – SPC
Sequential Events Recorder AccuracyPerformance Objective: All events that occur on monitored and in-service substation equipment are recorded and time stamped within the accuracy of the GPS clockMeasures: Number of reported loss of synchronization alarms (no system is presently in place to automatically monitor and collect instances of SER loss of sync alarms)End-stage Target: SER is synchronized with the station GPS clock to facilitate coordination of SER data with data from other time synchronized substation data recording devices
Sequential Events Recorder Availability/ReliabilityPerformance Objective: Recorded SER data is immediately available to field and control center personnel in electronic form and hardcopy format at the substation for monitoring the operation and health of the power system and to analyze or troubleshoot system problemsMeasures: Number of reported SER trouble alarms (no system is presently in place to automatically monitor and collect instances of SER trouble alarms)End-stage Target: Chronologically continuous substation event data is recorded by the SER and is immediately available for use by operations and maintenance personnel locally and remotely where access exists

2010 Integrated Program Review 49
B O N N E V I L L E P O W E R A D M I N I S T R A T I O N
Asset assessment - SPC
Lack of sufficient capital funding to replace SPC equipment in the last 15 years has resulted in a large inventory of obsolete (no manufacturer support, spare parts are not available) equipment still in operation
44% of nearly 3000 protective relay terminals are equipped with obsolete electro-mechanical or electronic relays
53% of 157 sequential event recorders are obsolete; another 27% are on the edge of obsolescence.
79% of 1600 revenue and interchange meters are 30 year old analog electronic technology that is nearly obsolete
As SPC equipment remains in operation past its life expectancy, probability of failure is increasing and the risk associated with failure grows
Expertise to maintain, troubleshoot and repair this obsolete equipment is held only by BPA personnel since manufacturer support no longer exists; most of these experts are either at or within 3 years of retirement age
The training burden for new and current SPC personnel has grown significantly as new digital equipment is added to the system without complete retirement of obsolete technologies
The increase in the capital replacement program necessary to retire the inventory of obsolete equipment will present challenges to BPA processes that will have to be overcome; the significant number of outages on critical transmission lines and substation components necessary to replace obsolete equipment may limit the rate at which replacements can be accomplished
2010 Integrated Program Review 50
B O N N E V I L L E P O W E R A D M I N I S T R A T I O N
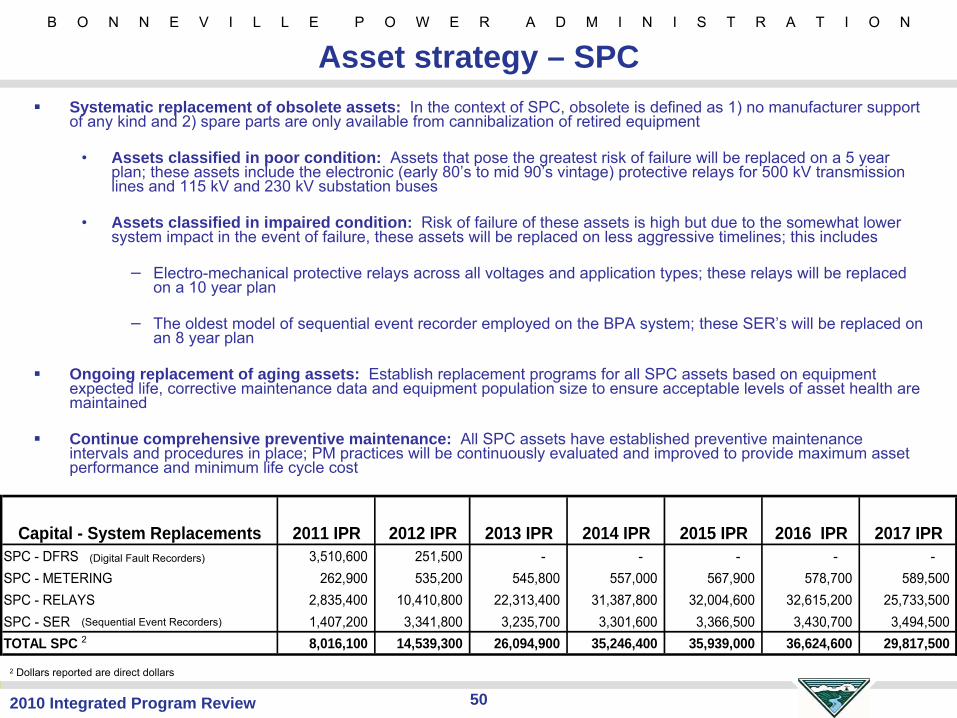
Asset strategy – SPCSystematic replacement of obsolete assets: In the context of SPC, obsolete is defined as 1) no manufacturer support of any kind and 2) spare parts are only available from cannibalization of retired equipment
•
Assets classified in poor condition: Assets that pose the greatest risk of failure will be replaced
on a 5 year plan; these assets include the electronic (early 80’s to mid 90’s vintage) protective relays for 500 kV transmission lines and 115 kV and 230 kV substation buses
•
Assets classified in impaired condition: Risk of failure of these assets is high but due to the somewhat lower system impact in the event of failure, these assets will be replaced on less aggressive timelines; this includes
−
Electro-mechanical protective relays across all voltages and application
types; these relays will be replaced on a 10 year plan
−
The oldest model of sequential event recorder employed on the BPA system; these SER’s
will be replaced on an 8 year plan
Ongoing replacement of aging assets: Establish replacement programs for all SPC assets based on equipment expected life, corrective maintenance data and equipment population size to ensure acceptable levels of asset health are maintained
Continue comprehensive preventive maintenance: All SPC assets have established preventive maintenance intervals and procedures in place; PM practices will be continuously evaluated and improved to provide maximum asset performance and minimum life cycle cost
Capital - System Replacements 2011 IPR 2012 IPR 2013 IPR 2014 IPR 2015 IPR 2016 IPR 2017 IPRSPC - DFRS 3,510,600 251,500 - - - - - SPC - METERING 262,900 535,200 545,800 557,000 567,900 578,700 589,500 SPC - RELAYS 2,835,400 10,410,800 22,313,400 31,387,800 32,004,600 32,615,200 25,733,500 SPC - SER 1,407,200 3,341,800 3,235,700 3,301,600 3,366,500 3,430,700 3,494,500 TOTAL SPC 8,016,100 14,539,300 26,094,900 35,246,400 35,939,000 36,624,600 29,817,500
(Digital Fault Recorders)
(Sequential Event Recorders)
2
Dollars reported are direct dollars
2
B O N N E V I L L E P O W E R A D M I N I S T R A T I O N
512010 Integrated Program Review
SUBSTATION -
AC

2010 Integrated Program Review 52
B O N N E V I L L E P O W E R A D M I N I S T R A T I O N
Assets within program – Substation - AC
Approximately 382 AC Substations with 60 stations operating at 500 kV. Substation facilities include the following major equipment types and quantities in service (qty):
•
Power Transformers (586), Reactors (117), & Fuses •
Switchgear –
Breakers & Circuit Switchers (2030), & Disconnects (6705)•
Instrument Transformers (7095) & Arresters (3457)•
Capacitors (612 groups)•
Station Auxiliary –
Control Batteries (767), Station Service (1084), Generators (86), Cabling•
Substation Bus & Structures –
Substation Structures, Insulators, Bus, Seismic
Substations that interconnect multiple utilities, generators, or serve to transfer power are considered “Network Facilities” – typical voltages are 230 kV – 500 kV
Substations that serve radial utility loads are “Delivery Facilities” – delivery voltages range from 4160V up to 230 kV, the vast majority deliver power from 12.5 kV to 115 Kv
Program does not include assets that incorporate a significant portion of Power Electronic Equipment:
•
Direct current (dc) facilities•
Static Var Compensators (SVC)•
Series Capacitors

2010 Integrated Program Review 53
B O N N E V I L L E P O W E R A D M I N I S T R A T I O N
Asset objectives – Substation - AC
Reliability Objective•
Minimize the number and frequency of planned and unplanned outages (maintenance and in service failures) of substation high voltage equipment affecting
transmission availability and system capacity
•
Measure: Frequency of unplanned outages resulting in line outages –
SAIFI•
End-Stage Target: Control Chart Violations
•
Measure: Duration of unplanned outages resulting in line outages-
SAIDI•
End-Stage Target: Control Chart Violations
Availability Objective•
Optimize availability of service from BPA’s substation facilities
•
Measure: Substation equipment outages affecting Available Transmission Capacity (ATC) and Operating Transmission Capacity (OTC)
•
Measure: Substation terminal equipment outages affecting transmission line availability -
including planned and unplanned outages
Safety Objective•
The lost-time accident frequency rate is ≤
1.5 incidents per 100,000 hours worked. No fatalities occur to BPA employees or contract employees working on BPA facilities
•
Measures: Lost-time accident frequency rate and near misses•
End-Stage Target: Set agency-wide at less than or equal to 1.5 accident per 100,000 hours worked

2010 Integrated Program Review 54
B O N N E V I L L E P O W E R A D M I N I S T R A T I O N
Nearly 40% of all power transformers are over 50 years old with an average expected life span of 45 years - aging asset problem
Approximately 9% of circuit breakers are over 45 years old and 20% are over 35 years old. Expected life span of circuit breakers varies from 25 to 35 years depending on type. Major problem – lack of spare parts reduces ability to repair/extend life
Instrument transformers have an average expected life of 30 years. Approximately 13% are 45 + years and 32% are 35 + years. Inability to obtain bus outages for maintenance is a major factor and the practice of replacing only one unit when sister units should also be replaced
Station Service (SS) facilities are typically run to failure with transformers, switches, and individual battery cells being the most common items to be replaced. As such the remaining SS cables, panels, and control battery sets are often much older
Resource constraints - Additional design and construction resources are needed to reduce the backlog of needed replacements. Forced outages due to in-service failures reduce the ability to accomplish both planned maintenance and planned infrastructure improvements
Asset assessment – Substation - AC

2010 Integrated Program Review 55
B O N N E V I L L E P O W E R A D M I N I S T R A T I O N
Risks to meeting the objectives – Substation - ACReliability Risk–
High voltage (HV) equipment in-service failures pose a reliability risk in terms of forced outages due to faults caused by the equipment failure
–
Likelihood: Likely 1-2 power transformer failures every 3 years, 5-6 breaker failures per year, 10-12 Instrument transformer failures per year.–
Active monitoring of major equipment is practiced but is not feasible or financially practical for all equipment
–
Consequence: Radial service HV failures will force a customer outage –
duration varies from hours to days. Major 230 kV and 500 kV have redundancy but for any contingencies or faults on a bus forced outages will result
•
Target 1: For power transformers, reactors, and most switchgear the replacement strategy is not to exceed the current average failure rates over the next 10 years –
See slides on asset strategy for transformers and switchgear
•
Target 2: For instrument transformers and station service equipment (transformers, DC batteries, and cable) the replacement strategy is to reduce the current rate of
in-service (emergency) failures by approximately 25% over the next 10 years to improve both reliability and optimal use of resources -
see slides on asset strategy for instrument transformers
Availability Risk–
Major HV equipment failures particularly for power transformers and switchgear can reduce Available Transmission Capacity and Operating Transmission Capacity
–
Likelihood: Likely to happen every year–
Consequences: Forced curtailments or customer outages
Safety Risk–
Risk that a HV equipment failure may injure onsite workers. Risk to public is low–
Likelihood: Rare –
Industry standards are practiced and followed. Most failures occur when workers are not present
–
Consequence: Significant consequence –
loss of human life

2010 Integrated Program Review 56
B O N N E V I L L E P O W E R A D M I N I S T R A T I O N
Asset strategy – Substation - ACPlanned Replacement of High Risk Assets: Asset replacement program is driven by health, criticality and risk. Each equipment type has specific condition factors that are either periodically inspected or actively monitored. Replacements are based on historical performance and projected failures of similar models or designs
•
Reliability Risk: Substation equipment will be prioritized for replacement based
on condition, performance and impact on system reliability relative to failure
consequences
•
Spare parts: Equipment requiring parts that can no longer be obtained or remanufactured at reasonable cost will be replaced with the goal of planned replacement prior to a critical component failure. Critical parts will be salvaged from retired equipment
to extend the life of remaining sister units
•
Balancing Resources - Replace vs. Maintain: Equipment may be replaced in lieu of continued maintenance when the cost of materials/parts, labor, and time out of service (reliability exposure) do not provide a significant life extension, typically 5 years for switchgear
Resource Strategy•
Contract for Owner-Engineer services for groups of switchgear replacements and battery replacements that are similar in design and materials. Will help reduce the backlog of replacements –
better manage the peak cycles in design and construction work
•
Utilize master agreements with equipment vendors for optimum pricing and delivery for all types of HV equipment. New strategic sourcing programs have resulted in master agreements for power transformers and insulators, shaving both cost and delivery time
over individually competed equipment. Strategic sourcing for power circuit breakers is underway

2010 Integrated Program Review 57
B O N N E V I L L E P O W E R A D M I N I S T R A T I O N
Planning estimates – Substation – AC Capital Cost – direct dollars
CAPITAL - SYSTEM REPLACEMENTS 2011 IPR 2012 IPR 2013 IPR 2014 IPR 2015 IPR 2016 IPR 2017 IPRSUB CAPACITORS 724,600 - - - - - - SUB CIRCUIT BREAKER REPLACMENT 10,054,400 20,213,500 21,985,000 19,200,200 14,630,300 9,109,300 9,137,100 SUB CVT/PT/CT REPLACEMENT 1,490,300 1,523,200 1,504,300 1,258,700 1,249,400 1,273,200 1,385,300 SUB LOW VOLTAGE AUX. 4,802,100 5,651,700 5,075,100 2,283,500 3,373,300 2,826,500 3,259,900 SUB NON-ELECTRIC PLANT 485,900 750,400 691,000 931,200 539,500 - - SUB TRANSFORMERS & REACTORS 5,351,100 5,710,600 5,900,400 5,982,800 5,465,500 4,919,200 5,187,500 TOTAL SUB AC 22,908,400 33,849,400 35,155,800 29,656,400 25,258,000 18,128,200 18,969,800

B O N N E V I L L E P O W E R A D M I N I S T R A T I O N
582010 Integrated Program Review
SUBSTATION -
DC

2010 Integrated Program Review 59
B O N N E V I L L E P O W E R A D M I N I S T R A T I O N
Assets within program – Substation - DCCelilo HVDC Converter Station (HVDC)
•
+/-
500 kVDC Bi-Pole rated at 3100A per pole. Overall rating 3100 MW. •
Original installed in 1970 as +/-
400 kVDC, 1800 A bi-pole with 1 converter per pole and 3 series groups per converter
•
In 1984 a 100 kV group was added in series per pole and an increase in current raised the rating to +/-
500 kVDC, 2000 A•
In 1988 a 500 kVDC, 1100 A converter was added in parallel per pole to increase to the present rating
•
These increases over the years have resulted in several vintages
of controls and equipment that have to work together rendering a very complicated station to operate and maintain to adequate levels
Static VAR Compensators (FACTS)•
Keeler SVC, rated +350/-300 MVARS at 230 kV -
installed 1992 to support Portland area network voltage
•
Maple Valley SVC, rated +350/-300 MVARS at 230 kV -
installed 1992 to support Seattle area network voltage
•
Rogue SVC, rated +50/-45 MVAR at 115 kV –
under construction
Series Capacitor Banks (FACTS)•
11 -
500 kV Series Capacitor banks for the California Oregon Intertie (COI) transmission
•
10 -
500 kV Series Capacitor banks to support AC transmission from eastern MT to Puget Sound area
•
1 –
500 kV Thyristor Controlled Series Capacitor (TCSC) bank initially built as an EPRI research project now supports transmission flow west of McNary
2010 Integrated Program Review 60
B O N N E V I L L E P O W E R A D M I N I S T R A T I O N
Asset objectives – Substation - DC
Reliability ObjectivePerformance objective: Reduce or avoid unplanned outages on BPA’s most important
transmission linesMeasure: Outage frequency (SAIFI) and duration (SAIDI) due to equipment age related failure, do not exceed control chart violation limits by line importanceEnd-stage Target: Maintain SAIDI and SAIFI at or below historic averages for transmission lines.
-
Zero Control Chart Violations for SAIDI and SAIFI
Availability ObjectivePerformance objective: Optimize availability of service from BPA’s HVDC and FACTS facilitiesMeasure: Substation equipment outages affecting Available Transmission Capacity (ATC) and Operating Transmission Capacity (OTC) End-Stage Target: Substation terminal equipment outages affecting transmission line availability -including planned and unplanned outages
Safety ObjectivePerformance objective: The lost-time accident frequency rate is ≤ 1.5 incidents per 100,000 hours worked. No fatalities occur to BPA employees or contract employees working on BPA facilitiesMeasures: Lost-time accident frequency rate and near missesEnd-Stage Target: Set agency-wide at less than or equal to 1.5 accident per 100,000 hours worked

2010 Integrated Program Review 61
B O N N E V I L L E P O W E R A D M I N I S T R A T I O N
Celilo HVDC Terminal was originally constructed 40 years ago. Since that time the station has been expanded and modified over the years resulting in a mixture of technology vintages which is becoming increasingly difficult to operate and maintain. Both the HVDC controls and the main circuit equipment are in very poor condition due to age and complexity. Much of the station equipment is no longer supported by the manufacturer, and the converter station is kept operational though a dwindling supply of spare parts
The control systems for the SVC’s at Keeler and Maple Valley are no longer supported by the manufacturer and spares are difficult to obtain. Both stations have experienced control malfunctions that are difficult to diagnose and fix. The main circuit equipment is generally in very good condition
Nine of eleven 500 kV Series Capacitors on the COI have control systems that are no longer supported by the manufacturer and some spare parts are no longer available. All banks from that vintage have been experiencing various degrees of control malfunction. The main circuit equipment is generally in very good condition
The TCSC at Slatt needs to be kept in service another 10 years, until other network enhancements are made. A project is currently underway to upgrade various systems and obtain additional specialized spare parts
Asset assessment – Substation - DC

2010 Integrated Program Review 62
B O N N E V I L L E P O W E R A D M I N I S T R A T I O N
Risks if objectives are not met – Substation - DCReliability Risk –
HVDC and FACTS equipment failures pose a reliability risk in terms of forced outages due to equipment failure.
–
Likelihood: HVDC Equipment -
Very likely. Statistically overall PDCI reliability is degraded by the Celilo terminal performance more than Sylmar or the DC transmission line. Very high chance that long outages will occur in the next few years
–
Consequence: Loss of the PDCI during spring run-off will cause BPA to miss opportunities for surplus power sales and can also restricts flow on the COI
–
Likelihood: FACTS equipment –
Somewhat likely. SVC systems and older series capacitor systems have a reasonable chance of causing unplanned outages
–
Consequence: Loss of 230 kV SVC’s will result in higher potential for voltage collapse for certain system conditions
Availability Risk –
HVDC and FACTS equipment failures can reduce Available Transmission Capacity and Operating Transmission Capacity.
–
Likelihood: HVDC equipment –
Very likely to happen every year, FACTS Equipment –
somewhat likely to happen every year–
Consequences: Forced curtailments on major transmission paths
Safety Risk–
Risk that a HVDC or FACTS equipment failure may injure onsite workers.–
Likelihood: HVDC equipment –
Higher than any other point on the transmission system. Several violent failures in the last 8-10 years. FACTS Equipment –
rare –
Consequence: Significant consequence –
loss of human life

2010 Integrated Program Review 63
B O N N E V I L L E P O W E R A D M I N I S T R A T I O N
CAPITAL - SYSTEM REPLACEMENTS 2011 IPR 2012 IPR 2013 IPR 2014 IPR 2015 IPR 2016 IPR 2017 IPRSUB DC Series - 3rd AC Tie Control Replacement 1,304,100 5,309,200 5,414,600 1,381,200 - - Static VAR Compensator (SVC) 1,637,500 11,696,100 2,271,600 TOTAL SUBS DC 1,304,100 5,309,200 7,052,100 13,077,300 2,271,600 - -
Asset strategy – Substation - DCHVDC Equipment - Celilo. An asset strategy is being developed for the Celilo terminal. Engineering studies have resulted in two best options:
•
Refurbishment of the terminal –
Retain the 4 converter main circuit architecture and replace equipment in a programmatic fashion over several years to maintain reliability and availability
•
Up-rate of the terminal –
If the PDCI southern partners agree, a 600 MW increase of the PDCI rating is achievable for ~25% over the cost of refurbishment. This would result in added
revenue possibility as well as a completely new terminal in a simplified 2 converter architecture
FACTS Equipment – SVC’s. Both SVC’s (Keeler & Maple Valley) are the same age and were built by the same vendor. The main circuit equipment (transformers, valves, reactors and filters) is in very good shape and could last another 20 years if properly maintained. Strategy is to replace the control and protection system only. Rogue SVC is under construction
FACTS Equipment – Fixed Series Capacitor (FSC) Banks. The 9 series capacitor banks for the COI are all the same age and were built by the same vendor. The main circuit equipment is in excellent condition and could last another 20 years. The strategy is to replace the control systems with new redundant digital controls. The remaining FSC banks are relatively new and with regular maintenance could reach design life. Control replacement would be considered in 15 years
FACTS Equipment – Thyristor Controlled Series Capacitor (TCSC) Banks. Planning has determined that the TCSC needs to be maintained another 10 years before retirement until other system reinforcements are made. A project is underway to accomplish this task and should be finished by the end of FY10
2
Dollars reported are direct dollars
2
Capital - Upgrades & Additions 2011 IPR 2012 IPR 2013 IPR 2014 IPR 2015 IPR 2016 IPR 2017 IPRCELILO UPGRADES PROJECT 11,568,900 47,327,300 43,120,400 7,362,000 - - - 2

B O N N E V I L L E P O W E R A D M I N I S T R A T I O N
642010 Integrated Program Review
CONTROL CENTERS
2010 Integrated Program Review 65
B O N N E V I L L E P O W E R A D M I N I S T R A T I O N
Assets within program – Control Centers
Approximately 50 systems that either directly control the Transmission system, or that support real-time decisions.
All NERC CIP Critical Cyber Assets (13 identified CCA’s) run in parallel at both Dittmer and Munro Control Centers (DCC and MCC).
The remaining ~37 systems are all supported at the DCC, and all but a few are supported at MCC. As systems are replaced, upgraded, or expanded, any systems not yet at MCC are planned to include MCC implementation
CC systems are managed within a strict Electronic Security Perimeter, and are subject to extensive NERC mandatory reliability requirements (this includes all cyber assets, not just CCA’s).
CC system asset subcomponents include: hardware, operating systems, multi-layered applications, network and other devices.
The CC Asset Program does not include BPA’s IT network or related systems, Commercial Business systems (CBS), and other business systems that do not directly support Transmission real-time operations.
The CC contains the controlling and monitoring masters for all field remotes. Terminating ends of all communication systems and all digital and analog communications equipment in the CC budgeted and managed via the PSC Program, in coordination with the Transmission Operations’Control Center Hardware Design PSC staff that manage and implement them.

2010 Integrated Program Review 66
B O N N E V I L L E P O W E R A D M I N I S T R A T I O N
Asset objectives – Control Centers
Reliability & Compliance objectivePerformance objective: Replacement or maintenance actions result in no assets assessed as Critical Risk Level of failure, obsolescence, or noncompliance.Measure: Asset condition standards and Health Assessments incorporate sufficient requirements for assets to be NERC CIP and FISMA compliant.End-stage Targets: No assets are assessed as “Poor” Health, and “Critical” or “High” Impact, reaching a combined “Critical” Risk Level rating.
Availability objectivePerformance objective: Critical systems meet their respective availability targets.Measure: Annual average of scheduled and unscheduled outages of any one instance/site or component of the system
•
Run to failure is not an option for CC assets –
the redundant operation standards of the control centers ensures that even if one site (or component) of a system fails, there is
automatic fail-over and/or site jurisdictional transfer to maintain service.
•
While one system automatically takes over in the event of an outage, this metric refers to the outage of that specific site system, and does not refer to time with no service (i.e., it’s not acceptable for SCADA service to be unavailable for more than a few min.)
•
Scheduled outages include system updates/upgrades, new deployments and various annual testing activities, etc.End-stage targets (Targets currently met)
−
SCADA: Available 99.95% per FY −
AGC: Available 99.975% per FY
Performance objective: In addition to being redundant, NERC CIP Critical Cyber Assets are deployed in a geographically diverse manner to help ensure continuity of operations in the event of loss of a control center.End-stage target: All CCA’s are deployed at both Dittmer and Munro Control Centers - Target is currently met.
Refine Standards & Assessments objectivePerformance objective: Refine and approve condition-based standards for CC assets, and assess assets timely against these standardsEnd-Stage Target: A plan for completing this effort is adopted by end of FY11 Q3.
2010 Integrated Program Review 67
B O N N E V I L L E P O W E R A D M I N I S T R A T I O N
Asset assessment – Control CentersThe rate of technology change has been accelerating so that equipment and infrastructure life spans are significantly shorter than in the past. Yet due to the interdependencies between Control Center (CC) and field equipment installations, replacement strategies require long-term planning and execution. Many systems and technologies must be supported past their normal end-of-life to accommodate this.
There are increased cyber and physical security challenges and related documentation and reporting requirements to address external mandates (DOE, FERC, NERC, WECC, OMB)
CC infrastructure has grown (e.g. RAS, SCADA expansion, redundancy with Munro, PSST, redundant AGC, ICCP) while increasing in sophistication. Data and power system interconnections have increased over time as have needs for external coordination (WECC Net, ICCP, etc)
The power system has changed over the past 30 years. Transmission and generation margins have decreased significantly. Available capacity has significantly declined. Advanced controls and tools have been used to maximize capacity. The availability of these tools and controls is becoming more and more critical (e.g., RAS).
CC support staff numbers and institutional knowledge are being depleted by retirements. Experience with newer technology is somewhat limited. Critical roles are increasingly being filled by contract staff to support a range of old and new technologies.
Efforts are currently underway to support cross-training and improve coverage depth for systems and technology, and succession planning, but these efforts are falling behind due to competing priorities.
The recent increase in Agency expansion strategies (WIT initiatives, Smart Grid, ATC, etc.) is adding pressure towards keeping pace with desired infrastructure expansion while simultaneously maintaining existing assets
Long-term maintenance and support costs for new systems and infrastructure are not adequately assessed, planned, or allocated when the investments are approved.

2010 Integrated Program Review 68
B O N N E V I L L E P O W E R A D M I N I S T R A T I O N
Risks to meeting the objectives – Control CentersAssessment of software applications/systems and hardware health risks
Asset Health = Likelihood of failure, obsolescence, or noncompliance
•
Assets are given Health ratings that take into account all of their components and the various levels of compliance requirements for our systems
•
Likelihood of failure are indicated by instances of component failures or intermittent system outages (i.e., a hard drive fails repeatedly).
•
Likelihood of obsolescence are indicated by loss of vendor or staff support, or problems with interoperability (i.e., vendor support is discontinued for a component, or component won’t interoperate with other key components or systems).
•
Likelihood of noncompliance is indicated by technical feasibility of components or systems to comply with regulatory requirements.
•
In our Health Assessment columns, we’ve arbitrarily provided 2 columns simply to offer additional granularity in our scoring
Impact = Severity of Impact to Operations (Critical, High, Moderate, Low), loss of service
Health X Impact = Risk Level
Assessment of asset management practice risksRisks to achieving asset management goals and objectivesRisk identification/definition (23 total risks) by teamSME analysis and surveyed prioritization of top 11Selection of top 5 for improvement

2010 Integrated Program Review 69
B O N N E V I L L E P O W E R A D M I N I S T R A T I O N
Asset strategy – Control Centers
Highest priority projects will be assigned to replacing, upgrading, or maintaining those systems with a Critical Risk Level. At present, nine systems fall in this category
Projects are underway that should move these nine systems out of the Critical Risk Level. These projects and their estimated delivery expectations are:
•
Munro UPS Upgrade (FY11 delivery)•
Digital Voice Recording (FY11 delivery)•
Badger Master Replacement (early FY11 delivery)•
RODS Replacement projects (FY12 delivery)•
CCN Critical Infrastructure Service DCC and MCC
project (expense project to close network gaps for both DCC/MCC by FY11)
•
Dittmer Building Management system (project being scoped today for FY11)
In addition to these projects; maintenance, replacements, and upgrades must also be planned and executed so that systems assessed at “High” risk level ratings do not migrate to the “Critical” risk level over time.
Many of the systems now rated at “High” risk level will be migrated to Windows platforms to reduce the range of technology support, improve compliance management, and increase interoperability.
Risk assessments will be updated annually. Risk assessments will use standardized criteria for rating the likelihood and impact of system health consistent with the agency’s risk management policy.
Availability targets for other critical systems will be developed. Data collection, monitoring, and evaluation procedures will be established to support the additional targets. The first set of priority systems to have availability targets developed will be identified by FY11 Q4.

2010 Integrated Program Review 70
B O N N E V I L L E P O W E R A D M I N I S T R A T I O N
Asset strategy – Control CentersA rolling 2-3 year resource plan will be prepared to identify both sustain and expansion workload and skill requirements, allocate existing staff to greatest benefit, and anticipate where staff needs to be added, either BFTE or CFTE. The resource plan will be developed by end of FY11 Q1
Outline alternative approaches to completing identified work by FY11 Q3, to include assessing:•
Minimum requirements for expense budget that is sufficient to support current systems and maintenance activities.•
Contracting strategies for supplementing additional priorities including priority Expansion Program work.•
Alternative choices for delaying work/projects.
Standards Refinement & Assessment: A plan for completing condition-based standards refinements and assessment will be adopted by end of FY11 Q3.
•
Ensure a project is launched to complete all new assessment work
by the end of FY11 Q3. •
Standards will be prepared in consultation with PSC and SPC sustain program managers and in consultation with the Transmission Service’s Standards group.
Integrated Investment Planning: Adopt an integrated investment planning process with PSC and SPC to address related and dependent assets by FY12 Q1.
•
Incorporate the integrated assessment and planning with related PSC/SPC assets, and establish an ongoing mechanism to continue coordinated investment planning.
Asset Information Management:. Analysis project to include consideration of efficient access to useful financial information for repair vs. replace and other investment planning, project execution, maintenance/support planning and cost management, and other purposes. Project plan should be approved by FY11 Q4.
•
Analysis project will include coordination with the TAS team.•
Includes outlining and approving the project plan for identifying business and data requirements, evaluation of current systems and data, gaps identification, and proposed solution alternatives for systems and processes
2
Dollars reported are direct dollars
Capital - Upgrades & Additions 2011 IPR 2012 IPR 2013 IPR 2014 IPR 2015 IPR 2016 IPR 2017 IPRCC INFASTRUCTURE COMPONENTS 1,682,700 1,070,400 1,965,000 2,784,800 1,703,700 1,157,500 1,179,000 CC SYSTEM & APPLICATION 1,682,700 1,926,700 3,165,800 2,227,800 2,839,500 4,051,100 4,126,400 CONTROL CENTERS 3,996,500 4,495,700 2,510,800 2,784,800 3,407,400 2,893,700 2,947,400 TOTAL CONTROL CENTERS 7,361,900 7,492,800 7,641,600 7,797,400 7,950,600 8,102,300 8,252,800 2
B O N N E V I L L E P O W E R A D M I N I S T R A T I O N
712010 Integrated Program Review
TOOLS AND EQUIPMENT ACQUISITION PROGRAM (TEAP)

2010 Integrated Program Review 72
B O N N E V I L L E P O W E R A D M I N I S T R A T I O N
Assets within program – TEAP (Mobile Equipment)Comprised of all mobile assets that BPA operates. New purchases of BPA owned equipment funded with capital. All Maintenance and operations cost funded by expense. GSA leased vehicles funded by expense.
Current Fleet Inventory:•
1,198 BPA-owned vehicles including:−
Man-lifts−
Cranes−
Derricks−
Equipment Trailers −
Bobcats−
Bull Dozers−
Forklifts
•
903 GSA-leased vehicles including (Expense):−
Sedans−
SUV’s−
Pickups−
Some trailers and large trucks

2010 Integrated Program Review 73
B O N N E V I L L E P O W E R A D M I N I S T R A T I O N
Asset objectives – TEAP (Mobile Equipment)The program objectives are to ensure that BPA's fleet is as reliable, safe, adequate, and economical as possible, ensuring maximum system reliability for the transmission infrastructure. This is related specifically to:
ReliabilityEnsure BPA’s fleet of mobile equipment meets its original design & function while also meeting employee safety objectives
•
When continued maintenance and repair of equipment is no longer feasible, plans to replace the equipment are developed that consider the unique circumstances of each case.
•
Where similar equipment is used throughout the transmission system, bulk refurbishment and replacement programs are considered to achieve economies of scale.
•
Replace failing existing equipment or to replace equipment that has reached the end of its cost-based useful life.
SafetyProvide newer equipment that is safer from a technological/ergonomic aspect as well as equipment that has less chance of catastrophic failure due to equipment fatigue and parts failure.
AdequacyAs our Transmission system has been updated and our capability as a grid increased, our old antiquated equipment (20-40 years old) is having trouble keeping up. This has resulted in the use of innovative techniques by crews to make existing equipment work (at the cost of time and efficiency) as well as increased rental rates for our crews to accomplish the mission.
AvailabilityIncrease equipment availability and usefulness. If this equipment is not replaced, BPA will incur a higher out of service rate due to increased maintenance requirements associated with equipment overhauls, increased inspections, and increased parts needs and a decrease in availability of equipment.
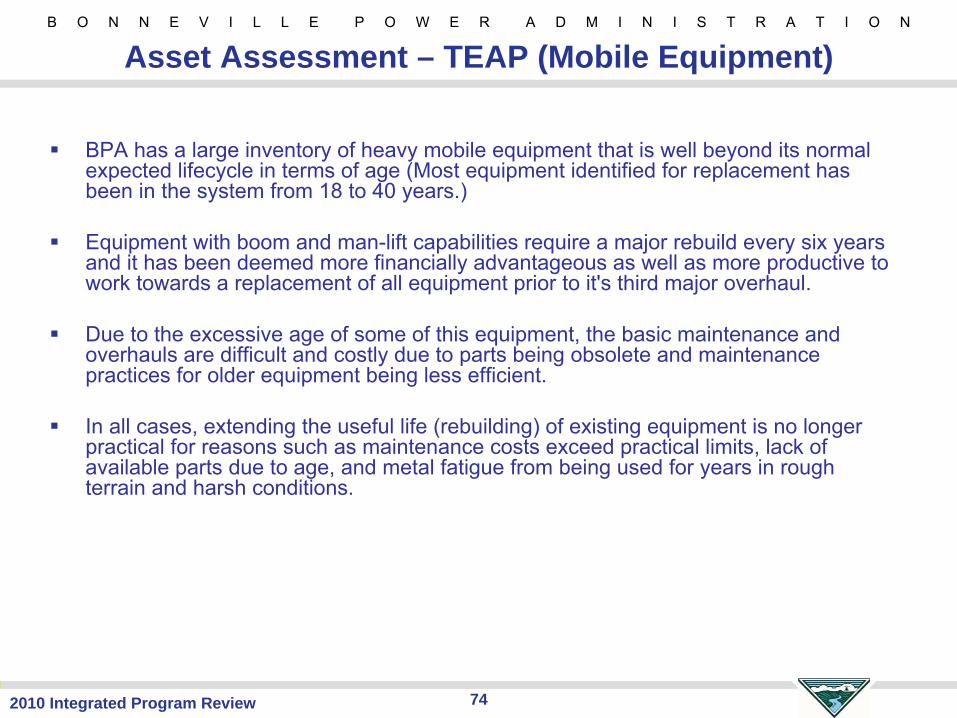
2010 Integrated Program Review 74
B O N N E V I L L E P O W E R A D M I N I S T R A T I O N
BPA has a large inventory of heavy mobile equipment that is well beyond its normal expected lifecycle in terms of age (Most equipment identified for replacement has been in the system from 18 to 40 years.)
Equipment with boom and man-lift capabilities require a major rebuild every six years and it has been deemed more financially advantageous as well as more productive to work towards a replacement of all equipment prior to it's third major overhaul.
Due to the excessive age of some of this equipment, the basic maintenance and overhauls are difficult and costly due to parts being obsolete and maintenance practices for older equipment being less efficient.
In all cases, extending the useful life (rebuilding) of existing equipment is no longer practical for reasons such as maintenance costs exceed practical limits, lack of available parts due to age, and metal fatigue from being used for years in rough terrain and harsh conditions.
Asset Assessment – TEAP (Mobile Equipment)

2010 Integrated Program Review 75
B O N N E V I L L E P O W E R A D M I N I S T R A T I O N
Risks if objectives are not met – TEAP – Mobile Equipment
FinancialBPA will see a continuing rise in costs associated with aging equipment such as increased maintenance and unique parts needed.
As the equipment continues to age, BPA will experience a continuing decrease in BPA owned equipment availability and a subsequent increase in equipment rental fees associated with daily operations. There is no available data on cost savings for owning vs. renting based on usage. Also for a significant number of items, rental is not an option due to the highly specialized nature of the equipment and the special engineering necessary to build it.
By not funding this project, BPA incurs the risk of a decrease in operational reliability, due to the decreased mechanical reliability of the equipment.
ReliabilityThis equipment has reached the end of its useful life and some requires substantial repairs. Unreliable equipment affects crew job efficiency, which affects the reliability level of the transmission system and will increase response times and outage lengths.
SafetyThe equipment identified for replacement has reached the end of its useful life and in a number of cases cannot be relied on to perform their functions efficiently or in the safest manner. This in turn significantly increases the likelihood of an on-site work environment that can quickly turn into an unsafe workplace.

2010 Integrated Program Review 76
B O N N E V I L L E P O W E R A D M I N I S T R A T I O N
Asset strategy – TEAP – Mobile Equipment
Currently under development
•
Developing lifecycle analysis
•
Fleet “Right Sizing Analysis”
•
Development of a 5+ year replacement plan (Due Spring 2011)

2010 Integrated Program Review 77
B O N N E V I L L E P O W E R A D M I N I S T R A T I O N
Tools and Equipment (TEAP)
Tools and EquipmentThe lack of a program focused on the tools, machinery and test equipment needed for the crafts to perform their work has left the agency in a deficit in this area.The SPC craft has a critical need to purchase new test equipment that will support the new generation of meters and relays.PSC crafts will start replacing test equipment that is no longer compatible with the new radio equipment that is being installed on the system.General Shops will be replacing 50 year old equipment with new, more efficient equipment that will allow production increases of up to 70% over current practices.Sub Maintenance will be purchasing new circuit breaker and transformer testing equipment.The loan pool is purchasing tools and equipment that are used throughout the BPA system. The Ross laboratory currently has an approved business plan that addresses the need to replace outdated and obsolete test equipment. The Tools and Equipment program will be the conduit for the replacement program for the needed equipment
CAPITAL - SYSTEM REPLACEMENTS 2011 IPR 2012 IPR 2013 IPR 2014 IPR 2015 IPR 2016 IPR 2017 IPRTEAP - EQUIPMENT 12,170,500 9,633,600 10,916,500 11,139,100 12,493,800 12,732,200 13,558,200 TEAP - TOOLS 1,051,700 1,070,400 1,091,700 1,113,900 1,135,800 1,157,500 1,179,000 TOTAL TEAP 13,222,200 10,704,000 12,008,200 12,253,000 13,629,600 13,889,700 14,737,200
2
Dollars reported are direct dollars
2

B O N N E V I L L E P O W E R A D M I N I S T R A T I O N
782010 Integrated Program Review
RIGHTS OF WAY (ROW)

2010 Integrated Program Review 79
B O N N E V I L L E P O W E R A D M I N I S T R A T I O N
Rights of Way are comprised of corridors of land and access roads around and leading to the transmission lines and fiber optic cables, substations, and non-electric facilities. BPA has varying levels of legal rights to the land and access roads.
Corridors:•
331 transmission lines for a total of 14,888 circuit miles of transmission line •
BPA maintains 266,589 acres of Right-of-Way1
transmission line corridors (144,102 are treatable acres2)•
~80,000 tracts of easement•
289 substations
Access Roads:•
11,500 miles of access road, including:•
Road travel way •
Trail travel way•
Bridges•
Culverts for water drainage•
Gates
Land (Capital) Assets•
Land rights for all existing facilities, perpetual easement rights, fee rights, leases, special use permits(government lands), and term easements
•
30% (80,761) of Transmission ROW acres have vegetation agreements•
22% agriculture•
53% landscaping•
17% tree (orchards and Christmas trees)•
8% individual tree agreements
1. Reference: Agency Decision Framework –
Align Vegetation Agreement Process with BPA’s New Vegetation Clearance Standard. October 15, 20082. Treatable acres estimated as all acres minus 85% of the agricultural acres
Assets within program – Rights of Way

2010 Integrated Program Review 80
B O N N E V I L L E P O W E R A D M I N I S T R A T I O N
Asset objectives – Rights of Way
Reliability ObjectivePerformance objective: Minimize the number and frequency of unplanned transmission line outages on all transmission lines Vegetation Measure: # of SAIFI/SAIDI reports of ROW fall into vegetation Access Roads Measure: Travel time to access site where outage occurred
Availability ObjectivePerformance objective: Optimize availability of service from BPA’s transmission linesVegetation Measure: Compliance with NERC and FERC standards for all sanctionable linesAccess Roads Measure: Provide vehicle access to structures on BPA’s transmission lines (Category 1 and 2) that have roads leading to them Land Rights Measure: Provide legal access to BPA’s transmission lines
Safety ObjectivePerformance objective: The lost-time accident frequency rate is minimized. No fatalities occur to BPA employees or contract employees working on BPA facilitiesMeasures: Lost-time accident frequency rate and near missesEnd-Stage Target: Set agency-wide at less than or equal to hours worked as measured by OSHA standards

2010 Integrated Program Review 81
B O N N E V I L L E P O W E R A D M I N I S T R A T I O N
Asset assessment – Rights of WayVegetation Management
•
NERC/WECC standards require that BPA improve the reliability of the electric transmission systems by preventing outages from vegetation located on transmission rights-of-way (ROW) and minimizing outages from vegetation located adjacent to ROW, maintaining clearances between transmission lines and vegetation on and along transmission ROW. BPA is currently meeting this standard.
Access Roads•
The AR system is a crucial part of the transmission system infrastructure that has been largely underfunded, ignored, and poorly maintained for decades, resulting in overall degradation to the system
•
This degradation exposes BPA to reduced reliability, safety concerns, and environmental damage•
The AR system is inadequate for most of our modern equipment; it
is critical that the system be upgraded to modern standards.
•
In order to do this upgrade, a systematic program must be developed that provides long term funding•
The access road system that is currently in place allows for traffic and patrols for maintenance•
On 10 percent of the system, roadway quality has deteriorated to
the point where the only access is by foot patrols or by using quad vehicles regardless of weather conditions
•
BPA has not prepared adequately for the 2015 Fish and Wildlife deadline to remove fish blockages occurring at undersized or incorrectly installed culverts; many landowners resolve these problems by removing culverts on permitted BPA access roads, rendering the road unusable for vehicle traffic
•
Acquisition issues need to be resolved; often planned work activities are postponed until legal access to the work site can be obtained
Land Rights•
BPA does not have legal access rights to some right of way segments (including corridors and access roads)•
BPA in some instances does not have perpetual rights to manage vegetation within the existing right of way corridors (ex. Orchard buy-back rights)
•
BPA has expiring land rights (easements) that need to be renewed
with tribal, county, and government entities

2010 Integrated Program Review 82
B O N N E V I L L E P O W E R A D M I N I S T R A T I O N
Risks to meeting the objectives – Rights of WayReliability Risk
Vegetation Management: •
Risk that vegetation grows into or falls into transmission line•
Likelihood: Vegetation continues to grow following maintenance.
Likelihood is reduced by regular maintenance cycles and patrols that identify vegetation issues.
•
Consequence: Vegetation could cause an interruption of electrical service and NERC fines
Access Roads: •
Risk that crews traveling to an outage will not be able to reach
the site in a timely manner•
Likelihood: More likely to happen in the wintertime and more likely to happen if the program continues to be underfunded
•
Consequence: The length of the outage is extended and possible safety issues
Availability RiskVegetation Management:
•
Risk that NERC and FERC clearance standards are not met•
Likelihood: Rare –
routine maintenance of vegetation on corridors combined with early issue identification of issues by patrols mitigates this risk
•
Consequences: NERC/FERC violationAccess Roads:
•
Risk that there is not adequate access to BPA’s most important transmission lines (category 1 and 2)
•
Likelihood: Very likely –
currently the maintenance program is used only for unplanned emergency repairs. The capital program is making progress in line corridors, but these corridors only represent ~25% of the system.
•
Consequences: Time to complete patrols and/or repair lines is extendedLand Rights:
•
Risk that there is not legal access to BPA’s transmission lines •
Likelihood: Very likely –
long lead time required to acquire legal rights•
Consequences: Trespass may be necessary to complete critical work; dissatisfied land owners and poor public image

2010 Integrated Program Review 83
B O N N E V I L L E P O W E R A D M I N I S T R A T I O N
Risks to meeting the objectives – Rights of Way
Safety Risk- All ROW Areas:
•
Risk that an employee would be injured or killed while performing traditional work activities
•
Likelihood: There are injuries every year. It is the goal of the program to minimize these and keep a low number of OSHA reportable incidents
•
Consequence: Significant consequence –
loss of human life or serious injury

2010 Integrated Program Review 84
B O N N E V I L L E P O W E R A D M I N I S T R A T I O N
Asset strategy – Veg. Mgmt. – Rights of Way
Cross-Organization CoordinationImproved coordination work across organizations that design, maintain, and support the Rights of Way (ROW) through re-instituting the ROW Functional Team to provide strategic and tactical direction for all ROW-related programsInstall a clarified process for TLM and NRS staff to request access roads (currently done using a “Call Letter”)
Develop and Implement Asset Management StrategiesClearly define what it means for the ROW to be an asset and provide accurate, reliable, and timely asset health reporting
•
Implement a corridor health dashboard that provides measurements
of key health attributes•
Ensure BPA staff have the understanding of the asset management philosophy and approach by using change management methodology to roll out these changes
•
Ensure the BPA staff have tool set to measure and track these assets (assumption is that Cascade will fulfill this need)
Data, Reporting, and AnalysisProvide ROW team members the ability to capture data and track all planning, contract management, response to reported vegetation, and project close-out activities within a limited number of user interfaces with data flowing smoothly between systems and databasesDevelop a Total Cost of Ownership model for the Rights of Way and apply this to future decisionsCollect accurate and reliable cost and effort data with regard to treatment type, line mile, acre, hours, trees cut, terrain type, geographic location, and contracting relationshipProvide managers with access to summary and detail information about progress on Vegetation Management Preventive and Out of Cycle Maintenance in real-time, or near real-timeAnalyze the cost and effort data to objectively identify best value approachesProvide information in a visual format that lets ROW team members quickly process complex information
Consistent Practices and Application of StandardsProvide clear descriptions of ROW vegetation and access roads standards with strong guidelines and procedures to achieve those standards, and reinforce practices that deliver consistent attainment of standards across all districts

2010 Integrated Program Review 85
B O N N E V I L L E P O W E R A D M I N I S T R A T I O N
Asset strategy – Access Roads – Rights of Way
Data, Reporting, and AnalysisImplement better functionality and more consistent practices for patrols and inspections (TLM, aerial, NRS) to capture road condition data using a standard road condition rating systemStratify inspection priorities by areas with more or less stability (i.e. those prone to land slides have more frequent field inspections – may have ad hoc inspections following severe weather conditions)Measure and track progress toward road repairs, based on priority of repairClarify criteria for bundling road repair into capital rehab projects versus repairing as maintenance expenseWhat could we do differently over the next 15-20 years to maintain current level of performance, assuming it is acceptable, and if not, improve future asset performance. Strategies to consider (there may be others) for the access road program
Asset Renewal StrategyCapital program would be a pro-active road upgrade program that would include rebuilding all roads ahead of planned line reconstruction/ BPA related activities and in support of other sustain programsFocus would be placed on roads in the mid-Cascades and the coast ranges300 miles of minor upgrades and 80 miles of major upgrades annually

2010 Integrated Program Review 86
B O N N E V I L L E P O W E R A D M I N I S T R A T I O N
Asset strategy – Land Rights – Rights of WayReview of Land Rights
Review Land rights that are due and have expiredReview rights to determine if they are still neededPrioritize identified tracts that are expiring
Review of Access RightsDetermine which roads BPA only has verbal agreements on and prioritize these over the next 5 yearsComplete estimates to obtain legal access rights for all roads that currently have only a verbal agreement
Review of Vegetation Agreements and Current RightsDetermine criticality of vegetation rights neededComplete estimate requests for vegetation perpetual rightsDevelop a logical budget and plan that is in alignment with other programs for the next 5-10 years
•
How much will these cost•
How many•
Staffing requirements
2
Dollars reported are direct dollars
2
B O N N E V I L L E P O W E R A D M I N I S T R A T I O N
872010 Integrated Program Review
UPGRADES & ADDITIONS

2010 Integrated Program Review 88
B O N N E V I L L E P O W E R A D M I N I S T R A T I O N
Transmission Capital – Upgrades & AdditionsCapital - Upgrades & Additions
2009 Actuals 2010 SOY
2011 TR-10 Rate Case 2011 IPR 2012 IPR 2013 IPR
CC INFASTRUCTURE COMPONENTS 518,236 2,312,493 - 1,682,700 1,070,400 1,965,000 CC SYSTEM & APPLICATION 1,488,809 1,630,337 - 1,682,700 1,926,700 3,165,800 CELILO UPGRADES PROJECT 397,218 6,200,000 21,488,900 11,568,900 47,327,300 43,120,400 CONTROL CENTERS (671,067) 2,541,975 - 3,996,500 4,495,700 2,510,800 FIBER OPTICS AND TERMINALS 10,106,092 12,762,000 - 21,560,200 39,001,300 35,260,400 IT PROJECTS 1,900,565 5,000,000 - 7,350,030 5,850,000 6,000,000 LAND ACQUISITION & REBUILDS 7,873,507 10,103,200 10,853,000 9,991,300 10,168,800 10,370,700 LAND RIGHTS - ACCESS ROADS 106,416 470,084 - 525,900 535,200 545,800 LAND RIGHTS - TRIBAL RENEWALS 14,780,350 25,329,994 - 3,681,000 3,746,400 - LAND RIGHTS- VEG MITIGATION - 500,000 - 525,900 535,200 545,800 LINE SWITCH UPGRADES 166,928 - - - - - MISC. UPGRADES AND ADDITIONS 23,872,465 31,870,058 75,128,800 12,681,000 11,070,400 3,091,700 SECURITY ENHANCEMENTS 2,818,258 4,601,730 5,113,940 5,000,000 5,000,000 6,000,000 SUBSTATION UPGRADES - - - 23,316,600 6,705,000 10,262,600 UPGRADES & ADDITIONS 3,552,618 - - - - -
Total 56,899,513 103,321,871 112,584,640 103,562,730 137,432,400 122,839,000
Program Description
Bonneville’s Upgrades and Additions program consists of adding new equipment and facilities and replacing older equipment and facilities in order to maintain or enhance the capabilities of the transmission system.
Strategic Objectives- S2 –
FCRPS Operations and Expansion, S4 –
Transmission Access and Rates , S9 –
Stakeholder Satisfaction, I4-
Asset Management
1
1
Due to changes to the data structure historical spending is not
available at the same level of detail. 2
Dollars reported are direct dollars
2

2010 Integrated Program Review 89
B O N N E V I L L E P O W E R A D M I N I S T R A T I O N
Key Products and Outputs Communications and controls additions and replacements such as:
•
Newer technology including fiber optics in order to maintain or enhance the capabilities of the transmission system•
Special remedial action control and protection schemes to accommodate new generation & mitigate constrained pathsPacific DC intertie upgrades at CeliloLine and substation upgrades and additionsControl center upgrades and additionsIT upgrades and additionsLand rights including renewals, access, and vegetation management Security enhancements
FY 2012-13 Program Spending DriversTelecommunication upgrades and additions needed to replace:
•
Analog radio systems with new digital radio systems•
The VHF radio systemCelilo upgrades
Potential RiskProposed spending levels are needed to maintain system reliability by moving to current technologies and equipment while replacing old equipment that is no longer supported by the equipment manufacturers and is also no longer maintainable. Fluctuations in the commodities market (price of materials) could affect proposed spending levels.Emerging technology could make existing equipment obsolete and difficulty in obtaining parts for maintenance could drive upgrades that were not anticipated.Increased spending levels support load growth and mitigate reliability concerns by preventing failures that may result if the needed equipment upgrades and additions are not made.
Transmission Capital – Upgrades & Additions

2010 Integrated Program Review 90
B O N N E V I L L E P O W E R A D M I N I S T R A T I O N
FY 2014-2017 Drivers of Proposed Spending ForecastCommunications and controls additions and replacements Line and substation upgrades and additionsControl center upgrades and additionsIT upgrades and additionsLand rights including renewals, access, and vegetation managementSecurity enhancements
Transmission Capital – Upgrades & Additions
Capital - Upgrades & Additions 2013 IPR 2014 IPR 2015 IPR 2016 IPR 2017 IPRCC INFASTRUCTURE COMPONENTS 1,965,000 2,784,800 1,703,700 1,157,500 1,179,000 CC SYSTEM & APPLICATION 3,165,800 2,227,800 2,839,500 4,051,100 4,126,400 CELILO UPGRADES PROJECT 43,120,400 7,362,000 - - - CONTROL CENTERS 2,510,800 2,784,800 3,407,400 2,893,700 2,947,400 FIBER OPTICS AND TERMINALS 35,260,400 32,126,500 16,014,800 5,208,600 6,248,600 IT PROJECTS 6,000,000 6,150,000 6,300,000 6,450,000 6,600,000 LAND ACQUISITION & REBUILDS 10,370,700 10,582,200 10,222,200 10,417,200 10,610,800 LAND RIGHTS - ACCESS ROADS 545,800 557,000 567,900 578,700 589,500 LAND RIGHTS - TRIBAL RENEWALS - - - - - LAND RIGHTS- VEG MITIGATION 545,800 557,000 567,900 578,700 589,500 LINE SWITCH UPGRADES - - - - - MISC. UPGRADES AND ADDITIONS 3,091,700 4,617,700 3,271,600 6,944,800 7,073,900 SECURITY ENHANCEMENTS 6,000,000 6,000,000 6,000,000 7,000,000 7,000,000 SUBSTATION UPGRADES 10,262,600 5,441,500 1,042,700 - - UPGRADES & ADDITIONS - - - - -
Total 122,839,000 81,191,300 51,937,700 45,280,300 46,965,100
2
Dollars reported are direct dollars
2

B O N N E V I L L E P O W E R A D M I N I S T R A T I O N
912010 Integrated Program Review
ENVIRONMENT PROGRAM
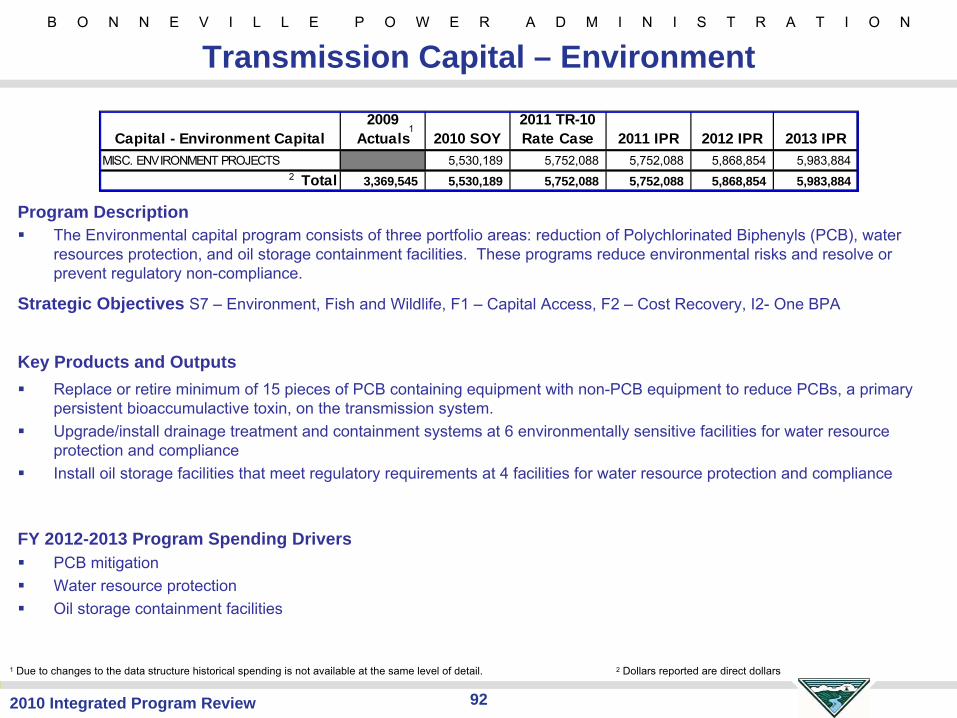
2010 Integrated Program Review 92
B O N N E V I L L E P O W E R A D M I N I S T R A T I O N
Program DescriptionThe Environmental capital program consists of three portfolio areas: reduction of Polychlorinated Biphenyls (PCB), water resources protection, and oil storage containment facilities. These programs reduce environmental risks and resolve or prevent regulatory non-compliance.
Strategic Objectives S7 –
Environment, Fish and Wildlife, F1 –
Capital Access, F2 –
Cost Recovery, I2-
One BPA
Key Products and OutputsReplace or retire minimum of 15 pieces of PCB containing equipment with non-PCB equipment to reduce PCBs, a primary persistent bioaccumulactive toxin, on the transmission system. Upgrade/install drainage treatment and containment systems at 6 environmentally sensitive facilities for water resource protection and complianceInstall oil storage facilities that meet regulatory requirements at 4 facilities for water resource protection and compliance
FY 2012-2013 Program Spending Drivers PCB mitigationWater resource protection Oil storage containment facilities
Transmission Capital – Environment
Capital - Environment Capital2009
Actuals 2010 SOY2011 TR-10 Rate Case 2011 IPR 2012 IPR 2013 IPR
MISC. ENVIRONMENT PROJECTS 3,780,352 5,530,189 5,752,088 5,752,088 5,868,854 5,983,884 Total 3,369,545 5,530,189 5,752,088 5,752,088 5,868,854 5,983,884
1
1
Due to changes to the data structure historical spending is not
available at the same level of detail. 2
Dollars reported are direct dollars
2

2010 Integrated Program Review 93
B O N N E V I L L E P O W E R A D M I N I S T R A T I O N
FY 2014-2017 Drivers of Proposed Spending ForecastPCB mitigationWater resource protectionOil storage containment facilities
Potential RiskReductions to the proposed Environment program spending levels could negatively impact the programs ability to address regulatory and liability issues at facilities and is likely to adversely affect water and environmental resources Changes in environmental regulations could put BPA in non-compliance. However, this is not anticipated because BPA staff monitors regulatory changes and is likely to foresee changes in time to modify program efforts within the planned budget.
Transmission Capital – Environment
Capital - Environment Capital 2013 IPR 2014 IPR 2015 IPR 2016 IPR 2017 IPRMISC. ENVIRONMENT PROJECTS 5,983,884 6,101,169 6,320,000 6,446,000 6,575,300 Total 5,983,884 6,101,169 6,320,000 6,446,000 6,575,300
2
Dollars reported are direct dollars
2

B O N N E V I L L E P O W E R A D M I N I S T R A T I O N
942010 Integrated Program Review
EXPANSION PROGRAM

2010 Integrated Program Review 95
B O N N E V I L L E P O W E R A D M I N I S T R A T I O N
Assets Within Expansion Program
Assets are grouped into the following categories:
Main Grid – Consists of mostly 500 kV transmission and substation facilities as well as some 345 kV and a few 230 kV facilities. This category includes BPA’s internal flow gates and large load service areas
Area and Customer Service – Consists of facilities, typically 230 kV and below, which function primarily to serve customer loads.
Inter-regional paths – Lines and facilities that interconnect with other transmission providers such as California Oregon Intertie (COI), Pacific Direct Current Intertie (PDCI), Montana Intertie, and Northern Intertie.
Grid Operations– Hardware and software system investments to expand Control Center and commercial systems capabilities
Projects Funded in Advance (PFIA)- Consists of facilities and/or equipment where BPA retains control or ownership but which are funded by a third-party or with revenues, in total or part. Also includes Commercial Spectrum Enhancement Act (CSEA) investment.

2010 Integrated Program Review 96
B O N N E V I L L E P O W E R A D M I N I S T R A T I O N
Expansion Asset Objectives
Ensure adequate facilities are in place to meet existing loads and expected/forecasted growth
Load service obligations and customer service requests meet standards and tariff requirements
A robust grid that effectively and efficiently integrates diverse energy resources, especially the increasing volume of renewable resources
Inter-regional transfer capacity meets reliability standards and commercial needs
Fuller, more optimal use is made of existing transmission capacity through technological, policy, and process change
Providing adequate capacity to accommodate requests for firm transmission serviceAccomplishing all of the above, with projects which are cost effective, least life-cycle cost and flexible to fit in with the future needs of the transmission system
2010 Integrated Program Review 97
B O N N E V I L L E P O W E R A D M I N I S T R A T I O N
Risks to Meeting the Expansion Program Objectives
Changes in regulatory requirements for reliability
Uncertainty of where large quantity of renewables will be delivered
Larger volume of wind resources – intermittent nature poses risk to having adequate transmission facilities in place
Variation and uncertainty of load forecasts
Increased system complexity
Environmental/siting process timelines impact project schedules
Interregional Expansion projects require multiple utilities participation which affects project funding and schedules
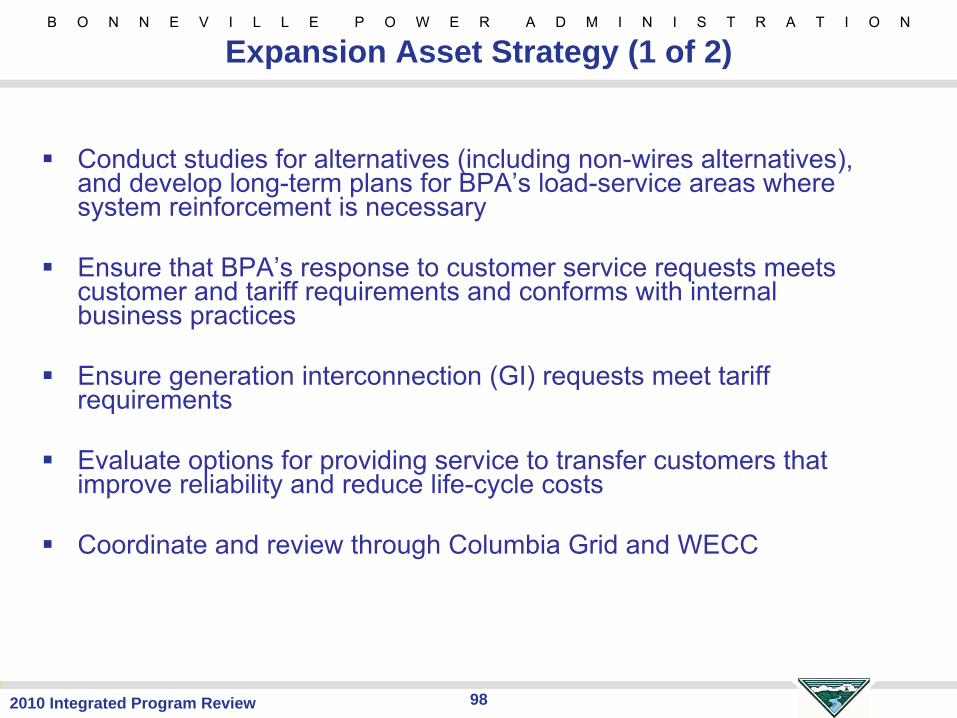
2010 Integrated Program Review 98
B O N N E V I L L E P O W E R A D M I N I S T R A T I O N
Expansion Asset Strategy (1 of 2)
Conduct studies for alternatives (including non-wires alternatives), and develop long-term plans for BPA’s load-service areas where system reinforcement is necessary
Ensure that BPA’s response to customer service requests meets customer and tariff requirements and conforms with internal business practices
Ensure generation interconnection (GI) requests meet tariff requirements
Evaluate options for providing service to transfer customers that improve reliability and reduce life-cycle costs
Coordinate and review through Columbia Grid and WECC

2010 Integrated Program Review 99
B O N N E V I L L E P O W E R A D M I N I S T R A T I O N
Ensure the implementation of a regional expansion plan that is (1) long-term and integrated with resource planning (2) meets reliability standards and (3) is directed at minimizing total system costs
Select and implement operational tools and visualization techniques to give system operators critical decision-making information on wind fleet operating status, reserves availability, potential ramps and contingencies
Optimize use of existing transmission assets
Enhance grid operations
Expansion Asset Strategy (2 of 2)

2010 Integrated Program Review 100
B O N N E V I L L E P O W E R A D M I N I S T R A T I O N
Program DescriptionBonneville's Main Grid capital program consists of projects which reinforce and expand the system in order to meet the
following objectives:•
Maintain reliable service to loads•
Ensure adequate reactive support to maintain system voltages•
Accommodate transmission service requests•
Relieve transmission congestion•
Comply with WECC and NERC Reliability Standards
Strategic Objectives S2 -
FCRPS Operations and Expansion, S4-
Transmission Access and Rates, I4 -
Asset Management
Key Products and OutputsMaintaining a reliable transmission system and relieving congestionMeeting load service obligations Meeting firm transmission service obligations
Transmission Capital – Main Grid
Capital - Main Grid2009
Actuals 2010 SOY2011 TR-10 Rate Case 2011 IPR 2012 IPR 2013 IPR
BIG EDDY-KNIGHT 500kv PROJECT 840,104 3,627,000 - 9,465,500 81,382,800 27,935,500 CENTRAL FERRY- LOWER MONUMNTAL 633,644 3,371,731 - 12,620,600 53,541,300 40,521,300 I-5 CORRIDOR UPGRADE PROJECT 929,731 6,000,000 6,840,000 6,310,300 12,849,900 135,305,700 LIBBY-TROY LINE REBUILD 9,898,080 4,888,859 - 157,800 - - MIDWAY-VANTAGE LINE UPGRADE 67,119 3,200,000 - 7,004,400 - - MISC. MAIN GRID PROJECTS 704,323 22,088,199 97,772,229 14,889,500 58,592,200 61,673,600 OLYMPIC PENINSULA PROJECT 21,927,438 2,115,204 - 999,100 1,070,800 4,708,600 REDMOND TRANSFORMER ADDITION 129,784 3,807,797 - 7,362,000 - - WEST OF MCNARY INTEGRATION PRO 25,389,280 78,974,808 85,326,471 51,201,800 5,953,800 -
Total 58,152,911 128,073,598 189,938,700 110,011,000 213,390,800 270,144,700
1
Due to changes to the data structure historical spending is not
available at the same level of detail.
1
1
2
Dollars reported are direct dollars
2
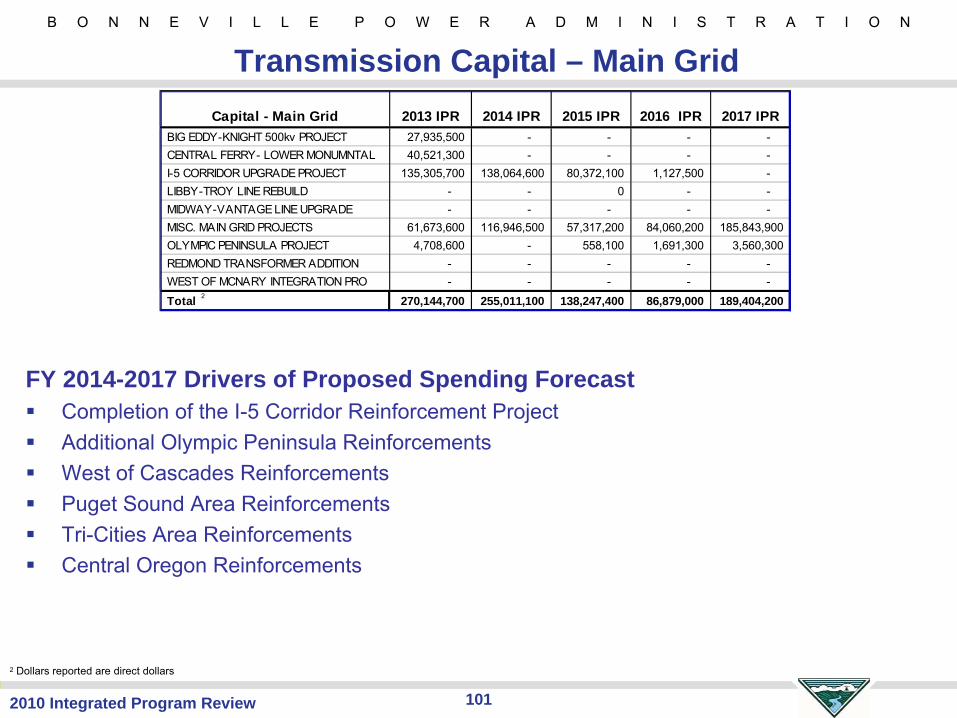
2010 Integrated Program Review 101
B O N N E V I L L E P O W E R A D M I N I S T R A T I O N
FY 2014-2017 Drivers of Proposed Spending ForecastCompletion of the I-5 Corridor Reinforcement ProjectAdditional Olympic Peninsula Reinforcements West of Cascades Reinforcements Puget Sound Area Reinforcements Tri-Cities Area Reinforcements Central Oregon Reinforcements
Transmission Capital – Main GridCapital - Main Grid 2013 IPR 2014 IPR 2015 IPR 2016 IPR 2017 IPR
BIG EDDY-KNIGHT 500kv PROJECT 27,935,500 - - - - CENTRAL FERRY- LOWER MONUMNTAL 40,521,300 - - - - I-5 CORRIDOR UPGRADE PROJECT 135,305,700 138,064,600 80,372,100 1,127,500 - LIBBY-TROY LINE REBUILD - - 0 - - MIDWAY-VANTAGE LINE UPGRADE - - - - - MISC. MAIN GRID PROJECTS 61,673,600 116,946,500 57,317,200 84,060,200 185,843,900 OLYMPIC PENINSULA PROJECT 4,708,600 - 558,100 1,691,300 3,560,300 REDMOND TRANSFORMER ADDITION - - - - - WEST OF MCNARY INTEGRATION PRO - - - - -
Total 270,144,700 255,011,100 138,247,400 86,879,000 189,404,200
2
Dollars reported are direct dollars
2

2010 Integrated Program Review 102
B O N N E V I L L E P O W E R A D M I N I S T R A T I O N
FY 2012-13 Program Spending DriversMajor network reinforcements identified from the 2008 Network Open Season: $363M•
Completion of the West of McNary Reinforcement Project -
Group I
•
Big Eddy-Knight 500 kV Project
•
Central Ferry -
Lower Monumental 500 kV Project
•
I-5 Corridor 500 kV Reinforcement Project
Reliability to loads:•
Olympic Peninsula Reinforcement
•
Portland / Vancouver Area Reinforcements
•
Salem/ Albany/ Eugene Area Reinforcement
•
Tri-Cities Area Reinforcement
•
Central Oregon Reinforcement
•
Facility Additions for NERC Compliance
Transmission Capital – Main Grid

2010 Integrated Program Review 103
B O N N E V I L L E P O W E R A D M I N I S T R A T I O N
Potential RiskChanges to proposed spending levels could occur as a result of: •
Unexpected changes to project schedules (such as delays/deferrals)
•
Variations in load forecasts resulting in project schedule or scope changes
•
Changes to current regulatory requirements
•
Fluctuations in the commodities market (i.e. price of materials)
New requests for firm transmission service could drive additional investments
Transmission Capital – Main Grid

B O N N E V I L L E P O W E R A D M I N I S T R A T I O N
1042010 Integrated Program Review
NETWORK OPEN SEASON (NOS) PROJECTS

2010 Integrated Program Review 105
B O N N E V I L L E P O W E R A D M I N I S T R A T I O N
McNary-John Day - West of McNary Reinforcement Group 1
Project Description: (Under Construction) 79 mile new 500kV transmission line, McNary and John Day Sub Bay Additions, Shunt Capacitor Additions at Jones Canyon Sub, McNary Transformer RAS, Upgrade McNary-Ross No. 1 345kV, John Day-Big Eddy No. 2 500kV and Big Eddy-Ostrander No. 1 230kV
PM: Theresa Berry
Schedule
2009 Feb. Project approved and launched
2009 June Construction started by Wilson Construction Co. for Phase 1 and 2 (miles 3 to 79)
2010 May Award McNary-John Day Phase 3 construction contract (miles 1 to 3)
2012 Feb. Energization
Budget
Complete to Date:
• 30 miles of towers installed.
• 10 miles of conductor, OHGW, fiber strung.
• 18 miles transmission towers assembled in fly yard and ready to be installed.
• 54 line miles of access roads constructed or improved.
2008 NOS Projects- McNary John Day
Proposed IPR BudgetTR-10
Rate Case
FY 2011 FY 2012
Estimated Total
Project Cost
Estimated Total
Project Cost
West of McNary Reinforcement Group 1 51,201.8 5,953.8 158,712.2 246,545.1
Dollars include direct costs only

2010 Integrated Program Review 106
B O N N E V I L L E P O W E R A D M I N I S T R A T I O N

2010 Integrated Program Review 107
B O N N E V I L L E P O W E R A D M I N I S T R A T I O N

2010 Integrated Program Review 108
B O N N E V I L L E P O W E R A D M I N I S T R A T I O N
Project Description: (In NEPA Review until June, 2011) 28 miles of new 500kV transmission line, Big Eddy Substation bay addition, and new Knight Substation.
PM: Steve Prickett
Schedule2009 Feb. Project approved for NEPA review and launched
2011 June Final EIS and ROD
2013 Feb. Energization
Budget
Completed to Date:•
NOI
•
Project Scoping and initial public meetings
•
NEPA Field Analysis 50% complete
•
Preliminary design 30% Complete
•
Preliminary Draft EIS goes to cooperating agencies June 1
Proposed IPR BudgetTR-10
Rate Case
FY 2011 FY 2012 FY 2013
Estimated Total
Project Cost
Estimated Total
Project Cost
Big Eddy-Knight 500kv Project 9,465.5 81,382.8 27,935.5 122,783.8 115,658.0
2008 NOS Projects- Big Eddy-Knight
Dollars include direct costs only

2010 Integrated Program Review 109
B O N N E V I L L E P O W E R A D M I N I S T R A T I O N
Big Eddy – Knight :
3 Routes being considered within the NEPA Process

2010 Integrated Program Review 110
B O N N E V I L L E P O W E R A D M I N I S T R A T I O N
Project Description: (In NEPA Review) 40 mile new 500kV transmission line, Central Ferry and Lower Monumental Sub Bay Additions
PM: Theresa Berry
Schedule2009 Feb. Project approved for NEPA review and launched
2011 March Final EIS and ROD
2013 July Energization
Budget
Completed to Date:• Project Scoping and initial public meeting
• NEPA Field Analysis 50% complete
• Preliminary design 100% complete and Final design 30% complete
• Preliminary Draft EIS sent to cooperating agencies April 13th
(Comment period ends May 13th)
• Engineer reviewed angle points and structure sites in field (22
miles)
• Verified 10 miles of access roads
Proposed IPR BudgetTR-10
Rate Case
FY 2011 FY 2012 FY 2013
Estimated Total
Project Cost
Estimated Total
Project Cost
Central Ferry - Lower Monumental 12,620.6 53,541.3 40,521.3 111,683.3 99,435.0
2008 NOS Projects- Central Ferry-Lower Monumental
Dollars include direct costs only

2010 Integrated Program Review 111
B O N N E V I L L E P O W E R A D M I N I S T R A T I O N

2010 Integrated Program Review 112
B O N N E V I L L E P O W E R A D M I N I S T R A T I O N
Project Description: (In NEPA Review) 70 mile new 500kV transmission line and 2 new substations
PM: Mark Korsness
Schedule2009 Feb. Project approved for NEPA review and launched
2012 Sept. Final EIS
2013 Jan. ROD
2015 Oct. Energization
Budget
Completed to Date:• NOI (Notice of Intent)
• Project Scoping and initial public meetings
• NEPA Field Analysis 10% complete
• Permission to Enter (PEP) 50% Complete
• Preliminary design 30% complete
• Continue to meet with landowner groups and elected officials
Proposed IPR Budget TR-10
Rate Case
FY 2011 FY 2012 FY 2013 FY 2014 FY 2015 FY 2016
Estimated Total
Project Cost
Estimated Total
Project Cost
I-5 Corridor Reinforcement Project 6,310.3 12,849.9 135,305.7 138,064.6 80,372.1 1,127.5 381,530.1 341,996.1
2008 NOS Projects- I-5 Corridor Reinforcement
Dollars include direct costs only

2010 Integrated Program Review 113
B O N N E V I L L E P O W E R A D M I N I S T R A T I O N
B O N N E V I L L E P O W E R A D M I N I S T R A T I O N
1142010 Integrated Program Review
AREA & CUSTOMER SERVICE

2010 Integrated Program Review 115
B O N N E V I L L E P O W E R A D M I N I S T R A T I O N
Transmission Capital – Area & Customer Service
Program DescriptionBPA's Area and Customer Service capital program consists of projects which reinforce and expand the system in order to meet the following objectives:
•
Provide reliable service to customer loads in accordance with contractual obligations•
Comply with WECC and NERC Reliability Standards•
Facilitate customer interconnection requests (generation, line, and load interconnections)
Strategic Objectives - S2 –
FCRPS Operations and Expansion, S9-
Stakeholder Satisfaction, I4 –
Asset Management
Key Products and Outputs
Maintaining a reliable transmission systemMeeting contractual obligations for serving customer loadsEnsuring adequate reactive support at customer points of delivery
Capital - Area & Customer Service
2009 Actuals 2010 SOY
2011 TR-10 Rate Case 2011 IPR 2012 IPR 2013 IPR
CITY OF CENTRALIA PROJECT 4,746,936 2,026,378 - - - - LOWER VALLEY (CARIBOU) PROJECT 1,238,340 19,127,551 - 1,183,200 7,064,700 6,004,100 MISC. AREA & CUSTOMER SERVICE 5,444,404 9,545,947 6,255,900 4,842,100 4,260,200 3,466,000 ROGUE SVC ADDITION 1,467,308 6,403,484 - - - -
Total 11,452,179 37,103,360 6,255,900 6,025,300 11,324,900 9,470,100
1
1
Due to changes to the data structure historical spending is not
available at the same level of detail. 2
Dollars reported are direct dollars
2

2010 Integrated Program Review 116
B O N N E V I L L E P O W E R A D M I N I S T R A T I O N
FY 2012-13 Program Spending DriversLower Valley ReinforcementOkanogan Area ReinforcementKalispell / Flathead Valley ReinforcementArea Service Reactive Additions & Customer Service Facility Additions
Potential RiskThe proposed spending levels are needed to ensure customer load service obligations are met and to ensure compliance with NERC Reliability Standards.Changes to proposed spending levels could occur as a result of:
•
Unanticipated changes to project schedules (such as delays/deferrals)•
Variations in load forecasts resulting in project schedule or scope changes•
Changes to current regulatory requirements •
Fluctuations in the commodities market (i.e. price of materials)New customer interconnection requests could result in additional projects which would affect the proposed spending levels
FY 2014-2017 Drivers of Proposed Spending ForecastKalispell / Flathead Valley Reinforcements – FY 2014Longview Area ReinforcementArea Service Reactive Additions & Customer Service Facility Additions – FY 2014-2017
Transmission Capital – Area & Customer Service
Capital - Area & Customer Service 2013 IPR 2014 IPR 2015 IPR 2016 IPR 2017 IPR
CITY OF CENTRALIA PROJECT - - - - - LOWER VALLEY (CARIBOU) PROJECT 6,004,100 - - - - MISC. AREA & CUSTOMER SERVICE 3,466,000 10,749,200 16,156,700 17,130,600 28,295,400 ROGUE SVC ADDITION - - - - -
Total 9,470,100 10,749,200 16,156,700 17,130,600 28,295,400
2
Dollars reported are direct dollars
2

B O N N E V I L L E P O W E R A D M I N I S T R A T I O N
1172010 Integrated Program Review
Projects Funded in Advance (PFIA)

2010 Integrated Program Review 118
B O N N E V I L L E P O W E R A D M I N I S T R A T I O N
Transmission Capital – PFIA
Program DescriptionBPA’s Projects Funded In Advance (PFIA) program includes those facilities and/or equipment where Bonneville retains control or ownership but which are funded or financed by a third-party or with revenues, either in total or in part. This program also includes investments associated with the Commercial Spectrum Enhancement Act (CSEA)
Strategic Objectives- S6 –
Renewable Energy, S4 –
Transmission Access and Rates, I4 –
Asset Management, S8 –
Climate Change
Key Products and OutputsTransmission line and substation modifications and additions to interconnect generation and line/load interconnection requests to the BPA transmission gridIntegration of generation projects connected to third-party transmission and distribution systems that are located within BPA's balancing authority areaControl area move projectsNon-tariff reimbursable work performed for entities that require the relocation or modification of BPA transmission facilities (e.g. moving a transmission line to accommodate a freeway expansion)Address customer load service needs and interconnect renewable energy generation to the grid while minimizing risk to BPA.Relocation or modification of BPA transmission assets, funded by a third party.
Capital - PFIA2009
Actuals 2010 SOY2011 TR-10 Rate Case 2011 IPR 2012 IPR 2013 IPR
COI ADDITION PROJECT 11,202,022 25,482,894 23,442,472 11,238,500 - - GENERATOR INTERCONNECTION 14,107,612 63,809,900 65,117,977 57,784,700 35,266,700 36,450,300 MISC. PFIA PROJECTS 6,655,095 6,500,000 13,726,000 9,643,000 7,385,100 6,864,200 SPECTRUM RELOCATION 7,187,852 10,812,502 - 8,126,000 1,780,000 400,000
Total 36,784,922 106,605,296 102,286,449 86,792,200 44,431,800 43,714,500
1
2
Dollars reported are direct dollars
2

2010 Integrated Program Review 119
B O N N E V I L L E P O W E R A D M I N I S T R A T I O N
FY 2012-13 Program Spending DriversGeneration interconnection and line load interconnection projectsCompletion of the COI projectCompletion of the radio spectrum programVarious other projects
Potential RiskBPA’s Open Access Transmission Tariff requires BPA continue to integrate new generation projects into the BPA transmission grid in response to interconnection requests submitted via the large and small generation interconnection procedures outlined in the tariff.
•
Developers are required to advance finance the interconnections;
therefore, there is always uncertainty on if and when a particular customer will authorize BPA to begin design and construction on a particular interconnection plan of service.
•
This results in great uncertainty in the projected spending levels.
Miscellaneous PFIA spending levels are extremely difficult to forecast due to the nature of the projects. They are usually the unexpected consequence of a state or county moving or widening a road or freeway, resulting in BPA moving transmission lines.
BPA lacks sufficient resources to accomplish the engineering, construction, testing and energization of all of these projects and expects to utilize the Owner Engineer and Engineer-Procure-Construct contracting strategies to help achieve the projected spending levels.
Transmission Capital – PFIA

2010 Integrated Program Review 120
B O N N E V I L L E P O W E R A D M I N I S T R A T I O N
Customer Line- Load Expand Projects FY10-13
FY 2010 Projects:•
Silverado Substation (Clallam PUD)•
Gardiner Substation, new 115 kV bay (Central Lincoln PUD)
FY 2011 Projects: •
Acord
Substation (Benton REA)•
Mt Adams Substation (Yakima Power) •
Flathead Substation new 230 kV Bay (Flathead Electric)•
Olympia Substation new 115 kV Bay (Puget Sound Energy)
FY 2012 Projects:•
Cathlamet
Substation transformer addition (Wahkiakum PUD)
FY 2013 Projects: •
St Clair Substation, add 230 kV yard for loop-in of Olympia-S. Tacoma line (PSE)•
Alderton
Substation, add 230 kV yard for loop-in of S. Tacoma-White River line (PSE)•
Juan de fuca
HVDC, connect to 230 kV at Port Angeles substation•
Big Sky Green Power, new 500 kV Substation at Townsend, Montana
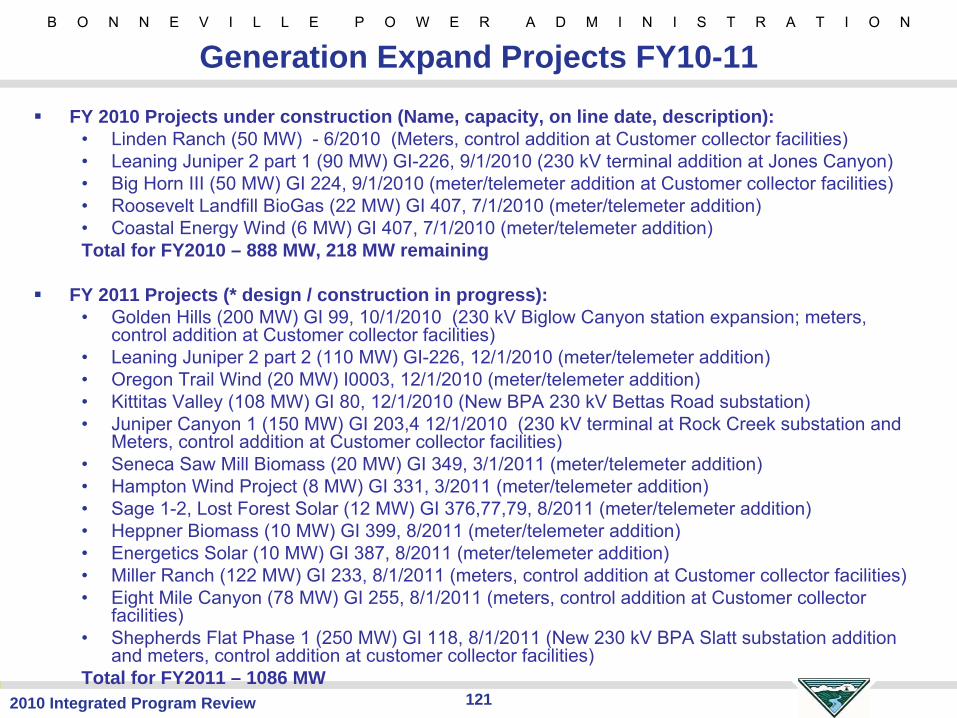
2010 Integrated Program Review 121
B O N N E V I L L E P O W E R A D M I N I S T R A T I O N
Generation Expand Projects FY10-11FY 2010 Projects under construction (Name, capacity, on line date, description):
•
Linden Ranch (50 MW) -
6/2010 (Meters, control addition at Customer collector facilities)•
Leaning Juniper 2 part 1 (90 MW) GI-226, 9/1/2010 (230 kV terminal addition at Jones Canyon)•
Big Horn III (50 MW) GI 224, 9/1/2010 (meter/telemeter addition at Customer collector facilities)•
Roosevelt Landfill BioGas
(22 MW) GI 407, 7/1/2010 (meter/telemeter addition)•
Coastal Energy Wind (6 MW) GI 407, 7/1/2010 (meter/telemeter addition)Total for FY2010 – 888 MW, 218 MW remaining
FY 2011 Projects (* design / construction in progress): •
Golden Hills (200 MW) GI 99, 10/1/2010 (230 kV Biglow Canyon station expansion; meters, control addition at Customer collector facilities)
•
Leaning Juniper 2 part 2 (110 MW) GI-226, 12/1/2010 (meter/telemeter addition)•
Oregon Trail Wind (20 MW) I0003, 12/1/2010 (meter/telemeter addition)•
Kittitas Valley (108 MW) GI 80, 12/1/2010 (New BPA 230 kV Bettas
Road substation)•
Juniper Canyon 1 (150 MW) GI 203,4 12/1/2010 (230 kV terminal at Rock Creek substation and Meters, control addition at Customer collector facilities)
•
Seneca Saw Mill Biomass (20 MW) GI 349, 3/1/2011 (meter/telemeter addition)•
Hampton Wind Project (8 MW) GI 331, 3/2011 (meter/telemeter addition)•
Sage 1-2, Lost Forest Solar (12 MW) GI 376,77,79, 8/2011 (meter/telemeter addition)•
Heppner Biomass (10 MW) GI 399, 8/2011 (meter/telemeter addition)•
Energetics Solar (10 MW) GI 387, 8/2011 (meter/telemeter addition)•
Miller Ranch (122 MW) GI 233, 8/1/2011 (meters, control addition
at Customer collector facilities)•
Eight Mile Canyon (78 MW) GI 255, 8/1/2011 (meters, control addition at Customer collector facilities)
•
Shepherds Flat Phase 1 (250 MW) GI 118, 8/1/2011 (New 230 kV BPA
Slatt substation addition and meters, control addition at customer collector facilities)
Total for FY2011 – 1086 MW
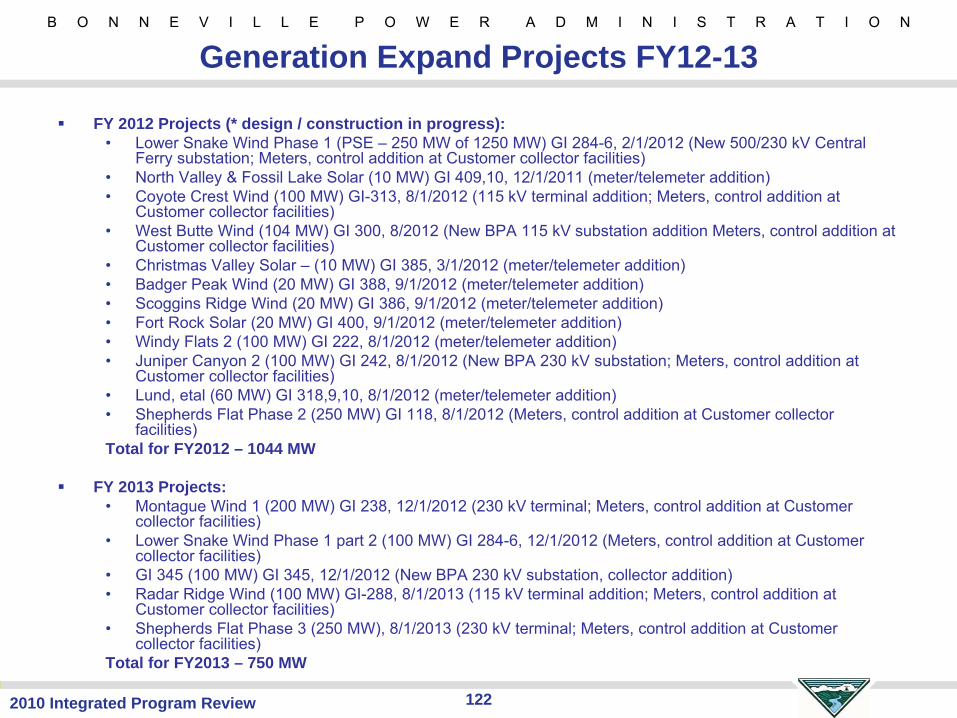
2010 Integrated Program Review 122
B O N N E V I L L E P O W E R A D M I N I S T R A T I O N
Generation Expand Projects FY12-13
FY 2012 Projects (* design / construction in progress): •
Lower Snake Wind Phase 1 (PSE –
250 MW of 1250 MW) GI 284-6, 2/1/2012 (New 500/230 kV Central Ferry substation; Meters, control addition at Customer collector
facilities)•
North Valley & Fossil Lake Solar (10 MW) GI 409,10, 12/1/2011 (meter/telemeter addition)•
Coyote Crest Wind (100 MW) GI-313, 8/1/2012 (115 kV terminal addition; Meters, control addition at Customer collector facilities)
•
West Butte Wind (104 MW) GI 300, 8/2012 (New BPA 115 kV substation addition Meters, control addition at Customer collector facilities)
•
Christmas Valley Solar –
(10 MW) GI 385, 3/1/2012 (meter/telemeter addition) •
Badger Peak Wind (20 MW) GI 388, 9/1/2012 (meter/telemeter addition)•
Scoggins Ridge Wind (20 MW) GI 386, 9/1/2012 (meter/telemeter addition)•
Fort Rock Solar (20 MW) GI 400, 9/1/2012 (meter/telemeter addition)•
Windy Flats 2 (100 MW) GI 222, 8/1/2012 (meter/telemeter addition) •
Juniper Canyon 2 (100 MW) GI 242, 8/1/2012 (New BPA 230 kV substation; Meters, control addition at Customer collector facilities)
•
Lund, etal (60 MW) GI 318,9,10, 8/1/2012 (meter/telemeter addition) •
Shepherds Flat Phase 2 (250 MW) GI 118, 8/1/2012 (Meters, control addition at Customer collector facilities)
Total for FY2012 – 1044 MW
FY 2013 Projects: •
Montague Wind 1 (200 MW) GI 238, 12/1/2012 (230 kV terminal; Meters, control addition at Customer collector facilities)
•
Lower Snake Wind Phase 1 part 2 (100 MW) GI 284-6, 12/1/2012 (Meters, control addition at Customer collector facilities)
•
GI 345 (100 MW) GI 345, 12/1/2012 (New BPA 230 kV substation, collector addition)•
Radar Ridge Wind (100 MW) GI-288, 8/1/2013 (115 kV terminal addition; Meters, control addition at Customer collector facilities)
•
Shepherds Flat Phase 3 (250 MW), 8/1/2013 (230 kV terminal; Meters, control addition at Customer collector facilities)
Total for FY2013 – 750 MW

2010 Integrated Program Review 123
B O N N E V I L L E P O W E R A D M I N I S T R A T I O N
FY 2014-2017 Drivers of Proposed Spending ForecastGenerator interconnection projectsVarious other misc. PFIA projects
Transmission Capital – PFIA
Capital - PFIA 2013 IPR 2014 IPR 2015 IPR 2016 IPR 2017 IPRCOI ADDITION PROJECT - - - - - GENERATOR INTERCONNECTION 36,450,300 24,328,500 17,809,700 18,149,500 18,486,700 MISC. PFIA PROJECTS 6,864,200 5,365,100 4,500,000 4,500,000 4,500,000 SPECTRUM RELOCATION 400,000 - - - -
Total 43,714,500 29,693,600 22,309,700 22,649,500 22,986,700
2
Dollars reported are direct dollars
2
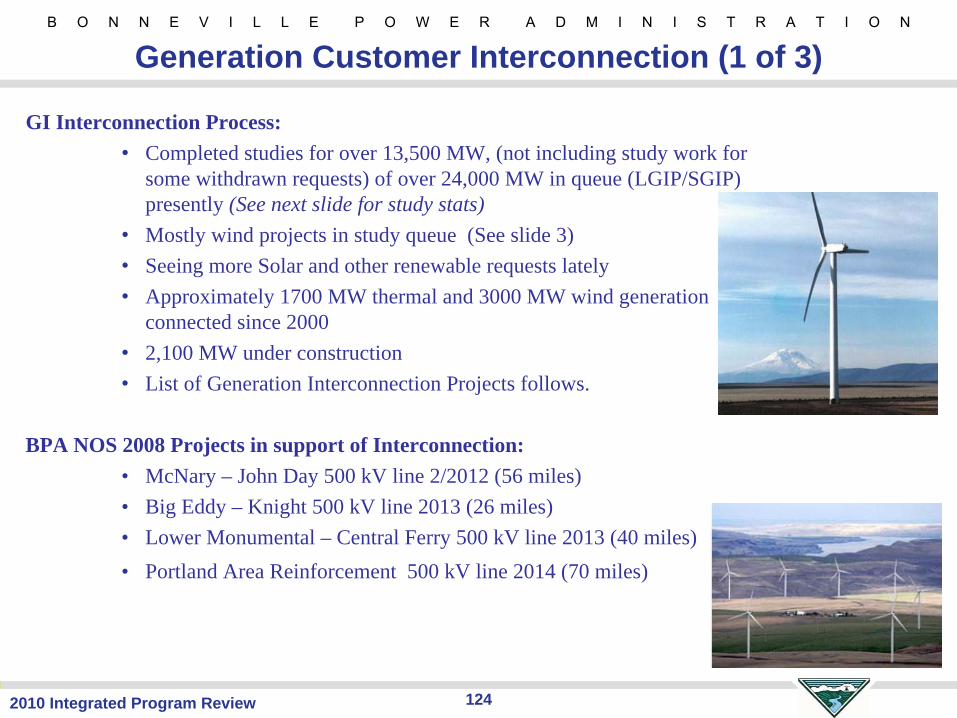
2010 Integrated Program Review 124
B O N N E V I L L E P O W E R A D M I N I S T R A T I O N
GI Interconnection Process:•
Completed studies for over 13,500 MW, (not including study work for some withdrawn requests) of over 24,000 MW in queue (LGIP/SGIP) presently (See next slide for study stats)
•
Mostly wind projects in study queue (See slide 3)•
Seeing more Solar and other renewable requests lately•
Approximately 1700 MW thermal and 3000 MW wind generation connected since 2000
•
2,100 MW under construction•
List of Generation Interconnection Projects follows.
BPA NOS 2008 Projects in support of Interconnection:• McNary – John Day 500 kV line 2/2012 (56 miles)• Big Eddy – Knight 500 kV line 2013 (26 miles)• Lower Monumental – Central Ferry 500 kV line 2013 (40 miles)• Portland Area Reinforcement 500 kV line 2014 (70 miles)
Generation Customer Interconnection (1 of 3)

2010 Integrated Program Review 125
B O N N E V I L L E P O W E R A D M I N I S T R A T I O N
Generation Interconnection Requests
0
10
20
30
40
50
60
70
80
90
2000 2001 2002 2003 2004 2005 2006 2007 2008 2009 2010
Que
ue R
eque
sts
RequestsWithdrawnStudy CompleteAdd'l In StudyStudy BacklogContract ExecutedOn-Line
Generation Customer Interconnection (2 of 3)

2010 Integrated Program Review 126
B O N N E V I L L E P O W E R A D M I N I S T R A T I O N
Generation Customer Interconnection (3 of 3)

B O N N E V I L L E P O W E R A D M I N I S T R A T I O N
1272010 Integrated Program Review
AFUDC & INDIRECTS

2010 Integrated Program Review 128
B O N N E V I L L E P O W E R A D M I N I S T R A T I O N
Transmission Capital – AFUDC
Program DescriptionAFUDC measures the costs of financing construction projects and BPA's inclusion of AFUDC in rates, provides reasonable assurance of the ability to recover those costs in future rates. Generally Accepted Accounting Principles (GAAP) reference: FAS 71 (Accounting for the Effects of Certain Types Regulation) Paragraph 15 states: AFUDC. In some cases, a regulator requires an enterprise subject to its authority to capitalize, as part of the cost of plant equipment, the cost of financing construction as financed partially by borrowings and partially by equity. A computed interest cost and a designated cost of equity funds are capitalized, and net income for the current period is increased by a corresponding amount. After the construction is completed, the resulting capitalized cost is the basis for depreciation and unrecovered investment for rate-making purposes. In such cases, the amounts capitalized for rate making purposes as part of the cost of acquiring the assets shall be capitalized for financial reporting purposes instead of the amount of interest that would be capitalized in accordance with FASB Statement No. 34, (Capitalization of Interest Cost. 9/ ). The income statement shall include an item of other income, a reduction of interest expense, or both, in a manner that indicates the basis for the amount capitalized. 9/. Statement 34 requires capitalization of interest cost on certain qualifying assets. The amount capitalized is the portion of the interest cost incurred during the period that theoretically could have been avoided if the expenditures had not been made.
Capital - Transmission AFUDC2009
Actuals 2010 SOY2011 TR-10 Rate Case 2011 IPR 2012 IPR 2013 IPR
FEDERAL AFUDC - - 22,467,500 24,624,000 31,157,000 38,075,000 Total - - 22,467,500 24,624,000 31,157,000 38,075,000

2010 Integrated Program Review 129
B O N N E V I L L E P O W E R A D M I N I S T R A T I O N
Transmission Capital – AFUDC
Capital - Transmission AFUDC 2013 IPR 2014 IPR 2015 IPR 2016 IPR 2017 IPRFEDERAL AFUDC 38,075,000 46,890,000 41,400,000 31,521,000 37,771,000
Total 38,075,000 46,890,000 41,400,000 31,521,000 37,771,000

2010 Integrated Program Review 130
B O N N E V I L L E P O W E R A D M I N I S T R A T I O N
Transmission Capital – Indirects
Program DescriptionWithin the Transmission, capital costs are treated as either direct or indirect. T’s indirect costs are comprised of Transmission Indirect costs, Transmission Support Services and Contracting costs, and Shared Services and Corporate Overhead costs. The Transmission Indirect and Support Services and Contracting costs originate in the Transmission organization and would normally be charged directly to projects but due to system processing issues, it is not cost effective to direct charge these costs. To determine the full cost of a direct project, the overhead costs must be associated with the final project to allow for proper capitalization and depreciation of the project.The process of allocating transmission capital indirects is determined by analysis of pricing the Transmission product which establishes the application of percentages at the beginning of the fiscal year. On a quarterly basis the balance in the indirect cost pool is reviewed to determine if the allocations are properly clearing.
Capital - TBL Capital Indirects 2009 Actuals 2010 SOY2011 TR-10 Rate Case 2011 IPR 2012 IPR 2013 IPR
CORPORATE CAPITAL INDIRECTS - - 39,217,436 42,643,257 44,534,565 45,197,257 TBL CAPITAL INDIRECTS (272) 0 41,834,774 40,794,000 41,518,900 42,343,000
Total 74,631,576 0 81,052,210 83,437,257 86,053,465 87,540,257

B O N N E V I L L E P O W E R A D M I N I S T R A T I O N
1312010 Integrated Program Review
ACCOMPLISHING THE CAPITAL
PROGRAM

2010 Integrated Program Review 132
B O N N E V I L L E P O W E R A D M I N I S T R A T I O N
Transmission Capital1 2003-2017
1Proposed Capital Levels do not include lapse factor.
$0
$100
$200
$300
$400
$500
$600
$700
$800
FY03 FY04 FY05 FY06 FY07 FY08 FY09 FY10 FY11 FY12 FY13 FY14 FY15 FY16 FY17
AFUDC
Indirects
CustomerFinanced/Credits/PFIA/RadioSpectrumEnvironment
System Replacements
Upgrades & Additions
Area & Customer Service
Main Grid
$ in Millions

2010 Integrated Program Review 133
B O N N E V I L L E P O W E R A D M I N I S T R A T I O N
Historical Capital Spending Comparison
$0
$50
$100
$150
$200
$250
$300
$350
$400
Actual Expenditures $330 $332 $222 $186 $248 $228 $377
IPR $246 $327 $335 $322 $301 $356 $330
FY03 FY04 FY05 FY06 FY07 FY08 FY09
$ in Millions
134% 101%
66%
58%
82%
64%
114%
Seven Year Average = 88%

2010 Integrated Program Review 134
B O N N E V I L L E P O W E R A D M I N I S T R A T I O N
Capital Resource Strategy
0100200300400500600700800
FY 2011 FY 2012 FY 2013 FY 2014 FY 2015 FY 2016 FY 2017
$MAccomplishing The Additional Work Effectively
Given BPA-T’s internal workforce constraint of $200M (direct $), BPA has developed a contract strategy that will ensure the completion of the sustain and expansion capital programs. The Contract Management Office (CMO) and other contracting strategies provide an increase in capacity to meet the capital program needs. Specific CMO objectives include achieving the increased capital program contracting without increasing employee levels as well as meeting project/program objectives within budget, scope, and schedule.
In-house (BPA + supplemental labor)
CMO (OE + EPC + C/I)
Other contracts
Owner’s Engineer (OE), Engineer, Procure, Construct (EPC), and Contract Administration and Inspection (C/I)

2010 Integrated Program Review 135
B O N N E V I L L E P O W E R A D M I N I S T R A T I O N
Contract Management Office (CMO)• 15 staff currently in this function overseeing contracts and work plan• Contracts include:
−Owner’s Engineer (OE)-
awarded 2009 −Engineer, Procure, Construct (EPC)-
June 2010 award −Contract Administration and Inspection (C/I)-
July 2010−Switchboard shop-
under development, operational 3-6 months−Special services contracts-
under development, operational 3-6 months
Other Contracts (outside of the CMO scope)•
Turn key solutions from original equipment manufacturers (e.g. series caps, Celilo enhancements)•
Specialized vendor contracts for telecomm projects (e.g. 3G, mobile radio upgrades)• Fixed price material contracts for major equipment (transformers) • Construction contracts for non-electric plant facilities
BPA Internal Capacity• Use of term employees (limited to 4 years)• Supplemental labor• New focus on managing and accepting work by contractors
Resource Strategies to Achieving Capital Program

2010 Integrated Program Review 136
B O N N E V I L L E P O W E R A D M I N I S T R A T I O N
What is the Desired Future State?
Have clearly defined agency level Talent Management Strategy that defines the “right size”, “right skills” and “right work environment”
Use Benchmarking to help define “right size” and “right skills”•
Navigant study-
reviewing preliminary findings−Based on 2009 capital program−Results -
below industry median for Transmission business wide−Functional analysis –
shows some over and some underShort on project managersSpan of control - 22 front-line supervisors (9% of total managers) with more than 20 staffShort on technical crafts (protection and control, communications)

2010 Integrated Program Review 137
B O N N E V I L L E P O W E R A D M I N I S T R A T I O N
Short Term Staffing Strategies
1)
Need to carefully assess what work really needs to be done by BPA employees. Only fill vacancies when really necessary;
2)
Understand BPA may need to reassign work or workers to critical functional areas;
3)
Continue to use supplemental labor contract resources.
4)
Use the Supplemental Labor Information System to effectively access contracting needs;
5)
Use tools to address peak work:−
Use term employees where appropriate; and−
Contracting mechanisms.

2010 Integrated Program Review 138
B O N N E V I L L E P O W E R A D M I N I S T R A T I O N
Contract Strategy Decision Tree
Note: Diagram is conceptual not operational
Project Delivery Method?
BPA Construction
Owner’s Engineer (OE)100% Design
In-house Contract
OE10-30% Design
Engineer, Procure, Construct (EPC)
Contractor
BPAProcurement &
Logistics
Contract ManagementOffice
BPA Design
Construction Type?
Contract
In-house
Construction Type?
In-house
Typical Contract Construction
ContractContract
Administration & Inspection
(C/I)
Man
age
Des
ign
Pro
cure
Con
stru
ct
Contract Procurement & Construction
2010 Integrated Program Review 139
B O N N E V I L L E P O W E R A D M I N I S T R A T I O N
Capital Program Process Improvements
•
Embrace ongoing automation efforts and change management processes to provide a solid foundation for the capital program.Improve Design, Field, Construction, and CMO coordinationContinue implementing strategies/systems to compare projects and resourcesImplement Work Plan in MS Project by July 2010Have 80% of the FY11 Work Plan and resource strategy developed by July 2010 prior to budget setting processRegularly review scope, schedule, and budget of projects underway for necessary defunding to improve end of year forecastEstablish outyear contract strategy execution targets for available contracting methodsMonitor key risk mitigation plans

2010 Integrated Program Review 140
B O N N E V I L L E P O W E R A D M I N I S T R A T I O N
BPA’s Financial Disclosure Information
•
All FY 2010 – FY 2017 information has been made publicly available by BPA on May 13th, 2010 and does not contain Agency-approved Financial Information.
•
All FY 2003 – 2009 information has been made publicly available by BPA and contains Agency-approved Financial Information.
•
All FY 2011 Rate Case data has been developed for publication in rates proceeding documents and is being provided by BPA.