Transmission Asset Management Strategy - BPA.gov · This Transmission Asset Management Strategy...
28
Transmission Asset Management Strategy Purpose and scope Strategic environment Strategic direction System performance metrics Integrated Program Review May 2010
-
Upload
phamnguyet -
Category
Documents
-
view
220 -
download
1
Transcript of Transmission Asset Management Strategy - BPA.gov · This Transmission Asset Management Strategy...
Transmission Asset Management Strategy
Purpose and scope
Strategic environment
Strategic direction
System performance metrics
Integrated Program Review May 2010
T r a n s m i s s i o n A s s e t M a n a g e m e n t S t r a t e g y
B O N N E V I L L E P O W E R A D M I N I S T R A T I O N
Purpose and scope
This Transmission Asset Management Strategy charts the course for managing the health, performance, costs and risks of transmission assets owned or leased by the Bonneville Power Administration. Its strategic ambition is to ensure that critical assets – including transmission lines, substations, control center equipment, and other facilities and equipment – meet reliability and availability requirements and provide needed capacity into the future, while at the same minimizing long-term costs. This strategy covers a 10-year planning horizon, and it seeks to answer these questions:
• Which transmission assets are critical to achieving BPA’s mission and vision? • What performance objectives should BPA set for these critical assets? • How are these assets performing today? • What are the gaps in meeting the performance objectives, and which gaps should we close? • What are the challenges to closing the gaps, and which risks should BPA seek to manage? • What strategies should BPA adopt? • What are the anticipated costs?
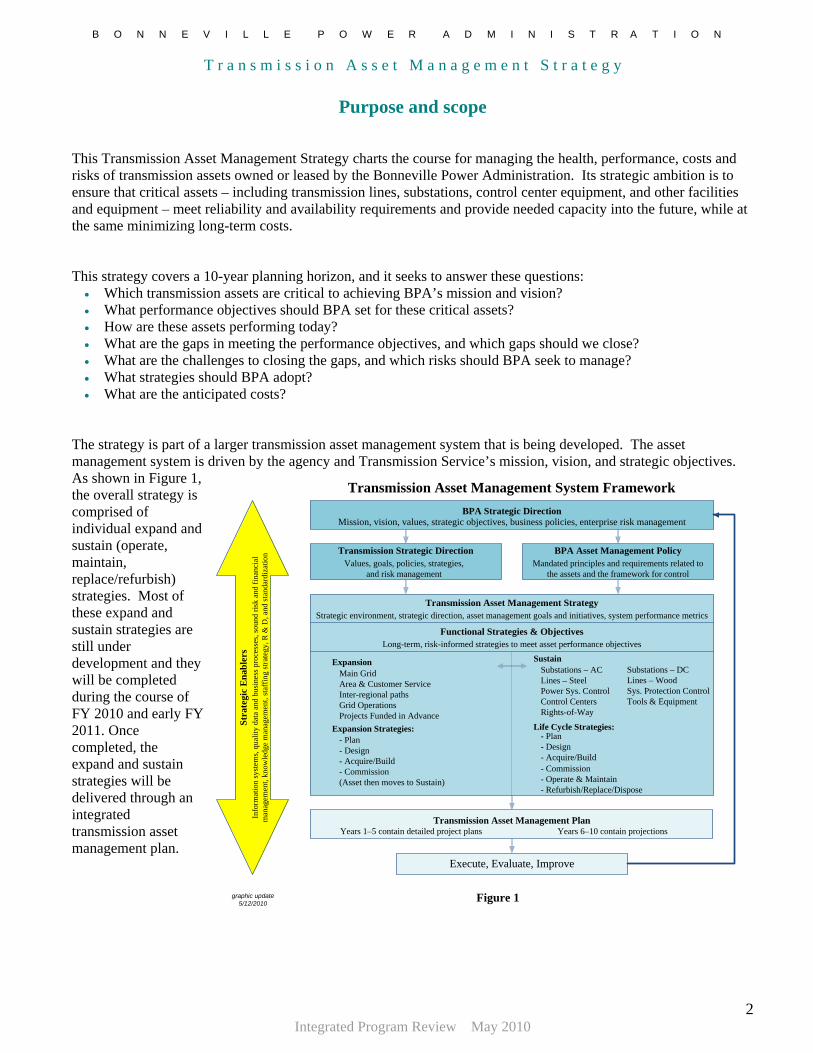
The strategy is part of a larger transmission asset management system that is being developed. The asset management system is driven by the agency and Transmission Service’s mission, vision, and strategic objectives. As shown in Figure 1, the overall strategy is comprised of individual expand and sustain (operate, maintain, replace/refurbish) strategies. Most of these expand and sustain strategies are still under development and they will be completed during the course of FY 2010 and early FY 2011. Once completed, the expand and sustain strategies will be delivered through an integrated transmission asset management plan.
Figure 1
Transmission Asset Management System Framework
Execute, Evaluate, Improve
Stra
tegi
c E
nabl
ers
Info
rmat
ion
syst
ems,
qual
ity d
ata
and
busi
ness
pro
cess
es, s
ound
risk
and
fina
ncia
l m
anag
emen
t, kn
owle
dge
man
agem
ent,
staf
fing
stra
tegy
, R &
D, a
nd st
anda
rdiz
atio
n
BPA Strategic DirectionMission, vision, values, strategic objectives, business policies, enterprise risk management
Transmission Strategic DirectionValues, goals, policies, strategies,
and risk management
BPA Asset Management PolicyMandated principles and requirements related to
the assets and the framework for control
Transmission Asset Management StrategyStrategic environment, strategic direction, asset management goals and initiatives, system performance metrics
Functional Strategies & ObjectivesLong-term, risk-informed strategies to meet asset performance objectives
Expansion SustainSubstations – ACLines – SteelPower Sys. ControlControl CentersRights-of-Way
–
Main GridArea & Customer ServiceInter-regional pathsGrid OperationsProjects Funded in Advance
Expansion Strategies: Life Cycle Strategies:- Plan- Design- Acquire/Build- Commission(Asset then moves to Sustain)
- Plan- Design- Acquire/Build
Transmission Asset Management PlanYears 1–5 contain detailed project plans Years 6–10 contain projections
Substations – DCLines – WoodSys. Protection ControlTools & Equipment
- Commission- Operate & Maintain- Refurbish/Replace/Dispose
graphic update 5/12/2010
Integrated Program Review May 2010
2
T r a n s m i s s i o n A s s e t M a n a g e m e n t S t r a t e g y
B O N N E V I L L E P O W E R A D M I N I S T R A T I O N
BPA’s transmission programs
Expansion The expansion investment portfolio consists of capital projects required to increase capacity and improve reliability to meet load growth, meet generation interconnection and customer service requests, or provide congestion relief. Projects range from minor facility upgrades to major transmission lines, upgrades to the communications system, and substation additions. Expansion projects are grouped as:
• Main Grid, consisting of 500-kV transmission and substation facilities as well as some 345-kV and a few 230-kV facilities;
• Area & Customer Service, consisting of facilities, typically 230 kV and below, which function primarily to serve customer loads;
• Inter-regional paths, consisting of 500-kV and some lower voltage lines and facilities that interconnect with transmission providers and generating resources outside the Pacific Northwest; and
• Grid operation and IT commercial systems, consisting of hardware and software system investments to expand Control Center and commercial systems capabilities.
Sustain Programs Steel Lines/Wood Lines
The BPA transmission system consists of about 15,200 circuit miles of high-voltage transmission lines suspending about 70,000 miles of cable on 89,560 structures. The power lines are composed of numerous conductors and groundwire cables carried on both lattice and pole structures composed of steel, aluminum, and/or wood. Fiber optic cables are carried by power line structures carefully located to ensure efficient co-existence of both bulk transfer systems. The preponderance of BPA’s overhead asset is contained on the 500-kV primary power delivery grid, along with the 230- and 115-kV grids serving load and interconnecting generation.
Rights of Way
Rights of Way are comprised of corridors of land and access roads around and leading to transmission lines and fiber optic cables, substations, and non-electric facilities. Working with federal, state, and local agencies, private land owners, and other interested parties, BPA maintains 266,589 acres of transmission line corridor Rights of Way, including ~80,000 tracts of easement, 11,500 miles of access road, and 289 substations. Access road work includes maintenance, improvements and new builds. Vegetation management includes maintenance work to control vegetation. Ongoing real estate easements work includes perfecting existing easements and acquiring new easements. Substations AC
Substation AC assets are contained in 288 substations and they include high voltage (HV 15kV – 500kV AC) outdoor substation equipment and supporting low voltage (120VAC & DC – 15kVAC) equipment. Also included are the substation ground mats; equipment structures and foundations, and substation dead-end towers. Power transformers provide power conversion between varying system voltages. Switchgear such as circuit breakers and circuit switchers provide protection against system disturbances and switching of reactive equipment. Switchgear such as disconnect switches provide isolation for maintenance. Instrument transformers such as current (CT), and voltage/potential (VT/PT) provide data signals for revenue metering, AGC, and protection and control circuits. Surge arresters protect high voltage equipment from lightning and switching over-voltages. Reactive compensation is provided by shunt capacitors and series and shunt reactors – these are passive installations (no power electronics – DC/SVC/Series Caps). Lower voltage outdoor substation equipment such as station service transformers, transfer switches, underground cables, fuses, and station control batteries provide primary and auxiliary power for the HV equipment and associated protection and control circuits.
Integrated Program Review May 2010
3
T r a n s m i s s i o n A s s e t M a n a g e m e n t S t r a t e g y
B O N N E V I L L E P O W E R A D M I N I S T R A T I O N
Substations DC
The BPA Transmission system employs High Voltage Direct Current (HVDC) and Flexible AC Transmission System (FACTS) technologies. The HVDC portion is composed of the northern terminus of the Pacific Direct Current Intertie (PDCI) - the Celilo Converter Station. The PDCI is operated with the Los Angeles Department of Power and Water, which maintains and operates the southern terminus. The FACTS portion is composed of Static Var Compensators (SVC) and Series Capacitor Banks. BPA presently operates 2 transmission class SVC’s. These devices serve to stabilize the voltage in these areas during transient and dynamic power system events. Another SVC is presently under construction. BPA operates 21 fixed series capacitor banks that serve to increase the transmission capability of existing transmission lines and also provide dynamic stability benefits to the transmission system. In addition, the system includes a Thyristor Controlled Series Capacitor , which was initially built as a demonstration project, but now provides has operational benefits to the California-Oregon Intertie.
Power System Control (PSC)
BPA operates an extensive telecommunications and control system for operation of the transmission system. The telecommunications system covers BPA’s 300,000 square mile service territory with a mix of technologies. A variety of control systems provides high-speed clearing of power line faults, automatic response to changing system conditions, and visibility and control of substation equipment by power system dispatchers. Together these systems provide the data and controls necessary to ensure the reliability of the transmission system and maximize transfer capacity. The majority of control data used to operate the transmission system is carried over a combination of a point-to-point analog microwave system and a digital microwave and fiber optic system. These systems are an integral part of high-speed protective relaying, Remedial Action Schemes, SCADA, and generation dispatch systems. The telecommunications system also provides a means of voice communications between Substation Operators, maintenance crews, and BPA Dispatchers. Both microwave and fiber optic systems are interconnected with similar systems for neighboring utilities and control area operators for exchange of control, data, and voice information. While its primary purpose is for transmission system operation, protection and control, the telecommunications system also provides a network for internal administrative security, voice and data traffic. Control systems provide the means for Dispatch to monitor the condition of the system and respond to changing conditions. Through a combination of automated and Dispatch-initiated control actions, BPA is able to respond quickly to power system events across the Pacific Northwest. System Protection Control (SPC)
Protection and control assets consist of protective relaying, monitoring, metering and control systems at transmission substations. These assets protect transmission equipment from damage due to electrical and mechanical faults, support the reliability and stability of the transmission system, protect the public and personnel and provide local and remote control and monitoring of transmission equipment. They also provide accurate metering and control of the electrical grid. Control Centers
BPA’s two control centers provide secure and highly available dispatch locations, infrastructure, systems and tools to support the safe and reliable control and operation of the Northwest power system. In support of power system control and operation, the centralized systems and tools also provide real-time monitoring, analysis and simulation. The control centers provide geographically separate hot standby redundancy for critical operations and control functions; the centers are capable of providing back-up to each other for critical business systems. BPA’s communications infrastructure and control and monitoring equipment in the substations enable the centralized functions of the control center to harmoniously operate the system. Many control center systems facilitate increased system utilization (non-wires solutions) and reduction of operational staff in the field. Dittmer Control Center is located at the Ross Complex and the Munro Control Center is located adjacent to the Bell Substation. BPA’s Dispatch Training Facility is located at Ross and includes clones of the most critical control center systems. Tools, Equipment and Acquisition Program (TEAP)
The Transmission TEAP covers over 2,000 individual pieces of equipment. The equipment includes cranes, man-lifts (up to 180'), digger derrick trucks, pole trucks, trailers, crawler tractors, backhoes, snow cats, substation maintenance vans and small boom trucks. Specialized equipment for stringing conductor and overall maintenance of the transmission system is also covered by this program.
Integrated Program Review May 2010
4
T r a n s m i s s i o n A s s e t M a n a g e m e n t S t r a t e g y
B O N N E V I L L E P O W E R A D M I N I S T R A T I O N
Strategic environment
BPA owns and manages about three-fourths of the region’s high-voltage transmission assets, and BPA’s transmission system is the largest of 17 balancing authorities in the Pacific Northwest. This system spans approximately 300,000 square miles and much of four states (with service to four others), including more than 15,000 circuit miles of transmission lines and 289 substations. These assets deliver electric power, directly or indirectly, to a Northwest population of more than 12 million through four product categories:
• Transmission service to regional utilities and commercial, industrial and other loads; • Generation and line and load interconnections; • Interregional transfers of capacity and energy; and • Ancillary services, such as regulation and load following services.
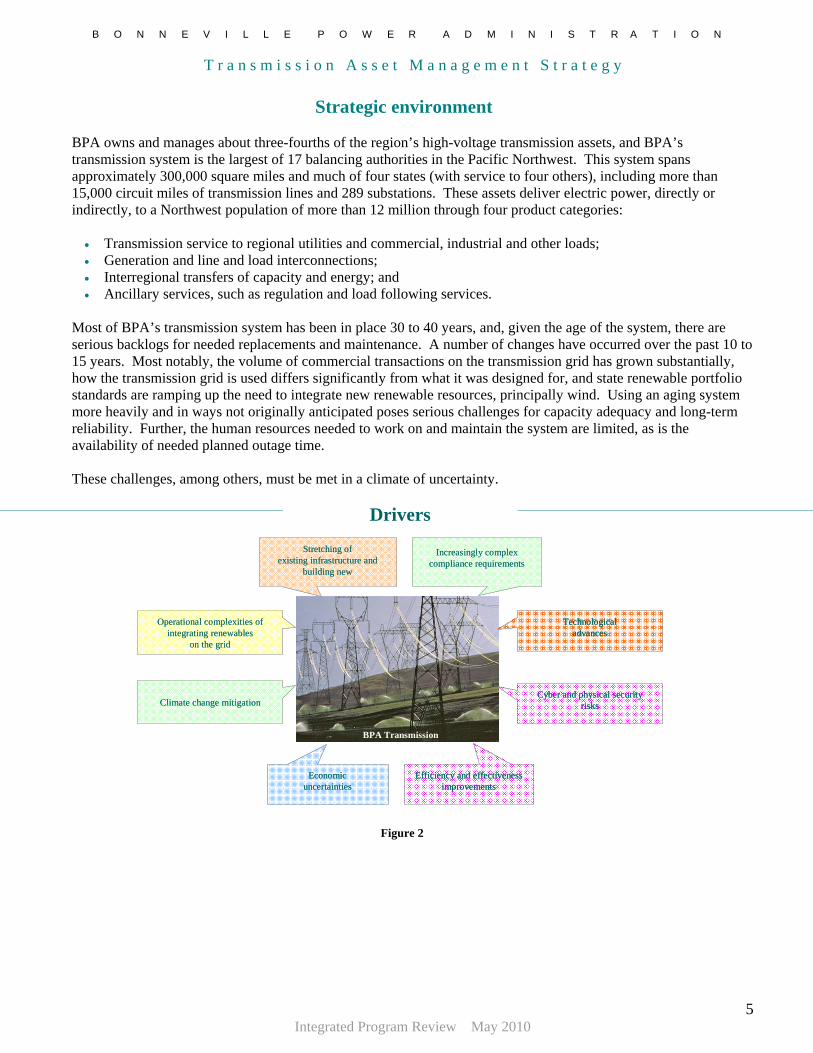
Most of BPA’s transmission system has been in place 30 to 40 years, and, given the age of the system, there are serious backlogs for needed replacements and maintenance. A number of changes have occurred over the past 10 to 15 years. Most notably, the volume of commercial transactions on the transmission grid has grown substantially, how the transmission grid is used differs significantly from what it was designed for, and state renewable portfolio standards are ramping up the need to integrate new renewable resources, principally wind. Using an aging system more heavily and in ways not originally anticipated poses serious challenges for capacity adequacy and long-term reliability. Further, the human resources needed to work on and maintain the system are limited, as is the availability of needed planned outage time. These challenges, among others, must be met in a climate of uncertainty.
BPA Transmission
Climate change mitigation
Increasingly complex compliance requirements
Operational complexities of integrating renewables
on the grid
Technological advances
Economicuncertainties
Stretching of existing infrastructure and
building new
Drivers
Efficiency and effectiveness improvements
Cyber and physical security risks
Figure 2
Integrated Program Review May 2010
5
T r a n s m i s s i o n A s s e t M a n a g e m e n t S t r a t e g y
B O N N E V I L L E P O W E R A D M I N I S T R A T I O N
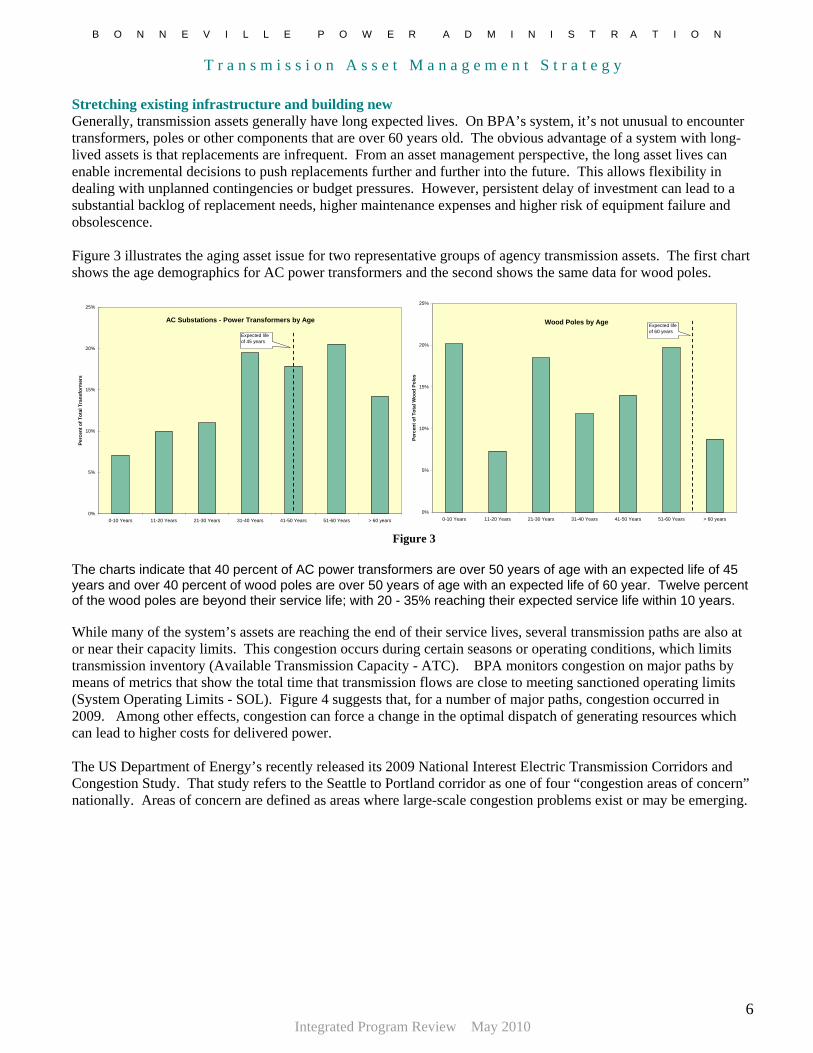
Stretching existing infrastructure and building new Generally, transmission assets generally have long expected lives. On BPA’s system, it’s not unusual to encounter transformers, poles or other components that are over 60 years old. The obvious advantage of a system with long-lived assets is that replacements are infrequent. From an asset management perspective, the long asset lives can enable incremental decisions to push replacements further and further into the future. This allows flexibility in dealing with unplanned contingencies or budget pressures. However, persistent delay of investment can lead to a substantial backlog of replacement needs, higher maintenance expenses and higher risk of equipment failure and obsolescence. Figure 3 illustrates the aging asset issue for two representative groups of agency transmission assets. The first chart shows the age demographics for AC power transformers and the second shows the same data for wood poles.
AC Substations - Power Transformers by Age
0%
5%
10%
15%
20%
25%
0-10 Years 11-20 Years 21-30 Years 31-40 Years 41-50 Years 51-60 Years > 60 years
Perc
ent o
f Tot
al T
rans
form
ers
Expected lifeof 45 years
Wood Poles by Age
0%
5%
10%
15%
20%
25%
0-10 Years 11-20 Years 21-30 Years 31-40 Years 41-50 Years 51-60 Years > 60 years
Perc
ent o
f Tot
al W
ood
Pole
s
Expected lifeof 60 years
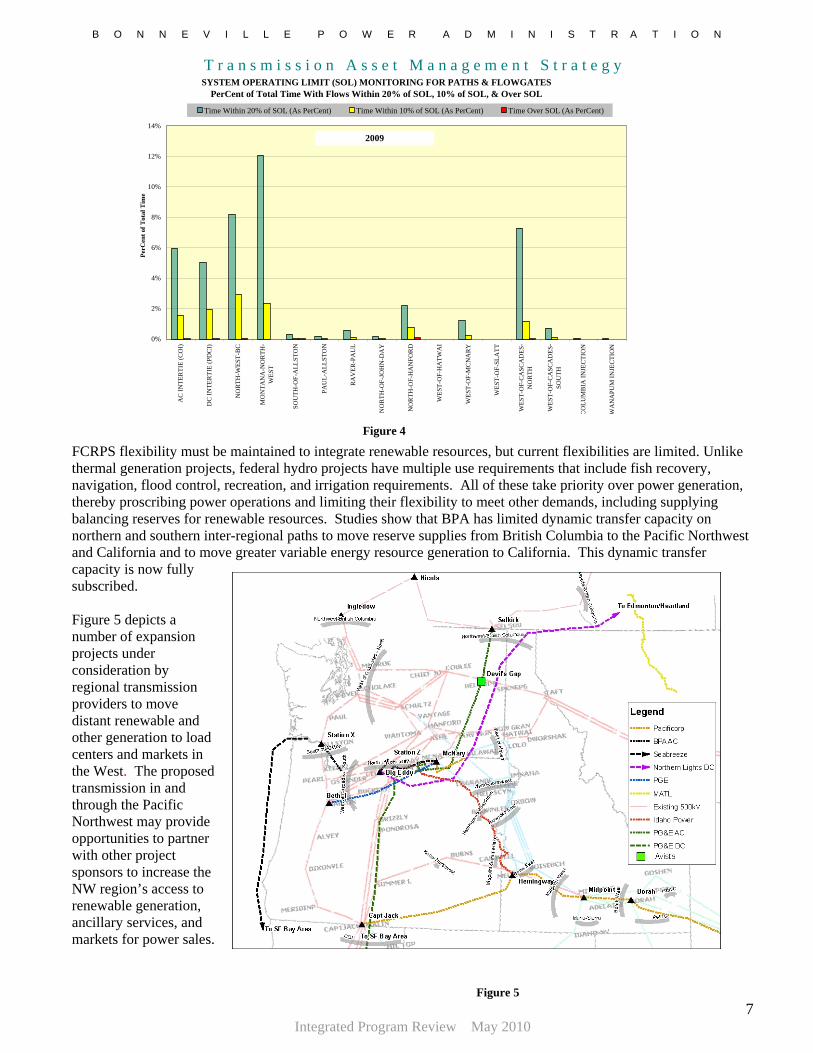
Figure 3 The charts indicate that 40 percent of AC power transformers are over 50 years of age with an expected life of 45 years and over 40 percent of wood poles are over 50 years of age with an expected life of 60 year. Twelve percent of the wood poles are beyond their service life; with 20 - 35% reaching their expected service life within 10 years. While many of the system’s assets are reaching the end of their service lives, several transmission paths are also at or near their capacity limits. This congestion occurs during certain seasons or operating conditions, which limits transmission inventory (Available Transmission Capacity - ATC). BPA monitors congestion on major paths by means of metrics that show the total time that transmission flows are close to meeting sanctioned operating limits (System Operating Limits - SOL). Figure 4 suggests that, for a number of major paths, congestion occurred in 2009. Among other effects, congestion can force a change in the optimal dispatch of generating resources which can lead to higher costs for delivered power. The US Department of Energy’s recently released its 2009 National Interest Electric Transmission Corridors and Congestion Study. That study refers to the Seattle to Portland corridor as one of four “congestion areas of concern” nationally. Areas of concern are defined as areas where large-scale congestion problems exist or may be emerging.
Integrated Program Review May 2010
6
T r a n s m i s s i o n A s s e t M a n a g e m e n t S t r a t e g y
B O N N E V I L L E P O W E R A D M I N I S T R A T I O N
SYSTEM OPERATING LIMIT (SOL) MONITORING FOR PATHS & FLOWGATESPerCent of Total Time With Flows Within 20% of SOL, 10% of SOL, & Over SOL
0%
2%
4%
6%
8%
10%
12%
14%
AC
INTE
RTI
E (C
OI)
DC
INTE
RTI
E (P
DC
I)
NO
RTH
-WES
T-B
C
MO
NTA
NA
-NO
RTH
-W
EST
SOU
TH-O
F-A
LLST
ON
PAU
L-A
LLST
ON
RA
VER
-PA
UL
NO
RTH
-OF-
JOH
N-D
AY
NO
RTH
-OF-
HA
NFO
RD
WES
T-O
F-H
ATW
AI
WES
T-O
F-M
CN
AR
Y
WES
T-O
F-SL
ATT
WES
T-O
F-C
ASC
AD
ES-
NO
RTH
WES
T-O
F-C
ASC
AD
ES-
SOU
TH
CO
LUM
BIA
INJE
CTI
ON
WA
NA
PUM
INJE
CTI
ON
PerC
ent o
f Tot
al T
ime
Time Within 20% of SOL (As PerCent) Time Within 10% of SOL (As PerCent) Time Over SOL (As PerCent)
2009
Integrated Program Review May 2010
7
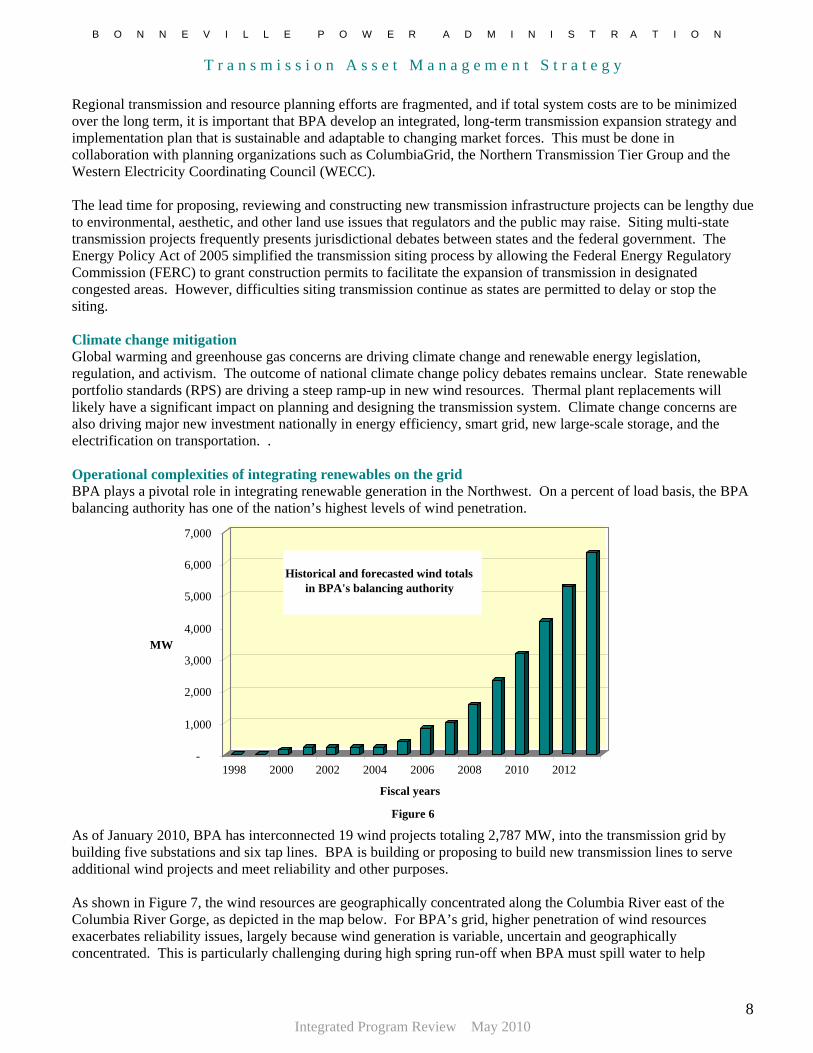
FCRPS flexibility must be maintained to integrate renewable resources, but current flexibilities are limited. Unlike thermal generation projects, federal hydro projects have multiple use requirements that include fish recovery, navigation, flood control, recreation, and irrigation requirements. All of these take priority over power generation, thereby proscribing power operations and limiting their flexibility to meet other demands, including supplying balancing reserves for renewable resources. Studies show that BPA has limited dynamic transfer capacity on northern and southern inter-regional paths to move reserve supplies from British Columbia to the Pacific Northwest and California and to move greater variable energy resource generation to California. This dynamic transfer capacity is now fully subscribed.
Figure 4
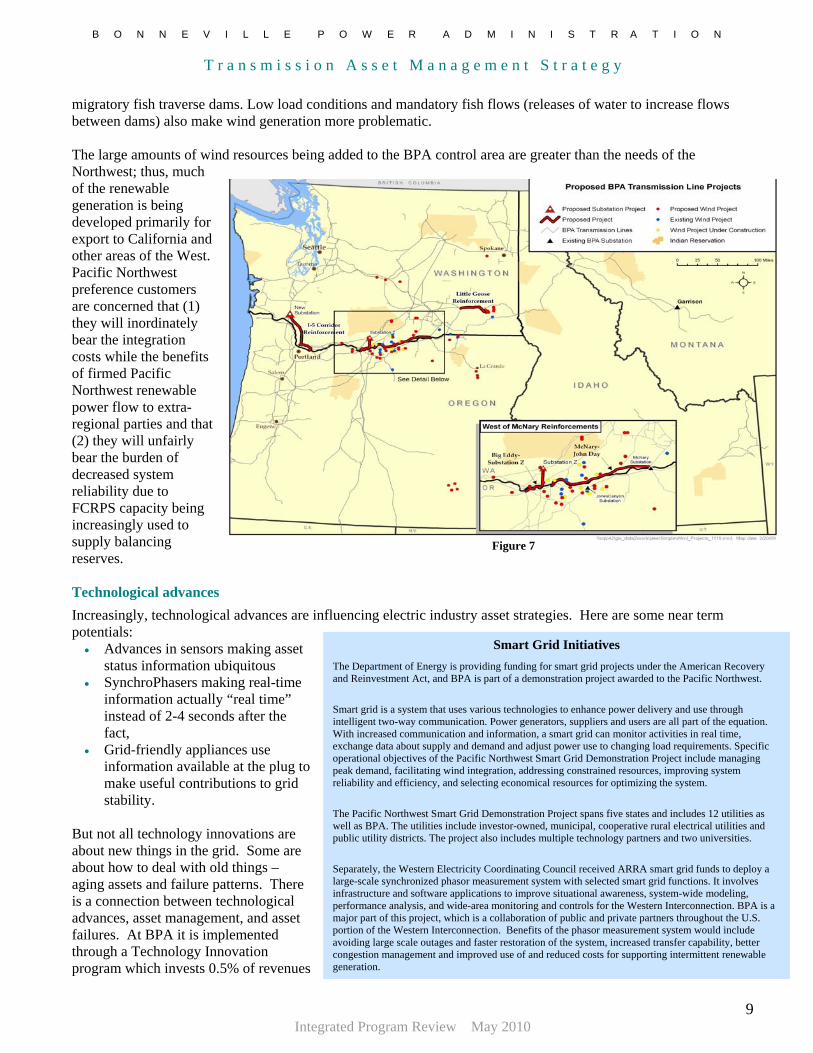
Figure 5 depicts a number of expansion projects under consideration by regional transmission providers to move distant renewable and other generation to load centers and markets in the West. The proposed transmission in and through the Pacific Northwest may provide opportunities to partner with other project sponsors to increase the NW region’s access to renewable generation, ancillary services, and markets for power sales.
Figure 5
T r a n s m i s s i o n A s s e t M a n a g e m e n t S t r a t e g y
B O N N E V I L L E P O W E R A D M I N I S T R A T I O N
Regional transmission and resource planning efforts are fragmented, and if total system costs are to be minimized over the long term, it is important that BPA develop an integrated, long-term transmission expansion strategy and implementation plan that is sustainable and adaptable to changing market forces. This must be done in collaboration with planning organizations such as ColumbiaGrid, the Northern Transmission Tier Group and the Western Electricity Coordinating Council (WECC). The lead time for proposing, reviewing and constructing new transmission infrastructure projects can be lengthy due to environmental, aesthetic, and other land use issues that regulators and the public may raise. Siting multi-state transmission projects frequently presents jurisdictional debates between states and the federal government. The Energy Policy Act of 2005 simplified the transmission siting process by allowing the Federal Energy Regulatory Commission (FERC) to grant construction permits to facilitate the expansion of transmission in designated congested areas. However, difficulties siting transmission continue as states are permitted to delay or stop the siting. Climate change mitigation Global warming and greenhouse gas concerns are driving climate change and renewable energy legislation, regulation, and activism. The outcome of national climate change policy debates remains unclear. State renewable portfolio standards (RPS) are driving a steep ramp-up in new wind resources. Thermal plant replacements will likely have a significant impact on planning and designing the transmission system. Climate change concerns are also driving major new investment nationally in energy efficiency, smart grid, new large-scale storage, and the electrification on transportation. . Operational complexities of integrating renewables on the grid BPA plays a pivotal role in integrating renewable generation in the Northwest. On a percent of load basis, the BPA balancing authority has one of the nation’s highest levels of wind penetration.
Historical and forecasted wind totals
in BPA's balancing authority
2012 201020082006200420022000 1998
7,000
6,000
5,000
4,000MW
3,000
2,000
1,000
-
Fiscal years Figure 6
As of January 2010, BPA has interconnected 19 wind projects totaling 2,787 MW, into the transmission grid by building five substations and six tap lines. BPA is building or proposing to build new transmission lines to serve additional wind projects and meet reliability and other purposes. As shown in Figure 7, the wind resources are geographically concentrated along the Columbia River east of the Columbia River Gorge, as depicted in the map below. For BPA’s grid, higher penetration of wind resources exacerbates reliability issues, largely because wind generation is variable, uncertain and geographically concentrated. This is particularly challenging during high spring run-off when BPA must spill water to help
Integrated Program Review May 2010
8
T r a n s m i s s i o n A s s e t M a n a g e m e n t S t r a t e g y
B O N N E V I L L E P O W E R A D M I N I S T R A T I O N
migratory fish traverse dams. Low load conditions and mandatory fish flows (releases of water to increase flows between dams) also make wind generation more problematic. The large amounts of wind resources being added to the BPA control area are greater than the needs of the Northwest; thus, much of the renewable generation is being developed primarily for export to California and other areas of the West. Pacific Northwest preference customers are concerned that (1) they will inordinately bear the integration costs while the benefits of firmed Pacific Northwest renewable power flow to extra-regional parties and that (2) they will unfairly bear the burden of decreased system reliability due to FCRPS capacity being increasingly used to supply balancing reserves.
Figure 7
Technological advances
Smart Grid Initiatives The Department of Energy is providing funding for smart grid projects under the American Recovery and Reinvestment Act, and BPA is part of a demonstration project awarded to the Pacific Northwest.
Smart grid is a system that uses various technologies to enhance power delivery and use through intelligent two-way communication. Power generators, suppliers and users are all part of the equation. With increased communication and information, a smart grid can monitor activities in real time, exchange data about supply and demand and adjust power use to changing load requirements. Specific operational objectives of the Pacific Northwest Smart Grid Demonstration Project include managing peak demand, facilitating wind integration, addressing constrained resources, improving system reliability and efficiency, and selecting economical resources for optimizing the system.
The Pacific Northwest Smart Grid Demonstration Project spans five states and includes 12 utilities as well as BPA. The utilities include investor-owned, municipal, cooperative rural electrical utilities and public utility districts. The project also includes multiple technology partners and two universities.
Separately, the Western Electricity Coordinating Council received ARRA smart grid funds to deploy a large-scale synchronized phasor measurement system with selected smart grid functions. It involves infrastructure and software applications to improve situational awareness, system-wide modeling, performance analysis, and wide-area monitoring and controls for the Western Interconnection. BPA is a major part of this project, which is a collaboration of public and private partners throughout the U.S. portion of the Western Interconnection. Benefits of the phasor measurement system would include avoiding large scale outages and faster restoration of the system, increased transfer capability, better congestion management and improved use of and reduced costs for supporting intermittent renewable generation.
Increasingly, technological advances are influencing electric industry asset strategies. Here are some near term potentials:
• Advances in sensors making asset status information ubiquitous
• SynchroPhasers making real-time information actually “real time” instead of 2-4 seconds after the fact,
• Grid-friendly appliances use information available at the plug to make useful contributions to grid stability.
But not all technology innovations are about new things in the grid. Some are about how to deal with old things – aging assets and failure patterns. There is a connection between technological advances, asset management, and asset failures. At BPA it is implemented through a Technology Innovation program which invests 0.5% of revenues
Integrated Program Review May 2010
9
T r a n s m i s s i o n A s s e t M a n a g e m e n t S t r a t e g y
B O N N E V I L L E P O W E R A D M I N I S T R A T I O N
(approximately $18 million annually) in a disciplined program of research demonstration and development focused on business challenges BPA faces. . Increasingly complex compliance requirements Following the East Coast blackout of 2003, Congress passed the Energy Policy Act of 2005 (EPAct of 2005) granting FERC the authority to require mandatory reliability standards for the U.S. electrical grid. FERC delegated its reliability regulatory authority to the North American Electric Reliability Corporation (NERC) and its regional regulatory authority to the Western Electricity Coordinating Council (WECC) and seven other regional entities. Today, there are over 100 mandatory reliability standards and FERC, NERC and the regional regulatory authorities are actively engaged in assessing penalties, both monetary and non-monetary, for instances of noncompliance. One landmark agreement, the only agreement to date to be negotiated directly with FERC, resulted in a $25 million civil penalty for Florida Power & Light Co. stemming from a February 2008 blackout that lasted several hours and disrupted power to millions of consumers in south Florida. Reliability standards are evolving to cover a wider range of contingencies than power systems were originally planned to meet. There is also a drive within NERC toward results-based standards, and major overhauls in the NERC-CIP standards are currently underway. While some standards, in particular those that are considered top priorities by NERC and FERC, are tending to increase in scope and complexity, efforts are underway to decrease the complexity of other standards (such as Protection and Control - PRC). Economic uncertainties Recovery from the economic recession poses difficult challenges for our nation, and particularly the Pacific Northwest where job losses continue to outpace those of other regions and ranges from about 9 percent to 11 percent. The pace and duration of the economic recovery remains unclear. However, it is expected to be slow and long, with job recovery lagging well behind advances in gross domestic product as employers seek higher productivity from the existing workforce. The public and private sectors share deep concerns about ensuring their own and BPA’s cost-effectiveness. Low rates for services will continue to be a focus internally and externally. State governments, the business sector, and the public are looking to the federal government to provide leadership in finding and facilitating solutions to the nation’s economic problems. The federal government has responded with a range of measures, including the American Recovery and Reinvestment Act, to restore confidence, stimulated economic growth and create jobs. The ARRA provided BPA an increase of $3.25 billion to its Treasury borrowing authority, which will be invested largely in building transmission lines and facilities to support the integration of renewable energy resources and to ensure continued system reliability.
Integrated Program Review May 2010
10
T r a n s m i s s i o n A s s e t M a n a g e m e n t S t r a t e g y
B O N N E V I L L E P O W E R A D M I N I S T R A T I O N
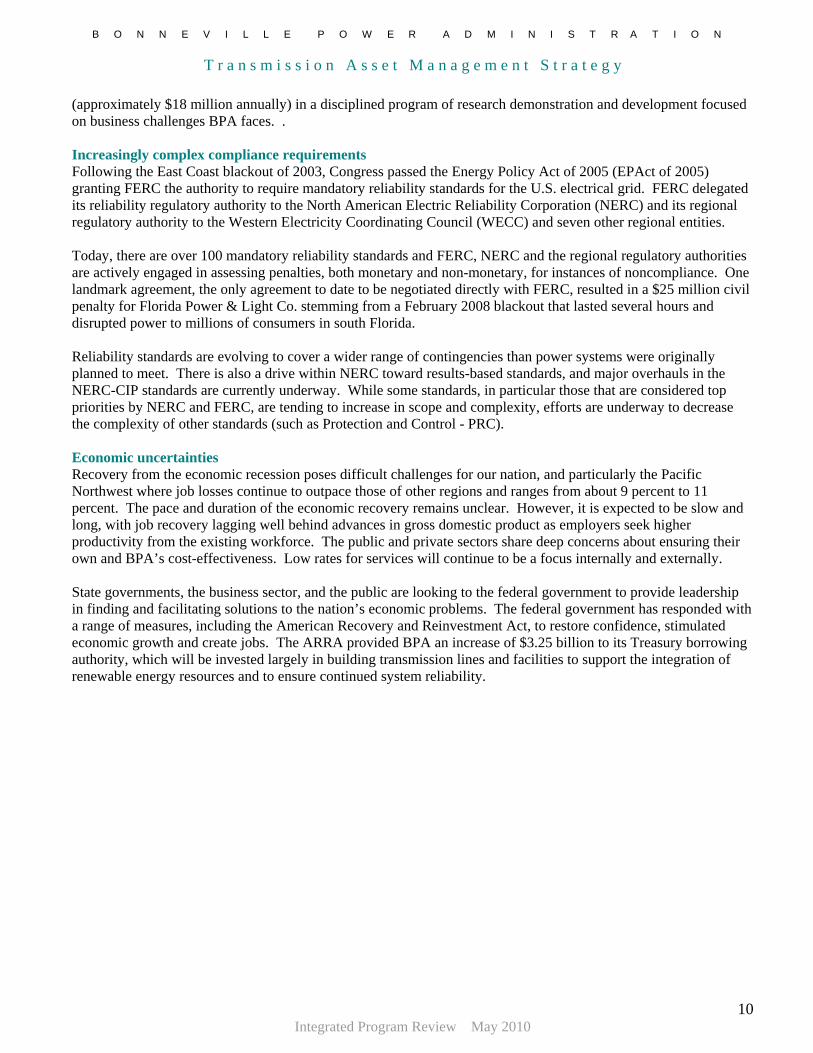
Load dynamics Loads throughout the Northwest continue to grow, although at a somewhat slower rate than in previous years due to the current economic downturn. The locations and rates of load growth vary across the region. These differences can complicate transmission planning. Historically, the Pacific Northwest has been a winter peaking system. This means that the highest loads typically occurred during the winter when cold weather causes increased use of electric resistance heaters. Over time, however, in many parts of the Northwest, peak summer load levels have been catching up with the winter levels. This is primarily due to a greater percentage of air conditioning being installed in homes and businesses. This shift presents new challenges: (1) transmission equipment typically has lower capacity under warm summer conditions, and (2) air conditioners have different load characteristics than electric resistance heaters, which affects the models and plans for system expansion.
Firm Obligation Forecast BPA Balancing Authority
(Non-coincidental peaks)
11,000
11,500
12,000
12,500
13,000
13,500
14,000
14,500
15,000
Jan-
10Ju
l-10
Jan-
11Ju
l-11
Jan-
12Ju
l-12
Jan-
13Ju
l-13
Jan-
14Ju
l-14
Jan-
15Ju
l-15
Jan-
16Ju
l-16
Jan-
17Ju
l-17
Jan-
18Ju
l-18
Jan-
19Ju
l-19
Jan-
20Ju
l-20
Jan-
21Ju
l-21
Jan-
22Ju
l-22
Jan-
23Ju
l-23
Jan-
24Ju
l-24
MW
1,400
1,500
1,600
1,700
1,800
1,900
2,000
MW
Summer Peak
Winter Peak
Difference in Peaks
Figure 8 Source: BPA -KSL, Load Forecasting and Analysis)
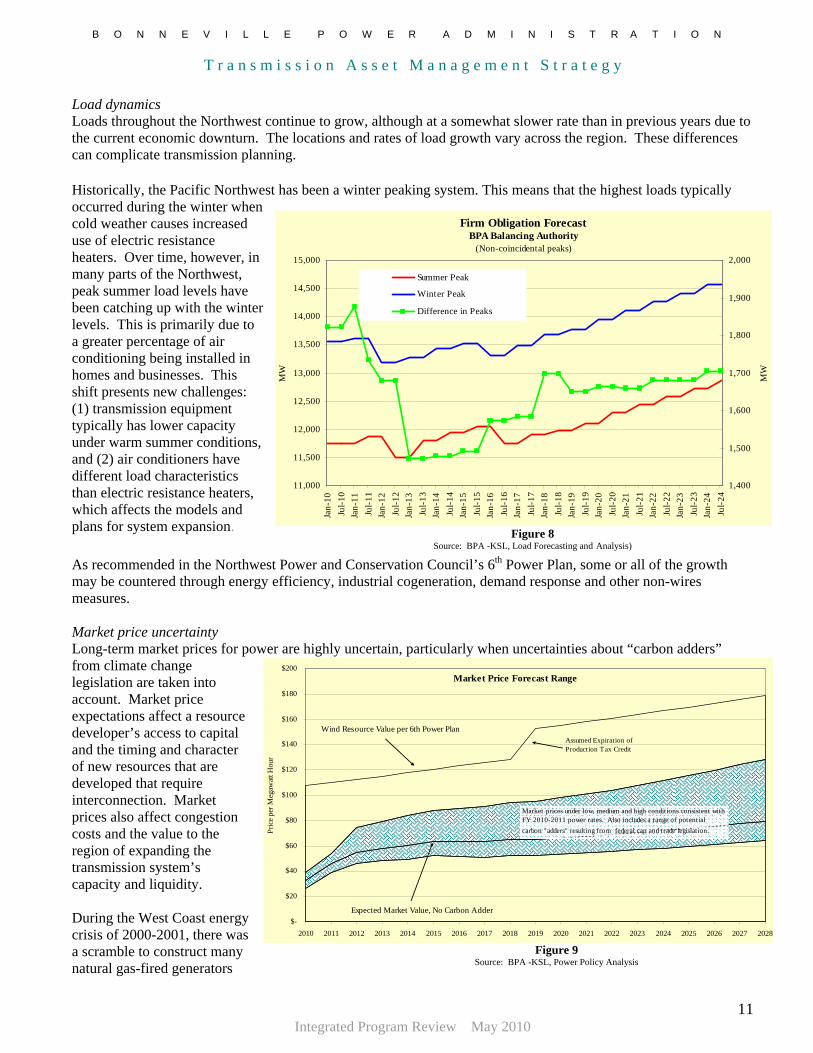
As recommended in the Northwest Power and Conservation Council’s 6th Power Plan, some or all of the growth may be countered through energy efficiency, industrial cogeneration, demand response and other non-wires measures. Market price uncertainty Long-term market prices for power are highly uncertain, particularly when uncertainties about “carbon adders” from climate change legislation are taken into account. Market price expectations affect a resource developer’s access to capital and the timing and character of new resources that are developed that require interconnection. Market prices also affect congestion costs and the value to the region of expanding the transmission system’s capacity and liquidity.
Market Price Forecast Range
$-
$20
$40
$60
$80
$100
$120
$140
$160
$180
$200
2010 2011 2012 2013 2014 2015 2016 2017 2018 2019 2020 2021 2022 2023 2024 2025 2026 2027 2028
Pric
e pe
r Meg
awat
t Hou
r
Expected Market Value, No Carbon Adder
Wind Resource Value per 6th Power PlanAssumed Expiration of Production Tax Credit
Market prices under low, medium and high conditions consistent with FY 2010-2011 power rates. Also includes a range of potential carbon "adders" resulting from federal cap and trade legislation.
During the West Coast energy crisis of 2000-2001, there was a scramble to construct many Figure 9
Source: BPA -KSL, Power Policy Analysis natural gas-fired generators
Integrated Program Review May 2010
11
T r a n s m i s s i o n A s s e t M a n a g e m e n t S t r a t e g y
B O N N E V I L L E P O W E R A D M I N I S T R A T I O N
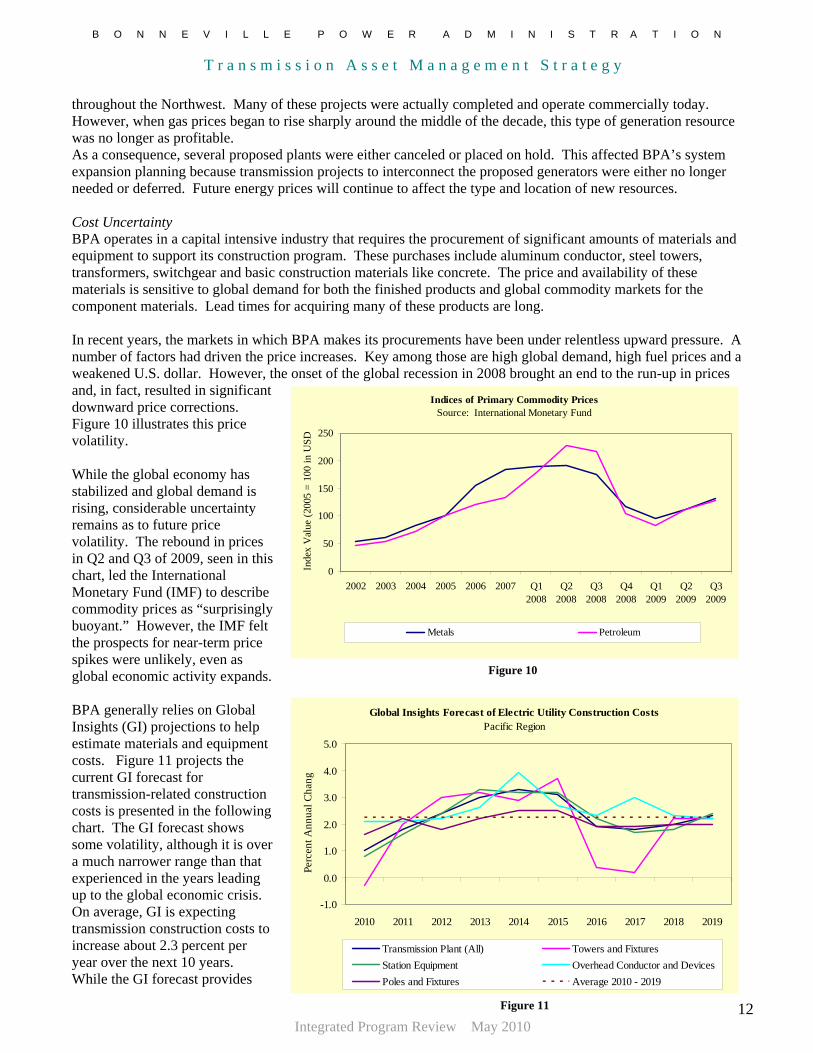
throughout the Northwest. Many of these projects were actually completed and operate commercially today. However, when gas prices began to rise sharply around the middle of the decade, this type of generation resource was no longer as profitable. As a consequence, several proposed plants were either canceled or placed on hold. This affected BPA’s system expansion planning because transmission projects to interconnect the proposed generators were either no longer needed or deferred. Future energy prices will continue to affect the type and location of new resources. Cost Uncertainty BPA operates in a capital intensive industry that requires the procurement of significant amounts of materials and equipment to support its construction program. These purchases include aluminum conductor, steel towers, transformers, switchgear and basic construction materials like concrete. The price and availability of these materials is sensitive to global demand for both the finished products and global commodity markets for the component materials. Lead times for acquiring many of these products are long. In recent years, the markets in which BPA makes its procurements have been under relentless upward pressure. A number of factors had driven the price increases. Key among those are high global demand, high fuel prices and a weakened U.S. dollar. However, the onset of the global recession in 2008 brought an end to the run-up in prices and, in fact, resulted in significant downward price corrections. Figure 10 illustrates this price volatility.
Indices of Primary Commodity PricesSource: International Monetary Fund
0
50
100
150
200
250
2002 2003 2004 2005 2006 2007 Q12008
Q22008
Q32008
Q42008
Q12009
Q22009
Q32009
Inde
x V
alue
(200
5 =
100
in U
SD
Metals Petroleum
While the global economy has stabilized and global demand is rising, considerable uncertainty remains as to future price volatility. The rebound in prices in Q2 and Q3 of 2009, seen in this chart, led the International Monetary Fund (IMF) to describe commodity prices as “surprisingly buoyant.” However, the IMF felt the prospects for near-term price spikes were unlikely, even as global economic activity expands. Figure 10
Global Insights Forecast of Electric Utility Construction Costs
Pacific Region
-1.0
0.0
1.0
2.0
3.0
4.0
5.0
2010 2011 2012 2013 2014 2015 2016 2017 2018 2019
Perc
ent A
nnua
l Cha
ng
Transmission Plant (All) Towers and FixturesStation Equipment Overhead Conductor and DevicesPoles and Fixtures Average 2010 - 2019
BPA generally relies on Global Insights (GI) projections to help estimate materials and equipment costs. Figure 11 projects the current GI forecast for transmission-related construction costs is presented in the following chart. The GI forecast shows some volatility, although it is over a much narrower range than that experienced in the years leading up to the global economic crisis. On average, GI is expecting transmission construction costs to increase about 2.3 percent per year over the next 10 years. While the GI forecast provides
Integrated Program Review May 2010
12Figure 11
T r a n s m i s s i o n A s s e t M a n a g e m e n t S t r a t e g y
B O N N E V I L L E P O W E R A D M I N I S T R A T I O N
some indication of relative price stability, the factors that drove the previous run-up in prices could reappear should the global recovery gain momentum rapidly. It is clear that BPA will be operating in an environment of uncertainty with respect to construction and commodity costs for the foreseeable future. The agency has acted to limit its exposure to volatile markets, in particular, by establishing long-term contractual relationships (strategic alliances) with key suppliers. These arrangements control procurement costs by consolidating and coordinating purchases. They also ensure reliable delivery and reduce lead times by reserving production capacity in the vendors’ manufacturing processes. Some form of hedging is another possibility to manage price volatility. To date, the agency has not attempted to hedge commodity prices, but is now investigating the practicality of implementing a commodity hedging program. Taken together, these efforts will provide some measure of control if high price volatility recurs.
Integrated Program Review May 2010
13
T r a n s m i s s i o n A s s e t M a n a g e m e n t S t r a t e g y
B O N N E V I L L E P O W E R A D M I N I S T R A T I O N
Strategic direction
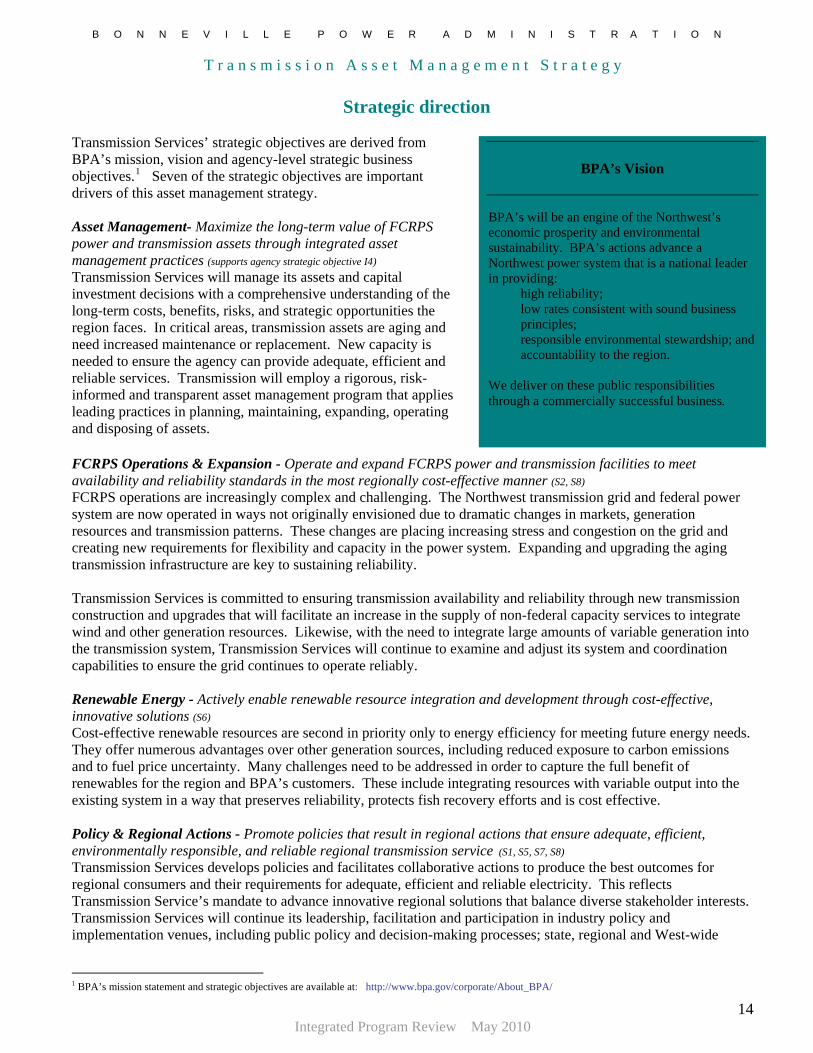
Transmission Services’ strategic objectives are derived from BPA’s mission, vision and agency-level strategic business objectives.1 Seven of the strategic objectives are important drivers of this asset management strategy.
Asset Management- Maximize the long-term value of FCRPS power and transmission assets through integrated asset management practices (supports agency strategic objective I4) Transmission Services will manage its assets and capital investment decisions with a comprehensive understanding of the long-term costs, benefits, risks, and strategic opportunities the region faces. In critical areas, transmission assets are aging and need increased maintenance or replacement. New capacity is needed to ensure the agency can provide adequate, efficient and reliable services. Transmission will employ a rigorous, risk-informed and transparent asset management program that applies leading practices in planning, maintaining, expanding, operating and disposing of assets. FCRPS Operations & Expansion - Operate and expand FCRPS power and transmission facilities to meet availability and reliability standards in the most regionally cost-effective manner (S2, S8) FCRPS operations are increasingly complex and challenging. The Northwest transmission grid and federal power system are now operated in ways not originally envisioned due to dramatic changes in markets, generation resources and transmission patterns. These changes are placing increasing stress and congestion on the grid and creating new requirements for flexibility and capacity in the power system. Expanding and upgrading the aging transmission infrastructure are key to sustaining reliability. Transmission Services is committed to ensuring transmission availability and reliability through new transmission construction and upgrades that will facilitate an increase in the supply of non-federal capacity services to integrate wind and other generation resources. Likewise, with the need to integrate large amounts of variable generation into the transmission system, Transmission Services will continue to examine and adjust its system and coordination capabilities to ensure the grid continues to operate reliably. Renewable Energy - Actively enable renewable resource integration and development through cost-effective, innovative solutions (S6) Cost-effective renewable resources are second in priority only to energy efficiency for meeting future energy needs. They offer numerous advantages over other generation sources, including reduced exposure to carbon emissions and to fuel price uncertainty. Many challenges need to be addressed in order to capture the full benefit of renewables for the region and BPA’s customers. These include integrating resources with variable output into the existing system in a way that preserves reliability, protects fish recovery efforts and is cost effective.
Policy & Regional Actions - Promote policies that result in regional actions that ensure adequate, efficient, environmentally responsible, and reliable regional transmission service (S1, S5, S7, S8) Transmission Services develops policies and facilitates collaborative actions to produce the best outcomes for regional consumers and their requirements for adequate, efficient and reliable electricity. This reflects Transmission Service’s mandate to advance innovative regional solutions that balance diverse stakeholder interests. Transmission Services will continue its leadership, facilitation and participation in industry policy and implementation venues, including public policy and decision-making processes; state, regional and West-wide
BPA’s Vision
BPA’s will be an engine of the Northwest’s economic prosperity and environmental sustainability. BPA’s actions advance a Northwest power system that is a national leader in providing:
• high reliability; • low rates consistent with sound business
principles; • responsible environmental stewardship; and • accountability to the region.
We deliver on these public responsibilities through a commercially successful business.
1 BPA’s mission statement and strategic objectives are available at: http://www.bpa.gov/corporate/About_BPA/
Integrated Program Review May 2010
14
T r a n s m i s s i o n A s s e t M a n a g e m e n t S t r a t e g y
B O N N E V I L L E P O W E R A D M I N I S T R A T I O N
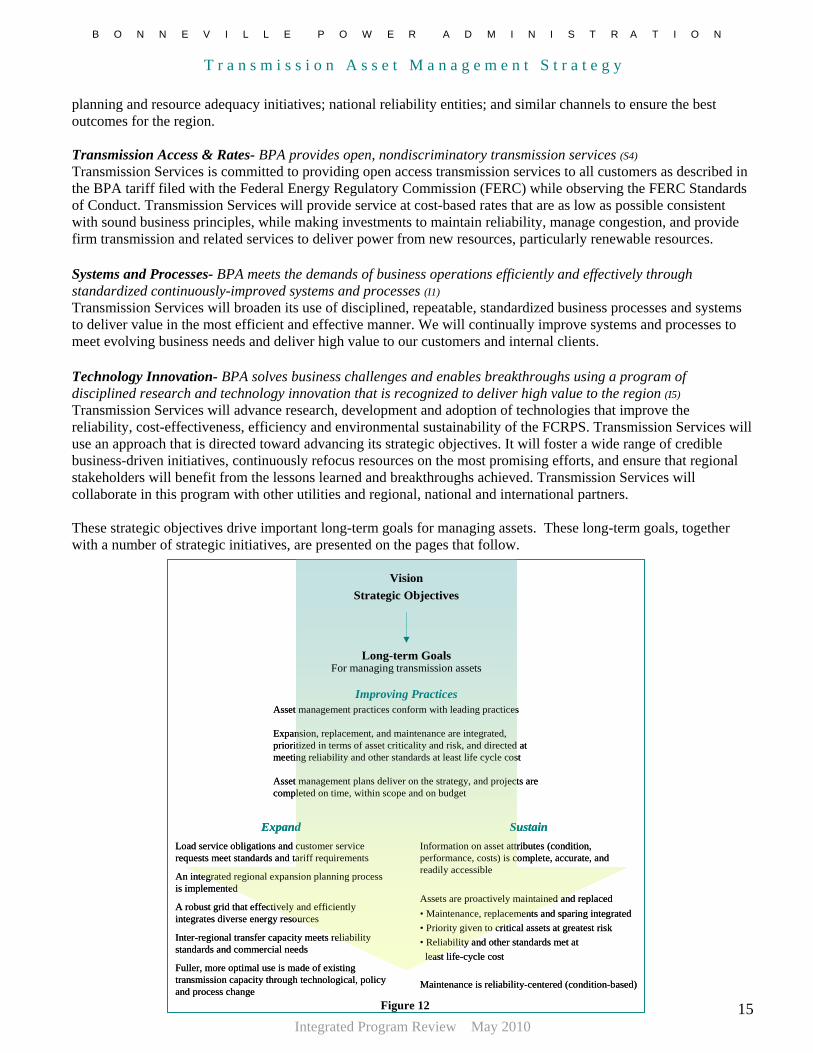
planning and resource adequacy initiatives; national reliability entities; and similar channels to ensure the best outcomes for the region. Transmission Access & Rates- BPA provides open, nondiscriminatory transmission services (S4) Transmission Services is committed to providing open access transmission services to all customers as described in the BPA tariff filed with the Federal Energy Regulatory Commission (FERC) while observing the FERC Standards of Conduct. Transmission Services will provide service at cost-based rates that are as low as possible consistent with sound business principles, while making investments to maintain reliability, manage congestion, and provide firm transmission and related services to deliver power from new resources, particularly renewable resources. Systems and Processes- BPA meets the demands of business operations efficiently and effectively through standardized continuously-improved systems and processes (I1) Transmission Services will broaden its use of disciplined, repeatable, standardized business processes and systems to deliver value in the most efficient and effective manner. We will continually improve systems and processes to meet evolving business needs and deliver high value to our customers and internal clients. Technology Innovation- BPA solves business challenges and enables breakthroughs using a program of disciplined research and technology innovation that is recognized to deliver high value to the region (I5) Transmission Services will advance research, development and adoption of technologies that improve the reliability, cost-effectiveness, efficiency and environmental sustainability of the FCRPS. Transmission Services will use an approach that is directed toward advancing its strategic objectives. It will foster a wide range of credible business-driven initiatives, continuously refocus resources on the most promising efforts, and ensure that regional stakeholders will benefit from the lessons learned and breakthroughs achieved. Transmission Services will collaborate in this program with other utilities and regional, national and international partners. These strategic objectives drive important long-term goals for managing assets. These long-term goals, together with a number of strategic initiatives, are presented on the pages that follow.
Integrated Program Review May 2010
15
ExpandLoad service obligations and customer service requests meet standards and tariff requirements
An integrated regional expansion planning process is implemented
A robust grid that effectively and efficiently integrates diverse energy resources
Inter-regional transfer capacity meets reliability standards and commercial needs
Fuller, more optimal use is made of existing transmission capacity through technological, policy and process change
SustainInformation on asset attributes (condition, performance, costs) is complete, accurate, and readily accessible
Assets are proactively maintained and replaced• Maintenance, replacements and sparing integrated• Priority given to critical assets at greatest risk• Reliability and other standards met at
least life-cycle cost
Maintenance is reliability-centered (condition-based)
Long-term GoalsFor managing transmission assets
Improving PracticesAsset management practices conform with leading practices
Expansion, replacement, and maintenance are integrated, prioritized in terms of asset criticality and risk, and directed at meeting reliability and other standards at least life cycle cost
Asset management plans deliver on the strategy, and projects arecompleted on time, within scope and on budget
VisionStrategic Objectives
Figure 12
T r a n s m i s s i o n A s s e t M a n a g e m e n t S t r a t e g y
B O N N E V I L L E P O W E R A D M I N I S T R A T I O N
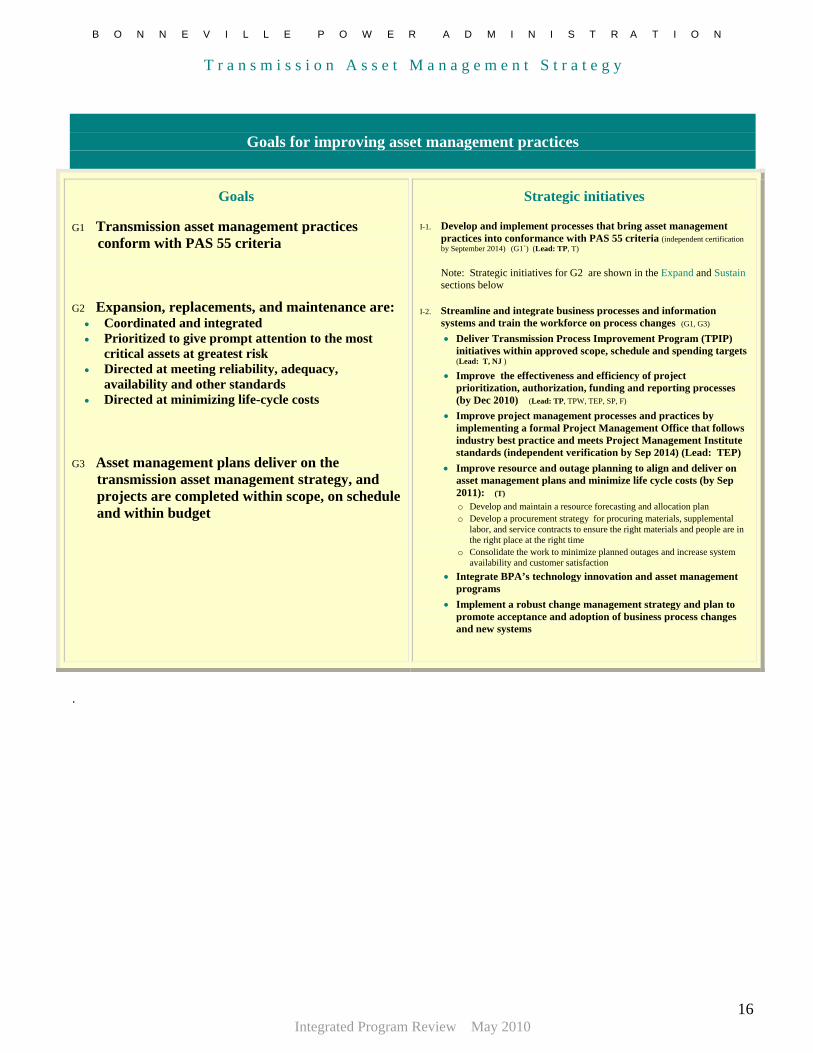
Goals for improving asset management practices
Goals
G1 Transmission asset management practices conform with PAS 55 criteria
G2 Expansion, replacements, and maintenance are: • Coordinated and integrated • Prioritized to give prompt attention to the most
critical assets at greatest risk • Directed at meeting reliability, adequacy,
availability and other standards • Directed at minimizing life-cycle costs
G3 Asset management plans deliver on the transmission asset management strategy, and projects are completed within scope, on schedule and within budget
Strategic initiatives
I-1. Develop and implement processes that bring asset management practices into conformance with PAS 55 criteria (independent certification by September 2014) (G1`) (Lead: TP, T)
Note: Strategic initiatives for G2 are shown in the Expand and Sustain sections below
I-2. Streamline and integrate business processes and information systems and train the workforce on process changes (G1, G3) • Deliver Transmission Process Improvement Program (TPIP)
initiatives within approved scope, schedule and spending targets (Lead: T, NJ )
• Improve the effectiveness and efficiency of project prioritization, authorization, funding and reporting processes (by Dec 2010) (Lead: TP, TPW, TEP, SP, F)
• Improve project management processes and practices by implementing a formal Project Management Office that follows industry best practice and meets Project Management Institute standards (independent verification by Sep 2014) (Lead: TEP)
• Improve resource and outage planning to align and deliver on asset management plans and minimize life cycle costs (by Sep 2011): (T)
o Develop and maintain a resource forecasting and allocation plan o Develop a procurement strategy for procuring materials, supplemental
labor, and service contracts to ensure the right materials and people are in the right place at the right time
o Consolidate the work to minimize planned outages and increase system availability and customer satisfaction
• Integrate BPA’s technology innovation and asset management programs
• Implement a robust change management strategy and plan to promote acceptance and adoption of business process changes and new systems
.
Integrated Program Review May 2010
16
T r a n s m i s s i o n A s s e t M a n a g e m e n t S t r a t e g y
B O N N E V I L L E P O W E R A D M I N I S T R A T I O N
Goals for expanding transmission
Goals
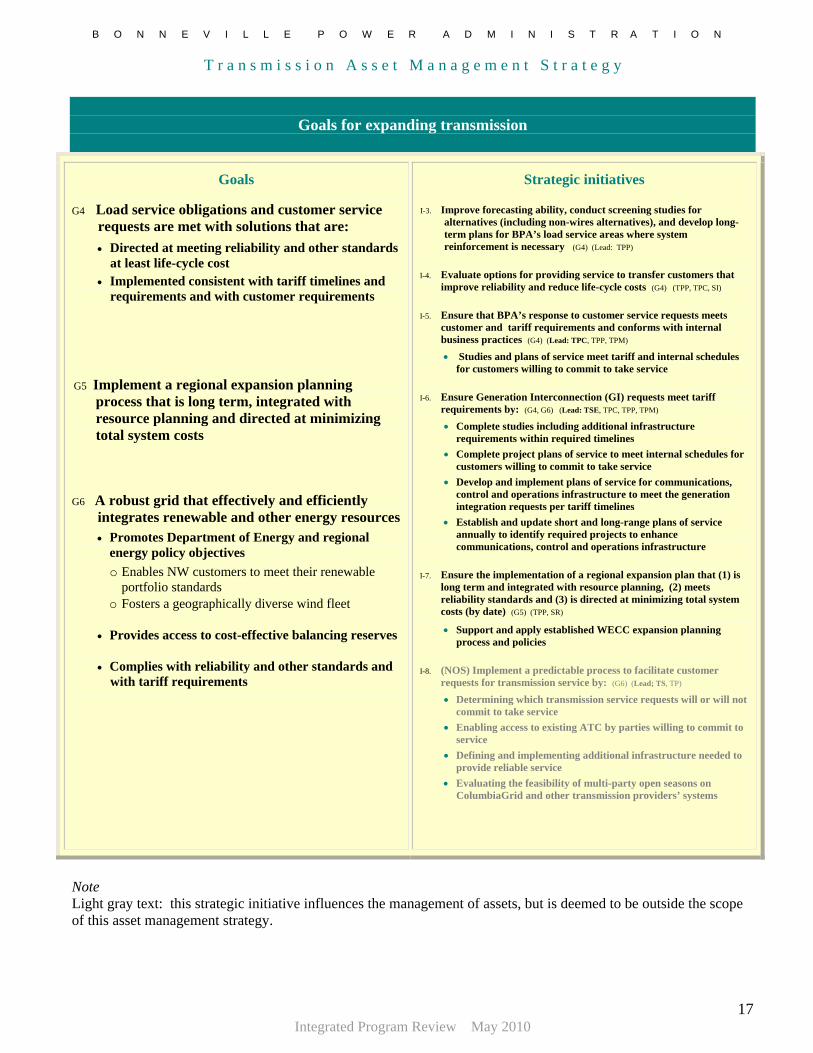
G4 Load service obligations and customer service requests are met with solutions that are: • Directed at meeting reliability and other standards
at least life-cycle cost • Implemented consistent with tariff timelines and
requirements and with customer requirements
G5 Implement a regional expansion planning process that is long term, integrated with resource planning and directed at minimizing total system costs
G6 A robust grid that effectively and efficiently integrates renewable and other energy resources • Promotes Department of Energy and regional
energy policy objectives o Enables NW customers to meet their renewable
portfolio standards o Fosters a geographically diverse wind fleet
• Provides access to cost-effective balancing reserves
• Complies with reliability and other standards and with tariff requirements
Strategic initiatives
I-3. Improve forecasting ability, conduct screening studies for alternatives (including non-wires alternatives), and develop long-term plans for BPA’s load service areas where system reinforcement is necessary (G4) (Lead: TPP)
I-4. Evaluate options for providing service to transfer customers that improve reliability and reduce life-cycle costs (G4) (TPP, TPC, SI)
I-5. Ensure that BPA’s response to customer service requests meets customer and tariff requirements and conforms with internal business practices (G4) (Lead: TPC, TPP, TPM)
• Studies and plans of service meet tariff and internal schedules for customers willing to commit to take service
I-6. Ensure Generation Interconnection (GI) requests meet tariff requirements by: (G4, G6) (Lead: TSE, TPC, TPP, TPM)
• Complete studies including additional infrastructure requirements within required timelines
• Complete project plans of service to meet internal schedules for customers willing to commit to take service
• Develop and implement plans of service for communications, control and operations infrastructure to meet the generation integration requests per tariff timelines
• Establish and update short and long-range plans of service annually to identify required projects to enhance communications, control and operations infrastructure
I-7. Ensure the implementation of a regional expansion plan that (1) is long term and integrated with resource planning, (2) meets reliability standards and (3) is directed at minimizing total system costs (by date) (G5) (TPP, SR)
• Support and apply established WECC expansion planning process and policies
I-8. (NOS) Implement a predictable process to facilitate customer requests for transmission service by: (G6) (Lead; TS, TP)
• Determining which transmission service requests will or will not commit to take service
• Enabling access to existing ATC by parties willing to commit to service
• Defining and implementing additional infrastructure needed to provide reliable service
• Evaluating the feasibility of multi-party open seasons on ColumbiaGrid and other transmission providers’ systems
Note Light gray text: this strategic initiative influences the management of assets, but is deemed to be outside the scope of this asset management strategy.
Integrated Program Review May 2010
17
T r a n s m i s s i o n A s s e t M a n a g e m e n t S t r a t e g y
B O N N E V I L L E P O W E R A D M I N I S T R A T I O N
Goals for expanding transmission
Continued
Goals
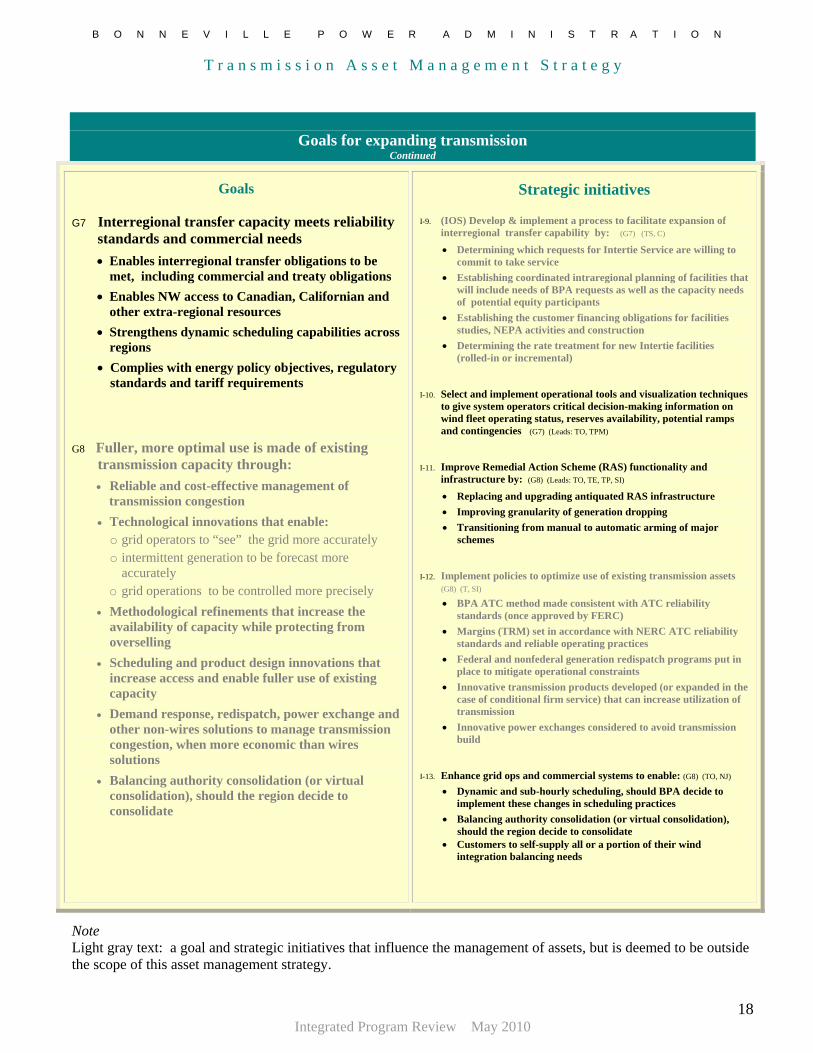
G7 Interregional transfer capacity meets reliability standards and commercial needs
• Enables interregional transfer obligations to be met, including commercial and treaty obligations
• Enables NW access to Canadian, Californian and other extra-regional resources
• Strengthens dynamic scheduling capabilities across regions
• Complies with energy policy objectives, regulatory standards and tariff requirements
G8 Fuller, more optimal use is made of existing transmission capacity through: • Reliable and cost-effective management of
transmission congestion • Technological innovations that enable:
o grid operators to “see” the grid more accurately o intermittent generation to be forecast more
accurately o grid operations to be controlled more precisely
• Methodological refinements that increase the availability of capacity while protecting from overselling
• Scheduling and product design innovations that increase access and enable fuller use of existing capacity
• Demand response, redispatch, power exchange and other non-wires solutions to manage transmission congestion, when more economic than wires solutions
• Balancing authority consolidation (or virtual consolidation), should the region decide to consolidate
Strategic initiatives
I-9. (IOS) Develop & implement a process to facilitate expansion of interregional transfer capability by: (G7) (TS, C) • Determining which requests for Intertie Service are willing to
commit to take service • Establishing coordinated intraregional planning of facilities that
will include needs of BPA requests as well as the capacity needs of potential equity participants
• Establishing the customer financing obligations for facilities studies, NEPA activities and construction
• Determining the rate treatment for new Intertie facilities (rolled-in or incremental)
I-10. Select and implement operational tools and visualization techniques to give system operators critical decision-making information on wind fleet operating status, reserves availability, potential ramps and contingencies (G7) (Leads: TO, TPM)
I-11. Improve Remedial Action Scheme (RAS) functionality and infrastructure by: (G8) (Leads: TO, TE, TP, SI)
• Replacing and upgrading antiquated RAS infrastructure • Improving granularity of generation dropping • Transitioning from manual to automatic arming of major
schemes
I-12. Implement policies to optimize use of existing transmission assets (G8) (T, SI)
• BPA ATC method made consistent with ATC reliability standards (once approved by FERC)
• Margins (TRM) set in accordance with NERC ATC reliability standards and reliable operating practices
• Federal and nonfederal generation redispatch programs put in place to mitigate operational constraints
• Innovative transmission products developed (or expanded in the case of conditional firm service) that can increase utilization of transmission
• Innovative power exchanges considered to avoid transmission build
I-13. Enhance grid ops and commercial systems to enable: (G8) (TO, NJ)
• Dynamic and sub-hourly scheduling, should BPA decide to implement these changes in scheduling practices
• Balancing authority consolidation (or virtual consolidation), should the region decide to consolidate
• Customers to self-supply all or a portion of their wind integration balancing needs
Note Light gray text: a goal and strategic initiatives that influence the management of assets, but is deemed to be outside the scope of this asset management strategy.
Integrated Program Review May 2010
18
T r a n s m i s s i o n A s s e t M a n a g e m e n t S t r a t e g y
B O N N E V I L L E P O W E R A D M I N I S T R A T I O N
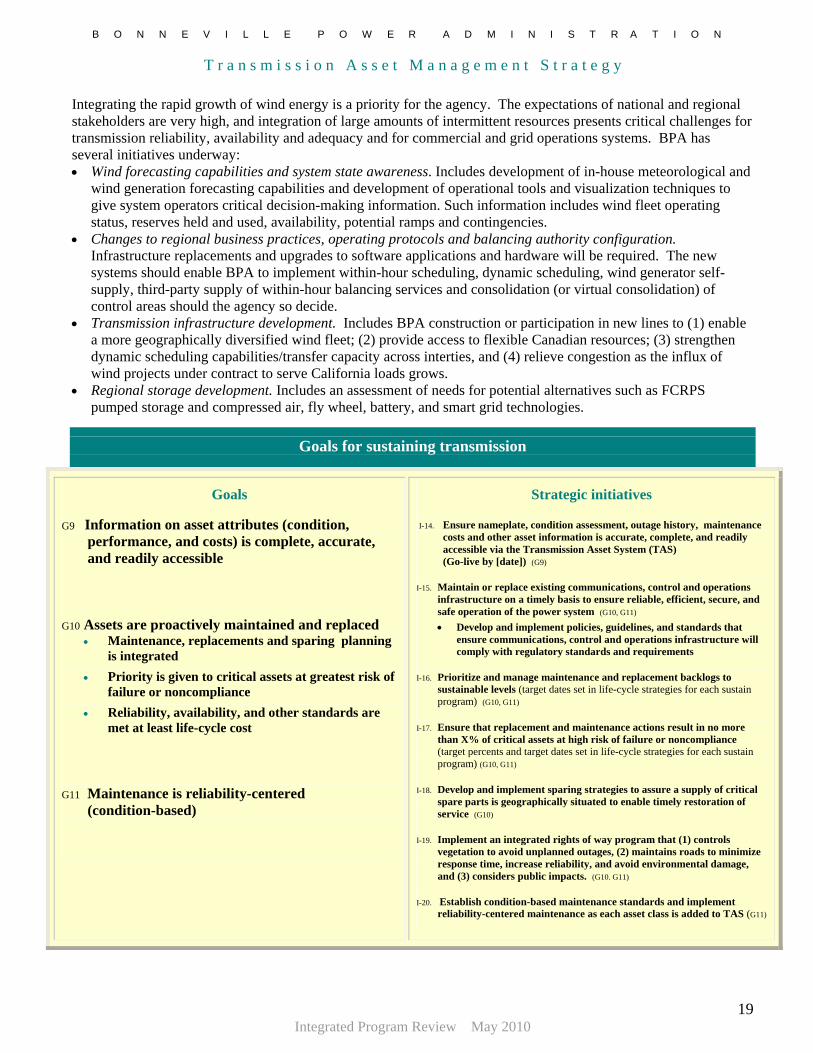
Integrating the rapid growth of wind energy is a priority for the agency. The expectations of national and regional stakeholders are very high, and integration of large amounts of intermittent resources presents critical challenges for transmission reliability, availability and adequacy and for commercial and grid operations systems. BPA has several initiatives underway: • Wind forecasting capabilities and system state awareness. Includes development of in-house meteorological and
wind generation forecasting capabilities and development of operational tools and visualization techniques to give system operators critical decision-making information. Such information includes wind fleet operating status, reserves held and used, availability, potential ramps and contingencies.
• Changes to regional business practices, operating protocols and balancing authority configuration. Infrastructure replacements and upgrades to software applications and hardware will be required. The new systems should enable BPA to implement within-hour scheduling, dynamic scheduling, wind generator self-supply, third-party supply of within-hour balancing services and consolidation (or virtual consolidation) of control areas should the agency so decide.
• Transmission infrastructure development. Includes BPA construction or participation in new lines to (1) enable a more geographically diversified wind fleet; (2) provide access to flexible Canadian resources; (3) strengthen dynamic scheduling capabilities/transfer capacity across interties, and (4) relieve congestion as the influx of wind projects under contract to serve California loads grows.
• Regional storage development. Includes an assessment of needs for potential alternatives such as FCRPS pumped storage and compressed air, fly wheel, battery, and smart grid technologies.
Goals for sustaining transmission
Goals
G9 Information on asset attributes (condition, performance, and costs) is complete, accurate, and readily accessible
G10 Assets are proactively maintained and replaced
• Maintenance, replacements and sparing planning is integrated
• Priority is given to critical assets at greatest risk of failure or noncompliance
• Reliability, availability, and other standards are met at least life-cycle cost
G11 Maintenance is reliability-centered
(condition-based)
Strategic initiatives
I-14. Ensure nameplate, condition assessment, outage history, maintenance costs and other asset information is accurate, complete, and readily accessible via the Transmission Asset System (TAS) (Go-live by [date]) (G9)
I-15. Maintain or replace existing communications, control and operations infrastructure on a timely basis to ensure reliable, efficient, secure, and safe operation of the power system (G10, G11) • Develop and implement policies, guidelines, and standards that
ensure communications, control and operations infrastructure will comply with regulatory standards and requirements
I-16. Prioritize and manage maintenance and replacement backlogs to sustainable levels (target dates set in life-cycle strategies for each sustain program) (G10, G11)
I-17. Ensure that replacement and maintenance actions result in no more than X% of critical assets at high risk of failure or noncompliance (target percents and target dates set in life-cycle strategies for each sustain program) (G10, G11)
I-18. Develop and implement sparing strategies to assure a supply of critical spare parts is geographically situated to enable timely restoration of service (G10)
I-19. Implement an integrated rights of way program that (1) controls vegetation to avoid unplanned outages, (2) maintains roads to minimize response time, increase reliability, and avoid environmental damage, and (3) considers public impacts. (G10. G11)
I-20. Establish condition-based maintenance standards and implement reliability-centered maintenance as each asset class is added to TAS (G11)
Integrated Program Review May 2010
19
T r a n s m i s s i o n A s s e t M a n a g e m e n t S t r a t e g y
B O N N E V I L L E P O W E R A D M I N I S T R A T I O N
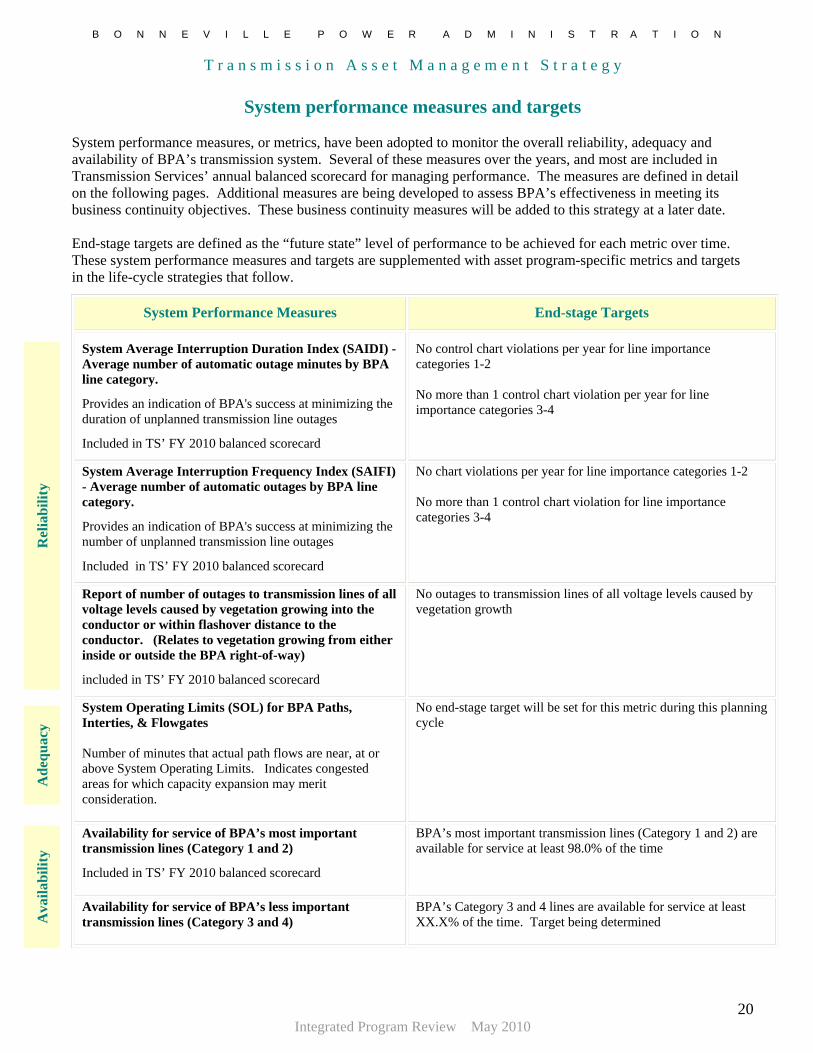
System performance measures and targets
System performance measures, or metrics, have been adopted to monitor the overall reliability, adequacy and availability of BPA’s transmission system. Several of these measures over the years, and most are included in Transmission Services’ annual balanced scorecard for managing performance. The measures are defined in detail on the following pages. Additional measures are being developed to assess BPA’s effectiveness in meeting its business continuity objectives. These business continuity measures will be added to this strategy at a later date. End-stage targets are defined as the “future state” level of performance to be achieved for each metric over time. These system performance measures and targets are supplemented with asset program-specific metrics and targets in the life-cycle strategies that follow.
System Performance Measures
End-stage Targets
System Average Interruption Duration Index (SAIDI) - Average number of automatic outage minutes by BPA line category.
Provides an indication of BPA's success at minimizing the duration of unplanned transmission line outages
Included in TS’ FY 2010 balanced scorecard
No control chart violations per year for line importance categories 1-2 No more than 1 control chart violation per year for line importance categories 3-4
System Average Interruption Frequency Index (SAIFI) - Average number of automatic outages by BPA line category.
Provides an indication of BPA's success at minimizing the number of unplanned transmission line outages
Included in TS’ FY 2010 balanced scorecard
No chart violations per year for line importance categories 1-2 No more than 1 control chart violation for line importance categories 3-4
Report of number of outages to transmission lines of all voltage levels caused by vegetation growing into the conductor or within flashover distance to the conductor. (Relates to vegetation growing from either inside or outside the BPA right-of-way)
included in TS’ FY 2010 balanced scorecard
No outages to transmission lines of all voltage levels caused by vegetation growth
System Operating Limits (SOL) for BPA Paths, Interties, & Flowgates Number of minutes that actual path flows are near, at or above System Operating Limits. Indicates congested areas for which capacity expansion may merit consideration.
No end-stage target will be set for this metric during this planning cycle
Availability for service of BPA’s most important transmission lines (Category 1 and 2)
Included in TS’ FY 2010 balanced scorecard
BPA’s most important transmission lines (Category 1 and 2) are available for service at least 98.0% of the time
Availability for service of BPA’s less important transmission lines (Category 3 and 4)
BPA’s Category 3 and 4 lines are available for service at least XX.X% of the time. Target being determined
Rel
iabi
lity
A
dequ
acy
A
vaila
bilit
y
Integrated Program Review May 2010
20
T r a n s m i s s i o n A s s e t M a n a g e m e n t S t r a t e g y
B O N N E V I L L E P O W E R A D M I N I S T R A T I O N
Documentation of System Performance Measures and End-stage Targets
Measure: System Average Interruption Duration Index (SAIDI) – Average number of automatic
outage minutes by BPA line category
Background: Maintaining system reliability is a critical BPA responsibility. This reliability measure is monitored to help minimize the duration of automatic (unplanned) line outages on the BPA system. SAIDI provides an indication of BPA’s success at minimizing the duration of unplanned transmission line outages. SAIDI data is used in developing Transmission’s asset management strategies and plans, and in its capital and expense planning levels.
Methodology: Reliability assessment is based on IEEE-standard measures of outage duration (SAIDI). Control chart techniques, closely mirroring transmission reliability methodology adopted by the California Independent System Operator (ISO), are used to establish allowable performance levels for each line importance category (1-4). Control charts are statistically-based graphs which illustrate the natural range of variability in performance, based on the most recent 10 years of historical data (FY 1998 - FY 2007). In general, the Control Limit is calculated as the 3-standard deviation band, and the Warning Limit as the 2-standard deviation band, based on historical line performance. Actual SAIDI results from the past year are then compared to the control chart limits to gauge the adequacy of system reliability and to determine control chart violations. Control chart violations are defined as follows:
• Latest fiscal year above the Upper Control Limit (short-term degradation) • 2 of last 3 fiscal years above the Upper Warning Limit (mid-term degradation) • Continuous worsening trend in the last six fiscal years (long-term degradation)
End-stage Targets: No control chart violations for line importance categories 1 and 2.
No more than 1 control chart violations per year for line importance categories 3 and 4.
Inclusions/ Exclusions:
• Reliability monitoring is based on automatic (unplanned) outages to transmission lines (not points-of-delivery)
• Duration of any single outage is capped at 4,320 minutes (72 hours) • Momentary outages are excluded • Outages to lines with all or part non-federal ownership are excluded • Outages in the year in which a line may have been energized or retired are excluded (i.e., line
must have “full year” availability) • Outages with a cause attributed to a foreign utility are excluded •
Responsibility for Monitoring & Reporting:
Transmission Technical Operations (TOT)
Integrated Program Review May 2010
21
T r a n s m i s s i o n A s s e t M a n a g e m e n t S t r a t e g y
B O N N E V I L L E P O W E R A D M I N I S T R A T I O N
Measure: System Average Interruption Frequency Index (SAIFI) – Average number of automatic
outages by BPA line category
Background: Maintaining system reliability is a critical BPA responsibility. This reliability measure is monitored to help minimize the frequency of automatic (unplanned) line outages on the BPA system. SAIFI provides an indication of BPA’s success at minimizing the number of unplanned transmission line outages. SAIFI data is used in developing Transmission’s asset management strategies and plans, and in its capital and expense planning levels.
Methodology: Reliability assessment is based on IEEE-standard measures of outage frequency (SAIFI). Control chart techniques, closely mirroring transmission reliability methodology adopted by the California Independent System Operator (ISO), are used to establish allowable performance levels for each line importance category (1-4). Control charts are statistically-based graphs which illustrate the natural range of variability in performance, based on the most recent 10 years of historical data (FY 1998 - FY 2007). In general, the Control Limit is calculated as the 3-standard deviation band, and the Warning Limit as the 2-standard deviation band, based on historical line performance. Actual SAIFI results from the past year are then compared to the control chart limits to gauge the adequacy of system reliability and to determine control chart violations. Control chart violations are defined as follows:
• Latest fiscal year above the Upper Control Limit (short-term degradation) • 2 of last 3 fiscal years above the Upper Warning Limit (mid-term degradation) • Continuous worsening trend in the last six fiscal years (long-term degradation)
End-stage Targets: No control chart violations for line importance categories 1 and 2.
No more than 1 control chart violations per year for line importance categories 3 and 4.
Inclusions/ Exclusions:
• Reliability monitoring is based on automatic (unplanned) outages to transmission lines (not points-of-delivery)
• Duration of any single outage is capped at 4,320 minutes (72 hours) • Momentary outages are excluded • Outages to lines with all or part non-federal ownership are excluded • Outages in the year in which a line may have been energized or retired are excluded (i.e., line
must have “full year” availability) • Outages with a cause attributed to a foreign utility are excluded
Responsibility for Monitoring & Reporting:
Transmission Technical Operations (TOT)
Integrated Program Review May 2010
22
T r a n s m i s s i o n A s s e t M a n a g e m e n t S t r a t e g y
B O N N E V I L L E P O W E R A D M I N I S T R A T I O N
Measure: Frequency of Line Outages caused by Vegetation Growth – Report the number of outages
caused by vegetation growing into the conductor or within flashover distance to the conductor on transmission lines of 200 kV or higher and lower voltage lines designated by the Regional Reliability Organization (RRO) as critical lines to maintaining transmission system reliability. WECC vegetation outage reporting classifies these as Category 1 – Grow-ins: outages caused by vegetation growing into lines from vegetation inside/or outside of the right-of-way.
Background: Maintaining system availability is a critical BPA responsibility. A vegetation growth caused outage measure is monitored to help minimize the amount of time that transmission lines are out of service due to a tree related incident. Cause of outage observed in the field is documented and captured in the outage management system. Outage cause data is used in determining Transmission’s expense planning for vegetation management.
Methodology: • Outage database (OARS) is the repository of information related to WECC Vegetation Growth Outages.
• Outages that have a ‘TREE’ cause appearing in the Dispatcher Cause or Field Cause or Fault Location or Comment columns are investigated by TF.
• Vegetation related Transmission line outages are classified as follows: • Category 1 – grow-ins, from inside/or outside of the right-of-way • Category 2 – fall-ins, from inside the right-of-way • Category 3 – fall-ins, from outside the right-of-way
• Mandatory reporting to WECC of vegetation outages.
End-stage Targets: No outages to transmission lines of 200 kV or greater and for RRO designated lines caused by vegetation growth.
Inclusions/ Exclusions:
• Applies primarily to lines 200 kV or greater with the exception of lower voltage lines that are designated RRO.
• WECC reporting includes tree falling from inside and outside of the right-of-way. For purposes of this measure, only category 1 vegetation outages apply. Category 2 and 3 are excluded.
• Excludes vegetation related outages that result from natural disasters • Excludes vegetation related outages that are due to human or animal activity such as logging, vehicle
contact, etc.
Responsibility for Monitoring & Reporting:
Technical Operations (TOT) monitors for Transmission Field Services (TF) the OARS database for potentially reportable outages. TF is responsible for reporting. (Currently prepared by TOT, but will transition to TF)
Integrated Program Review May 2010
23
T r a n s m i s s i o n A s s e t M a n a g e m e n t S t r a t e g y
B O N N E V I L L E P O W E R A D M I N I S T R A T I O N
Measure: System Operating Limit (SOL) for BPA Paths, Interties, & Flowgates – number of minutes
that actual path flows are near, at or above System Operating Limit. Monitored for 21 separate directional paths, interties and flowgates.
Background: On-going monthly analysis comparing System Operating Limit (SOL) with Actual Path Flows for 21 separate directional paths, interties, & flowgates, based on 1-minute SCADA data. Selected elements are Transmission Business Key Performance Indicators and NERC/WECC Compliance reporting elements. Note terminology update from "OTC" (Operational Transfer Capacity) to "SOL" (System Operating Limit), per national standards.
Methodology: For 21 separate directional paths, compare the actual path flow to the System Operating Limit (SOL) for that path, at 1-minute increments. Calculate the number of minutes where actual flows were within 20% of SOL, 10% of SOL, and Over SOL. Report this by month, by path, in minutes and percentage of total time. For excursion periods Over SOL, compare the consecutive minutes vs. the reliability limits (20 minutes or 30 minutes, varies by path) to determine if a NERC/WECC violation occurred.
End-stage Targets: No end stage target will be set for this metric during this planning cycle. Inclusions/ Exclusions:
This metric indicates: • Utilization levels/patterns for existing line assets. • Congestion areas for which capacity expansion may merit consideration.
Responsibility for Monitoring & Reporting:
Transmission Technical Operations (TOT)
Integrated Program Review May 2010
24
T r a n s m i s s i o n A s s e t M a n a g e m e n t S t r a t e g y
B O N N E V I L L E P O W E R A D M I N I S T R A T I O N
Measure: Percent Availability for Service of BPA’s transmission lines – total hours less average
planned and unplanned outage duration.
Background: Maintaining system availability is a critical BPA responsibility. Availability measures are monitored to help minimize the amount of time the most important lines on the system are out of service for maintenance, construction, and related “planned” activities, thus maximizing the commercial availability of the grid. Availability data are used in Transmission’s capital and expense planning, maintenance, and operations processes.
Methodology: Control chart techniques are used to establish allowable performance levels for system availability. Control charts are statistically-based graphs which illustrate the natural range of variability in performance, based on the most recent 5 years of historical data (FY05-FY09). In general, the Control Limit is calculated as the 3-standard deviation band, and the Warning Limit as the 2-standard deviation band, based on historical line availability, for lines of importance ranks 1-4. Actual Availability for the current year is then compared to the lower limit of availability to determine if it falls below the violation limits. Control chart violations are defined as follows:
• Latest fiscal year below the Lower Control Limit (short-term degradation) • 2 of last 3 fiscal years below the Lower Warning Limit (mid-term degradation) • Continuous worsening trend in the last six fiscal years (long-term degradation)
End-stage Targets: Line importance categories 1 and 2 are available for service at least 98% of the time.
Line importance categories 3 and 4 are available for service at least XX% of the time. (target being determined)
Inclusions/ Exclusions:
The following outage inclusion/exclusion rules apply: • Momentary outages are excluded • Outages to lines with all or part non-federal ownership are excluded • Outages in the year in which a line may have been energized or retired are excluded (i.e., line
must have “full year” availability) • Outages to the four Big Eddy-Celilo feeder lines are excluded • Outages with cause codes 6,5,0 (Voltage Control, Foreign Request, Normally Out) are
excluded
Responsibility for Monitoring & Reporting:
Transmission Technical Operations (TOT)
Integrated Program Review May 2010
25
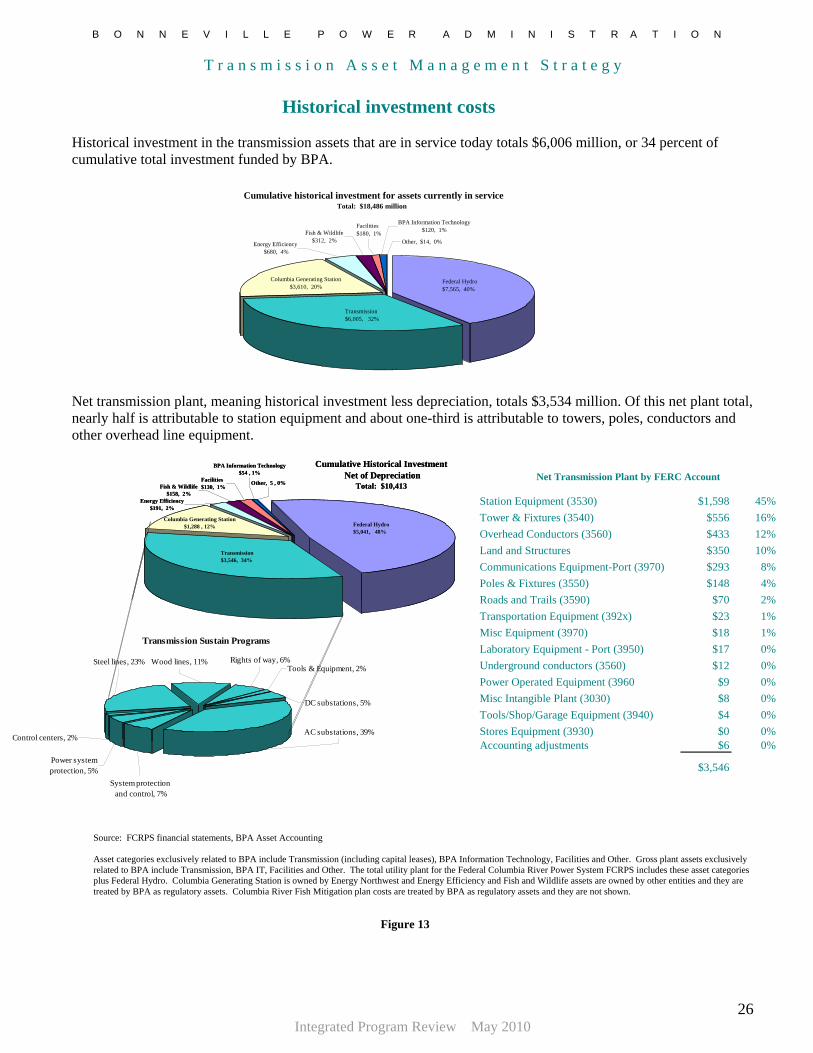
T r a n s m i s s i o n A s s e t M a n a g e m e n t S t r a t e g y
B O N N E V I L L E P O W E R A D M I N I S T R A T I O N
Historical investment costs
Historical investment in the transmission assets that are in service today totals $6,006 million, or 34 percent of cumulative total investment funded by BPA.
Cumulative historical investment for assets currently in service
Federal Hydro $7,565, 40%
Columbia Generating Station $3,610, 20%
Energy Efficiency $680, 4%
Fish & Wildlife $312, 2% Other, $14, 0%
BPA Information Technology $120, 1%
Facilities$180, 1%
Transmission$6,005, 32%
Total: $18,486 million
Net transmission plant, meaning historical investment less depreciation, totals $3,534 million. Of this net plant total, nearly half is attributable to station equipment and about one-third is attributable to towers, poles, conductors and other overhead line equipment.
Station Equipment (3530) $1,598 45%Tower & Fixtures (3540) $556 16%Overhead Conductors (3560) $433 12%Land and Structures $350 10%Communications Equipment-Port (3970) $293 8%Poles & Fixtures (3550) $148 4%Roads and Trails (3590) $70 2%Transportation Equipment (392x) $23 1%Misc Equipment (3970) $18 1%Laboratory Equipment - Port (3950) $17 0%Underground conductors (3560) $12 0%Power Operated Equipment (3960 $9 0%Misc Intangible Plant (3030) $8 0%Tools/Shop/Garage Equipment (3940) $4 0%Stores Equipment (3930) $0 0%Accounting adjustments $6 0%
$3,546
Net Transmission Plant by FERC Account
Transmission Sustain Programs
DC substations, 5%
Control centers, 2%
Power system protection, 5%
System protection and control, 7%
Steel lines, 23% Wood lines, 11% Rights of way, 6%Tools & Equipment, 2%
AC substations, 39%
Transmission Sustain Programs
DC substations, 5%
Control centers, 2%
Power system protection, 5%
System protection and control, 7%
Steel lines, 23% Wood lines, 11% Rights of way, 6%Tools & Equipment, 2%
AC substations, 39%
Facilities $130, 1%
BPA Information Technology$54 , 1%
Other, 5 , 0%Fish & Wildlife$158, 2%
Columbia Generating Station $1,288 , 12%
Energy Efficiency $191, 2%
Transmission $3,546, 34%
Federal Hydro $5,041, 48%
Cumulative Historical Investment Net of Depreciation
Total: $10,413
Transmission Sustain Programs
DC substations, 5%
Control centers, 2%
Power system protection, 5%
System protection and control, 7%
Steel lines, 23% Wood lines, 11% Rights of way, 6%Tools & Equipment, 2%
AC substations, 39%
Transmission Sustain Programs
DC substations, 5%
Control centers, 2%
Power system protection, 5%
System protection and control, 7%
Steel lines, 23% Wood lines, 11% Rights of way, 6%Tools & Equipment, 2%
AC substations, 39%
Facilities $130, 1%
BPA Information Technology$54 , 1%
Other, 5 , 0%Fish & Wildlife$158, 2%
Columbia Generating Station $1,288 , 12%
Energy Efficiency $191, 2%
Transmission $3,546, 34%
Federal Hydro $5,041, 48%
Cumulative Historical Investment Net of Depreciation
Total: $10,413
Source: FCRPS financial statements, BPA Asset Accounting Asset categories exclusively related to BPA include Transmission (including capital leases), BPA Information Technology, Facilities and Other. Gross plant assets exclusively related to BPA include Transmission, BPA IT, Facilities and Other. The total utility plant for the Federal Columbia River Power System FCRPS includes these asset categories plus Federal Hydro. Columbia Generating Station is owned by Energy Northwest and Energy Efficiency and Fish and Wildlife assets are owned by other entities and they are treated by BPA as regulatory assets. Columbia River Fish Mitigation plan costs are treated by BPA as regulatory assets and they are not shown.
Figure 13
Integrated Program Review May 2010
26
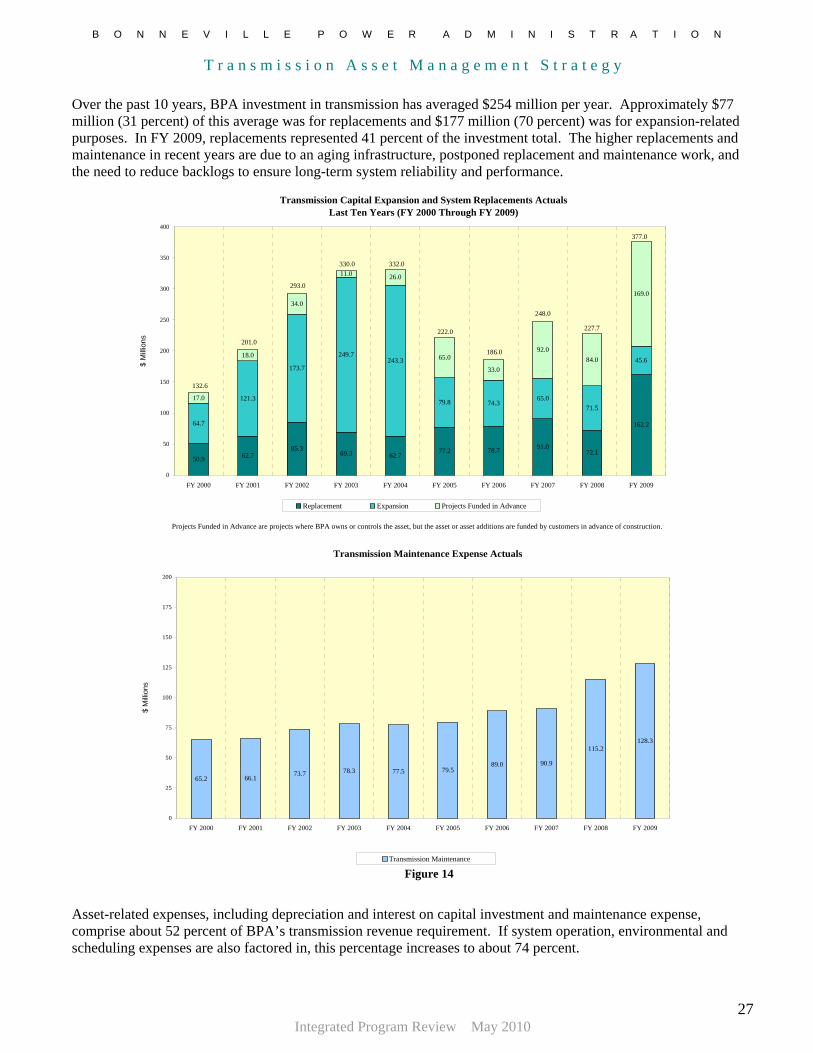
T r a n s m i s s i o n A s s e t M a n a g e m e n t S t r a t e g y
B O N N E V I L L E P O W E R A D M I N I S T R A T I O N
Over the past 10 years, BPA investment in transmission has averaged $254 million per year. Approximately $77 million (31 percent) of this average was for replacements and $177 million (70 percent) was for expansion-related purposes. In FY 2009, replacements represented 41 percent of the investment total. The higher replacements and maintenance in recent years are due to an aging infrastructure, postponed replacement and maintenance work, and the need to reduce backlogs to ensure long-term system reliability and performance.
Transmission Capital Expansion and System Replacements Actuals Last Ten Years (FY 2000 Through FY 2009)
50.9 62.785.3
69.3 62.777.2 78.7 91.0
72.1
162.264.7
121.3
173.7
249.7243.3
79.8 74.365.0
71.5
45.6
17.0
18.0
34.0
11.0 26.0
65.0
33.0
92.084.0
169.0
0
50
100
150
200
250
300
350
400
FY 2000 FY 2001 FY 2002 FY 2003 FY 2004 FY 2005 FY 2006 FY 2007 FY 2008 FY 2009
$ M
illion
s
Replacement Expansion Projects Funded in Advance
132.6
201.0186.0
222.0
332.0330.0
293.0
377.0
227.7
248.0
Projects Funded in Advance are projects where BPA owns or controls the asset, but the asset or asset additions are funded by customers in advance of construction.
Transmission Maintenance Expense Actuals
65.2 66.173.7 78.3 77.5 79.5
89.0 90.9
115.2128.3
0
25
50
75
100
125
150
175
200
FY 2000 FY 2001 FY 2002 FY 2003 FY 2004 FY 2005 FY 2006 FY 2007 FY 2008 FY 2009
$ M
illion
s
Transmission Maintenance Figure 14
Asset-related expenses, including depreciation and interest on capital investment and maintenance expense, comprise about 52 percent of BPA’s transmission revenue requirement. If system operation, environmental and scheduling expenses are also factored in, this percentage increases to about 74 percent.
Integrated Program Review May 2010
27
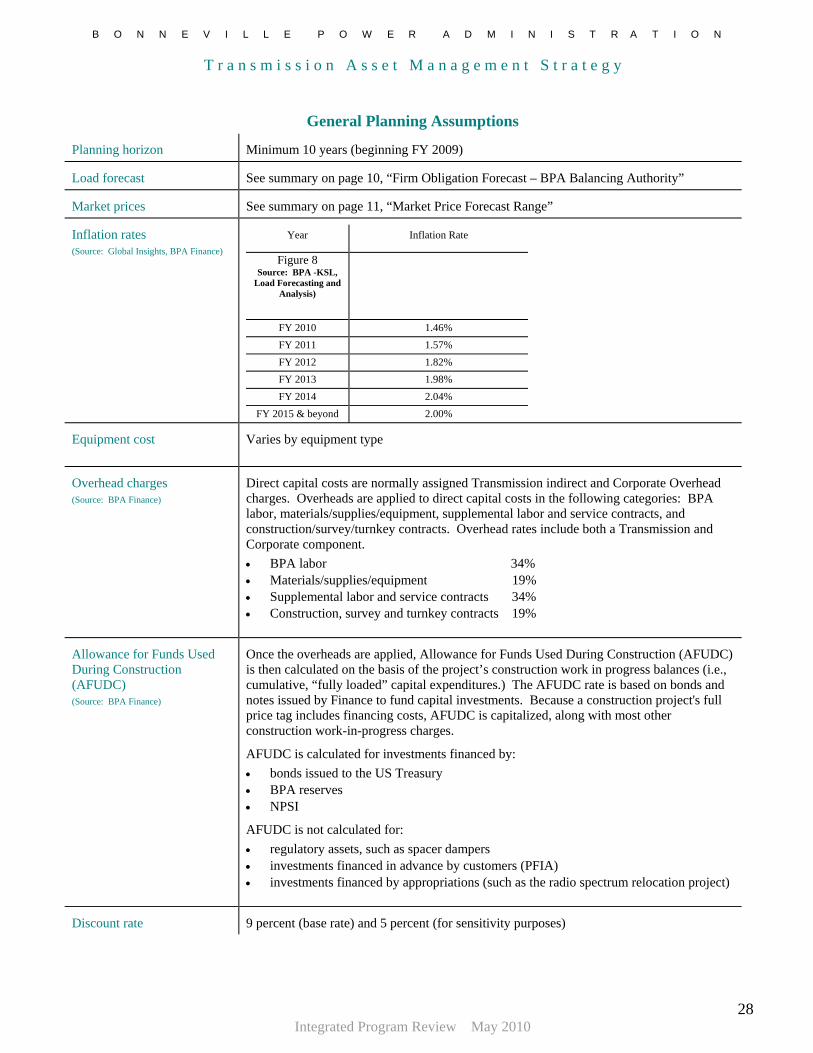
T r a n s m i s s i o n A s s e t M a n a g e m e n t S t r a t e g y
Integrated Program Review May 2010
28
B O N N E V I L L E P O W E R A D M I N I S T R A T I O N
General Planning Assumptions
Planning horizon Minimum 10 years (beginning FY 2009)
Load forecast See summary on page 10, “Firm Obligation Forecast – BPA Balancing Authority”
Market prices See summary on page 11, “Market Price Forecast Range”
Inflation rates (Source: Global Insights, BPA Finance)
Year Inflation Rate
Figure 8 Source: BPA -KSL,
Load Forecasting and Analysis)
FY 2010 1.46% FY 2011 1.57% FY 2012 1.82% FY 2013 1.98% FY 2014 2.04%
FY 2015 & beyond 2.00% Equipment cost Varies by equipment type
Overhead charges (Source: BPA Finance)
Direct capital costs are normally assigned Transmission indirect and Corporate Overhead charges. Overheads are applied to direct capital costs in the following categories: BPA labor, materials/supplies/equipment, supplemental labor and service contracts, and construction/survey/turnkey contracts. Overhead rates include both a Transmission and Corporate component. • BPA labor 34% • Materials/supplies/equipment 19% • Supplemental labor and service contracts 34% • Construction, survey and turnkey contracts 19%
Allowance for Funds Used During Construction (AFUDC) (Source: BPA Finance)
Once the overheads are applied, Allowance for Funds Used During Construction (AFUDC) is then calculated on the basis of the project’s construction work in progress balances (i.e., cumulative, “fully loaded” capital expenditures.) The AFUDC rate is based on bonds and notes issued by Finance to fund capital investments. Because a construction project's full price tag includes financing costs, AFUDC is capitalized, along with most other construction work-in-progress charges.
AFUDC is calculated for investments financed by: • bonds issued to the US Treasury • BPA reserves • NPSI
AFUDC is not calculated for: • regulatory assets, such as spacer dampers • investments financed in advance by customers (PFIA) • investments financed by appropriations (such as the radio spectrum relocation project)
Discount rate 9 percent (base rate) and 5 percent (for sensitivity purposes)