SHARED SERVICES - ASSET MANAGEMENT...Asset Management remains focused on ensuring, and being able to...
21
Filed: September 30, 2008 EB-2008-0272 Exhibit C1 Tab 2 Schedule 8 Page 1 of 21 1 2 3 4 5 6 7 8 9 10 11 12 13 14 15 16 17 18 19 20 21 22 24 26 28 SHARED SERVICES - ASSET MANAGEMENT 1.0 OVERVIEW The Transmission and Distribution businesses are operated using the Asset Management model, which the company adopted in 1998. The model separates the planning, decision- making and approvals associated with customer and asset needs from the engineering design, estimating and asset service functions required to expand and maintain the assets. This separation of functions is a common industry practice in today’s utilities and reflects the different skills required for these functions. By applying this model, Hydro One Networks Inc. can make management decisions involving customer and asset requirements on a consistent basis across its entire service territory. The Asset Management model is further discussed in Exhibit A, Tab 4, Schedule 1. Asset Management remains focused on ensuring, and being able to demonstrate, that the necessary transmission and distribution assets are planned, acquired, constructed, maintained and operated to deliver the required function and level of performance expected by customers in a sustainable manner. The Asset Management function balances the needs of customers, various economic and operational regulatory bodies, the company’s assets and systems, the shareholder and the people of Ontario in delivering on the following accountabilities: • Developing an asset plan for the sustainment, development and operation of the 23 Transmission and Distribution system; • Optimizing the release, bundling and sequencing of the work to ensure the effective 25 delivery of the programs and projects within the plan; • Redirecting projects and programs in response to new or unforeseen factors and 27 drivers;
Transcript of SHARED SERVICES - ASSET MANAGEMENT...Asset Management remains focused on ensuring, and being able to...
Filed: September 30, 2008 EB-2008-0272 Exhibit C1 Tab 2 Schedule 8 Page 1 of 21
1
2
3
4
5
6
7
8
9
10
11
12
13
14
15
16
17
18
19
20
21
22
24
26
28
SHARED SERVICES - ASSET MANAGEMENT
1.0 OVERVIEW
The Transmission and Distribution businesses are operated using the Asset Management
model, which the company adopted in 1998. The model separates the planning, decision-
making and approvals associated with customer and asset needs from the engineering
design, estimating and asset service functions required to expand and maintain the assets.
This separation of functions is a common industry practice in today’s utilities and reflects
the different skills required for these functions. By applying this model, Hydro One
Networks Inc. can make management decisions involving customer and asset
requirements on a consistent basis across its entire service territory. The Asset
Management model is further discussed in Exhibit A, Tab 4, Schedule 1.
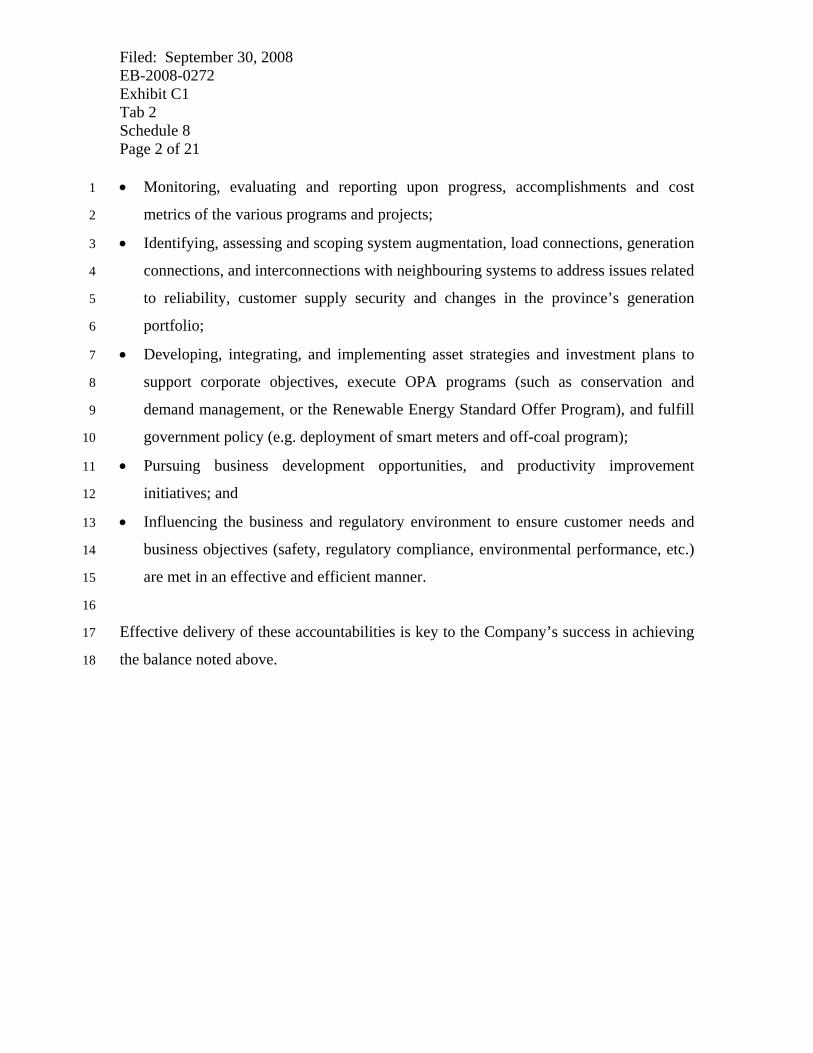
Asset Management remains focused on ensuring, and being able to demonstrate, that the
necessary transmission and distribution assets are planned, acquired, constructed,
maintained and operated to deliver the required function and level of performance
expected by customers in a sustainable manner. The Asset Management function
balances the needs of customers, various economic and operational regulatory bodies, the
company’s assets and systems, the shareholder and the people of Ontario in delivering on
the following accountabilities:
• Developing an asset plan for the sustainment, development and operation of the 23
Transmission and Distribution system;
• Optimizing the release, bundling and sequencing of the work to ensure the effective 25
delivery of the programs and projects within the plan;
• Redirecting projects and programs in response to new or unforeseen factors and 27
drivers;
Filed: September 30, 2008 EB-2008-0272 Exhibit C1 Tab 2 Schedule 8 Page 2 of 21
10
12
14
15
16
17
18
• Monitoring, evaluating and reporting upon progress, accomplishments and cost 1
metrics of the various programs and projects; 2
• Identifying, assessing and scoping system augmentation, load connections, generation 3
connections, and interconnections with neighbouring systems to address issues related 4
to reliability, customer supply security and changes in the province’s generation 5
portfolio; 6
• Developing, integrating, and implementing asset strategies and investment plans to 7
support corporate objectives, execute OPA programs (such as conservation and 8
demand management, or the Renewable Energy Standard Offer Program), and fulfill 9
government policy (e.g. deployment of smart meters and off-coal program);
• Pursuing business development opportunities, and productivity improvement 11
initiatives; and
• Influencing the business and regulatory environment to ensure customer needs and 13
business objectives (safety, regulatory compliance, environmental performance, etc.)
are met in an effective and efficient manner.
Effective delivery of these accountabilities is key to the Company’s success in achieving
the balance noted above.

Updated: February 13, 2009 EB-2008-0272 Exhibit C1 Tab 2 Schedule 8 Page 3 of 21
1 2 3
Table 1 Asset Management Function ($ Millions)
Function/Service Historic Bridge Test Years Allocation to
Transmission 2005 2006 2007 2008 2009 2010 2009 2010
Strategy & Business Development
6.3 6.4 5.9 6.3 9.4 9.7 4.3 4.5
System Investment
14.0 22.0 22.7 24.0 35.0 37.5 26.6 28.5
Work Program Optimization
2.5 3.6 3.8 3.4 3.7 3.8 3.1 3.2
Business Integration
12.1 16.5 15.5 18.2 18.7 20.0 10.7 11.4
Business Transformation
2.3 2.7 3.4 2.6 3.1 3.3 1.7 1.8
Real Estate & Facilities
35.4 38.7 37.5 41.9 46.5 49.1 24.5 25.8
Contracts and Business Relations
2.6 4.9 5.1 4.9 5.9 6.1 5.0 5.2
Asset Management Processes and Policies
* * * 1.3 1.4 1.4 0.8 0.8
Total Costs 75.2 94.8 93.8 102.5 123.6 131.0 76.7 81.2* The Asset Management Process and Policies function was part of System Investment prior to 2008. 4
5
6
7
As shown in Table 1, the 2009 cost of doing Asset Management work is $123.6 million
and the 2010 cost is $131.0 million, with the portion of the total cost attributable to the
Filed: September 30, 2008 EB-2008-0272 Exhibit C1 Tab 2 Schedule 8 Page 4 of 21
1
2
3
4
5
6
7
8
9
10
11
12
13
14
15
16
17
18
19
20
21
22
23
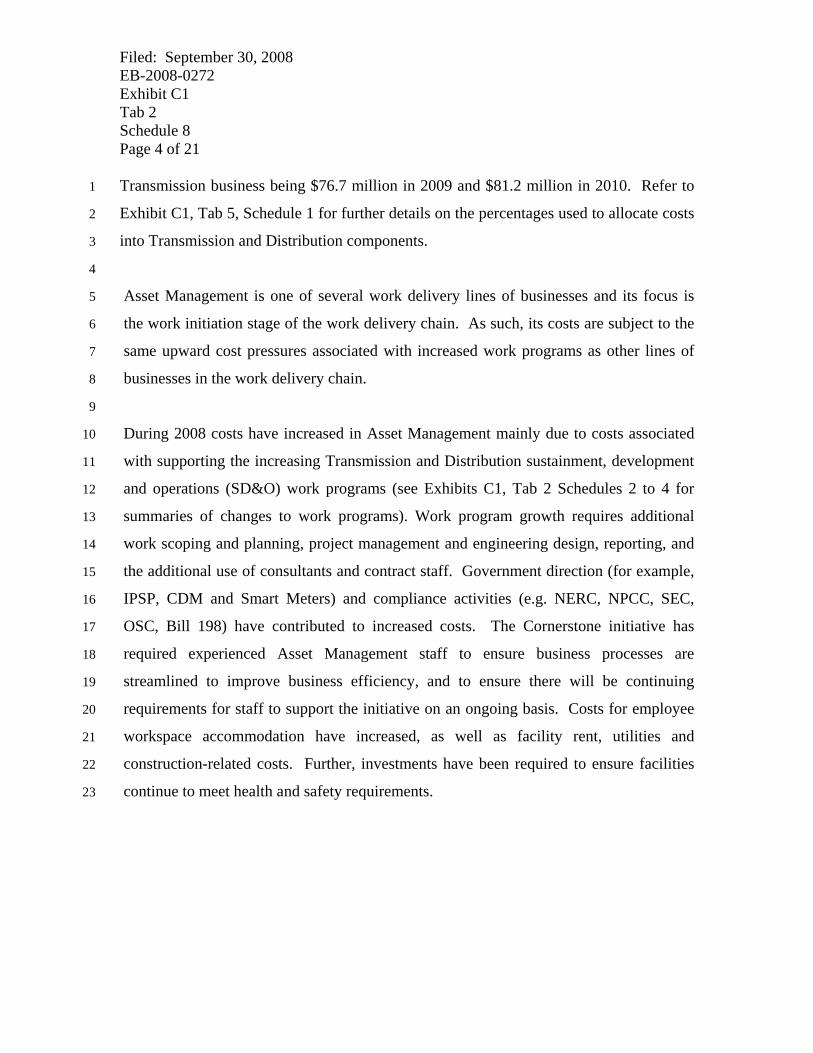
Transmission business being $76.7 million in 2009 and $81.2 million in 2010. Refer to
Exhibit C1, Tab 5, Schedule 1 for further details on the percentages used to allocate costs
into Transmission and Distribution components.
Asset Management is one of several work delivery lines of businesses and its focus is
the work initiation stage of the work delivery chain. As such, its costs are subject to the
same upward cost pressures associated with increased work programs as other lines of
businesses in the work delivery chain.
During 2008 costs have increased in Asset Management mainly due to costs associated
with supporting the increasing Transmission and Distribution sustainment, development
and operations (SD&O) work programs (see Exhibits C1, Tab 2 Schedules 2 to 4 for
summaries of changes to work programs). Work program growth requires additional
work scoping and planning, project management and engineering design, reporting, and
the additional use of consultants and contract staff. Government direction (for example,
IPSP, CDM and Smart Meters) and compliance activities (e.g. NERC, NPCC, SEC,
OSC, Bill 198) have contributed to increased costs. The Cornerstone initiative has
required experienced Asset Management staff to ensure business processes are
streamlined to improve business efficiency, and to ensure there will be continuing
requirements for staff to support the initiative on an ongoing basis. Costs for employee
workspace accommodation have increased, as well as facility rent, utilities and
construction-related costs. Further, investments have been required to ensure facilities
continue to meet health and safety requirements.
Updated: February 13, 2009 EB-2008-0272 Exhibit C1 Tab 2 Schedule 8 Page 5 of 21
1
2
3
4
5 6 7
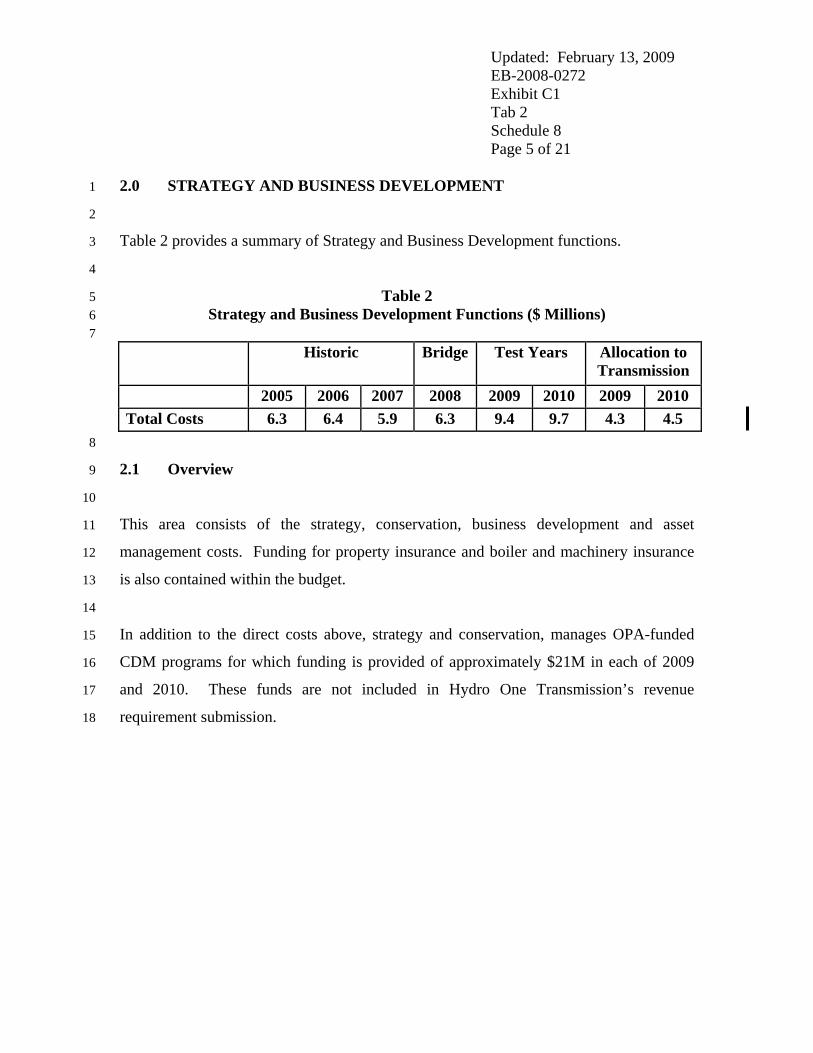
2.0 STRATEGY AND BUSINESS DEVELOPMENT
Table 2 provides a summary of Strategy and Business Development functions.
Table 2 Strategy and Business Development Functions ($ Millions)
Historic Bridge Test Years Allocation to
Transmission 2005 2006 2007 2008 2009 2010 2009 2010
Total Costs 6.3 6.4 5.9 6.3 9.4 9.7 4.3 4.5 8
9
10
11
12
13
14
15
16
17
18
2.1 Overview
This area consists of the strategy, conservation, business development and asset
management costs. Funding for property insurance and boiler and machinery insurance
is also contained within the budget.
In addition to the direct costs above, strategy and conservation, manages OPA-funded
CDM programs for which funding is provided of approximately $21M in each of 2009
and 2010. These funds are not included in Hydro One Transmission’s revenue
requirement submission.

Filed: September 30, 2008 EB-2008-0272 Exhibit C1 Tab 2 Schedule 8 Page 6 of 21
1
2
3
4
10
11
13
15
20
22
23
24
25
28
2.2 Strategy and Conservation and Business Development Activities
The Strategy and Conservation function activities include:
• developing the long term corporate vision; 5
• leading and supporting the development and integration of strategies that respond to 6
corporate direction, and to changes in the industry environment or government policy 7
(for example, the Conservation and Demand Management initiative); 8
• supporting opportunities to optimize leveraging of Hydro One Networks Inc.’s assets 9
(such as leveraging the communications network being put in place for smart meters
for in-home displays and potentially for load control);
• developing strategies and implementation plans for business improvement initiatives 12
(for example, internal energy efficiency);
• developing strategies that support corporate goals related to the transmission and 14
distribution functions;
• assisting with improving industry efficiencies within the utility sector; 16
• managing the corporate research portfolio; 17
• overseeing the operation of the Customer Advisory Board; 18
• developing innovative conservation and demand management programs that meet the 19
needs of Hydro One Network’ unique customer base;
• initiating and managing the delivery of conservation and demand management 21
customer programs funded by the OPA.
Business Development is responsible for the following activities:
• leading the planning and implementation of the Corporation’s smart meter program; 26
• planning and implementing business improvement initiatives (for example, smart 27
networks);
Updated: February 13, 2009 EB-2008-0272 Exhibit C1 Tab 2 Schedule 8 Page 7 of 21
9
10
11 12
13 14 15 16
• planning and implementing utility industry efficiency initiatives (for example, utility 1
rationalization); 2
• supporting the development of opportunities to optimize leveraging of Hydro One 3
Networks’ assets (for example, secondary land use, utility rationalization, and utility 4
boundary adjustments); 5
• coordinating field activities, regulatory-driven activities (e.g. elimination of long-term 6
load transfers) and programming of the distribution business; and 7
• providing advice and guidance on distribution rates and conditions of service. 8
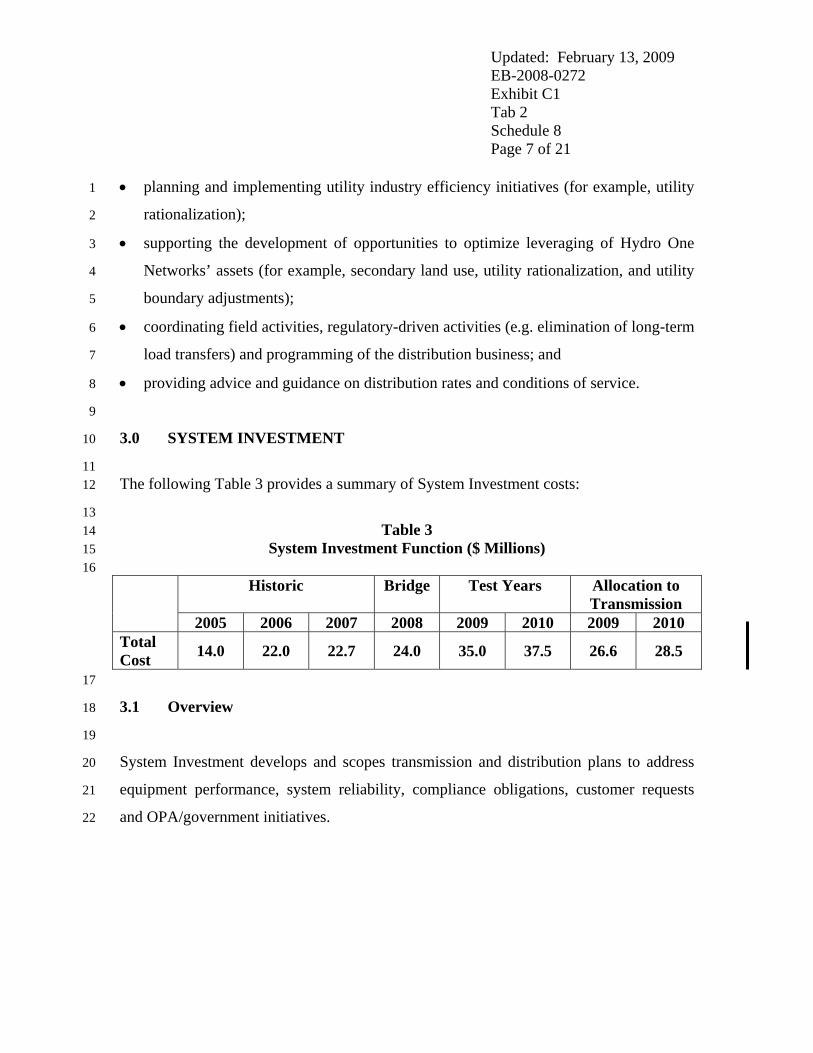
3.0 SYSTEM INVESTMENT
The following Table 3 provides a summary of System Investment costs:
Table 3
System Investment Function ($ Millions)
Historic Bridge Test Years Allocation to Transmission
2005 2006 2007 2008 2009 2010 2009 2010 Total Cost 14.0 22.0 22.7 24.0 35.0 37.5 26.6 28.5
17
18
19
20
21
22
3.1 Overview
System Investment develops and scopes transmission and distribution plans to address
equipment performance, system reliability, compliance obligations, customer requests
and OPA/government initiatives.
Filed: September 30, 2008 EB-2008-0272 Exhibit C1 Tab 2 Schedule 8 Page 8 of 21
1
2
11
14
15
16
17
18
19
21
22
23
26
28
System Investment has experienced upward pressure on costs, due to the following:
• An unprecedented number of requests for generation applications, requiring 3
connection impact assessments; 4
• The need to develop new standards related to configurations or connections to the 5
transmission and distribution networks; 6
• The need to develop, scope and obtain approvals for transmission plans in response to 7
Government policy decisions related to the province’s generation mix, in consultation 8
with the OPA, and in support of the IPSP; 9
• The greater number and complexity of Section 92 and Environmental Approvals 10
required for new facilities or expenditures;
• The need to comply with new industry standards and codes; and 12
• The higher levels of maintenance, refurbishment or replacement required for the 13
aging asset base.
3.2 System Investment Activities
System Investments activities include:
• Identifying, scoping and obtaining approval for projects and programs related to new 20
and existing transmission and distribution assets. Such investments must meet defined
needs in an economic and cost-efficient fashion, and be consistent with corporate
objectives, regulatory requirements and government policy;
• Obtaining necessary approvals or endorsement of investment plans; 24
• Redirecting and re-prioritizing projects and programs in response to unforeseen 25
events and work execution opportunities;
• Performing technical studies to assess the viability of proposed connections, 27
alternatives or investment plans;
Updated: February 13, 2009 EB-2008-0272 Exhibit C1 Tab 2 Schedule 8 Page 9 of 21
11
15
16
17
18
19
20
21 22 23 24
• Investigating power system disturbances; 1
• Conducting asset condition assessments; 2
• Monitoring and managing equipment and network performance; 3
• Establishing performance standards that establish the foundation for detailed 4
engineering designs; 5
• Responding to customer requests for new or expanded connections or customer 6
concerns regarding connection security or power quality; 7
• Advising external agencies and customers of the transmission and distribution 8
impacts of their plans; 9
• Consulting with affected stakeholders regarding new transmission and distribution 10
facilities;
• Participating in the development of North American or regional reliability standards; 12
• Supporting regulatory filings; and 13
• Specifying technical requirements and work for new technologies, such as anti-theft 14
initiatives for copper wire, animal abatement, transformer refurbishment (core
heating) and remote monitoring.
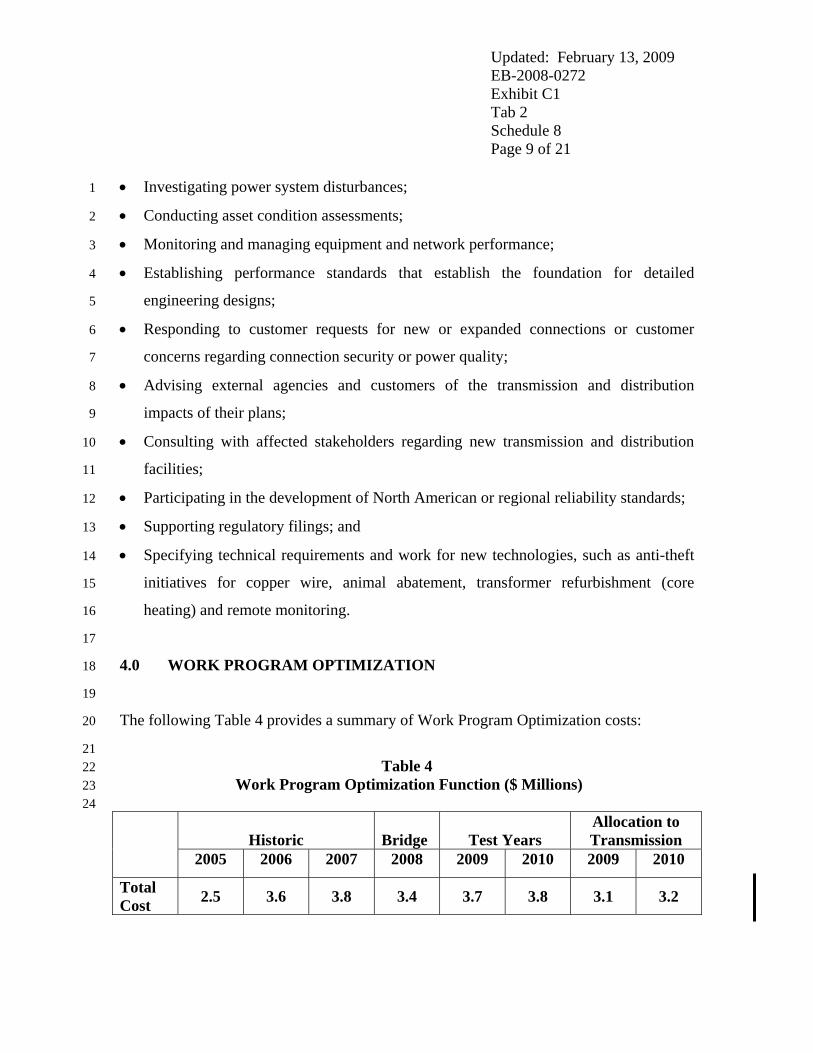
4.0 WORK PROGRAM OPTIMIZATION
The following Table 4 provides a summary of Work Program Optimization costs:
Table 4
Work Program Optimization Function ($ Millions)
Historic
Bridge
Test Years
Allocation to Transmission
2005 2006 2007 2008 2009 2010 2009 2010
Total Cost 2.5 3.6 3.8 3.4 3.7 3.8 3.1 3.2
Updated: February 13, 2009 EB-2008-0272 Exhibit C1 Tab 2 Schedule 8 Page 10 of 21
1
2
3
4
5
6
7
8
9
10
11
12
13
14
15
16
17
19
20
22
23
24
25
27
4.1 Overview
Work Program Optimization focuses on execution planning, integrating and bundling of
awarded transmission and distribution work across Hydro One Networks. As shown in
Table 4, the 2009 cost for this activity is $3.7 million with $3.1 million allocated to
Transmission, and the 2010 cost is $3.8 million with $3.2 million allocated to
Transmission. The year over year increases are due to increased work activities that are a
direct consequence of an increasing transmission work program on the activities of the
function.
Spending in 2008 was slightly lower at $3.4 million, primarily due to reduced work
scheduling efforts needed after the roll-out of phase one of the Cornerstone SAP project.
4.2 Work Program Optimization Activities
Activities of the function can be split into three major categories:
• Work Execution Planning, Bundling & Integration - Work closely with functions 18
across the organization to bundle and schedule work in ways that minimize outages,
resources, schedule and costs.
• Knowledge Management – Design, implement and support a knowledge management 21
system for all major capital and engineering documentation. The system includes
standard document templates and a structured workflow for document creation.
Provide a storage and management system to enable searching and retrieval of
historic documents to enable knowledge transfer to new staff.
• Scheduling System Administration - Provide administration of the corporate planning 26
and scheduling system (P3E) including the management of any required upgrades,
Updated: February 13, 2009 EB-2008-0272 Exhibit C1 Tab 2 Schedule 8 Page 11 of 21
1
2
3
4
5
6
7
8 9
10
training and operating requirements and the development of planning standards and
templates.
5.0 BUSINESS INTEGRATION
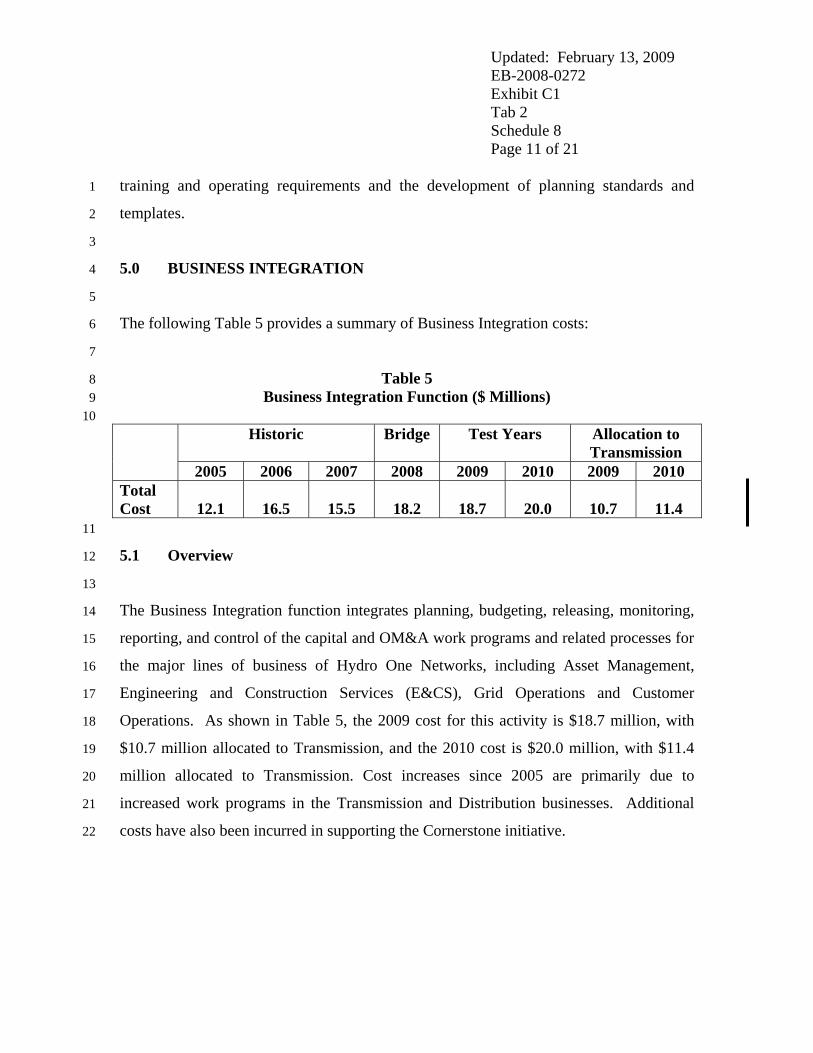
The following Table 5 provides a summary of Business Integration costs:
Table 5 Business Integration Function ($ Millions)
Historic Bridge Test Years Allocation to
Transmission
2005 2006 2007 2008 2009 2010 2009 2010 Total Cost
12.1
16.5
15.5
18.2
18.7
20.0
10.7
11.4
11
12
13
14
15
16
17
18
19
20
21
22
5.1 Overview
The Business Integration function integrates planning, budgeting, releasing, monitoring,
reporting, and control of the capital and OM&A work programs and related processes for
the major lines of business of Hydro One Networks, including Asset Management,
Engineering and Construction Services (E&CS), Grid Operations and Customer
Operations. As shown in Table 5, the 2009 cost for this activity is $18.7 million, with
$10.7 million allocated to Transmission, and the 2010 cost is $20.0 million, with $11.4
million allocated to Transmission. Cost increases since 2005 are primarily due to
increased work programs in the Transmission and Distribution businesses. Additional
costs have also been incurred in supporting the Cornerstone initiative.
Filed: September 30, 2008 EB-2008-0272 Exhibit C1 Tab 2 Schedule 8 Page 12 of 21
1
2
3
4
10
13
15
17
19
21
23
25
28
5.2 Business Integration Activities
Business Integration Activities include:
• Developing multi-year Hydro One Network Business Plans; 5
• Developing and leading the OM&A and capital Asset Planning process; 6
• Supporting regulatory processes, such as Transmission and Distribution filings, 7
within Asset Management; 8
• Performing business analytics, and conducting special studies in such areas as 9
productivity and cost savings management;
• Developing work program costing rates; 11
• Managing integrated processes for releasing and monitoring program results through 12
common systems;
• Reporting and analysing work program costs and results, and managing necessary 14
program redirection;
• Reporting and analysing Transmission and Distribution system and component 16
reliability;
• Developing and managing financial, customer, and asset information tools and 18
reports;
• Managing corporate asset information and systems (e.g. Power System Database) 20
used in key corporate processes;
• Managing corporate and line of business performance measurement and reporting 22
processes;
• Performing detailed performance benchmarking and productivity studies in support of 24
corporate objectives and regulatory filings;
• Managing corporate time reporting systems and processes; 26
• Managing distribution rationalization and WEP (Work Execution Program) rollout 27
and implementation; and
Updated: February 13, 2009 EB-2008-0272 Exhibit C1 Tab 2 Schedule 8 Page 13 of 21
3
5
6 7
8 9
10
• Providing support to Cornerstone Phases 1 and 2, and managing operational readiness 1
of Phase 1 on behalf of Asset Management. 2
6.0 BUSINESS TRANSFORMATION 4
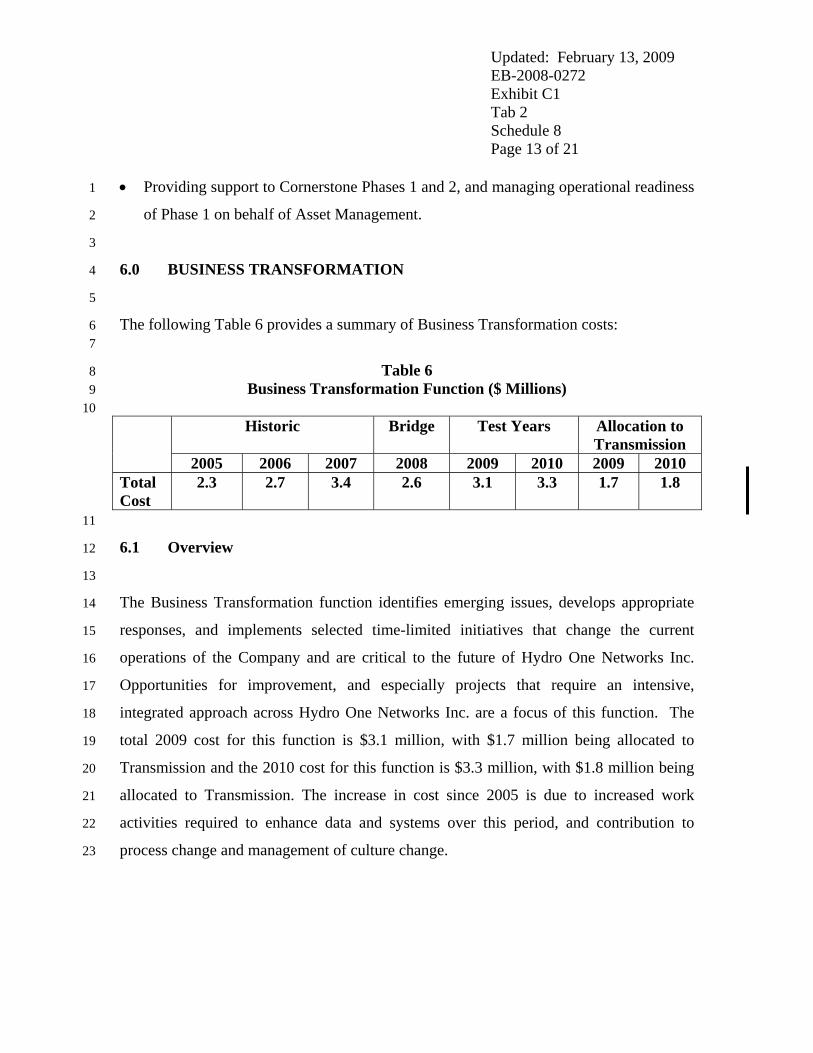
The following Table 6 provides a summary of Business Transformation costs:
Table 6 Business Transformation Function ($ Millions)
Historic Bridge Test Years Allocation to
Transmission
2005 2006 2007 2008 2009 2010 2009 2010 Total Cost
2.3 2.7 3.4 2.6 3.1 3.3 1.7 1.8
11
12
13
14
15
16
17
18
19
20
21
22
23
6.1 Overview
The Business Transformation function identifies emerging issues, develops appropriate
responses, and implements selected time-limited initiatives that change the current
operations of the Company and are critical to the future of Hydro One Networks Inc.
Opportunities for improvement, and especially projects that require an intensive,
integrated approach across Hydro One Networks Inc. are a focus of this function. The
total 2009 cost for this function is $3.1 million, with $1.7 million being allocated to
Transmission and the 2010 cost for this function is $3.3 million, with $1.8 million being
allocated to Transmission. The increase in cost since 2005 is due to increased work
activities required to enhance data and systems over this period, and contribution to
process change and management of culture change.
Updated: February 13, 2009 EB-2008-0272 Exhibit C1 Tab 2 Schedule 8 Page 14 of 21
1
2
10
11
12
13
14
15
16
17
18
19
20
21
22
23 24 25
6.2 Business Transformation Activities
• Corporate Projects / Business Transformation Activities include: 3
• participating in the definition and scoping of cross-functional priority projects, or 4
directly managing and mobilizing resources for large projects; 5
• managing cross-corporate initiatives to ensure an integrated approach to data, 6
systems, and processes as well as contributing to change management within Hydro 7
One; and 8
• managing Hydro One’s integrated approach to Emergency Preparedness and Business 9
continuity, including liaison with other industry organizations and various levels of
governments;
Business Transformation’s current priority is planning the replacement of a corporate
core IT systems. The first phase, which went live on June 2, 2008, replaced the existing
purchasing, inventory, work management, labour time entry, and Accounts Payable
modules. The second phase will replace the Financial, Human Resources and Pay
systems (see Exhibit D1, Tab 3, Schedule 7)
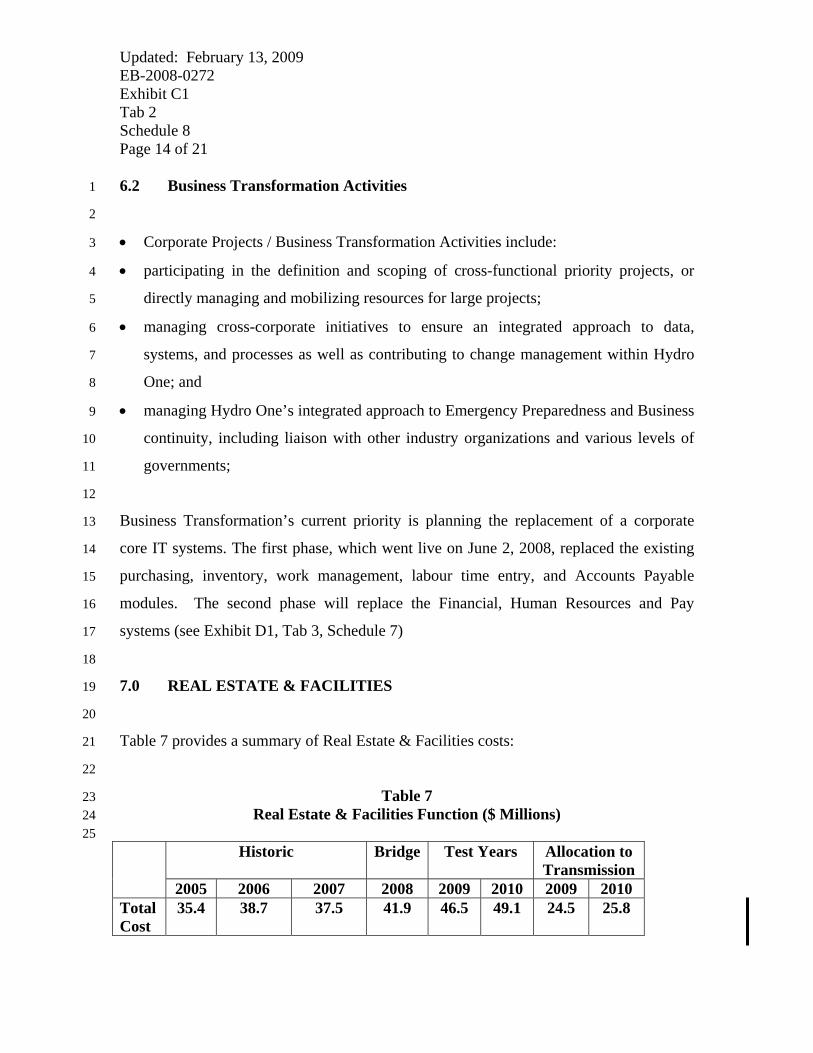
7.0 REAL ESTATE & FACILITIES
Table 7 provides a summary of Real Estate & Facilities costs:
Table 7 Real Estate & Facilities Function ($ Millions)
Historic Bridge Test Years Allocation to
Transmission
2005 2006 2007 2008 2009 2010 2009 2010 Total Cost
35.4 38.7 37.5 41.9 46.5 49.1 24.5 25.8

Filed: September 30, 2008 EB-2008-0272 Exhibit C1 Tab 2 Schedule 8 Page 15 of 21
1
2
3
4
5
6
7
8
9
10
11
12
13
14
15
16
17
18
19
20
22
24
26
7.1 Overview
The total cost for the Facilities and Real Estate function in 2009 is $46.5 million, with
$24.5 million allocated to Transmission. The 2010 cost is $49.1 million, with $25.8
million of that allocated to Transmission. The increase in cost over the 2007 through
2010 period reflects primarily new space - accommodation requirements driven by the
increasing work programs across the company and expansion of real estate and facilities
work programs.
7.2 Real Estate Services (“RES”)
Real Estate Services manages Hydro One’s land rights portfolio across the Province.
This involves ensuring that rights across over 200,000 acres of owned transmission
corridor, easement and “statutory right” properties are maintained, and that new rights are
acquired as necessary to ensure the safe and reliable operation of the transmission system.
In addition, Real Estate oversees the management of Hydro One’s rights associated with
transmission and distribution lands, stations and other property.
Key work activities include:
• managing acquisition of new real estate rights, including company transmission 21
development project initiatives across the Province;
• managing the Provincial secondary land use program on behalf of the shareholder / 23
Province (such as leasing transmission corridor lands to external parties);
• managing easement and other rights agreements on public/private sector, railway and 25
other lands;
• managing First Nations settlements and First Nations liaison activities; 27
• managing about 500,000 unregistered, low-voltage, real estate rights agreements; and 28

Updated: February 13, 2009 EB-2008-0272 Exhibit C1 Tab 2 Schedule 8 Page 16 of 21
2
3
4
5
6
7
8
9
10
11
12
13
14
15
16
17
18
19
20
21
22
23
24
25
26
27
28
• Maintenance of the Geographic Information System (GIS) property record database. 1
More specific support is provided on a selected project basis. This includes provision of
land ownership information, damage claim settlement, road access and other rights
acquisitions.
Specialized real estate services are provided as necessary. This includes assessment
appeals, payment of property taxes on distribution lands/buildings, and employee
relocation services as appropriate.
7.3 Facilities
The Facilities function manages all of the building and site facilities across the Company.
This includes leasing costs and contract management for Head Office. In addition, it
includes costs for administrative and service centres, transmission site facilities and
infrastructure and other work locations (for example, the London call centre and the
Ontario Grid Control Centre).
The Facilities Program focuses on providing employee workspace at sites across the
province including head office, administrative and service centres, the OGCC, and other
work locations such as the London Call Centre, and Network Services field centre
facilities.
Providing adequate workspace, storage and garage facilities for employees and trades is
critical to the effective undertaking of organizational work programs. Equally important
is ensuring that new or existing employee workspaces are consistently maintained to a
standard that meets current work requirements and complies with all corporate,
legislative and other related health, safety and environmental standards.

Filed: September 30, 2008 EB-2008-0272 Exhibit C1 Tab 2 Schedule 8 Page 17 of 21
1
2
10
11
12
13
14
15
16
17
18
19
20
21
22
23
24
25
26
27
This Program includes:
• Administration of 46 contract lease agreements for workspace rented from other 3
parties, including contractual obligations undertaken regarding payment of rent, 4
operating expenses and taxes; 5
• Coordination of activities related to the ongoing management, operation, maintenance 6
and inspection of 82 administrative/service centres; 7
• Provision of support services for Head Office space, such as provision of office 8
supplies and equipment, coordination of office moves, records management and 9
tenant services.
Providing accommodation strategies and acquiring new employee / trades workspace in
line with operational requirements is also undertaken.
The Facilities work program is extensively driven by fixed-cost contractual obligations,
as well as by the current regulatory environment (including health and safety and
corporate standards) and corporate staff levels.
Fixed cost contractual obligations arise primarily through relationships with external
landlords. For example, rent, operating and tax costs are specified in formal lease
agreements and opportunities to significantly amend these set costs typically do not
materialize until the agreement expires. Other fixed costs are represented by negotiated
contracts with internal and external service providers for base level facility maintenance
(for example, administrative/service centre building maintenance, janitorial and snow
removal, minor repairs, building component inspections) and similar activities. These
contracts focus on maintaining facilities in a condition that meets current employee work
requirements and corporate/legislative requirements.
Filed: September 30, 2008 EB-2008-0272 Exhibit C1 Tab 2 Schedule 8 Page 18 of 21
1
2
3
4
5
6
7
8
9
10
11 12 13
Fixed facility cost components (for example, utilities, property taxes, operational costs)
are expected to continue to rise. This is due to the anticipated escalation of utility prices
in Ontario as a result of electricity price increases and expected increases in natural gas
prices. As a result, a consistent approach was adopted in the proposed funding levels to
address these changing factors in the operating environment.
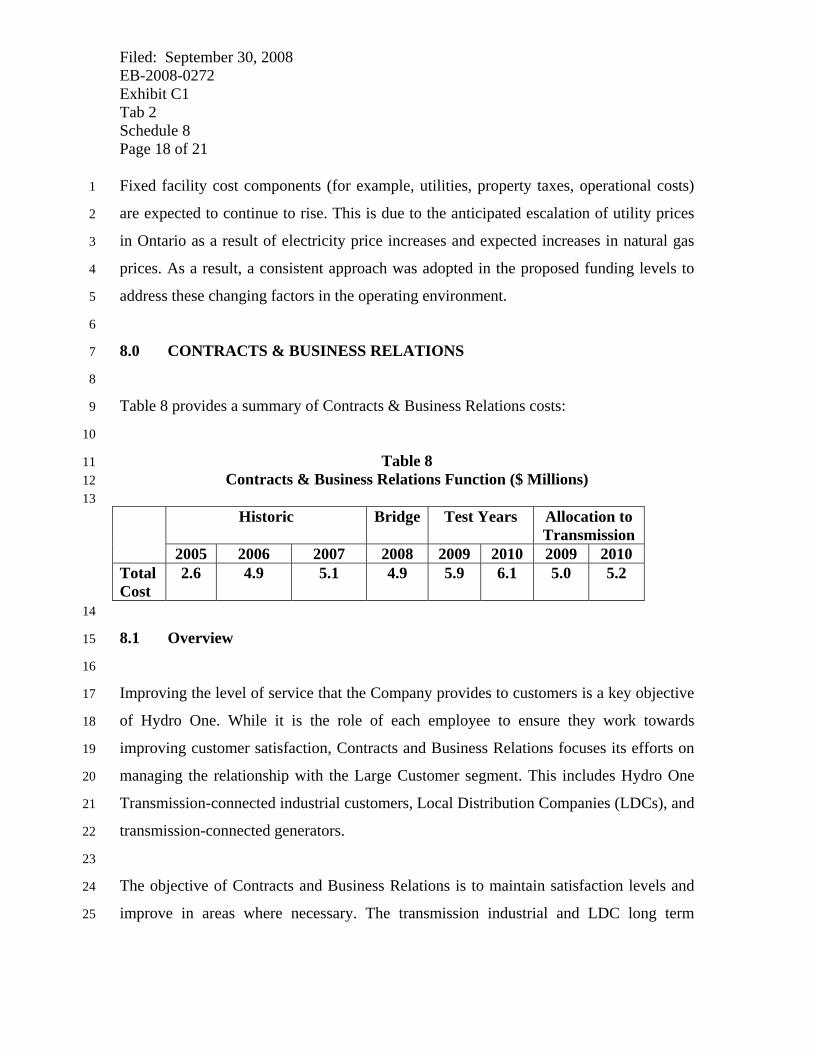
8.0 CONTRACTS & BUSINESS RELATIONS
Table 8 provides a summary of Contracts & Business Relations costs:
Table 8 Contracts & Business Relations Function ($ Millions)
Historic Bridge Test Years Allocation to
Transmission
2005 2006 2007 2008 2009 2010 2009 2010 Total Cost
2.6 4.9 5.1 4.9 5.9 6.1 5.0 5.2
14
15
16
17
18
19
20
21
22
23
24
25
8.1 Overview
Improving the level of service that the Company provides to customers is a key objective
of Hydro One. While it is the role of each employee to ensure they work towards
improving customer satisfaction, Contracts and Business Relations focuses its efforts on
managing the relationship with the Large Customer segment. This includes Hydro One
Transmission-connected industrial customers, Local Distribution Companies (LDCs), and
transmission-connected generators.
The objective of Contracts and Business Relations is to maintain satisfaction levels and
improve in areas where necessary. The transmission industrial and LDC long term
Filed: September 30, 2008 EB-2008-0272 Exhibit C1 Tab 2 Schedule 8 Page 19 of 21
1
2
3
4
5
6
7
8
9
10
11
12
13
17
21
23
25
satisfaction target of 90% was exceeded with a score of 95% in 2007. The transmission
generators score also improved from 74% in 2006 to 83% in 2007.
Core work programs include contract management, program implementation, customer
communications, operational and business support and customer connection project
coordination. Planned long-term initiatives include improving customer communications
through enhanced Web self service, skills training and new database functionality to
increase customer knowledge, and improving commitment tracking and reporting.
8.2 Contract & Business Relations Activities
Contracts & Business Relations activities include:
• Coordinating new and modified connection requests. 14
• Managing transmission connection agreements. 15
• Managing the Wholesale Meter Exit program and the Transitional Meter Service 16
Provider (MSP) fee program.
• Managing the Station Access program. 18
• Implementing and administering a new tracking process for customer contracts. 19
• Enhancing customer account management and commitment tracking systems to 20
improve customer service and sharing of customer information within Hydro One.
• Meeting with each customer annually to identify any issues and follow up on 22
satisfaction surveys.
• Managing Hydro One’s large customer web services, including annual enhancements 24
to improve customer experience with web access
• Continuing to manage customer programs and communications. 26

Filed: September 30, 2008 EB-2008-0272 Exhibit C1 Tab 2 Schedule 8 Page 20 of 21
1
2
3
4
5
6
7
8
9 10 11
2009 and 2010 spending for Contracts and Customer Business Relations remains at or
below spending in recent years. Spending has increased relative to 2005 as a result of
expanded business responsibilities and a proportionate increase in staffing complement.
9.0 ASSET MANAGEMENT PROCESSES AND POLICIES
Table 9 provides a summary of Asset Management Processes and Policies costs:
Table 9 Asset Management Processes and Policies Function ($ Millions)
Historic Bridge Test Years Allocation to
Transmission
2005 2006 2007 2008 2009 2010 2009 2010 Total Cost * * * 1.3 1.4 1.4 0.8 0.8
12
13
14
16
17
18
19
20
*Previously performed as part of System Investment function
9.1 Overview 15
The Asset Management Processes and Policies function is responsible for developing the
long-term (10-year) asset plan, developing and improving policies and processes (which
includes support of the Cornerstone initiative); coordinating regulatory-related processes
within Asset Management, and supporting improvements to market rules and codes.
Filed: September 30, 2008 EB-2008-0272 Exhibit C1 Tab 2 Schedule 8 Page 21 of 21
1
2
10
11
12
9.2 Asset Management Processes and Policies Activities
• Asset Management Processes and Policies activities include: Developing a long-term 3
(10-year) asset plan; 4
• Coordinating Asset Management’s participation in Transmission and Distribution rate 5
hearings; 6
• Identifying and promoting improvements to market rules and codes, to ensure that 7
they are pragmatic and effective in meeting the needs of customers; 8
• Acting as a key interface with the Cornerstone initiative, to ensure that asset 9
management processes incorporated into the project represent best practices; and
Developing related Asset Management and compliance-based policies.