Trade Area Analysis - For Your Information
23
1 Trade Area Analysis Defining a downtown or business district's trade area is an important first step in any market analysis. This step is crucial because it defines the boundaries that will serve as the basis for further study. It also helps individual businesses identify opportunities to expand their own trade area. In community economic development, a trade area is the geographic area from which a community generates the majority of its customers. This often is the geographic area that represents 75-percent of current customers. Sometimes a community may have more than one trade area (such as a convenience and a destination trade area). Knowing the size and shape of each trade area is extremely important because its boundaries allow for measurement of the number of potential customers, their demographics, and their spending potential. This information provides valuable insight into your community’s customer base and allows you to calculate demand for stores, products, and services. This section includes information on how to define your trade area(s). You will be able to apply these methods to define the most appropriate geographical boundaries using zip codes, political boundaries or U.S. Census designations. Learn more: Factors that Influence Trade Areas Types of Trade Areas Defining Trade Areas using Focus Groups Defining Trade Areas using Geographic Data Defining Trade Areas using Actual Customer Data Appendix: Trade Areas Representing Non-Resident Customers
Transcript of Trade Area Analysis - For Your Information

1
Trade Area Analysis Defining a downtown or business district's trade area is an important first step in any market
analysis. This step is crucial because it defines the boundaries that will serve as the basis for
further study. It also helps individual businesses identify opportunities to expand their own
trade area.
In community economic development, a trade area is the geographic area from which a
community generates the majority of its customers. This often is the geographic area that
represents 75-percent of current customers. Sometimes a community may have more than one
trade area (such as a convenience and a destination trade area). Knowing the size and shape of
each trade area is extremely important because its boundaries allow for measurement of the
number of potential customers, their demographics, and their spending potential. This
information provides valuable insight into your community’s customer base and allows you to
calculate demand for stores, products, and services.
This section includes information on how to define your trade area(s). You will be able to apply
these methods to define the most appropriate geographical boundaries using zip codes, political
boundaries or U.S. Census designations.
Learn more:
Factors that Influence Trade Areas Types of Trade Areas Defining Trade Areas using Focus Groups Defining Trade Areas using Geographic Data Defining Trade Areas using Actual Customer Data Appendix: Trade Areas Representing Non-Resident Customers
2
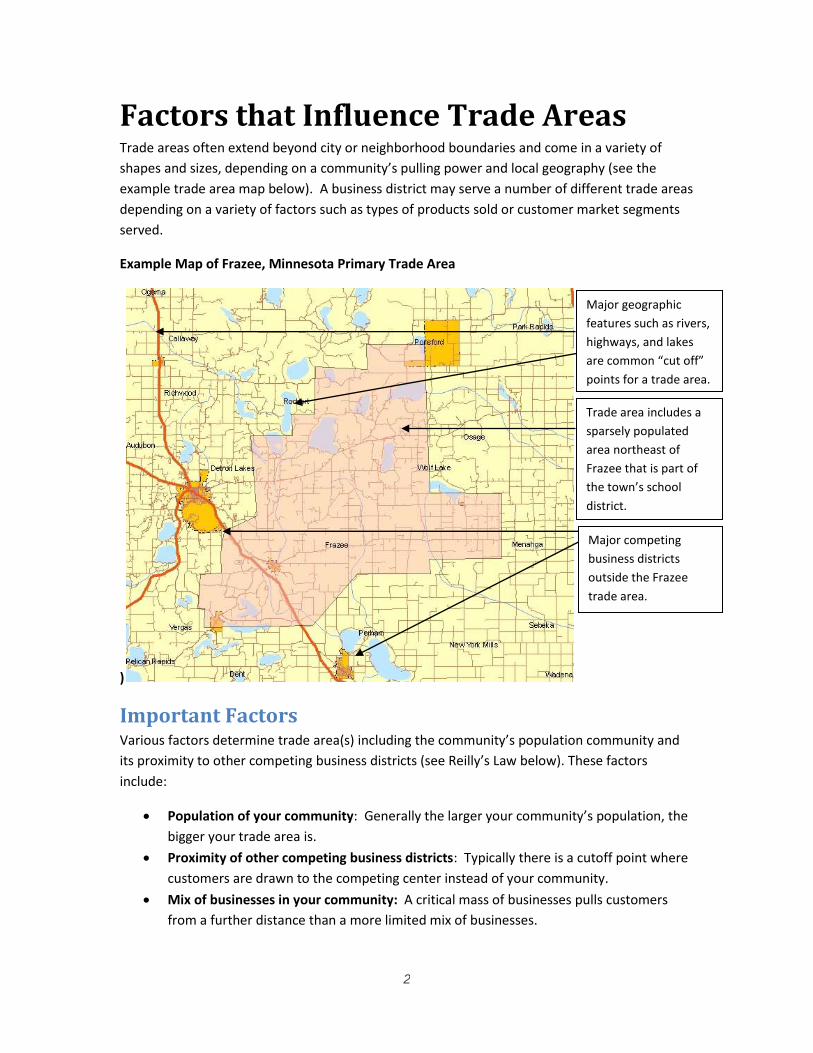
Factors that Influence Trade Areas Trade areas often extend beyond city or neighborhood boundaries and come in a variety of
shapes and sizes, depending on a community’s pulling power and local geography (see the
example trade area map below). A business district may serve a number of different trade areas
depending on a variety of factors such as types of products sold or customer market segments
served.
Example Map of Frazee, Minnesota Primary Trade Area
)
Important Factors Various factors determine trade area(s) including the community’s population community and
its proximity to other competing business districts (see Reilly’s Law below). These factors
include:
Population of your community: Generally the larger your community’s population, the
bigger your trade area is.
Proximity of other competing business districts: Typically there is a cutoff point where
customers are drawn to the competing center instead of your community.
Mix of businesses in your community: A critical mass of businesses pulls customers
from a further distance than a more limited mix of businesses.
Trade area includes a
sparsely populated
area northeast of
Frazee that is part of
the town’s school
district.
Major competing
business districts
outside the Frazee
trade area.
Major geographic
features such as rivers,
highways, and lakes
are common “cut off”
points for a trade area.
3
Destination attractions: A significant destination business (such as a large discount
department store) or community attraction can expand your trade area—drawing
customers from a long distance. However, do not assign a single business’s trade area to
the whole community. Rarely do other businesses match the pull of a prominent
destination business.
Traffic patterns: Each region has distinct traffic patterns strongly impacted by its
network of streets and highways, as well as major landforms such as rivers, lakes, and
mountains.
Reilly's Law of Retail Gravitation Reilly's Law of Retail Gravitation is a theoretical means defining a trade area. It is based on the
premise that people are attracted to larger communities to do their shopping, but the time and
distance they must travel influence their willingness to shop in a given city. In other words,
people are more likely to travel shorter distances when possible. Additionally, customers are
more likely to shop in larger communities as they typically offer more goods and services.
Reilly's Law provides a mathematical formula that can be used to calculate hard numbers
relating the distance people will travel. However, you can also combine a simple map and
common sense to apply the concepts behind Reilly's Law to define general trade area
boundaries.
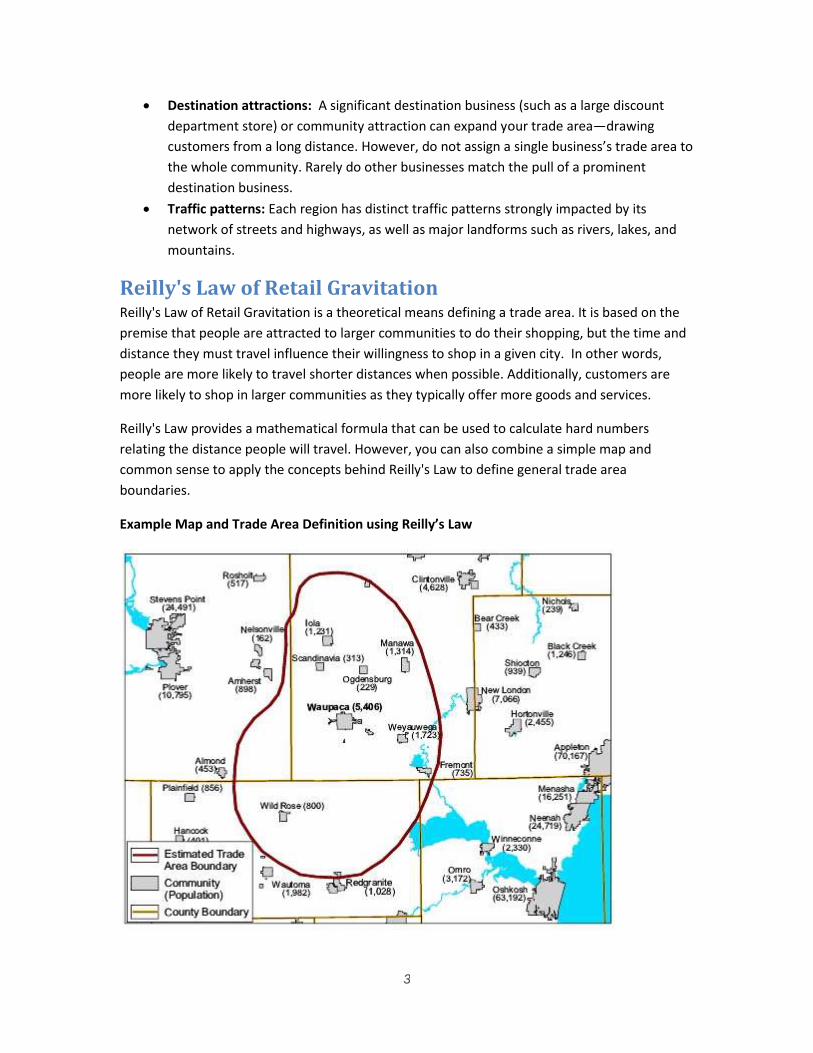
Example Map and Trade Area Definition using Reilly’s Law

4
Consider the map of the Waupaca, Wisconsin (example map above). The map shows the
location of Waupaca along with surrounding communities. The populations of each of these
towns and cities are provided below the community name. Based on community populations
and their distribution, you can draw a simple trade area (shown by the red line) using the
concepts of Reilly's Law.
For instance, residents of Amherst or Nelsonville live closer to Stevens Point than Waupaca.
Furthermore, the Stevens Point area is larger in population. Therefore people living in these
communities will more likely travel to Stevens Point than Waupaca. In contrast, residents of
Ogdensburg are closer to Waupaca and will most likely shop accordingly. From such
observations you can estimate the entire trade area.
While theoretical, using Reilly's Law provides a general sense of the community's trade area as a
whole. This method requires little effort and few resources. However, Reilly’s Law does not
capture possible variations in the trade area. Additionally, Reilly's Law is less appropriate if you
are defining both convenience and destination shopping trade areas. There are ways to
overcome these deficiencies, however, including one based on actual customer data discussed
in the later in this section.
Return to top

5
Types of Trade Areas Trade areas business districts fall under two major categories: convenience trade areas and
destination trade areas. Most small communities encompass only one type of trade area
(primary trade area). However, communities with over 10,000 residents may find it useful to
define both a convenience and a destination trade area.
A convenience trade area is based on the purchase of products and services needed on
a regular basis, such as gasoline, groceries, and hair care. Because these purchases are
relatively frequent, people usually find it more convenient to buy these products and
services from businesses located close to their home or workplace. A grocery store’s
trade area can often be used to represent a community’s convenience trade area.
A destination trade area is based on the purchase of “major” products and services,
such as appliances or furniture, or of products and services that are distinctive in such a
way, such as deeply discounted products and services. People are willing to travel longer
distances to do comparison shopping and purchase these kinds of items. A large
discount department store’s trade area can often be used to represent a community’s
destination trade area.
In addition to differing by types of goods and services, a business district differs in the types of
customers who shop there. Three common market segments are:
1. Local residents within the trade area. As they reside locally year-round, they provide
the majority of spending potential for most businesses. “
2. Daytime employees who may live in the trade area or others who commute from other
communities. They have the potential to make purchases within the trade area during
the workday.
3. Tourists and second- home owners can offer a large amount of spending potential.
While they are not permanent residents, tourists obviously shop while visiting the area.
Analysis of the geographic origin of non-resident customers is discussed in the appendix
of this section.
Return to top

6
Defining Trade Areas Using Focus
Groups Defining trade areas is sometimes more of an art than a science and no one method is always
correct. Whatever method you choose to define a trade area (including convenience and
destination trade areas), make sure the area you ultimately delineate represents the entire
business district or community. If a trade area is too small or too large, your demographic and
spending calculations based on that area will be unrealistic and of questionable value. Focus
groups help you ensure that your trade area will be broadly representative. Two methods for
defining trade areas using focus groups are described below.
Business Owners Focus Group Approach Experienced business owners typically know their customers well. Asking a group of business
owners or operators to undertake a focus group mapping exercise is an efficient way to define
your trade area.
Video: Focus Group Approach to Defining a Trade Area
Steps for Conducting a Business Owners Focus Group Trade Area Exercise:
Hand out printed maps of the general region with a couple rings drawn on the map
(typically 5- and 10- mile radii) to give a sense of distance.
Explain to participants that a local trade area is the area in which a majority of the local
customers live (often defined as the area where 75 percent live). Communities can have
significant number of customers who are seasonal customers, tourists, or other visitors,
but the focus here is on local residents.
Explain that individual businesses have their own trade area. A destination business like
a furniture store typically has a larger trade area than a convenience business like a gas
station or grocery store. For this exercise, participants must not think in terms of their
individual business, but rather in terms of the entire business community. Another way
of framing the idea of a community trade area is to ask participants to visualize various
7
trade areas of individual businesses layered on the same map and try to draw a “typical”
trade area for convenience businesses and one for destination businesses.
Have individual participants shade on the map where they think the convenience and
destination trade areas lie. Again, small communities may have one trade area.
Bring the group to a consensus about the trade area(s) for the overall business district.
Consider using a map displayed on a computer projector for discussion and shade in this
master copy as you elicit feedback from the group. Start by gaining agreement on a core
area and work for consensus, working around the core area to define the extent of the
trade area in each direction (north, south, east, and west). Ask questions like “At what
point would a customer choose to travel to community A rather than your community?”
Some potential pitfalls of the mapping exercise approach are the potential for one or
two strong-willed participants to dominate the exercise and the tendency for
community merchants to inflate their trade area(s). The primary counter to these issues
is to emphasize that the purpose for the exercise is to define a reasonable trade area(s)
for the entire business district (not one or two merchants).
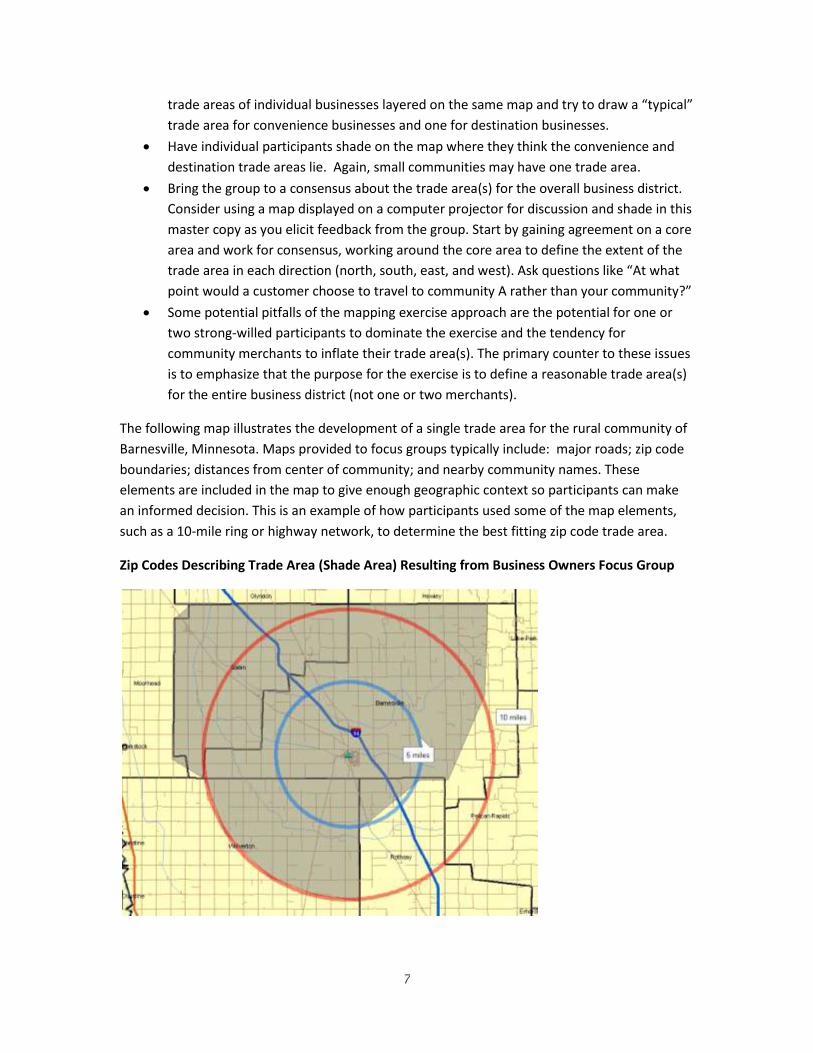
The following map illustrates the development of a single trade area for the rural community of
Barnesville, Minnesota. Maps provided to focus groups typically include: major roads; zip code
boundaries; distances from center of community; and nearby community names. These
elements are included in the map to give enough geographic context so participants can make
an informed decision. This is an example of how participants used some of the map elements,
such as a 10-mile ring or highway network, to determine the best fitting zip code trade area.
Zip Codes Describing Trade Area (Shade Area) Resulting from Business Owners Focus Group
8
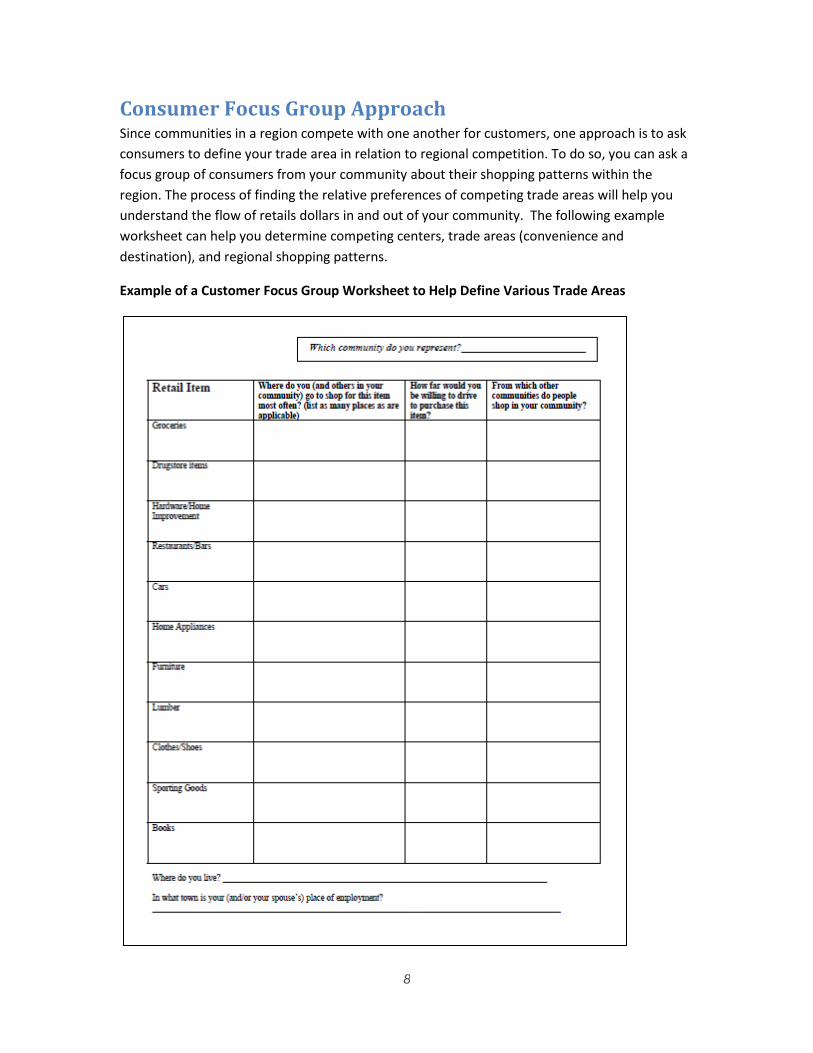
Consumer Focus Group Approach Since communities in a region compete with one another for customers, one approach is to ask
consumers to define your trade area in relation to regional competition. To do so, you can ask a
focus group of consumers from your community about their shopping patterns within the
region. The process of finding the relative preferences of competing trade areas will help you
understand the flow of retails dollars in and out of your community. The following example
worksheet can help you determine competing centers, trade areas (convenience and
destination), and regional shopping patterns.
Example of a Customer Focus Group Worksheet to Help Define Various Trade Areas
9
The worksheet reflects a range of goods so the entire region can be mapped (see the Evaluating
Retail and Service Business Opportunities section for more information on retail goods and their
hierarchy). We also suggest the facilitator bring a map of the region to orient focus group
members. The facilitator also should instruct focus group participants to think not only about
their own shopping habits, but also about where other people living in your community are
likely to shop for these items. Based on participants’ answers to questions, the facilitator can
gain a better sense of shopping patterns within and outside of the community.
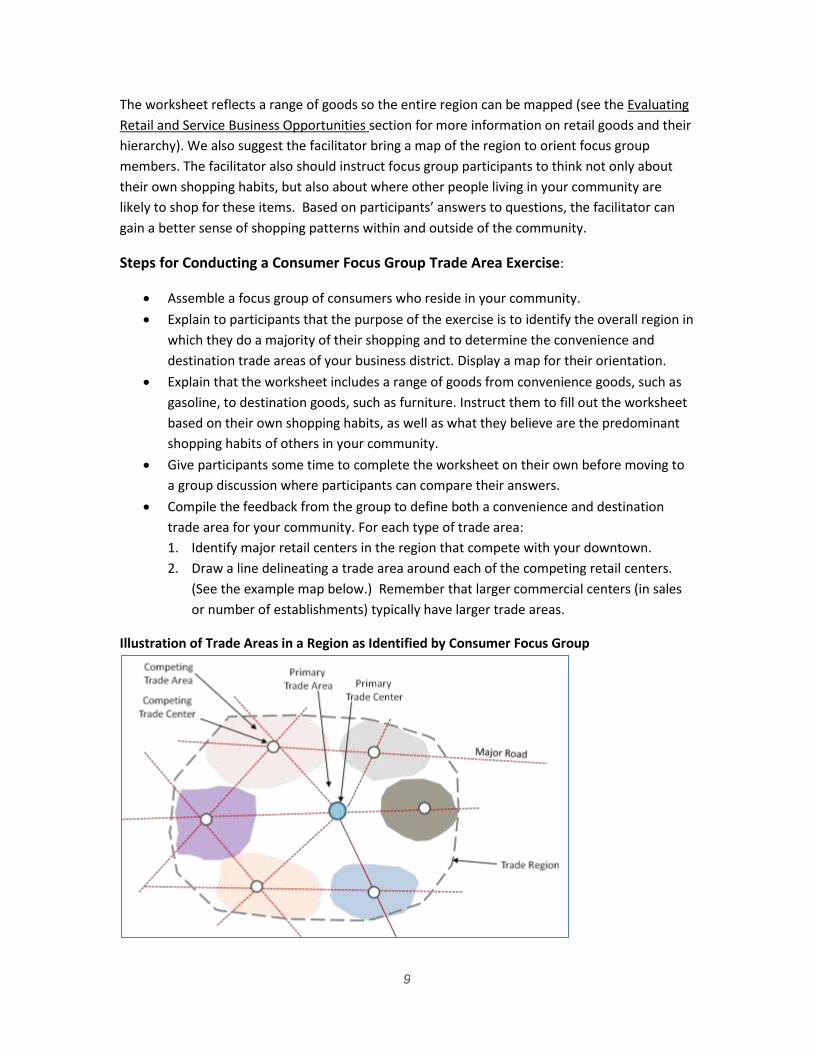
Steps for Conducting a Consumer Focus Group Trade Area Exercise:
Assemble a focus group of consumers who reside in your community.
Explain to participants that the purpose of the exercise is to identify the overall region in
which they do a majority of their shopping and to determine the convenience and
destination trade areas of your business district. Display a map for their orientation.
Explain that the worksheet includes a range of goods from convenience goods, such as
gasoline, to destination goods, such as furniture. Instruct them to fill out the worksheet
based on their own shopping habits, as well as what they believe are the predominant
shopping habits of others in your community.
Give participants some time to complete the worksheet on their own before moving to
a group discussion where participants can compare their answers.
Compile the feedback from the group to define both a convenience and destination
trade area for your community. For each type of trade area:
1. Identify major retail centers in the region that compete with your downtown.
2. Draw a line delineating a trade area around each of the competing retail centers.
(See the example map below.) Remember that larger commercial centers (in sales
or number of establishments) typically have larger trade areas.
Illustration of Trade Areas in a Region as Identified by Consumer Focus Group
10
Return to top
Defining Trade Areas using Geographic
Data Trade area definition is inherently geographic. That is, a trade area defines where customers live
and how far they are likely to travel to a particular business or business district. Thus, basic map
data, such as distances, highways, and physical barriers, can be useful in defining trade areas.
What’s more, using Geographic Information System (GIS) software for trade area analysis offers
a number of advantages over hand-generated mapping techniques.
GIS software matches a variety of data to specific geographic locations and displays the results
on maps rather than in tables or charts. GIS enables you to easily combine a variety of data from
several different sources and formats to create maps that help illustrate important trends in the
data. GIS also aids in the recognition of important market trends that would often go unnoticed
without the ability to visualize the data on a map.
While many users of this toolbox may not have their own desktop-based GIS software, advances
in web-based applications are making these mapping techniques more accessible. Further, there
are many consultants, city planners and marketing data providers who can offer technical or
analytical assistance in using GIS software.
Following are descriptions of five GIS techniques using basic geographic data: simple rings,
data-driven rings, drive-time polygons, equal competition areas, and gravity modeling. Many
of these techniques were drawn from documentation supporting ESRI’s ArcGIS Business Analyst
GIS software.
11
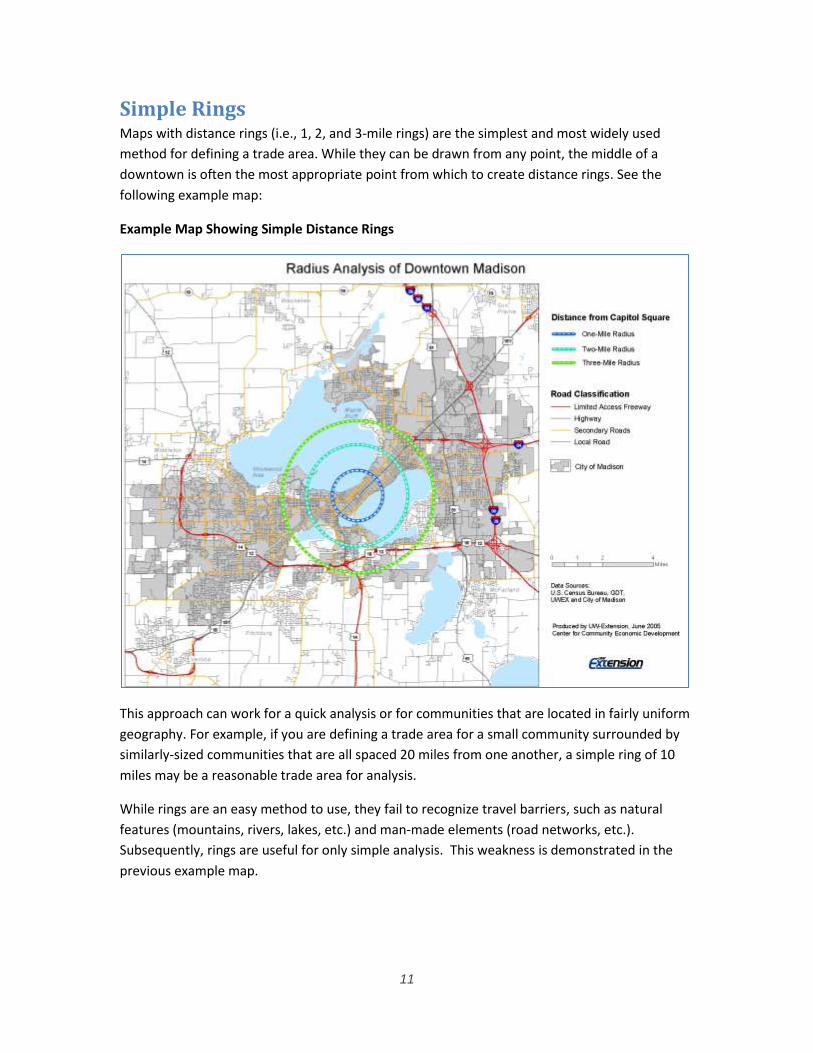
Simple Rings Maps with distance rings (i.e., 1, 2, and 3-mile rings) are the simplest and most widely used
method for defining a trade area. While they can be drawn from any point, the middle of a
downtown is often the most appropriate point from which to create distance rings. See the
following example map:
Example Map Showing Simple Distance Rings
This approach can work for a quick analysis or for communities that are located in fairly uniform
geography. For example, if you are defining a trade area for a small community surrounded by
similarly-sized communities that are all spaced 20 miles from one another, a simple ring of 10
miles may be a reasonable trade area for analysis.
While rings are an easy method to use, they fail to recognize travel barriers, such as natural
features (mountains, rivers, lakes, etc.) and man-made elements (road networks, etc.).
Subsequently, rings are useful for only simple analysis. This weakness is demonstrated in the
previous example map.
12
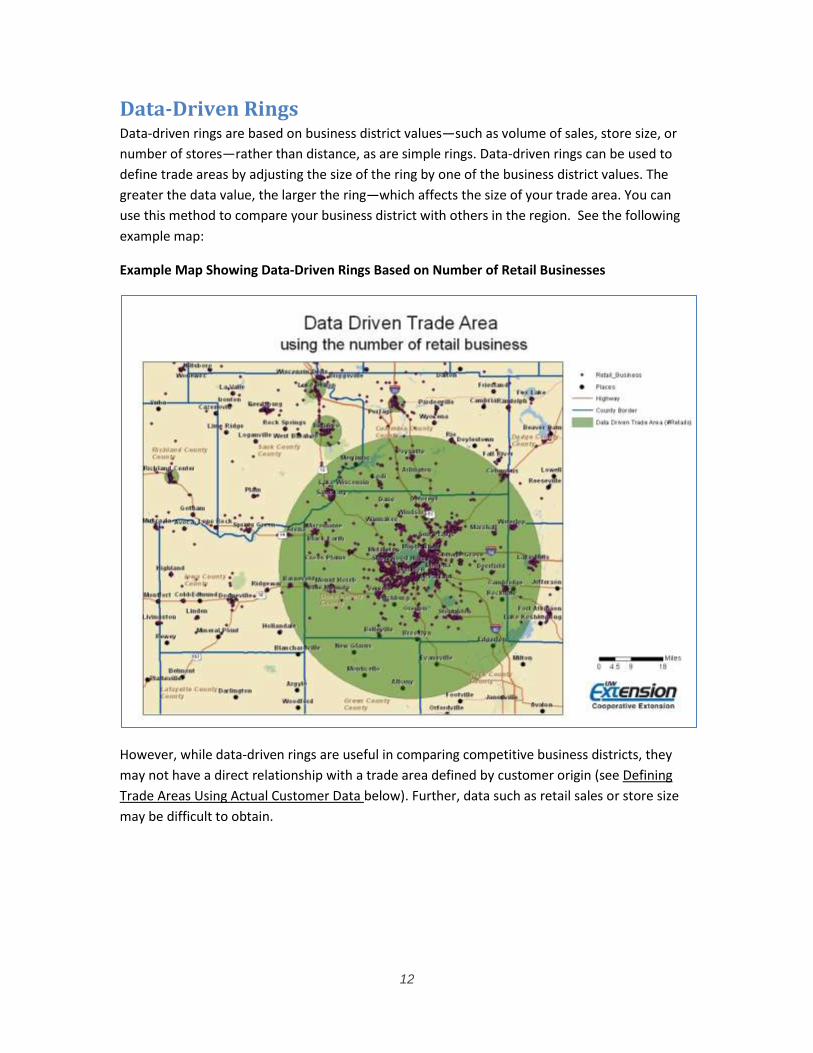
Data-Driven Rings Data-driven rings are based on business district values—such as volume of sales, store size, or
number of stores—rather than distance, as are simple rings. Data-driven rings can be used to
define trade areas by adjusting the size of the ring by one of the business district values. The
greater the data value, the larger the ring—which affects the size of your trade area. You can
use this method to compare your business district with others in the region. See the following
example map:
Example Map Showing Data-Driven Rings Based on Number of Retail Businesses
However, while data-driven rings are useful in comparing competitive business districts, they
may not have a direct relationship with a trade area defined by customer origin (see Defining
Trade Areas Using Actual Customer Data below). Further, data such as retail sales or store size
may be difficult to obtain.
13
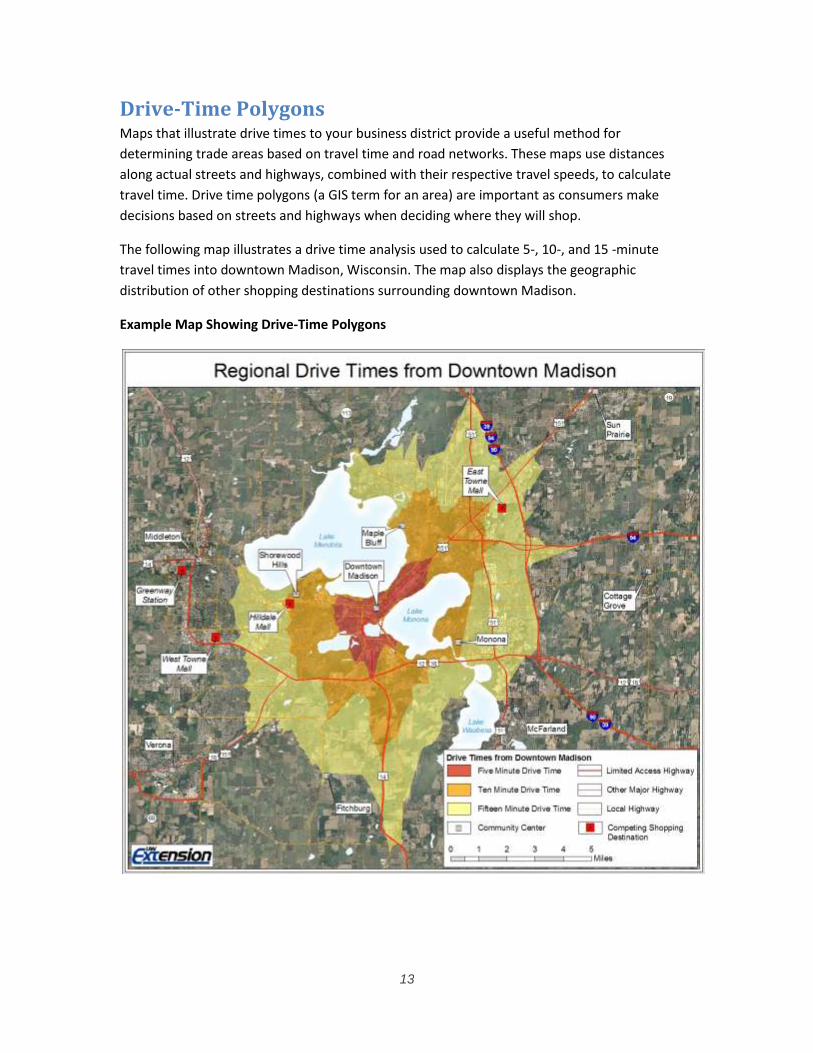
Drive-Time Polygons Maps that illustrate drive times to your business district provide a useful method for
determining trade areas based on travel time and road networks. These maps use distances
along actual streets and highways, combined with their respective travel speeds, to calculate
travel time. Drive time polygons (a GIS term for an area) are important as consumers make
decisions based on streets and highways when deciding where they will shop.
The following map illustrates a drive time analysis used to calculate 5-, 10-, and 15 -minute
travel times into downtown Madison, Wisconsin. The map also displays the geographic
distribution of other shopping destinations surrounding downtown Madison.
Example Map Showing Drive-Time Polygons
14
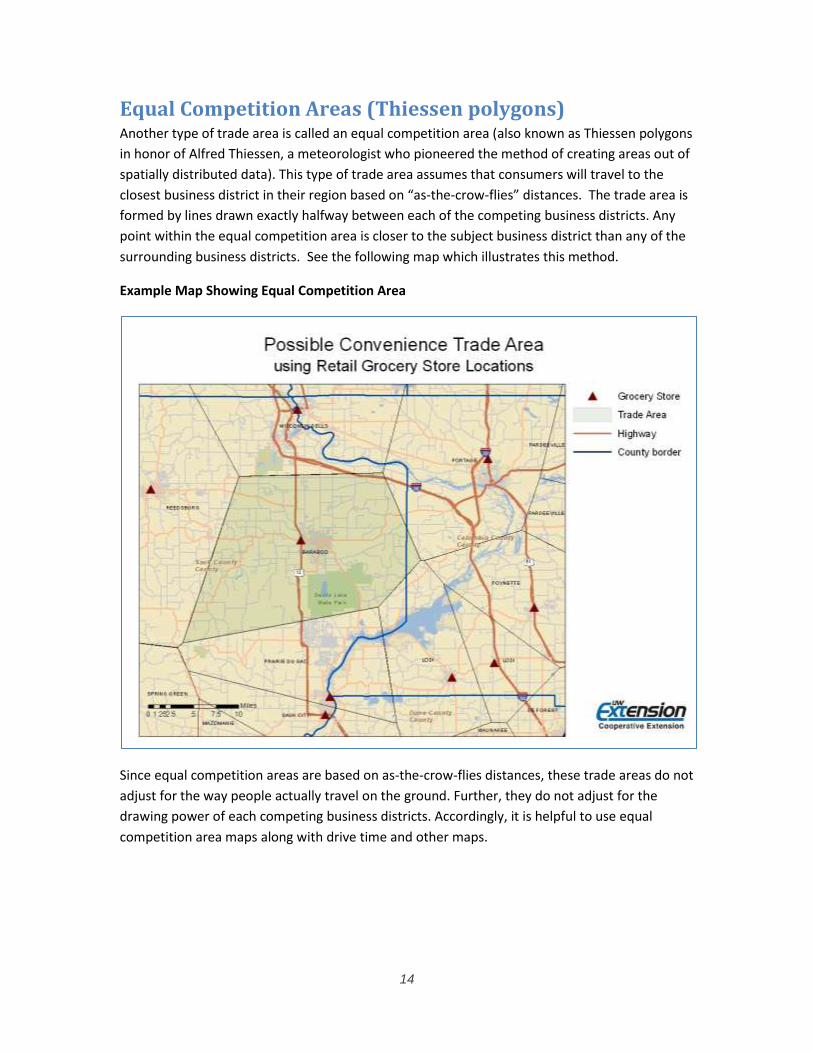
Equal Competition Areas (Thiessen polygons) Another type of trade area is called an equal competition area (also known as Thiessen polygons
in honor of Alfred Thiessen, a meteorologist who pioneered the method of creating areas out of
spatially distributed data). This type of trade area assumes that consumers will travel to the
closest business district in their region based on “as-the-crow-flies” distances. The trade area is
formed by lines drawn exactly halfway between each of the competing business districts. Any
point within the equal competition area is closer to the subject business district than any of the
surrounding business districts. See the following map which illustrates this method.
Example Map Showing Equal Competition Area
Since equal competition areas are based on as-the-crow-flies distances, these trade areas do not
adjust for the way people actually travel on the ground. Further, they do not adjust for the
drawing power of each competing business districts. Accordingly, it is helpful to use equal
competition area maps along with drive time and other maps.
15
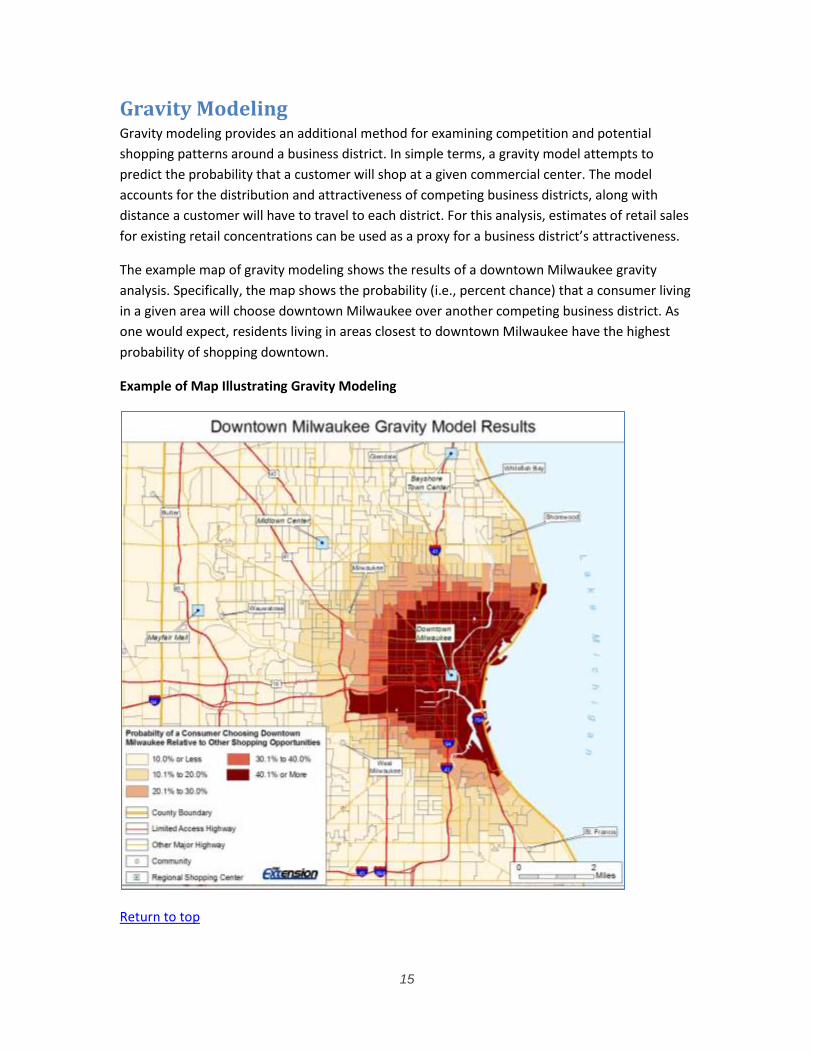
Gravity Modeling Gravity modeling provides an additional method for examining competition and potential
shopping patterns around a business district. In simple terms, a gravity model attempts to
predict the probability that a customer will shop at a given commercial center. The model
accounts for the distribution and attractiveness of competing business districts, along with
distance a customer will have to travel to each district. For this analysis, estimates of retail sales
for existing retail concentrations can be used as a proxy for a business district’s attractiveness.
The example map of gravity modeling shows the results of a downtown Milwaukee gravity
analysis. Specifically, the map shows the probability (i.e., percent chance) that a consumer living
in a given area will choose downtown Milwaukee over another competing business district. As
one would expect, residents living in areas closest to downtown Milwaukee have the highest
probability of shopping downtown.
Example of Map Illustrating Gravity Modeling
Return to top
16
Defining Trade Areas using Actual
Customer Data Trade areas based on actual customer data have a number of distinct advantages. Combining
actual customer addresses or zip codes with GIS allows you to uncover relationships and
perform calculations unavailable with tabular data. A GIS can visually display where customers
are coming from, show how customer concentrations are related over an area and perform
advanced distance-based calculations. See Defining Trade Areas using Geographic Data.
You can collect address or zip code data using a variety of methods and sources. However,
regardless of how the data is obtained, this method offers a number of advantages, including:
Collecting information from customers allows the trade area to be based on real
business data, instead of created from estimates.
Comparing the trade area maps of different businesses can identify opportunities to
increase market size and penetration. For instance, the trade areas for businesses that
primarily sell convenience items can be compared with each other to identify variation.
These differences could indicate potential market expansion opportunities for some of
the businesses. The same can be done for comparison shopping businesses.
Trade areas for different market segments can be compared. Businesses serving
residents can be compared to the origins (or home address) of employees at a major
employer. Furthermore, addresses or zip codes are ideal for tracking the origins of
tourists.
While using customer addresses or zip codes to analyze a trade area has the ability to capture
trade area variability, an appropriate sample of customer lists from participating businesses
must be incorporated. For instance, stores that serve both convenience and destination
shopping segments are necessary to understand the local market. Businesses that serve
tourists must be incorporated into your analysis to examine the tourist market segment.
Employee lists from major employers are necessary to explore the daytime population market
segment.
Trade Area Based on Customer Street Addresses Ideally, customer origins are defined by a street address. While zip codes can be used, knowing
the street address will allow for a more accurate trade area definition. Using the street address
and a process known as geocoding, GIS software can map the origin of each customer. After
mapping each address, another GIS technique can be used to define rings based on the
percentage of overall customers. These rings, or customer penetration polygons, can be drawn
according to different customer percentages. Furthermore, these customer penetration
polygons help account for the store trade area in the context of demographics, travel barriers
and other market characteristics.
17
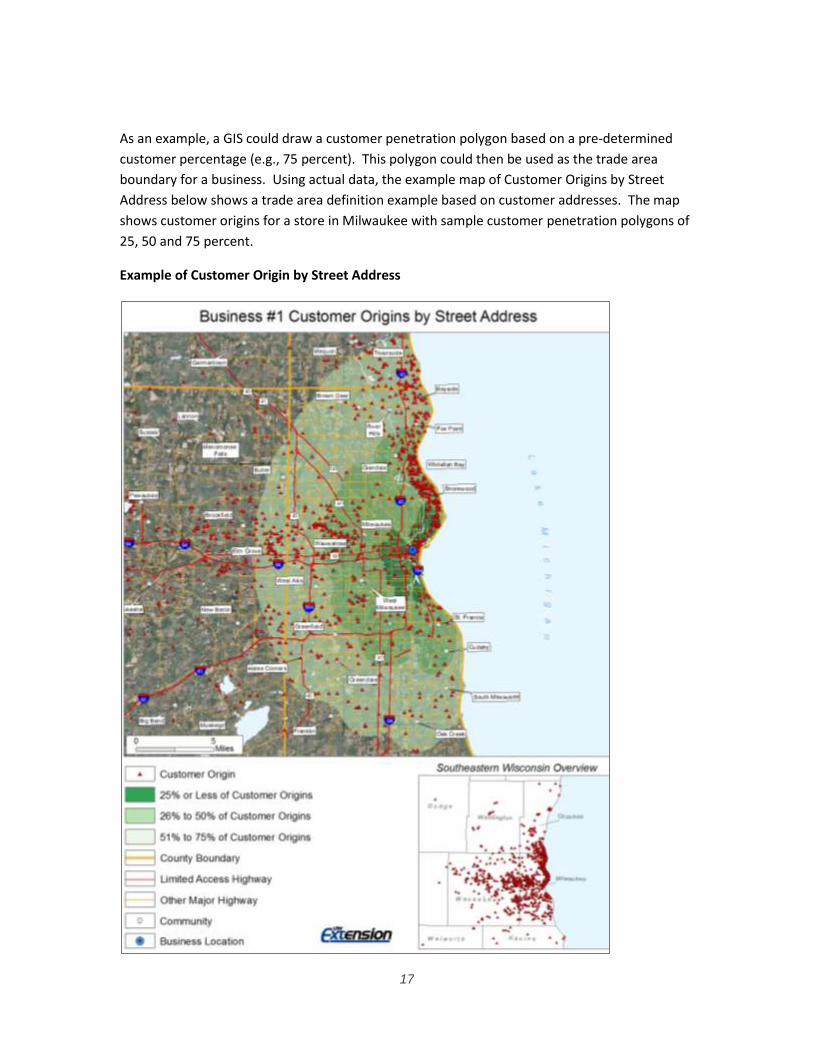
As an example, a GIS could draw a customer penetration polygon based on a pre-determined
customer percentage (e.g., 75 percent). This polygon could then be used as the trade area
boundary for a business. Using actual data, the example map of Customer Origins by Street
Address below shows a trade area definition example based on customer addresses. The map
shows customer origins for a store in Milwaukee with sample customer penetration polygons of
25, 50 and 75 percent.
Example of Customer Origin by Street Address
18
Trade Area Based on Customer Zip Codes While customer street addresses are advantageous, zip codes are a viable alternative. Although
not as precise in pinpointing customer origins as street addresses, zip codes are easier to collect
and work well in rural areas where geocoding accuracy often diminishes. You can categorize
customer zip codes by the percentage of customers (patronizing a business district) originating
from each zip code. These percentages can then be mapped to show the relative origins of
customers.
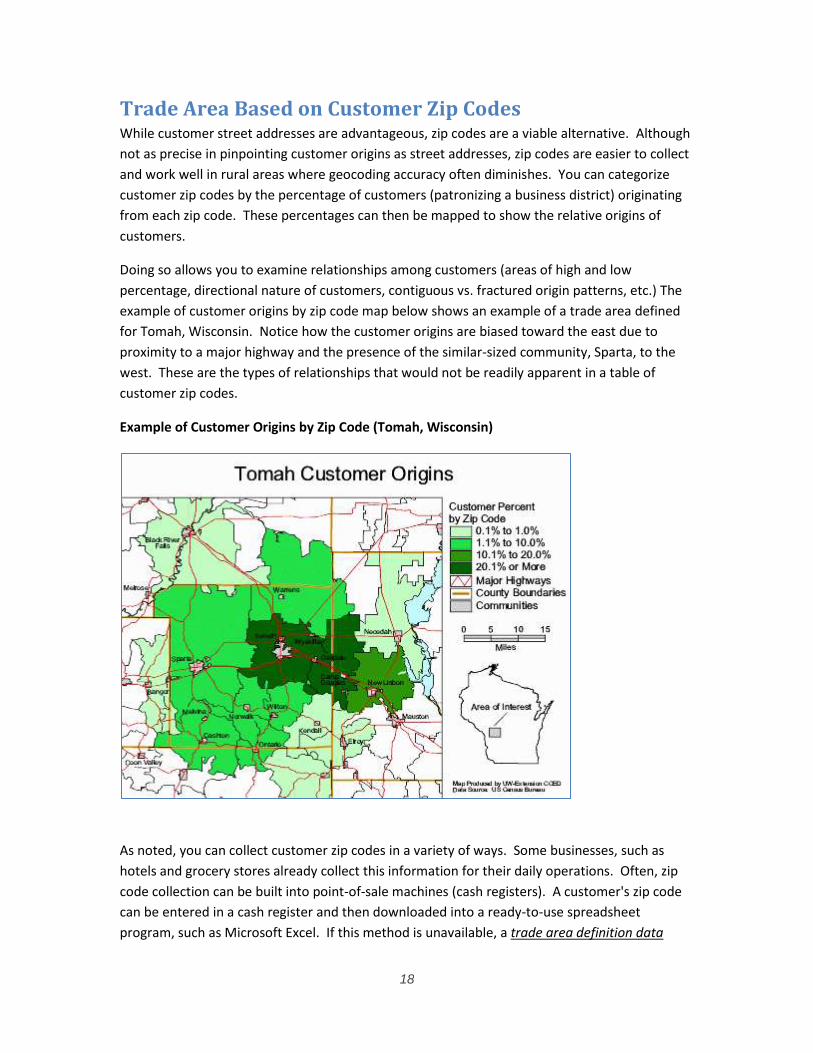
Doing so allows you to examine relationships among customers (areas of high and low
percentage, directional nature of customers, contiguous vs. fractured origin patterns, etc.) The
example of customer origins by zip code map below shows an example of a trade area defined
for Tomah, Wisconsin. Notice how the customer origins are biased toward the east due to
proximity to a major highway and the presence of the similar-sized community, Sparta, to the
west. These are the types of relationships that would not be readily apparent in a table of
customer zip codes.
Example of Customer Origins by Zip Code (Tomah, Wisconsin)
As noted, you can collect customer zip codes in a variety of ways. Some businesses, such as
hotels and grocery stores already collect this information for their daily operations. Often, zip
code collection can be built into point-of-sale machines (cash registers). A customer's zip code
can be entered in a cash register and then downloaded into a ready-to-use spreadsheet
program, such as Microsoft Excel. If this method is unavailable, a trade area definition data
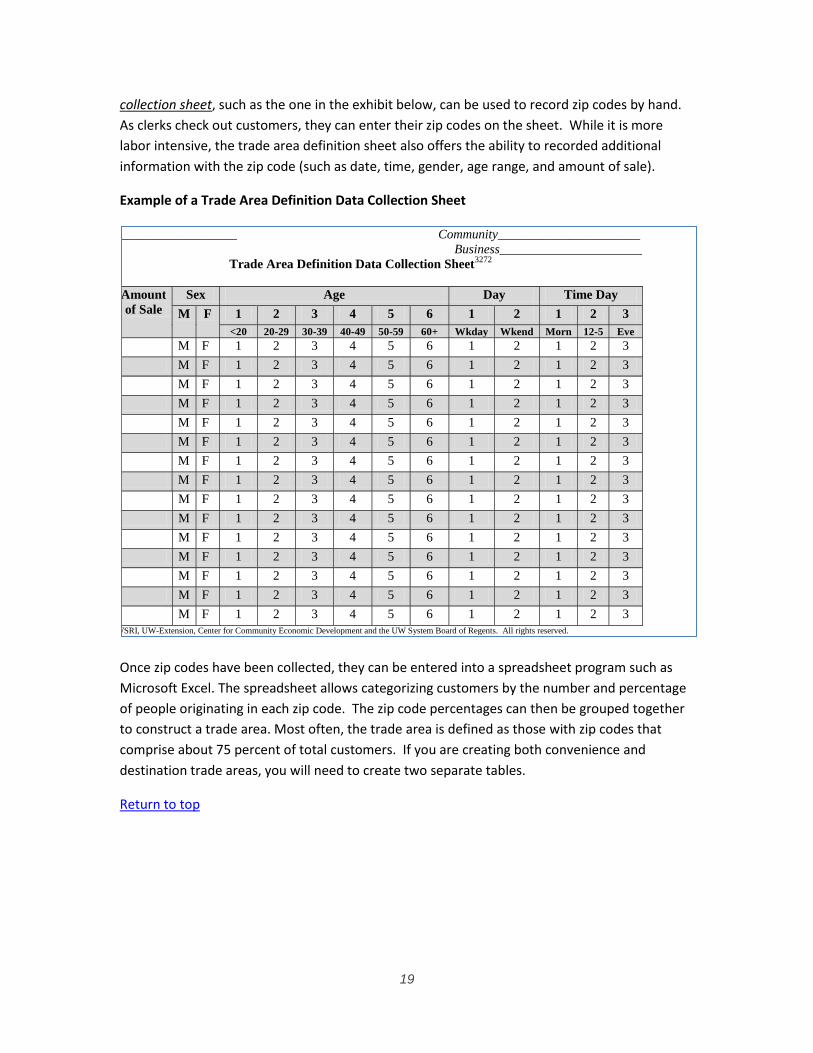
19
collection sheet, such as the one in the exhibit below, can be used to record zip codes by hand.
As clerks check out customers, they can enter their zip codes on the sheet. While it is more
labor intensive, the trade area definition sheet also offers the ability to recorded additional
information with the zip code (such as date, time, gender, age range, and amount of sale).
Example of a Trade Area Definition Data Collection Sheet
Once zip codes have been collected, they can be entered into a spreadsheet program such as
Microsoft Excel. The spreadsheet allows categorizing customers by the number and percentage
of people originating in each zip code. The zip code percentages can then be grouped together
to construct a trade area. Most often, the trade area is defined as those with zip codes that
comprise about 75 percent of total customers. If you are creating both convenience and
destination trade areas, you will need to create two separate tables.
Return to top
Date______________________ Community______________________
Business______________________
Trade Area Definition Data Collection Sheet3272
ZIP
Amount
of Sale
Sex Age Day Time Day
M F 1 2 3 4 5 6 1 2 1 2 3
<20 20-29 30-39 40-49 50-59 60+ Wkday Wkend Morn 12-5 Eve
M F 1 2 3 4 5 6 1 2 1 2 3
M F 1 2 3 4 5 6 1 2 1 2 3
M F 1 2 3 4 5 6 1 2 1 2 3
M F 1 2 3 4 5 6 1 2 1 2 3
M F 1 2 3 4 5 6 1 2 1 2 3
M F 1 2 3 4 5 6 1 2 1 2 3
M F 1 2 3 4 5 6 1 2 1 2 3
M F 1 2 3 4 5 6 1 2 1 2 3
M F 1 2 3 4 5 6 1 2 1 2 3
M F 1 2 3 4 5 6 1 2 1 2 3
M F 1 2 3 4 5 6 1 2 1 2 3
M F 1 2 3 4 5 6 1 2 1 2 3
M F 1 2 3 4 5 6 1 2 1 2 3
M F 1 2 3 4 5 6 1 2 1 2 3
M F 1 2 3 4 5 6 1 2 1 2 3
©1998 by WSRI, UW-Extension, Center for Community Economic Development and the UW System Board of Regents. All rights reserved.
20
Appendix: Trade Areas Representing
Non-Local Customers Generally, local residents provide a majority of sales in a community since most shop in town (or
in the region) year-round. However, some communities have important customer segments that
do not live locally, such as day-time employees, seasonal residents, and tourists. Because these
customers live some distance away, the addition of “non-local customer” trade areas may be
helpful if you want to include their demographics and spending potential in your analysis. We
focus on tourists in this appendix, but techniques are useful for analyzing all types of non-local
resident customers.
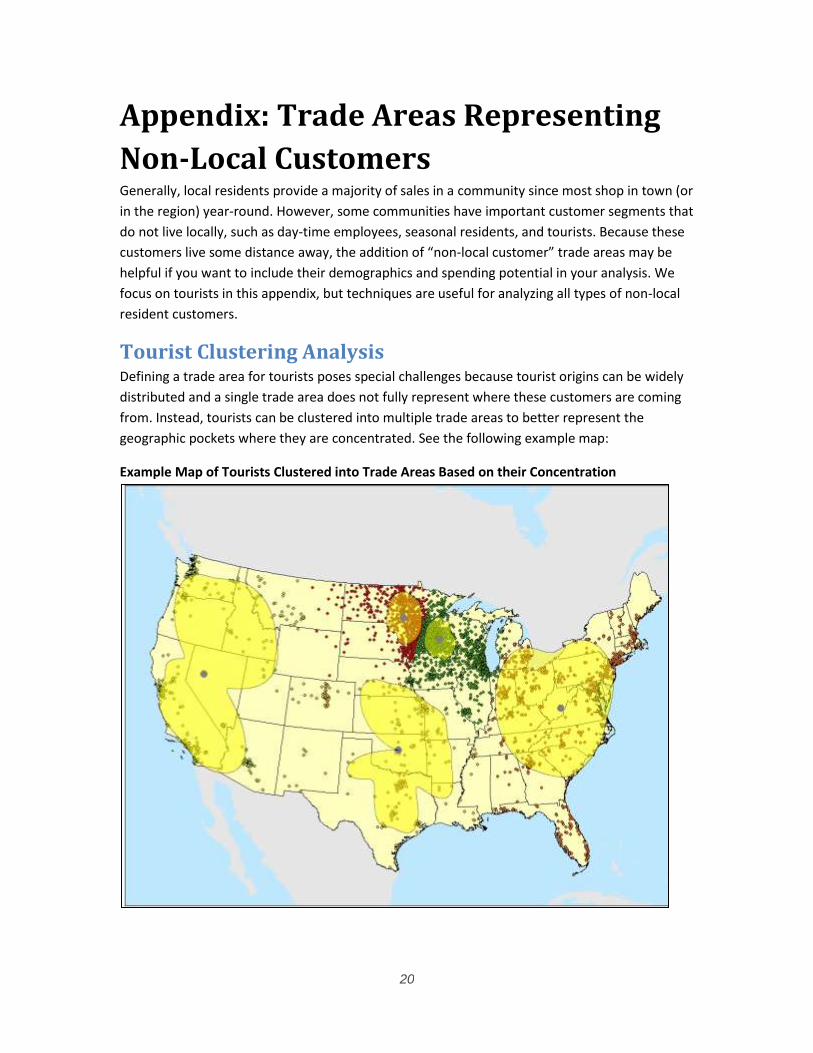
Tourist Clustering Analysis Defining a trade area for tourists poses special challenges because tourist origins can be widely
distributed and a single trade area does not fully represent where these customers are coming
from. Instead, tourists can be clustered into multiple trade areas to better represent the
geographic pockets where they are concentrated. See the following example map:
Example Map of Tourists Clustered into Trade Areas Based on their Concentration
21
As noted, you can use a similar approach for discerning clusters for other non-local resident
customers, such as in-commuters, seasonal residents, or any other segment whose spending
affects your business district but live (year-round) outside your community.
Tourist Profiling and Prospecting By mapping the origins of your tourists, you can also analyze the demographics of their home
neighborhoods as a basis for attracting tourists from other neighborhoods with similar
demographics. Here again, you can use GIS software with existing customer address lists to
generate a profile or their origins and demographics of their neighborhoods. GIS then uses this
information to search (prospect) for potential new customers.
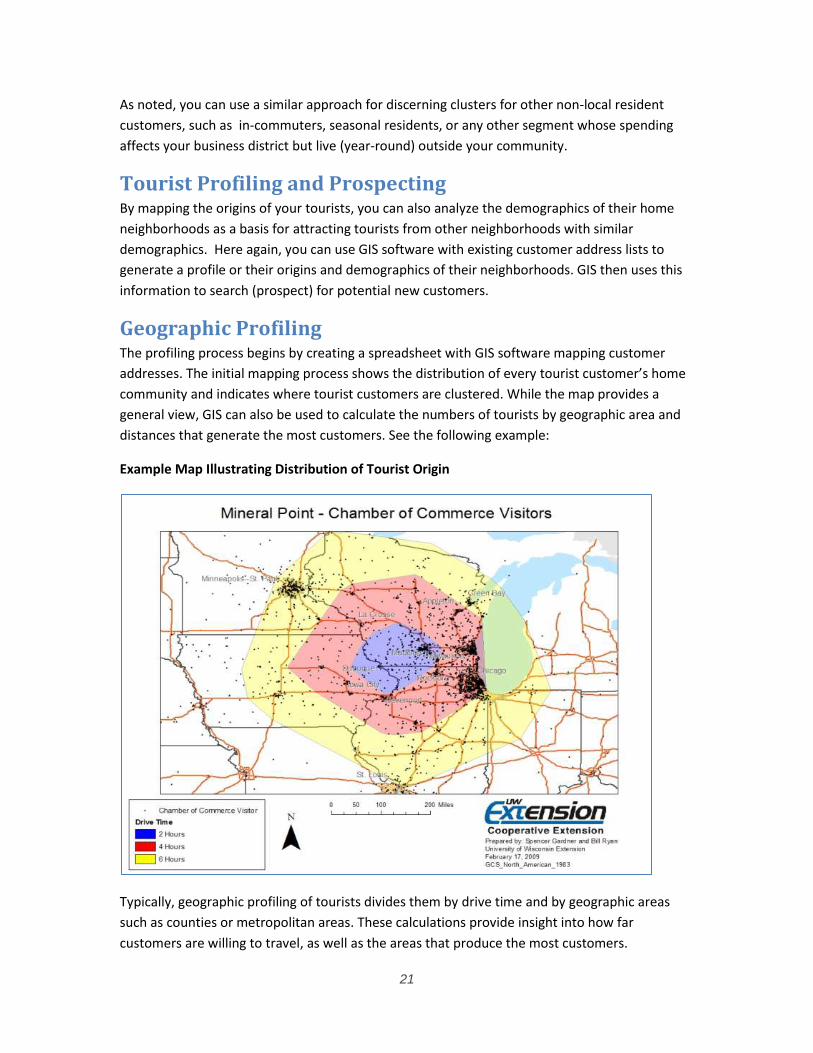
Geographic Profiling The profiling process begins by creating a spreadsheet with GIS software mapping customer
addresses. The initial mapping process shows the distribution of every tourist customer’s home
community and indicates where tourist customers are clustered. While the map provides a
general view, GIS can also be used to calculate the numbers of tourists by geographic area and
distances that generate the most customers. See the following example:
Example Map Illustrating Distribution of Tourist Origin
Typically, geographic profiling of tourists divides them by drive time and by geographic areas
such as counties or metropolitan areas. These calculations provide insight into how far
customers are willing to travel, as well as the areas that produce the most customers.
22
Demographic Profiling In addition to identifying the geographic origin of tourist customers, GIS also provides their
demographic composition. By knowing customer addresses, demographic information can be
obtained about the neighborhoods where they live. This is because pre-defined neighborhoods,
such as census block groups or zip codes, have robust demographic information associated with
their boundaries. GIS can link neighborhood demographic information to each customer
address. The combination generates a neighborhood demographic profile that describes all
customers coming from that location. The profile can contain information such as visitors'
incomes, professions, marital status, ages, and education levels. Using customer segmentation
data from private data firms, GIS profiling methods can also be used to describe tourist
customers’ lifestyles and preferred leisure activities, as well as products they may purchase.
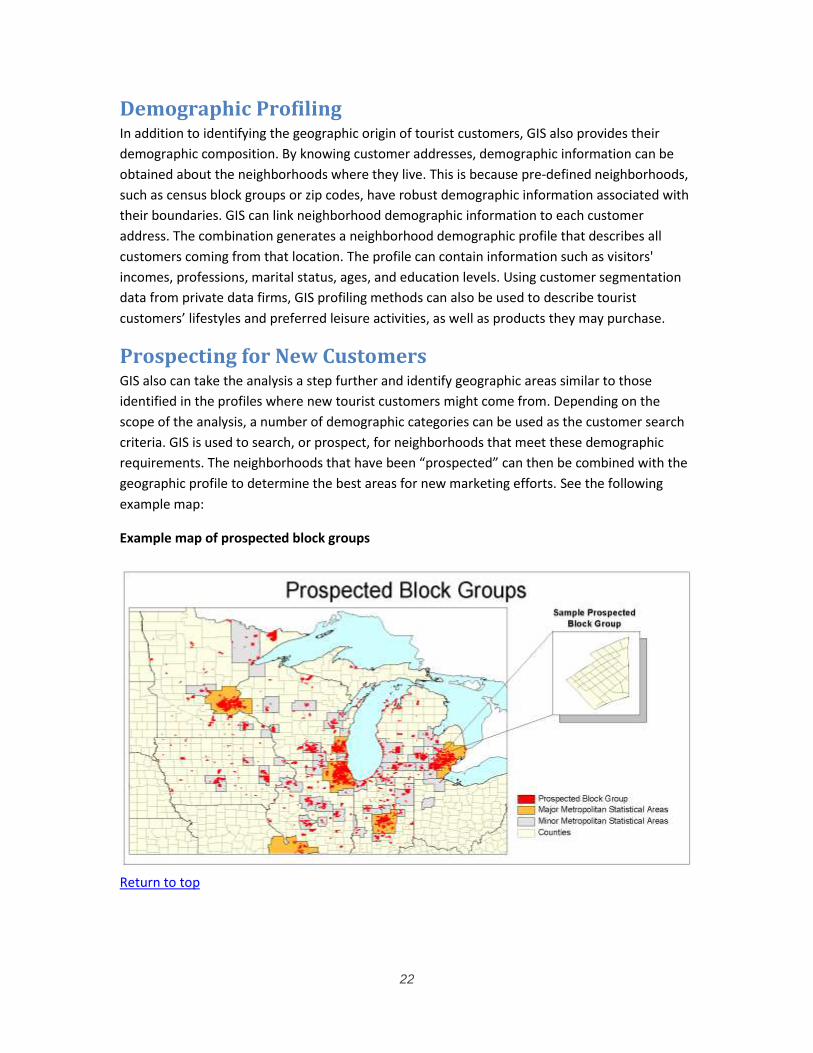
Prospecting for New Customers GIS also can take the analysis a step further and identify geographic areas similar to those
identified in the profiles where new tourist customers might come from. Depending on the
scope of the analysis, a number of demographic categories can be used as the customer search
criteria. GIS is used to search, or prospect, for neighborhoods that meet these demographic
requirements. The neighborhoods that have been “prospected” can then be combined with the
geographic profile to determine the best areas for new marketing efforts. See the following
example map:
Example map of prospected block groups
Return to top
23
About the Toolbox and this Section
The 2011 update of the Downtown and Business District Market Analysis toolbox is a result of a
collaborative effort involving University of Minnesota Extension, Ohio State University
Extension, and University of Wisconsin Extension. The update was supported with funding from
the North Central Regional Center for Rural Development.
The toolbox is based on and supportive of the economic restructuring principles of the National
Trust Main Street Center. The Wisconsin Main Street Program (Wisconsin Department of
Commerce) has been an instrumental partner in the development of this toolbox.
This section builds on work originally completed by Matt Kures, Bill Pinkovitz and Bill Ryan of University of Wisconsin Extension. This update includes new methods added by Jill Clark of Ohio State University Extension, and Ryan Pesch of University of Minnesota Extension. Edited by Mary Vitcenda of the University of Minnesota Extension. March 30, 2011