Computational Analysis of the Free Trade Area of the...
37
RESEARCH SEMINAR IN INTERNATIONAL ECONOMICS RESEARCH SEMINAR IN INTERNATIONAL ECONOMICS Gerald R. Ford School of Public Policy Gerald R. Ford School of Public Policy The University of Michigan The University of Michigan Ann Arbor, Michigan 48109-1220 Ann Arbor, Michigan 48109-1220 Discussion Paper No. 528 Discussion Paper No. 528 Computational Analysis of the Free Trade Computational Analysis of the Free Trade Area of the Americas (FTAA) Area of the Americas (FTAA) Drusilla K. Brown Drusilla K. Brown Tufts University Tufts University Kozo Kiyota Kozo Kiyota Yokohama National University Yokohama National University and and University of Michigan University of Michigan Robert M. Stern Robert M. Stern University of Michigan University of Michigan Revised, February 5, 2005 Revised, February 5, 2005 Recent RSIE Discussion Papers are available on the World Wide Web at: http://www.spp.umich.edu/rsie/workingpapers/wp.html Recent RSIE Discussion Papers are available on the World Wide Web at: http://www.spp.umich.edu/rsie/workingpapers/wp.html
Transcript of Computational Analysis of the Free Trade Area of the...

RESEARCH SEMINAR IN INTERNATIONAL ECONOMICS RESEARCH SEMINAR IN INTERNATIONAL ECONOMICS
Gerald R. Ford School of Public Policy Gerald R. Ford School of Public Policy The University of Michigan The University of Michigan
Ann Arbor, Michigan 48109-1220 Ann Arbor, Michigan 48109-1220
Discussion Paper No. 528 Discussion Paper No. 528
Computational Analysis of the Free Trade Computational Analysis of the Free Trade Area of the Americas (FTAA) Area of the Americas (FTAA)
Drusilla K. Brown Drusilla K. Brown
Tufts University Tufts University
Kozo Kiyota Kozo Kiyota
Yokohama National University Yokohama National University and and
University of Michigan University of Michigan
Robert M. Stern Robert M. Stern
University of Michigan University of Michigan
Revised, February 5, 2005 Revised, February 5, 2005
Recent RSIE Discussion Papers are available on the World Wide Web at: http://www.spp.umich.edu/rsie/workingpapers/wp.html
Recent RSIE Discussion Papers are available on the World Wide Web at: http://www.spp.umich.edu/rsie/workingpapers/wp.html

NAJEF FTAA Paper, February 5, 2005
COMPUTATIONAL ANALYSIS OF THE FREE TRADE AREA OF THE AMERICAS (FTAA)
Drusilla K. Brown, Tufts University
Kozo Kiyota, Yokohama National University Robert M. Stern, University of Michigan
Abstract
We use the Michigan Model of World Production and Trade to assess the economic effects of the Free Trade Area of the Americas (FTAA) that is currently being negotiated among the 34 countries in the region. The model covers 18 economic sectors in each of 22 countries/regions and is based on Version 5.4 of the GTAP database for 1997 together with specially constructed estimates of services barriers and other data on sectoral employment and numbers of firms. The distinguishing feature of the model is that it incorporates some aspects of trade with imperfect competition in the manufacturing and services sectors, including monopolistic competition, increasing returns, and product variety. The modeling focus is on the effects of the bilateral removal of tariffs on agriculture and manufactures and services barriers. Rules of origin and other restrictive measures and the non-trade aspects of the FTAA are not taken into account due to data constraints. The computational results indicate that the FTAA would increase the economic welfare of the FTAA member countries by $118.8 billion, with the largest increases accruing to the United States, $67.6 billion, and to South America, $31.0 billion. The FTAA is trade diverting for most of the rest-of-world, with a welfare reduction of $9.3 billion. In comparison, if the FTAA countries were to adopt unilateral free trade, total FTAA member welfare would increase by $476.8 billion and global welfare by $812.7 billion. If multilateral free trade were adopted by all countries/regions in the global trading system, the welfare effects would be considerably larger, $751.2 billion for the FTAA members and $2.7 trillion globally. Revised February 5, 2005 Address correspondence to: Robert M. Stern Department of Economics University of Michigan Ann Arbor, MI 48109-1220 Tel. 734-764-2373 Fax 734-763-9181 E-mail [email protected] Keywords: Free Trade Agreements, Unilateral Liberalization, Multilateral Liberalization JEL: F10; F13; F15
COMPUTATIONAL ANALYSIS OF THE FREE TRADE AREA OF THE AMERICAS (FTAA)�
Drusilla K. Brown, Tufts University Kozo Kiyota, Yokohama National University �
Robert M. Stern, University of Michigan
I. Introduction
This paper presents a computational analysis of the economic effects of the Free Trade
Area of the Americas that is currently being negotiated by the 34 countries in the region. The
initiative for the FTAA was first announced in December 1994 at the Summit of the Americas in
Miami and is supposed to be completed in 2005. The analysis of the FTAA is based on the
Michigan Model of World Production and Trade. This is a multi-country/multi-sectoral
computable general equilibrium (CGE) model of the global trading system that has been used for
over three decades to analyze the economic effects of multilateral, regional, and bilateral trade
negotiations and a variety of other changes in trade and related policies.
In Section II following, we present a brief description of the main features and data of the
Michigan Model. In Section III, we present brief background information on the FTAA and U.S.
FTAA negotiating proposals together with presentation of the modeling results of the potential
economic effects of the FTAA on the economic welfare, trade, output, and employment for the
United States, Canada, Chile, Mexico, and aggregates of 19 countries in Central America and the
Caribbean (excluding Cuba) and 11 countries in South America (excluding Chile). In Section IV,
we provide a broader perspective on the FTAA that takes into account the effects of the unilateral
removal of trade barriers by the aforementioned FTAA countries/regions and the effects of global
free trade in which all countries/regions covered in the model are assumed to remove their
� The research in this paper was funded by the U.S. Department of Labor (DOL). The analysis and conclusions are those of the authors and do not necessarily reflect those of the DOL or the U.S. Government. Helpful comments on an earlier version of the paper were provided by Greg Schoepfle and anonymous referees. � Kozo Kiyota was a Visiting Scholar at the University of Michigan when this research was undertaken and would like to thank the Kikawada Fellowship Program for providing financial support.
2
existing trade barriers on a multilateral basis. Section V contains a summary and concluding
remarks.
II. The Michigan Model of World Production and Trade
Overview of the Michigan Model
The version of the Michigan Model that we use in this paper covers each of 22
countries/regions and 18 economic sectors, including agriculture, manufactures, and services.
The distinguishing feature of the Michigan Model is that it incorporates some aspects of trade with
imperfect competition, including monopolistic competition, increasing returns to scale, and product
variety. A more complete description of the formal structure and equations of the model can be
found on line at www.Fordschool.umich.edu/rsie/model/.1
Interpreting the Modeling Results
To help the reader interpret the modeling results to be presented, it is useful to review the
features of the model that serve to identify the various economic effects to be reflected in the
different applications of the model. Although the model includes the aforementioned features of
imperfect competition, it remains the case that markets respond to trade liberalization in much the
same way that they would with perfect competition. That is, when tariffs or other trade barriers
are reduced in a sector, domestic buyers (both final and intermediate) substitute towards imports
and the domestic competing industry contracts production while foreign exporters expand. Thus,
in the case of multilateral liberalization that reduces tariffs and other trade barriers simultaneously
in most sectors and countries, each country�s industries share in both of these effects, expanding
or contracting depending primarily on whether their protection is reduced more or less than in
other sectors and countries.
1 See also Deardorff and Stern (1990, esp. pp. 9-46), Brown and Stern (1989a,b), and Brown, Kiyota, and Stern (2005a,b).
3
Worldwide, these changes cause increased international demand for all sectors. World
prices increase most for those sectors where trade barriers fall the most.2 This in turn causes
changes in countries� terms of trade that can be positive or negative. Those countries that are net
exporters of goods with the greatest degree of liberalization will experience increases in their
terms of trade, as the world prices of their exports rise relative to their imports. The reverse
occurs for net exporters in industries where liberalization is slight � perhaps because it may
already have taken place in previous trade rounds.
The effects on the welfare of countries arise from a mixture of these terms-of-trade
effects, together with the standard efficiency gains from trade and also from additional benefits
due to the realization of economies of scale. Thus, we expect on average that the world will gain
from multilateral liberalization, as resources are reallocated to those sectors in each country
where there is a comparative advantage. In the absence of terms-of-trade effects, these efficiency
gains should raise national welfare measured by the equivalent variation for every country,
although some factor owners within a country may lose, as will be noted below. However, it is
possible for a particular country whose net imports are concentrated in sectors with the greatest
liberalization to lose overall, if the worsening of its terms of trade swamps these efficiency gains.
On the other hand, although trade with imperfect competition is perhaps best known for
introducing reasons why countries may lose from trade, actually its greatest contribution is to
expand the list of reasons for gains from trade. Thus, in the Michigan Model, trade liberalization
permits all countries to expand their export sectors at the same time that all sectors compete more
closely with a larger number of competing varieties from abroad. As a result, countries as a
whole gain from lower costs due to increasing returns to scale, lower monopoly distortions due to
greater competition, and reduced costs and/or increased utility due to greater product variety.3
2 The price of agricultural products supplied by the rest of the world is taken as the numeraire in the model, and there is a rest-of-world against which all other prices can rise. 3 As noted in Brown, Kiyota, and Stern (2005a,b), there have been many computational studies using the standard GTAP model, which assumes constant returns to scale, perfect competition, and product

4
All of these effects make it more likely that countries will gain from liberalization in ways that
are shared across the entire population.4
The various effects just described in the context of multilateral trade liberalization will
also take place when there is unilateral trade liberalization, although these effects will depend on
the magnitudes of the liberalization in relation to the patterns of trade and the price and output
responses involved between the liberalizing country and its trading partners. Similarly, many of
the effects described will take place with the formation of bilateral or regional free trade
agreements (FTAs). But in these cases, there may be trade creation and positive effects on the
economic welfare of FTA-member countries together with trade diversion and negative effects on
the economic welfare of non-member countries. The net effects on economic welfare for
individual countries and globally will thus depend on the economic circumstances and policy
changes implemented.5
In the real world, all of the various effects occur over time, some of them more quickly
than others. However, the Michigan Model is static in the sense that it is based upon a single set
of equilibrium conditions rather than relationships that vary over time.6 The model results
differentiation by country of origin (the so-called Armington assumption). The Armington assumption implies that countries have monopoly power in their trading relationships, and that trade liberalization may thus have sizable terms-of-trade effects, depending on the structure and pattern of trade. In the Michigan Model, manufactures and services products are distinguished by firm, so that countries have much less leverage over their terms of trade. It should furthermore be noted that, while the GTAP framework is structured to take shifts of productive resources into account and generates results for effects on real wages and the return to capital, the GTAP framework does not permit calculation of shifts in the sectoral employment of workers as is done in the Michigan Model. 4 In perfectly competitive trade models such as the Heckscher-Ohlin Model, one expects countries as a whole to gain from trade, but the owners of one factor � the �scarce factor� � to lose through the mechanism first explored by Stolper and Samuelson (1941). The additional sources of gain from trade due to increasing returns to scale, competition, and product variety, however, are shared across factors, and we routinely find in our CGE modeling that both labor and capital gain from multilateral trade liberalization. 5 It may be noted that, in a model with perfect competition, bilateral trade liberalization should have the effect of contracting trade with excluded countries, thereby improving the terms of trade for FTA members vis-à-vis the rest of world. But in a model with scale economies, the pro-competitive effect of trade liberalization can generate a cut in price and increase in supply to excluded countries. The terms of trade of FTA members may therefore deteriorate in this event. It should also be mentioned that rules of origin may offset some of the potential welfare benefits of FTAs insofar as they may lead to higher input costs and consequent reduction of preference margins. In this connection, see Krishna (2005). 6 Macroeconomic closure in the model involves the equivalent of having expenditure equal to the sum of earned incomes plus redistributed net tax revenues. However, the actual solution is attained indirectly, but
5
therefore refer to a time horizon that depends on the assumptions made about which variables do
and do not adjust to changing market conditions, and on the short- or long-run nature of these
adjustments. Because the supply and demand elasticities used in the model reflect relatively
long-run adjustments and it is assumed that markets for both labor and capital clear within
countries,7 the modeling results are appropriate for a relatively long time horizon of several years
� perhaps two or three at a minimum. On the other hand, the model does not allow for the very
long-run adjustments that could occur through capital accumulation, population growth, and
technological change. The modeling results should therefore be interpreted as being
superimposed upon longer-run growth paths of the economies involved. To the extent that these
growth paths themselves may be influenced by trade liberalization, therefore, the model does not
capture such effects.
Benchmark Data
The main data source used in the model is �The GTAP-5.4 Database� of the Purdue
University Center for Global Trade Analysis Project (Dimaranan and McDougall, 2002). The
benchmark data are described in the Appendix and in the Appendix tables below. The tariff data,
which are noted in Table A-1, indicate for the United States, that the highest tariffs for
manufactures are recorded for textiles, wearing apparel, and leather products & footwear, both
globally and bilaterally. The highest tariff rates for Canada are in food, beverages & tobacco,
textiles, wearing apparel, and leather products & footwear. Chile�s manufactures tariffs are
equivalently, by imposing a zero change in the trade balance. Since the model allows for all net tax and tariff revenues to be redistributed to consumers, when tariffs are reduced with trade liberalization, the model implicitly imposes a non-distorting tax to recoup the loss in tariff revenues. 7 The analysis in the model assumes throughout that the aggregate, economy-wide, level of employment is held constant in each country. The effects of trade liberalization are therefore not permitted to change any country�s overall rates of employment or unemployment. This assumption is made because overall employment is determined by macroeconomic forces and policies that are not contained in the model and would not themselves be included in a negotiated trade agreement. The focus instead is on the composition of employment across sectors as determined by the microeconomic interactions of supply and demand resulting from the liberalization of trade.

6
uniform at around the 10% level. Mexican tariffs are relatively low across sectors.8 CAC tariffs
are relatively high across manufactures, especially in textiles, wearing apparel, leather products &
footwear, non-metallic mineral products, and other manufactures. Tariffs on manufactures
imports range between 8 and 20% for the aggregate of South American countries.
The constructed services barriers are considerably higher than the import barriers on
manufactures. While possibly subject to overstatement, it is generally acknowledged that many
services sectors are highly regulated and thus considerably restrain international services
transactions.
The values and shares of U.S. exports and imports of goods and services for 1997 are
broken by sector according to destination and origin in Table A-2. U.S. exports to other FTAA
countries/regions were $268.4 billion in 1997 and were 31.5% of total U.S. exports. The largest
U.S. exports to the other FTAA countries/regions consisted of wood & wood products, chemicals,
metal products, transportation equipment, and machinery & equipment. The United States also
had sizable exports of textiles and wearing apparel especially to Mexico and the CAC, reflecting
presumably their use as inputs into the production process in these countries. U.S. imports from
other FTAA countries/regions were $317.3 billion in 1997 and were 31.0% of U.S. total imports.
The sectoral and geographical composition of U.S. imports of manufactures is similar to the
composition of U.S. exports noted. In addition, the United States had sizable imports of
agricultural products and food, beverages & tobacco especially from Canada, Mexico, the CAC,
and South America, as well as sizable imports of mining products from Canada, Mexico, and
South America.
The sectoral shares and total values of exports and imports by destination and origin for
Canada, Chile, Mexico, the CAC, and South America are given in Tables A-3 and A-4 for 1997.9
8 The negative entries for Mexico in agriculture and food, beverages & tobacco in the GTAP 5.4 database apparently reflect domestic policies that result in lower domestic as compared to world prices. 9 The values and shares of the total exports and imports of the 34 FTAA countries are available from the authors on request.

7
It can be seen that the United States accounted for over 70% of Canada�s total exports and
imports and higher percentages in many of the individual sectors shown. This is the case also for
Mexico, with the United States accounting for 75% of the values of Mexico�s exports and imports.
The U.S. shares of total exports and total imports were 14% for Chile, 41% for the CAC, and
24% for South America. The shares of exports and imports can be seen to vary somewhat across
sectors for the FTAA countries/regions but appear to be quite similar on the whole. The trade
data in Tables A-2�A-4 reflect the �revealed� cooperative of the various FTAA members and
will provide an indication of how trade may respond to the FTAA removal of bilateral trade
barriers.
Employment by sector is indicated in Table A-5. Nearly 80% of U.S. employment is in
the services sectors and the remainder spread across agriculture and manufacturing. This is the
case for Canada as well. Agriculture accounts for 14.4% of total employment in Chile, 24.2% in
Mexico, 25.8% in the CAC, and 18.1% in South America. The services sectors account for
67.4% of total employment in Chile, 58.4% in Mexico, 57.8% in the CAC, and 67.3% in South
America.
Information on the stock of U.S. foreign direct investment (FDI) abroad in 2002 is
indicated in Table A-6. The other FTAA countries/regions accounted for $424.9 billion of the
total of $1,521 billion, or 27.9%. It is evident from the details in Table A-6 that the United States
has considerable FDI interests in many of the FTAA countries/regions.
III. An Assessment of the Economic Effects of the FTAA
Background Information on the FTAA
As noted in the website, Free Trade of the Americas � FTAA (2004), �Antecedents of the
FTAA Process� (www.ftaa-alca.org/View_e.asp), the effort to unite the 34 countries (excluding
Cuba) in the Western Hemisphere was initiated at the Summit of the Americas in Miami in
December 1994. The objective was to attain progressive elimination of barriers to trade and
8
investment and to complete the negotiations by 2005 and have the agreement enter into force by
December 2005. In the Ministerial Declaration issued on November 20, 2003, the following
vision of the FTAA was expressed (www.ftaa-alca.org/Ministerials/Miami/Miami_e.asp):
�We, the Ministers, reaffirm our commitment to the successful conclusion of the FTAA negotiations by January 2005, with the ultimate goal of achieving an area of free trade and regional integration. The Ministers reaffirm their commitment to a comprehensive and balanced FTAA that will most effectively foster economic growth, the reduction of poverty, development, and integration through trade liberalization. Ministers also recognize the need for flexibility to take into account the needs and sensitivities of all FTAA partners.
We are mindful that negotiations must aim at a balanced agreement that addresses the issue of differences in the levels of development and size of economies of the hemisphere, through various provisions and mechanisms.
Taking into account and acknowledging existing mandates, Ministers recognize that countries may assume different levels of commitments. We will seek to develop a common and balanced set of rights and obligations applicable to all countries. In addition, negotiations should allow for countries that so choose, within the FTAA, to agree to additional obligations and benefits. One possible course of action would be for these countries to conduct plurilateral negotiations within the FTAA to define the obligations in the respective individual areas.
We fully expect that this endeavor will result in an appropriate balance of rights and obligations where countries reap the benefits of their respective commitments.�
The Ministers also issued the following general instructions:
�The Agreement will include measures in each negotiating discipline, and horizontal measures, as appropriate, that take into account the differences in the levels of development and the size of the economies, and are capable of implementation. Special attention will be given to the needs, economic conditions (including transition costs and possible internal dislocations) and opportunities of small economies, to insure their full participation in the FTAA process.�
It is evident from the foregoing FTAA Ministerial statements that individual countries
reserve the right to opt out of specific elements of the FTAA negotiations and to pursue specific
negotiations with other FTAA countries. This means that the FTAA negotiations may not be
concluded with the full set of rights and obligations assumed by all of the member countries at the

9
same time, and that the negotiating process may be ongoing for an undetermined period after
2005.10
U.S. FTAA Negotiations Proposals
It is interesting in connection with the process leading up to and beyond the November
2003 FTAA Ministerial Meeting in Miami to take note of the proposals that the United States
tabled prior to the Miami Ministerial that were designed to expedite the conclusion of the
negotiations in 2005. The U.S. proposals for the FTAA negotiations were set out in the USTR
Press Release 03-08 on February 11, 2003 and in �Trade Facts. Free Trade Area of the Americas:
The Opportunity for a Hemispheric Marketplace� (www.ustr.gov, February 11, 2003).
The U.S. proposals were designed to provide momentum to the FTAA negotiating
process and to elicit offers from the other FTAA countries in an effort to bring the FTAA
negotiations to a conclusion in 2005. But as already noted, it remains to be seen how the
negotiating process will unfold in terms of the comprehensiveness of participation of the 34
FTAA countries in removing their trade barriers against each other and the time periods over
which the liberalization will take place. In addition, the FTAA countries will have to address and
to provide a timetable for dealing with many important non-trade issues of policy reform and
institutional change that in their own right may generate benefits and costs that need to be
assessed with care. This suggests that the realization of the FTAA may evolve over a
considerable period of time, and that the process of negotiation could be encumbered by less than
full compliance on the part of some of the FTAA member countries. There is the further political
question in the United States of obtaining Congressional approval of the negotiated agreement. A
10 It is also not clear, given that the FTAA negotiating process is supposed to reach its final stage in 2005, how rules of origin are to be handled in the FTAA agreement. But it appears that the rules of origin in bilateral and sub-regional FTAs would take precedence over the provisions for rules of origin in the FTAA. By the same token, it is conceivable that the product coverage of rules of origin in existing agreements could be extended and administrative procedures become more burdensome and costly in the context of the FTAA.

10
final issue is how the FTAA negotiations will be tied into and possibly affected by the
multilateral Doha Development Agenda negotiations that are in process under WTO auspices.
Computational Results of the FTAA
To shed some light on the FTAA issues, we turn now to our computational analysis,
which is based on the Michigan Model of World Production and Trade. For modeling purposes,
we use as inputs into the model the bilateral tariff rates and estimates of services barriers
discussed above. It is assumed that the FTAA countries/regions covered in the model reduce
their bilateral trade barriers at a single point in time and thus adopt the measures for trade
liberalization that the FTAA agreement is designed to achieve.
The global welfare effects of the FTAA are shown in Table 1.11 Total welfare for the
FTAA members is increased by $118.8 billion. The increase in U.S. economic welfare is $67.6
billion (0.7% of GNP), Canada, $5.8 billion (0.7% of GNP), Chile, $3.4 billion (3.6% of GNP),
Mexico, $6.6 billion (1.3% of GNP), CAC, $7.8 billion (6.5% of GNP), and South America $27.6
billion (1.5% of GNP).12 The decomposition of the results for the FTAA members shows
relatively small welfare changes from agricultural liberalization, sizable welfare increases from
manufactures liberalization, and the largest welfare increases from services liberalization. As
11 See the Appendix below for sensitivity analyses of the results for alternative values of some key parameters in the model. 12 It should be noted in the computational results that there tend to be larger absolute welfare gains and smaller percent changes in welfare for the large countries as compared to the small countries. In this connection, the expectation is that, under conditions of perfect competition, a small country may appropriate a large share of the absolute gains from trade liberalization because the prices of the small country will tend to move towards the prices in the large country. Since large price changes give rise to large gains from trade, the small country may be expected therefore to realize greater gains from liberalization than the large country. But when scale effects are present, as in the Michigan Model, the foregoing distributional logic may not hold. That is, scale gains will be substantial for countries that specialize in sectors with significant unrealized scale economies, and it may well be that large countries are in a better position to realize big scale gains. Also, the pro-competitive effects resulting from liberalization may produce efficiency gains throughout an industry. As a consequence, the absolute gain will be proportional to the industry�s/country�s size. With regard to percent changes, however, there is reason to believe that a large country will exert stronger pro-competitive forces on a small country, than vice versa. We might therefore expect to observe larger percent changes in scale in small as compared to large countries. This is borne out in our calculations of scale effects for the countries/regions in the various liberalization scenarios that we have run, the results of which are available on request.
11
mentioned earlier, services liberalization reflects the sizable services barriers that are included in
the model database. There is apparently trade diversion across most non-FTAA countries/regions,
especially the EU/EFTA that shows a welfare decline of $6.2 billion (0.05% of GNP). Global
welfare thus rises by $109.5 billion, which is less than the $118.8 billion increase for the FTAA
members.
The decomposition of the results for the FTAA members shows relatively small welfare
changes from agricultural liberalization, sizable welfare increases from manufactures
liberalization, and the largest welfare increases from services liberalization. As mentioned earlier,
services liberalization reflects the sizable services barriers that are included in the model
database.13
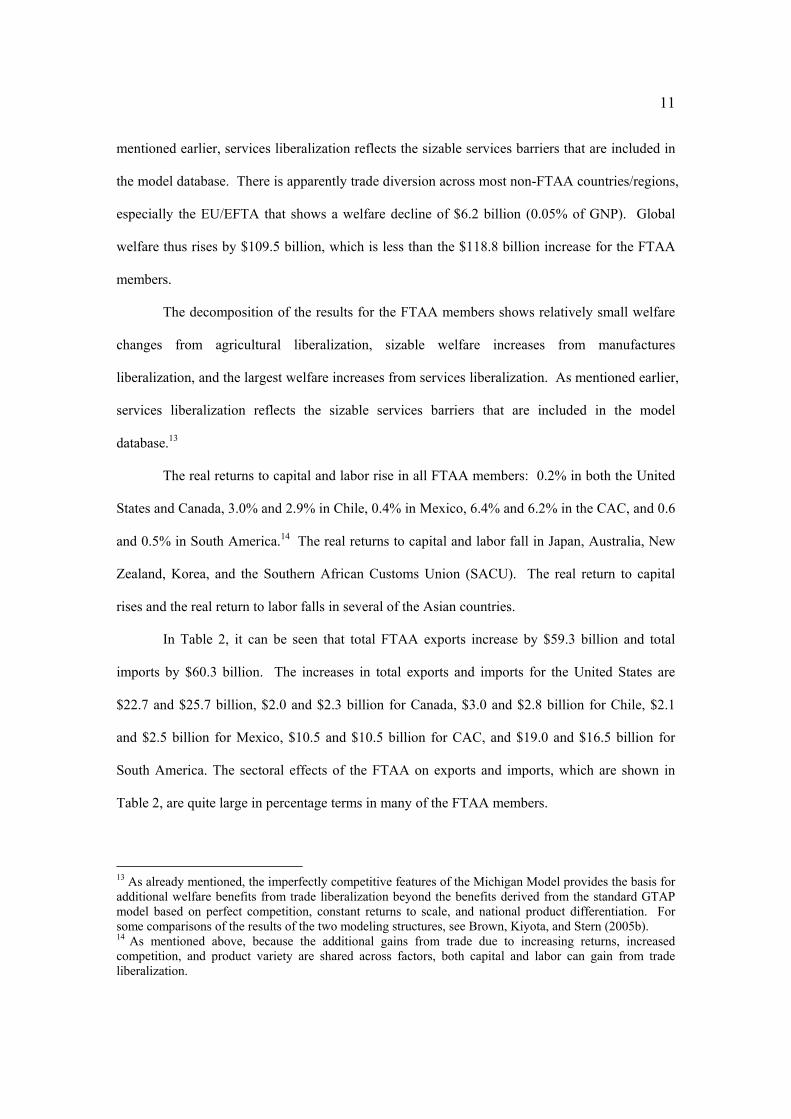
The real returns to capital and labor rise in all FTAA members: 0.2% in both the United
States and Canada, 3.0% and 2.9% in Chile, 0.4% in Mexico, 6.4% and 6.2% in the CAC, and 0.6
and 0.5% in South America.14 The real returns to capital and labor fall in Japan, Australia, New
Zealand, Korea, and the Southern African Customs Union (SACU). The real return to capital
rises and the real return to labor falls in several of the Asian countries.
In Table 2, it can be seen that total FTAA exports increase by $59.3 billion and total
imports by $60.3 billion. The increases in total exports and imports for the United States are
$22.7 and $25.7 billion, $2.0 and $2.3 billion for Canada, $3.0 and $2.8 billion for Chile, $2.1
and $2.5 billion for Mexico, $10.5 and $10.5 billion for CAC, and $19.0 and $16.5 billion for
South America. The sectoral effects of the FTAA on exports and imports, which are shown in
Table 2, are quite large in percentage terms in many of the FTAA members.
13 As already mentioned, the imperfectly competitive features of the Michigan Model provides the basis for additional welfare benefits from trade liberalization beyond the benefits derived from the standard GTAP model based on perfect competition, constant returns to scale, and national product differentiation. For some comparisons of the results of the two modeling structures, see Brown, Kiyota, and Stern (2005b). 14 As mentioned above, because the additional gains from trade due to increasing returns, increased competition, and product variety are shared across factors, both capital and labor can gain from trade liberalization.
12
The absolute and percent changes in gross outputs shown in Table 2 reflect the sectoral
responses to the liberalization among the FTAA countries/regions. That is, changes in gross
outputs represent the combined changes in sectoral exports and imports and domestic
consumption resulting from the removal of trade barriers. The changes in gross output may
therefore be positive or negative as shown and will reflect the underlying comparative advantage
in each country/region. It is evident accordingly that the FTAA will shift labor and capital in the
United States out of agriculture, mining, textiles, and wearing apparel into a broad spectrum of
other manufacturing sectors and into services. In Canada, the negative shifts occur in mining,
food, beverages & tobacco, and labor-intensive manufactures, and there are positive shifts
elsewhere. All sectors in Chile expand except non-metallic mineral products and government-
related services. In Mexico, agriculture-related and labor-intensive manufactures contract and
other manufactures and services expand. In the CAC, there are substantial increases in gross
output concentrated especially in food, beverages & tobacco, textiles, wearing apparel, leather
products & footwear, electricity, gas & water, and trade & transport, and there are declines in
remaining sectors. In South America, the negative shifts in output occur in wood & wood
products, transportation equipment, machinery & equipment, and services, and there are
expansions in output especially in agriculture, mining, food, beverages & tobacco, labor-intensive
manufactures, chemicals, non-metallic mineral products, and metal products.
Changes in sectoral employment are also shown in Table 2. These employment changes
are determined by changes in outputs and by capital/labor substitution and broadly reflect the
comparative advantage of the FTAA countries/regions. The percentage employment effects for
the United States are small on the whole. In terms of numbers of workers, there are employment
declines in U.S. agriculture (12,460 workers), mining (3,251 workers), food, beverages & tobacco
(3,452 workers), textiles (6,028 workers), wearing apparel (16,804 workers), electricity, gas &
water (228 workers), and construction (88 workers). U.S. employment rises in capital-intensive
manufactures and in the main services sectors. In Canada, there are employment increases in

13
agriculture, transportation equipment, machinery & equipment, trade & transport, and other
private services, and declines in employment across the other natural resource and manufactures
sectors.
In Chile, the most noteworthy employment declines are in mining, wearing apparel,
chemicals, non-metallic mineral products, and services, and there are increases especially in
agriculture, food, beverages & tobacco, metal products, and machinery & equipment. There are
employment reductions in Mexico in agriculture, food, beverages & tobacco, labor-intensive
manufactures, other private services, and government-related services and employment
expansions in the more capital-intensive manufacturing sectors, construction, and trade &
transport. In the CAC, there is significant employment expansion concentrated in textiles,
wearing apparel, and leather products & footwear, and resources are attracted away from the
remaining sectors. Finally, in South America, it can be seen that employment expansion is
concentrated in agriculture, mining, food, beverages & tobacco, and leather products & footwear,
and there are employment declines across the relatively more capital-intensive manufacturing
sectors and in services.
The percentage changes in employment can be seen in Table 2 to be relatively large in
several sectors especially in Chile, Mexico, the CAC, and South America. While, as noted, the
FTAA liberalization would be phased in over a period of years, the employment shifts noted
suggest nonetheless that there may be a need for programs of assistance for dislocated workers
who would change employment between sectors. Adjustment costs would thus have to be
factored into the assessment of the welfare effects of the FTAA for these countries/regions.
It was mentioned above in discussing the global welfare results of the FTAA that there
were indications of trade diversion for the non-member countries/regions. This can be seen more
clearly in Table 3, which shows the changes in bilateral trade flows associated with the FTAA.
Thus, intra-FTAA bilateral exports increase by $61.8 billion, and intra-FTAA bilateral imports
increase by $59.3 billion. Total U.S. exports increase by $22.7 billion, with $21.5 billion going
14
to other FTAA members. Total U.S. total imports increase by $25.7 billion, whereas U.S.
imports from FTAA members increase by $27.3 billion. U.S. imports are seen therefore to
decline from all of the non-FTAA countries/regions shown. The changes in exports and imports
for the other FTAA members � Canada, Chile, Mexico, the CAC, and South America -- also
reflect the importance of their intra-FTAA trade, with somewhat different effects on their
exports/imports vis-à-vis non-FTAA trading partners. In any event, the exports and imports of
the non-FTAA countries/regions can be seen to decline in total.
Our foregoing discussion of the FTAA results reflects the bilateral elimination of barriers
to trade in agricultural products, manufactures, and services among the FTAA countries/regions
covered in the Michigan Model. The computational results suggest that the FTAA would be
beneficial to the welfare of the FTAA members, at least in terms of how they have been
represented in the model database and the fact that we assumed that all FTAA members agreed to
remove their intra-FTAA trade barriers at a single point in time. In this light, our results may
then need to be qualified, especially since, as we noted, some FTAA countries could choose to
opt out of specific aspects of the FTAA agreement, including presumably the complete removal
of their intra-FTAA trade barriers. Also, some FTAA countries may experience adjustment costs
due to labor-market displacements. The FTAA may therefore not be unambiguously beneficial to
all FTAA member countries. Finally, our results suggest that non-FTAA trading partners will be
affected adversely because of the trade diversion that the FTAA may engender.
Our results may need to be qualified even further since there are a number of non-trade
issues of policy reform and institutional changes related to the FTAA that will require careful
assessment in terms of the benefits and costs to individual FTAA member countries. We have
not made allowance for these non-trade benefits/costs in our analysis. Also, no account has been
taken of possible increases in foreign direct investment in the FTAA members in response to the
incentives provided by the FTAA trade liberalization, and no allowance has been made for
possible increases in capital formation and economic growth and improvements in productivity
15
that the FTAA may engender. It is possible of course that the non-trade and dynamic growth and
productivity benefits of the FTAA could turn out to be significant and thus reinforce the benefits
of the FTAA trade liberalization and more than offset the costs of adjustment and trade diversion.
But it would take several years of experience following the implementation of the FTAA before
such an evaluation is possible.
IV. Welfare Comparisons of the FTAA with Unilateral Free Trade of FTAA Member Countries and Global (Multilateral) Free Trade
Having analyzed the economic effects of the FTAA, we now consider whether the
economic interests of the FTAA members would be more or less enhanced by unilateral free trade
and global (multilateral) free trade as compared to the adoption of the FTAA. The welfare
comparisons are indicated in Table 4 and can be summarized as follows:
1. Unilateral free trade increases total FTAA economic welfare by $476.8 billion compared to the FTAA liberalization of $118.8 billion. Global welfare with unilateral free trade by the FTAA members is $812.7 billion compared to $109.5 billion for the FTAA liberalization.
2. With unilateral free trade, U.S. economic welfare increases by $346.5 billion (3.4% of GNP) compared to $67.6 billion (0.7% of GNP) with the FTAA. The welfare effects of unilateral free trade are similarly much larger for the other FTAA countries/regions shown as compared to the FTAA liberalization.
3. Global (multilateral) free trade increases total FTAA economic welfare by $751.2 billion as compared to $476.8 billion with unilateral free trade and $118.8 billion with the FTAA. Global free trade increases global welfare by $2.4 trillion compared to $812.7 billion with FTAA unilateral liberalization, and $109.5 billion with the FTAA.
4. With global free trade, U.S. economic welfare rises by $542.5 billion (5.4% of GNP) compared to $346.5 (3.4% of GNP) billion with unilateral free trade and $67.6 billion (0.7%) with the FTAA. The welfare effects of global free trade are also much larger for the other FTAA countries/regions as compared to unilateral free trade and the FTAA liberalization.
These calculations clearly show that multilateral trade liberalization offers potentially far
greater increases in economic welfare for the FTAA members and non-FTAA countries/regions
in the global trading system. This is the case even if there would be less than complete free trade

16
globally. That is, if existing trade barriers in the ongoing Doha Development Agenda
negotiations were to be reduced, for example, by one-third or one-half, the resulting global and
national gains would be proportionally lower. But these welfare gains would still far exceed the
welfare gains from the FTAA and would serve to offset the negative welfare effects of the
adjustment costs and trade diversion resulting from the FTAA. This would almost certainly
remain true even if there are other benefits from the non-trade aspects of the FTAA and possible
increases in capital accumulation and productivity.
V. Summary and Conclusions
This paper has been designed to assess the economic effects of the FTAA that is entering
the final stages of negotiation and designed for completion in 2005. The analysis has been based
on a version of the Michigan Model of World Production and Trade that covers 18 economic
sectors, including agriculture, manufactures, and services, in each of 22 countries/regions. The
34 countries involved in the FTAA are represented for modeling purposes to include the United
States, Canada, Chile, Mexico, an aggregate of 19 countries (excluding Cuba) in Central America
and the Caribbean (CAC), and an aggregate of 11 countries in South America (excluding Chile).
The data for the model are based on Version 5.4 of the GTAP database for 1997 together with
some other data derived from other sources.
For modeling purposes, the focus has been on the effects of the removal of FTAA trade
barriers, which lend themselves most readily to quantification. The computational results
presented for the FTAA are therefore best interpreted as providing a lower bound for the potential
benefits involved. We have shown that these benefits are fairly large in absolute and relative
terms for the FTAA countries/regions covered in the model. We also noted that non-trade and
dynamic benefits could add to the welfare gains of the FTAA. But there is a downside to the
FTAA resulting from the adjustment costs that may be experienced and from negative effects of
trade diversion that we have shown may occur. Further, because of the lack of information, we

17
were not able to allow for rules of origin and related restrictive measures that are likely to be
incorporated into the FTAA and that could undermine the welfare benefits of the trade
liberalization. Finally, it appears likely that there may be less than full compliance with the
FTAA negotiating agenda, and that the negotiations may be drawn out over an extended period of
time before some FTAA members may decide to accept full compliance with the FTAA
obligations.
To provide a broader perspective on the potential economic effects of the FTAA, the
model was also used to calculate the effects of unilateral tariff removal by the FTAA
countries/regions. It was shown that unilateral free trade would result in much larger increases in
economic welfare for the FTAA members as compared to the FTAA trade liberalization. Finally,
the effects of global (multilateral) free trade were calculated and shown to be far greater for all of
the FTAA countries/regions and for non-FTAA countries/regions as compared to both the FTAA
liberalization and unilateral tariff removal by the FTAA members. Our results suggest
accordingly that the interests of the global trading community, including the FTAA member
countries, could be better served if the members of the WTO were able to put their divisiveness
and indecisions aside and work to keep the multilateral negotiations on track.15
Appendices
Benchmark Data
The reference year for the GTAP 5.4 database used in the model is 1997. From this
source, we have extracted the following data, aggregated to our sectors and countries/regions:16
• Bilateral trade flows among 22 countries/regions, decomposed into 18 sectors. Trade with the rest-of-world (ROW) is included to close the model.
• Input-output tables for the 22 countries/regions, excluding ROW
15 This conclusion is reinforced in Brown, Kiyota, and Stern (2005a) in which the negative effects of overlapping FTAs are contrasted with the benefits that unilateral or multilateral free trade may provide. 16 Details on the sectoral and country/region aggregation are provided in Brown, Kiyota, and Stern (2004) and are available on request.
18
• Components of final demand along with sectoral contributions for the 22 countries/regions, excluding ROW
• Gross value of output and value added at the sectoral level for the 22 countries/regions, excluding ROW
• Bilateral import tariffs by sector among the 22 countries/regions
• Elasticity of substitution between capital and labor by sector
• Bilateral export-tax equivalents among the 22 countries/regions, decomposed into 18 sectors
The monopolistically competitive market structure in the nonagricultural sectors of the
model imposes an additional data requirement of the numbers of firms at the sectoral level. There
is need also for estimates of sectoral employment, which have been adapted from a variety of
published sources.17
The GTAP-5.4 1997 database has been projected to the year 2005, which is when the
Uruguay Round liberalization will have been fully implemented. In this connection, we
extrapolated the labor availability in different countries/regions by an average weighted
population growth rate of 1.2 percent per annum. All other major variables have been projected,
using an average weighted growth rate of GDP of 2.5 percent.18 The 2005 data have been
adjusted to take into account two major developments that have occurred in the global trading
system since the mid-1990s. These include: (1) implementation of the Uruguay Round
negotiations that were completed in 1993-94 and were to be phased in over the following decade;
and (2) the accession of Mainland China and Taiwan to the WTO in 2001.19 We have made
17 Notes on the construction of the data on the number of firms and for employment are provided in Brown, Kiyota, and Stern (2004) and are available from the authors on request. 18 The underlying data are drawn from World Bank sources and are available on request. For a more elaborate and detailed procedure for calculating year 2005 projections, see Hertel and Martin (1999) and Hertel (2000). 19 The tariff data for the WTO accession of China and Taiwan have been adapted from Ianchovichina and Martin (2004). In addition to benchmarking the effects of the Uruguay Round and China/Taiwan accession to the WTO, Francois et al. (2005) benchmark their GTAP 5.4 dataset to take into account the enlargement of the European Union (EU) in 2004 to include ten new member countries from Central and Eastern Europe and some changes in the EU Common Agricultural Policies that were introduced in 2000. Our EU and EFTA regional aggregate includes the 25-member EU, but the benchmark data were not adjusted to take
19
allowance for the foregoing developments by readjusting the 2005 scaled-up database for
benchmarking purposes to obtain an approximate picture of what the world may be expected to
look like in 2005. In the computational scenarios, we use these re-adjusted data as the starting
point to carry out the liberalization scenarios for the FTAA and for the accompanying unilateral
and global free trade scenarios.
The GTAP 5.4 (1997) base data for tariffs and the estimated tariff equivalents of services
barriers are broken down in Table A-1 by sector on a global and bilateral basis for the United
States, Canada, Chile, Mexico, and aggregates of Central America and the Caribbean (CAC) and
South America (excluding Chile).20 The tariff rates refer to the post-Uruguay Round and are
applied rates that are calculated in GTAP by dividing tariff revenues by the value of imports in
the agricultural and manufactures sectors.21
The services barriers noted in Table A-1 are based on financial data on average gross
(price-cost) margins constructed initially by Hoekman (2000) and adapted for modeling purposes
in Brown, Deardorff, and Stern (2002, 2003). The gross operating margins are calculated as the
differences between total revenues and total operating costs. Some of these differences are
presumably attributable to fixed costs. Given that the gross operating margins vary across
countries, a portion of the margin can also be attributed to barriers to FDI. For this purpose, a
benchmark is set for each sector in relation to the country with the smallest gross operating
into account the adoption of the EU common external tariffs by the new members. Because of data constraints, we have not made allowance for the Information Technology Agreement and agreements for liberalization of financial and telecommunications services following conclusion of the Uruguay Round negotiations. 20 The CAC countries include: Antigua and Barbuda; Bahamas; Barbados; Belize; Costa Rica; Dominica; Dominican Republic; El Salvador; Grenada; Guatemala; Haiti; Honduras; Jamaica; Nicaragua; Panama; St. Kitts and Nevis; St. Lucia; St. Vincent & Grenadines; and Trinidad and Tobago. South America includes: Argentina; Bolivia; Brazil; Colombia; Ecuador; Guyana; Paraguay; Peru; Suriname; Uruguay; and Venezuela. Chile is included separately as noted. 21 It will be noted that the bilateral tariff rates for the United States, Canada, and Mexico are set to zero in the context of the NAFTA. But the other bilateral rates for the NAFTA members and for the other FTAA countries/regions are an amalgam that reflects Most-Favored-Nation (MFN) tariffs and preferential tariffs that are applied in other sub-regional, bilateral, and special preferential trading arrangements. Because of data constraints, it is not feasible to take these various preferential tariff rates and related trade agreements explicitly into account.

20
margin, on the assumption that operations in the benchmark country can be considered to be
freely open to foreign firms. The excess in any other country above this lowest benchmark is
then taken to be due to barriers to establishment by foreign firms.
That is, the barrier is modeled as the cost-increase attributable to an increase in fixed cost
borne by multinational corporations attempting to establish an enterprise locally in a host country.
This abstracts from the possibility that fixed costs may differ among firms because of variations
in market size, distance from headquarters, and other factors. It is further assumed that this cost
increase can be interpreted as an ad valorem equivalent tariff on services transactions generally.
Sensitivity Analysis
This appendix reports on sensitivity analysis of the Michigan Model. There are three key
elasticities/parameters in the Model: the elasticity of substitution among varieties, which is
exogenously set at three; the parameter that measures the sensitivity of consumers to the number
of varieties, which is set at 0.5; and the elasticities of supply that are taken from the literature.
The variety parameter can take on values between zero and one. The larger it is, the
more consumers value variety. If the parameter is set at zero, consumers have no preference for
variety. This would correspond to the Armington assumption, according to which consumers
view products depending on their place of production.
To analyze the sensitivity of our model results, we have experimented with different
values of the elasticity of substitution among varieties and the consumer sensitivity to the number
of varieties. The following tests were conducted: (1) increase the elasticity of substitution among
varieties by 10 percent, holding other parameters constant; (2) decrease the elasticity of
substitution by 10 percent, holding other parameters constant; (3) increase the consumption
varieties by 10 percent, holding other parameters constant; and (4) decrease the consumption
varieties by 10 percent, holding other parameters constant.

21
The results, which are available on request, are not very sensitive to the alternative
parameters of the consumption varieties. That is, a 10 percent increase (decrease) in these
parameters yields only 2 percent larger (smaller) welfare effects compared to the baseline model.
The sensitivity to the changes in the elasticity of substitution is large compared with the results of
differences in the variety parameters. For some countries, the differences are greater than 10
percent.
In Brown, Deardorff, and Stern (2000), sensitivity tests reveal that the model may
exaggerate the likely gains from economies of scale due to trade liberalization in the context of
expansion of the NAFTA. But the error is small in this context because the impact of trade
liberalization is small. When econometric estimates of scale economies are incorporated into the
model, the welfare gains due to capital flows are shown to remain robust.
22
References
Brown, Drusilla K. and Robert M. Stern. 1989a. �Computational Analysis of the U.S.-Canadian Free Trade Agreement: The Role of Product Differentiation and Market Structure,� in Robert C. Feenstra (ed.), Trade Policies for International Competitiveness. University of Chicago Press.
Brown, Drusilla K. and Robert M. Stern. 1989b. �Computable General Equilibrium Estimates of the Gains from U.S.-Canadian Trade Liberalization,� in David Greenaway, Thomas Hyclak, and Robert J. Thornton (eds.), Economic Aspects of Regional Trading Arrangements. London: Harvester Wheatsheaf.
Brown, Drusilla K., Alan V. Deardorff and Robert M. Stern. 2000. �Computational Analysis of the Accession of Chile to the NAFTA and Western Hemisphere Integration,� The World Economy 23: 145-174.
Brown, Drusilla K., Alan V. Deardorff and Robert M. Stern. 2002. �CGE Modeling and Analysis of Multilateral and Regional Negotiating Options,� in Robert M. Stern (ed.), Issues and Options for U.S.-Japan Trade Policies. Ann Arbor: University of Michigan Press.
Brown, Drusilla K., Alan V. Deardorff, and Robert M. Stern. 2003. �Multilateral, Regional, and Bilateral Trade-Policy Options for the United States and Japan,� The World Economy 26:803-828.
Brown, Drusilla K., Kozo Kiyota, and Robert M. Stern 2004. �Computational Analysis for the United States of the U.S. Bilateral Free Trade Agreements with Central America, Australia, and Morocco,� U.S. Department of Labor (April 24).
Brown, Drusilla K., Kozo Kiyota, and Robert M. Stern. 2005a. �Computational Analysis of the Menu of U.S.-Japan Trade Policies, The World Economy (forthcoming).
Brown, Drusilla K., Kozo Kiyota, and Robert M. Stern. 2005b. �Computational Analysis of the U.S. FTAs with Central America, Australia, and Morocco,� The World Economy, forthcoming.
Deardorff, Alan V. and Robert M. Stern. 1990. Computational Analysis of Global Trading Arrangements. Ann Arbor: University of Michigan Press.
Dimaranan, Betina V. and Robert A. McDougall. 2002. "Command Line Data Aggregation Program," in Betina V. Dimaranan and Robert A. McDougall. (eds.), The GTAP 5 Data Base. West Lafayette, IN: Center for Global Trade Analysis, Department of Agricultural Economics, Purdue University.
Francois, Joseph and Anna Strutt. 1999. "Post Uruguay Round Tariff Vectors for GTAP Version 4," Erasmus University, manuscript.
Francois, Joseph, Hans van Meijl, and Frank van Tongeren. 2005. �Trade Liberalization and Developing Countries under the Doha Round,� Economic Policy, forthcoming.

23
Free Trade Area of the Americas � FTAA. 2003. �Free Trade Area of the Americas Eighth Ministerial Meeting, Miami, USA: Ministerial Declaration,� November 20. (http://www.ftaa-alca.org/Ministerials/Miami/Miami_e.asp)
Free Trade Area of the Americas � FTAA. 2004. �Antecedents of the FTAA Process.� (http://www.ftaa-alca.org/View_e.asp)
Harrison, W. J. and Van Pearson. 1996. �Computing Solutions for Large General Equilibrium Models using GEMPACK,� Computational Economics 9:83-127.
Hertel, Thomas W., and Will Martin. 1999. �Would Developing Countries Gain from Inclusion of Manufactures in the WTO Negotiations?� Presented at the Conference on the �WTO and the Millennium Round,� Geneva, September 20-21.
Hertel, Thomas W. 2000. �Potential Gains from Reducing Trade Barriers in Manufacturing,� Federal Reserve Bank of St. Louis Review 82:77-99.
Hoekman, Bernard. 2000. �The Next Round of Services Negotiations: Identifying Priorities and Options,� Federal Reserve Bank of St. Louis Review 82:31-47.
Ianchovichina, Elena and William Martin. 2004. �Economic Impacts of China�s Accession to the WTO,� in D. Bhattasali, Shantong Li, and William Martin (eds.), China and the WTO: Accession, Policy Reform, and Poverty Reduction Strategies. Washington, D.C.: Oxford University Press and the World Bank.
International Labor Organization. 2003. LABORSTA [http://laborsta.ilo.org/cgi-bin/brokerv8. exe].
Krishna, Kala. 2005 �Understanding Rules of Origin,� in A. Estervardoal et al. (eds.), Rules of Origin, forthcoming.
Office of the U.S. Trade Representative (USTR). 2003a. �Trade Facts. Free Trade Area of the Americas: The Opportunity for a Hemispheric Marketplace,� February 11. (www.ustr.gov)
Office of the U.S. Trade Representative (USTR). 2003b. �U.S. Advances Bold Proposals in FTAA Negotiations to Create World�s Largest Free Market in 2005,� Press Release 03-08 (www.ustr.gov)
Stolper, Wolfgang and Paul A. Samuelson. 1941. �Protection and Real Wages,� Review of Economic Studies 9:58-73.
U.S. Bureau of Economic Analysis. 2003. Survey of Current Business, 83(9): 121.
United Nations Industrial Development Organization (UNIDO). 2003. UNIDO Industrial Statistics Database 2003 at the 3-digit Level of ISIC (Revision 2) on CD-ROM, Geneva: UNIDO.
World Bank. 2003. World Development Indicators on CD-ROM, Washington, D.C.: World Bank.
24
World Trade Organization. 2003. Trade Policy Review: Southern African Customs Union, 2003. Geneva: World Trade Organization.

Table 1. Global Welfare Effects of Free Trade Area of Americas (FTAA) (Billions of U.S. Dollars and Percent)
% Bil. % Bil. % Bil. % Bil. Capital LaborFTAA (total) 1.68 44.79 72.31 118.78United States 0.01 0.74 0.23 23.15 0.43 43.71 0.67 67.59 0.24 0.23Canada 0.00 -0.01 0.29 2.31 0.43 3.46 0.72 5.76 0.21 0.23Chile 0.05 0.05 1.89 1.82 1.61 1.55 3.55 3.42 3.00 2.88Mexico 0.04 0.20 0.83 4.14 0.46 2.31 1.33 6.64 0.39 0.37Central America and the Caribbean (CAC) 0.10 0.11 3.86 4.63 2.56 3.07 6.52 7.81 6.36 6.22South America 0.03 0.59 0.48 8.74 1.01 18.22 1.52 27.55 0.56 0.48
Japan 0.00 -0.10 -0.05 -2.57 0.02 1.11 -0.03 -1.56 -0.01 -0.01 Australia 0.00 -0.00 -0.05 -0.24 0.01 0.04 -0.04 -0.20 -0.02 -0.01 New Zealand -0.01 -0.00 -0.05 -0.04 0.01 0.01 -0.05 -0.03 -0.01 -0.01 EU and EFTA 0.00 -0.19 -0.06 -7.02 0.01 1.04 -0.05 -6.16 -0.02 -0.02 Hong Kong 0.00 -0.00 0.01 0.01 0.01 0.01 0.02 0.02 0.02 0.01China 0.01 0.06 -0.06 -0.62 0.01 0.15 -0.04 -0.41 0.02 0.00Korea 0.00 -0.00 -0.09 -0.49 0.02 0.11 -0.07 -0.38 -0.03 -0.03 Singapore 0.00 -0.00 -0.01 -0.01 0.01 0.01 0.00 -0.00 0.01 0.00Taiwan 0.00 0.00 -0.07 -0.25 0.02 0.09 -0.05 -0.16 0.00 -0.02 Indonesia 0.00 0.00 -0.06 -0.17 0.01 0.04 -0.05 -0.13 0.00 -0.02 Malaysia 0.00 -0.00 0.00 -0.01 0.03 0.04 0.03 0.03 0.02 0.02Philippines 0.00 0.00 -0.04 -0.04 0.03 0.03 -0.01 -0.02 0.02 -0.06 Thailand 0.00 0.01 -0.03 -0.05 0.02 0.04 -0.01 -0.00 0.02 -0.02 Rest of Asia 0.00 -0.00 -0.03 -0.22 0.01 0.05 -0.02 -0.17 0.01 -0.01 Morocco 0.00 0.00 -0.02 -0.01 0.01 0.00 -0.01 -0.00 0.01 0.01Southern African Customs Union (SACU) 0.01 0.01 -0.05 -0.09 0.01 0.02 -0.03 -0.06 -0.01 -0.03 Total 1.46 32.95 75.11 109.52
Real ReturnsAgricultural Protection Manufactures Tariffs Services Barriers Total

Table 2. Free Trade Area of the Americas (FTAA): Percent and Absolute Changes in Exports, Imports, Output, and Number of Workers(Percent, Millions of Dollars, and Number of Workers)
U.S. Canada Chile Mexico CAC SouthAmerica
U.S. Canada Chile Mexico CAC SouthAmerica
Agriculture 1.39 0.99 8.77 -1.01 0.38 11.72 9.51 0.45 27.81 2.06 29.91 13.55Mining -0.94 -0.38 4.42 -1.40 -14.60 9.89 1.56 1.10 18.40 11.46 11.50 -4.95 Food, Beverages & Tobacco 2.84 -0.03 12.24 0.38 17.10 10.41 6.32 3.19 23.76 5.34 27.27 12.36Textiles 8.05 -1.93 36.56 1.36 59.08 15.87 5.09 0.97 7.62 1.95 28.21 9.05Wearing Apparel 12.47 -3.35 30.37 -4.54 74.71 26.77 9.22 3.00 3.80 2.98 18.28 10.20Leather Products & Footwear 6.30 -1.75 27.48 -0.44 45.98 17.62 1.36 1.87 3.07 5.13 15.64 0.56Wood & Wood Products 2.09 0.19 8.05 1.02 4.96 7.66 0.62 0.31 13.35 1.43 21.76 10.70Chemicals 2.02 0.05 15.95 4.97 6.47 14.10 1.36 0.61 12.59 2.19 14.47 5.31Non-metallic Min. Products 1.98 0.11 11.62 2.74 6.52 16.12 1.38 0.46 16.72 2.49 18.08 8.19Metal Products 1.65 0.07 11.76 3.14 -1.49 9.09 1.35 0.67 10.64 2.62 12.50 8.27Transportation Equipment 1.53 1.40 47.90 4.86 -1.29 12.32 0.83 0.57 5.19 0.90 2.88 10.44Machinery & Equipment 1.69 0.76 35.52 0.92 10.13 11.07 0.65 0.30 4.39 0.74 8.33 7.50Other Manufactures 2.77 0.16 21.94 0.08 5.51 12.76 0.63 0.56 3.72 1.78 12.52 5.64Elec., Gas & Water -0.86 -0.40 3.50 -1.06 -2.90 3.77 0.50 1.46 -0.29 1.95 6.22 -3.98 Construction -0.07 1.71 5.86 1.52 2.27 5.73 1.28 0.93 6.98 2.41 14.42 -0.53 Trade & Transport 2.67 2.41 14.06 1.35 9.49 14.79 3.18 1.71 12.75 4.05 25.68 13.23Other Private Services 1.96 2.10 16.29 1.06 8.77 18.55 2.98 1.84 14.50 4.58 31.00 13.09Government Services 1.56 0.99 30.64 0.19 17.94 27.89 4.49 0.50 30.22 2.40 30.63 20.00
U.S. Canada Chile Mexico CAC SouthAmerica
U.S. Canada Chile Mexico CAC SouthAmerica
Agriculture 670 130 186 -49 25 2,407 2,148 23 143 108 690 616Mining -78 -99 137 -201 -123 2,705 1,312 88 333 80 463 -239Food, Beverages & Tobacco 1,353 -4 606 17 1,116 3,049 2,617 404 303 236 1,381 734Textiles 1,223 -52 82 58 1,813 296 1,449 54 74 69 1,073 331Wearing Apparel 1,118 -52 28 -234 5,739 354 4,438 93 19 75 713 141Leather Products & Footwear 189 -5 17 -4 354 692 387 38 14 39 136 7Wood & Wood Products 796 78 184 46 21 388 332 36 107 73 497 600Chemicals 2,365 12 199 375 213 1,853 1,308 167 449 398 1,182 1,398Non-metallic Min. Products 308 4 19 63 34 288 233 21 90 43 184 224Metal Products 734 18 781 238 -34 1,216 938 126 169 244 348 650Transportation Equipment 2,016 835 62 1,069 -26 560 1,354 305 151 120 466 1,928Machinery & Equipment 5,889 387 152 494 221 627 2,503 235 334 357 849 4,207Other Manufactures 409 3 8 2 42 149 304 20 17 26 170 184Elec., Gas & Water -8 -9 0 -0 -2 42 14 11 -0 3 2 -68Construction -4 2 1 1 2 9 21 1 1 1 50 -1Trade & Transport 2,803 347 372 139 679 1,963 3,030 218 309 204 844 2,791Other Private Services 2,060 412 122 40 276 1,739 2,261 452 161 338 1,190 2,149Government Services 850 14 42 1 196 612 1,075 11 99 39 290 874Total 22,693 2,020 2,998 2,054 10,546 18,950 25,725 2,303 2,773 2,453 10,528 16,526
Exports Imports(Percent) (Percent)
Exports Imports(Value) (Value)
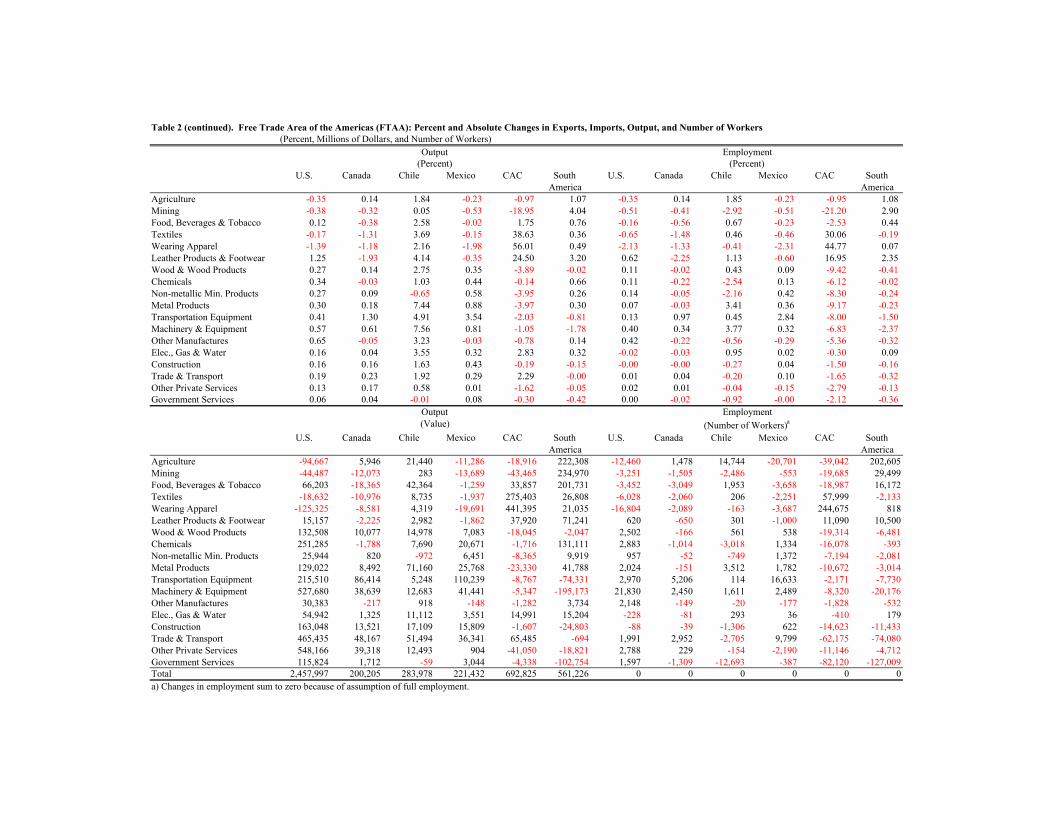
Table 2 (continued). Free Trade Area of the Americas (FTAA): Percent and Absolute Changes in Exports, Imports, Output, and Number of Workers(Percent, Millions of Dollars, and Number of Workers)
U.S. Canada Chile Mexico CAC SouthAmerica
U.S. Canada Chile Mexico CAC SouthAmerica
Agriculture -0.35 0.14 1.84 -0.23 -0.97 1.07 -0.35 0.14 1.85 -0.23 -0.95 1.08Mining -0.38 -0.32 0.05 -0.53 -18.95 4.04 -0.51 -0.41 -2.92 -0.51 -21.20 2.90Food, Beverages & Tobacco 0.12 -0.38 2.58 -0.02 1.75 0.76 -0.16 -0.56 0.67 -0.23 -2.53 0.44Textiles -0.17 -1.31 3.69 -0.15 38.63 0.36 -0.65 -1.48 0.46 -0.46 30.06 -0.19 Wearing Apparel -1.39 -1.18 2.16 -1.98 56.01 0.49 -2.13 -1.33 -0.41 -2.31 44.77 0.07Leather Products & Footwear 1.25 -1.93 4.14 -0.35 24.50 3.20 0.62 -2.25 1.13 -0.60 16.95 2.35Wood & Wood Products 0.27 0.14 2.75 0.35 -3.89 -0.02 0.11 -0.02 0.43 0.09 -9.42 -0.41 Chemicals 0.34 -0.03 1.03 0.44 -0.14 0.66 0.11 -0.22 -2.54 0.13 -6.12 -0.02 Non-metallic Min. Products 0.27 0.09 -0.65 0.58 -3.95 0.26 0.14 -0.05 -2.16 0.42 -8.30 -0.24 Metal Products 0.30 0.18 7.44 0.88 -3.97 0.30 0.07 -0.03 3.41 0.36 -9.17 -0.23 Transportation Equipment 0.41 1.30 4.91 3.54 -2.03 -0.81 0.13 0.97 0.45 2.84 -8.00 -1.50 Machinery & Equipment 0.57 0.61 7.56 0.81 -1.05 -1.78 0.40 0.34 3.77 0.32 -6.83 -2.37 Other Manufactures 0.65 -0.05 3.23 -0.03 -0.78 0.14 0.42 -0.22 -0.56 -0.29 -5.36 -0.32 Elec., Gas & Water 0.16 0.04 3.55 0.32 2.83 0.32 -0.02 -0.03 0.95 0.02 -0.30 0.09Construction 0.16 0.16 1.63 0.43 -0.19 -0.15 -0.00 -0.00 -0.27 0.04 -1.50 -0.16 Trade & Transport 0.19 0.23 1.92 0.29 2.29 -0.00 0.01 0.04 -0.20 0.10 -1.65 -0.32 Other Private Services 0.13 0.17 0.58 0.01 -1.62 -0.05 0.02 0.01 -0.04 -0.15 -2.79 -0.13 Government Services 0.06 0.04 -0.01 0.08 -0.30 -0.42 0.00 -0.02 -0.92 -0.00 -2.12 -0.36
U.S. Canada Chile Mexico CAC SouthAmerica
U.S. Canada Chile Mexico CAC SouthAmerica
Agriculture -94,667 5,946 21,440 -11,286 -18,916 222,308 -12,460 1,478 14,744 -20,701 -39,042 202,605Mining -44,487 -12,073 283 -13,689 -43,465 234,970 -3,251 -1,505 -2,486 -553 -19,685 29,499Food, Beverages & Tobacco 66,203 -18,365 42,364 -1,259 33,857 201,731 -3,452 -3,049 1,953 -3,658 -18,987 16,172Textiles -18,632 -10,976 8,735 -1,937 275,403 26,808 -6,028 -2,060 206 -2,251 57,999 -2,133Wearing Apparel -125,325 -8,581 4,319 -19,691 441,395 21,035 -16,804 -2,089 -163 -3,687 244,675 818Leather Products & Footwear 15,157 -2,225 2,982 -1,862 37,920 71,241 620 -650 301 -1,000 11,090 10,500Wood & Wood Products 132,508 10,077 14,978 7,083 -18,045 -2,047 2,502 -166 561 538 -19,314 -6,481Chemicals 251,285 -1,788 7,690 20,671 -1,716 131,111 2,883 -1,014 -3,018 1,334 -16,078 -393Non-metallic Min. Products 25,944 820 -972 6,451 -8,365 9,919 957 -52 -749 1,372 -7,194 -2,081Metal Products 129,022 8,492 71,160 25,768 -23,330 41,788 2,024 -151 3,512 1,782 -10,672 -3,014Transportation Equipment 215,510 86,414 5,248 110,239 -8,767 -74,331 2,970 5,206 114 16,633 -2,171 -7,730Machinery & Equipment 527,680 38,639 12,683 41,441 -5,347 -195,173 21,830 2,450 1,611 2,489 -8,320 -20,176Other Manufactures 30,383 -217 918 -148 -1,282 3,734 2,148 -149 -20 -177 -1,828 -532Elec., Gas & Water 54,942 1,325 11,112 3,551 14,991 15,204 -228 -81 293 36 -410 179Construction 163,048 13,521 17,109 15,809 -1,607 -24,803 -88 -39 -1,306 622 -14,623 -11,433Trade & Transport 465,435 48,167 51,494 36,341 65,485 -694 1,991 2,952 -2,705 9,799 -62,175 -74,080Other Private Services 548,166 39,318 12,493 904 -41,050 -18,821 2,788 229 -154 -2,190 -11,146 -4,712Government Services 115,824 1,712 -59 3,044 -4,338 -102,754 1,597 -1,309 -12,693 -387 -82,120 -127,009Total 2,457,997 200,205 283,978 221,432 692,825 561,226 0 0 0 0 0 0a) Changes in employment sum to zero because of assumption of full employment.
(Value) (Number of Workers)aOutput Employment
(Percent) (Percent)Output Employment
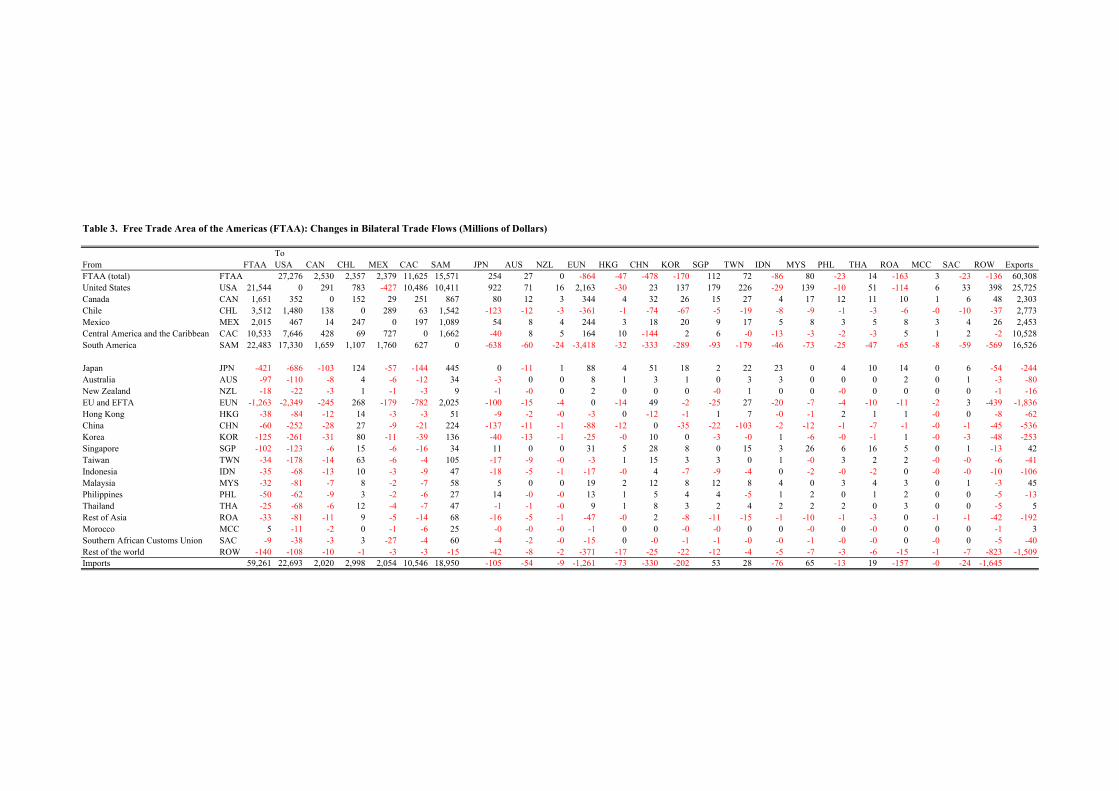
Table 3. Free Trade Area of the Americas (FTAA): Changes in Bilateral Trade Flows (Millions of Dollars)
ToFrom FTAA USA CAN CHL MEX CAC SAM JPN AUS NZL EUN HKG CHN KOR SGP TWN IDN MYS PHL THA ROA MCC SAC ROW ExportsFTAA (total) FTAA 27,276 2,530 2,357 2,379 11,625 15,571 254 27 0 -864 -47 -478 -170 112 72 -86 80 -23 14 -163 3 -23 -136 60,308United States USA 21,544 0 291 783 -427 10,486 10,411 922 71 16 2,163 -30 23 137 179 226 -29 139 -10 51 -114 6 33 398 25,725Canada CAN 1,651 352 0 152 29 251 867 80 12 3 344 4 32 26 15 27 4 17 12 11 10 1 6 48 2,303Chile CHL 3,512 1,480 138 0 289 63 1,542 -123 -12 -3 -361 -1 -74 -67 -5 -19 -8 -9 -1 -3 -6 -0 -10 -37 2,773Mexico MEX 2,015 467 14 247 0 197 1,089 54 8 4 244 3 18 20 9 17 5 8 3 5 8 3 4 26 2,453Central America and the Caribbean CAC 10,533 7,646 428 69 727 0 1,662 -40 8 5 164 10 -144 2 6 -0 -13 -3 -2 -3 5 1 2 -2 10,528South America SAM 22,483 17,330 1,659 1,107 1,760 627 0 -638 -60 -24 -3,418 -32 -333 -289 -93 -179 -46 -73 -25 -47 -65 -8 -59 -569 16,526
Japan JPN -421 -686 -103 124 -57 -144 445 0 -11 1 88 4 51 18 2 22 23 0 4 10 14 0 6 -54 -244Australia AUS -97 -110 -8 4 -6 -12 34 -3 0 0 8 1 3 1 0 3 3 0 0 0 2 0 1 -3 -80New Zealand NZL -18 -22 -3 1 -1 -3 9 -1 -0 0 2 0 0 0 -0 1 0 0 -0 0 0 0 0 -1 -16EU and EFTA EUN -1,263 -2,349 -245 268 -179 -782 2,025 -100 -15 -4 0 -14 49 -2 -25 27 -20 -7 -4 -10 -11 -2 3 -439 -1,836Hong Kong HKG -38 -84 -12 14 -3 -3 51 -9 -2 -0 -3 0 -12 -1 1 7 -0 -1 2 1 1 -0 0 -8 -62China CHN -60 -252 -28 27 -9 -21 224 -137 -11 -1 -88 -12 0 -35 -22 -103 -2 -12 -1 -7 -1 -0 -1 -45 -536Korea KOR -125 -261 -31 80 -11 -39 136 -40 -13 -1 -25 -0 10 0 -3 -0 1 -6 -0 -1 1 -0 -3 -48 -253Singapore SGP -102 -123 -6 15 -6 -16 34 11 0 0 31 5 28 8 0 15 3 26 6 16 5 0 1 -13 42Taiwan TWN -34 -178 -14 63 -6 -4 105 -17 -9 -0 -3 1 15 3 3 0 1 -0 3 2 2 -0 -0 -6 -41Indonesia IDN -35 -68 -13 10 -3 -9 47 -18 -5 -1 -17 -0 4 -7 -9 -4 0 -2 -0 -2 0 -0 -0 -10 -106Malaysia MYS -32 -81 -7 8 -2 -7 58 5 0 0 19 2 12 8 12 8 4 0 3 4 3 0 1 -3 45Philippines PHL -50 -62 -9 3 -2 -6 27 14 -0 -0 13 1 5 4 4 -5 1 2 0 1 2 0 0 -5 -13Thailand THA -25 -68 -6 12 -4 -7 47 -1 -1 -0 9 1 8 3 2 4 2 2 2 0 3 0 0 -5 5Rest of Asia ROA -33 -81 -11 9 -5 -14 68 -16 -5 -1 -47 -0 2 -8 -11 -15 -1 -10 -1 -3 0 -1 -1 -42 -192Morocco MCC 5 -11 -2 0 -1 -6 25 -0 -0 -0 -1 0 0 -0 -0 0 0 -0 0 -0 0 0 0 -1 3Southern African Customs Union SAC -9 -38 -3 3 -27 -4 60 -4 -2 -0 -15 0 -0 -1 -1 -0 -0 -1 -0 -0 0 -0 0 -5 -40Rest of the world ROW -140 -108 -10 -1 -3 -3 -15 -42 -8 -2 -371 -17 -25 -22 -12 -4 -5 -7 -3 -6 -15 -1 -7 -823 -1,509Imports 59,261 22,693 2,020 2,998 2,054 10,546 18,950 -105 -54 -9 -1,261 -73 -330 -202 53 28 -76 65 -13 19 -157 -0 -24 -1,645
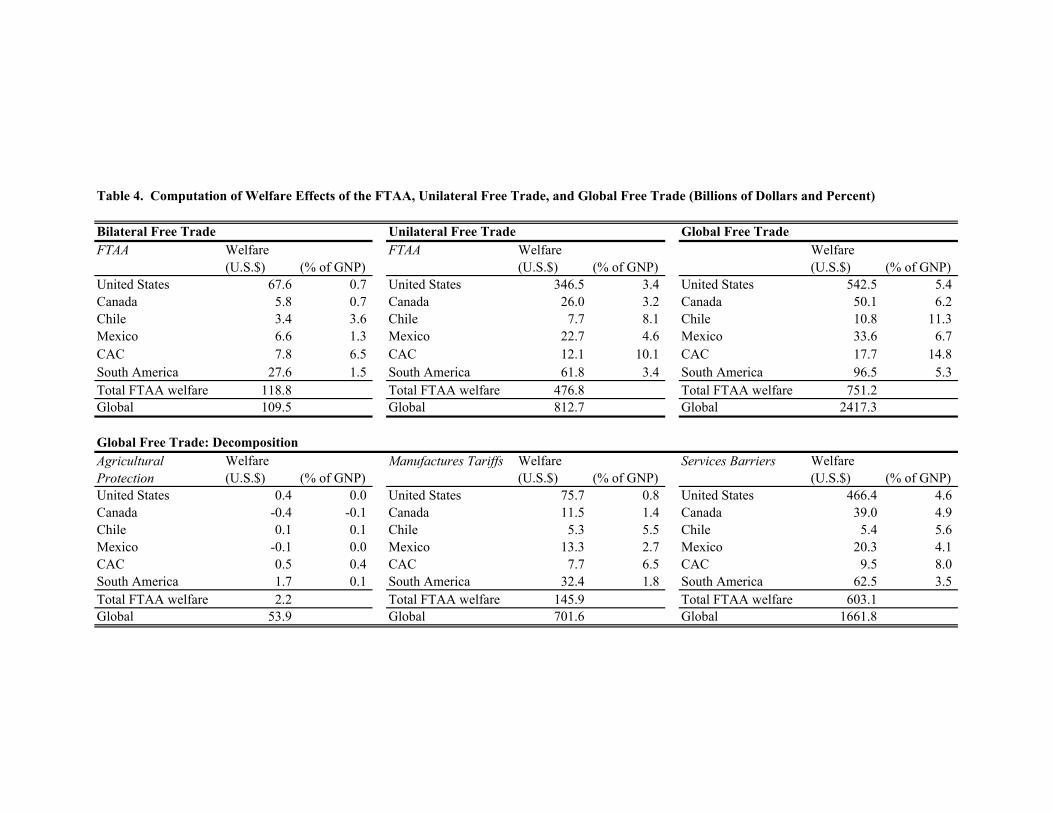
Table 4. Computation of Welfare Effects of the FTAA, Unilateral Free Trade, and Global Free Trade (Billions of Dollars and Percent)
Bilateral Free Trade Unilateral Free Trade Global Free TradeFTAA Welfare FTAA Welfare Welfare
(U.S.$) (% of GNP) (U.S.$) (% of GNP) (U.S.$) (% of GNP)United States 67.6 0.7 United States 346.5 3.4 United States 542.5 5.4Canada 5.8 0.7 Canada 26.0 3.2 Canada 50.1 6.2Chile 3.4 3.6 Chile 7.7 8.1 Chile 10.8 11.3Mexico 6.6 1.3 Mexico 22.7 4.6 Mexico 33.6 6.7CAC 7.8 6.5 CAC 12.1 10.1 CAC 17.7 14.8South America 27.6 1.5 South America 61.8 3.4 South America 96.5 5.3Total FTAA welfare 118.8 Total FTAA welfare 476.8 Total FTAA welfare 751.2Global 109.5 Global 812.7 Global 2417.3
Global Free Trade: DecompositionWelfare Welfare Welfare(U.S.$) (% of GNP) (U.S.$) (% of GNP) (U.S.$) (% of GNP)
United States 0.4 0.0 United States 75.7 0.8 United States 466.4 4.6Canada -0.4 -0.1 Canada 11.5 1.4 Canada 39.0 4.9Chile 0.1 0.1 Chile 5.3 5.5 Chile 5.4 5.6Mexico -0.1 0.0 Mexico 13.3 2.7 Mexico 20.3 4.1CAC 0.5 0.4 CAC 7.7 6.5 CAC 9.5 8.0South America 1.7 0.1 South America 32.4 1.8 South America 62.5 3.5Total FTAA welfare 2.2 Total FTAA welfare 145.9 Total FTAA welfare 603.1Global 53.9 Global 701.6 Global 1661.8
AgriculturalProtection
Manufactures Tariffs Services Barriers

Table A-1. Post-Uruguay Round Tariff Rates by Sector for the United States and Other FTAA Countries/Regions(Percent)
Global Canada Chile Mexico CAC SouthAmerica
Global U.S. Global U.S. Global U.S. Global U.S. Global U.S.
Agriculture 2.7 0.0 0.8 0.0 1.0 3.2 0.2 0.0 5.0 4.8 -2.7 0.0 3.1 0.4 4.0 0.8Mining 0.2 0.0 0.1 0.0 0.3 0.1 0.0 0.0 9.1 11.0 1.5 0.0 1.7 3.8 3.0 0.9Food, Beverages & Tobacco 3.5 0.0 1.3 0.0 3.0 1.8 5.7 0.0 8.2 11.0 -4.8 0.0 8.2 8.5 9.0 11.5Textiles 5.6 0.0 14.0 0.0 6.8 7.7 4.2 0.0 10.2 11.0 3.3 0.0 13.0 14.5 14.2 13.0Wearing Apparel 11.0 0.0 11.5 0.0 11.6 13.6 13.8 0.0 10.4 11.0 2.5 0.0 23.5 25.7 19.6 19.8Leather Products & Footwear 7.2 0.0 7.7 0.0 4.6 6.3 9.2 0.0 10.8 11.0 5.3 0.0 13.7 16.4 14.1 15.9Wood & Wood Products 0.3 0.0 0.2 0.0 0.5 0.4 0.3 0.0 9.6 10.7 0.9 0.0 9.9 9.8 7.8 7.7Chemicals 1.9 0.0 0.0 0.0 0.8 0.9 1.0 0.0 9.5 11.0 2.0 0.0 7.6 8.0 8.6 9.0Non-metallic Min. Products 3.2 0.0 0.6 0.0 3.8 2.3 0.8 0.0 9.9 11.0 4.4 0.0 11.4 11.0 11.2 11.3Metal Products 1.4 0.0 0.5 0.0 0.5 0.6 0.8 0.0 10.2 11.0 2.7 0.0 7.6 8.1 10.7 11.6Transportation Equipment 1.2 0.0 1.4 0.0 1.3 0.2 0.7 0.0 10.2 9.2 2.6 0.0 8.1 10.4 20.0 15.6Machinery & Equipment 1.0 0.0 0.2 0.0 0.3 0.4 0.5 0.0 10.4 11.0 2.6 0.0 5.8 5.6 12.2 11.7Other Manufactures 1.3 0.0 0.1 0.0 2.2 1.5 1.2 0.0 10.8 11.0 4.2 0.0 13.6 17.0 14.8 16.3Elec., Gas & Water 0.0 0.0 0.0 0.0 0.0 0.0 0.0 0.0 0.0 0.0 0.0 0.0 0.0 0.0 0.0 0.0Construction 9.0 0.0 9.0 0.0 9.0 9.0 3.0 0.0 58.0 58.0 15.0 0.0 18.0 18.0 18.0 18.0Trade & Transport 27.0 0.0 27.0 0.0 27.0 27.0 13.0 0.0 24.0 24.0 27.0 0.0 32.0 32.0 32.0 32.0Other Private Services 31.0 0.0 31.0 0.0 31.0 31.0 27.0 0.0 20.0 20.0 32.0 0.0 34.0 34.0 34.0 34.0Government Services 25.0 0.0 25.0 0.0 25.0 25.0 0.0 0.0 21.0 21.0 21.0 0.0 17.0 17.0 17.0 17.0Note: Central America and Caribbean (CAC) members include Costa Rica, Dominican Republic, El Salvador, Guatemala, Honduras, and Nicaragua. South America excludes Chile.Sources: Adapted from Francois and Strutt (1999); Brown, Deardorff and Stern (2002); and Diamaranan and McDougall (2002).
United States Canada South AmericaCACMexicoChile

Table A-2. Value and Shares of U.S. Sectoral Trade by Destination and Origin, 1997 (Millions of U.S. Dollars)
World TotalFTAA
Canada Chile Mexico CAC SouthAmerica
World TotalFTAA
Canada Chile Mexico CAC SouthAmerica
Agriculture 35,176 8,748 2,815 47 3,242 1,098 1,547 18,602 13,521 3,984 716 2,956 2,280 3,585Mining 6,421 2,129 1,416 39 214 26 434 69,939 39,016 17,060 74 8,324 664 12,894Food, Beverages & Tobacco 30,541 8,558 3,964 83 2,065 1,464 982 28,813 11,892 5,553 534 1,957 1,421 2,427Textiles 11,485 6,610 2,538 90 2,055 1,362 565 21,514 6,541 1,803 9 2,640 1,725 365Wearing Apparel 6,847 4,709 423 21 1,623 2,428 213 38,335 11,095 1,050 17 3,974 5,443 612Leather products & Footwear 2,280 786 185 6 323 213 59 21,842 2,841 219 5 607 438 1,572Wood & Wood Products 29,386 13,747 7,717 151 3,415 1,094 1,371 43,785 29,947 25,258 352 2,956 165 1,216Chemicals 90,569 36,446 15,886 665 10,405 2,737 6,752 77,142 23,648 15,449 159 2,747 879 4,414Non-metallic Min. Products 11,921 4,732 2,703 93 922 269 745 14,071 4,931 2,572 18 1,365 369 607Metal Products 34,238 17,932 10,460 223 5,089 712 1,447 56,001 24,423 15,649 573 4,180 429 3,592Transportation Equipment 102,640 46,999 33,595 607 8,130 953 3,713 128,874 59,396 43,993 3 14,064 22 1,314Machinery & Equipment 269,892 95,169 44,683 1,860 27,568 3,795 17,262 307,001 73,397 32,119 13 38,411 1,128 1,726Other Manufactures 11,322 3,062 1,400 69 794 273 526 39,851 3,175 988 7 1,400 289 491Elec., Gas & Water 751 186 113 2 9 2 60 2,230 1,569 1,445 1 2 5 117Construction 4,023 49 5 0 2 32 9 1,268 30 4 0 2 18 7Trade & Transport 81,445 7,036 2,401 308 744 514 3,069 75,050 5,657 1,696 296 1,270 873 1,523Other Private Services 81,707 7,752 3,889 151 928 588 2,195 59,724 4,563 2,111 94 741 522 1,096Government Services 42,165 3,727 826 139 722 282 1,759 18,838 1,698 467 54 144 335 699Total 852,808 268,375 135,019 4,554 68,250 17,843 42,708 1,022,879 317,342 171,418 2,924 87,739 17,004 38,256
World TotalFTAA
Canada Chile Mexico CAC SouthAmerica
World TotalFTAA
Canada Chile Mexico CAC SouthAmerica
Agriculture 100.0 24.9 8.0 0.1 9.2 3.1 4.4 100.0 72.7 21.4 3.9 15.9 12.3 19.3Mining 100.0 33.2 22.0 0.6 3.3 0.4 6.8 100.0 55.8 24.4 0.1 11.9 0.9 18.4Food, Beverages & Tobacco 100.0 28.0 13.0 0.3 6.8 4.8 3.2 100.0 41.3 19.3 1.9 6.8 4.9 8.4Textiles 100.0 57.6 22.1 0.8 17.9 11.9 4.9 100.0 30.4 8.4 0.0 12.3 8.0 1.7Wearing Apparel 100.0 68.8 6.2 0.3 23.7 35.5 3.1 100.0 28.9 2.7 0.0 10.4 14.2 1.6Leather Products & Footwear 100.0 34.5 8.1 0.3 14.2 9.3 2.6 100.0 13.0 1.0 0.0 2.8 2.0 7.2Wood & Wood Products 100.0 46.8 26.3 0.5 11.6 3.7 4.7 100.0 68.4 57.7 0.8 6.8 0.4 2.8Chemicals 100.0 40.2 17.5 0.7 11.5 3.0 7.5 100.0 30.7 20.0 0.2 3.6 1.1 5.7Non-metallic Min. Products 100.0 39.7 22.7 0.8 7.7 2.3 6.3 100.0 35.0 18.3 0.1 9.7 2.6 4.3Metal Products 100.0 52.4 30.6 0.7 14.9 2.1 4.2 100.0 43.6 27.9 1.0 7.5 0.8 6.4Transportation Equipment 100.0 45.8 32.7 0.6 7.9 0.9 3.6 100.0 46.1 34.1 0.0 10.9 0.0 1.0Machinery & Equipment 100.0 35.3 16.6 0.7 10.2 1.4 6.4 100.0 23.9 10.5 0.0 12.5 0.4 0.6Other Manufactures 100.0 27.0 12.4 0.6 7.0 2.4 4.6 100.0 8.0 2.5 0.0 3.5 0.7 1.2Elec., Gas & Water 100.0 24.8 15.1 0.2 1.3 0.3 8.0 100.0 70.4 64.8 0.0 0.1 0.2 5.2Construction 100.0 1.2 0.1 0.0 0.0 0.8 0.2 100.0 2.4 0.3 0.0 0.1 1.4 0.5Trade & Transport 100.0 8.6 2.9 0.4 0.9 0.6 3.8 100.0 7.5 2.3 0.4 1.7 1.2 2.0Other Private Services 100.0 9.5 4.8 0.2 1.1 0.7 2.7 100.0 7.6 3.5 0.2 1.2 0.9 1.8Government Services 100.0 8.8 2.0 0.3 1.7 0.7 4.2 100.0 9.0 2.5 0.3 0.8 1.8 3.7Total 100.0 31.5 15.8 0.5 8.0 2.1 5.0 100.0 31.0 16.8 0.3 8.6 1.7 3.7Source: GTAP 5.4 adapted from Dimaranan and McDougall (2002).
U.S. Imports
U.S. Imports
U.S. Exports
U.S. Exports

Table A-3. Shares and Total Values of Exports by Destination, 1997: Canada, Chile, Mexico, CAC and South America(Percent)
U.S. Chile Mexico CAC SouthAmerica
Global U.S. Canada Mexico CAC SouthAmerica
Global U.S. Canada Chile CAC SouthAmerica
Global
Agriculture 40.1 0.6 2.7 0.9 5.0 100.0 33.0 1.4 2.3 0.6 17.8 100.0 76.8 2.0 0.2 1.6 1.0 100.0Mining 80.8 0.2 0.3 0.1 0.7 100.0 2.5 1.4 3.3 0.0 10.2 100.0 72.1 1.6 0.1 4.4 0.2 100.0Food, Beverages & Tobacco 66.8 0.1 0.7 1.5 1.0 100.0 17.3 2.8 1.6 1.7 14.1 100.0 64.1 1.9 0.9 4.9 4.3 100.0Textiles 83.9 0.2 0.4 0.3 0.5 100.0 5.0 1.4 12.0 1.4 64.9 100.0 77.6 2.4 1.8 4.1 4.7 100.0Wearing Apparel 86.1 0.1 0.6 0.5 0.2 100.0 23.1 3.0 4.4 1.6 37.6 100.0 96.0 0.6 0.2 0.5 0.2 100.0Leather Products & Footwear 80.4 0.0 0.7 0.2 0.7 100.0 9.3 2.1 7.6 0.7 47.7 100.0 79.3 3.0 1.4 2.8 1.2 100.0Wood & Wood Products 76.2 0.1 0.2 0.3 1.3 100.0 17.5 0.2 0.7 0.5 22.6 100.0 82.7 6.5 0.7 2.7 3.0 100.0Chemicals 80.7 0.2 0.5 0.4 1.7 100.0 15.5 1.3 2.6 2.1 39.5 100.0 46.3 1.8 2.7 10.8 17.1 100.0Non-metallic Min. Products 89.3 0.1 0.2 0.2 0.5 100.0 14.6 0.1 0.9 1.8 35.0 100.0 72.4 3.6 2.6 6.6 5.6 100.0Metal Products 80.9 0.1 0.2 0.2 0.3 100.0 10.3 0.1 1.9 0.4 9.5 100.0 69.5 2.4 2.2 4.3 6.4 100.0Transportation Equipment 93.6 0.0 0.6 0.1 1.3 100.0 3.4 0.6 3.8 1.3 83.4 100.0 81.5 9.1 1.5 1.0 3.4 100.0Machinery & Equipment 80.4 0.2 0.6 0.4 1.5 100.0 4.0 0.6 9.6 2.4 71.5 100.0 90.3 2.2 0.6 0.9 2.1 100.0Other Manufactures 72.5 0.2 0.3 0.6 0.8 100.0 24.9 2.1 4.2 3.3 36.3 100.0 87.0 2.1 0.5 1.3 1.7 100.0Elec., Gas & Water 78.5 0.0 0.3 0.1 3.9 100.0 15.6 2.6 0.9 0.5 2.9 100.0 10.7 13.5 4.6 0.1 2.0 100.0Construction 5.3 0.1 0.3 2.1 1.7 100.0 4.7 0.8 0.4 2.1 1.7 100.0 4.3 0.6 0.1 2.4 1.3 100.0Trade & Transport 15.2 0.4 0.9 0.5 3.2 100.0 13.9 1.5 0.8 0.4 3.1 100.0 15.9 2.5 0.3 0.5 3.1 100.0Other Private Services 13.9 0.2 0.4 0.6 2.7 100.0 15.6 3.3 3.1 0.8 2.8 100.0 25.2 1.5 0.2 0.7 2.2 100.0Government Services 41.8 0.2 0.9 0.5 2.3 100.0 49.0 0.6 0.9 0.5 2.1 100.0 32.0 1.5 0.2 0.6 2.4 100.0Total - Percent 72.8 0.2 0.5 0.4 1.6 100.0 14.0 1.2 2.2 0.7 15.1 100.0 75.0 3.3 0.9 2.3 3.3 100.0Total Value (Bill. $) 168.2 0.4 1.3 0.8 3.6 231.0 2.6 0.2 0.4 0.1 2.8 18.8 86.4 3.7 1.0 2.6 3.8 115.2
U.S. Canada Chile Mexico SouthAmerica
Global U.S. Canada Chile Mexico CAC Global
Agriculture 38.1 3.4 0.1 0.6 0.3 100.0 17.3 1.2 1.1 0.5 0.9 100.0Mining 84.7 0.2 0.0 0.1 1.9 100.0 49.7 2.4 3.6 0.3 7.5 100.0Food, Beverages & Tobacco 30.1 2.6 1.6 1.6 3.0 100.0 10.6 1.2 2.6 0.6 1.8 100.0Textiles 82.0 0.9 0.1 0.6 2.3 100.0 13.2 1.6 4.9 1.8 1.9 100.0Wearing Apparel 94.2 1.0 0.1 0.1 0.7 100.0 44.3 1.0 2.8 0.5 2.7 100.0Leather Products & Footwear 69.4 0.9 0.1 0.6 6.2 100.0 40.4 3.1 1.2 1.1 0.8 100.0Wood & Wood Products 24.7 0.6 0.1 1.8 6.0 100.0 20.5 0.9 2.4 1.1 2.8 100.0Chemicals 19.4 0.8 1.6 3.1 8.7 100.0 26.5 1.5 4.5 4.3 6.2 100.0Non-metallic Min. Products 57.5 0.3 0.1 1.0 8.2 100.0 25.6 0.9 5.7 2.1 5.6 100.0Metal Products 19.4 19.6 0.0 2.8 5.1 100.0 26.3 2.9 2.5 3.0 1.9 100.0Transportation Equipment 1.4 0.4 0.0 0.1 2.1 100.0 15.0 0.7 3.2 1.9 3.5 100.0Machinery & Equipment 57.6 1.6 0.2 1.1 10.8 100.0 18.7 1.1 5.1 2.4 2.3 100.0Other Manufactures 45.6 0.6 0.2 0.5 3.4 100.0 46.7 1.0 2.1 1.1 1.3 100.0Elec., Gas & Water 10.8 5.8 0.1 1.2 16.6 100.0 6.2 4.2 0.0 0.8 0.3 100.0Construction 22.7 1.9 0.2 1.1 4.1 100.0 5.4 0.6 0.1 0.4 2.4 100.0Trade & Transport 15.5 2.1 0.4 0.9 3.3 100.0 14.1 1.7 0.4 0.8 0.6 100.0Other Private Services 20.5 3.4 0.2 1.2 3.2 100.0 14.5 3.5 0.2 2.5 0.9 100.0Government Services 38.6 1.5 0.2 1.0 2.8 100.0 39.5 1.1 0.2 0.9 0.6 100.0Total - Percent 40.9 2.8 0.5 1.1 3.6 100.0 24.2 1.7 2.7 1.5 3.1 100.0Total Value (Bill. $) 16.1 1.1 0.2 0.4 1.4 39.3 35.9 2.6 4.0 2.2 4.6 148.5Source: Adapted from Dimaranan and McDougall (2002).
CAC South America
Canada Chile Mexico
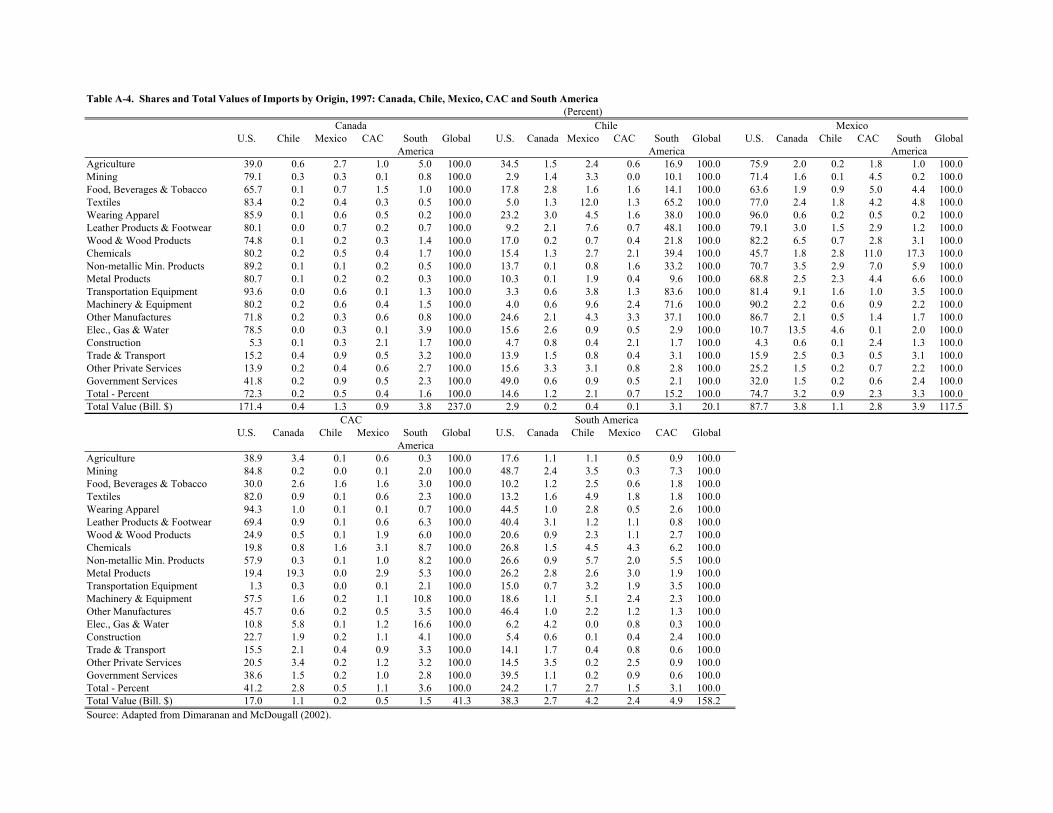
Table A-4. Shares and Total Values of Imports by Origin, 1997: Canada, Chile, Mexico, CAC and South America(Percent)
U.S. Chile Mexico CAC SouthAmerica
Global U.S. Canada Mexico CAC SouthAmerica
Global U.S. Canada Chile CAC SouthAmerica
Global
Agriculture 39.0 0.6 2.7 1.0 5.0 100.0 34.5 1.5 2.4 0.6 16.9 100.0 75.9 2.0 0.2 1.8 1.0 100.0Mining 79.1 0.3 0.3 0.1 0.8 100.0 2.9 1.4 3.3 0.0 10.1 100.0 71.4 1.6 0.1 4.5 0.2 100.0Food, Beverages & Tobacco 65.7 0.1 0.7 1.5 1.0 100.0 17.8 2.8 1.6 1.6 14.1 100.0 63.6 1.9 0.9 5.0 4.4 100.0Textiles 83.4 0.2 0.4 0.3 0.5 100.0 5.0 1.3 12.0 1.3 65.2 100.0 77.0 2.4 1.8 4.2 4.8 100.0Wearing Apparel 85.9 0.1 0.6 0.5 0.2 100.0 23.2 3.0 4.5 1.6 38.0 100.0 96.0 0.6 0.2 0.5 0.2 100.0Leather Products & Footwear 80.1 0.0 0.7 0.2 0.7 100.0 9.2 2.1 7.6 0.7 48.1 100.0 79.1 3.0 1.5 2.9 1.2 100.0Wood & Wood Products 74.8 0.1 0.2 0.3 1.4 100.0 17.0 0.2 0.7 0.4 21.8 100.0 82.2 6.5 0.7 2.8 3.1 100.0Chemicals 80.2 0.2 0.5 0.4 1.7 100.0 15.4 1.3 2.7 2.1 39.4 100.0 45.7 1.8 2.8 11.0 17.3 100.0Non-metallic Min. Products 89.2 0.1 0.1 0.2 0.5 100.0 13.7 0.1 0.8 1.6 33.2 100.0 70.7 3.5 2.9 7.0 5.9 100.0Metal Products 80.7 0.1 0.2 0.2 0.3 100.0 10.3 0.1 1.9 0.4 9.6 100.0 68.8 2.5 2.3 4.4 6.6 100.0Transportation Equipment 93.6 0.0 0.6 0.1 1.3 100.0 3.3 0.6 3.8 1.3 83.6 100.0 81.4 9.1 1.6 1.0 3.5 100.0Machinery & Equipment 80.2 0.2 0.6 0.4 1.5 100.0 4.0 0.6 9.6 2.4 71.6 100.0 90.2 2.2 0.6 0.9 2.2 100.0Other Manufactures 71.8 0.2 0.3 0.6 0.8 100.0 24.6 2.1 4.3 3.3 37.1 100.0 86.7 2.1 0.5 1.4 1.7 100.0Elec., Gas & Water 78.5 0.0 0.3 0.1 3.9 100.0 15.6 2.6 0.9 0.5 2.9 100.0 10.7 13.5 4.6 0.1 2.0 100.0Construction 5.3 0.1 0.3 2.1 1.7 100.0 4.7 0.8 0.4 2.1 1.7 100.0 4.3 0.6 0.1 2.4 1.3 100.0Trade & Transport 15.2 0.4 0.9 0.5 3.2 100.0 13.9 1.5 0.8 0.4 3.1 100.0 15.9 2.5 0.3 0.5 3.1 100.0Other Private Services 13.9 0.2 0.4 0.6 2.7 100.0 15.6 3.3 3.1 0.8 2.8 100.0 25.2 1.5 0.2 0.7 2.2 100.0Government Services 41.8 0.2 0.9 0.5 2.3 100.0 49.0 0.6 0.9 0.5 2.1 100.0 32.0 1.5 0.2 0.6 2.4 100.0Total - Percent 72.3 0.2 0.5 0.4 1.6 100.0 14.6 1.2 2.1 0.7 15.2 100.0 74.7 3.2 0.9 2.3 3.3 100.0Total Value (Bill. $) 171.4 0.4 1.3 0.9 3.8 237.0 2.9 0.2 0.4 0.1 3.1 20.1 87.7 3.8 1.1 2.8 3.9 117.5
U.S. Canada Chile Mexico SouthAmerica
Global U.S. Canada Chile Mexico CAC Global
Agriculture 38.9 3.4 0.1 0.6 0.3 100.0 17.6 1.1 1.1 0.5 0.9 100.0Mining 84.8 0.2 0.0 0.1 2.0 100.0 48.7 2.4 3.5 0.3 7.3 100.0Food, Beverages & Tobacco 30.0 2.6 1.6 1.6 3.0 100.0 10.2 1.2 2.5 0.6 1.8 100.0Textiles 82.0 0.9 0.1 0.6 2.3 100.0 13.2 1.6 4.9 1.8 1.8 100.0Wearing Apparel 94.3 1.0 0.1 0.1 0.7 100.0 44.5 1.0 2.8 0.5 2.6 100.0Leather Products & Footwear 69.4 0.9 0.1 0.6 6.3 100.0 40.4 3.1 1.2 1.1 0.8 100.0Wood & Wood Products 24.9 0.5 0.1 1.9 6.0 100.0 20.6 0.9 2.3 1.1 2.7 100.0Chemicals 19.8 0.8 1.6 3.1 8.7 100.0 26.8 1.5 4.5 4.3 6.2 100.0Non-metallic Min. Products 57.9 0.3 0.1 1.0 8.2 100.0 26.6 0.9 5.7 2.0 5.5 100.0Metal Products 19.4 19.3 0.0 2.9 5.3 100.0 26.2 2.8 2.6 3.0 1.9 100.0Transportation Equipment 1.3 0.3 0.0 0.1 2.1 100.0 15.0 0.7 3.2 1.9 3.5 100.0Machinery & Equipment 57.5 1.6 0.2 1.1 10.8 100.0 18.6 1.1 5.1 2.4 2.3 100.0Other Manufactures 45.7 0.6 0.2 0.5 3.5 100.0 46.4 1.0 2.2 1.2 1.3 100.0Elec., Gas & Water 10.8 5.8 0.1 1.2 16.6 100.0 6.2 4.2 0.0 0.8 0.3 100.0Construction 22.7 1.9 0.2 1.1 4.1 100.0 5.4 0.6 0.1 0.4 2.4 100.0Trade & Transport 15.5 2.1 0.4 0.9 3.3 100.0 14.1 1.7 0.4 0.8 0.6 100.0Other Private Services 20.5 3.4 0.2 1.2 3.2 100.0 14.5 3.5 0.2 2.5 0.9 100.0Government Services 38.6 1.5 0.2 1.0 2.8 100.0 39.5 1.1 0.2 0.9 0.6 100.0Total - Percent 41.2 2.8 0.5 1.1 3.6 100.0 24.2 1.7 2.7 1.5 3.1 100.0Total Value (Bill. $) 17.0 1.1 0.2 0.5 1.5 41.3 38.3 2.7 4.2 2.4 4.9 158.2Source: Adapted from Dimaranan and McDougall (2002).
CAC South America
Canada Chile Mexico

Table A-5. Employment by Sector, 1997: United States and Other FTAA Countries/Regions(Percent of Employment and Number of Workers)
% Workers % Workers % Workers % Workers % Workers % WorkersAgriculture 2.7 3,538,000 3.8 1,057,800 14.4 775,900 24.2 9,023,392 25.8 4,073,711 18.1 18,635,678Mining 0.5 634,000 1.3 364,800 1.6 87,900 0.3 108,437 0.6 97,348 1.0 1,021,196Food, Beverages & Tobacco 1.7 2,144,942 2.0 543,754 5.2 277,309 4.2 1,556,262 4.6 725,235 3.6 3,657,121Textiles 0.7 948,740 0.5 143,052 0.8 45,525 1.3 495,191 1.1 179,245 1.1 1,118,847Wearing Apparel 0.6 796,958 0.6 160,479 0.7 40,186 0.4 161,768 3.3 512,837 1.1 1,103,914Leather Products & Footwear 0.1 111,039 0.1 32,309 0.5 27,909 0.5 172,152 0.4 63,601 0.4 456,190Wood & Wood Products 1.7 2,218,458 3.2 901,658 2.5 133,659 1.6 586,075 1.3 207,217 1.5 1,586,805Chemicals 2.1 2,666,937 1.7 462,217 2.2 120,628 2.8 1,041,845 1.7 260,793 2.1 2,172,198Non-metallic Min. Products 0.5 689,823 0.4 115,557 0.6 34,859 0.9 325,305 0.6 88,125 0.9 887,379Metal Products 2.4 3,053,744 2.0 552,920 2.0 106,750 1.3 492,957 0.7 117,625 1.3 1,335,574Transportation Equipment 1.7 2,244,402 1.9 534,043 0.5 26,358 1.6 583,420 0.2 28,232 0.5 522,903Machinery & Equipment 4.2 5,440,783 2.6 718,748 0.8 43,890 2.1 790,311 0.8 123,325 0.8 859,293Other Manufactures 0.4 519,174 0.2 68,962 0.1 3,728 0.2 61,762 0.2 33,932 0.2 168,550Elec., Gas & Water 1.2 1,493,000 0.9 256,000 0.6 31,100 0.5 187,564 0.9 137,560 0.2 212,583Construction 6.4 8,302,000 5.3 1,478,000 9.1 488,800 4.7 1,759,103 6.2 982,142 6.8 6,973,844Trade & Transport 26.6 34,466,000 30.6 8,541,100 25.6 1,376,900 25.6 9,550,372 24.1 3,800,310 22.8 23,466,222Other Private Services 11.4 14,768,000 14.0 3,905,500 7.0 376,500 4.1 1,513,318 2.6 404,888 3.6 3,660,586Government Services 35.1 45,521,000 28.8 8,042,700 25.7 1,382,400 24.0 8,950,667 24.9 3,924,632 34.1 35,062,057Total 100.0 129,557,000 100.0 27,879,600 100.0 5,380,300 100.0 37,359,900 100.0 15,760,757 100.0 102,900,940Sources: ILO website (2003); UNIDO (2003); and World Bank (2003).
United States CACMexico South AmericaCanada Chile

Table A-6. Stock of U.S. Foreign Direct Investment Abroad, 2002(Millions of U.S. Dollars and Percent)
World Total FTAA Canada Chile Mexico CAC South AmericaMil. Mil. Mil. Mil. Mil. Mil. Mil.
Mining 80,976 36,045 20,345 2,939 459 n.a. 12,302Utilities 20,932 9,253 355 1,743 298 n.a. 6,857Manufacturing Total 392,553 113,732 67,209 1,807 19,172 n.a. 25,544
Of which Food 28,240 8,406 3,668 56 1,228 136 3,318Chemicals 99,371 21,288 9,765 594 4,999 n.a. 5,930Primary and fabricated metals 24,359 8,822 4,430 39 n.a. 28 4,325Machinery 22,025 4,887 1,930 28 1,011 1 1,917Computer and electronic products 69,208 8,537 9,189 2 -1,414 n.a. 760Electrical equipment, appliances, and components 10,166 2,462 1,578 16 735 104 29Transportation equipment 48,378 25,073 17,504 n.a. 4,861 n.a. 2,708
Wholesale trade 114,895 20,508 9,065 610 2,365 21 8,447Information 53,841 7,628 1,861 490 n.a. n.a. 5,277Depository institutions 52,935 8,283 2,211 989 13,630 n.a. -8,547Finance (except depository institutions) and insurance 244,480 94,757 23,498 2,072 n.a. 19 69,168Professional, scientific, and technical services 38,307 5,264 1,863 12 573 26 2,790Other industries 522,047 129,238 26,116 962 12,472 n.a. 89,688Total 1,520,965 424,885 152,522 11,625 58,074 1,786 200,878
World Total FTAA Canada Chile Mexico CAC South America% % % % % % %
Mining 5.3 8.5 13.3 25.3 0.8 n.a. 6.1Utilities 1.4 2.2 0.2 15.0 0.5 n.a. 3.4Manufacturing Total 25.8 26.8 44.1 15.5 33.0 n.a. 12.7
Of which Food 1.9 2.0 2.4 0.5 2.1 7.6 1.7Chemicals 6.5 5.0 6.4 5.1 8.6 n.a. 3.0Primary and fabricated metals 1.6 2.1 2.9 0.3 n.a. 1.6 2.2Machinery 1.4 1.2 1.3 0.2 1.7 0.1 1.0Computer and electronic products 4.6 2.0 6.0 0.0 -2.4 n.a. 0.4Electrical equipment, appliances, and components 0.7 0.6 1.0 0.1 1.3 5.8 0.0Transportation equipment 3.2 5.9 11.5 n.a. 8.4 n.a. 1.3
Wholesale trade 7.6 4.8 5.9 5.2 4.1 1.2 4.2Information 3.5 1.8 1.2 4.2 n.a. n.a. 2.6Depository institutions 3.5 1.9 1.4 8.5 23.5 n.a. -4.3 Finance (except depository institutions) and insurance 16.1 22.3 15.4 17.8 n.a. 1.1 34.4Professional, scientific, and technical services 2.5 1.2 1.2 0.1 1.0 1.5 1.4Other industries 34.3 30.4 17.1 8.3 21.5 n.a. 44.6Total 100.0 100.0 100.0 100.0 100.0 100.0 100.0Notes: 1) FDI data for CAC refer only to Costa Rica and Honduras, South American data refer to Latin America and other Western Hemisphere minus Chile, Mexico, and CAC. 2) n.a. means not available.Source: Adapted from U.S. Bureau of Economic Analysis (2003).