Towards a Globally Competitive Ethiopian Economy:...
78
Towards a Globally Competitive Ethiopian Economy: The Role of Services and Urbanization Case Studies – Rose and Polo Shirt Value Chains Prepared for The World Bank Draft Final Prepared by Global Development Solutions, LLC 18 February, 2011
Transcript of Towards a Globally Competitive Ethiopian Economy:...
Towards a Globally Competitive Ethiopian Economy: The Role of Services and Urbanization
Case Studies – Rose and Polo Shirt Value Chains
Prepared for
The World Bank
Draft Final
Prepared by
Global Development Solutions, LLC
18 February, 2011
Towards a Globally Competitive Ethiopian Economy: The Role of Services and Urbanization. Case Studies – Rose and Polo Shirt Value Chains
Global Development Solutions, LLC 2/18/2011 2
Copyright Global Development Solutions, LLCTM
All Rights Reserved
Global Development Solutions, LLC
11921 Freedom Drive Suite 550
Reston, VA. 20190 Tel. +1 703 904-4373 Fax. +1 703 991-4056
E-mail: [email protected]
Towards a Globally Competitive Ethiopian Economy: The Role of Services and Urbanization. Case Studies – Rose and Polo Shirt Value Chains
Global Development Solutions, LLC 2/18/2011 3
Table of Contents
I. Objectives and Approach of the Study.............................................................................................. 6
II. Background: Cut Flowers and Apparel – International Market Overview ................................. 8 1. Cut Flower Trade............................................................................................................................. 8 2. Apparel Trade .................................................................................................................................. 9
III. Ethiopia’s Services Value Chain and the Role of Urban Concentration (Addis Ababa) ....... 11 1. Objective ........................................................................................................................................ 11 2. The Service Value Chain - Background ......................................................................................... 11 3. Urbanization and the Role of Addis Ababa – Advantages and Disadvantages of Concentration.. 12 4. Transport/Trade Costs and Cities .................................................................................................. 14 5. Addis Ababa as an “Anchor” of Urban Economies – Its Growth and Activities in Nearby Towns18 6. Addis Ababa in Comparison with other Cities ............................................................................... 25 7. Addis Ababa as a Service Market Anchor/Leader – Strengths and Weaknesses............................ 28
IV. Case Study 1: the Role of Services in the Ethiopian Garment Value Chain (Polo Shirts).... 32 1. The Garment Supply Chain ............................................................................................................ 32 2. Role of Services in the Import of Inputs – Garment Value Chain (Polo Shirts)............................. 34 3. Role of Services in Production – Garment Value Chain (Polo Shirts)........................................... 43 4. Role of Services in Exports – Garment Value Chain (Polo Shirts) ................................................ 45 5. The Contribution of Addis Ababa to the Garment Value Chain (Polo Shirts) ............................... 47
1. Geographic Distribution of the Garment Industry in Ethiopia .................................................. 47 2. Geographic Distribution of Service Providers to the Garment Industry in Ethiopia ................. 48
V. Case Study 2: the Role of Services in the Ethiopian Cut Flowers Value Chain (Roses) ............ 52 1. The Cut Flowers Supply Chain ...................................................................................................... 52 2. Role of Services in the Import of Inputs – Value Chain for Cut Flowers (Roses) .......................... 54 3. Role of Services in Production – Cut Flowers Value Chain (Roses) ............................................. 55 4. Role of Services in Exports – Cut Flowers Value Chain (Roses) ................................................... 57 5. The Contribution of Addis Ababa to the Value Chain for Cut Flowers (Roses)............................. 62
1. Geographic Distribution of the Cut Flowers Industry in Ethiopia............................................. 62 2. Geographic Distribution of Service Providers to the Cut Flowers Industry in Ethiopia ........... 64
VI. Conclusions ................................................................................................................................... 69
ANNEX 1: Power Consumption in Ethiopia (Domestic, Commercial and Industrial) ........................ 74
ANNEX 2: An Overview of the Financial Services in Ethiopia............................................................. 75
ANNEX 3: Commercial Banks and Insurance Companies in Ethiopia................................................ 78
Towards a Globally Competitive Ethiopian Economy: The Role of Services and Urbanization. Case Studies – Rose and Polo Shirt Value Chains
Global Development Solutions, LLC 2/18/2011 4
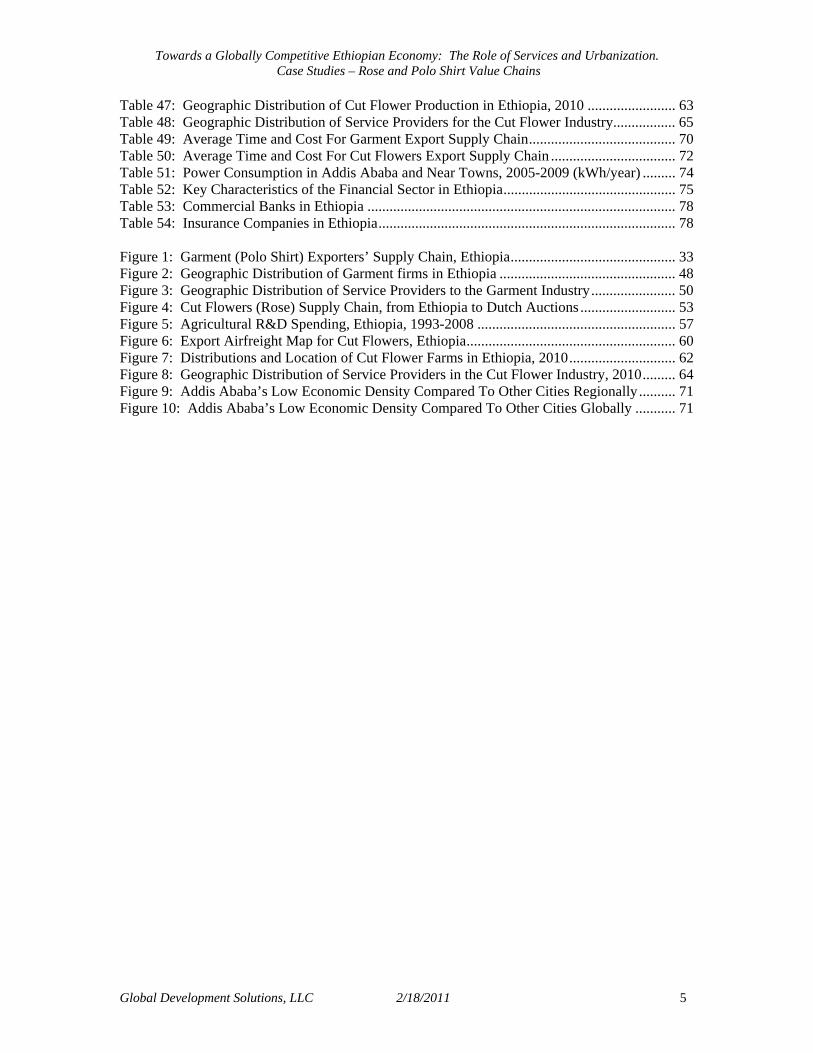
List of Tables and Figures
Table 1: Cut Flowers Exports, Sub Saharan Africa, 2009 (US$ thousand) ................................... 8 Table 2: Employment Statistics for Ethiopian Cut Flower Sector ................................................. 9 Table 3: Apparel Exports, Sub-Saharan Africa, 2009 (US$ thousand)........................................ 10 Table 4: Employment Statistics for Ethiopia Apparel Sector....................................................... 10 Table 5: Business Services and the Manufacturing Value Chain................................................. 12 Table 6: Urbanization in Selected African Countries................................................................... 14 Table 7: African Cities, Comparative Data .................................................................................. 14 Table 8: Overall Growth of Towns .............................................................................................. 18 Table 9: Growth of Selected Larger Towns ................................................................................. 19 Table 10: Features of Selected Towns Close to Addis Ababa...................................................... 20 Table 11: Ten Largest Cities Ethiopia, 2007................................................................................ 20 Table 12: Number of Power Customers in Ethiopia..................................................................... 23 Table 13: Power Consumption Growth per Annum 2005/6 – 2008/9.......................................... 23 Table 14: Share of Addis Ababa in Power Consumption............................................................. 24 Table 15: Number of Enterprises and Employment in Addis Ababa and its Proximity............... 24 Table 16: Comparisons of Addis Ababa and Other Cities: Investment Climate Survey Data ..... 26 Table 17: Infrastructure Indicators in Select African Cities......................................................... 26 Table 18: Delays in Land Acquisition, Costs of Security and Theft by City ............................... 27 Table 19: Days Required to Process Lease for Urban Industrial land: Selected Countries.......... 27 Table 20: Doing Business International Ranking 2011................................................................ 28 Table 21: Addis Ababa and other African Cities, 2005 ............................................................... 30 Table 22: Addis Ababa as Primate City: Pros and Cons .............................................................. 31 Table 23: Cost of Services in the Ethiopian Export Polo Shirt, 2010 .......................................... 35 Table 24: Cost of Input Import Related Services as Share of Input Costs, 2010 ......................... 36 Table 25: Transportation and Handling Costs for Imported Inputs.............................................. 37 Table 26: Comparative Transport Cost ........................................................................................ 37 Table 27: Clothing and Accessories, Comparative Product Performance Table, 2007................ 38 Table 28: Storage Grace Period per Shipping Line...................................................................... 40 Table 29: Customs and Highway Inspection Points and Duration for Imported Cargo, Ethiopia 40 Table 30: Procedures and Time Lapse During Input Import Process, Ethiopia ........................... 41 Table 31: The Role of Services in the Polo Shirt Assembly Costs, Ethiopia............................... 43 Table 32: Commercial Banks in Ethiopia, 2010........................................................................... 44 Table 33: Sample Commercial Bank Rates in Ethiopia, 2010 ..................................................... 44 Table 34: The Role of Export Services in the Polo Shirt Garment Price, Ethiopia...................... 45 Table 35: Procedures and Time Lapse During the Garment Export Process, Ethiopia................ 46 Table 36: Service Providers to the Garment Industry .................................................................. 49 Table 37: Cities with Garment Firms, Ethiopia............................................................................ 51 Table 38: Cost of Services in the Ethiopian Export Roses, 2010................................................. 54 Table 39: Cost of Input Import Related Services, Share in Rose Production Input Costs, 2010 . 55 Table 40: The Role of Services in the Ex-Farm Rose Production Cost, Ethiopia........................ 56 Table 41: Breeders’ Varieties in Selected Cut-flower Producing Countries ................................ 56 Table 42: The Role of Export Services in Cut Flower Export Price, Ethiopia............................. 58 Table 43: Airfreight Cargo Fees. Addis Ababa - Europe ............................................................. 58 Table 44: Airlines Represented by Tradepath International PLC ................................................ 59 Table 45: Summary of Flower Export Handling Process and Duration....................................... 61 Table 46: Refer Trucks’ Service Supply for Cut Flower Exports ................................................ 62
Towards a Globally Competitive Ethiopian Economy: The Role of Services and Urbanization. Case Studies – Rose and Polo Shirt Value Chains
Global Development Solutions, LLC 2/18/2011 5
Table 47: Geographic Distribution of Cut Flower Production in Ethiopia, 2010 ........................ 63 Table 48: Geographic Distribution of Service Providers for the Cut Flower Industry................. 65 Table 49: Average Time and Cost For Garment Export Supply Chain........................................ 70 Table 50: Average Time and Cost For Cut Flowers Export Supply Chain .................................. 72 Table 51: Power Consumption in Addis Ababa and Near Towns, 2005-2009 (kWh/year) ......... 74 Table 52: Key Characteristics of the Financial Sector in Ethiopia............................................... 75 Table 53: Commercial Banks in Ethiopia .................................................................................... 78 Table 54: Insurance Companies in Ethiopia................................................................................. 78 Figure 1: Garment (Polo Shirt) Exporters’ Supply Chain, Ethiopia............................................. 33 Figure 2: Geographic Distribution of Garment firms in Ethiopia ................................................ 48 Figure 3: Geographic Distribution of Service Providers to the Garment Industry....................... 50 Figure 4: Cut Flowers (Rose) Supply Chain, from Ethiopia to Dutch Auctions .......................... 53 Figure 5: Agricultural R&D Spending, Ethiopia, 1993-2008 ...................................................... 57 Figure 6: Export Airfreight Map for Cut Flowers, Ethiopia......................................................... 60 Figure 7: Distributions and Location of Cut Flower Farms in Ethiopia, 2010............................. 62 Figure 8: Geographic Distribution of Service Providers in the Cut Flower Industry, 2010......... 64 Figure 9: Addis Ababa’s Low Economic Density Compared To Other Cities Regionally .......... 71 Figure 10: Addis Ababa’s Low Economic Density Compared To Other Cities Globally ........... 71
Towards a Globally Competitive Ethiopian Economy: The Role of Services and Urbanization. Case Studies – Rose and Polo Shirt Value Chains
Global Development Solutions, LLC 2/18/2011 6
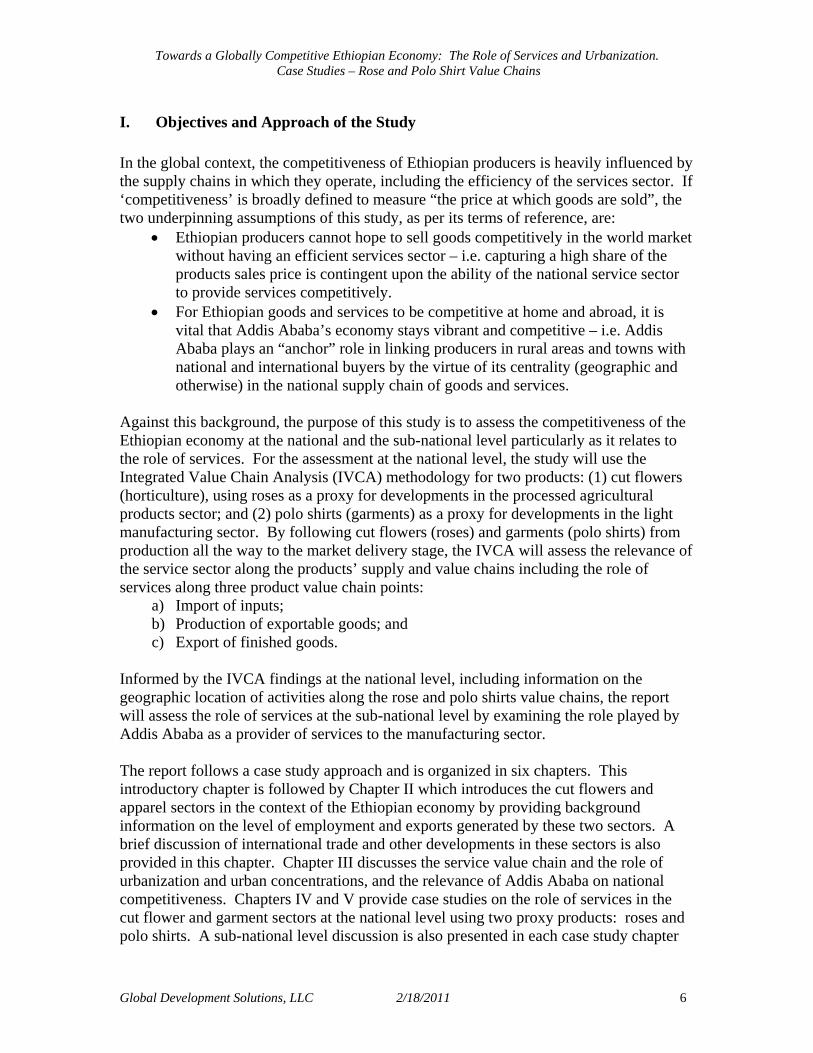
I. Objectives and Approach of the Study In the global context, the competitiveness of Ethiopian producers is heavily influenced by the supply chains in which they operate, including the efficiency of the services sector. If ‘competitiveness’ is broadly defined to measure “the price at which goods are sold”, the two underpinning assumptions of this study, as per its terms of reference, are:
• Ethiopian producers cannot hope to sell goods competitively in the world market without having an efficient services sector – i.e. capturing a high share of the products sales price is contingent upon the ability of the national service sector to provide services competitively.
• For Ethiopian goods and services to be competitive at home and abroad, it is vital that Addis Ababa’s economy stays vibrant and competitive – i.e. Addis Ababa plays an “anchor” role in linking producers in rural areas and towns with national and international buyers by the virtue of its centrality (geographic and otherwise) in the national supply chain of goods and services.
Against this background, the purpose of this study is to assess the competitiveness of the Ethiopian economy at the national and the sub-national level particularly as it relates to the role of services. For the assessment at the national level, the study will use the Integrated Value Chain Analysis (IVCA) methodology for two products: (1) cut flowers (horticulture), using roses as a proxy for developments in the processed agricultural products sector; and (2) polo shirts (garments) as a proxy for developments in the light manufacturing sector. By following cut flowers (roses) and garments (polo shirts) from production all the way to the market delivery stage, the IVCA will assess the relevance of the service sector along the products’ supply and value chains including the role of services along three product value chain points:
a) Import of inputs; b) Production of exportable goods; and c) Export of finished goods.
Informed by the IVCA findings at the national level, including information on the geographic location of activities along the rose and polo shirts value chains, the report will assess the role of services at the sub-national level by examining the role played by Addis Ababa as a provider of services to the manufacturing sector. The report follows a case study approach and is organized in six chapters. This introductory chapter is followed by Chapter II which introduces the cut flowers and apparel sectors in the context of the Ethiopian economy by providing background information on the level of employment and exports generated by these two sectors. A brief discussion of international trade and other developments in these sectors is also provided in this chapter. Chapter III discusses the service value chain and the role of urbanization and urban concentrations, and the relevance of Addis Ababa on national competitiveness. Chapters IV and V provide case studies on the role of services in the cut flower and garment sectors at the national level using two proxy products: roses and polo shirts. A sub-national level discussion is also presented in each case study chapter
Towards a Globally Competitive Ethiopian Economy: The Role of Services and Urbanization. Case Studies – Rose and Polo Shirt Value Chains
Global Development Solutions, LLC 2/18/2011 7
by assessing the role and relevance of Addis Ababa as the country’s key urban center, and the source of many vital services to firms in the selected product value chains. The study ends with Chapter VI which provides concluding remarks.

Towards a Globally Competitive Ethiopian Economy: The Role of Services and Urbanization. Case Studies – Rose and Polo Shirt Value Chains
Global Development Solutions, LLC 2/18/2011 8
II. Background: Cut Flowers and Apparel – International Market Overview
1. Cut Flower Trade In 2009, the world trade in cut flowers was worth roughly US$7 billion. As the world’s leading hub for cut flower trade, the Netherlands maintained its leadership position by exporting roughly half of all cut flowers traded in the world in 2009 (US$3.6 billion). Other major exporting countries include Colombia (US$1 billion in 2009), and Ecuador (US$500 million); on an annual basis, these three countries combined export roughly three quarters of the world’s cut flowers. The largest importers of cut flowers are Germany, the Netherlands, and the United Kingdom, each of which import, on average, US$1 billion worth of cut flowers annually. France, Italy, Russia and Japan make up the bulk of the remaining cut flower imports. Sub-Saharan Africa is a significant region in the global cut flower trade by the virtue of having three big exporters of cut flowers, namely: Kenya, Zimbabwe and Ethiopia (see table below).1 Table 1: Cut Flowers Exports, Sub Saharan Africa, 2009 (US$ thousand)
Exporters Exported value in
2005
Exported value in
2006
Exported value in
2007
Exported value in
2008
Exported value in
2009 % of World
% of Africa
'World $5,617,103 $ 6,811,428 $ 7,121,896 $ 7,705,355 $7,305,167 100% Africa $ 346,263 $ 1,134,251 $ 636,271 $ 804,636 $1,012,821 14% 'Kenya $ 242,561 $ 274,946 $ 313,412 $ 445,996 $ 421,484 6% 42% 'Zimbabwe $ 33,658 $ 765,230 $ 201,056 $ 185,772 $ 334,117 5% 33% 'Ethiopia $ 12,128 $ 25,137 $ 68,827 $ 104,740 $ 131,518 2% 13% 'Nigeria $ - $ 4,585 $ 9,905 $ 67,725 7% 'South Africa $ 24,408 $ 22,064 $ 25,439 $ 28,412 $ 26,467 3% Tanzania $ 9,282 $ 7,791 $ 8,812 $ 13,428 $ 14,075 1% Global Development Solutions LLC from ITC/Comtrade data. Ethiopia is an increasingly important player in the regional and global market for cut flowers. In 2005, the country exported US$12 million worth of cut flowers. By 2009, its cut flower exports increased by tenfold to US$131 million, which represented 13% of African exports and 2% of world exports. In the first ten month of 2010 alone, Ethiopia exported an estimated US$250 million of cut flowers.2 The industry employs roughly 35,000 people – mostly women (80%) employed on temporary basis (80%).
1 North African countries do not export cut flowers in any significant numbers. Sub-Saharan Africa export figures are therefore roughly equal to export figures of the continent as a whole. 2 www.floracultureinternational.com
Towards a Globally Competitive Ethiopian Economy: The Role of Services and Urbanization. Case Studies – Rose and Polo Shirt Value Chains
Global Development Solutions, LLC 2/18/2011 9
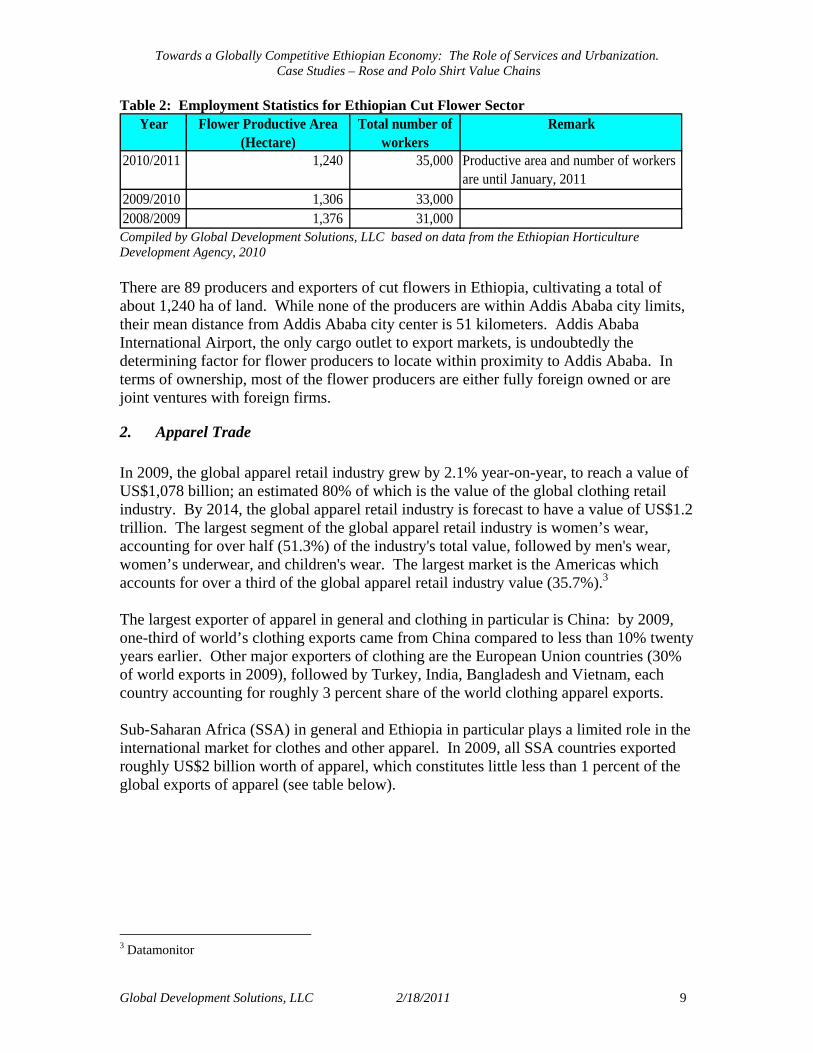
Table 2: Employment Statistics for Ethiopian Cut Flower Sector Year Flower Productive Area
(Hectare)Total number of
workersRemark
2010/2011 1,240 35,000 Productive area and number of workers are until January, 2011
2009/2010 1,306 33,000 2008/2009 1,376 31,000 Compiled by Global Development Solutions, LLC based on data from the Ethiopian Horticulture Development Agency, 2010 There are 89 producers and exporters of cut flowers in Ethiopia, cultivating a total of about 1,240 ha of land. While none of the producers are within Addis Ababa city limits, their mean distance from Addis Ababa city center is 51 kilometers. Addis Ababa International Airport, the only cargo outlet to export markets, is undoubtedly the determining factor for flower producers to locate within proximity to Addis Ababa. In terms of ownership, most of the flower producers are either fully foreign owned or are joint ventures with foreign firms.
2. Apparel Trade In 2009, the global apparel retail industry grew by 2.1% year-on-year, to reach a value of US$1,078 billion; an estimated 80% of which is the value of the global clothing retail industry. By 2014, the global apparel retail industry is forecast to have a value of US$1.2 trillion. The largest segment of the global apparel retail industry is women’s wear, accounting for over half (51.3%) of the industry's total value, followed by men's wear, women’s underwear, and children's wear. The largest market is the Americas which accounts for over a third of the global apparel retail industry value (35.7%).3 The largest exporter of apparel in general and clothing in particular is China: by 2009, one-third of world’s clothing exports came from China compared to less than 10% twenty years earlier. Other major exporters of clothing are the European Union countries (30% of world exports in 2009), followed by Turkey, India, Bangladesh and Vietnam, each country accounting for roughly 3 percent share of the world clothing apparel exports. Sub-Saharan Africa (SSA) in general and Ethiopia in particular plays a limited role in the international market for clothes and other apparel. In 2009, all SSA countries exported roughly US$2 billion worth of apparel, which constitutes little less than 1 percent of the global exports of apparel (see table below).
3 Datamonitor

Towards a Globally Competitive Ethiopian Economy: The Role of Services and Urbanization. Case Studies – Rose and Polo Shirt Value Chains
Global Development Solutions, LLC 2/18/2011 10
Table 3: Apparel Exports, Sub-Saharan Africa, 2009 (US$ thousand) Exporters Exported
value in 2006 Exported value
in 2007 Exported value
in 2008 Exported
value in 2009 % of World % of SSA
'World $ 340,626,012 $ 383,678,608 $ 408,126,132 $ 359,532,180 100% Africa $ 8,959,393 $ 10,325,969 $ 11,525,187 $ 10,267,308 2.9% Sub Saharan Africa $ 2,539,483 $ 2,970,069 $ 3,022,420 $ 2,014,444 0.6% 'Mauritius $ 771,922 $ 884,065 $ 843,054 $ 552,645 27.4% 'Madagascar $ 347,450 $ 502,897 $ 888,173 $ 461,626 22.9% 'Lesotho $ 418,649 $ 413,895 $ 370,149 $ 303,433 15.1% 'Kenya $ 279,255 $ 286,231 $ 288,419 $ 215,847 10.7% 'South Africa $ 171,282 $ 157,512 $ 168,305 $ 159,969 7.9% 'Swaziland $ 150,204 $ 48,059 $ 133,546 $ 99,888 5.0% Tanzania $ 29,181 $ 69,128 $ 76,678 $ 70,205 3.5% 'Malawi $ 43,047 $ 34,919 $ 27,637 $ 31,489 1.6% 'Zimbabwe $ 61,394 $ 79,677 $ 49,328 $ 25,326 1.3% 'Botswana $ 148,941 $ 347,636 $ 30,835 $ 21,976 1.1% 'Côte d'Ivoire $ 17,352 $ 15,623 $ 20,116 $ 16,823 0.8% 'Senegal $ 5,891 $ 6,255 $ 7,657 $ 12,840 0.6% 'Ethiopia $ 8,196 $ 10,927 $ 10,753 $ 7,904 0.4%' ki $ 2 4Global Development Solutions LLC from ITC/Comtrade data.
Ethiopia exports roughly US$7 million - US$10 million worth of apparel each year. Although exports have increased significantly from earlier periods (US$4 million in 2002), the country remains an insignificant player in the global (and regional) apparel trade. Even at these comparatively low export volumes, however, the Ethiopian textile and apparel sector is a major contributor to the country’s industrial production: for the year ending in June 2010, the sector accounted for 7 percent of the country’s industrial production. The sector employs an estimated 9,746 workers who work mostly in small firms (see table below). Table 4: Employment Statistics for Ethiopia Apparel Sector
Company SizeEstimated Number of
Companies% of Companies
by SizeNumber ofEmployees
Ave Number of Employees
Small 397 91.1% 1,961 5 Medium 7 1.6% 343 49 Large 32 7.3% 7,442 233 Total 436 100.0% 9,746 Source: Central Statistical Authority
Towards a Globally Competitive Ethiopian Economy: The Role of Services and Urbanization. Case Studies – Rose and Polo Shirt Value Chains
Global Development Solutions, LLC 2/18/2011 11
III. Ethiopia’s Services Value Chain and the Role of Urban Concentration (Addis Ababa)
1. Objective This section is a preliminary analysis of urbanization in Ethiopia, examining the following issues:
• The extent to which Addis Ababa is an ‘anchor’ for the development of urban economies in Ethiopia, the rate of growth of productive activity over time in and around the city, and the correlation between its growth and the concentration of new enterprises in some geographic proximity.
• The contribution of Addis Ababa compared with similar cities in other
developing countries to assess whether the City of Addis Ababa has a disproportionately high importance for urban market linkages that take place, especially the balance of advantage and disadvantage of concentration and centralization within a single city, and whether a more decentralized structure of value added is a sustainable solution.
• The areas where Addis Ababa is weakest compared to other similar Cities and
the reasons for this – whether it is due to the market structure and/or the policy/regulatory environment, and ways to improve competitiveness of Addis Ababa.
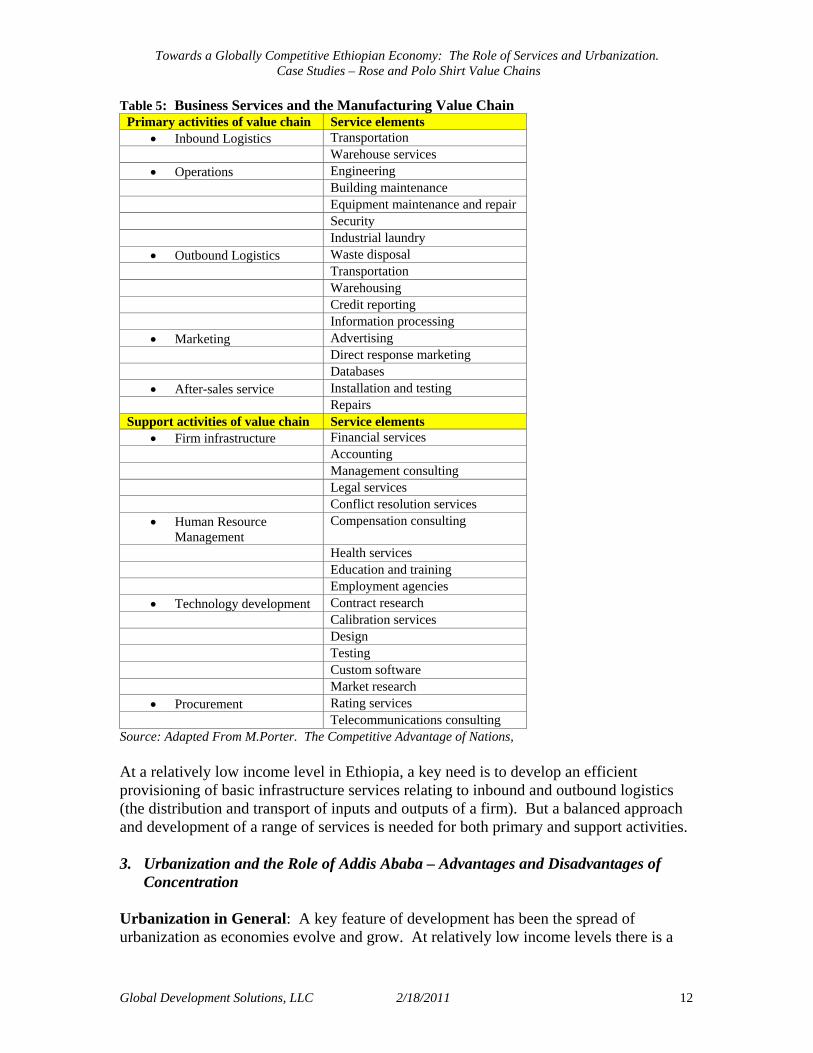
This analysis serves as the background to the value chain analysis of two products, roses and polo shirts. The roses and polo shirt VCAs explore at the business process level the opportunities for cost reduction in services, for investment entry and expanded supply of each product, and for increasing domestic value added by rationalizing or expanding services in Ethiopia. In the process, the VCAs also identify the geographical location of activity in order to provide information to assess the role of the prime city, Addis Ababa, as a provider of services in two important activities. 2. The Service Value Chain - Background The importance of services can be illustrated by reference to the original value-chain model developed by Porter, which comprises five stages of Primary Activities of which most are service activities – Production, Inbound Logistics, Outbound Logistics, Marketing and Sales and After-Sale Service. Operations in turn require service activities such as equipment maintenance. In addition, all Primary Activities are supported by a range of Support Activities covering Firm Infrastructure (that is Finance and Planning), Human Resource Management, Technology Development and Procurement, which have service elements. The table below lists some of the key business services associated with different stages of the manufacturing value chain.
Towards a Globally Competitive Ethiopian Economy: The Role of Services and Urbanization. Case Studies – Rose and Polo Shirt Value Chains
Global Development Solutions, LLC 2/18/2011 12
Table 5: Business Services and the Manufacturing Value Chain Primary activities of value chain Service elements
• Inbound Logistics Transportation Warehouse services
• Operations Engineering Building maintenance Equipment maintenance and repair Security Industrial laundry
• Outbound Logistics Waste disposal Transportation Warehousing Credit reporting Information processing
• Marketing Advertising Direct response marketing Databases
• After-sales service Installation and testing Repairs Support activities of value chain Service elements
• Firm infrastructure Financial services Accounting Management consulting Legal services Conflict resolution services
• Human Resource Management
Compensation consulting
Health services Education and training Employment agencies
• Technology development Contract research Calibration services Design Testing Custom software Market research
• Procurement Rating services Telecommunications consulting
Source: Adapted From M.Porter. The Competitive Advantage of Nations, At a relatively low income level in Ethiopia, a key need is to develop an efficient provisioning of basic infrastructure services relating to inbound and outbound logistics (the distribution and transport of inputs and outputs of a firm). But a balanced approach and development of a range of services is needed for both primary and support activities. 3. Urbanization and the Role of Addis Ababa – Advantages and Disadvantages of
Concentration Urbanization in General: A key feature of development has been the spread of urbanization as economies evolve and grow. At relatively low income levels there is a
Towards a Globally Competitive Ethiopian Economy: The Role of Services and Urbanization. Case Studies – Rose and Polo Shirt Value Chains
Global Development Solutions, LLC 2/18/2011 13
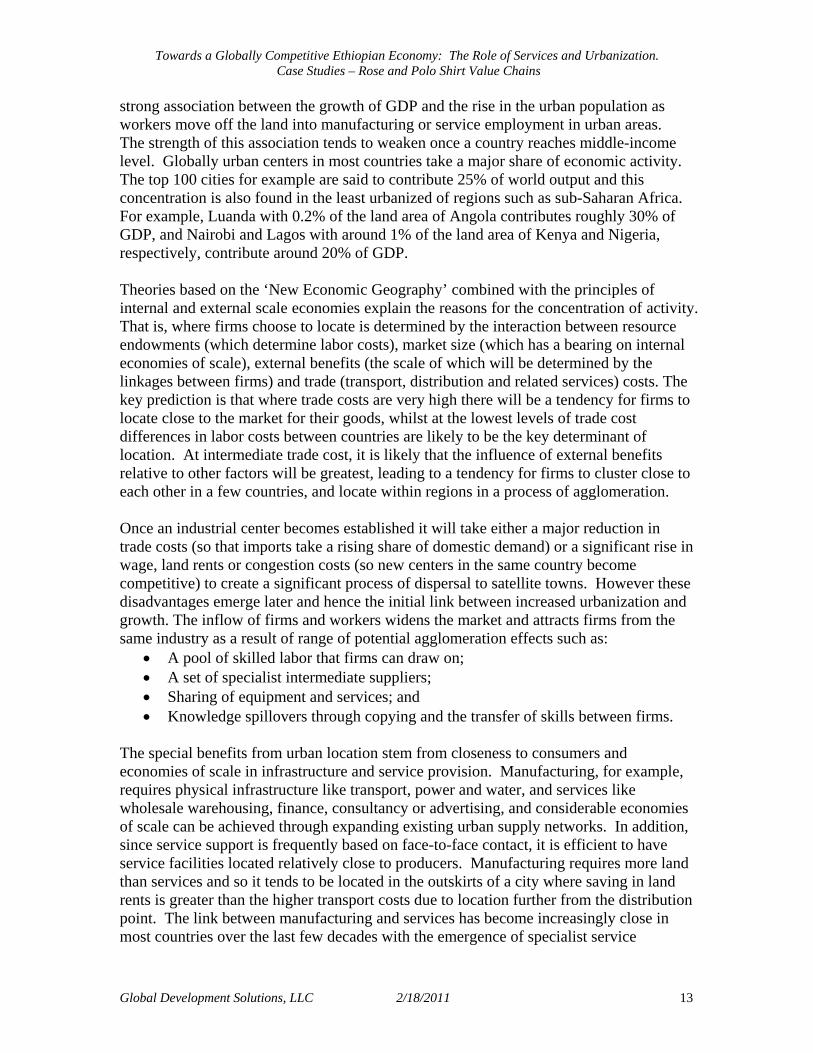
strong association between the growth of GDP and the rise in the urban population as workers move off the land into manufacturing or service employment in urban areas. The strength of this association tends to weaken once a country reaches middle-income level. Globally urban centers in most countries take a major share of economic activity. The top 100 cities for example are said to contribute 25% of world output and this concentration is also found in the least urbanized of regions such as sub-Saharan Africa. For example, Luanda with 0.2% of the land area of Angola contributes roughly 30% of GDP, and Nairobi and Lagos with around 1% of the land area of Kenya and Nigeria, respectively, contribute around 20% of GDP. Theories based on the ‘New Economic Geography’ combined with the principles of internal and external scale economies explain the reasons for the concentration of activity. That is, where firms choose to locate is determined by the interaction between resource endowments (which determine labor costs), market size (which has a bearing on internal economies of scale), external benefits (the scale of which will be determined by the linkages between firms) and trade (transport, distribution and related services) costs. The key prediction is that where trade costs are very high there will be a tendency for firms to locate close to the market for their goods, whilst at the lowest levels of trade cost differences in labor costs between countries are likely to be the key determinant of location. At intermediate trade cost, it is likely that the influence of external benefits relative to other factors will be greatest, leading to a tendency for firms to cluster close to each other in a few countries, and locate within regions in a process of agglomeration. Once an industrial center becomes established it will take either a major reduction in trade costs (so that imports take a rising share of domestic demand) or a significant rise in wage, land rents or congestion costs (so new centers in the same country become competitive) to create a significant process of dispersal to satellite towns. However these disadvantages emerge later and hence the initial link between increased urbanization and growth. The inflow of firms and workers widens the market and attracts firms from the same industry as a result of range of potential agglomeration effects such as:
• A pool of skilled labor that firms can draw on; • A set of specialist intermediate suppliers; • Sharing of equipment and services; and • Knowledge spillovers through copying and the transfer of skills between firms.
The special benefits from urban location stem from closeness to consumers and economies of scale in infrastructure and service provision. Manufacturing, for example, requires physical infrastructure like transport, power and water, and services like wholesale warehousing, finance, consultancy or advertising, and considerable economies of scale can be achieved through expanding existing urban supply networks. In addition, since service support is frequently based on face-to-face contact, it is efficient to have service facilities located relatively close to producers. Manufacturing requires more land than services and so it tends to be located in the outskirts of a city where saving in land rents is greater than the higher transport costs due to location further from the distribution point. The link between manufacturing and services has become increasingly close in most countries over the last few decades with the emergence of specialist service

Towards a Globally Competitive Ethiopian Economy: The Role of Services and Urbanization. Case Studies – Rose and Polo Shirt Value Chains
Global Development Solutions, LLC 2/18/2011 14
suppliers who undertake activities that might earlier have been conducted in-house by a manufacturing firm. To get an indication of how Addis Ababa compares in terms of the level of urban concentration, the table provides some comparisons with other African cities, in relation also to infrastructure development. Table 6: Urbanization in Selected African Countries
Country Agglomeration Index 2000
Urban Pop 2000 %
Urban Pop 2005 %
Road Density km/100 km2
Rail density km/100 km2
Ethiopia 11.9 14.9 16.0 3.6 0.1 Gambia 44.0 49.1 53.9 37.4 Na Ghana 34.1 44.0 47.8 21.0 0.4 Kenya 25.4 19.7 20.7 11.1 0.5 Mozambique 24.1 30.7 34.5 Na 0.4 Tanzania 28.2 22.3 24.2 8.9 0.4 Zambia 30.8 34.8 35.0 12.3 0.3 Zimbabwe 33.4 33.8 35.9 25.1 0.8
World Development Report 2009 Ethiopia remains less urbanized than a number of other African countries while at the same time indicators of infrastructural development which are related to service efficiency, that is road and rail density, are also lagging well behind those of the comparator countries, a fact that is likely to result in relatively high transport costs within value chains. While Ethiopia as a whole is less urbanized than others, as shown in the table below Addis Ababa is the most densely populated amongst the capital cities of this group of African countries, although it apparently also has a relative urban welfare level higher than the other comparators except for Nairobi. Thus, despite the categorization as ‘incipient urbanizer’ and problems such as unemployment (see below) Addis Ababa is shown here as relatively well developed as the primate city in Ethiopia. Table 7: African Cities, Comparative Data
City Pop/km² (latest Census)
Area km² Welfare measure/country average (1995-2006) %
Addis 4,574 530 197 Accra 1,121 2,593 182 Nairobi province 3,133 684 244 Banjul 4,060 88 183 Maputo 1,631 602 192 Dar es Salaam 1,793 1,393 188 Lusaka 64 21,898 170
World Development Report 2009 4. Transport/Trade Costs and Cities General Experience: One of the major cost components in service value chains (see Table 6) is transport, or more broadly, transport logistics, consisting of transport costs, warehousing, freight forwarding and border-related costs.

Towards a Globally Competitive Ethiopian Economy: The Role of Services and Urbanization. Case Studies – Rose and Polo Shirt Value Chains
Global Development Solutions, LLC 2/18/2011 15
Trade volumes outside a central area are highly sensitive to transport costs. One finding by the World Bank suggests that a 10% increase in trade costs reduces the volume of trade by 20%. In the case of intermediate goods, the effect is even greater. Trade volume in itself also affects costs because large trade flows tend to reduce trade costs through economies of scale. Transport costs are a determinant of the extent of urban agglomeration. High transport costs tend to confine economic activity at a relatively low level within a small geographical center or area. As costs fall, longer distance supply becomes feasible and activity spreads geographically, dependent on the location of key supplies and markets. However at lower levels of transport cost, location of certain types of business may return to the Center, now attracted by the advantages of concentration rather than the location of suppliers and markets. In other words low transport costs tend to encourage agglomeration. As the economy grows more new businesses can optimally locate close to existing production. Transport costs thus become a key to urbanization, manufacturing and services. As more facilities and services are provided centrally in larger cities, smaller communities become less attractive. A fall in transport costs thus indirectly allows more efficient sharing of facilities and services in the center. Improving transport infrastructure thus leads to more concentration of economic activity. To attract a business away from the advantages of being close to a major center it has to have access to outside centers or hubs that are within a reasonable distance of the major center. These firms may follow the available transport corridors. The significance of transport costs for location is also influenced by the value-to-weight ratio of goods being transported. Thus where transport costs per km-ton are relatively high there may still be scope for trade in high-value goods since they face low transport costs as a percent of value. This turns out to be the case for the high-value good (roses) and the medium value good (polo shirts) in Ethiopia, discussed below. With low percentage transport and handling costs high value goods may be located close to supply sources, or concentrated within urban centers even where transport costs per km-ton are high. Transport costs are also sensitive to the structure (eg degree of monopoly) of the transport industry. Costs tend to be inflated by monopolistic transport providers resulting from the naturally large scale and high threshold investment costs of much transport infrastructure. There has been a tendency for monopoly power to increase through concentration of ownership of infrastructure. For example according to the World Bank, in 1980s the top 20% of the world’s carriers controlled 26% of the global port slot capacity while by 1992 this had increased to 42% and by 2003, to 58%. Regulating market structure thus becomes important for developing countries who wish to increase or rationalize the percent of domestic value added in both exports and imports, especially where facilities are foreign owned or controlled. Similarly, improving trade facilitation and regional coordination are also needed. In the case of a landlocked country (such as Ethiopia) there
Towards a Globally Competitive Ethiopian Economy: The Role of Services and Urbanization. Case Studies – Rose and Polo Shirt Value Chains
Global Development Solutions, LLC 2/18/2011 16
may be an additional problem because transport to the only available port is outside its control. Although Ethiopia’s transport industry is competitive, one of the problems noted by the World Bank is that it is of low capacity and therefore competition is likely to be limited, resulting in increased costs, and potential collusive practices. Transport and Trade Costs in Ethiopia: The Port of Djibouti in the North handles 98% of Ethiopia’s export and import needs, of which over 97% is transported by road. The registered vehicle fleet in Ethiopia is small, less than four vehicles per 1,000 people compared to Kenya (18 vehicles/1,000 people) and Zimbabwe (45 vehicles/1,000 people).4 Walking and head loading remain the main transport modes in rural areas. The combined fleet of the public and private sectors has been inadequate for the size of the population while the fleet is also aging. Ethiopia’s transport infrastructure consists of: a) an all-weather road network of 44,000 km in 2008 (compared to 25,000 km in 1997) plus community roads of about 70,000 km; b) a railway line (781 km) from Addis Ababa to Djibouti (of which 709 km lies within Ethiopia); and, c) air transport facilities including four international airports, five major domestic airports, and more than 30 other domestic runways and airstrips. The proportion of the road network classified as in good condition has risen to 66% from 23% in 1977, with road density per 1,000 inhabitants increasing slowly. The average distance to all weather roads (km) has fallen steadily over time to 11 km in 2008, but a large majority of the population still live more than 2 km from an all-weather road. Despite considerable efforts to expand the road network over the past few decades, the country still has one of the lowest road densities in Africa (see Table 7). Addis Ababa is not excessively large compared with other African capitals but it has nonetheless started to face congestion, low infrastructure utilization, and relatively weak traffic management. The Government is planning to introduce an urban mass-transit system involving electric trams and buses. It is also introducing concession arrangements for management of the Ethiopia-Djibouti railway which is being rehabilitated. The government is also proposing the construction of new railways and upgrading of some domestic airports to international airport standard. Outside Addis Ababa there have been reductions in time spent on travel and transport. The most significant impact reported as a result of World Bank assistance has been the reduction in travel time and costs of travel on a number of roads. On one road (Daleti to Oda Bildigilu) the freight rate fell following upgrading in 2004 from about ETB 83 per quintal to ETB 20 per quintal - less than a quarter of the previous rate, while the new road provided significant opportunities for the diversification of agriculture, and a significant increase in percent of marketed crops (30% to 50%). However, key constraints remain in the quality and quantity especially of feeder roads, and to some extent the main road network (weak capacity for road maintenance is contributing to an increase in inland transport costs). 4 The age of registered vehicle fleets varies across countries – relatively new in Ethiopia and relatively old in Zimbabwe.

Towards a Globally Competitive Ethiopian Economy: The Role of Services and Urbanization. Case Studies – Rose and Polo Shirt Value Chains
Global Development Solutions, LLC 2/18/2011 17
Aside from actual transportation services, the broader area of transport and trade is an important constraint in Ethiopia. The overall cost of trading across borders is the number one problem facing businesses. Ethiopia ranks only 157th out of 185 countries according to the World Bank’s ‘Doing Business’ index for 2011 in terms of ease of cross border trade. Although the VCAs have not shown high transport costs in relation to total value according to the Doing Business report, the average time required in Ethiopia for exporting is 44 days at $1,890 per container, and for importing, 45 days at $2,993 per container, with relatively heavy documentation requirements. This provides a potential for arbitrary controls which fuel delay and increase costs. With the only port of Djibouti being outside Ethiopia, there are likely to be additional potential costs associated with port handling and customs that cannot be easily controlled by Ethiopian authorities. Despite the long distances and less than adequate road conditions, high value goods such as cut flowers may face relatively low transport costs as a proportion of value. The high value of roses allows the use of air freight which avoids the potential difficulties of surface transport. Polo shirts (Section 7) also face relatively low transport costs as percent of border value. The total transport and handling cost of import of inputs and export of outputs comprise only about 4% of combined import and export value of polo shirts. The relatively low importance of transport and handling costs for these two products has two conflicting implications for the growth of cities such as Addis Ababa. On the one hand it favors geographical concentration of production, gaining economies in infrastructure and service provision; on the other hand, it makes it less important to concentrate close to urban services. The key cost consideration is more likely to be nearness to urban distribution points and markets (in the case of polo shirts). For roses the optimal location of production is clearly outside urban areas but with proximity to air transport and refrigeration services, which are likely to be urban-based. The above considerations suggest that for these types of products Ethiopia’s main doing-business problem of cross-border trade is not a cash cost issue – i.e. the actual cost of transport and handling. Instead it is the implicit cost of delay, especially for perishables like roses (e.g. if refrigeration services fail). In the case of non-perishables such as polo fabrics, the cost of delay shows up not in transport but in finance of excessive inventories and is one reason why the cost of finance is relatively high. Securing of finance is also a lengthy process. Time required for order-to-delivery (excluding time for securing finance) are about double those of China and may thereby exclude some Ethiopian products from world markets altogether (see Section 7). The cost of delays may thus be not the result of poor services as much as the result of regulatory constraints such as border documentation. Regarding transport costs themselves, while the proportion of all-weather road has significantly increased, reductions in cost have been achieved and serious attempts made at institution building, but several key issues remain.

Towards a Globally Competitive Ethiopian Economy: The Role of Services and Urbanization. Case Studies – Rose and Polo Shirt Value Chains
Global Development Solutions, LLC 2/18/2011 18
• Urban congestion in Addis Ababa is significant while other towns are small and currently unable to reap agglomeration economies. Thus, transport costs overall may be higher than necessary.
• The national transport fleet appears to be underdeveloped in relation to the scale of trade flow.
• Transport costs within Ethiopia are likely to be relatively high because of the distance of most of the population from road access, and the remaining poor road conditions, partly due to overloading of trucks, leading to breakdowns, especially with the long distances traveled to and from the available port, and excessive damage to roads from overweight loads.
5. Addis Ababa as an “Anchor” of Urban Economies – Its Growth and Activities in Nearby Towns
Addis Ababa and Smaller Town Growth: Ethiopia had an almost entirely rural economy up until relatively recently. Only since the 1960s have new urban centers started to emerge outside Addis Ababa and some older towns such as Asmara (now part of Eritrea), Gonder, Dire Dawa, Debre Zeyt, and Debre Markos. The newer towns included Akaki, Arba Minch, Awasa, Bahir Dar, Jijiga, and Shashemene, whose populations more than tripled between 1965 and 1975 due to rural-urban migration. Bahar Dar was a planned city with several industrial units located therein, and Akaki and Aseb became industrial towns. Jijiga and Shashemene developed communications and services as a part of its development strategy. More modest growth was recorded in the older towns. Overall, the rate of urban growth declined between 1975 and 1987. This was partly due to 1975 land reforms which provided incentives and opportunities for the rural population to stay put combined with restrictions on travel, lack of employment, housing shortages, and social unrest in some towns. Rural-urban migration was also restricted by an official registration system. Significant urban migration restarted during 1988-91 especially to Addis Ababa, as a result of war, causing incipient congestion problems and unemployment. Addis Ababa has a current population (in 2010) of over 3.0 million which, while relatively large compared to other African cities, is still less than 5% of the total population of the country. Its growth rate has been moderate in comparison to smaller towns as is reflected in its declining share of the total population in urban areas from 41% to 35% over 1994 to 2007. The total urban population outside Addis Ababa grew at about 3.9 % per annum from 1994 to 2007 while the population of Addis Ababa grew at 2.0% in that period. Table 8: Overall Growth of Towns
1984* 1994 2007 130 towns above 10,000 population 3,117,130 5,173,117 7,775,623 Urban population excluding Addis Ababa 1,704,555 3,060,380 5,036,072 Addis Ababa % share of total 45.3% 40.8% 35.2%
Compiled by Global Development Solutions, LLC *excludes some towns shown in 1994 and 2007.

Towards a Globally Competitive Ethiopian Economy: The Role of Services and Urbanization. Case Studies – Rose and Polo Shirt Value Chains
Global Development Solutions, LLC 2/18/2011 19
Thus while the total absolute population size of Addis Ababa rose by about 620,000 between 1994 and 2007, the urban population outside Addis Ababa rose by about 1,300,000. Excluding the smallest towns, 50 towns with population above 30,000 in 2007 achieved a growth rate of about 3.1% per annum over a period between 1994 and 2007. Addis Ababa’s share in the total population of these 50 towns correspondingly also fell steadily from 50% in 1994 to 43% in 2007. Table 9: Growth of Selected Larger Towns
1984 1994 2007 1994-2007
Growth rate 50 towns above 30,000 population 2,661,783 4,220,868 6,308,213 3.2% Addis Ababa population 1,412,575 2,112,737 2,739,551 2.0% Addis Ababa % total 53.1% 50.1% 43.4%
Compiled by Global Development Solutions, LLC The group of towns outside Addis Ababa with population above 100,000 in 2007 grew at 4.1 % per annum over 1994-2007, faster than both the total urban population (towns above 10,000), and the population of towns with more than 30,000. The fastest growing towns were Jijiga, an Eastern regional capital with a population of approximately 125,000 (in 2007) which grew at over 6% per annum between 1994 and 2007. Mekele, a regional capital in the North about 400 miles from Addis Ababa grew at about 6.4% making it the fastest growing Ethiopian city with a population above 100,000 (215,000 in 2007). Mekele has an airport that meets international standards, and a number of heavy industrial plants that originated in the public sector. Shashemene with a population of 100,000 has been another fast growing town at 5% per annum over 1994-2007. It is located 150 miles South of Addis Ababa, close to the town of Awasa with a population of about 160,000 in 2007. Nazret about 70 miles South East of Addis Ababa with a population of 220,000 grew at about 4.2% per annum between 1994 and 2007. There is no obvious correlation between Addis Ababa and surrounding towns in these figures, nor a pattern from the point of view of location-based advantage and international competitiveness. The four fastest growing towns with a population of over 100,000 are relatively far geographically from Addis Ababa,. These towns are to the North near the Eritrean border, to the South on the road to Kenya, and to the West close to the Somali border. To benefit from international trade, they would have to be located either close to Addis Ababa or on the main route between Addis Ababa and Djibouti in the North East. Rather they are mostly administrative capitals. On the other hand none of the towns that do have trade location-based advantages have shown impressive size or growth up to 2007. Debre Zeyt, the largest town in proximity to Addis Ababa (30 miles away with a population of about 100,000 in 2007) grew little faster than Addis Ababa itself at a rate of 2.4% from 1994 to 2007. The towns of Dese with a population of 130,000 and Kembolcha (60,000), both with good location-based advantages on the transit route to Djibouti, have also shown modest size and/or growth. Few towns appear to be flourishing on the North Easterly route to Djibouti despite the fact that it is now the
Towards a Globally Competitive Ethiopian Economy: The Role of Services and Urbanization. Case Studies – Rose and Polo Shirt Value Chains
Global Development Solutions, LLC 2/18/2011 20
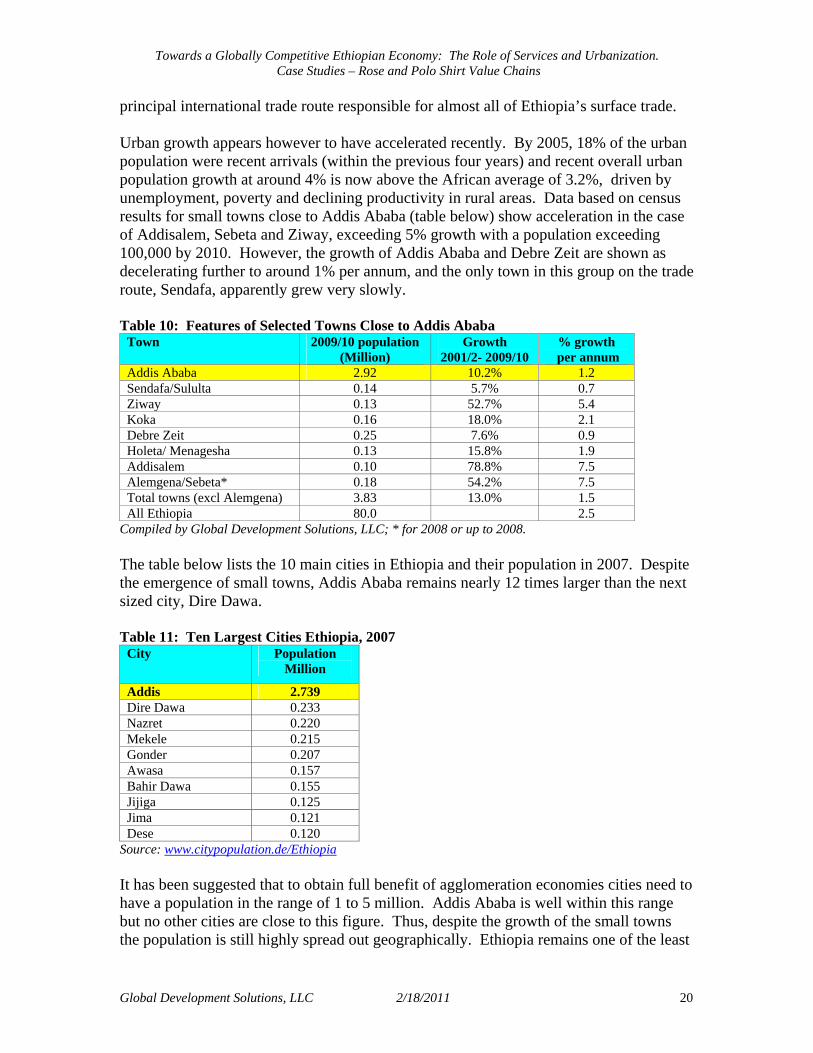
principal international trade route responsible for almost all of Ethiopia’s surface trade. Urban growth appears however to have accelerated recently. By 2005, 18% of the urban population were recent arrivals (within the previous four years) and recent overall urban population growth at around 4% is now above the African average of 3.2%, driven by unemployment, poverty and declining productivity in rural areas. Data based on census results for small towns close to Addis Ababa (table below) show acceleration in the case of Addisalem, Sebeta and Ziway, exceeding 5% growth with a population exceeding 100,000 by 2010. However, the growth of Addis Ababa and Debre Zeit are shown as decelerating further to around 1% per annum, and the only town in this group on the trade route, Sendafa, apparently grew very slowly. Table 10: Features of Selected Towns Close to Addis Ababa
Town 2009/10 population (Million)
Growth 2001/2- 2009/10
% growth per annum
Addis Ababa 2.92 10.2% 1.2 Sendafa/Sululta 0.14 5.7% 0.7 Ziway 0.13 52.7% 5.4 Koka 0.16 18.0% 2.1 Debre Zeit 0.25 7.6% 0.9 Holeta/ Menagesha 0.13 15.8% 1.9 Addisalem 0.10 78.8% 7.5 Alemgena/Sebeta* 0.18 54.2% 7.5 Total towns (excl Alemgena) 3.83 13.0% 1.5 All Ethiopia 80.0 2.5
Compiled by Global Development Solutions, LLC; * for 2008 or up to 2008. The table below lists the 10 main cities in Ethiopia and their population in 2007. Despite the emergence of small towns, Addis Ababa remains nearly 12 times larger than the next sized city, Dire Dawa. Table 11: Ten Largest Cities Ethiopia, 2007
City Population Million
Addis 2.739 Dire Dawa 0.233 Nazret 0.220 Mekele 0.215 Gonder 0.207 Awasa 0.157 Bahir Dawa 0.155 Jijiga 0.125 Jima 0.121 Dese 0.120
Source: www.citypopulation.de/Ethiopia It has been suggested that to obtain full benefit of agglomeration economies cities need to have a population in the range of 1 to 5 million. Addis Ababa is well within this range but no other cities are close to this figure. Thus, despite the growth of the small towns the population is still highly spread out geographically. Ethiopia remains one of the least
Towards a Globally Competitive Ethiopian Economy: The Role of Services and Urbanization. Case Studies – Rose and Polo Shirt Value Chains
Global Development Solutions, LLC 2/18/2011 21
urbanized economies in Africa. The World Bank ‘Agglomeration Index’ score for Ethiopia (see Table 6) is well below that of other African countries and low even in relation to the country’s low income per capita. Its urban population share is only 18% and its road and rail density is also very low (Table 6). It is described in the World Development Report 2009 as an ‘incipient urbanizer.’ One of the reasons for the underdevelopment of the Ethiopian minor towns is probably associated with the presence up to 1991 of Asmara, the main city of what is now Eritrea, with a current population of about 600,000, which along with the port of Massawa, constituted a key component of Ethiopia’s trade infrastructure for about fifty years. The urban profile of Ethiopia may yet have to fully adjust for the trade disruption resulting from the secession of Eritrea. Overall, there has in the past generally been only weak inducement to migrate to all towns including Addis Ababa. The small towns are as yet nowhere near the level of activity of Addis Ababa. The need for more vigorous small town development was taken up in the Plan for Accelerated Sustained Development to End Poverty (PASDEP) 2005/6–2009/10 which aimed to develop some of the smaller urban centers. Economic Activity in Addis Ababa and Smaller Towns: According to the sparse data available, while up to about 2004 urban economic activity overall grew slowly, more recently data show that urban-based activity has accelerated. Even during the slow growth period up to 2004, banking and insurance, transport and communication, and construction grew at over 7% per annum. Manufacturing growth lagged behind at or below 3%. Further analysis by the World Bank shows that over 1999 to 2005, growth in value added in industry of almost 3% per annum was eroded by productivity falling by 0.6% per annum, whereas in transport and communications a significant increase in productivity has occurred, with output increasing despite little growth in employment. These trends are consistent with the gradual emergence of Addis Ababa as a services center while manufacturing remained relatively stagnant. However, even with the acceleration in activity, especially in services, urban job growth seems to have slowed overall, and the urban unemployment rate rose. New income earning opportunities are typically in the informal microenterprise sector, and generally represent very low paying jobs. According to the World Bank the urban labor market is segmented into three categories, namely, a privileged high wage public sector; a small private formal sector; and a large informal economy, which is more ‘survivalist’ than entrepreneurial. Thus main sources of formal urban employment have been in Government and parastatal enterprises. The unemployment rate in Addis was around 24% in 2005, well above the national average of 13.5 % and that of the next largest city Dire Dawa at 18%. More recent unemployment data for 2006 put the Addis unemployment rate at 29%. Ethiopia’s low overall urbanization ratio suggests that economies of agglomeration have yet to be realized across the country, but at the same time Addis Ababa is, in absolute terms, a medium-sized city by African standards (and one of the largest for a landlocked
Towards a Globally Competitive Ethiopian Economy: The Role of Services and Urbanization. Case Studies – Rose and Polo Shirt Value Chains
Global Development Solutions, LLC 2/18/2011 22
economy) and diseconomies of concentration are emerging (such as congestion). A key issue therefore is whether scale economies can still be pursued in Addis Ababa or whether decentralization is a better strategy. More data is needed to arrive at a clear picture of the nature of the urban economy and the extent of private sector capacity and growth, but to the extent that the public sector continues to account for the bulk of urban formal employment and much of the private expansion is in the microenterprise, informal sector, which is the least susceptible to scale economies, this would usually suggest rather limited urban agglomeration externalities, despite the growth of services. One indicator of the rate of growth of economic activity in Addis Ababa and the townships near to Addis Ababa is the growth of commercial and industrial power consumption. The increase in power customers can be used as a proxy for business start-ups (although some new customers will be shifting from self-generation to the grid). The table below gives the number of business power customers 2005/06 to 2008/09 nationally and in Addis Ababa and surrounding small towns. There was a roughly parallel growth in the number of customers over 2005/6 to 2008/9 between Addis Ababa and its nearby towns but somewhat lower than for the country as a whole. For the commercial area (of which services would comprise a significant proportion) the total number of customers grew nationally by 11.6% per annum between 2005/6 and 2008/9. Similarly, Addis Ababa grew by 8.2% per annum, and Addis Ababa plus nearby towns also grew 8.2%. For low-voltage industrial customers (SMEs) Ethiopia showed 16.4% growth, Addis Ababa 14% and Addis Ababa plus nearby towns 14.4%. For high voltage industrial customers, Ethiopia showed 8.5% annual growth, Addis Ababa 27.5%, and Addis Ababa plus nearby towns 13% per annum. Thus the Addis Ababa region generally showed a smaller increase in the number of customers than Ethiopia as a whole for commercial and low voltage establishments, partly because of the rural electrification drive. Only in the case of high voltage customers did the Addis Ababa area growth exceed the rest of the country. The drive for rural electrification may cause consumption to migrate to more distant areas from Addis Ababa and its nearby towns, which is consistent with the finding on the fastest growth of population which has been in towns more remote from Addis Ababa, and off the main transit routes, such as Jijiga, Mekele and Awasa.
Towards a Globally Competitive Ethiopian Economy: The Role of Services and Urbanization. Case Studies – Rose and Polo Shirt Value Chains
Global Development Solutions, LLC 2/18/2011 23
Table 12: Number of Power Customers in Ethiopia
Low voltage
Ethiopia 123,458 11,789 134 133,196 12,396 156 173,703 19,132 202 171,090 18,575 171Addis Ababa and nearby towns 51,899 3,440 63 55,697 3,657 62 68,354 5,206 82 65,800 5,145 91Addis Ababa 44,170 2,290 13 47,291 2,508 16 57,774 3,308 20 56,047 3,390 27Sabata 416 96 - 467 106 - 728 122 - 680 135 - Dukem/Debre Zeit 1,295 179 25 1,646 174 25 1,799 314 32 1,778 349 32Nazereth 3,518 402 12 3,516 371 11 4,220 594 17 3,834 525 21Modjo/Koka 665 84 9 788 75 6 1,164 146 9 1,137 146 6Ziway 720 126 2 745 132 2 1,017 242 2 831 137 1Sendafa 180 80 - 253 94 - 407 135 - 414 123 - Chanco/Suluta 164 32 - 190 44 - 266 70 - 313 77 - Holeta 613 121 2 632 123 2 751 226 2 550 217 4Addis Alem/Menagesha 158 30 - 169 30 - 228 49 - 216 46 -
Large industrialCommercial Commercial Commercial CommercialLow
voltageHigh
voltageLow
voltageHigh
voltageHigh
voltageLow
voltageHigh
voltage
Large industrial Large industrial Large industrialCity/town
2005/06 2006/07 2007/08 2008/09
EEPCO In contrast to the number of customers, in terms of the actual amount of power consumed the EEPCO data show Addis Ababa and its nearby towns exceeding the growth of the country as a whole (see Annex 1). Between 2005/6 and 2008/9 power consumption in Addis Ababa and nearby towns grew at a considerably higher rate than the country as a whole, for all users. Table 13: Power Consumption Growth per Annum 2005/6 – 2008/9
Commercial. Growth
Low Voltage Industrial Growth
High Voltage Industrial Growth
Ethiopia 3.3% 3.8% 5.1% Addis Ababa and Nearby Towns 5.0% 5.2% 11.8% Addis Ababa 6.0% 6.5% 20.7%
EEPCO 2008/9 saw a decline in consumption from 2007/8 in all towns because of supply shortages and rationing (New dams expected to generate power did not come on stream due to delays in construction). Some manufacturing plants were closed for a number of months or were told to operate during specific hours in a day on certain days in a week. So the four year trend understates the rate of

Towards a Globally Competitive Ethiopian Economy: The Role of Services and Urbanization. Case Studies – Rose and Polo Shirt Value Chains
Global Development Solutions, LLC 2/18/2011 24
growth overall. Two of the small towns near Addis Ababa (Debre Zeyt and Sabata) have rapidly increased their high voltage consumption, the main users of which are industries such as cement, glass, sugar and metal products. Otherwise the available data show the nearby small towns as decreasing their share while Addis Ababa’s overall share is increasing, as shown in the table below. Table 14: Share of Addis Ababa in Power Consumption
Year 2005/06 2008/09 City/town Industrial Industrial
Commer- cial
Low
voltage High
Voltage
Commer- cial
Low
voltage High
Voltage Addis Ababa and near towns as % of nation 60% 55% 38% 63% 54% 42% Addis Ababa as % of nation 53% 40% 8% 56% 42% 7% Near towns excluding Addis Ababa as % of nation 7% 15% 30% 7% 11% 35%
EEPCO This result is not consistent with a significant decentralization of economic activity from Addis Ababa to its surrounding towns, but seems to support the conclusion based on population growth that economic activity is if anything migrating to more distant cities, and not necessarily on the optimal trade transit routes. To back up findings based on power usage and population some data were also collected from the Statistical Agency on enterprise and employment growth which were available for non-commercial enterprises provides some data for Addis Ababa and nearby towns (see table below). Table 15: Number of Enterprises and Employment in Addis Ababa and its Proximity
Note 1) Data for Addis Alem, Holeta/Menagesha and Koka are subsumed in the nearest township, but not identified. 2) the employment in the table does not include commercial entities and self employed. Source: Central Statistics Agency (CSA), compiled by Global Development Solutions, LLC., 2010. According to the table both formal employment and number of establishments have recently been growing at a remarkably rapid pace. In Addis Ababa there was a recorded

Towards a Globally Competitive Ethiopian Economy: The Role of Services and Urbanization. Case Studies – Rose and Polo Shirt Value Chains
Global Development Solutions, LLC 2/18/2011 25
53% rise (23% per annum) in the number of establishments, and 82% increase (35% per annum) in employment over 2005/6 to 2007/8, far exceeding the growth of power usage or population. Data on growth in the seven nearby towns is patchy but seems to have been lower than Addis Ababa, which is contrary to the indications based on population growth. Sebeta shows the highest level of activity but a relatively low rate of growth. Sendafa has just recently established three medium scale green field production facilities. Ziway shows a rapid rate of increase but again from a very low starting point. Taking together the available data on urban population, employment and output, it seems likely that there has been an acceleration in urban output growth and that Addis Ababa is maintaining its position as the manufacturing and services hub even if its population is increasing relatively slowly. The evidence we have available is, however, insufficient to suggest that other nearby towns have ‘taken off’ as satellites of Addis Ababa, but instead activity seems to have migrated more to distant cities like Makele, Jijiga, Shashemene and Awasa. This is the basis on which the Government has adopted a Plan for Accelerated Sustained Development to End Poverty (PASDEP) 2005/6–2009/10, in order to develop smaller urban centers through a range of measures including:
• Support for municipal authorities; • Infrastructure urban investment; • Improvements to the licensing and regulatory system to allow easier access to
land • Increased availability of land for urban development.
Despite some growth in smaller towns, there seems to be an absence of a critical mass in these towns to warrant support for an internationally oriented service industry. Transport costs remain elevated partly because there is little economic activity and no towns of significant size near the border with Djibouti which could, for example, act as export free zones, or special economic zones that can minimize transport costs on import and export. There is thus a need to support both the existing expansion of services within Addis Ababa, and to encourage the expansion of other urban centers. For low income ‘incipient urbanizers’ like Ethiopia, the World Bank (World Development Report 2009) recommends a policy towards urbanization of spatial neutrality - improving the operation of land markets and the provision of basic public services - rather than one that favors specific locations to allow market forces based on agglomeration effects to determine which urban centers would grow most rapidly. 6. Addis Ababa in Comparison with other Cities The following section provides a comparison of key indicators associated with urbanization among several cities including Addis Ababa. Based on investment climate survey data, some preliminary comparisons of business conditions are provided in the table below. Amongst the differences in the business environment between cities both in Africa and elsewhere (table below) are the following:
Towards a Globally Competitive Ethiopian Economy: The Role of Services and Urbanization. Case Studies – Rose and Polo Shirt Value Chains
Global Development Solutions, LLC 2/18/2011 26
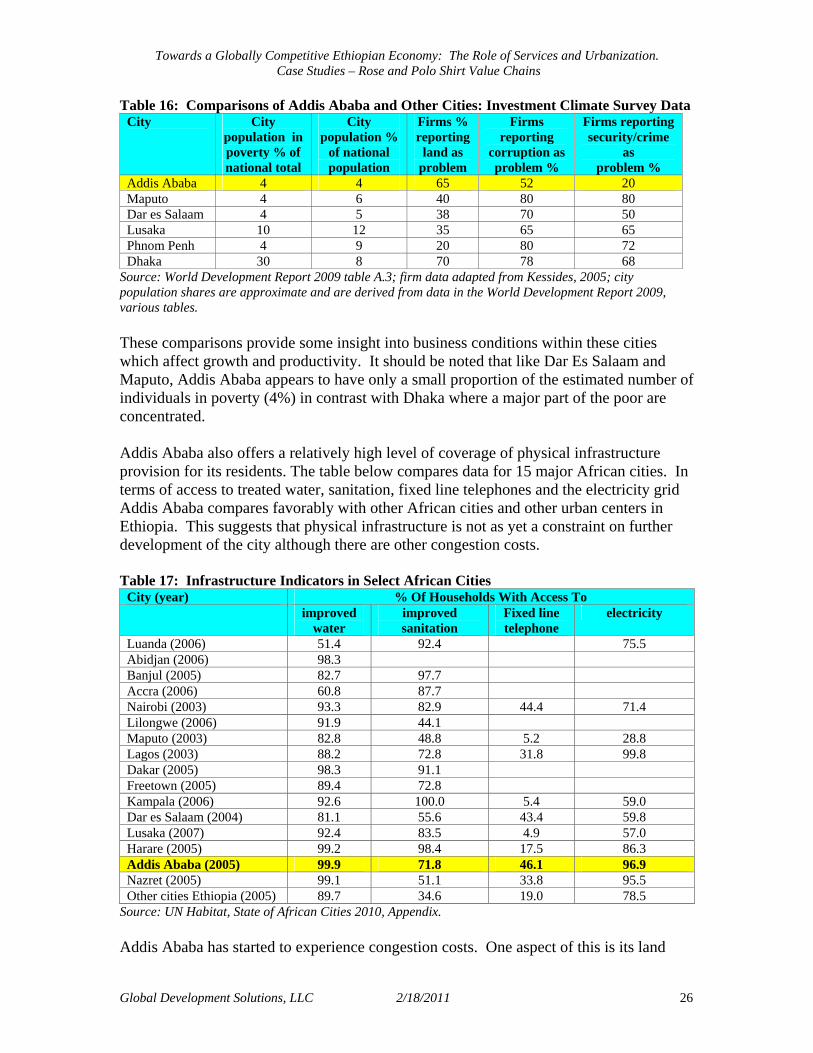
Table 16: Comparisons of Addis Ababa and Other Cities: Investment Climate Survey Data City City
population in poverty % of national total
City population %
of national population
Firms % reporting
land as problem
Firms reporting
corruption as problem %
Firms reporting security/crime
as problem %
Addis Ababa 4 4 65 52 20 Maputo 4 6 40 80 80 Dar es Salaam 4 5 38 70 50 Lusaka 10 12 35 65 65 Phnom Penh 4 9 20 80 72 Dhaka 30 8 70 78 68
Source: World Development Report 2009 table A.3; firm data adapted from Kessides, 2005; city population shares are approximate and are derived from data in the World Development Report 2009, various tables. These comparisons provide some insight into business conditions within these cities which affect growth and productivity. It should be noted that like Dar Es Salaam and Maputo, Addis Ababa appears to have only a small proportion of the estimated number of individuals in poverty (4%) in contrast with Dhaka where a major part of the poor are concentrated. Addis Ababa also offers a relatively high level of coverage of physical infrastructure provision for its residents. The table below compares data for 15 major African cities. In terms of access to treated water, sanitation, fixed line telephones and the electricity grid Addis Ababa compares favorably with other African cities and other urban centers in Ethiopia. This suggests that physical infrastructure is not as yet a constraint on further development of the city although there are other congestion costs. Table 17: Infrastructure Indicators in Select African Cities
City (year) % Of Households With Access To improved
water improved sanitation
Fixed line telephone
electricity
Luanda (2006) 51.4 92.4 75.5 Abidjan (2006) 98.3 Banjul (2005) 82.7 97.7 Accra (2006) 60.8 87.7 Nairobi (2003) 93.3 82.9 44.4 71.4 Lilongwe (2006) 91.9 44.1 Maputo (2003) 82.8 48.8 5.2 28.8 Lagos (2003) 88.2 72.8 31.8 99.8 Dakar (2005) 98.3 91.1 Freetown (2005) 89.4 72.8 Kampala (2006) 92.6 100.0 5.4 59.0 Dar es Salaam (2004) 81.1 55.6 43.4 59.8 Lusaka (2007) 92.4 83.5 4.9 57.0 Harare (2005) 99.2 98.4 17.5 86.3 Addis Ababa (2005) 99.9 71.8 46.1 96.9 Nazret (2005) 99.1 51.1 33.8 95.5 Other cities Ethiopia (2005) 89.7 34.6 19.0 78.5
Source: UN Habitat, State of African Cities 2010, Appendix. Addis Ababa has started to experience congestion costs. One aspect of this is its land

Towards a Globally Competitive Ethiopian Economy: The Role of Services and Urbanization. Case Studies – Rose and Polo Shirt Value Chains
Global Development Solutions, LLC 2/18/2011 27
market which is reported as working much less effectively than in comparable cities, and only in Dhaka does a higher proportion of firms report accessing land as a problem (see table below). Two-thirds of firms in Addis see land as a constraint on their development compared with 35%-40% in Maputo, Dar es Salaam and Lusaka. Much of the problem in Addis appears to have been the extreme delay in land acquisition (around one and half years from agreement to sell). However, in contrast with other cities Addis has the reported advantage of being a relatively safe urban environment with corruption appearing to be relatively less significant than in other cities. The table below gives the investment climate comparative survey data on key business constraints in the selected cities. These are: average days of delay in land acquisition and the average share of security costs and of losses due to theft in total sales. Table 18: Delays in Land Acquisition, Costs of Security and Theft by City Delay in land
acquisition (days) Cost of security (%
of sales) Losses due to theft (% of
sales) Addis Ababa 538 0.9 0.4 Maputo 38 Na Na Dar es Salaam Na 3.1 Na Lusaka 233 4.1 5.9 Phnom Penh Na 20.2 2.9 Dhaka Na Na 0.6
Source: Adapted from Kessides, 2005. Reform of the urban land market in Addis Ababa remains an issue. The 2006 Investment Climate survey ranked access to land as a lesser concern overall (5th out of the 10 main constraints faced by firms) but for service firms it remained the second biggest constraint. For medium size service firms (which would tend to include formal sector long distance transport firms) 73% report land as a major constraint. The Government has introduced a program for the reform of the urban land market with measures to improve procedures for land registration, reform the system of land leases and regularize compensation payments. Progress on these reforms is important in achieving the full benefits of urban agglomeration. Alternatively, more recent data on time required to process a lease for urban land shows more days required in Ethiopia than elsewhere in East Africa. However, Ethiopia is just below the average for sub-Saharan Africa as a whole for leasing public land, and a little above it for private land (see table below). Table 19: Days Required to Process Lease for Urban Industrial land: Selected Countries
Country Private land Public land Ethiopia 75 145 Kenya 65 110 Tanzania 65 80 Uganda 55 75 Republic of South Africa 45 300 Average Sub-Saharan Africa 60 150
Source: Adapted from UN Habitat, The State of African Cities 2010 The World Bank ‘Doing Business’ reports also provide information on a number of constraints that relate the efficiency of the urban sector because they are either under the
Towards a Globally Competitive Ethiopian Economy: The Role of Services and Urbanization. Case Studies – Rose and Polo Shirt Value Chains
Global Development Solutions, LLC 2/18/2011 28
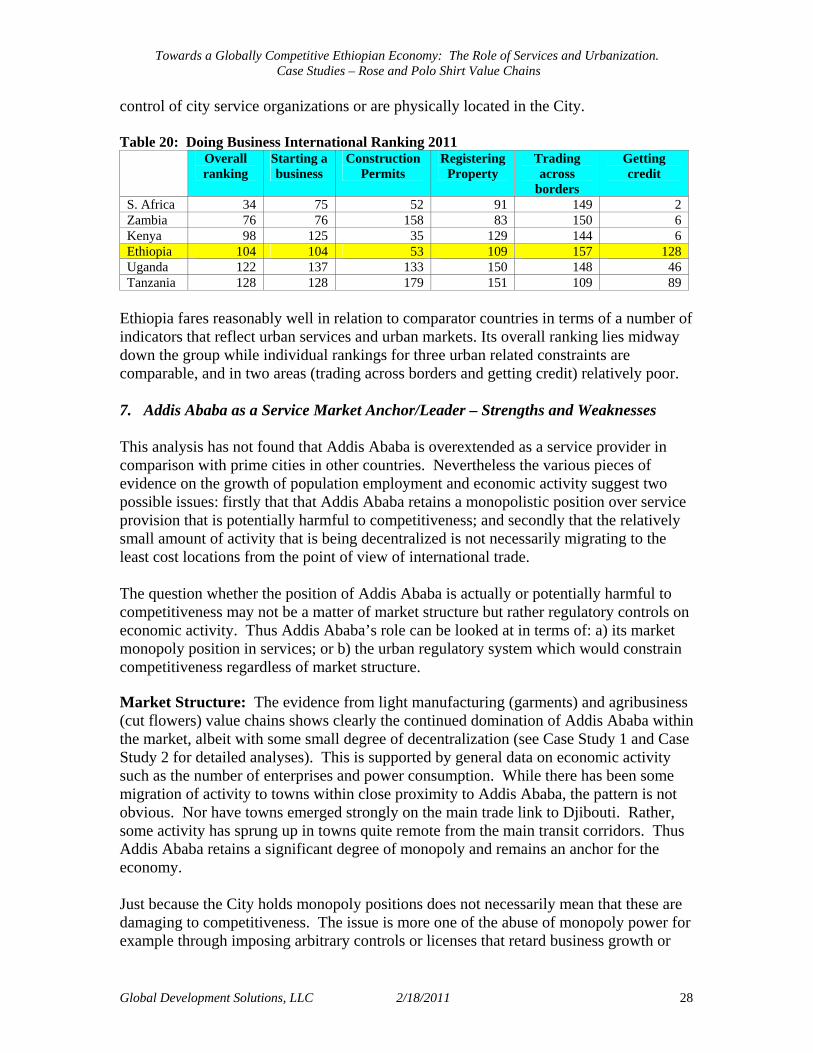
control of city service organizations or are physically located in the City. Table 20: Doing Business International Ranking 2011
Overall ranking
Starting a business
Construction Permits
Registering Property
Trading across
borders
Getting credit
S. Africa 34 75 52 91 149 2 Zambia 76 76 158 83 150 6 Kenya 98 125 35 129 144 6 Ethiopia 104 104 53 109 157 128 Uganda 122 137 133 150 148 46 Tanzania 128 128 179 151 109 89
Ethiopia fares reasonably well in relation to comparator countries in terms of a number of indicators that reflect urban services and urban markets. Its overall ranking lies midway down the group while individual rankings for three urban related constraints are comparable, and in two areas (trading across borders and getting credit) relatively poor. 7. Addis Ababa as a Service Market Anchor/Leader – Strengths and Weaknesses This analysis has not found that Addis Ababa is overextended as a service provider in comparison with prime cities in other countries. Nevertheless the various pieces of evidence on the growth of population employment and economic activity suggest two possible issues: firstly that that Addis Ababa retains a monopolistic position over service provision that is potentially harmful to competitiveness; and secondly that the relatively small amount of activity that is being decentralized is not necessarily migrating to the least cost locations from the point of view of international trade. The question whether the position of Addis Ababa is actually or potentially harmful to competitiveness may not be a matter of market structure but rather regulatory controls on economic activity. Thus Addis Ababa’s role can be looked at in terms of: a) its market monopoly position in services; or b) the urban regulatory system which would constrain competitiveness regardless of market structure. Market Structure: The evidence from light manufacturing (garments) and agribusiness (cut flowers) value chains shows clearly the continued domination of Addis Ababa within the market, albeit with some small degree of decentralization (see Case Study 1 and Case Study 2 for detailed analyses). This is supported by general data on economic activity such as the number of enterprises and power consumption. While there has been some migration of activity to towns within close proximity to Addis Ababa, the pattern is not obvious. Nor have towns emerged strongly on the main trade link to Djibouti. Rather, some activity has sprung up in towns quite remote from the main transit corridors. Thus Addis Ababa retains a significant degree of monopoly and remains an anchor for the economy. Just because the City holds monopoly positions does not necessarily mean that these are damaging to competitiveness. The issue is more one of the abuse of monopoly power for example through imposing arbitrary controls or licenses that retard business growth or
Towards a Globally Competitive Ethiopian Economy: The Role of Services and Urbanization. Case Studies – Rose and Polo Shirt Value Chains
Global Development Solutions, LLC 2/18/2011 29
failing to provide services to business on the grounds that business has nowhere else to go. Another issue would be the emergence of externalities such as diseconomies of agglomeration through congestion costs. The evidence that has been gathered suggests that neither of these problems applies extensively. Addis Ababa authorities have for example taken measures to make urban land more accessible and the City is not so large compared to other capitals that it should incur special high congestion costs. Market regulation: Over 2002 to 2004 Ethiopia implemented a series of reforms in its business regulatory system. These included improvements in business registration, the investment code, the tax regime, competition policy, customs administration, and urban land administration. In terms of the contribution of cities such as Addis Ababa to competitiveness the progress on business registration, customs administration and urban land administration is especially relevant. As an illustration, the time required for business registration was reduced from more than 40 days and $400 cost to 1 or 2 days and about $70 cost. The share of firms reporting a major or severe obstacle declined to less than 40% for most relevant variables, with the exception access to finance. While Ethiopia‘s manufacturing and services enterprises continue to operate at very low levels of productivity, there has been a dramatic improvement in the perception among managers. In the most recent survey of 2007 access to finance was the most important constraint (41% viewing it as serious) while access to land was regarded as serious by 31%, and cost of finance by 23%. Labor regulation was regarded as a problem only by 5%. While therefore there are still constraining regulatory activities that are controlled from Addis Ababa they have been gradually relaxed. However, two specific areas of regulation remain very important (see Case Study 1 – Value Chain Analysis for Polo shirts). These are: a) customs clearance; and b) access to foreign exchange. In the first case the problem is the execution of the regulations rather than the regulations themselves. In the second case the problem may be one of informal control rather than formal regulation. Access to foreign exchange is subject to intermittent informal quotas by the central bank which are reflected in long delays incurred by applicants. There is clearly scope for the decentralization of some of these regulatory activities including customs clearance that would reduce pressure on Addis while liberalization of regulations in a number of other areas would help to enhance business and generate agglomeration economies. Addis Ababa – the Balance of Advantages as Ethiopia’s Economic Anchor: Is Addis Ababa too large? Addis Ababa has a relatively low primacy ratio (share of main city in total urban population) because of the large land area of Ethiopia and the relatively large number of small to medium size cities. It has evolved as the hub of the transport network within the country with the most significant international airport and a rail link to the port of Djibouti. In recent years the number of business establishments in Addis has grown more rapidly than the surrounding areas. Unemployment is higher than the national urban average but this is to be expected for a primary city at low levels of development given migration trends from rural areas and its income per capita is nearly twice the

Towards a Globally Competitive Ethiopian Economy: The Role of Services and Urbanization. Case Studies – Rose and Polo Shirt Value Chains
Global Development Solutions, LLC 2/18/2011 30
national average. The value-chain case-studies for garments and roses illustrate the continued importance of Addis Ababa as a transport hub. Roses are all grown within a 200 mile radius of the city and are processed before being sent to the airport for export by air. Transport to Addis takes only a few hours and all of the freight service providers and an estimated approximately 80% of the trucking service providers are based in the city. Of the 39 garment factories in the country in 2009/10, 32 were located in the Addis Ababa area and only 4 are located more than 500kms from the city. All 39 have an office in the city for banking, and freight forwarding services, and for liaising directly with government authorities. As with roses the bulk of freight forwarding services and approximately 80% of transport services are provided by suppliers from the city. Ethiopia has a low level of urban development by African standards (16% urbanization rate in 2007 compared with the average of 35%) and Addis’ share in the total urban population at 21% is well below the sample average of 33% (see table below). The Addis population is also still below the threshold of 5 million population cited as the level at which diseconomies may emerge in the African context. Research also stresses that the primacy ratio will be low at low levels of development and will rise as development proceeds. Conceptually there will be an optimal primacy ratio beyond which the growth of the main city has negative effects. A simple regression analysis of the primacy ratio for sample of 25 African economies reveals a statistically significant negative relation between this ratio and population size, controlling for level of income and the degree of urbanization. The predicted level of the primacy ratio for Ethiopia from this analysis is 26%, five percentage points above the current level. Thus, despite the undoubted problems of traffic congestion, there is little evidence that Addis Ababa has grown substantially beyond the ratio that might be expected for Ethiopia’s size and income level. Table 21: Addis Ababa and other African Cities, 2005 Main city
population (million, 2005)
Primacy ratio
Urbanization rate
Country population (million)
Country land area (million
sq km) Addis Ababa 2.6 0.21 0.16 79 1.1 African average* 2.4 0.33 0.32 31 0.72
Source: UN Habitat, State of African Cities 2010 and World Development Report 2009 *Average from sample of 25 countries of sub Saharan Africa
The following table summarizes the main arguments regarding the size of Addis Ababa as the primary city of Ethiopia.
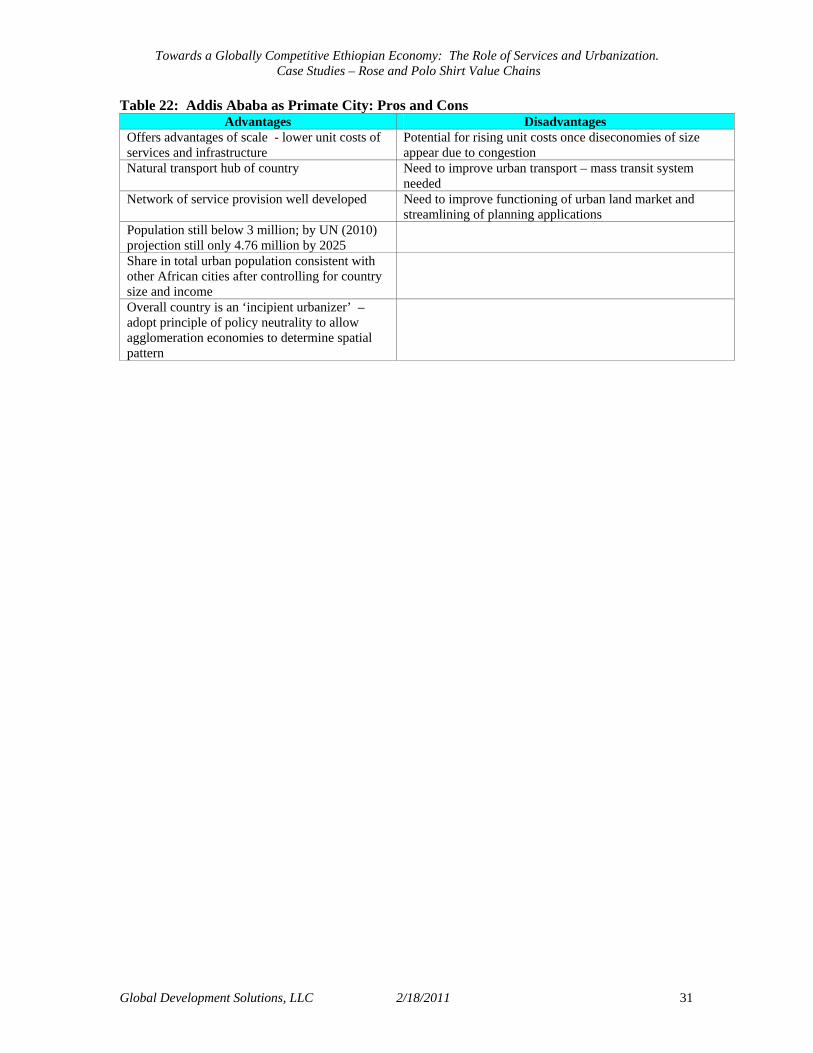
Towards a Globally Competitive Ethiopian Economy: The Role of Services and Urbanization. Case Studies – Rose and Polo Shirt Value Chains
Global Development Solutions, LLC 2/18/2011 31
Table 22: Addis Ababa as Primate City: Pros and Cons Advantages Disadvantages
Offers advantages of scale - lower unit costs of services and infrastructure
Potential for rising unit costs once diseconomies of size appear due to congestion
Natural transport hub of country Need to improve urban transport – mass transit system needed
Network of service provision well developed Need to improve functioning of urban land market and streamlining of planning applications
Population still below 3 million; by UN (2010) projection still only 4.76 million by 2025
Share in total urban population consistent with other African cities after controlling for country size and income
Overall country is an ‘incipient urbanizer’ – adopt principle of policy neutrality to allow agglomeration economies to determine spatial pattern
Towards a Globally Competitive Ethiopian Economy: The Role of Services and Urbanization. Case Studies – Rose and Polo Shirt Value Chains
Global Development Solutions, LLC 2/18/2011 32
IV. Case Study 1: the Role of Services in the Ethiopian Garment Value Chain (Polo Shirts)
This case study looks at the role of services in the garment value chain in Ethiopia. A value chain analysis for polo shirts is provided as a proxy to the working of the garments sector as a whole. The case study is organized in five sections. The first section discusses the garment supply chain and its current functioning in Ethiopia.5 The section traces and prices out a polo shirt from the raw material sourcing stages to the export market and describes the role of services in the supply chain. The three following sections discuss in detail the polo shirt value chain in relation to the role of services during input sourcing, production, and exporting stages of the value chain. The final section discusses the geographic distribution of garments firms and service suppliers and the role of Addis Ababa in the garment supply chain. 1. The Garment Supply Chain The export garment supply chain in Ethiopia is illustrated in the figure below. The key features of the supply chain are:
• Exporting garment firms almost exclusive rely on imported inputs, while at the same time local import trade facilitation is poor. For garment manufacturer in Addis Ababa, the order-to-factory delivery of inputs from foreign suppliers takes between 30 - 50 days. Up to 21 days can be lost in the process of obtaining official customs permits and the performance of clearances and inspections by official institutions;
• Before any input order is placed, garment exporters must wait 30 - 90 days to obtain foreign currency;
• Many garments producers are located in or around Addis Ababa (see sections below for more details of the geographic location of firms). At the same time, all inputs and finished products are moved in and out of the country via Djibouti port which is over 900 kilometers away from Addis Ababa;
• No network of local service providers to perform non-essential processes within the garment value chain. Specifically, Ethiopian garment firms can not outsource any production activities along the value chain to local SMEs, including processes such as washing, and finishing;
• No network of specialized trading service providers specialized in supporting garment firms in Ethiopia, including agents specialized in import of inputs. As a result, garment manufacturers are required to perform all trade related functions to access input supplies and for exporting finished garments;
5 All supply and value chain discussions throughout the three cases studies are in relation to firms that engage in exports. The functioning of the supply chain of firms that sell garments (and cut flowers) in the local market is not the object of these case studies.
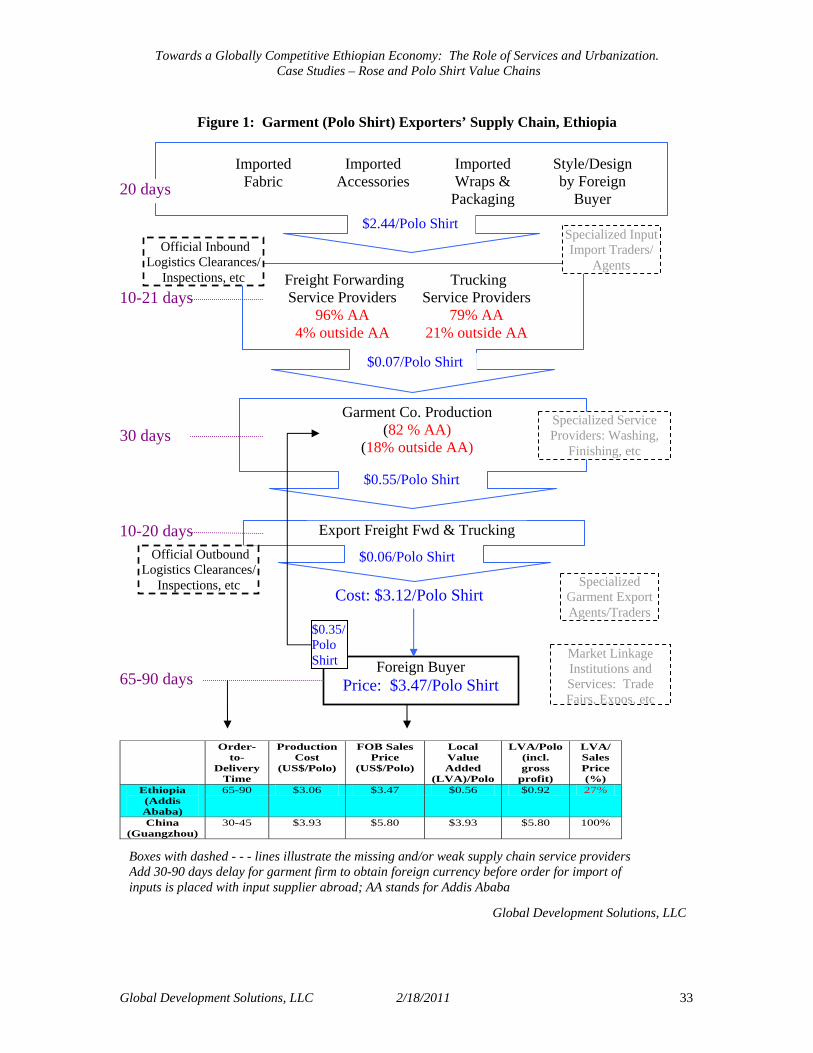
Towards a Globally Competitive Ethiopian Economy: The Role of Services and Urbanization. Case Studies – Rose and Polo Shirt Value Chains
Global Development Solutions, LLC 2/18/2011 33
Figure 1: Garment (Polo Shirt) Exporters’ Supply Chain, Ethiopia
20 days
10-21 days
30 days
10-20 days
Global Development Solutions, LLC
Garment Co. Production (82 % AA)
(18% outside AA)
Imported Fabric
Imported Accessories
Style/Design by Foreign
Buyer
Freight ForwardingService Providers
96% AA 4% outside AA
Imported Wraps &
Packaging
Trucking Service Providers
79% AA 21% outside AA
$2.44/Polo Shirt
$0.07/Polo Shirt
$0.55/Polo Shirt
Export Freight Fwd & Trucking
$0.06/Polo Shirt
Boxes with dashed - - - lines illustrate the missing and/or weak supply chain service providers Add 30-90 days delay for garment firm to obtain foreign currency before order for import of inputs is placed with input supplier abroad; AA stands for Addis Ababa
Specialized Service Providers: Washing,
Finishing, etc
Specialized Input Import Traders/
Agents
Market Linkage Institutions and Services: Trade Fairs, Expos, etc
Foreign Buyer Price: $3.47/Polo Shirt
$0.35/Polo Shirt
Cost: $3.12/Polo Shirt
65-90 days
Specialized Garment Export Agents/Traders
Official Inbound Logistics Clearances/
Inspections, etc
Order-to-
Delivery Time
Production Cost
(US$/Polo)
FOB Sales Price
(US$/Polo)
Local Value Added
(LVA)/Polo
LVA/Polo(incl. gross
profit)
LVA/ Sales Price (%)
Ethiopia (Addis Ababa)
65-90 $3.06 $3.47 $0.56 $0.92 27%
China (Guangzhou)
30-45 $3.93 $5.80 $3.93 $5.80 100%
Official Outbound Logistics Clearances/
Inspections, etc
Towards a Globally Competitive Ethiopian Economy: The Role of Services and Urbanization. Case Studies – Rose and Polo Shirt Value Chains
Global Development Solutions, LLC 2/18/2011 34
• No network of specialized marketing agents that perform match-making, market research, order management and processing, or other export marketing functions in Ethiopia;
• No services at the national level that would provide critical market linkage and trade/investment support to Ethiopian exporters (including garment producers) in terms of attracting foreign buyers and making Ethiopia known as an attractive location – specialized trade fairs, expositions, etc are limited or non-existent in Ethiopia; and
• Basic services such as water, electricity and other infrastructure related services are generally available but can sometimes be unreliable (for example, electricity).
The current structure of the garment supply chain in Ethiopia has the following implications on the national competitiveness of the sector.
• The supply chain leads to long order-to-delivery times (at least 65 – 90 days). Ethiopian garment exporters are uncompetitive in this regard.
• The long order-to-delivery time confines garment exporters to the production of the most basic garment items with long order cycles.
• The current supply chain structure contributes to high overhead costs related to managing input material sourcing, in-house production, and finished product exports. Overhead costs for Ethiopian firms can be as much as twice what Asian producers pay (for more details, refer to Section 3: The Role of Services in the Garment Value Chain - Polo Shirts).
• The net effect of the current supply chain is that even though Ethiopian firms are generally competitive with respect to the cost of production compared to producers in China, they are generally unable to compete in terms of sales price. In the example of polo shirts, an Ethiopian firm is likely to sell a standard polo shirt for US$3 - US$4 price range, whereas a Chinese producers of similar size would generally sell a similar polo shirt at US$5-US$6 price range.6
The role of services in firms’ supply and value chains are discussed in more detail in the sections below.
2. Role of Services in the Import of Inputs – Garment Value Chain (Polo Shirts) The role of services in the import of inputs in the Ethiopian garment value chain is by and large limited to the contribution of inbound logistics/transport service providers. As specialized garment input traders and/or agents do not exist in the country, Ethiopian garment exporters import inputs directly from foreign suppliers with the inbound logistics performed by freight forwarders. The value chain interviews suggest that most Ethiopian garment export firms work at or around 60% of capacity, and the fixed staff costs related to supply chain management can be high notwithstanding the fact that Ethiopian labor costs are relatively low. According
6 Standard short sleeve ribbed three-button polo shirt, 275-300 grams per polo, pique knit.
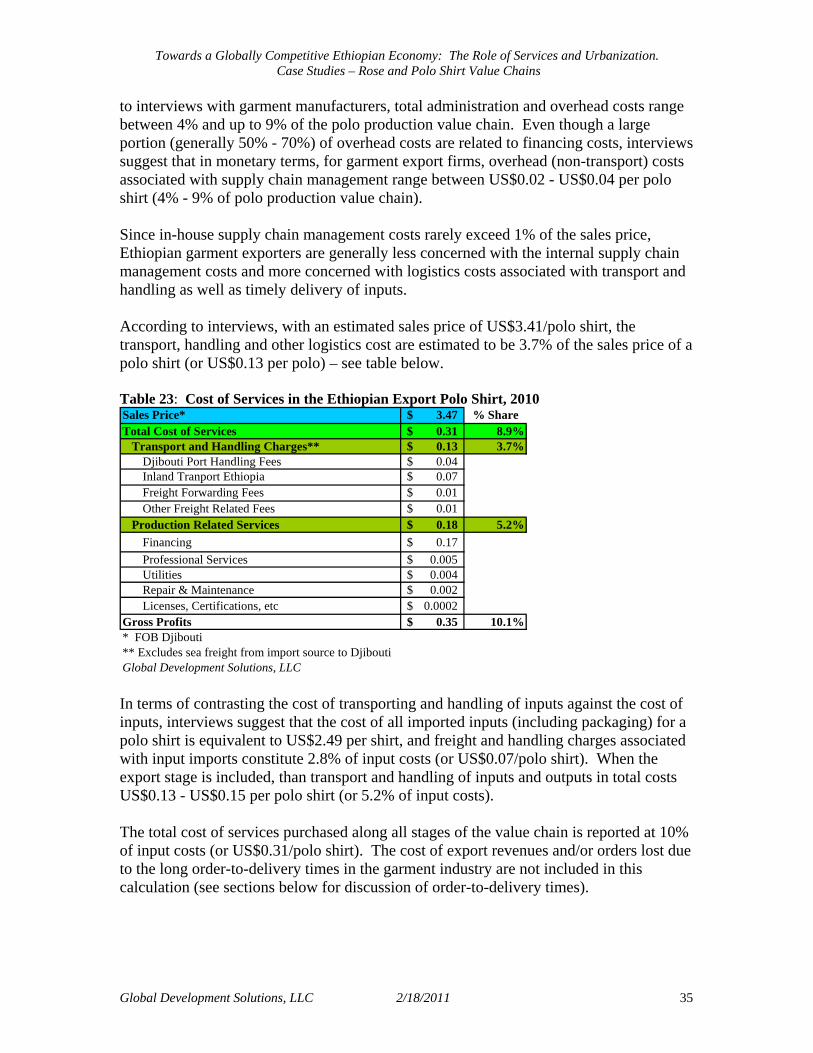
Towards a Globally Competitive Ethiopian Economy: The Role of Services and Urbanization. Case Studies – Rose and Polo Shirt Value Chains
Global Development Solutions, LLC 2/18/2011 35
to interviews with garment manufacturers, total administration and overhead costs range between 4% and up to 9% of the polo production value chain. Even though a large portion (generally 50% - 70%) of overhead costs are related to financing costs, interviews suggest that in monetary terms, for garment export firms, overhead (non-transport) costs associated with supply chain management range between US$0.02 - US$0.04 per polo shirt (4% - 9% of polo production value chain). Since in-house supply chain management costs rarely exceed 1% of the sales price, Ethiopian garment exporters are generally less concerned with the internal supply chain management costs and more concerned with logistics costs associated with transport and handling as well as timely delivery of inputs. According to interviews, with an estimated sales price of US$3.41/polo shirt, the transport, handling and other logistics cost are estimated to be 3.7% of the sales price of a polo shirt (or US$0.13 per polo) – see table below. Table 23: Cost of Services in the Ethiopian Export Polo Shirt, 2010 Sales Price* 3.47$ % ShareTotal Cost of Services 0.31$ 8.9% Transport and Handling Charges** 0.13$ 3.7%
Djibouti Port Handling Fees 0.04$ Inland Tranport Ethiopia 0.07$ Freight Forwarding Fees 0.01$ Other Freight Related Fees 0.01$
Production Related Services 0.18$ 5.2%Financing 0.17$ Professional Services 0.005$ Utilities 0.004$ Repair & Maintenance 0.002$ Licenses, Certifications, etc 0.0002$
Gross Profits 0.35$ 10.1%* FOB Djibouti ** Excludes sea freight from import source to DjiboutiGlobal Development Solutions, LLC In terms of contrasting the cost of transporting and handling of inputs against the cost of inputs, interviews suggest that the cost of all imported inputs (including packaging) for a polo shirt is equivalent to US$2.49 per shirt, and freight and handling charges associated with input imports constitute 2.8% of input costs (or US$0.07/polo shirt). When the export stage is included, than transport and handling of inputs and outputs in total costs US$0.13 - US$0.15 per polo shirt (or 5.2% of input costs). The total cost of services purchased along all stages of the value chain is reported at 10% of input costs (or US$0.31/polo shirt). The cost of export revenues and/or orders lost due to the long order-to-delivery times in the garment industry are not included in this calculation (see sections below for discussion of order-to-delivery times).

Towards a Globally Competitive Ethiopian Economy: The Role of Services and Urbanization. Case Studies – Rose and Polo Shirt Value Chains
Global Development Solutions, LLC 2/18/2011 36
Table 24: Cost of Input Import Related Services as Share of Input Costs, 2010 Cost of Inputs in a Polo Shirt* 2.49$ % ShareTotal Cost of Services 0.31$ 10.0% Input Import Transport and Handling Charges** 0.07$ 2.8%
Djibouti Port Handling Fees 0.03$ Inland Tranport Ethiopia 0.03$ Freight Forwarding Fees 0.004$ Other Freight Related Fees 0.01$
Production Related Services 0.18$ 7.2% Garment Export Related Services 0.06$ 2.4%* FOB Djibouti ** Excludes sea freight from import source to DjiboutiGlobal Development Solutions, LLC Efficient and Competitive Freight Forwarding Service Providers: Currently, there are more than 200 licensed/registered transit operators conducting business in the country. All freight forwarding companies are private with the exception of The Maritime and Transit Service Enterprise (MTSE), which is the sole state owned agent operating in the industry. The work of freight forwarders is closely tied with the Customs Authority, transporters, shipping lines, Djibouti port and other Djibouti based forwarders. MTSE is the only Ethiopian company operating legally in Djibouti. However, other Ethiopian companies operate in collaboration with legally registered operators in Djibouti. In general, the freight forwarding business in Ethiopia is highly competitive – freight forwarding fees are on average US$50/TEU. These fees constitute approximately 2% - 4% of the total cost of inbound logistics costs. Costly Transportation Dictated by Geography: As can be seen from the table above, transport and handling charges constitute 3.7% of the sales price of a polo shirt. This includes both the inbound (import) and outbound (export) logistics costs. When measured in the export polo garment equivalent, the import of fabrics, accessories, packaging materials, and all other inputs costs are roughly US$2,000/TEU, or US$0.07 per polo shirt – detailed breakdown of inland and foreign (Djibouti) portion of services is provided in the table below.7
7 The costs incurred by firms for document preparation

Towards a Globally Competitive Ethiopian Economy: The Role of Services and Urbanization. Case Studies – Rose and Polo Shirt Value Chains
Global Development Solutions, LLC 2/18/2011 37
Table 25: Transportation and Handling Costs for Imported Inputs
20ft (container) 40ft (container)ImportDjibouti Port Handling Fee 9,714 16,330 Bank Services 194 326 Container return 2,000 6,000 Miscellaneous 30 Postage & Communication with Revenue Stamp 285 185 Forms & Petties 185 95 Transit & Custom Clearing/Inspection Charges 1,850 1,570 VAT 15% 187 235 Trucking (Transportation ) 13,320 23,000 Total (ETB/Container) 27,765 47,741 Total (US$/Container)* $2,057 $3,536* At exchange rate of 13.5 ETB/US$. As of December 2010, rate has changed to 16.5 ETB/US$(lowering freight and hanling costs at least temporarily)Global Development Solutions, LLC
ActivitiesOver Sea Cargo Co.
ETB
Considering the fact that most garment exporters are situated up to 1,000 kilometers away from the main point of entry of inputs at Djibouti Port (220 km from the port to the Ethiopian border, and 700 - 800 kilometers from the border to warehouses in or around Addis), garment firms generally must import inputs over long distances which increases the cost of doing business. Land transport is a fully liberalized and deregulated sub-sector in Ethiopia and transport service charges are by and large a function of the long
distance to and from Djibouti. Transport costs, however, fluctuates frequently with changes in fuel price set by the Ministry of Trade. Nevertheless, when measured in per unit (km-ton) basis, inland transport costs within Ethiopia are relatively competitive (see table) and it is at the cross-border logistics stages of transportation and handling that most problems occur in the garment exporters’ supply chain.
Inbound Logistics Burdened by Inefficient Government Service Providers – Customs Transit Documentation: While garment exporters are well served by private freight forwarding service providers, the same can not be said for the government-based providers of critical trade facilitation services such as customs clearance. In Ethiopia, firms from the garment (and most other) sectors need only to:
i) Obtain an official Transit Declaration (which is in effect an import permit) from the Customs Authority based on shipping documents already obtained; and
Table 26: Comparative Transport Cost Comparative Transport Cost for Selected Countries US$/km-ton India $ 0.02 Indonesia $ 0.02 Pakistan $ 0.02 Ethiopia $ 0.04 Gambia (truck) $ 0.09 Gambia (bus) $ 0.27 Tanzania $ 0.06 Kenya $ 0.06 Mozambique $ 0.15 Madagascar $ 0.17 South Africa $ 0.20
Global Development Solutions, LLC

Towards a Globally Competitive Ethiopian Economy: The Role of Services and Urbanization. Case Studies – Rose and Polo Shirt Value Chains
Global Development Solutions, LLC 2/18/2011 38
ii) Send documents to Djibouti by courier to process clearance from port and arrange transport to a designated destination.
Even though the Customs Authority claims to complete issuance of the Transit Declaration within 8 hours after importer or the agent (forwarder, delegated in writing) presents full document to customs, in practice, however, obtaining a transit declaration requires at least several days. When time required to courier the necessary paperwork is included, it generally takes three to five days for the official documentation to reach Djibouti. Losing a minimum of three to six days for official import paper work slows the inbound supply chain of garment firms significantly. As was illustrated in the garment supply chain figure above, the fact that Ethiopian garment exporting firms must import all necessary inputs already puts them at 20 - 30 day disadvantage compared to foreign garment exporters who often have readily available supply of materials in their local markets. An additional six-day period required for processing official paperwork in effect adds another 10% to the order-to-delivery time for exporters. The costs of inadequate management of apparel sourcing and supply chains are especially onerous since price and demand for an individual garment are largely time-dependent. This is especially the case for fashion garments. When the product is delayed beyond the start of a fashion season, the final retailers’ margins for fashion apparel “perish” even if the garments are not a perishable. For example, a seasonal garment for the holidays or bathing suit for the summer might sell at full price for only two weeks or even less, then at a 30 - 40% markdown (or zero margins) for another two weeks before the garment is sold through other discount retail channels for a small fraction of the original price, mostly at a large loss. In this context, the long order-to-delivery cycle in Ethiopia suggest that Ethiopian garment suppliers are generally confined to exporting a limited range of products such as polo shirts, which are generally less driven by fashion trends and can tolerate some degree of variation in terms of time-to-delivery (see table below for a comparative ranking of Ethiopia in garment product diversification – ex: Ethiopian garment firms make only 20 types of garment products). Table 27: Clothing and Accessories, Comparative Product Performance Table, 2007
Value Rank Value Rank Value Rank
P1 112,597 1 -93 109 8,216 6
P2 87 48 0 145 105 42P3 33.82% 1 0% 117 2.64% 9P4a 50 4 20 58 29 38P4b 4 104 29P5a 15 3 2 111 3 102P5b 2 90 55
Source: Product Map, International Trade Center
Product diversification (N° of equivalent products)
Product Performance TableIndicators
VIETNAMETHIOPIACHINA
Position in 2007
(Current Index) Product spread (concentration)
Market diversification (N° of equivalent markets)Market spread (concentration)
Net exports (in million US$)
Per capita exports (US$ per inhabitant)Share in World market (%)
Towards a Globally Competitive Ethiopian Economy: The Role of Services and Urbanization. Case Studies – Rose and Polo Shirt Value Chains
Global Development Solutions, LLC 2/18/2011 39
Also, if current export price of polo shirts from Ethiopia are indicative of the sector as a whole, the ability of Ethiopian garment exporters to increase their sales price is diminished. In the example of polo shirts, an Ethiopian firm generally sells a standard polo shirt in the US$3-US$4 price range, whereas a Chinese producers of similar size would generally sell an equivalent polo shirt for US$5-US$6. The price difference can, in part, be explained by the fact that even at lower prices, sourcing polo shirts from Ethiopia is not attractive for international buyers because of the lack of competitiveness of Ethiopian producers with respect to a number of critical non-price factors;8
• Being able to deliver orders fast – currently not possible due to the poor trade facilitation environment;
• Providing the client the ability to order a wide range of garment products in a single order increases the value for the customer and increases the chance of obtaining higher prices for garments – this is currently not possible due to the fact that service providers such as trading and/or marketing agents that consolidate orders do not exist in Ethiopia;
• Having capability to complete larger orders of a single product or of a narrow range of products – currently not possible due to the fact that:
o There are no service providers in Ethiopia that provide specialized services to garment firms for non-essential services such as washing, trimming, or other finishing tasks.9 Scaling up production by outsourcing parts of production to service providers is not possible given the industry and supply chain structure in Ethiopian.
o There are no collaborative arrangements among garment firms in Ethiopia through which a firm who receives one or more large orders splits/outsource the order(s) to other garment firms for a set service fee.
The supply chain analysis also suggests that due to the time-consuming issuance of the Transit Document, almost all garment firms incur storage (demurrage) fees at Djibouti port while importing inputs (US$5 - US$20 per day depending on storage duration). Storage grace period given by shipping lines used to be 30 days but has recently been substantially reduced to one or two weeks depending on the shipping lines based in Djibouti (see table below).
8 Non-price refers to the apparent sales price offered/demanded at the time of order negotiation. Otherwise, all the factors highlighted have specific cost and price/profit implications for garment buyers in terms of minimization of supply chain management and inventory costs as well as maximization of sales price by timing the sales of garments as per market demand/season. 9 The term non-essential refers generally to knit shirts (including polos). Depending on the type of garment, some of the finishing tasks can be essential functions that are generally not outsourced to third parties. In some denim garments, for example, washing can be a core defining feature of a product.

Towards a Globally Competitive Ethiopian Economy: The Role of Services and Urbanization. Case Studies – Rose and Polo Shirt Value Chains
Global Development Solutions, LLC 2/18/2011 40
Table 28: Storage Grace Period per Shipping Line (in days)
Shipping Line Grace PeriodMESINA 15PIL 10ESL 8MSC 10MAERSK 10 Source: The Maritime and Transit Service Enterprise Inbound Logistics Burdened by Inefficient Government Service Providers – Shortage of Customs Inspectors: The supply chain analysis suggests that in addition to time consuming transit documentation process, delays persist further along the chain up to the final stage of officially required Customs Inspection. Once containerized cargo enters Ethiopia, the containers must be unsealed and inspected by Customs inspectors. Garment exporters can not use bonded warehouses nor can they store their cargo in a single warehouse while waiting for inspections to be performed. All import containers must be sent to the premises of the Customs Authority in Addis Ababa. This process leads to double handling: unstuffing/unloading containerized truck, and then loading inspected goods back onto a buyer’s truck(s). Even though double handling is a problem, garment exporters are more concerned with the time it takes for the inspection process to be completed: at least three days and up to seven days (see table below). Excessive time required for inspections at Customs can be attributed to:
1. A dire shortage of inspectors at Customs; and 2. Inspections are performed at only one location: Customs uses the Comet
Transport Enterprise facilities Addis Ababa. Table 29: Customs and Highway Inspection Points and Duration for Imported Cargo, Ethiopia
Inspection points US$/Inspection
Responsible agent Time lapse Documents required
Stamps & signatures
Galafi Border -$ Ethiopian Customs Agency 1 hour 1 1Mile -$ Ethiopian Road Authority 10 minutes 1 1Awash Weigh Station 3$ Ethiopian Road Authority 10 minutes 1 1
Ethiopian Customs Agency 3-7 days 1 1 Warehouse/Storage Fee 49$ Standard & Quality Test Fee 8$ Total 60$ Global Development Solutions, LLC
Addis Ababa Customs:
As can be seen from the table below, inadequate trade facilitation by government agencies contributes significantly to delays which garment exporters incur when importing inputs.

Towards a Globally Competitive Ethiopian Economy: The Role of Services and Urbanization. Case Studies – Rose and Polo Shirt Value Chains
Global Development Solutions, LLC 2/18/2011 41
Table 30: Procedures and Time Lapse During Input Import Process, Ethiopia
Import Procedure/Step Fees Time required
Responsible/ Issuing
Authority Remarks
Terms of a sale agreed between Ethiopian importer and foreign exporters--> Importer applies for Indemnity Letter: an official request for foreign exchange for import trade.
US$0.2 30 minutes Commercial Bank
Credit/Delinquency rating performed by National Bank of Ethiopia (NBE) every month. Importer can not obtain currency if in delinquency.
General: 1-3 months (waiting
list) Longest: 6
months, when foreign
currency is scarce
Importer presents copies of Pro Forma invoice. Photocopy of valid trade licenses for foreign trade/investment/industry, Tax Identification Number (TIN) certificate and Insurance certificate.
1.5% of document
value
Shortest: 1 week
Commercial Bank
Importer presents application for Letter of Credit (LC)
1.5% of document
value 1 day Commercial
Bank
Bank issues account number for importing customer. At least 5% of LC value will be escrowed/blocked from importer's account - rate varies between banks.
Importer's bank sends its irrevocable LC to foreign exporter’s bank and requests confirmation.
US$15 1 day Commercial Bank
Effectively this is when the order for import of inputs (fabric and other materials) is placed by Ethiopian garment exporter(s).
Letter of confirmation along with the irrevocable LC sent to foreign exporter
4-7 days Correspondent
The foreign exporter reviews carefully all conditions in the LC – its freight forwarder is contacted to make sure that the shipping date can be met (if the exporter cannot comply with one or more of the conditions, the customer is alerted at once.)
20 days Correspondent
The foreign exporter arranges with their freight forwarder to deliver the goods to the appropriate port or airport.
1-3 days Exporter To be processed within valid period (90 days)
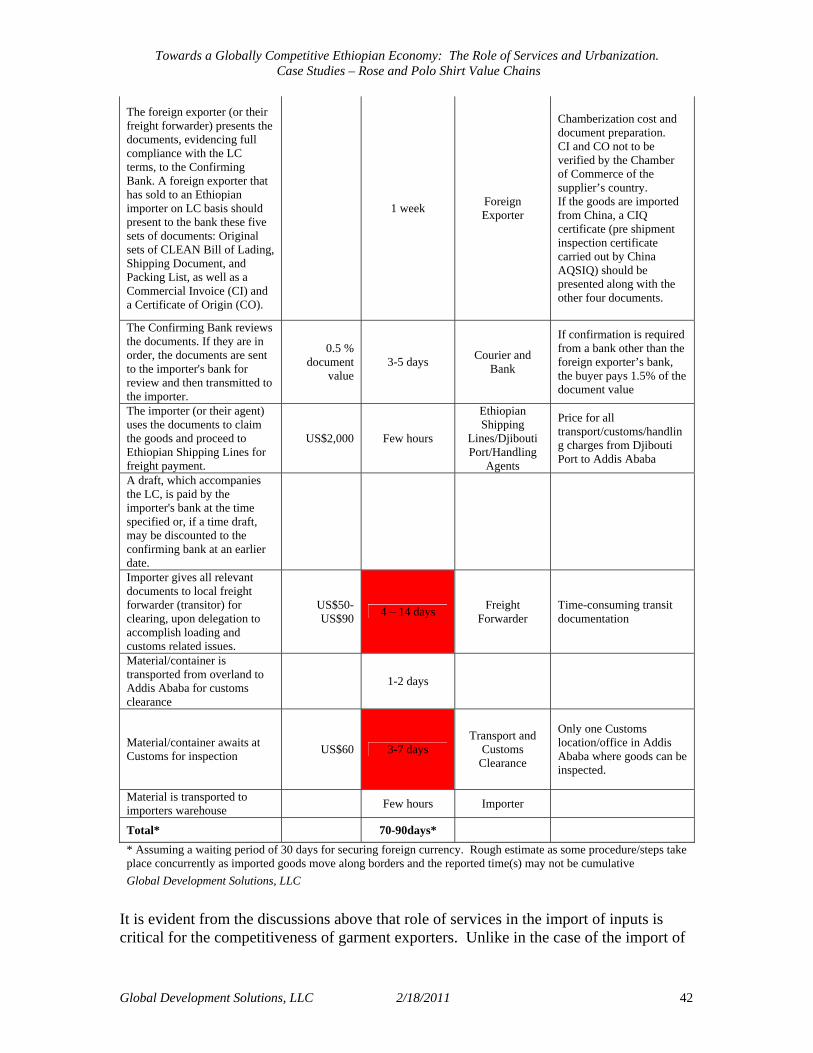
Towards a Globally Competitive Ethiopian Economy: The Role of Services and Urbanization. Case Studies – Rose and Polo Shirt Value Chains
Global Development Solutions, LLC 2/18/2011 42
The foreign exporter (or their freight forwarder) presents the documents, evidencing full compliance with the LC terms, to the Confirming Bank. A foreign exporter that has sold to an Ethiopian importer on LC basis should present to the bank these five sets of documents: Original sets of CLEAN Bill of Lading, Shipping Document, and Packing List, as well as a Commercial Invoice (CI) and a Certificate of Origin (CO).
1 week Foreign Exporter
Chamberization cost and document preparation. CI and CO not to be verified by the Chamber of Commerce of the supplier’s country. If the goods are imported from China, a CIQ certificate (pre shipment inspection certificate carried out by China AQSIQ) should be presented along with the other four documents.
The Confirming Bank reviews the documents. If they are in order, the documents are sent to the importer's bank for review and then transmitted to the importer.
0.5 % document
value 3-5 days Courier and
Bank
If confirmation is required from a bank other than the foreign exporter’s bank, the buyer pays 1.5% of the document value
The importer (or their agent) uses the documents to claim the goods and proceed to Ethiopian Shipping Lines for freight payment.
US$2,000 Few hours
Ethiopian Shipping
Lines/Djibouti Port/Handling
Agents
Price for all transport/customs/handling charges from Djibouti Port to Addis Ababa
A draft, which accompanies the LC, is paid by the importer's bank at the time specified or, if a time draft, may be discounted to the confirming bank at an earlier date.
Importer gives all relevant documents to local freight forwarder (transitor) for clearing, upon delegation to accomplish loading and customs related issues.
US$50-US$90 4 – 14 days Freight
Forwarder Time-consuming transit documentation
Material/container is transported from overland to Addis Ababa for customs clearance
1-2 days
Material/container awaits at Customs for inspection US$60 3-7 days
Transport and Customs
Clearance
Only one Customs location/office in Addis Ababa where goods can be inspected.
Material is transported to importers warehouse Few hours Importer
Total* 70-90days* * Assuming a waiting period of 30 days for securing foreign currency. Rough estimate as some procedure/steps take place concurrently as imported goods move along borders and the reported time(s) may not be cumulative Global Development Solutions, LLC
It is evident from the discussions above that role of services in the import of inputs is critical for the competitiveness of garment exporters. Unlike in the case of the import of

Towards a Globally Competitive Ethiopian Economy: The Role of Services and Urbanization. Case Studies – Rose and Polo Shirt Value Chains
Global Development Solutions, LLC 2/18/2011 43
inputs for cut flower producers who can generally keep rolling stocks of imported inputs such as fertilizer and chemicals on hand, garment exporters generally must import discrete batches of inputs (such as fabric, accessories, etc) each time a garment order is received. As a result, their ability to stock inputs in order to avoid delays during cross-border trade in practically non-existent. For garment exporters, therefore, the efficiency of trade facilitation infrastructure is critical to their competitiveness, especially in terms of their ability to shorten their order-to-delivery cycles. One of the main ways in which inefficiencies in the provision of import-related services manifest itself is through long delays in the process of input imports (especially in relation to the time consumed for undergoing official clearances and inspections). The sections below discuss other manifestations of the role of services along the stages of garment production, and most notably the cost of finance.
3. Role of Services in Production – Garment Value Chain (Polo Shirts) Once inputs reach a manufacturing facility, the production of polo shirts goes through several stages of production: cutting/layering, sewing/assembly, finishing/quality control, packing and loading. The manufacturing process is supported by the management and administration stage of production. Garment manufacturers in Ethiopia assemble polo shirt orders within 20-30 days.10 Financing Cost – The Dominant Service Cost in the Polo Shirt Assembly: As can be seen from the table below, financial services is the most significant cost associated with service provisioning during the production process of polo shirts in Ethiopia.11 When only polo shirt assembly costs are considered (excluding all non-packaging input materials), the cost of financing (US$0.17/polo shirt) constitutes 30% of assembly costs (US$0.55/polo shirt). In terms of cost of polo shirt assembly in Ethiopia, the cost of finance is second only to labor costs (US$0.28). Table 31: The Role of Services in the Polo Shirt Assembly Costs, Ethiopia Sales Price* 3.47$ % ShareTotal Cost of Services 0.31$ 8.9% Transport and Handling Charges** 0.13$ 3.7%
Djibouti Port Handling Fees 0.04$ Inland Tranport Ethiopia 0.07$ Freight Forwarding Fees 0.01$ Other Freight Related Fees 0.01$
Production Related Services 0.18$ 5.2% Total Polo Shirt Assembly Costs*** 0.55$ % ShareFinancing 0.17$ Financing 0.17$ 30%Professional Services 0.005$ Other Production Related Services 0.01$ 1%Utilities 0.004$ Other Manufacturing Costs:Repair & Maintenance 0.002$ Labor 0.28$ 51%Licenses, Certifications, etc 0.0002$ Packaging 0.05$ 9%
Gross Profits 0.35$ 10.1% Other 0.05$ 9%* FOB Djibouti Total 0.55$ 100%** Excludes sea freight from import source to Djibouti *** Excludes raw material inputsGlobal Development Solutions, LLC Interviews suggest that the financial service industry in Ethiopia is liberalized. Currently there are 16 commercial and 1 development banks operating in Ethiopia (see table below). The commercial banks provide a wide range of services in the area of consumer finance,
10 Complex order of multiple garment styles and/or combination of garment types takes longer to complete. 11 The role of utilities and other services in the production of garments is minimal and is left out of the discussion in this case study.
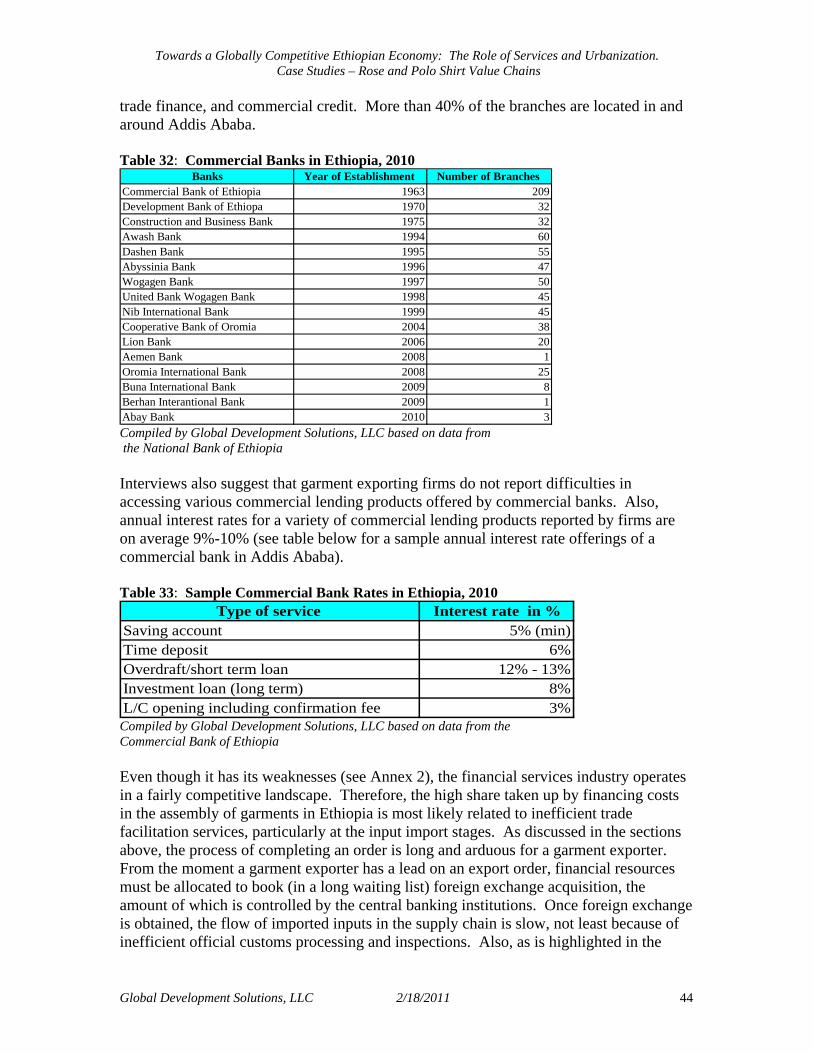
Towards a Globally Competitive Ethiopian Economy: The Role of Services and Urbanization. Case Studies – Rose and Polo Shirt Value Chains
Global Development Solutions, LLC 2/18/2011 44
trade finance, and commercial credit. More than 40% of the branches are located in and around Addis Ababa. Table 32: Commercial Banks in Ethiopia, 2010
Banks Year of Establishment Number of Branches Commercial Bank of Ethiopia 1963 209Development Bank of Ethiopa 1970 32Construction and Business Bank 1975 32Awash Bank 1994 60Dashen Bank 1995 55Abyssinia Bank 1996 47Wogagen Bank 1997 50United Bank Wogagen Bank 1998 45Nib International Bank 1999 45Cooperative Bank of Oromia 2004 38Lion Bank 2006 20Aemen Bank 2008 1Oromia International Bank 2008 25Buna International Bank 2009 8Berhan Interantional Bank 2009 1Abay Bank 2010 3 Compiled by Global Development Solutions, LLC based on data from the National Bank of Ethiopia Interviews also suggest that garment exporting firms do not report difficulties in accessing various commercial lending products offered by commercial banks. Also, annual interest rates for a variety of commercial lending products reported by firms are on average 9%-10% (see table below for a sample annual interest rate offerings of a commercial bank in Addis Ababa). Table 33: Sample Commercial Bank Rates in Ethiopia, 2010
Type of service Interest rate in %Saving account 5% (min)Time deposit 6%Overdraft/short term loan 12% - 13%Investment loan (long term) 8%L/C opening including confirmation fee 3%
Compiled by Global Development Solutions, LLC based on data from the Commercial Bank of Ethiopia Even though it has its weaknesses (see Annex 2), the financial services industry operates in a fairly competitive landscape. Therefore, the high share taken up by financing costs in the assembly of garments in Ethiopia is most likely related to inefficient trade facilitation services, particularly at the input import stages. As discussed in the sections above, the process of completing an order is long and arduous for a garment exporter. From the moment a garment exporter has a lead on an export order, financial resources must be allocated to book (in a long waiting list) foreign exchange acquisition, the amount of which is controlled by the central banking institutions. Once foreign exchange is obtained, the flow of imported inputs in the supply chain is slow, not least because of inefficient official customs processing and inspections. Also, as is highlighted in the
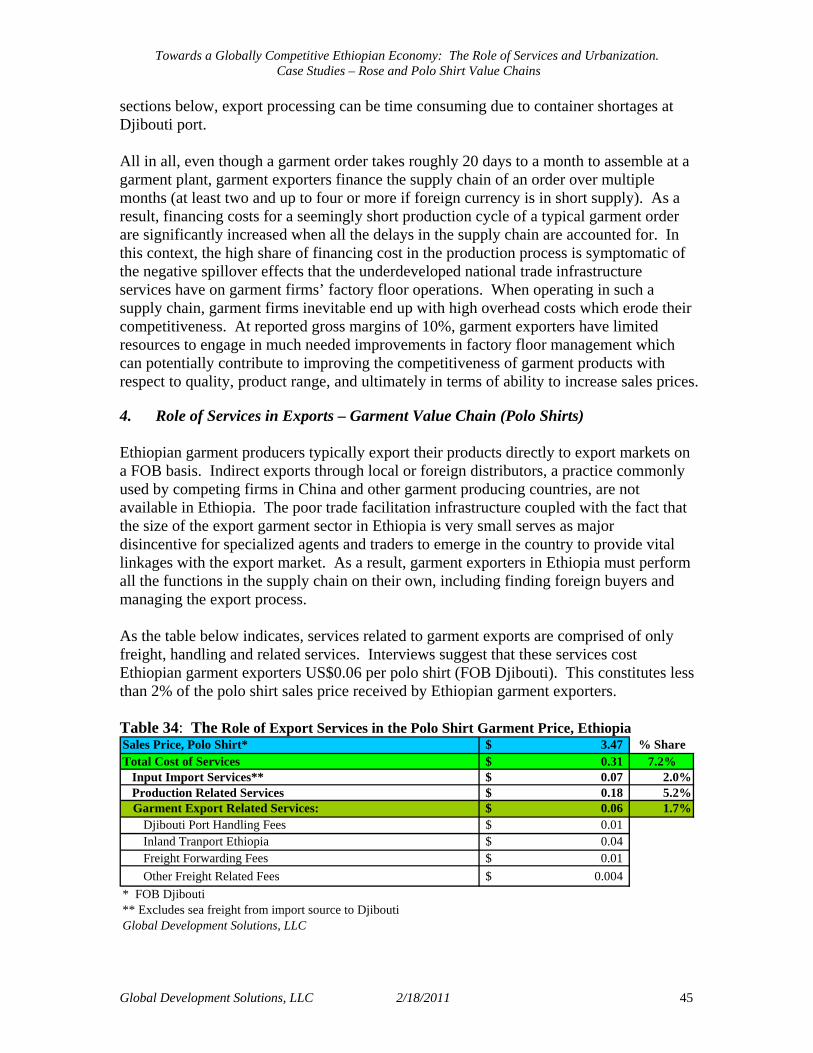
Towards a Globally Competitive Ethiopian Economy: The Role of Services and Urbanization. Case Studies – Rose and Polo Shirt Value Chains
Global Development Solutions, LLC 2/18/2011 45
sections below, export processing can be time consuming due to container shortages at Djibouti port. All in all, even though a garment order takes roughly 20 days to a month to assemble at a garment plant, garment exporters finance the supply chain of an order over multiple months (at least two and up to four or more if foreign currency is in short supply). As a result, financing costs for a seemingly short production cycle of a typical garment order are significantly increased when all the delays in the supply chain are accounted for. In this context, the high share of financing cost in the production process is symptomatic of the negative spillover effects that the underdeveloped national trade infrastructure services have on garment firms’ factory floor operations. When operating in such a supply chain, garment firms inevitable end up with high overhead costs which erode their competitiveness. At reported gross margins of 10%, garment exporters have limited resources to engage in much needed improvements in factory floor management which can potentially contribute to improving the competitiveness of garment products with respect to quality, product range, and ultimately in terms of ability to increase sales prices. 4. Role of Services in Exports – Garment Value Chain (Polo Shirts) Ethiopian garment producers typically export their products directly to export markets on a FOB basis. Indirect exports through local or foreign distributors, a practice commonly used by competing firms in China and other garment producing countries, are not available in Ethiopia. The poor trade facilitation infrastructure coupled with the fact that the size of the export garment sector in Ethiopia is very small serves as major disincentive for specialized agents and traders to emerge in the country to provide vital linkages with the export market. As a result, garment exporters in Ethiopia must perform all the functions in the supply chain on their own, including finding foreign buyers and managing the export process. As the table below indicates, services related to garment exports are comprised of only freight, handling and related services. Interviews suggest that these services cost Ethiopian garment exporters US$0.06 per polo shirt (FOB Djibouti). This constitutes less than 2% of the polo shirt sales price received by Ethiopian garment exporters. Table 34: The Role of Export Services in the Polo Shirt Garment Price, Ethiopia Sales Price, Polo Shirt* 3.47$ % ShareTotal Cost of Services 0.31$ 7.2% Input Import Services** 0.07$ 2.0% Production Related Services 0.18$ 5.2%
Garment Export Related Services: 0.06$ 1.7%Djibouti Port Handling Fees 0.01$ Inland Tranport Ethiopia 0.04$ Freight Forwarding Fees 0.01$ Other Freight Related Fees 0.004$
* FOB Djibouti ** Excludes sea freight from import source to DjiboutiGlobal Development Solutions, LLC

Towards a Globally Competitive Ethiopian Economy: The Role of Services and Urbanization. Case Studies – Rose and Polo Shirt Value Chains
Global Development Solutions, LLC 2/18/2011 46
Outbound Logistics Burdened by Inefficient Government Service Providers: As can be seen from the table below, the quality of trade facilitation services provided by the Customs Authority is equally poor for export related activities. Nevertheless, during the export process the exporters receive more attention and are given higher priority during the documentation and other cargo handling steps than during import stages. Many of the bottlenecks prevailing at input import stages persist at the export stage:
• Delays at customs inspection stages of export processing of cargo; • Inability to containerize cargo in Ethiopia; and • Delays during customs processing in Djibouti.
Table 35: Procedures and Time Lapse During the Garment Export Process, Ethiopia Activities Time taken Costs Remarks
Exporter presents Export Permit from National Bank of Ethiopia to forwarder
Documents presented by forwarder to Customs Authority
Within a few hours US$2 paid for Revenue Stamp
Very high priority given for export processes
Arrange transporter to take cargo to Djibouti Less than 1/2 day
Loading, Inspection by Customs, Sealing (plumbing) and allow cargo for transport to Port 1 - 2 days
Loading of bulk materials in Addis stuffing into containers in Djibouti. Shortage of Ethiopian inspectors acute and causes delays
Transport to Djibouti by trucks 2 – 3 days US$15-20/ton
Processes for unloading in Djibouti 3 - 5 days US$10/truck
Containerization in Addis Ababa or any other location not possible.Transporters take cargo in bulk and wait for days for containers.
Pay road toll
Pay gate pass fee at entrance to port
Arrange for empty containers and clean them for stuffing of bulk items
Arrange for equipments for unloading and loading
Arrange for loading on vessel US$17 per TEU
Port Clearing US$30 per B/L
Bill of Lading (B/L) fee to liners US$15 per TEU
Craft Paper fee
1 – 1.5 days
Both Port Authority and liners are escalating costs and fees

Towards a Globally Competitive Ethiopian Economy: The Role of Services and Urbanization. Case Studies – Rose and Polo Shirt Value Chains
Global Development Solutions, LLC 2/18/2011 47
Other port handling costs such as equipment rentals and labor costs
Issuance of B/L and shipping documents and communication of data on cargo 3 - 7 days
Not every shipping line has agents to issue B/Ls.Delay in issuing original B/L means delay in submission of shipping documents to the bank and claiming settlement of L/C.i.e. cash delay which is cost to the exporter.
Communication and reporting on follow-up on status of shipment
Though costs are transferable to exporters, forwarders complain about the high tariff Ethiopian Telecommunication Corporation charges at the rate of US$0.7/minute
Total 15 days
Global Development Solutions, LLC
Shortage of Empty Containers in Djibouti Slows the Export Logistic Process: Shortage of empty containers in Djibouti is considered to be one of the biggest problems in the export freight and handling activities which prevents exporters from achieving faster garment delivery times. In this context, making it possible for garment exporters to containerize their cargo in their facilities in Ethiopia is anticipated to generate some cost savings by avoiding double handling of cargo, but more importantly it is expected to generate significant improvements in the quality of the exported goods and the speed with which they reach the customers in export markets, such as:
• Stuffing could be done in the presence of owner/ representative product mishandling avoided fewer damages in quality of delivered items;
• Truck turnaround time could be greatly reduced only one day would suffice to unload container with no time lost searching for empty containers in Djibouti; and
• Some transporters could even reduce tariffs if they know there is less time to wait for unloading at the port:
• Vessel lines will be loaded much faster; • Less follow up costs for forwarders; and • Less costs for exporters.
5. The Contribution of Addis Ababa to the Garment Value Chain (Polo Shirts) 1. Geographic Distribution of the Garment Industry in Ethiopia There are 39 garment factories operating in Ethiopia. Roughly 90% of garment firms (35) are located in or around Addis Ababa. Only four firms (10% of all garments firms)

Towards a Globally Competitive Ethiopian Economy: The Role of Services and Urbanization. Case Studies – Rose and Polo Shirt Value Chains
Global Development Solutions, LLC 2/18/2011 48
are located more than 500 km away from Addis Ababa. The figure below illustrates the geographic distribution of garment firms in Ethiopia. Figure 2: Geographic Distribution of Garment firms in Ethiopia
Global Development Solutions, LLC
2. Geographic Distribution of Service Providers to the Garment Industry in Ethiopia
The majority of service providers to the garment industry are located in Addis Ababa. All garment factories have either their head office or liaison office in Addis Ababa in order to obtain the main logistical services such as customs, banking, forwarding and clearing, etc. The majority of services provided to the industry are entirely based in Addis Ababa, with few exceptions (ex: 11% of trucking services are purchased outside Addis Ababa). The few firms located outside Addis Ababa obtain only a limited set of service outside Addis Ababa: infrastructural services related to water, power supply and

Towards a Globally Competitive Ethiopian Economy: The Role of Services and Urbanization. Case Studies – Rose and Polo Shirt Value Chains
Global Development Solutions, LLC 2/18/2011 49
telecommunications. The list of the service providers, the type of services provided, location, and distance from Addis Ababa including some remarks are illustrated in the table below. Table 36: Service Providers to the Garment Industry
Service Provider Type Service Provider LocationDistance from Addis Ababa
(km)Remark
InputsPolo Fabric Adey Abeba Addis Ababa _Polo Collar Almeda Tigray - Adwa 1,006
MA Garment Tigray - Mekele 783Polo Buttons ELNAEL PLC Addis Ababa
_
Companies import buttons directly or buy from local button factories. In times of shortage, they buy buttons from importer distributors in the local market (Merkato). They do same for supply of buttons of the desired size and color of required quantity.
Polo Placket Hardener Private shops in Merkato Addis Ababa _Polo Thread Private shops in Merkato Addis Ababa _Polo LabelsFreight and Handling
Trans TransportEast-West TransportGet-Us TransportCommet TransportBekelcha TransportTikur AbayMaritime & Transit Service EnterpriseExpress Transit ServicePacktra transit serviceMacfa Transit ServiceDolphin Transit ServiceGreen Transit ServiceTegegneWork Transit Service
Utility and Other Support ServicesTelecommunication Ethiopia Telecommunication Corporation Addis Ababa _ State owned monopoly Electric Power Ethiopia Electric Power Corporation Addis Ababa _ State owned monopoly distributerWater & Sewerage Service Water from Addis Ababa Water and Sewerage
Authority (AAWSSA) and also owned well waters in individual farms, sewerage services by AAWSSA and private operators for sludge disposal.
_
In other townships the municipalities provide water and sewerage services.
Bank & Insurance Services Refer to Annex 3 Addis Ababa _ All have head quarters in Addis Ababa. Customs services Ethiopia Revenue & Customs Authority Addis Ababa _Provision of land Municipality Addis Ababa _ District (Woreda) administration land
departments provide land for investment for licensed investors.
Freight & ForwardingThese are major maritime and transit services providers among the existing more than 150 similar companies operating in the country.
There are about 200 trucking and land transport service providers among which these ones are very prominent in transport of goods from the port.
Addis Ababa _
Truck and Land Transport Addis Ababa _
Garment factories also import fabric from abroad.
Imported directly by garment companies
The biggest market place in Ethiopia
Global Development Solutions, LLC The figure below illustrates the geographic distribution of services provider to the garment industry in Ethiopia.
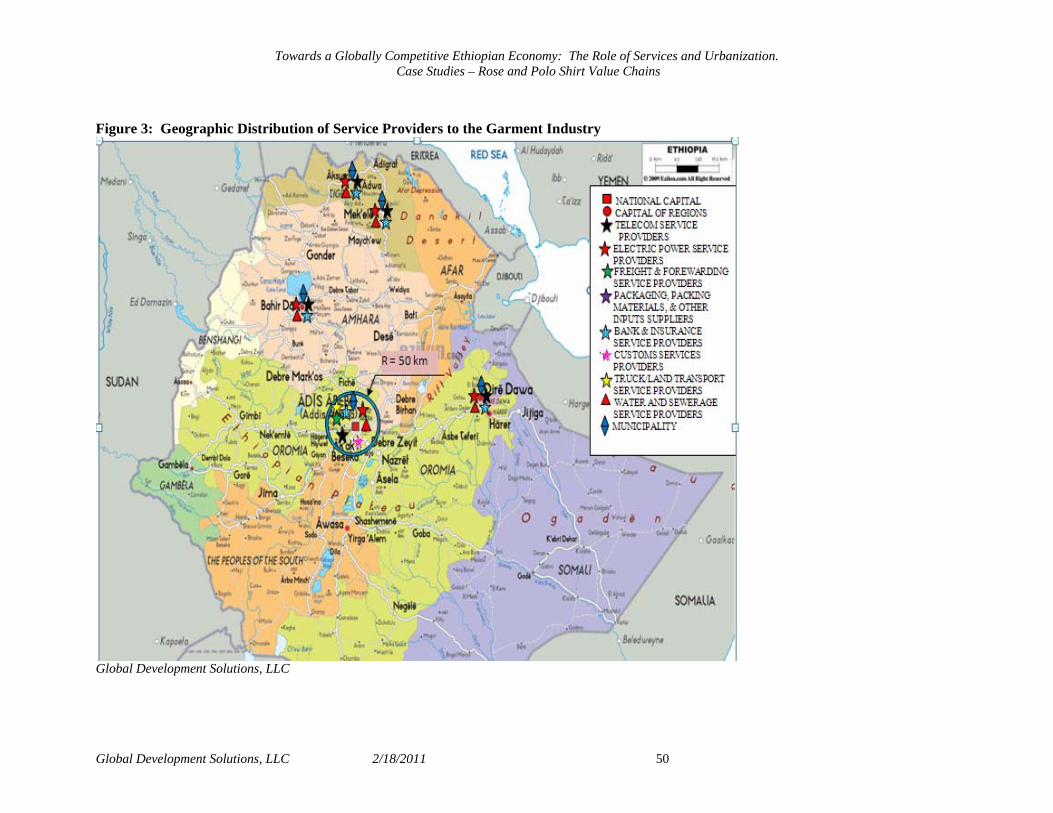
Towards a Globally Competitive Ethiopian Economy: The Role of Services and Urbanization. Case Studies – Rose and Polo Shirt Value Chains
Global Development Solutions, LLC 2/18/2011 50
Figure 3: Geographic Distribution of Service Providers to the Garment Industry
Global Development Solutions, LLC
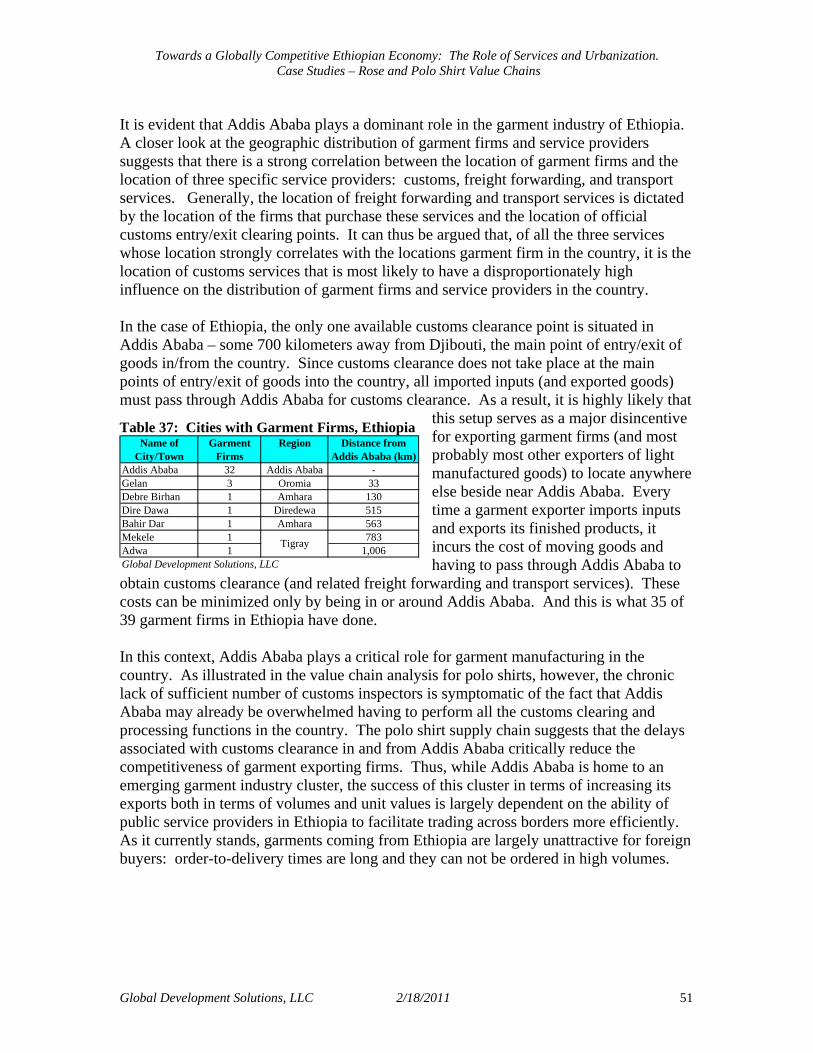
Towards a Globally Competitive Ethiopian Economy: The Role of Services and Urbanization. Case Studies – Rose and Polo Shirt Value Chains
Global Development Solutions, LLC 2/18/2011 51
It is evident that Addis Ababa plays a dominant role in the garment industry of Ethiopia. A closer look at the geographic distribution of garment firms and service providers suggests that there is a strong correlation between the location of garment firms and the location of three specific service providers: customs, freight forwarding, and transport services. Generally, the location of freight forwarding and transport services is dictated by the location of the firms that purchase these services and the location of official customs entry/exit clearing points. It can thus be argued that, of all the three services whose location strongly correlates with the locations garment firm in the country, it is the location of customs services that is most likely to have a disproportionately high influence on the distribution of garment firms and service providers in the country. In the case of Ethiopia, the only one available customs clearance point is situated in Addis Ababa – some 700 kilometers away from Djibouti, the main point of entry/exit of goods in/from the country. Since customs clearance does not take place at the main points of entry/exit of goods into the country, all imported inputs (and exported goods) must pass through Addis Ababa for customs clearance. As a result, it is highly likely that
this setup serves as a major disincentive for exporting garment firms (and most probably most other exporters of light manufactured goods) to locate anywhere else beside near Addis Ababa. Every time a garment exporter imports inputs and exports its finished products, it incurs the cost of moving goods and having to pass through Addis Ababa to
obtain customs clearance (and related freight forwarding and transport services). These costs can be minimized only by being in or around Addis Ababa. And this is what 35 of 39 garment firms in Ethiopia have done. In this context, Addis Ababa plays a critical role for garment manufacturing in the country. As illustrated in the value chain analysis for polo shirts, however, the chronic lack of sufficient number of customs inspectors is symptomatic of the fact that Addis Ababa may already be overwhelmed having to perform all the customs clearing and processing functions in the country. The polo shirt supply chain suggests that the delays associated with customs clearance in and from Addis Ababa critically reduce the competitiveness of garment exporting firms. Thus, while Addis Ababa is home to an emerging garment industry cluster, the success of this cluster in terms of increasing its exports both in terms of volumes and unit values is largely dependent on the ability of public service providers in Ethiopia to facilitate trading across borders more efficiently. As it currently stands, garments coming from Ethiopia are largely unattractive for foreign buyers: order-to-delivery times are long and they can not be ordered in high volumes.
Table 37: Cities with Garment Firms, Ethiopia Name of
City/TownGarment
FirmsRegion Distance from
Addis Ababa (km)Addis Ababa 32 Addis Ababa -Gelan 3 Oromia 33Debre Birhan 1 Amhara 130Dire Dawa 1 Diredewa 515Bahir Dar 1 Amhara 563Mekele 1 783Adwa 1 1,006Global Development Solutions, LLC
Tigray
Towards a Globally Competitive Ethiopian Economy: The Role of Services and Urbanization. Case Studies – Rose and Polo Shirt Value Chains
Global Development Solutions, LLC 2/18/2011 52
V. Case Study 2: the Role of Services in the Ethiopian Cut Flowers Value Chain (Roses)
This case study looks at the role of services in the cut flower value chain in Ethiopia. A value chain analysis for cut roses is provided as a proxy to help gain insights into how the cut flowers sector works in Ethiopia. The case study is organized into five sections. The first section discusses the cut flowers supply chain and its current functioning in Ethiopia.12 The section traces and develops a detailed cost profile of a freshly cut rose stem from the raw material sourcing stages to the export market, and describes the role of services in the supply chain. The following three sections discuss in detail the rose value chain in relation to the role of services during input sourcing, production, and export stages of the value chain. The final section discusses the geographic distribution of cut flower firms and service suppliers and the role of Addis Ababa in the cut flower supply chain. 1. The Cut Flowers Supply Chain The typical cut flowers/rose supply chain in Ethiopia is illustrated in the figure below. The key features of the supply chain are:
• Exporting cut flowers/rose firms are not reliant exclusively on imported inputs. They source fertilizers, chemicals, plant materials, packaging, etc through local traders who are generally situated in or around Addis Ababa. Greenhouse film is the only tangible input beside other intangibles like royalties that is generally sourced from abroad every 5 to 10 years depending on wear and tear (or expiration of royalty rights);
• The inland cold chain functions relatively well, especially since refrigerated trucking service providers exist in the country and are used extensively by exporters;
• Most cut flower/rose producers sell their output through Dutch auctions, and only a limited number of firms sell a part of their production through other auctions or directly to supermarkets;
• Very few rose exporters have developed their own marketing or partnerships arrangements in export markets;
• The bulk of costs along the rose farm-to-market value chain are associated with air freight costs to destination markets and the handling/marketing fees and commissions in the end markets; and
• Service providers of export cargo consolidation exist in Ethiopia and are used extensively by exporters.
In general, the supply chain for cut flowers in Ethiopia is moving in the right direction. With 8 - 12 harvest cycles per year, rose producers need to reach their markets in timely fashion every few weeks. Time-to-market is especially critical during peak holiday 12 All supply and value chain discussions throughout the three cases studies are in relation to firms that engage in exports. The functioning of the supply chain of firms that cut flowers (and garments) in the local market is not the object of these case studies.

Towards a Globally Competitive Ethiopian Economy: The Role of Services and Urbanization. Case Studies – Rose and Polo Shirt Value Chains
Global Development Solutions, LLC 2/18/2011 53
seasons in the consumer market. In general the current supply chain enables them to compete internationally. Figure 4: Cut Flowers (Rose) Supply Chain, from Ethiopia to Dutch Auctions
Rolling Stock
10-21 days
Continuous cycle 30-45 days
Rose Farming & Post Harvest Handling (0% AA)
(100% outside AA; mean distance from AA: 88 km)
Local and Imported Fertilizer
Local and Imported
Chemicals
Local and Imported Seedlings
Freight ForwardingService Providers
100% AA 0% outside AA
Local and Imported
Packaging
Trucking Service Providers
79% AA 21% outside AA
$0.05/Stem
Handling/Transport to Addis Ababa Airport
Boxes with dashed - - - lines illustrate the missing and/or weak supply chain service providers GAPC - Guaranteed auction participation commission paid to rose exporter/auction participant * Only for illustration – prices in auctions are extremely volatile.
Cut Flowers R&D/Breed Developers
Specialized Input Import Traders/
Agents
Auctions* Price/Stem: US$0.25*
US$/Stem 1. GAPC: $0.03 2. Auction Price Profit: $0.02 Total Gross Profit: $0,05
Cost: US$0.23/Stem
$0.001/Stem
$0.08/Stem
$0.004/Stem
4 days Handling/Air Freight to Dutch Auction
Global Development Solutions, LLC
Continuous
$0.10/Stem
$0.05/Stem
Few Hours
Handling/Marketing/Auction Commissions, Dutch Auction

Towards a Globally Competitive Ethiopian Economy: The Role of Services and Urbanization. Case Studies – Rose and Polo Shirt Value Chains
Global Development Solutions, LLC 2/18/2011 54
The role of services in firms’ supply and value chains are discussed in more detail in the sections below.13 2. Role of Services in the Import of Inputs – Value Chain for Cut Flowers (Roses) The main inputs used in rose farming and post-harvest handling operations are fertilizers, chemicals, and packaging materials. Rose exporters generally use the services of two and up to five local suppliers of these inputs. Sometimes they also import portions of these inputs directly. Even though the inbound/import logistics for fertilizers and other inputs is just as time consuming and burdensome as the logistics of importing inputs needed in the garment industry, rose exporters do not report any major concerns in relation to the flow of inputs to their farms. This is mainly because the required imported inputs are a fixed set of commodity-type inputs which can be stocked in a warehouse if necessary as a way to overcome the slow movement of inputs across borders in Ethiopia. Since most inputs can be readily purchased from local traders, rose exporter can generally minimize carrying-costs associated with buffer stock. As can be seen from the table below, with an average sales price of US$0.25/rose stem, the transport, handling and other logistics cost are estimated to be less than 1% of the sales price of an exported rose stem (or US$0.01 per stem) – see table below.14 Table 38: Cost of Services in the Ethiopian Export Roses, 2010 Sales Price Per Rose Stem* 0.252$ % ShareTotal Cost of Services 0.168$ 66.7% Input Transport and Handling Charges** 0.001$ 0.4% Production Related Services 0.017$ 6.8% Rose Export Related Services 0.150$ 59.6%Gross Profits 0.022$ 8.8%* C&F Dutch Auction ** Excludes sea freight from import source to Djibouti Global Development Solutions, LLC In terms of contrasting the cost of transporting and handling of inputs against the cost of inputs (see table below), interviews suggest that the cost of all imported inputs (excluding royalty fees) for a delivered rose stem is roughly US$0.05 per stem, and freight and handling charges associated with input imports constitute 2.3% of input costs.15 In this context, freight and handling services related to input imports, as far as cost is concerned, do not present a competitiveness bottleneck for rose/cut flower exports from Ethiopia. As can be seen from the table below, the cost of inputs needed for producing a rose stem are very low compared to the costs associated with rose exporting stages of the value chain and the cost of rose export related services (ex: rose export related services
13 The case study discusses mainly the functioning of the most prevalent cut flower (rose) supply chain organization in Ethiopia: soil grown highland flowers (roses) destined to auctions in Netherlands/Europe. 14 Due to high variation of prices of both exported roses depending on season/variety/auction and of inputs and related transport, reported prices and costs are a rough indicative prices as of December 2010 timeframe only. 15 Input prices/costs, especially fertilizers, fluctuate widely and the proportion of freight and handling charges in the total cost of inputs is indicative as of December 2010.
Towards a Globally Competitive Ethiopian Economy: The Role of Services and Urbanization. Case Studies – Rose and Polo Shirt Value Chains
Global Development Solutions, LLC 2/18/2011 55
(US$0.15/stem) are roughly three times higher than the cost of inputs needed to produce a rose stem (US$0.05/stem)). Table 39: Cost of Input Import Related Services, Share in Rose Production Input Costs, 2010 Cost of Inputs in a Rose Stem* 0.045$ % ShareTotal Cost of Services 0.168$ 373.0% Input Transport and Handling Charges** 0.001$ 2.3% Production Related Services 0.017$ 37.8% Rose Export Related Services 0.150$ 332.9%* C&F Dutch Auction ** Excludes sea freight from import source to Djibouti Global Development Solutions, LLC As far as import and processing time and related procedures are concerned, the process of importing inputs used in rose farming is characterized by the same poor across border trading discussed in Case Study 1 for garment exporters; the most notable indicator being the long delays caused by official procedures. In the case of rose/cut flower exporters, however, long delays and lengthy procedures for input imports do not cause major competitiveness bottlenecks because the required inputs are not order specific and can be stockpiled; and specialized agents trading in these inputs exist in the local market. In other words, the same set of fertilizers, chemicals, packaging materials, etc is used on a continuous basis. Thus rose/cut flower exporters, unlike garment exporters, can mitigate the lengthy input import process by either maintaining buffer stocks when importing directly or acquire these inputs readily in the market via local traders. 3. Role of Services in Production – Cut Flowers Value Chain (Roses) Once inputs reach a rose farm, the rose/cut flower production value chain goes through three major stages: rose farming, post-harvest handling, and marketing and delivery to market. Rose farms, depending on variety, type of farming, and altitude, generally have 8-12 harvest cycles per year. Post-harvest handling and transport to export markets are therefore a function of matching harvest cycles with optimal timing of the demand for roses in international markets. Rose Breeders’ Royalties – The Dominant Rose Production Service Cost: As can be seen from the table below, royalty fees associated with different rose varieties is the most significant cost associated with service provisioning during the farming and post-harvest handling of roses.16 When all costs associated with farming and post-harvest handling stages of rose production are considered, the cost of royalty payments to international breeders (US$0.012/stem) constitutes 21% of the ex-farm rose production costs (US$0.08/stem); i.e. excluding all post-farm freight and marketing costs for delivering roses to the export market.
16 The role of utilities and other services in the production of roses is minimal and is left out of the discussion in this case study.
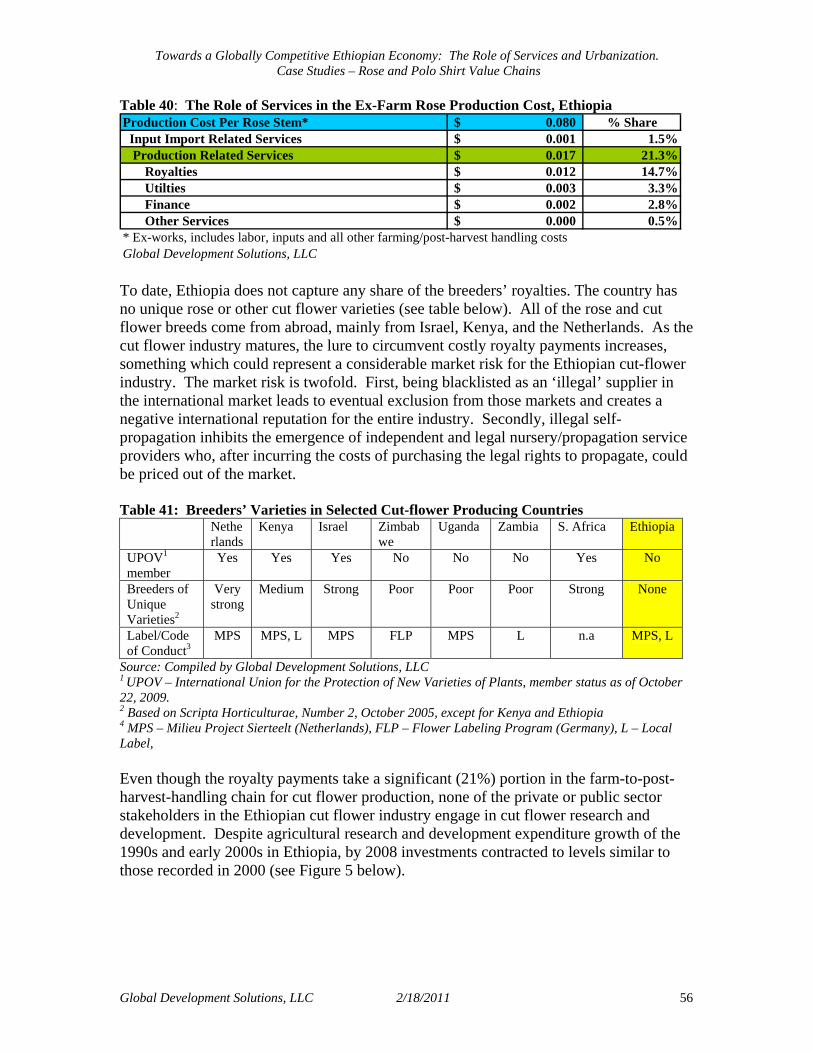
Towards a Globally Competitive Ethiopian Economy: The Role of Services and Urbanization. Case Studies – Rose and Polo Shirt Value Chains
Global Development Solutions, LLC 2/18/2011 56
Table 40: The Role of Services in the Ex-Farm Rose Production Cost, Ethiopia Production Cost Per Rose Stem* 0.080$ % Share Input Import Related Services 0.001$ 1.5% Production Related Services 0.017$ 21.3%
Royalties 0.012$ 14.7%Utilties 0.003$ 3.3%Finance 0.002$ 2.8%Other Services 0.000$ 0.5%
* Ex-works, includes labor, inputs and all other farming/post-harvest handling costsGlobal Development Solutions, LLC To date, Ethiopia does not capture any share of the breeders’ royalties. The country has no unique rose or other cut flower varieties (see table below). All of the rose and cut flower breeds come from abroad, mainly from Israel, Kenya, and the Netherlands. As the cut flower industry matures, the lure to circumvent costly royalty payments increases, something which could represent a considerable market risk for the Ethiopian cut-flower industry. The market risk is twofold. First, being blacklisted as an ‘illegal’ supplier in the international market leads to eventual exclusion from those markets and creates a negative international reputation for the entire industry. Secondly, illegal self-propagation inhibits the emergence of independent and legal nursery/propagation service providers who, after incurring the costs of purchasing the legal rights to propagate, could be priced out of the market. Table 41: Breeders’ Varieties in Selected Cut-flower Producing Countries
Netherlands
Kenya Israel Zimbabwe
Uganda Zambia S. Africa Ethiopia
UPOV1 member
Yes Yes Yes No No No Yes No
Breeders of Unique Varieties2
Very strong
Medium Strong Poor Poor Poor Strong None
Label/Code of Conduct3
MPS MPS, L MPS FLP MPS L n.a MPS, L
Source: Compiled by Global Development Solutions, LLC 1 UPOV – International Union for the Protection of New Varieties of Plants, member status as of October 22, 2009. 2 Based on Scripta Horticulturae, Number 2, October 2005, except for Kenya and Ethiopia 4 MPS – Milieu Project Sierteelt (Netherlands), FLP – Flower Labeling Program (Germany), L – Local Label, Even though the royalty payments take a significant (21%) portion in the farm-to-post-harvest-handling chain for cut flower production, none of the private or public sector stakeholders in the Ethiopian cut flower industry engage in cut flower research and development. Despite agricultural research and development expenditure growth of the 1990s and early 2000s in Ethiopia, by 2008 investments contracted to levels similar to those recorded in 2000 (see Figure 5 below).

Towards a Globally Competitive Ethiopian Economy: The Role of Services and Urbanization. Case Studies – Rose and Polo Shirt Value Chains
Global Development Solutions, LLC 2/18/2011 57
Figure 5: Agricultural R&D Spending, Ethiopia, 1993-2008
Source: ASTI, 2010 The 2008 agricultural intensity ratio of $0.27 is one of the lowest ratios in the region, and funding remains highly dependent on donor loans and grants. and the long term agricultural research intensity in general (total spending as a percent of agricultural output) in Ethiopia is one of the lowest in the world. In terms of agricultural research intensity ratio, or total public spending on agricultural R&D as a percentage of every US$100 of agricultural output agricultural GDP, Ethiopia performs poorly. While this ratio rose sharply after 2000 (reaching $0.65 in 2002), this level was still comparatively low. Moreover, the ratio had returned to 2000 levels (US$0.27) which is very low compared with other countries, such as Kenya and Tanzania whose ratios that year were $1.43 and $0.50 respectively.17 Within the context of weak research intensity in the overall agriculture sector, the R&D specific to the cut-flower sector is also weak. According to ASTI survey, crops like wheat, vegetables, and maize attract over 40% of total crop researcher’s time, while sorghum, coffee and potatoes attract another 20% of research time. Among the remaining 40% of the researchers, no specific research on cut-flowers is undertaken. In this context, without combined efforts from GOE and the industry towards cut-flower R&D in the country, it is unlikely that service providers of rose or other cut flower varieties will emerge in the near future. Thus a significant portion of farming value added from royalty varieties is likely to continue to be captured outside Ethiopia. 4. Role of Services in Exports – Cut Flowers Value Chain (Roses) Ethiopian cut flower exporters typically export their roses and other cut flowers to flower auctions in Europe on a C&F basis. Selling through this channel has some disadvantages in that prices can be volatile at the auction. Nevertheless, selling through an auction has 17 ASTI

Towards a Globally Competitive Ethiopian Economy: The Role of Services and Urbanization. Case Studies – Rose and Polo Shirt Value Chains
Global Development Solutions, LLC 2/18/2011 58
many advantages because large volumes of roses can be sold and there is a guaranteed commission that auction participants (flower exporters) receive for marketing their flowers through the auction. As the table below indicates, for a sales price of US$0.25 per rose stem in a Dutch auction, services related to flower exports constitute almost 60% (US$0.15), of which:
• Airfreight and handling services to the auction accounts for the largest share (64%) of the cost (US$0.1/stem);
• Marketing and handling fees and commissions at the auction are the second most costly export related service (33%); and
• Inland handling and transport of flowers using refrigerated trucks from farms to Addis Ababa Airport is the third largest export service (2%).
Table 42: The Role of Export Services in Cut Flower Export Price, Ethiopia
Sales Price Per Rose Stem* 0.252$ % Share Of Export Price
Total Cost of Services 0.168$ 66.8% Input Import Related Services 0.001$ Production Related Services 0.017$
Rose Export Related Services 0.150$ 59.6%% Share of
Exp. ServicesInland Transport and Handling, Addis Ababa Airport 0.004$ 1.5% 2%Airfreight and Handling to Destination 0.097$ 38.3% 64%Marketing/Handling Fees and Commissions, Export Market 0.050$ 19.8% 33%* C&F Dutch Auction Global Development Solutions, LLC Export Airfreight and Handling Services: Cargo airfreight in Ethiopia has seen major developments in recent years. In 2005, when the cut flower industry in Ethiopia was in its initial growth stage, the number of airlines providing dedicated cargo or passenger cargo space and services was very limited. Airlines dominating the routes from Addis Ababa to Europe, for example KLM, charged excessive prices for their airfreight services. Today, as the cut flower industry has grown in size and is increasing its demand for airfreight services, both Ethiopian Airlines and foreign airlines such as Etihad, Egypt Air, etc, are stepping up their airfreight service. By and large, the competition among airlines is growing to capturing a share of the cargo airfreight demand from the rapidly growing cut flowers industry, and prices offered to the industry are increasingly more competitive (see table below). Table 43: Airfreight Cargo Fees. Addis Ababa - Europe
Type of Service Vehicle Type US$/KgChartered Airplane B-747 1.78$ Chartered Airplane MD 1.86$ Chartered Airplane Air Bus 1.70$ Inland transport Refrigerated truck 0.02$ Global Development Solutions, LLC

Towards a Globally Competitive Ethiopian Economy: The Role of Services and Urbanization. Case Studies – Rose and Polo Shirt Value Chains
Global Development Solutions, LLC 2/18/2011 59
The export airfreight handling of bulk cut flowers is provided by Tradepath International, a private business company involved in air cargo representation, logistics, import & export, and custom clearing. Currently, the company represents 8 airlines including Ethiopian, Etihad, and Egypt airlines. Tradepath covers about 70% of all flower exports from Ethiopia, while two other smaller service providers cover the remaining 30% of the market. The two service providers include:
• Ethiopian Horticulture Producer Exporters Association; and • Ethiopian Horticultural Cooperatives.
The company is IATA (Air Transport Association) certified and hence can represent airlines worldwide. For Tradepath to represent airlines, it is required to pay a deposit to each airline. This amount varies from airline-to-airline. Ethiopian Airlines, for example, requires about US$12,000 while the foreign airlines require up to US$50,000 (see table below). Tradepath has long-term commitments with the airlines it represents for the transport of perishable goods, mainly cut flowers. Accordingly, Ethiopian Airlines makes six chartered flights per week, ETIHAD makes one chartered flight, and Egypt Air makes one chartered flight per week as per their respective agreement. Table 44: Airlines Represented by Tradepath International PLC
Air Line Deposit Required for Representation
Type Capacity (tons) NumberB-747 100 4ME 80 2
ETHIAD 300 Dash 45 1 $50,000Egypt Air 300 Dash 45 1 $50,000Global Development Solutions, LLC
Dedicated Airplane
$12,121Ethiopian
Flower exporters can acquire the services of an airfreight carrier by giving a notice of 72 hours before the scheduled cargo departure. The service rendered to the customers by the company is twofold: (1) booking of shipment; and (2) handling – (see figure below for export airfreight handling map).

Towards a Globally Competitive Ethiopian Economy: The Role of Services and Urbanization. Case Studies – Rose and Polo Shirt Value Chains
Global Development Solutions, LLC 2/18/2011 60
Figure 6: Export Airfreight Map for Cut Flowers, Ethiopia Global Development Solutions, LLC Shipment booking: Booking is the arrangement of space (reservation) for a cargo for the product to be exported. The booking for a consignment or a cargo can be arranged by a phone call. The airfreight company has two types of customers: customers with annual commitment that are charged a fixed amount for tonnage of consignment per week; and ‘walk-in’ customers who require cargo service from time-to-time. In all cases, a notice 72 hours prior to departure of the scheduled cargo is required (see handling process and time in the table below). However, the committed customers can deliver their products to the airport 6 hours prior to departure time without any additional charge. The charges for the ’walk-in’ customers are 100% if the notice is delivered in less than 12 hours prior to departure.
Ethio Hortishare or Coops
FlowerProducer
Bulk Space with Airlines Confirm space with exporter Confirm to FF if exporter is eligible (member) to acquire cargo space/book with airline if going through Agent/Forwarder
Trucking
Airline
Ministry of Agriculture
Phytosanitary Inspection
Customs Department
Inspection PSI Seal Truck Customs Entry
Ethiopian Civil Aviation Authority
Port Charges TradePath PLC
Booking with Airlines Airway Bill Palletize Load to Airplane
Airway Bill Eur 1 Customs Declaration
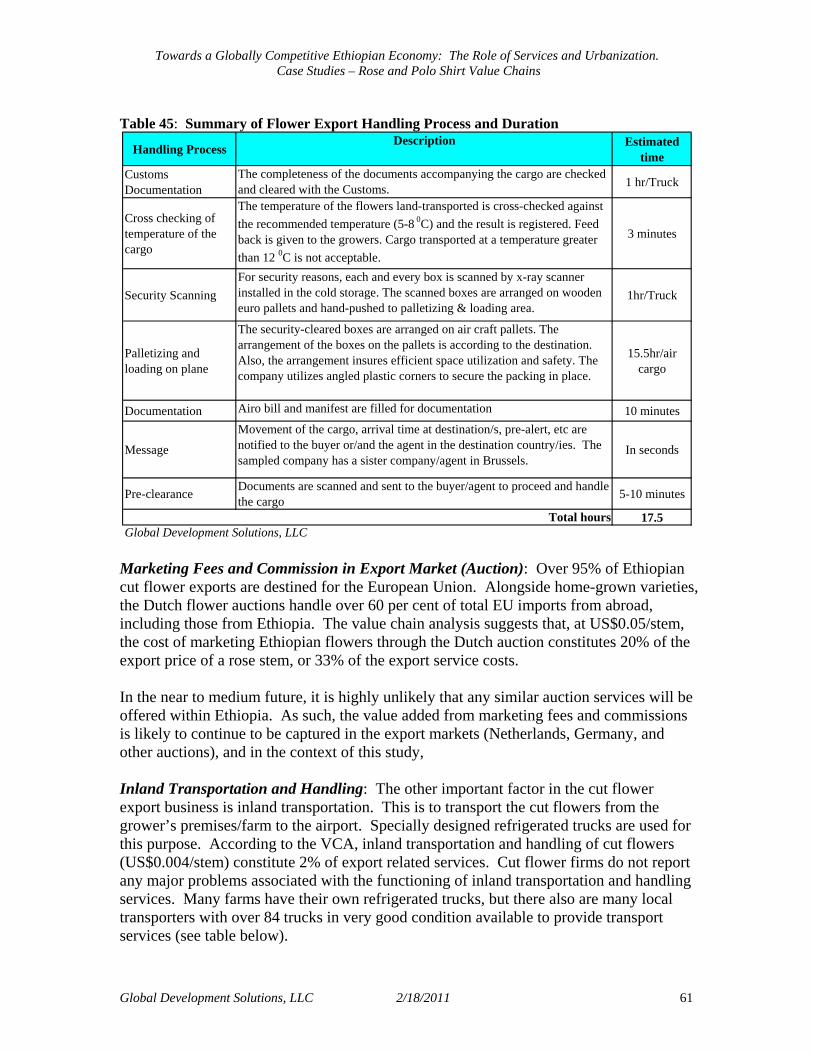
Towards a Globally Competitive Ethiopian Economy: The Role of Services and Urbanization. Case Studies – Rose and Polo Shirt Value Chains
Global Development Solutions, LLC 2/18/2011 61
Table 45: Summary of Flower Export Handling Process and Duration
Handling ProcessDescription Estimated
timeCustoms Documentation
The completeness of the documents accompanying the cargo are checked and cleared with the Customs. 1 hr/Truck
Cross checking of temperature of the cargo
The temperature of the flowers land-transported is cross-checked against the recommended temperature (5-8 0C) and the result is registered. Feed back is given to the growers. Cargo transported at a temperature greater than 12 0C is not acceptable.
3 minutes
Security Scanning For security reasons, each and every box is scanned by x-ray scanner installed in the cold storage. The scanned boxes are arranged on wooden euro pallets and hand-pushed to palletizing & loading area.
1hr/Truck
Palletizing and loading on plane
The security-cleared boxes are arranged on air craft pallets. The arrangement of the boxes on the pallets is according to the destination. Also, the arrangement insures efficient space utilization and safety. The company utilizes angled plastic corners to secure the packing in place.
15.5hr/air cargo
Documentation Airo bill and manifest are filled for documentation 10 minutes
Message
Movement of the cargo, arrival time at destination/s, pre-alert, etc are notified to the buyer or/and the agent in the destination country/ies. The sampled company has a sister company/agent in Brussels.
In seconds
Pre-clearance Documents are scanned and sent to the buyer/agent to proceed and handle the cargo 5-10 minutes
17.5Total hoursGlobal Development Solutions, LLC
Marketing Fees and Commission in Export Market (Auction): Over 95% of Ethiopian cut flower exports are destined for the European Union. Alongside home-grown varieties, the Dutch flower auctions handle over 60 per cent of total EU imports from abroad, including those from Ethiopia. The value chain analysis suggests that, at US$0.05/stem, the cost of marketing Ethiopian flowers through the Dutch auction constitutes 20% of the export price of a rose stem, or 33% of the export service costs. In the near to medium future, it is highly unlikely that any similar auction services will be offered within Ethiopia. As such, the value added from marketing fees and commissions is likely to continue to be captured in the export markets (Netherlands, Germany, and other auctions), and in the context of this study, Inland Transportation and Handling: The other important factor in the cut flower export business is inland transportation. This is to transport the cut flowers from the grower’s premises/farm to the airport. Specially designed refrigerated trucks are used for this purpose. According to the VCA, inland transportation and handling of cut flowers (US$0.004/stem) constitute 2% of export related services. Cut flower firms do not report any major problems associated with the functioning of inland transportation and handling services. Many farms have their own refrigerated trucks, but there also are many local transporters with over 84 trucks in very good condition available to provide transport services (see table below).
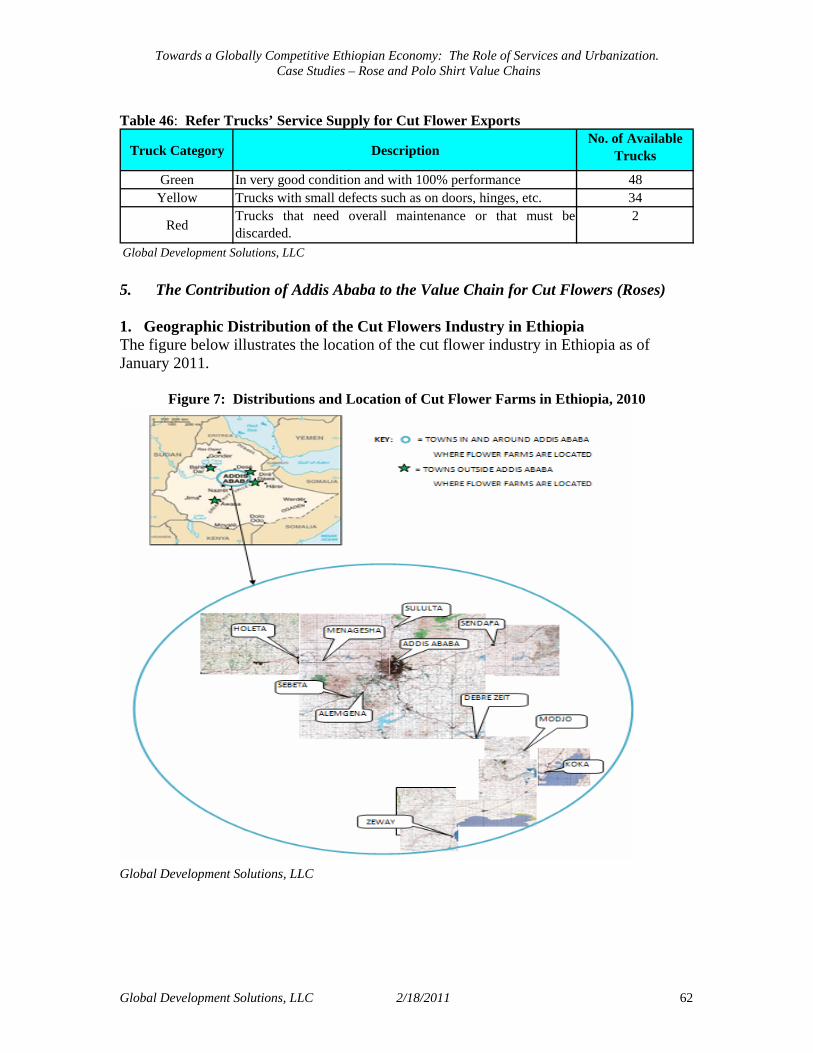
Towards a Globally Competitive Ethiopian Economy: The Role of Services and Urbanization. Case Studies – Rose and Polo Shirt Value Chains
Global Development Solutions, LLC 2/18/2011 62
Table 46: Refer Trucks’ Service Supply for Cut Flower Exports
Truck Category DescriptionNo. of Available
Trucks
Green In very good condition and with 100% performance 48Yellow Trucks with small defects such as on doors, hinges, etc. 34
RedTrucks that need overall maintenance or that must bediscarded.
2
Global Development Solutions, LLC 5. The Contribution of Addis Ababa to the Value Chain for Cut Flowers (Roses) 1. Geographic Distribution of the Cut Flowers Industry in Ethiopia The figure below illustrates the location of the cut flower industry in Ethiopia as of January 2011.
Figure 7: Distributions and Location of Cut Flower Farms in Ethiopia, 2010
Global Development Solutions, LLC
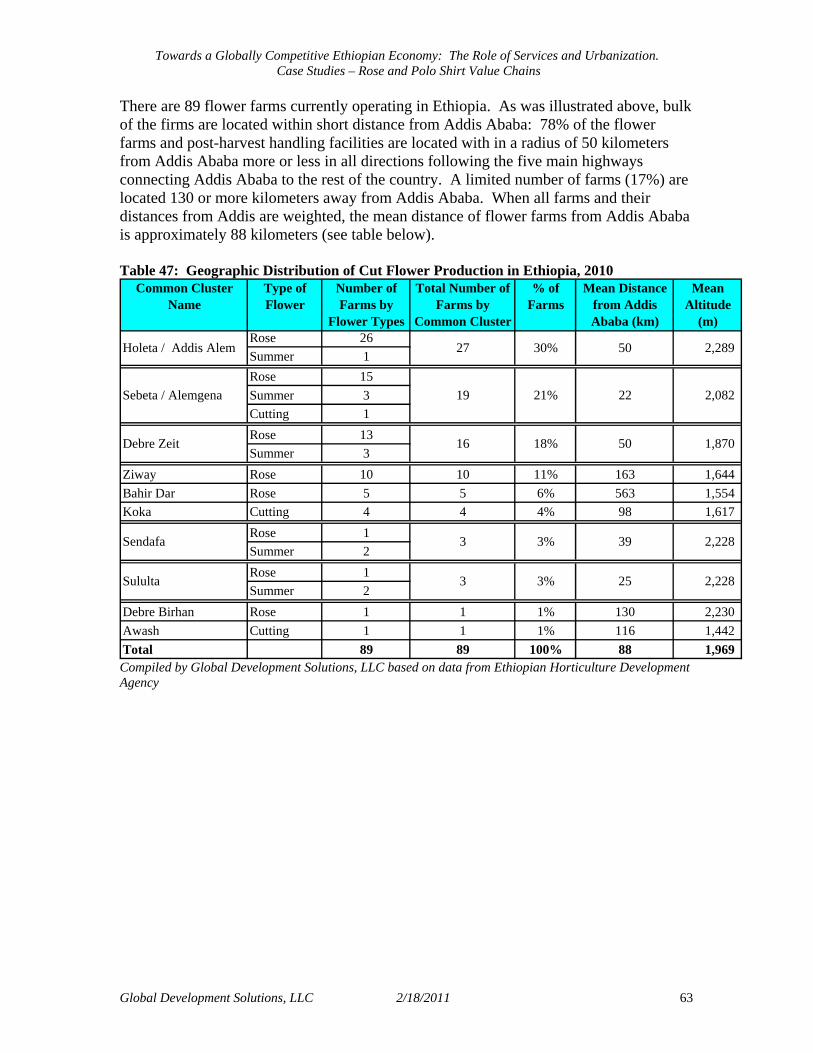
Towards a Globally Competitive Ethiopian Economy: The Role of Services and Urbanization. Case Studies – Rose and Polo Shirt Value Chains
Global Development Solutions, LLC 2/18/2011 63
There are 89 flower farms currently operating in Ethiopia. As was illustrated above, bulk of the firms are located within short distance from Addis Ababa: 78% of the flower farms and post-harvest handling facilities are located with in a radius of 50 kilometers from Addis Ababa more or less in all directions following the five main highways connecting Addis Ababa to the rest of the country. A limited number of farms (17%) are located 130 or more kilometers away from Addis Ababa. When all farms and their distances from Addis are weighted, the mean distance of flower farms from Addis Ababa is approximately 88 kilometers (see table below). Table 47: Geographic Distribution of Cut Flower Production in Ethiopia, 2010
Common Cluster Name
Type of Flower
Number of Farms by
Flower Types
Total Number of Farms by
Common Cluster
% of Farms
Mean Distance from Addis Ababa (km)
Mean Altitude
(m)Rose 26Summer 1Rose 15Summer 3Cutting 1Rose 13Summer 3
Ziway Rose 10 10 11% 163 1,644 Bahir Dar Rose 5 5 6% 563 1,554 Koka Cutting 4 4 4% 98 1,617
Rose 1Summer 2Rose 1Summer 2
Debre Birhan Rose 1 1 1% 130 2,230 Awash Cutting 1 1 1% 116 1,442 Total 89 89 100% 88 1,969
Sendafa 39 2,228
Sululta 25
3
3
3%
3% 2,228
Holeta / Addis Alem 50 2,289 27 30%
Debre Zeit 50 1,870
Sebeta / Alemgena 22 2,082
16
19
18%
21%
Compiled by Global Development Solutions, LLC based on data from Ethiopian Horticulture Development Agency
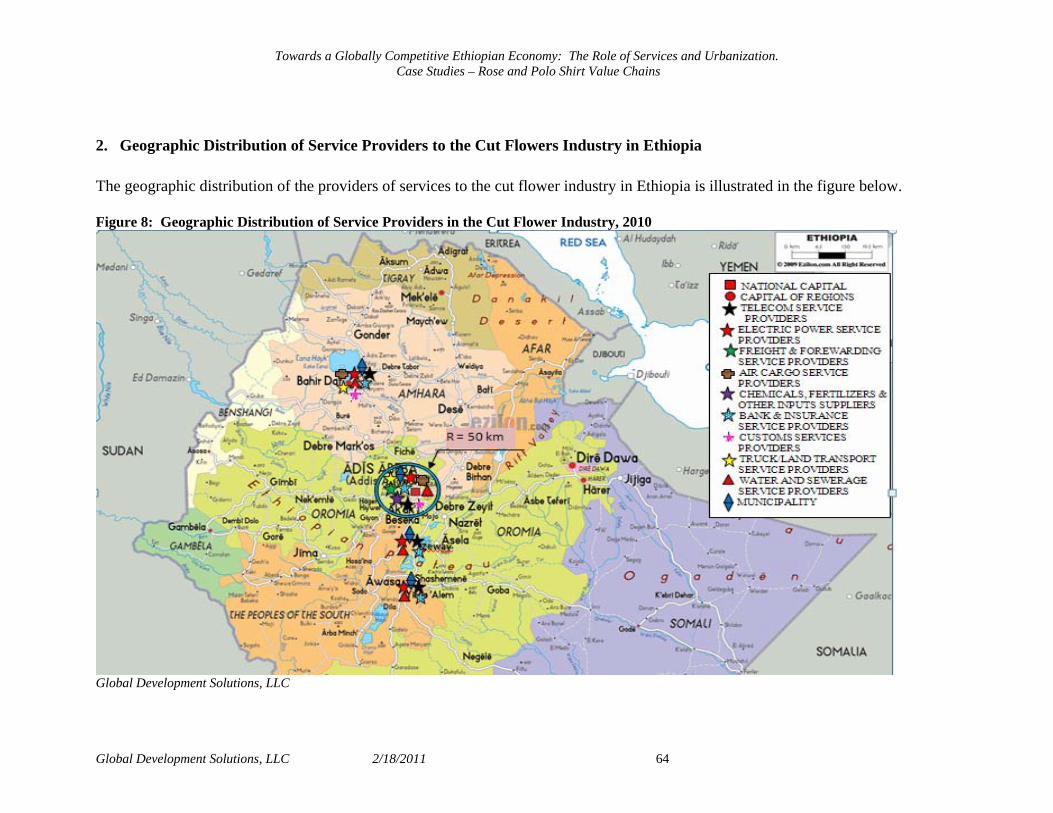
Towards a Globally Competitive Ethiopian Economy: The Role of Services and Urbanization. Case Studies – Rose and Polo Shirt Value Chains
Global Development Solutions, LLC 2/18/2011 64
2. Geographic Distribution of Service Providers to the Cut Flowers Industry in Ethiopia The geographic distribution of the providers of services to the cut flower industry in Ethiopia is illustrated in the figure below. Figure 8: Geographic Distribution of Service Providers in the Cut Flower Industry, 2010
Global Development Solutions, LLC

Towards a Globally Competitive Ethiopian Economy: The Role of Services and Urbanization. Case Studies – Rose and Polo Shirt Value Chains
Global Development Solutions, LLC 2/18/2011 65
As illustrated above, all services for cut flower are rendered from Addis Ababa except for infrastructural services such as water and power supply, telecommunications and to some extent also banking services. The provision of cold chain service and air transport for export necessitate that service providers for cut flowers concentrate around Addis Ababa and it the same is true in Bahr Dar. The list of the service providers, the type of services provided, location and distance from Addis Ababa including some remarks on the service providers are illustrated in the table below. Table 48: Geographic Distribution of Service Providers for the Cut Flower Industry
Service Provider Type Service Provider Location
Distance from Addis Ababa (km)
Remark
Inputs Agrisher Golden Rose BASF AZRUM Hortishare BABA Trading (only generic products)
Chemical & Fertilizer Suppliers
OMNI
Addis Ababa _
Inputs imported mostly from: South Africa, Holland, Norway, Israel, France, Germany, India and China.
Agrisher Addis Ababa _ Rubber Band Suppliers Private shops in Merkato Addis Ababa _
Merkato is the largest market place in Ethiopia.
Plastic Sleeves and Film Imported directly by the respective companies
Minaye Packaging Alemgena 20 Golden Rose Shiv (Ethiopia Meadows)
Addis Ababa _
Packaging
Seventh Hill Debre Zeit 50 Freight and Handling
Sher Ethiopia
Herberg
Addis Ababa _
Minaye Alemgena 20 Ziway AQ
Ziway 163
Lafto Addis Ababa _
These companies provide cold-chain transport services
Tans Transport
East-West Transport
Truck and Land Transport
Get-Us Transport
Addis Ababa _ +/- 200 trucking companies (most prominent ones listed)

Towards a Globally Competitive Ethiopian Economy: The Role of Services and Urbanization. Case Studies – Rose and Polo Shirt Value Chains
Global Development Solutions, LLC 2/18/2011 66
Commet Transport Bekelcha Transport Tikur Abay Hortishare Flower Port Ethiopian Horticultural Cooperatives Ethiopian Horticulture Producer Exporters Association
Addis Ababa _
These companies take 30% of the forwarding business in cut flower export
Ethiopian Air Lines KLM Turkish Airways Egypt Air Lines ETHAD
Emirates
Addis Ababa _
Represented by Tradepath International PLC. These air freight companies handle 70% of the forwarding business in cut flower export.
Maritime & Transit Service Enterprise Express Transit Service Packtra transit service Macfa Transit Service Dolphin Transit Service Green Transit Service
Freight & Forwarding
TegegneWork Transit Service
Addis Ababa _
These are the major maritime and transit services providers among the more than 150 similar companies operating in the country.
Utility and Other Support Services
Electricity Ethiopia Electric Power Corporation Addis Ababa _
State-owned monopoly distributor
Water & Sewerage Service
Water from Addis Ababa Water and Sewerage Authority (AAWSSA) and also owned well waters in individual farms, sewerage services by AAWSSA and private operators for sludge disposal.
Addis Ababa _
In other townships the municipalities provide water and sewerage services.
Telecommunications Ethiopia Telecommunication Corporation
Addis Ababa _ State-owned monopoly
Commercial Bank of Ethiopia Development Bank of Ethiopia Construction and Business Bank Awash Bank
Banking
Dashen Bank
All have HQs in Addis Ababa with regional
branch/ distribution networks
_

Towards a Globally Competitive Ethiopian Economy: The Role of Services and Urbanization. Case Studies – Rose and Polo Shirt Value Chains
Global Development Solutions, LLC 2/18/2011 67
Abyssinia Bank Wogagen Bank United Bank Wogagen Bank Nib International Bank Cooperative Bank of Oromia Lion Bank Aemen Bank Oromia International Bank Buna International Bank Berhan International Bank Abay Bank Africa Insurance Awash Insurance Ethiopian Insurance Corporation Global Insurance Lion Insurance Nice Insurance NIB Insurance Nyala Insurance Nile Insurance
Insurance
Unity Insurance
_
At present there are 10 insurance companies which have 40 branches of which more than 50% are located in Addis Ababa.
Customs services Ethiopia Revenue & Customs Authority Addis Ababa _
Provision of land Municipality Addis Ababa _
District (Woreda) administration land departments provide land for investment for licensed investors.
Global Development Solutions, LLC As is the case with the garment sector, the majority of cut flower producers are within a 50-kilometer radius from Addis Ababa (68 of 89 farms); the mean distance of all farms from Addis Ababa is 88 kilometers. All the farms have either head or liaison offices in Addis Ababa in order to access vital services such as airfreight services, customs, banking, export facilitation and communication etc. Service providers to the cut flower industry are also almost exclusively in or around Addis Ababa. For example, it is estimated that 100% of the forwarding and clearing service, and 100% of the refrigerated truck service (except for Bah Dar) and 79% of the trucking service for supply of inputs are obtained from Addis Ababa. In this context, the growth and competitiveness of the cut flower industry in Ethiopia is likely to continue to be determined, for most firms, by the efficiency of Addis Ababa as the logistical nerve center of the industry.
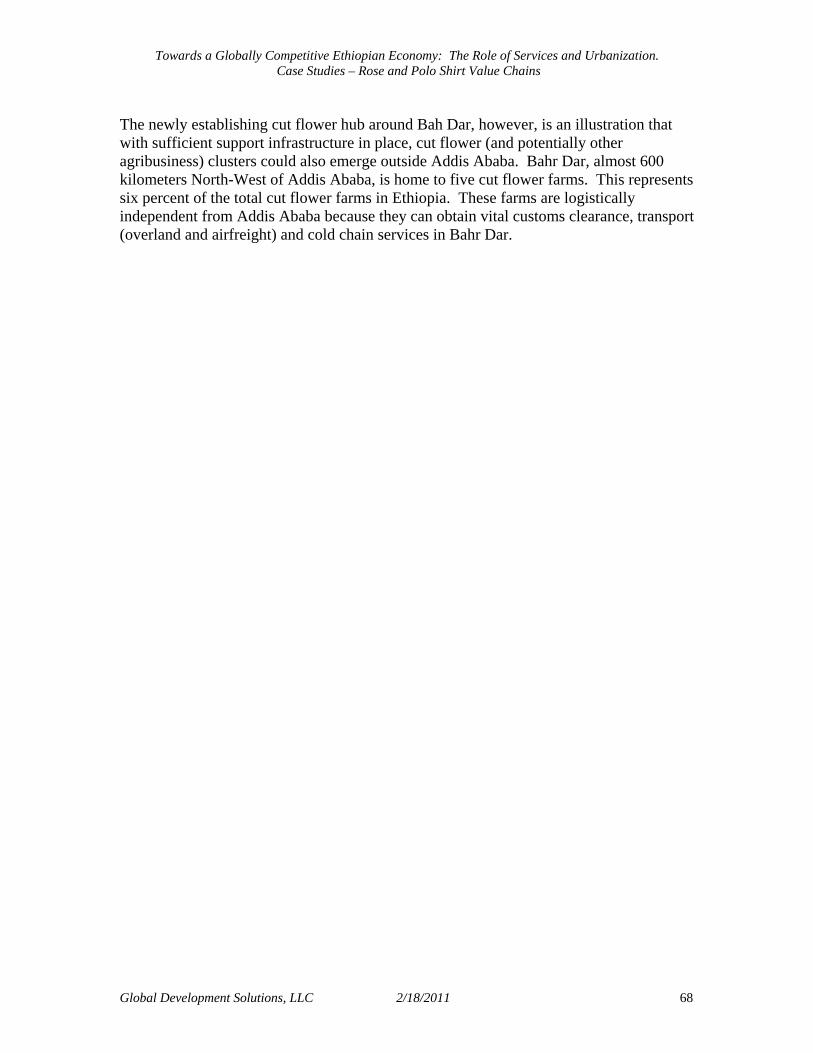
Towards a Globally Competitive Ethiopian Economy: The Role of Services and Urbanization. Case Studies – Rose and Polo Shirt Value Chains
Global Development Solutions, LLC 2/18/2011 68
The newly establishing cut flower hub around Bah Dar, however, is an illustration that with sufficient support infrastructure in place, cut flower (and potentially other agribusiness) clusters could also emerge outside Addis Ababa. Bahr Dar, almost 600 kilometers North-West of Addis Ababa, is home to five cut flower farms. This represents six percent of the total cut flower farms in Ethiopia. These farms are logistically independent from Addis Ababa because they can obtain vital customs clearance, transport (overland and airfreight) and cold chain services in Bahr Dar.

Towards a Globally Competitive Ethiopian Economy: The Role of Services and Urbanization. Case Studies – Rose and Polo Shirt Value Chains
Global Development Solutions, LLC 2/18/2011 69
VI. Conclusions As illustrated by the polo shirt and cut flower supply and value chains, Addis Ababa plays a critical role for the light manufacturing and agribusiness industries in Ethiopia. The vast majority of garment and flower producing firms are located in or around the city. As such, the main question to be addressed is whether Addis Ababa exerts inefficiencies over the services market and whether that damages competitiveness. To illustrate the role of Addis Ababa we examined the value chains for two products: roses and polo shirts. The key findings from these value chains are provided below. Polo Shirts and Light Manufacturing In the case of polo shirts the value chain analysis shows that key service components, namely transport, freight forwarding and insurance, foreign exchange procurement, finance, and customs control are centralized in Addis Ababa. From the Doing Business report Ethiopia is ranked very low especially in access to finance and trading across borders, and both these areas have caused difficulties for polo shirt production. The share of Addis Ababa in production of garments has fallen slightly over the past few years but remains at 82%. The slight reduction in its share arises from a new production unit set up in Bahar Dar in 2006 and Mekele in 2009, neither of which towns are close to transit routes. The location maps show production of garments concentrated in the Addis Ababa area, with small contributions from Bahar Dar, Mekele and Dire Dawa. While production is concentrated in Addis Ababa area, services required by the garment industry are even more concentrated around Addis Ababa. In terms of the value chain for importation 96.2% of freight forwarding and 78.5% of trucking services are provided in Addis Ababa. In addition Addis Ababa is the key center for financing trade which involves not only securing financing but also for securing access to foreign exchange. Services outside Addis Ababa are mainly limited to infrastructural services such as land, water, power supply, and telecommunications. In the case of garments the role of Addis Ababa is thus key both to the location of production (mostly in and around the city) and to the location of the trade facilitation service providers. A key feature of the garment supply chain is that the constraints faced by the export sector are a function of the time delay rather than the actual transaction costs (see table below). In fact the time required to produce a garment is well under half of the overall time lapse between order and delivery. The time delays are likely to be reflected in long order-to-delivery lead times which may result in the loss of orders, especially large volume orders, as well as in the loss or pricing power. Otherwise they may be reflected in the costs of finance tied up for longer periods in the supply process.
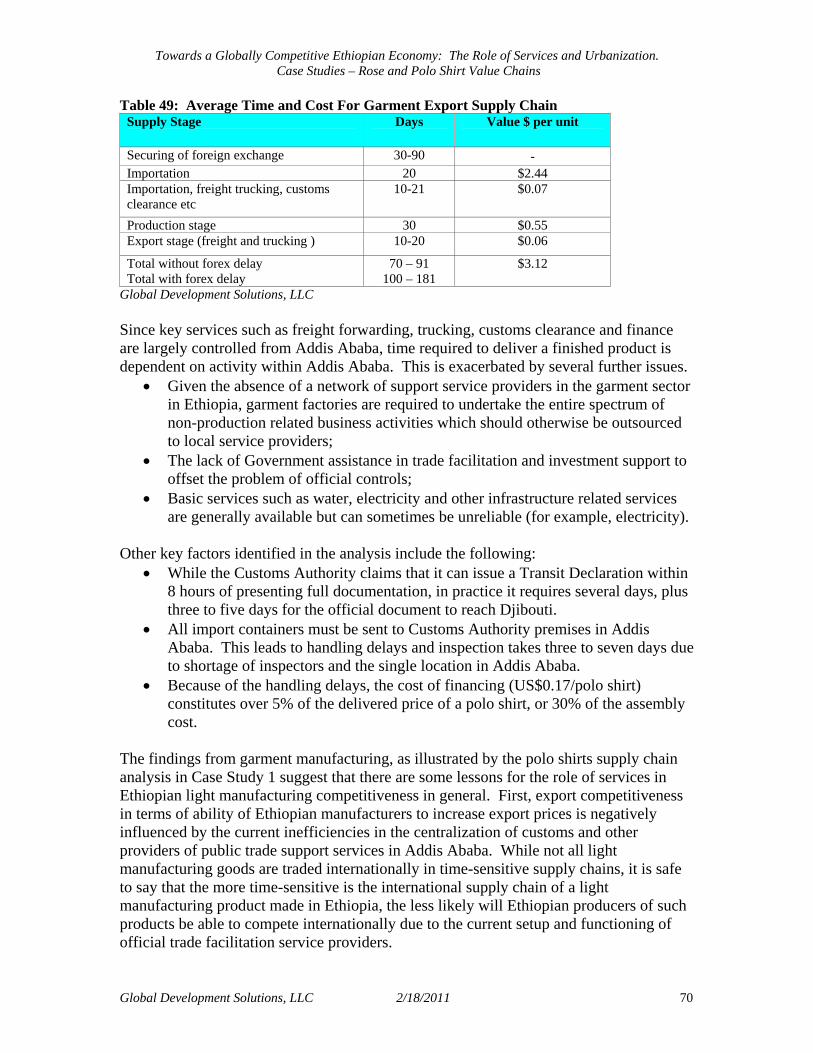
Towards a Globally Competitive Ethiopian Economy: The Role of Services and Urbanization. Case Studies – Rose and Polo Shirt Value Chains
Global Development Solutions, LLC 2/18/2011 70
Table 49: Average Time and Cost For Garment Export Supply Chain Supply Stage
Days Value $ per unit
Securing of foreign exchange 30-90 ‐ Importation 20 $2.44 Importation, freight trucking, customs clearance etc
10-21 $0.07
Production stage 30 $0.55 Export stage (freight and trucking ) 10-20 $0.06 Total without forex delay Total with forex delay
70 – 91 100 – 181
$3.12
Global Development Solutions, LLC Since key services such as freight forwarding, trucking, customs clearance and finance are largely controlled from Addis Ababa, time required to deliver a finished product is dependent on activity within Addis Ababa. This is exacerbated by several further issues.
• Given the absence of a network of support service providers in the garment sector in Ethiopia, garment factories are required to undertake the entire spectrum of non-production related business activities which should otherwise be outsourced to local service providers;
• The lack of Government assistance in trade facilitation and investment support to offset the problem of official controls;
• Basic services such as water, electricity and other infrastructure related services are generally available but can sometimes be unreliable (for example, electricity).
Other key factors identified in the analysis include the following:
• While the Customs Authority claims that it can issue a Transit Declaration within 8 hours of presenting full documentation, in practice it requires several days, plus three to five days for the official document to reach Djibouti.
• All import containers must be sent to Customs Authority premises in Addis Ababa. This leads to handling delays and inspection takes three to seven days due to shortage of inspectors and the single location in Addis Ababa.
• Because of the handling delays, the cost of financing (US$0.17/polo shirt) constitutes over 5% of the delivered price of a polo shirt, or 30% of the assembly cost.
The findings from garment manufacturing, as illustrated by the polo shirts supply chain analysis in Case Study 1 suggest that there are some lessons for the role of services in Ethiopian light manufacturing competitiveness in general. First, export competitiveness in terms of ability of Ethiopian manufacturers to increase export prices is negatively influenced by the current inefficiencies in the centralization of customs and other providers of public trade support services in Addis Ababa. While not all light manufacturing goods are traded internationally in time-sensitive supply chains, it is safe to say that the more time-sensitive is the international supply chain of a light manufacturing product made in Ethiopia, the less likely will Ethiopian producers of such products be able to compete internationally due to the current setup and functioning of official trade facilitation service providers.
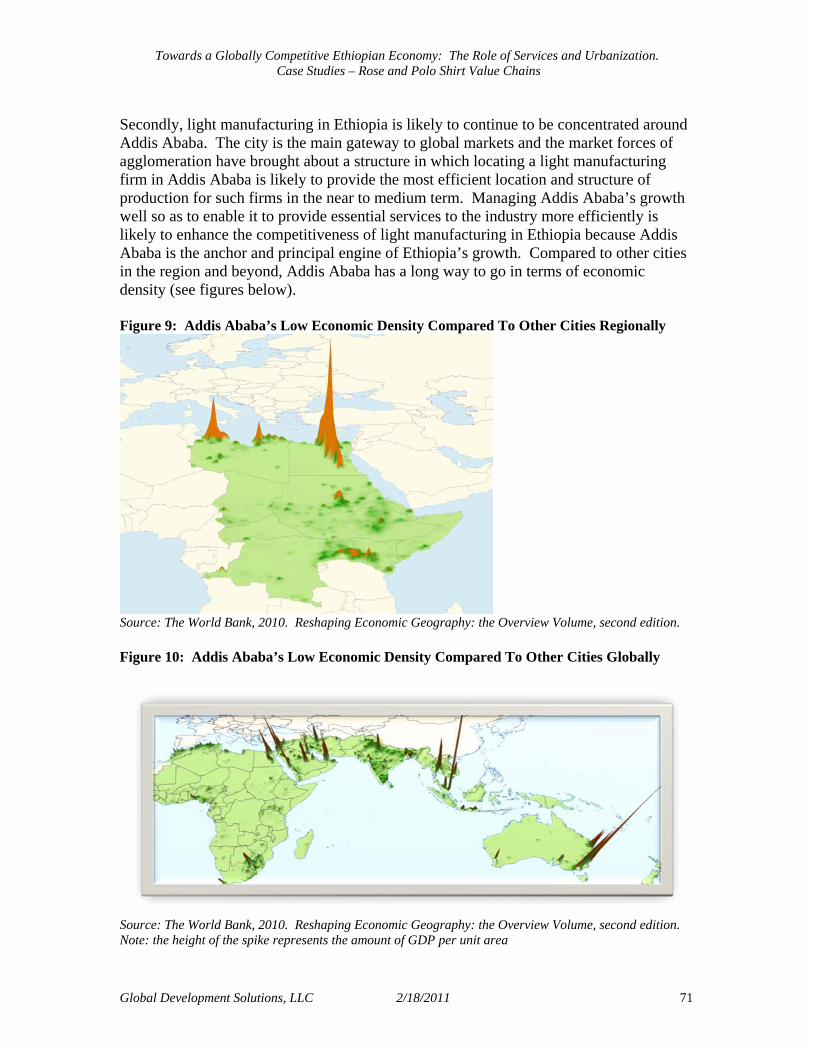
Towards a Globally Competitive Ethiopian Economy: The Role of Services and Urbanization. Case Studies – Rose and Polo Shirt Value Chains
Global Development Solutions, LLC 2/18/2011 71
Secondly, light manufacturing in Ethiopia is likely to continue to be concentrated around Addis Ababa. The city is the main gateway to global markets and the market forces of agglomeration have brought about a structure in which locating a light manufacturing firm in Addis Ababa is likely to provide the most efficient location and structure of production for such firms in the near to medium term. Managing Addis Ababa’s growth well so as to enable it to provide essential services to the industry more efficiently is likely to enhance the competitiveness of light manufacturing in Ethiopia because Addis Ababa is the anchor and principal engine of Ethiopia’s growth. Compared to other cities in the region and beyond, Addis Ababa has a long way to go in terms of economic density (see figures below). Figure 9: Addis Ababa’s Low Economic Density Compared To Other Cities Regionally
Source: The World Bank, 2010. Reshaping Economic Geography: the Overview Volume, second edition. Figure 10: Addis Ababa’s Low Economic Density Compared To Other Cities Globally
Source: The World Bank, 2010. Reshaping Economic Geography: the Overview Volume, second edition. Note: the height of the spike represents the amount of GDP per unit area
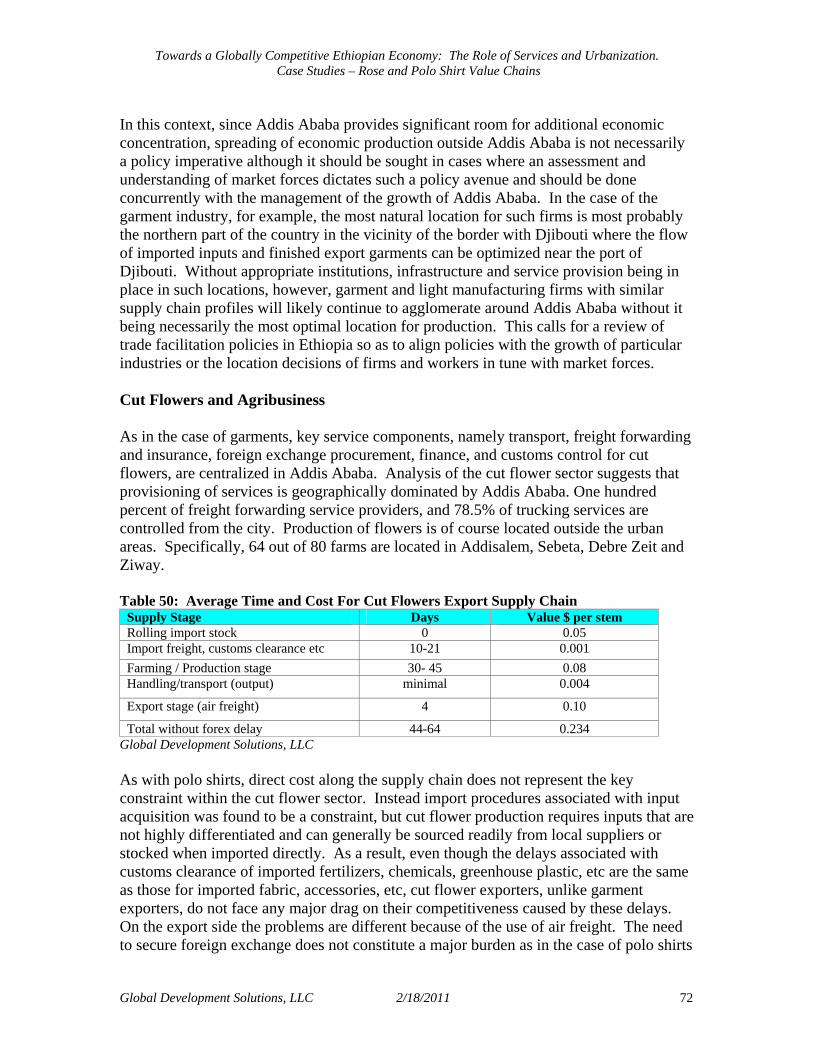
Towards a Globally Competitive Ethiopian Economy: The Role of Services and Urbanization. Case Studies – Rose and Polo Shirt Value Chains
Global Development Solutions, LLC 2/18/2011 72
In this context, since Addis Ababa provides significant room for additional economic concentration, spreading of economic production outside Addis Ababa is not necessarily a policy imperative although it should be sought in cases where an assessment and understanding of market forces dictates such a policy avenue and should be done concurrently with the management of the growth of Addis Ababa. In the case of the garment industry, for example, the most natural location for such firms is most probably the northern part of the country in the vicinity of the border with Djibouti where the flow of imported inputs and finished export garments can be optimized near the port of Djibouti. Without appropriate institutions, infrastructure and service provision being in place in such locations, however, garment and light manufacturing firms with similar supply chain profiles will likely continue to agglomerate around Addis Ababa without it being necessarily the most optimal location for production. This calls for a review of trade facilitation policies in Ethiopia so as to align policies with the growth of particular industries or the location decisions of firms and workers in tune with market forces. Cut Flowers and Agribusiness As in the case of garments, key service components, namely transport, freight forwarding and insurance, foreign exchange procurement, finance, and customs control for cut flowers, are centralized in Addis Ababa. Analysis of the cut flower sector suggests that provisioning of services is geographically dominated by Addis Ababa. One hundred percent of freight forwarding service providers, and 78.5% of trucking services are controlled from the city. Production of flowers is of course located outside the urban areas. Specifically, 64 out of 80 farms are located in Addisalem, Sebeta, Debre Zeit and Ziway. Table 50: Average Time and Cost For Cut Flowers Export Supply Chain
Supply Stage Days Value $ per stem Rolling import stock 0 0.05 Import freight, customs clearance etc 10-21 0.001 Farming / Production stage 30- 45 0.08 Handling/transport (output) minimal 0.004 Export stage (air freight) 4 0.10 Total without forex delay 44-64 0.234
Global Development Solutions, LLC As with polo shirts, direct cost along the supply chain does not represent the key constraint within the cut flower sector. Instead import procedures associated with input acquisition was found to be a constraint, but cut flower production requires inputs that are not highly differentiated and can generally be sourced readily from local suppliers or stocked when imported directly. As a result, even though the delays associated with customs clearance of imported fertilizers, chemicals, greenhouse plastic, etc are the same as those for imported fabric, accessories, etc, cut flower exporters, unlike garment exporters, do not face any major drag on their competitiveness caused by these delays. On the export side the problems are different because of the use of air freight. The need to secure foreign exchange does not constitute a major burden as in the case of polo shirts
Towards a Globally Competitive Ethiopian Economy: The Role of Services and Urbanization. Case Studies – Rose and Polo Shirt Value Chains
Global Development Solutions, LLC 2/18/2011 73
because of the higher net foreign exchange earnings of cut flowers and the presence of foreign investors. The location of flower production is more footloose than garments because transport costs are low as a percent of the total export value. However all services for cut flowers are based in and around Addis Ababa except for infrastructure services such as land, water and power supply, elements of telecommunications and to some extent also banking services. The provision of cold chain service and air transport for export necessitates that service providers for cut flower concentrate around Addis Ababa. It is anticipated that cut flowers will in the future be exported directly from Bahar Dar Airport using charter flights but until capacity for direct export is developed, they will be transshipped through Addis Ababa Airport. The existence of the airport of international standards in Bahr Dar is undoubtedly one of the most vital parts of the trade infrastructure that has enabled the emergence of the cut flower cluster in the region. However, the geography of cut flower firms and service providers presented in the figures above illustrates that, like in the case of Addis Ababa, the existence of airport and related transport infrastructure is essential but not a sufficient condition for the emergence of a cut flower industry cluster. Other critical components required for such a cluster to emerge are:
• The existence of functioning public service providers in proximity to the location of the cluster, and most notably services such as customs and other official clearances and supporting public utility services. In Bahr Dar, all such support services can be readily obtained in the Amhara regional state capital.
• The existence of service providers that support the supply chain from farm-to-market in proximity to the location of the cluster, including suppliers of inputs, transport/freight services, etc.
• The ability of firms to access water, land, and other resources in timely and efficient manner.
Bahr Dar meets all of the above conditions and is slowly emerging as a cut flower cluster. It is very likely that the emergence of other export-oriented agribusiness industries and cluster is going to require similar level of development of infrastructure and support services.
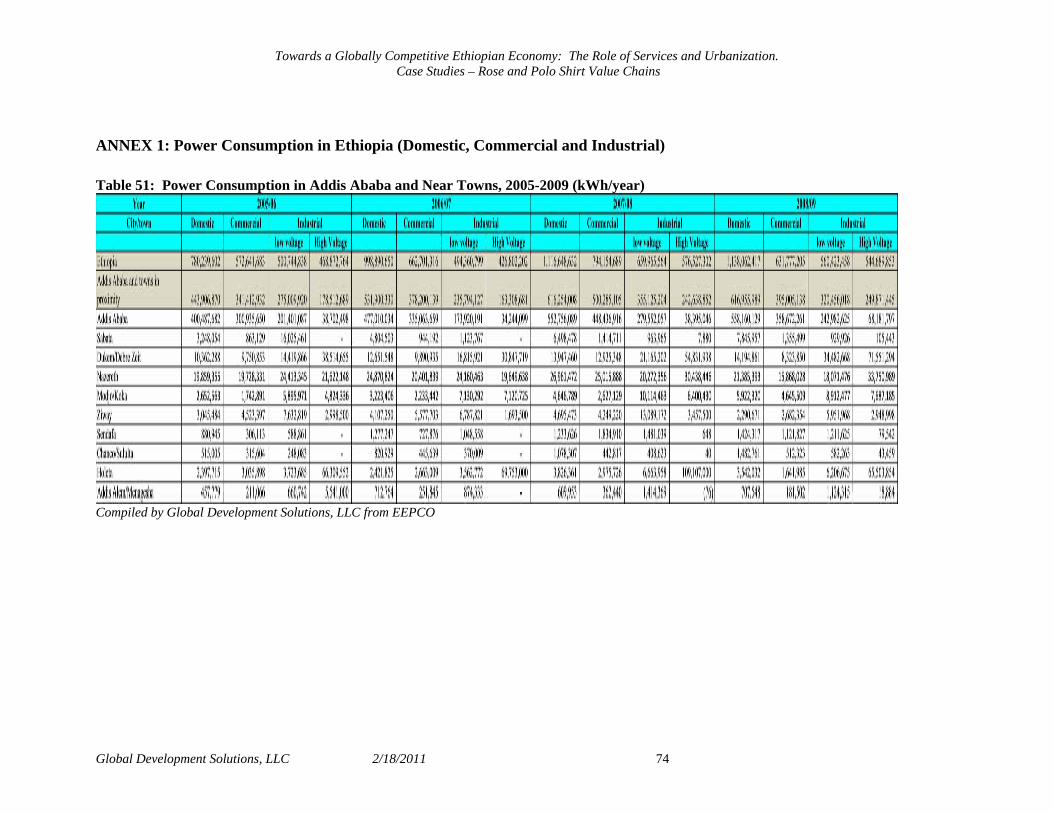
Towards a Globally Competitive Ethiopian Economy: The Role of Services and Urbanization. Case Studies – Rose and Polo Shirt Value Chains
Global Development Solutions, LLC 2/18/2011 74
ANNEX 1: Power Consumption in Ethiopia (Domestic, Commercial and Industrial) Table 51: Power Consumption in Addis Ababa and Near Towns, 2005-2009 (kWh/year)
Compiled by Global Development Solutions, LLC from EEPCO

Towards a Globally Competitive Ethiopian Economy: The Role of Services and Urbanization. Case Studies – Rose and Polo Shirt Value Chains
Global Development Solutions, LLC 2/18/2011 75
ANNEX 2: An Overview of the Financial Services in Ethiopia The structure of the financial sector in Ethiopia favors trade finance, and is either not set up to or discourages other forms of capital flow into the value adding sector for a variety of reasons, including the following:
1. Weak governance and management; 2. Limited financial instruments; 3. Obstacles to capital markets; 4. Underdeveloped government bill market; 5. Weak inter-bank lending; 6. High liquidity in the banking system; 7. Regulated fund pricing; 8. High collateral requirement; 9. Low rural and agriculture lending; 10. Low SME lending and consumer credit; and 11. Lack of competition.
A detailed breakdown of critical bottlenecks in each of the above factors is presented in the matrix below. Table 52: Key Characteristics of the Financial Sector in Ethiopia Key Characteristics Prevailing Issues Weak Governance and Management(1)
• 20% overall non-performing loans (NPL) among State Owned Banks • 70% NPL for Development Bank of Ethiopia (DBE) • Low loan-to-debt ratio: average 36% • Low loan-to-deposit ratio: average 51%
Limited Financial Instruments
• No term finance for business from private banks • Term finance available from DBE but through direct credit requiring
30% equity • Lending primarily focused on trade finance • Large share of banking system’s assets held as cash, real estate or
government paper (treasury bills) • Capital markets are non-existent
Obstacles to Capital Markets
• Economy represented largely by small firms • Low liquidity among small firms • Absence of accurate financial information • High dependence on foreign investors to reach large trading volumes
Underdeveloped Government Bill Market
• Low interest rates on T-bills (approximately 1%) • Low interest makes government securities unattractive for the private
sector • 99% of T-bills held by the Commercial Bank of Ethiopia (CBE) • Prevents the establishment of a secondary government bond market • Absence of proper tools for the transmission of monetary policy
decisions by National Bank of Ethiopia (NBE) Weak Inter-bank Lending • Small and illiquid inter-bank money market
• Lack of T-bill transaction deprives inter-bank lending system of collateral
• Inter-bank foreign exchange market is non-existent
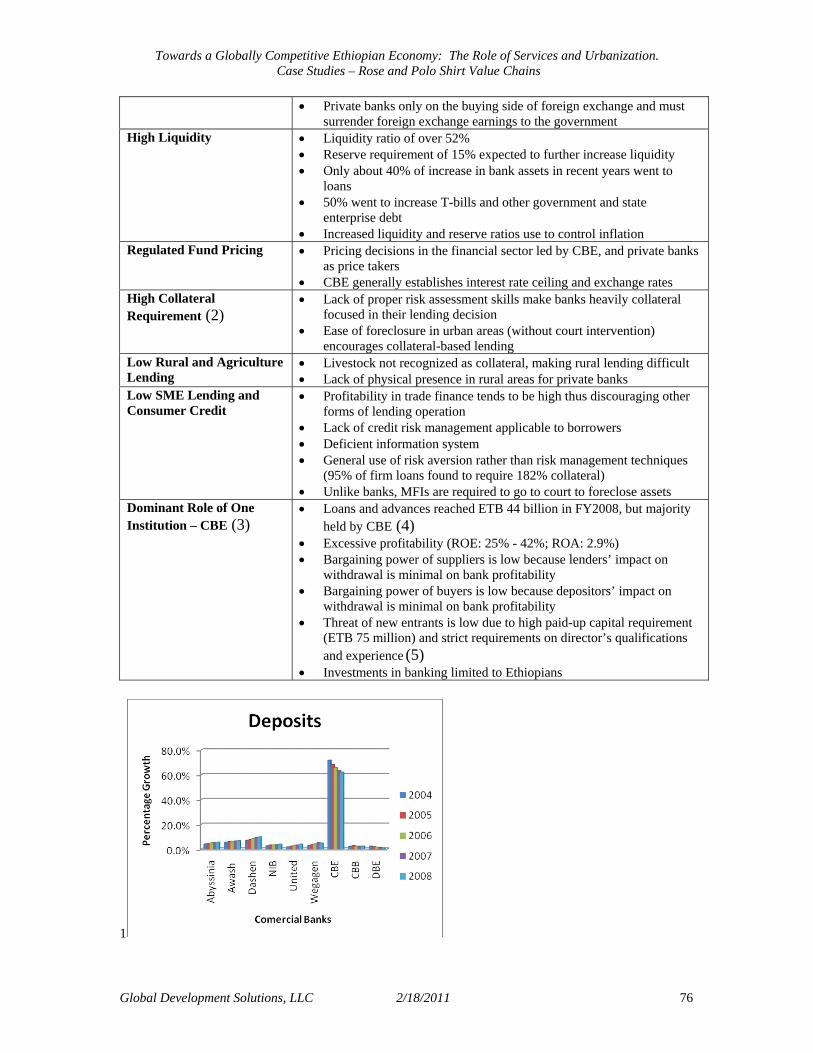
Towards a Globally Competitive Ethiopian Economy: The Role of Services and Urbanization. Case Studies – Rose and Polo Shirt Value Chains
Global Development Solutions, LLC 2/18/2011 76
• Private banks only on the buying side of foreign exchange and must surrender foreign exchange earnings to the government
High Liquidity • Liquidity ratio of over 52% • Reserve requirement of 15% expected to further increase liquidity • Only about 40% of increase in bank assets in recent years went to
loans • 50% went to increase T-bills and other government and state
enterprise debt • Increased liquidity and reserve ratios use to control inflation
Regulated Fund Pricing • Pricing decisions in the financial sector led by CBE, and private banks as price takers
• CBE generally establishes interest rate ceiling and exchange rates High Collateral Requirement (2)
• Lack of proper risk assessment skills make banks heavily collateral focused in their lending decision
• Ease of foreclosure in urban areas (without court intervention) encourages collateral-based lending
Low Rural and Agriculture Lending
• Livestock not recognized as collateral, making rural lending difficult • Lack of physical presence in rural areas for private banks
Low SME Lending and Consumer Credit
• Profitability in trade finance tends to be high thus discouraging other forms of lending operation
• Lack of credit risk management applicable to borrowers • Deficient information system • General use of risk aversion rather than risk management techniques
(95% of firm loans found to require 182% collateral) • Unlike banks, MFIs are required to go to court to foreclose assets
Dominant Role of One Institution – CBE (3)
• Loans and advances reached ETB 44 billion in FY2008, but majority held by CBE (4)
• Excessive profitability (ROE: 25% - 42%; ROA: 2.9%) • Bargaining power of suppliers is low because lenders’ impact on
withdrawal is minimal on bank profitability • Bargaining power of buyers is low because depositors’ impact on
withdrawal is minimal on bank profitability • Threat of new entrants is low due to high paid-up capital requirement
(ETB 75 million) and strict requirements on director’s qualifications and experience (5)
• Investments in banking limited to Ethiopians
1
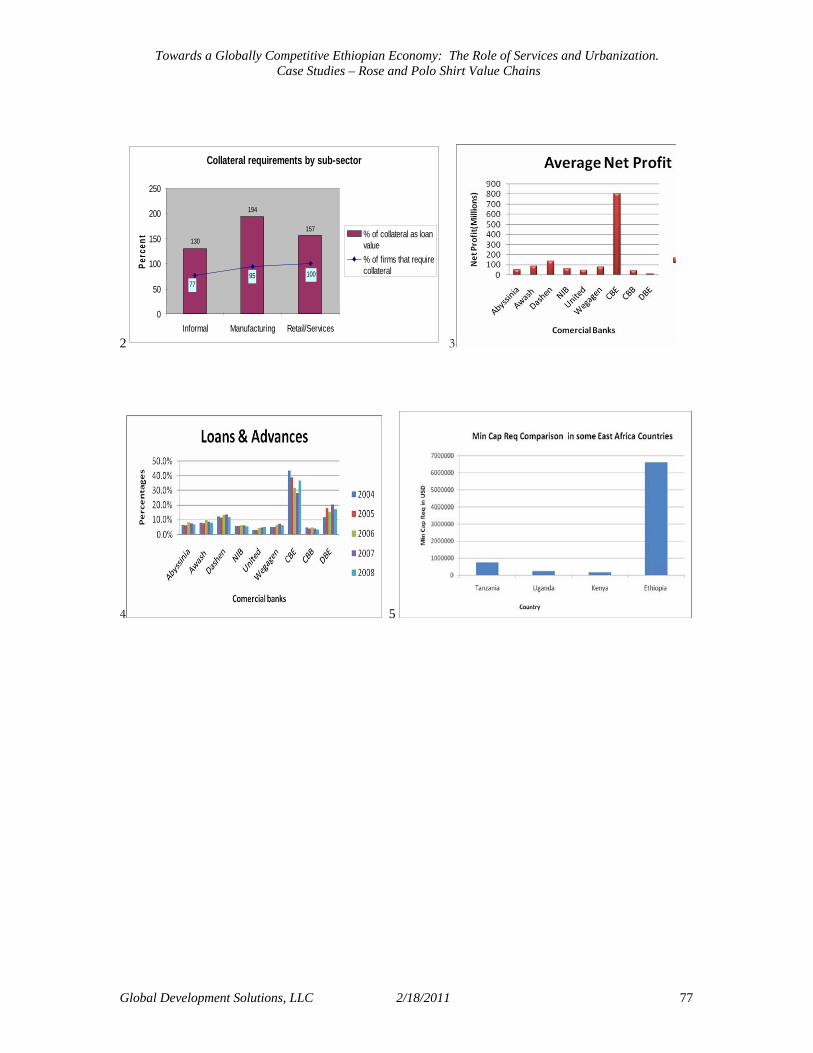
Towards a Globally Competitive Ethiopian Economy: The Role of Services and Urbanization. Case Studies – Rose and Polo Shirt Value Chains
Global Development Solutions, LLC 2/18/2011 77
2
Collateral requirements by sub-sector
130
194
157
10077
95
0
50
100
150
200
250
Informal Manufacturing Retail/Services
Perc
ent % of collateral as loan
value% of firms that requirecollateral
3
4 5

Towards a Globally Competitive Ethiopian Economy: The Role of Services and Urbanization. Case Studies – Rose and Polo Shirt Value Chains
Global Development Solutions, LLC 2/18/2011 78
ANNEX 3: Commercial Banks and Insurance Companies in Ethiopia Table 53: Commercial Banks in Ethiopia
Banks Year of Establishment Number of Branches Commercial Bank of Ethiopia 1963 209Development Bank of Ethiopa 1970 32Construction and Business Bank 1975 32Awash Bank 1994 60Dashen Bank 1995 55Abyssinia Bank 1996 47Wogagen Bank 1997 50United Bank Wogagen Bank 1998 45Nib International Bank 1999 45Cooperative Bank of Oromia 2004 38Lion Bank 2006 20Aemen Bank 2008 1Oromia International Bank 2008 25Buna International Bank 2009 8Berhan Interantional Bank 2009 1Abay Bank 2010 3 Global Development Solutions, LLC Table 54: Insurance Companies in Ethiopia
Insurance Companies RemarksAfrica InsuranceAwash InsuranceEthiopian Insurance CorporationGlobal InsuranceLion InsuranceNice InsuranceNIB InsuranceNyala InsuranceNile InsuranceUnity Insurance
These ten insurance companies have an estimated 40 branches countrywide (more than 50% are located in Addis Ababa).
Global Development Solutions, LLC