Tourism Survey for Dadra & Nagar Haveli (Jan Dec...
58
Nielsen India Pvt. Ltd. Ministry of Tourism (Market Research Division) Government of India Tourism Survey for Dadra & Nagar Haveli (Jan – Dec 2014) By Final Report
-
Upload
nguyenduong -
Category
Documents
-
view
220 -
download
2
Transcript of Tourism Survey for Dadra & Nagar Haveli (Jan Dec...

Nielsen India Pvt. Ltd.
Executive Summary – Tourism Survey For Dadra Nagar Haveli
Ni
1.0
1.0 BACKGROUND
Nielsen India Pvt. Ltd.
Ministry of Tourism
(Market Research Division)
Government of India
Tourism Survey for Dadra & Nagar Haveli (Jan – Dec 2014)
By
Final Report

Nielsen India Pvt. Ltd.
Executive Summary-Tourism Survey for Dadra & Nagar Haveli i
ACKNOWLEDGEMENT
We are thankful to the Ministry of Tourism, Government of
India for assigning this Study on Tourism Survey for Dadra &
Nagar Haveli. We are grateful to Dr. Lalit K. Panwar,
Secretary (Tourism), and Shri Girish Shankar, Additional
Secretary (Tourism) for extending their support.
We are also grateful to Dr. R.K. Bhatnagar Additional
Director General (MR), Smt. Mini Prasanna Kumar, Joint
Director (MR), Ms. Neha Srivastava, Deputy Director (MR),
Ms. Anila Kumari, Asst. Director (MR) for providing us the
necessary guidance and periodical support for
conducting the study. We would also like to thank Shri S.K.
Mahanta, DPA (Grade’B’) - MR for providing us the
required support and help from time to time.
We are also thankful to Shri Vinod P. Kavle Secretary
(Tourism), Dadra & Nagar Haveli and other State Tourism
Officials for extending their help and support from time to
time.
Last but not the least we would like to thank our entire
team of research professionals as well as our field team for
keeping up the momentum and time schedule of the
study.

Ministry of Tourism Nielsen India Pvt. Ltd.
Government of India
Executive Summary –Tourism Survey For Dadra & Nagar Haveli ii
TABLE OF CONTENTS
Executive Summary ii
Final Report For The State of Dadra Nagar Haveli 1
Annexure 1 : Methodology 19
Annexure 2 : Estimation Procedure 25
Annexure 3 : Questionnaires / Survey Instruments 34

Ministry of Tourism Nielsen India Pvt. Ltd.
Government of India
Executive Summary –Tourism Survey For Dadra & Nagar Haveli iii
Executive Summary
E.1 Tourism in Dadra & Nagar Haveli
Snuggled cozily amid the state of Maharashtra and Gujarat, Dadra & Nagar
Haveli is located in the western corner of India. It lies on the north bank of the
Daman Ganga River. This small union territory (UT) sprawls over an area less
than 500 sq. km, covered with tall, awesome trees and winding rivers.
Dadra and Nagar Haveli (DNH) are in the watershed of the Daman Ganga River,
which flows through the territory. The towns of Dadra and Silvassa lie on the
north bank of the river. The Western Ghats range rises to the east, and the
foothills of the range occupy the eastern portion of the district. The territory is
landlocked, although the Arabian Sea coast lies just to the west in Gujarat. The
major spoken languages in the territory are Gujarati, Hindi and Marathi.
A land of spell bounding beauty, Dadra & Nagar Haveli is endowed with lush
green forests, thundering waterfalls, gurgling streams, undulating mountain
ranges and a dazzling show of flora and fauna.
E.2 Research Aim
The aim of the proposed research was to collect relevant tourist related statistics,
from Dadra & Nagar Haveli, which would enable analyzing subtle trends as well
as preparation of month wise and annual estimates separately for foreign and
domestic visitors –with a break –up of overnight tourists & same day visitors for
the selected tourist destinations.
E.3 Research Objective
To achieve the aim of the study, the objectives for the proposed research, was as
follows:-

Ministry of Tourism Nielsen India Pvt. Ltd.
Government of India
Executive Summary –Tourism Survey For Dadra & Nagar Haveli iv
a. To enlist prime tourist locations in the union territories and available
accommodation facility thereof.
b. To generate details about available infrastructural facility at the prime
tourist spots in the union territories.
c. To collate month wise information about domestic as well as foreign
tourists availing accommodation in all facilities in those locations
d. To collate month wise expenditures made by the Union Government for
development of tourism and its potential earnings
e. To accrue information on employment in the accommodation units,
estimate direct employment generated in accommodation units at district
& territory level.
The field survey in a union territory was conducted for a period of 12 months in
all districts of the union territory. The survey was used to obtain the following
month-wise information for each district:
a. Estimated number of visits
(i) Visits by overnight visitors- staying at accommodation units;
- staying with friends and relatives
- Others, such as those staying in tented
accommodations provided by Union Govt. or by any
other charitable organizations, etc.
(ii) Visits by same-day visitors
b. Profile of visitors, their expenditure pattern, purpose of visits, etc.
c. Occupancy rates and direct employment in accommodation units.
E.4 Terms of Reference
The terms of reference of the study as indicated are as under
Prepare a frame /list of all important places in the State
As per the methodology developed by Ministry of Tourism for preparation of
month wise & annual estimates, prepare the following estimate, separately for

Ministry of Tourism Nielsen India Pvt. Ltd.
Government of India
Executive Summary –Tourism Survey For Dadra & Nagar Haveli v
foreign and domestic visitors (with break-up of overnight tourists and same
day visitors) for the selected tourist places, at district level and at State level.
Total no: of tourists (overnight)
Total number of same day visitors
Total number of tourists staying with friends /relatives
Expenditure incurred by tourists (overnight)
Expenditure incurred by same day visitors
Expenditure incurred by tourists staying with friends / relatives
Profiling the tourists /visitors at district and state level in
respect of age, sex, occupation, purpose of visit, state /UT of
residence or country of origin, duration of stay, mode of
journey, use of package tour etc.
As per the methodology prepare month wise and annual estimates of
occupancy rate of accommodation units at district and State levels.
Conduct one-day Inception workshop for the officers of the State. Details of
the exercise and the proposed methodology to be adopted for estimating the
number of tourists and other parameters mentioned in other paras of TOR
were explained by the consultants in the workshop. Also organize a workshop
/meeting in the state at the end of the survey to discuss the report of the
survey.
Prepare a frame/list of tourist place-wise all accommodation units, like Hotels,
Dharamshallas, Guest houses, etc. for conduction State level survey on
tourism, Update this frame/list on quarterly basis; and accordingly revise the
coverage, This frame should include information on rooms, beds and
employment, etc. Also conduct survey of selected tourists staying in
accommodation units to identify the purpose of their visits.
Based on the methodology collect, compile data about domestic and foreign
tourists to provide information as mentioned at S. No. (ii) Above.
Based on the information on employment in the accommodation units in the
sampling frame, estimate direct employment generated in accommodation units
at district and State levels.
Collect information on the annual expenditure incurred by State Government
at the selected tourist places, at district level and at the State level for
development of tourism.

Ministry of Tourism Nielsen India Pvt. Ltd.
Government of India
Executive Summary –Tourism Survey For Dadra & Nagar Haveli vi
E.5 Research Methodology
However, to briefly define the methodology, the various steps of the operational
methodology are given below:-
a. This study was conducted in the only district of Dadra Nagar Haveli and
at 8 destinations of tourist interest
b. Selection of Tourist Destinations and Locations: Important
destinations of tourist attraction and their location in the district were
selected in consultation with the State Tourism Department
c. Survey Period: The field survey was conducted for a period of 12
months (January 2014 till December 2014) at selected destinations. In a
particular month at a particular destination the survey was done for 7
days covering two specified weeks. The details are available at
Annexure-1
d. Survey Instruments: The survey instruments or questionnaires given at
Annexure - 3 covers three types of survey, namely, survey at destinations
(Short Survey), survey at exit point(s) (Exit Point Survey) and survey at
accommodation units (AUs) specified briefly below.
e. In total of 4 surveys were conducted for this study. They were:
The Counting Survey: In this survey, head counts were taken at
each tourist destination in the state. This survey was conducted
every month from January 2014 till December 2014
The Short Survey: In this survey, 600 tourists per district were
interviewed at each tourist location and information regarding
tourists’ duration of visit, place of stay, frequency of visit,
nationality/residence state, etc. was collected. This survey was
conducted every month from January 2014 till December 2014
The Accommodation Survey: In this survey, accommodation
units in the district were visited and information regarding number
of domestic and foreign guests staying, number of bed nights
spent, employee details and residency state/ country of guests
was collected. This survey was done every month from January
2014 till December 2014

Ministry of Tourism Nielsen India Pvt. Ltd.
Government of India
Executive Summary –Tourism Survey For Dadra & Nagar Haveli
vii
The Exit Survey: In this survey, information regarding,
background of tourists, their expenditure, their place of stay,
mode of traveling, etc. were collected. This survey was conducted
on a quarterly basis and 400 tourists or visitors were interviewed
per district each quarter in this survey.
f. Data from all the above surveys were used to calculate the number of
tourists or visitors to the districts and hence to the UT of Dadra Nagar
Haveli.
E.6 Tourist Destinations Covered
The destinations which were included in the study are given below. These destinations were
included, based on secondary research and after discussions with officials from MR division of
Ministry of Tourism, Government of India and officials from Dadra Nagar Haveli Tourism Ministry.
Towns Destination
Silvasa Silvasa
Dadra Dadra
Dudhni Dudhni
Luhari Luhari
Khanvel Khanvel
Satmalia Satmalia
Vasona Vasona
Kauncha Kauncha
E.7 Sample Distribution among Destinations for Short Survey
Destination Monthly Sample Total Monthly Sample
Silvasa 75 900
Dadra 75 900
Dudhni 75 900
Luhari 75 900
Khanvel 75 900
Satmalia 75 900
Vasona 75 900
Kauncha 75 900

Ministry of Tourism Nielsen India Pvt. Ltd.
Government of India
Executive Summary –Tourism Survey For Dadra & Nagar Haveli
viii
E.8 Sample Distribution among Districts for the Exit Survey
The sample size for each district to be covered in the Exit Survey was 800. The
distribution of tourists interviewed in the Exit survey for each of the 4 Quarters
(January2014, April 2014, July 2014 and October 2014) is given below.
District January 2014 April 2014 July 2014 October 2014 Total
Gross Total
Domestic Foreign Domestic Foreign Domestic Foreign Domestic Foreign Domestic Foreign
Dadra &
Nagar Haveli
392 8 396 4 398 2 391 9 1577 23 1600
TOTAL 392 8 396 4 398 2 391 9 1577 23 1600

Ministry of Tourism Nielsen India Pvt. Ltd.
Government of India
Executive Summary –Tourism Survey For Dadra & Nagar Haveli xvi
E.9 Month Wise Short Survey Sample Covered For the Study
Month Jan Feb Mar Apr May June July Aug Sep Oct Nov Dec Aggregate Sample Size 600 600 600 600 600 600 600 600 600 600 600 600
Overnight Tourists
Foreigner 23 19 17 16 14 12 8 10 14 22 27 30
Domestic (from within the state) 0 0 0 0 0 0 0 0 0 0 0 0
Domestic (from outside the state)
223 209 205 224 205 201 226 215 208 209 210 210
Same Day
Visitor
Foreigner 0 0 0 0 0 0 0 0 0 0 0 0
Domestic (from within the state) 113 119 121 115 122 124 117 123 121 134 128 151
Domestic (from outside the state)
241 253 257 245 259 263 249 261 257 238 238 209
Total 600 600 600 600 600 600 600 600 600 600 600 600
E.10 Month Wise and District Wise Domestic Visitor in Dadra Nagar Haveli (January’2014 till December’2014)
Destinations January February March April May June July August September October November December Total
Silvasa 6449 4449 11629 10136 12090 14142 13092 14638 15345 16143 19203 22032 159348
Dadra 6893 4984 14076 12359 16603 17280 17283 18133 18863 20803 24765 27615 199657
Dudhni 4778 3914 9423 8185 9094 9785 9435 10337 11284 12009 15159 16866 120269
Luhari 4313 3475 8513 7410 8912 9899 9332 10238 10861 11611 14620 16750 115934
Khanvel 4273 3752 9391 8176 9867 10783 10327 11384 11900 12769 15904 17390 125916
Satmalia 6950 5684 14792 12906 14940 15676 15345 16541 17054 18015 21510 24931 184344
Vasona 7247 5609 13768 11921 11765 12566 12052 13081 13709 14695 17435 19043 152891
Kauncha 4147 3623 8910 7747 8938 9454 9078 10198 10785 11556 14572 16337 115345
TOTAL 45050 35490 90502 78840 92209 99585 95944 104550 109801 117601 143168 160964 1173704
Ministry of Tourism Nielsen India Pvt. Ltd.
Government of India
Executive Summary –Tourism Survey For Dadra & Nagar Haveli xvii
E.11 Month Wise and District Wise Foreign Visitor in Dadra Nagar Haveli (January ’2014 till December’2014)
Destinations January Februar
y March April May June July August
September
October Novem
ber December
Total
Silvasa 9 5 6 4 4 2 2 5 7 11 14 22 91
Dadra 0 0 0 0 0 0 0 0 0 0 0 0 0
Dudhni 0 0 0 0 0 0 0 0 0 0 0 0 0
Luhari 16 14 13 11 10 7 5 7 9 15 23 31 161
Khanvel 0 0 0 0 0 0 0 0 0 0 0 0 0
Satmalia 59 28 33 30 26 21 18 22 26 35 48 59 405
Vasona 86 47 54 49 42 35 31 36 40 49 61 76 606
Kauncha 6 0 3 0 0 0 0 0 0 0 0 0 9
Total 176 94 109 94 82 65 56 70 82 110 146 188 1272
E.12 Month Wise and District Wise Total Visitor Arrival in Dadra Nagar Haveli (January’2014 till December’2014)
Destinations January February March April May June July August September October November December Total
Silvasa 6458 4454 11635 10140 12094 14144 13094 14643 15352 16154 19217 22054 159439
Dadra 6893 4984 14076 12359 16603 17280 17283 18133 18863 20803 24765 27615 199657
Dudhni 4778 3914 9423 8185 9094 9785 9435 10337 11284 12009 15159 16866 120269
Luhari 4329 3489 8526 7421 8922 9906 9337 10245 10870 11626 14643 16781 116095
Khanvel 4273 3752 9391 8176 9867 10783 10327 11384 11900 12769 15904 17390 125916
Satmalia 7009 5712 14825 12936 14966 15697 15363 16563 17080 18050 21558 24990 184749
Vasona 7333 5656 13822 11970 11807 12601 12083 13117 13749 14744 17496 19119 153497
Kauncha 4153 3623 8913 7747 8938 9454 9078 10198 10785 11556 14572 16337 115354
TOTAL 45226 35584 90611 78934 92291 99650 96000 104620 109883 117711 143314 161152 1174976

Ministry of Tourism Nielsen India Pvt. Ltd.
Government of India
Executive Summary –Tourism Survey For Dadra & Nagar Haveli xx
E.13 District Wise Details of Total Number of Accommodation Units in Dadra Nagar Haveli:
#this does not include Company Guest houses, Guest houses run by trusts, Dormitories, free
dharamshalas, tourist bunglows and free accommodation units in the state of Dadra Nagar Haveli.
Destinations Total
Accommodation Units
Total Rooms
Silvasa 68 1581
Dadra 3 85
Dudhni 1 12
Khanvel 6 71
TOTAL 78 1749

Ministry of Tourism Nielsen India Pvt. Ltd.
Government of India
Final Report for Dadra & Nagar Haveli– Tourism Survey 1
ADILABAD
Dadra & Nagar Haveli
Ministry of Tourism Nielsen India Pvt. Ltd.
Government of India
Final Report for Dadra & Nagar Haveli– Tourism Survey 2
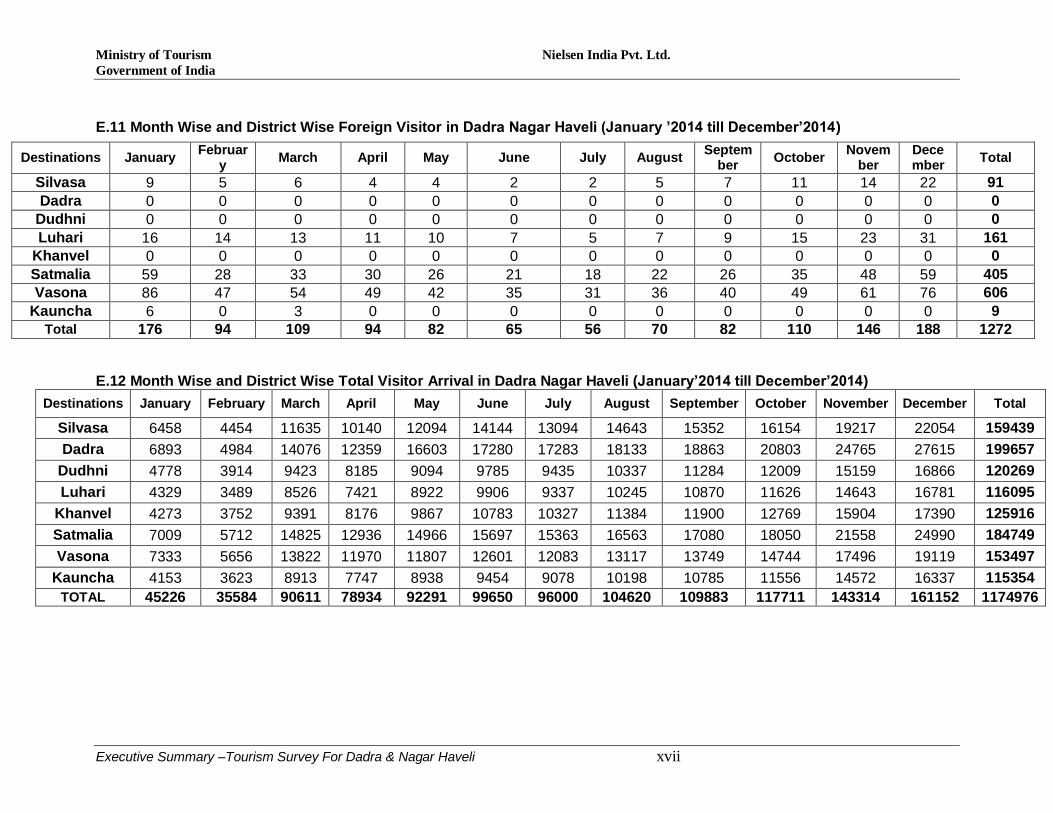
Table – 1
Total number of visits to Tourist Destinations by Domestic and Foreign Leisure Visitors
Dadra Nagar Haveli
No. of Visits by Domestic Tourists / Same Day Visitors
No of visits by Foreign Tourists / Same Day Visitor
Overnight Tourists
Same Day Visitors
Total Overnight Tourists
Same Day Visitors
Total
Month (1) (2) (3) (4) (5) (6) (7)
January’2014 21373 29375 50748 211 0 211
February’2014 16317 23682 39999 112 0 112
Marhc’2014 46913 55357 102270 130 0 130
April’2014 37232 48960 86192 111 0 111
May’2014 53552 49658 103210 96 0 96
June’2014 56732 54526 111258 76 0 76
July’2014 59475 56661 116136 83 0 83
August’2014 59475 56661 116136 83 0 83
September’2014 63104 59025 122129 98 0 98
October’2014 65449 64142 129591 129 0 129
November’2014 83136 75509 158645 173 0 173
December’2014 90765 87297 178062 222 0 222
Total 653523 660853 1314376 1524 0 1524
As inferred from the table above the maximum no. of visits by domestic leisure visitors to tourist destinations in Dadra Nagar Haveli has been in the months of November & December. As far as foreign leisure tourists are concerned, maximum no. of visits to tourist destinations in Dadra Nagar Haveli is in the month December.
Table – 2
Total number of visits to Tourist Destinations by Domestic and Foreign Visitors
Dadra Nagar Haveli
No. of Visits by Domestic Tourists / Same Day Visitors
No of visits by Foreign Tourists / Same Day Visitor
Overnight Tourists
Same Day Visitors
Total Overnight Tourists
Same Day Visitors
Total
Month (1) (2) (3) (4) (5) (6) (7)
January’2014 26552 29831 56383 387 0 387
February’2014 20293 24036 44329 206 0 206
Marhc’2014 57116 56241 113357 239 0 239
April’2014 46122 49728 95850 205 0 205
May’2014 63995 50514 114509 178 0 178
June’2014 68162 55472 123634 141 0 141
July’2014 70414 57559 127973 139 0 139
August’2014 71432 57651 129083 153 0 153
September’2014 75638 60069 135707 180 0 180
October’2014 79200 65602 144802 239 0 239
November’2014 99823 77296 177119 319 0 319
December’2014 109560 89293 198853 410 0 410
Total 788307 673292 1461599 2796 0 2796
As inferred from the table above the maximum no. of visits by domestic visitors to tourist destinations in Dadra Nagar Haveli has been in the months of November & December. As far as foreign tourists are concerned, maximum no. of visits to tourist destinations in Dadra Nagar Haveli is in the month December.

Ministry of Tourism Nielsen India Pvt. Ltd.
Government of India
Final Report for Dadra & Nagar Haveli– Tourism Survey 3
Table – 3 Total number of Domestic and Foreign Leisure Tourists / Same Day Visitors
Dadra Nagar Haveli
No. Domestic Tourists / Visitor No of Foreign Tourists / Visitor
Overnight Tourists
Same Day Visitors
Total Overnight Tourists
Same Day Visitors
Total
Month (1) (2) (3) (4) (5) (6) (7)
January’2014 14722 24694 39416 176 0 176
February’2014 11266 19894 31160 94 0 94
Marhc’2014 32640 46775 79415 109 0 109
April’2014 26449 42731 69180 94 0 94
May’2014 37490 43419 80909 82 0 82
June’2014 39574 47636 87210 65 0 65
July’2014 38375 45731 84106 56 0 56
August’2014 41921 49679 91600 70 0 70
September’2014 44499 51723 96222 82 0 82
October’2014 45958 56427 102385 110 0 110
November’2014 58405 66285 124690 146 0 146
December’2014 63568 76605 140173 188 0 188
Total 454867 571599 1026466 1272 0 1272
The maximum no. of domestic leisure visitors to Dadra Nagar Haveli are spread across the months of October – December. For foreign leisure visitors to Dadra Nagar Haveli, November December and January have been the preferred months for visit.
Table – 4
Total Number of Leisure and Non-Leisure Domestic Tourists and Same Day Visitors
Dadra Nagar Haveli
No. of Overnight Tourists No. of Same Day Visitors
Month Leisure Non
Leisure Total
(col.2+3) Leisure
Non Leisure
Total (col.5+6)
(1) (2) (3) (4) (5) (6) (7)
January’2014 14722 5179 19901 24694 456 25149
February’2014 11266 3976 15241 19894 354 20249
Marhc’2014 32640 10203 42843 46775 884 47659
April’2014 26449 8890 35339 42731 768 43501
May’2014 37490 10443 47934 43419 856 44275
June’2014 39574 11430 51004 47636 946 48581
July’2014 38375 10939 49315 45731 898 46629
August’2014 38375 10939 49315 45731 898 46629
September’2014 44499 12534 57034 51723 1044 52767
October’2014 45958 13751 59711 56427 1460 57887
November’2014 58405 16687 75093 66285 1787 68072
December’2014 63568 18795 82365 76605 1996 78601
Total 451321 133766 585095 567651 12347 579999
Considering both leisure as well as non-leisure domestic tourists to Dadra Nagar Haveli, the maximum no. of overnight visitors are in the period November -December. A majority of the same day visitors visited Dadra Nagar Haveli in the months of December and November.

Ministry of Tourism Nielsen India Pvt. Ltd.
Government of India
Final Report for Dadra & Nagar Haveli– Tourism Survey 4
Table – 5 Total Number of Leisure and Non-Leisure Foreign Tourists and Day Visitors
Dadra Nagar Haveli
No. of Overnight Tourists No. of Same Day Visitors
Month Leisure Non
Leisure Total
(col.2+3) Leisure
Non Leisure
Total (col.5+6)
(1) (2) (3) (4) (5) (6) (7)
January’2014 176 0 176 0 0 0
February’2014 94 0 94 0 0 0
March’2014 109 0 109 0 0 0
April’2014 94 0 94 0 0 0
May’2014 82 0 82 0 0 0
June’2014 65 0 65 0 0 0
July’2014 56 0 56 0 0 0
August’2014 70 0 70 0 0 0
September’2014 82 0 82 0 0 0
October’2014 110 0 110 0 0 0
November’2014 146 0 146 0 0 0
December’2014 188 0 188 0 0 0
Total 1272 0 1272 0 0 0
Considering both leisure as well as non-leisure foreign tourists to Dadra Nagar Haveli, the maximum no. of overnight visitors are in the months of December and January.
Table – 6
Total Number of Domestic and Foreign Tourists and Day Visitors
Dadra Nagar Haveli
No. of Tourists No. of Day Visitors
Month Domestic Foreign Total
(col.2+3) Domestic Foreign
Total (col.5+6)
(1) (2) (3) (4) (5) (6) (7)
January’2014 19901 176 20079 25149 0 25149
February’2014 15241 94 15335 20249 0 20249
March’2014 42843 109 42952 47659 0 47659
April’2014 35339 94 35434 43501 0 43501
May’2014 47934 82 48014 44275 0 44275
June’2014 51004 65 51067 48581 0 48581
July’2014 49315 56 49371 46629 0 46629
August’2014 53881 70 53951 50669 0 50669
September’2014 57034 82 57116 52767 0 52767
October’2014 59712 110 59822 57889 0 57889
November’2014 75095 146 75241 68073 0 68073
December’2014 82363 188 82551 78601 0 78601
Total 589662 1272 590933 584042 0 584042
Collating the findings of the previous tables, the total no. of domestic and foreign overnight tourists are most in the months of November and December. The total no. of domestic day visitors to Dadra Nagar Haveli is most in the month of December and November.

Ministry of Tourism Nielsen India Pvt. Ltd.
Government of India
Final Report for Dadra & Nagar Haveli– Tourism Survey 5
Table – 7 Distribution of Domestic and Foreign Tourists by place of Stay
The above table presents the distribution of domestic and foreign tourists, visiting Dadra Nagar Haveli, by place of stay. As we can see the maximum no. of domestic visitors (285297) to Dadra Nagar Haveli are staying at friends & relatives place, followed by hotels (228974). All the sample foreign tourists stayed at hotels during their visit to Dadra Nagar Haveli.
Table - 8
No. of accommodation units, Rooms / Beds Available and Occupancy Rate
Dadra Nagar Haveli No. of
Accommodation units
No. of Rooms
Available per day
No. of Beds
Available per day
No. of Beds
Occupied per day
Occupancy Rate
(%)(Col5
as % of Col4)
Months
(1) (2) (3) (4) (5) (6)
January’2014 78 1749 3934 1849 47%
February’2014 78 1749 3934 1850 47%
March’2014 78 1749 3934 1849 47%
April’2014 78 1749 3934 1851 47%
May’2014 78 1749 3934 1847 47%
June’2014 78 1749 3934 1888 48%
July’2014 78 1749 3934 1890 48%
August’2014 78 1749 3934 1928 49%
September’2014 78 1749 3934 1967 50%
October’2014 78 1749 3934 1925 49%
November’2014 78 1749 3934 1927 49%
December’2014 78 1749 3934 1931 49%
As evident from the table, it can be concluded that occupancy rate was the highest during the month of September.
Dadra Nagar Haveli
No. Domestic Tourists No of Foreign Tourists
Staying at
Hotels
Staying with F&R
Staying elsewhe
re
Total (col.2+3
+4)
Staying at
Hotels
Staying
with F&R
Staying
elsewhere
Total (col.6+7
+8)
Month(1) (2) (3) (4) (5) (6) (7) (8) (9)
January’2014 7261 9778 2860 19901 176 0 0 176
February’2014 5904 7114 2222 15241 94 0 0 94
March’2014 15528 21942 5375 42843 109 0 0 109
April’2014 13363 17213 4763 35339 94 0 0 94
May’2014 18012 24006 5914 47934 82 0 0 82
June’2014 19588 25766 5649 51004 65 0 0 65
July’2014 19214 24629 5472 49315 56 0 0 56
August’2014 20188 26406 7287 53881 70 0 0 70
September’2014 22186 27985 6863 57034 82 0 0 82
October’2014 23637 28155 7919 59711 110 0 0 110
November’2014 30273 34886 9934 75093 146 0 0 146
December’2014 33820 37417 11128 82365 188 0 0 188
Total 228974 285297 75386 589661 1272 0 0 1272

Ministry of Tourism Nielsen India Pvt. Ltd.
Government of India
Final Report for Dadra & Nagar Haveli– Tourism Survey 6
Table - 9 Month wise Total Number of Guests checked-in, bed nights spent and average duration of stay at Accommodation Units
The above table presents the statistical data on domestic and foreign tourist who checked-in and their duration of stay in Dadra Nagar Haveli month wise. As it can be seen the average duration of stay for domestic tourists is highest for the months of January and February. For foreigners, April is the peak month of stay.
Dadra Nagar Haveli
No. of Guests checked-in No. of bed nights spent Average duration of Stay
Month Indians Foreigner
s Total
(col.2+3) Indians
Foreigners
Total (col.5+6)
Indians (Col.5/C
ol.2)
Foreigners
(Col.6/Col.3)
Total (Col.7/Col.4)
(1) (2) (3) (4) (5) (6) (7) (8) (9) (10)
January’2014 8631 168 8799 11917 298 12215 1.38 1.77 1.39
February’2014 6193 94 6287 8837 169 9006 1.43 1.80 1.43
March’2014 19184 108 19292 25627 220 25847 1.34 2.04 1.34
April’2014 15008 108 15116 20084 221 20305 1.34 2.05 1.34
May’2014 21638 78 21716 28572 139 28711 1.32 1.78 1.32
June’2014 20203 59 20262 27206 119 27325 1.35 2.02 1.35
July’2014 18361 51 18412 24451 104 24555 1.33 2.04 1.33
August’2014 21336 65 21401 28540 132 28408 1.34 2.03 1.33
September’2014 23756 77 23833 28465 130 28595 1.20 1.69 1.20
October’2014 22669 94 22763 26538 154 26692 1.17 1.64 1.17
November’2014 28050 134 28184 35915 232 36147 1.28 1.73 1.28
December’2014 30367 174 30541 38335 287 38622 1.26 1.65 1.26
Total 235396 1210 236606 304487 2205 306428 1.29 1.82 1.30

Ministry of Tourism Nielsen India Pvt. Ltd.
Government of India
Final Report For Dadra & Nagar Haveli – Annexure 1: Methodology 7
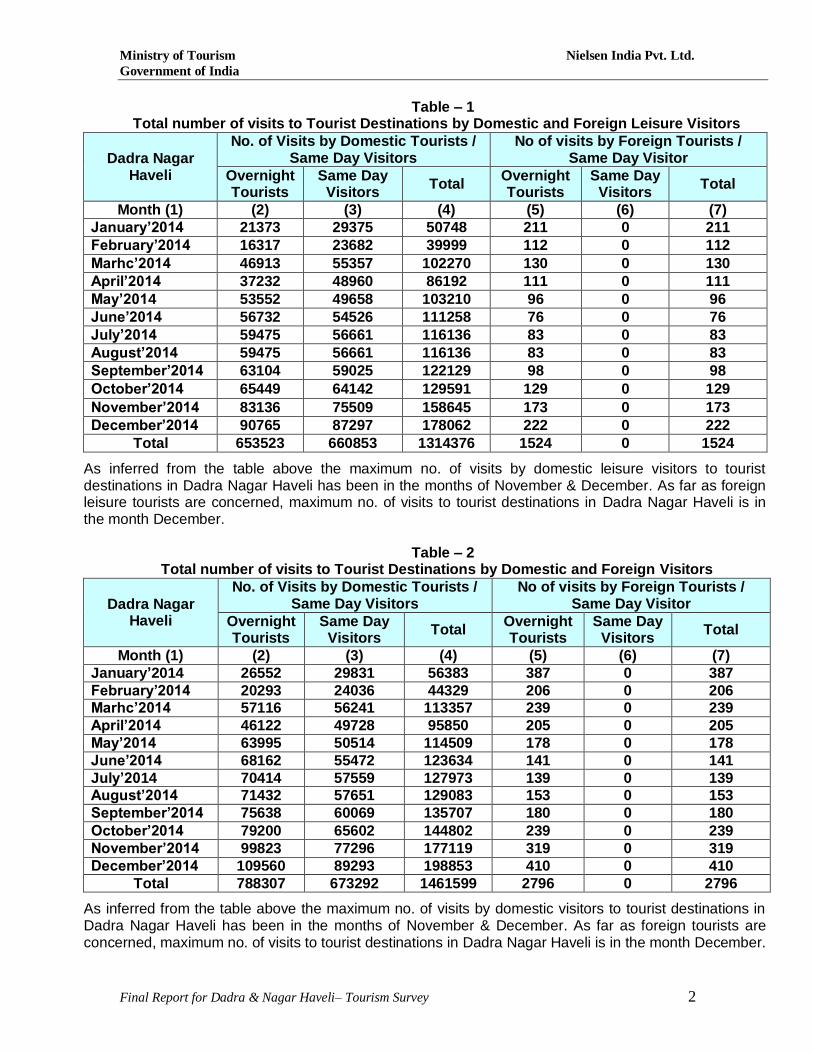
Tables 10 – 15 give the quarterly data pertaining to information collected from accommodation survey held in the UT of Dadra & Nagar Haveli. As shown in the tables below, the no. of accommodation units surveyed were 78 during the period January 2014 – December 2014. Most of the accommodations units are sole proprietorship/partnership entities. These accommodation units employ nearly 1400 persons. A majority of the accommodation units (72) fall under the Non- Star category. The survey reveals that nearly 72 accommodation units in Dadra & Nagar Haveli come under Non – Classified category.
Table - 10 Number of Accommodation units, Rooms, Beds and Employment
Dadra Nagar
Haveli No. of AUs
No. of Rooms
No. of Beds
No. of Employees
Quarter
(1) (2) (3) (4) Temporary Permanent Total
(5) (6) (7)
Quarter – 1 78 1749 3934 912 491 1403
Quarter – 2 78 1749 3934 824 443 1267
Quarter – 3 78 1749 3934 780 419 1199
Quarter – 4 78 1749 3934 957 514 1471
Table - 11
Distribution of Employees in Accommodation Units by Age Group
Dadra Nagar Haveli
No. of AUs
No. of Employees
Distribution of employees by age-group
Quarter
(1) (2) (3) 18-25 yrs 26-30 yrs 31-40 yrs 41-50 yrs > 51 yrs
(4) (5) (6) (7) (8)
Quarter – 1 78 1403 253 477 449 210 14
Quarter – 2 78 1267 228 431 405 190 13
Quarter – 3 78 1199 216 408 384 180 12
Quarter – 4 78 1471 265 500 471 221 15
Table - 12 Distribution of Employees in Accommodation Units by Service
Dadra Nagar Haveli No. of
AUs No. of
Employees Distribution of employees by service
Quarter
(1) (2) (3) Management F&B House Keeping Others
(4) (5) (6) (7)
Quarter – 1 78 1403 182 351 533 337
Quarter – 2 78 1267 165 317 481 304
Quarter – 3 78 1199 156 300 456 288
Quarter – 4 78 1471 191 368 559 353
Ministry of Tourism Nielsen India Pvt. Ltd.
Government of India
Final Report For Dadra & Nagar Haveli – Annexure 1: Methodology 8
Table - 13 Category-wise Distribution Accommodation Units
Dadra Nagar Haveli
No. of Accommodation units
Quarter Classified
Non-classified
Total Having
more than 20 rooms
10-20 rooms
Less than 10 rooms
Sub-Total (Col.
3+4+5)
(1) (2) (3) (4) (5) (6) (7)
Quarter – 1 6 21 39 14 72 78
Quarter – 2 6 21 39 14 72 78
Quarter – 3 6 21 39 14 72 78
Quarter – 4 6 21 39 14 72 78
Table - 14
Distribution Accommodation Units by Types
Dadra Nagar Haveli
No. of Accommodation units
Quarter Star
Hotels Apartment
Hotels
Non-Star
Hotels
Youth/ YMCA
Hostels
Dharamshalas/ Sarais/
Musafirkhanas
Gurudwaras/ Temples/
Monastries
Bed & Breakfast
Units Motels Total
Quarter – 1 6 0 72 0 0 0 0 0 78
Quarter – 2 6 0 72 0 0 0 0 0 78
Quarter – 3 6 0 72 0 0 0 0 0 78
Quarter – 4 6 0 72 0 0 0 0 0 78
Table - 15
Distribution Accommodation Units by Type of Ownership
State: No. of Accommodation units
Quarter Central Govt.
State Govt.
Pvt. Ltd.
Prop./ Partnership
Public Limited
PSU Charitable
Trust/ Society
Others Total
Quarter – 1 0 0 3 75 0 0 0 0 78
Quarter – 2 0 0 3 75 0 0 0 0 78
Quarter – 3 0 0 3 75 0 0 0 0 78
Quarter – 4 0 0 3 75 0 0 0 0 78

Ministry of Tourism Nielsen India Pvt. Ltd.
Government of India
Final Report For Dadra & Nagar Haveli – Annexure 1: Methodology 9
Visitors Profiling Tables Table – 16
Age Distribution of Sample Visitors in the State
It is to be noted from the table above that predominant age group was 35-44 years among domestic overnight, day and foreign visitors. Most of the visitors to Dadra Nagar Haveli are males with females comprising a small proportion.
Table – 17
Sex Distribution of Sample Visitors in the State
The gender wise distribution of sample visitors to Dadra Nagar Haveli is mentioned in the table above. Male visitors are in majority in both the categories of domestic overnight as well as domestic day visitors. The same is observed for foreign visitors too.
Table – 18 Marital Status of Sample Visitors in the State
It is clear from the table above that most of the sample domestic overnight visitors to Dadra Nagar Haveli have marital status as married. However, majority of domestic day visitors and foreign visitors have marital status as unmarried. Others mentioned above cover the Widows, Divorcee etc.
Age Group
%age of Domestic Overnight Visitors
%age of Domestic Day Visitors
%age of Foreign Overnight Visitors
Male Female Male Female Male Female
(1) (2) (3) (5) (6) (8) (9)
15 – 24 Years 18 17 24 24 10 9 25 – 34 Years 30 31 28 27 30 29 35 – 44 Years 37 36 35 34 35 37 45 – 60 Years 14 15 12 14 23 24
>60 Years 1 1 1 1 2 1 Total 100 100 100 100 100 100
Gender %age of Domestic Overnight Visitors
%age of Domestic Day Visitors
%age of Foreign Overnight Visitors
(1) (2) (3) (4)
Male 64 55 72 Female 36 45 28 Total 100 100 100
Marital Status %age of Domestic Overnight Visitors
%age of Domestic Day
Visitors
%age of Foreign Overnight Visitors
(1) (2) (3) (4)
Married 63 42 41 Unmarried 33 52 53
Others 04 06 06 Total 100 100 100
Ministry of Tourism Nielsen India Pvt. Ltd.
Government of India
Final Report For Dadra & Nagar Haveli – Annexure 1: Methodology 10
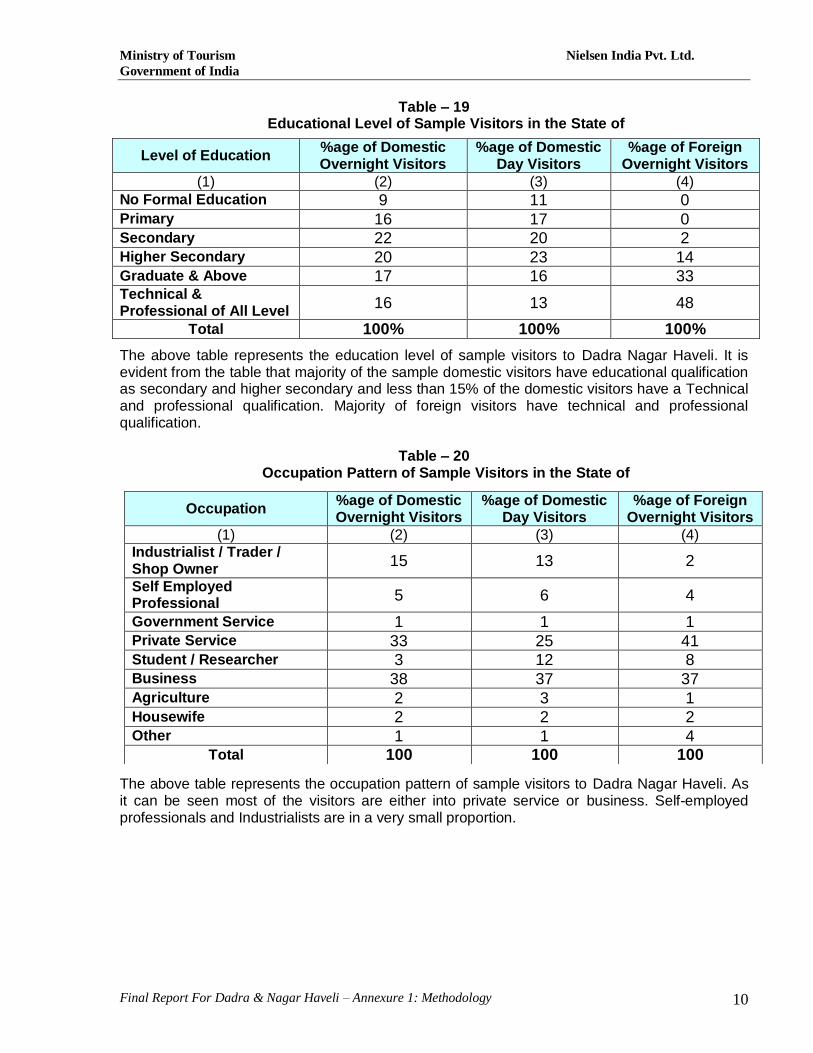
Table – 19 Educational Level of Sample Visitors in the State of
The above table represents the education level of sample visitors to Dadra Nagar Haveli. It is evident from the table that majority of the sample domestic visitors have educational qualification as secondary and higher secondary and less than 15% of the domestic visitors have a Technical and professional qualification. Majority of foreign visitors have technical and professional qualification.
Table – 20
Occupation Pattern of Sample Visitors in the State of
The above table represents the occupation pattern of sample visitors to Dadra Nagar Haveli. As it can be seen most of the visitors are either into private service or business. Self-employed professionals and Industrialists are in a very small proportion.
Level of Education %age of Domestic Overnight Visitors
%age of Domestic Day Visitors
%age of Foreign Overnight Visitors
(1) (2) (3) (4)
No Formal Education 9 11 0 Primary 16 17 0 Secondary 22 20 2 Higher Secondary 20 23 14 Graduate & Above 17 16 33 Technical & Professional of All Level
16 13 48
Total 100% 100% 100%
Occupation %age of Domestic Overnight Visitors
%age of Domestic Day Visitors
%age of Foreign Overnight Visitors
(1) (2) (3) (4)
Industrialist / Trader / Shop Owner
15 13 2
Self Employed Professional
5 6 4
Government Service 1 1 1 Private Service 33 25 41 Student / Researcher 3 12 8 Business 38 37 37 Agriculture 2 3 1 Housewife 2 2 2 Other 1 1 4
Total 100 100 100
Ministry of Tourism Nielsen India Pvt. Ltd.
Government of India
Final Report For Dadra & Nagar Haveli – Annexure 1: Methodology 11
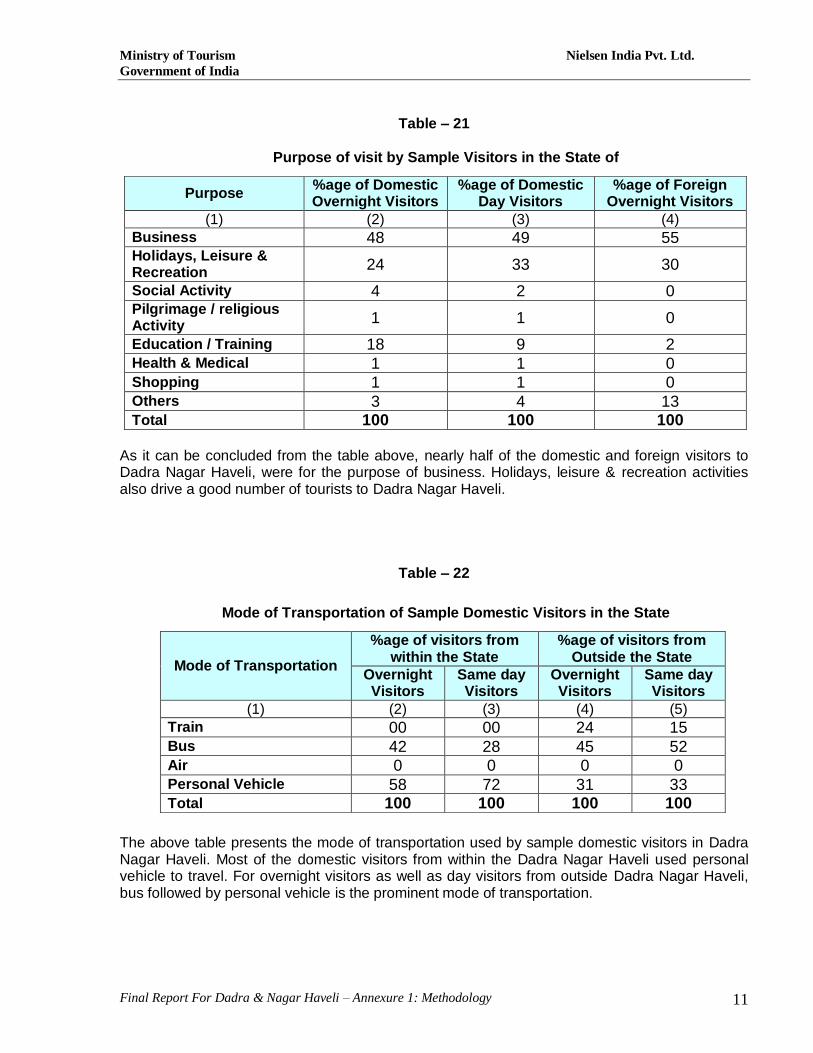
Table – 21
Purpose of visit by Sample Visitors in the State of
As it can be concluded from the table above, nearly half of the domestic and foreign visitors to Dadra Nagar Haveli, were for the purpose of business. Holidays, leisure & recreation activities also drive a good number of tourists to Dadra Nagar Haveli.
Table – 22
Mode of Transportation of Sample Domestic Visitors in the State
The above table presents the mode of transportation used by sample domestic visitors in Dadra Nagar Haveli. Most of the domestic visitors from within the Dadra Nagar Haveli used personal vehicle to travel. For overnight visitors as well as day visitors from outside Dadra Nagar Haveli, bus followed by personal vehicle is the prominent mode of transportation.
Purpose %age of Domestic Overnight Visitors
%age of Domestic Day Visitors
%age of Foreign Overnight Visitors
(1) (2) (3) (4)
Business 48 49 55 Holidays, Leisure & Recreation
24 33 30
Social Activity 4 2 0 Pilgrimage / religious Activity
1 1 0
Education / Training 18 9 2 Health & Medical 1 1 0 Shopping 1 1 0 Others 3 4 13 Total 100 100 100
Mode of Transportation
%age of visitors from within the State
%age of visitors from Outside the State
Overnight Visitors
Same day Visitors
Overnight Visitors
Same day Visitors
(1) (2) (3) (4) (5)
Train 00 00 24 15 Bus 42 28 45 52 Air 0 0 0 0 Personal Vehicle 58 72 31 33 Total 100 100 100 100

Ministry of Tourism Nielsen India Pvt. Ltd.
Government of India
Final Report For Dadra & Nagar Haveli – Annexure 1: Methodology 12
Table – 23
Mode of Transportation of Sample Foreign Visitors in the State
The above table represents the mode of transportation used by foreign visitors to travel to Dadra Nagar Haveli. As clearly stated above, nearly 90% of foreign tourists traveled by taxi to Dadra Nagar Haveli. Train is the next preferred option.
Table – 24 Travel Behavior of Sample Visitors in the State
The above table evaluates the travel behavior of sample visitors to Dadra Nagar Haveli. It is clear from the table above that for more than a quarter of the domestic visitors to Dadra Nagar Haveli; the frequency of visit is once in six months or once in 3 months. For most of the foreign visitors, the frequency of travel to Dadra Nagar Haveli is once in a year.
Table – 25 Propensity of availing package tour of Sample Visitors in the State of
The above mentioned is the measure the propensity of availing package tour among the sample visitors in the district of Dadra Nagar Haveli. And we conclude less people avail package tours for traveling to Dadra Nagar Haveli.
Mode of Transportation %age of Foreign visitors
Overnight Visitors
(1) (4)
Train 12 Air 0 Personal Vehicle 0 Taxi 88 Total 100
Frequency of Visits %age of Domestic Overnight Visitors
%age of Domestic Day Visitors
%age of Foreign Overnight Visitors
(1) (2) (3) (4)
Once a week or more often
0 1 0
Once a fortnight 0 3 0 Once a month 24 13 0 Once in 3 months 25 27 4 Once in 6 months 19 22 17 Once in a Year 21 20 48 Less Often 11 15 31 Total 100 100 100
%age of Domestic Overnight Visitors
%age of Domestic Day Visitors
%age of Foreign Overnight Visitors
(1) (2) (3) (4) Percentage of Tourists availing package tour
16 1 4

Ministry of Tourism Nielsen India Pvt. Ltd.
Government of India
Final Report For Dadra & Nagar Haveli – Annexure 1: Methodology 13
Table – 26
Travel Arrangement Mode of Sample Visitors in the State
As concluded from the previous table that few people avail package tour, thus most of the domestic visitors traveling to Dadra Nagar Haveli make their travel arrangements themselves, which can be justified from the findings presented in the above table. However, foreign visitors rely on their office/ employer for making travel arrangements to Dadra Nagar Haveli.
Table – 27
Distribution of overnight visitors by place of stay of Sample Visitors in the State
The category wise details regarding the place of stay are presented above. It may be seen from the table above that most of the overnight tourist preferred non-star hotel as the place of stay. Star hotels are the other prominent choice for place of stay.
Travel Arrangement Mode
%age of Domestic Overnight Visitors
%age of Domestic Day Visitors
%age of Foreign Overnight Visitors
(1) (2) (3) (4)
Self 46 55 8 Office / Employer 30 26 52 Travel Agent 22 18 24 Tour Operator 2 1 16 Total 100 100 100
Place of Stay %age of Domestic Overnight Visitors
%age of Foreign Overnight Visitors
(1) (2) (3)
Star Hotel 18 44 Non-Star Hotel 70 66 Motel 0 0 Govt. Guest House / Circuit House / Bhawan / Sadan
0 0
Private Guest House / Inn / Rest House / Tourist Bungalow
0 0
Dharamshala / Sarai / Musafirkhana
0 0
Gurudwara / Temple / Monastery / Other Temporary free stay in tent etc.
0 0
Friends & Relative 12 0 Bed & Breakfast Unit 0 0 Youth / YMCA Hostel 0 0 Other (Company guest house, Community Dharamshalas, etc.)
0 0
Total 100 100

Ministry of Tourism Nielsen India Pvt. Ltd.
Government of India
Final Report For Dadra & Nagar Haveli – Annexure 1: Methodology 14
Table – 28
Distribution of visitor by their preferred eating place of Sample Visitors in the State
The above table gives the percentage distribution of visitor by their preferred eating place of sample visitors in the district of Dadra Nagar Haveli. It may be seen that majority of domestic day visitors preferred Restaurants for eating whereas majority of domestic overnight visitors preferred their place of lodging for eating. Most of the foreign visitors, like domestic overnight visitors, preferred their place of lodging for eating.
Eating Place %age of Domestic Overnight Visitors
%age of Domestic Day Visitors
%age of Foreign Overnight Visitors
(1) (2) (3) (4)
Restaurant 28 48 22 Fast Food Outlets 9 22 4
Cafeteria 2 4 3
Dhaba 0 0 0
Bars 19 21 11
Mobile Van 0 0 0 Refreshment Stand 1 2 0
Dharamshala / Sarai 0 0 0
Gurudwara / Temple / Monastery / Other free accommodation
0 0 0
Friends & Relatives 10 3 0
Other 0 0 0
Lodging Place 30 0 60
Total 100 100 100

Ministry of Tourism Nielsen India Pvt. Ltd.
Government of India
Final Report For Dadra & Nagar Haveli – Annexure 1: Methodology 15
Table – 29
Satisfaction level of services by Sample Visitors in the State
Services %age of Domestic Overnight Visitors
%age of Domestic Day Visitors
%age of Foreign Overnight Visitors
Satisfied Dissatisfied Satisfied Dissatisfied Satisfied Dissatisfied
(1) (2) (3) (4) (5) (6) (7)
Availability of Tour Operator
22 68 60 40 20 80
Availability of Transportation
45 55 40 60 40 55
Availability of Tourist Guide
30 70 80 20 30 70
Availability of good quality accommodation
70 30 50 50 75 25
Public Convenience 35 65 40 60 90 10
Eating Places 78 32 70 30 75 25
Information Centers 10 90 20 80 10 90
Souvenir Shops 30 70 40 60 30 70
Entertainment Places
70 30 70 30 55 45
Quality of Roads 65 35 40 60 45 55
Security 70 30 70 30 50 50
Behavior of Local People
60 40 60 40 55 45
Shops other than souvenir ones
50 50 50 50 20 80
Upkeep of tourist sites
30 70 25 75 30 70
Accommodation tariff
30 70 00 00 65 45
Quality of Information
25 75 30 70 30 70

Ministry of Tourism Nielsen India Pvt. Ltd.
Government of India
Final Report For Dadra & Nagar Haveli – Annexure 1: Methodology 16
Table – 30
Expectation level of their visit to district / State of Sample Visitors in the State
The above table presents the percentage distribution across different expectation levels. There is a positive trend as most of the visitors found their visit to Dadra Nagar Haveli as per expectation or somewhat better than expectation.
Table – 31
Popular Source of Information of tourist destination of the Sample Visitors in the State
The categories (Information Source) in the above table reflect on the popular source of information about tourist destinations in Dadra Nagar Haveli. As seen from the table above, The State Tourism department and relatives & friends have been the most popular source of information for domestic visitors traveling to the district. For foreign visitors to Dadra Nagar Haveli, internet and travel books has been the most important source of information.
Expectation level %age of Domestic Overnight Visitors
%age of Domestic Day Visitors
%age of Foreign Overnight Visitors
(1) (2) (3) (4)
Much Better than expectation 5 2 4 Somewhat better than expectation
15 12 5
As per expectation 77 76 80 Worse than expectation 2 5 10 Much worse than expectation 1 5 1 Total 100 100 100
Information Source %age of Domestic Overnight Visitors
%age of Domestic Day
Visitors
%age of Foreign Overnight Visitors
(1) (2) (3) (4)
Indian Embassy in your Country
0 0 14
Indian Tourism Bureau in your country
0 0 0
Indian Tourism Office in India
8 0 4
State Tourism department
35 30 6
Travel Agent 5 5 26 Internet 15 16 13 Travel Books / Guides / Magazines / Newspaper
10 12 22
Relatives / Friends 25 28 4 Other 10 10 11
Ministry of Tourism Nielsen India Pvt. Ltd.
Government of India
Final Report For Dadra & Nagar Haveli – Annexure 1: Methodology 17
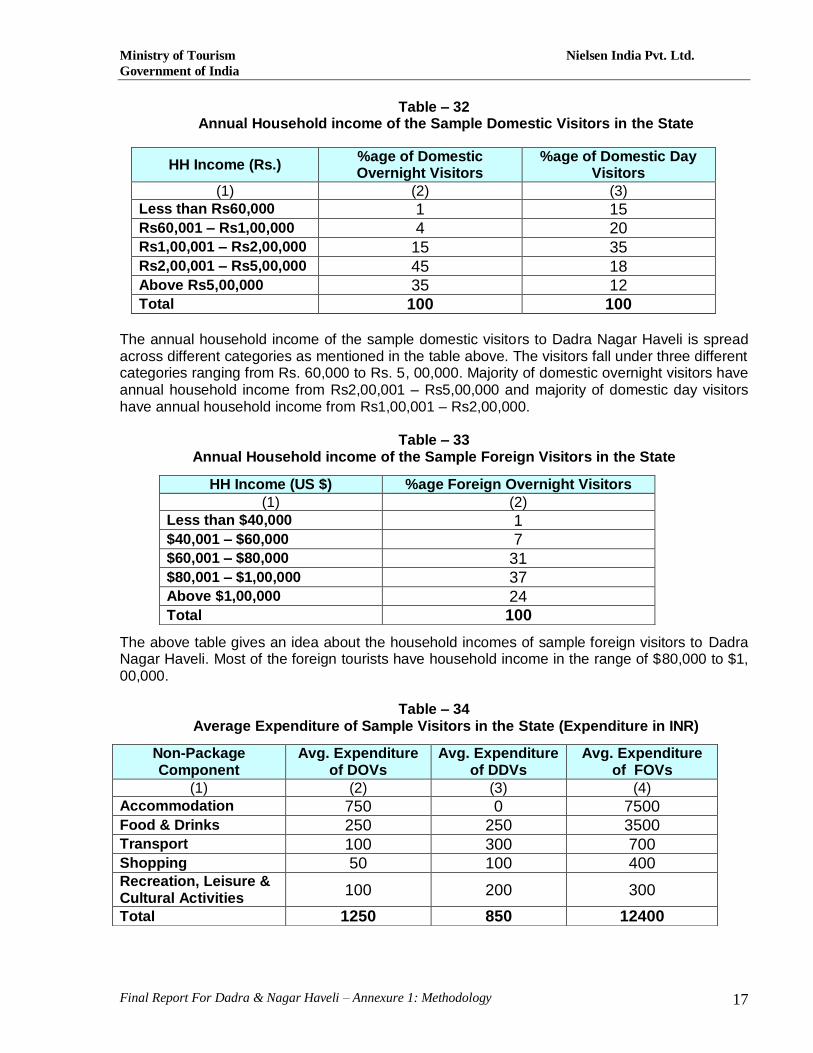
Table – 32 Annual Household income of the Sample Domestic Visitors in the State
The annual household income of the sample domestic visitors to Dadra Nagar Haveli is spread across different categories as mentioned in the table above. The visitors fall under three different categories ranging from Rs. 60,000 to Rs. 5, 00,000. Majority of domestic overnight visitors have annual household income from Rs2,00,001 – Rs5,00,000 and majority of domestic day visitors have annual household income from Rs1,00,001 – Rs2,00,000.
Table – 33 Annual Household income of the Sample Foreign Visitors in the State
The above table gives an idea about the household incomes of sample foreign visitors to Dadra Nagar Haveli. Most of the foreign tourists have household income in the range of $80,000 to $1, 00,000.
Table – 34
Average Expenditure of Sample Visitors in the State (Expenditure in INR)
HH Income (Rs.) %age of Domestic Overnight Visitors
%age of Domestic Day Visitors
(1) (2) (3)
Less than Rs60,000 1 15 Rs60,001 – Rs1,00,000 4 20 Rs1,00,001 – Rs2,00,000 15 35 Rs2,00,001 – Rs5,00,000 45 18 Above Rs5,00,000 35 12 Total 100 100
HH Income (US $) %age Foreign Overnight Visitors
(1) (2)
Less than $40,000 1 $40,001 – $60,000 7 $60,001 – $80,000 31 $80,001 – $1,00,000 37 Above $1,00,000 24 Total 100
Non-Package Component
Avg. Expenditure of DOVs
Avg. Expenditure of DDVs
Avg. Expenditure of FOVs
(1) (2) (3) (4)
Accommodation 750 0 7500 Food & Drinks 250 250 3500 Transport 100 300 700 Shopping 50 100 400 Recreation, Leisure & Cultural Activities
100 200 300
Total 1250 850 12400
Ministry of Tourism Nielsen India Pvt. Ltd.
Government of India
Final Report For Dadra & Nagar Haveli – Annexure 1: Methodology 18
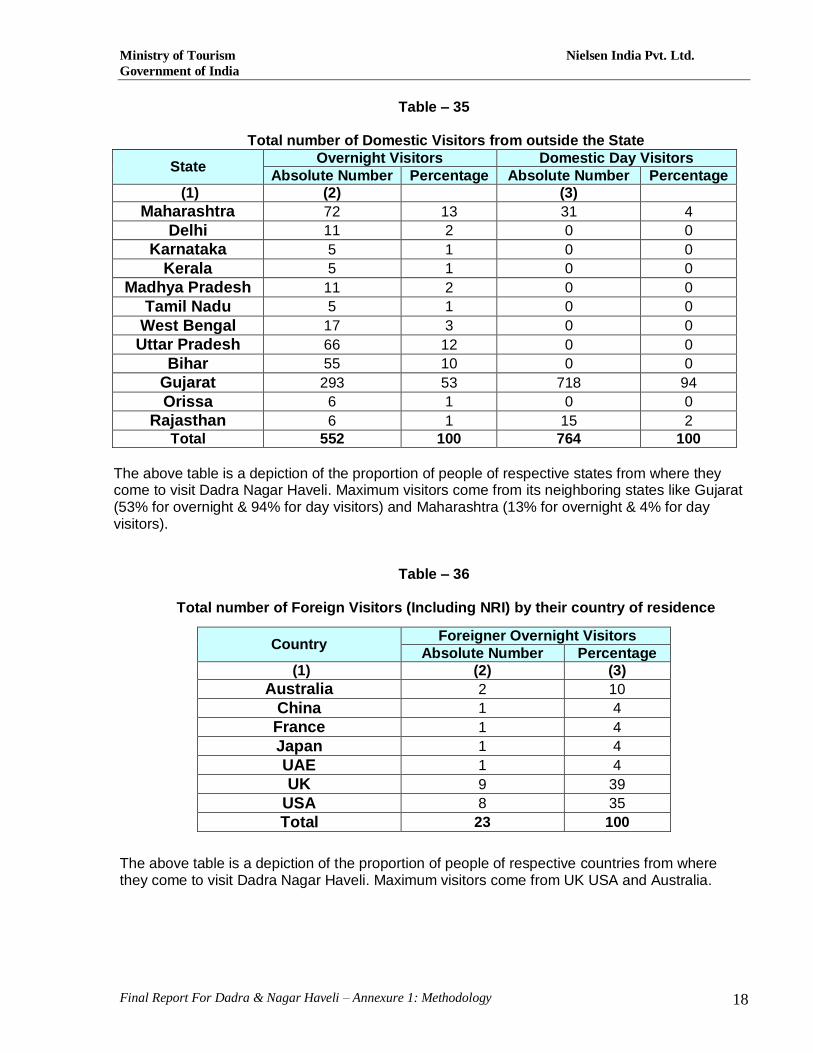
Table – 35
Total number of Domestic Visitors from outside the State
State Overnight Visitors Domestic Day Visitors
Absolute Number Percentage Absolute Number Percentage
(1) (2) (3)
Maharashtra 72 13 31 4
Delhi 11 2 0 0
Karnataka 5 1 0 0
Kerala 5 1 0 0
Madhya Pradesh 11 2 0 0
Tamil Nadu 5 1 0 0
West Bengal 17 3 0 0
Uttar Pradesh 66 12 0 0
Bihar 55 10 0 0
Gujarat 293 53 718 94
Orissa 6 1 0 0
Rajasthan 6 1 15 2
Total 552 100 764 100
The above table is a depiction of the proportion of people of respective states from where they come to visit Dadra Nagar Haveli. Maximum visitors come from its neighboring states like Gujarat (53% for overnight & 94% for day visitors) and Maharashtra (13% for overnight & 4% for day visitors).
Table – 36
Total number of Foreign Visitors (Including NRI) by their country of residence
The above table is a depiction of the proportion of people of respective countries from where they come to visit Dadra Nagar Haveli. Maximum visitors come from UK USA and Australia.
Country Foreigner Overnight Visitors
Absolute Number Percentage
(1) (2) (3)
Australia 2 10
China 1 4
France 1 4
Japan 1 4
UAE 1 4
UK 9 39
USA 8 35
Total 23 100

Ministry of Tourism Nielsen India Pvt. Ltd.
Government of India
Final Report For Dadra & Nagar Haveli – Annexure 1: Methodology 19
ANNEXURE – 1
Methodology for Estimation of Domestic and Foreign Tourists Visit at District Level in India
I. Introduction Ministry of Tourism compiles data on domestic and foreign tourist visits in State/ UT based on the information received from the State/ UT Governments. Such information at State/ UT level is generally collected by State Tourism Departments on the basis of administrative records and returns. In many cases, the information supplied does not cover the same-day visitors, visitors staying with friends and relatives, etc. Doubts have been also expressed by experts about the reliability of the data on domestic and foreign tourist visits released every year. A need was felt to prepare a standard methodology for estimation of number of visitors at district level which can be used by the State/ UT Governments. This methodology should enable the compilation of such data on monthly basis. The methodology should also help in preparation of estimates of number of visitors for some period after the base line survey, mainly based on the information to be collected from the accommodation units without resorting to regular large scale survey. Keeping these requirements in view, a methodology has been prepared which will be initially used in the tourism surveys to be commissioned by the Ministry of Tourism in 5 states namely, Dadra Nagar Haveli, Delhi, Jharkhand, Maharashtra and Punjab. The details of the methodology are given in the subsequent paragraphs. II. Definitions
The definitions of various terms to be used in the survey are given below. Usual place of Residence: The usual place of residence of a person is the village/ town
where the person has been staying continuously for at least 6 months prior to the date of the survey. Usual Environment: The usual environment refers to the geographical boundaries within which a person moves within his/ her regular routine of life. Trip: A trip refers to the travel by a person from the time of departure from his usual
environment until he/ she returns. It, thus, refers to a round trip. A trip may be made up of visits to different places. Visitor: A visitor is a traveller taking a trip to a main destination outside his/ her usual environment for any main purpose (business, leisure or other personal purpose) other than to
be employed at the place visited. Tourist: A visitor is classified as a tourist if his/ her trip includes an overnight stay. A tourist is also referred to as an overnight visitor. Same-day visitor: A visitor is classified as a same-day visitor if his/ her trip does not include an overnight stay. A same-day visitor is also referred to as an excursionist.

Ministry of Tourism Nielsen India Pvt. Ltd.
Government of India
Final Report For Dadra & Nagar Haveli – Annexure 1: Methodology 20
Exclusion: The same-day visitors at a tourist destination for whom the tourism destination is part
of their usual environment, are not considered same-day visitors for the purpose of this survey. Foreign Visitor: A visitor having a foreign passport will be treated as a foreign visitor. Even a Non- Resident Indian (NRI) will be treated as a foreign visitor. NRIs have Indian passports but may be living, or are likely to live, in other countries for 6 months or more. Domestic Visitor: A visitor, who is a resident Indian, will be treated as a domestic visitor. Tourist Destination: The tourist destinations would generally be as defined by the State in
terms of geographical area and tourist interest. A tourist destination should be a clearly identified area/ location. A tourist location could be a ticketed closed area, non-ticketed closed area, or an open area without clearly specified boundaries. It may be a location maintained by Central Govt., State Govt., local body or any other organization, including those run by the private sector. A tourist location may consist of more than one tourist spots. However, the following norms should be adhered to for identifying a tourist location as a tourist destination: (i) Each ticketed tourist location will be considered as one tourist destination irrespective of the number of tourist spots at that location covered under the common ticket. (ii) If there are 2 or more tourist spots within close proximity which are not ticketed, the location would be considered to be a single destination if a visitor usually visits most or all the spots in the same visit. Town:
Definition of the town will be same as that used in 2001 Population Census of India. III. Objective
The field survey in a State will be conducted for a period of 12 months in all districts of the State. The survey will be used to obtain the following month-wise information for each district: a. Estimated number of visits (i) Visits by overnight visitors- staying at accommodation units;
- staying with friends and relatives - others, such as those staying in tented accommodations provided by State Govt. or by any other charitable organizations, etc.
(ii) Visits by same-day visitors b. Profile of visitors, their expenditure pattern, purpose of visits, etc. c. Occupancy rates and direct employment in accommodation units. IV. Approach
To meet the objectives, first the tourist destinations have to be identified before the start of the survey. Two possible variables studied for identification of the tourist destination werenumber of tourists and number of accommodation units. However, interaction of the consultant with the state authority revealed that past data on number of tourists at various destinations are generally not available. Similarly, the analysis of the unit level data of Economic Census 2005 revealed that data on number of hotels below the district level are not available. Therefore, first towns important from tourist angle have to be identified. All the tourist destinations in the identified

Ministry of Tourism Nielsen India Pvt. Ltd.
Government of India
Final Report For Dadra & Nagar Haveli – Annexure 1: Methodology 21
towns will be covered in the survey. In the identified towns two types of survey, namely Survey at tourist destination and Survey of Accommodation units will be done. The survey of tourist destination will broadly provide the estimate of tourists for leisure purpose, however, the purpose of the survey is to have an estimate of tourists for all type of purposes such as visiting friends and relatives, business, etc. Similarly, the Survey at tourist destination and at Accommodation unit will not provide information about the visitors staying with friends and relatives and in accommodation units but not visiting any tourist destination as well as same day visitors not visitors not visiting any tourist destinations. To get these information surveys at important Entry/Exit Points of the district will be also conducted. The ratio obtained from this exit survey will be used to find out the estimate of tourist for non-leisure purposes. However, this adjustment will be done only at district level. The district level estimates will be worked out by adding the leisure tourists at all the towns covered in the survey and multiplying it by the ratio of total urban population of the district to the total population of the towns covered in the survey. The estimate of non-leisure tourists will be worked out from the data of exit survey and added to the estimate of leisure tourists to find out the district level estimate of visitors. The state level estimate of visitors (tourists and same day visitors) will be worked out by adding the district level estimates of visitors. V. Methodology
The methodology envisages three stage sampling. The first stage units will be the towns important from tourism perspective, the second stage units will be the tourist destinations in the selected town or linked to the selected town, and the visitors within a tourist destination will constitute the third stage units. The procedure for selection of first, second and third stage units are given below: (i) Selection of Towns important for Tourism In the absence of reliable information about the number of tourists or accommodation units at tourist destination, towns, which are important from tourism perspective, will be identified in each district in consultation with the State Government. Apart from such towns, the towns which cater to the accommodation needs of visitors to important tourist destinations located in non-urban areas will also be identified. For the latter cases, only one – the most important – town will be identified with one tourist destination. Therefore, as per this methodology, the first stage in this survey will be the identification of towns important for tourism purposes. (ii) Selection of Tourist Destinations in the Selected Town
All the tourist destinations in a selected town will be covered in the survey. In case the number of tourist destinations in the selected town is large, only the important ones will be covered in the survey. (iii) Selection of Visitors at a Tourist Destination for brief profiling (a) Sample size of visitors at district level
The sample is required for estimating the number of visitors at district level from the data collected at destination/ spot level. Statistically, the sample size may be obtained from the following expression,
n = Z 2
1-α/2 p(1-p)/d2
Where p= anticipated proportion to be estimated 100(1- α /2) % is the confidence level and

Ministry of Tourism Nielsen India Pvt. Ltd.
Government of India
Final Report For Dadra & Nagar Haveli – Annexure 1: Methodology 22
d=absolute precision required on either side in the proportion in percentage points Statistically, we require a sample size of about 400 respondents (384 to be exact) to get estimate of a parameter with a precision of 5% points and 95% level of confidence. As the data is required on monthly basis this sample size may be required on a monthly basis. (iv) Distribution of Sample Size in Towns and at Tourist Destinations
(a) Distribution of sample size amongst selected towns in a district: The district sample size
of 600 visitors will be distributed among the selected towns in proportion to the 2001 Census population of these towns. (b) Distribution of sample size among tourist destinations in a selected town: If there are
more than one tourist destinations in a selected town, the sample size allocated for the town will be equally distributed among the tourist destinations. (c) Selection of days for survey of visitors in different months
The survey will be conducted during all the 12 months of the year at each selected destination. Information about important festivals, fairs, religious events at the selected tourist destinations will be collected in advance for the 12-month period. In a particular month at a particular destination, survey will be done during 2 weeks. In the first week, first 3 days of the week will be covered, and in the second week last 4 days of the week will be covered. For this purpose, first day of the month will be considered as the first day of the week. The dates of survey at a tourist destination during the 12 months will be as follows.
Month Weeks Days of weeks Dates of the month
First First and Third 1st week: 1-3 days 3rd week: 4-7 days 1,2,3,18,19,20,21
Second Second and Fourth 2nd week: 1-3 days 4th week: 4-7 days 8,9,10, 25,26,27,28
Third First and Fourth 1st week: 1-3 days 4th week: 4-7 days 1,2,3,25,26,27,28
Fourth Second and Third 2nd week: 1-3 days 3rd week: 4-7 days 8,9,10,18,19,20,21
Fifth First and Second 1st week: 1-3 days 2nd week: 4-7 days 1,2,3,11,12,13,14
Sixth Third and Fourth 3rd week: 1-3 days 4th week: 4-7 days 15,16,17,25,26,27,28
Seventh to Twelve
Above pattern will be repeated
The date and week on which important tourism event is scheduled to take place at the selected tourist destination will be positively covered. If the important tourist event at the selected tourist destination falls outside the selected week and dates, the nearest week/dates will be substituted by the week/dates of the special event. (d) Canvassing of schedules to the visitors for brief profile

Ministry of Tourism Nielsen India Pvt. Ltd.
Government of India
Final Report For Dadra & Nagar Haveli – Annexure 1: Methodology 23
The monthly sample size of visitors at a selected tourist destination should be distributed equally on the 7 days of the survey work (in 2 weeks) at the destination. The services of 2 investigators would be required on the selected days at non- ticketed tourist destinations. The first investigator will basically count the number of visitors and second investigator will canvass the schedule to seek the information about overnight/ same-day visitors, domestic/ foreign visitors, etc. At a ticketed tourist destinations perhaps one investigator will be able to canvass the schedule because counting of the visitors may not be required. (v) Details of the Surveys (A) Survey at Tourist Destinations A survey of visitors at tourist destinations has to be done to obtain the following information: (a) Total number of visits (i) Ticketed Destinations:- If the tourist destination is a ticketed destination with differential
pricing for domestic and foreign visitors, the data on number of foreign and domestic visits separately during any day would be available from sale record of tickets. If the destination has common ticket for both domestic and foreign visitors, then an assessment of the distribution of visits by domestic and foreign visitors would have to be made by counting the visitors at the entry point(s). To capture the variations in visitors’ number on different days of the week as well as at different time periods of a day, this exercise would have to be carried out at different periods of time of the day, and on different days of the week. Many destinations attract large number of visitors during specific periods of the year, such as Kumbh Mela, Suraj Kund Mela, etc. Such periods should be identified in advance, and the survey should cover such specific periods. (ii) Non-Ticketed Destinations:- In such cases, the total number of visitors, during the day,
along with its break-up into domestic and foreign visitors, has to be assessed by counting the number of such visitors at specified time slot at entry point (s). If there are more than one entry points to the tourist destination, all should be covered by pre-specified rotation, for counting the number and broad distribution. If there is no specific entry point, investigator will have to notionally designate appropriate points as entry points based on the flow of visitors to such a destination. (b) Brief Profile of Visitors Break-up of number of visitors into overnight visitors staying at accommodation units, overnight visitors staying with friends and relatives, other overnight visitors, and the same-day visitors, separately for domestic and foreign visitors, has to be obtained. For this, a small questionnaire, comprising 5-6 questions, has to be canvassed. As getting this information is the prime objective of the survey, the sample size should be adequate to provide the desired breakup of different type of visits. In para IV (A)(ii)(a), the desired sample size at district level has been worked out to be 400 visitors. However, it has been decided that the number of visitors to be selected for this short profile survey will be 800 per district per month. (B) Survey of Accommodation Units
All the accommodation units (hotels, tourist lodges, dharamshalas, motels, Govt. / private companies, guest houses, etc.) in the selected towns will be listed with the help of Municipal Corporations or other competent authorities. If a tourist destination not located in the town is linked to a non-urban tourist destination in terms of providing accommodation facilities to tourists

Ministry of Tourism Nielsen India Pvt. Ltd.
Government of India
Final Report For Dadra & Nagar Haveli – Annexure 1: Methodology 24
visiting that destination, the list of additional accommodation units located near such tourist destinations will also be included in the list of accommodation units of the town.
The accommodation units so listed will be grouped in the following categories: (ii) Classified hotels (iii) Other accommodation units
a. Having more than 20 rooms b. Having 10-20 rooms c. Having less than 10 rooms
From all the selected accommodation units, the following 2 types of information will be collected:
(i) Particulars of the accommodation unit- Apart from the identification details, the information would be collected on number of rooms, number of beds, total number of persons employed, annual turnover, etc. This information would be collected initially, and thereafter updated every quarter along with the updating of the list of accommodation units. (ii) Information about overnight visitors- Based on the records available with the
accommodation units, information on number of guests checked-in, number of nights spent, whether domestic or foreign, residency status of the tourists (within the state, within country, outside country), etc. would be collected. This information has to be collected every month for the preceding month.
All the classified hotels would be covered for collecting both the information. For the remaining 3 categories of accommodation units, 10% of the units in each will be covered. These 10% accommodation units will be selected by using circular systematic sampling method. In metropolitan cities, list of all the accommodation units will have to be prepared for the survey work. For collecting information about the number of visitors and their other details as well as information about the accommodation units for a particular month, the selected accommodation units will be visited in the 1st week of the succeeding month. (C) Survey at Entry/Exit Points of the district
The survey at the tourist destinations will not be able to capture the following categories of visitors:
(a) Visitors staying with friends and relatives and not visiting any tourist destination; (b) Visitors staying in accommodation units but not visiting any tourist destination; (c) Same day visitors not visiting any tourist destination
For having an idea about the total number of visitors in the district, information about visitors collected at tourist destinations has to be supplemented by information on the above categories of visitors. To meet this objective, exit survey of the visitors at the major exit/ entry points of the district will be conducted to have information about the above mentioned categories of visitors as well as for detailed profiling of the visitors. In view of the fact that profiling of the visitors is not likely to change over a short time interval, profile of visitors will be generated only at district level on quarterly basis. The requirement of the sample size for this exercise would also be less. It has been decided to conduct the interview of 200 visitors every quarter in each district.
As the information collected in the exit survey used for estimating the number of non-leisure visitors in the district, the exit survey will be conducted only in the first month of the quarter so that its result can be used for the three months of the quarter. All the four weeks as well as the days (week days and weekends) in a month should be covered on representative basis.

Ministry of Tourism Nielsen India Pvt. Ltd.
Government of India
Final Report For Dadra & Nagar Haveli – Annexure 2: Estimation Procedure 25
Annexure – 2: Estimation Procedure
I. Estimation from survey at Entry / Exit points in a Quarter From the survey at major entry/exit points of the district, we get the following: x DT – h-l = no. of domestic leisure visitors to the district in the sample at all exit points covered who
stayed at hotels. x DT – h-nl = no. of domestic non-leisure visitors to the district in the sample at all exit points
covered who stayed at hotels.
a DT – h-l = average no. of tourist destinations in the district visited by a domestic leisure tourist who stayed at a hotel based on the survey at exit points. Clearly, a DT – h-l ≥ 1 Similarly, we define x DT – f – l , x DT – f – nl, a DT – f – l for domestic tourists staying with Friends & Relatives x DT – o – l , x DT – o – nl, a DT – o – l for domestic tourists staying at other places x DS– l , x DS– nl, a DS – l for domestic same day visitors
x FT– h - l , x FT–h-nl, a FT-h – l for foreign Tourist staying at hotels x FT– f - l , x FT–f-nl, a FT-f – l for foreign Tourist staying with friends and relatives
x FT–o - l , x FT–o-nl, a FT-o – l for foreign tourists staying at other places x FS– l , x FS–nl, a FT – l for foreign same day visitors.
II. Estimation of tourists for a tourist destination in a month Define the following notations: Assume that i stands for ith destination selected in the selected town, j stands for jth day selected for survey at the ith destination (j=1,2,…,di); k stands for the kth entry point at the ith destination (k=1,2,,…,ei); l stands for the lth entry hour at the kth entry point at ith destination (l=1,2,…,h ik).
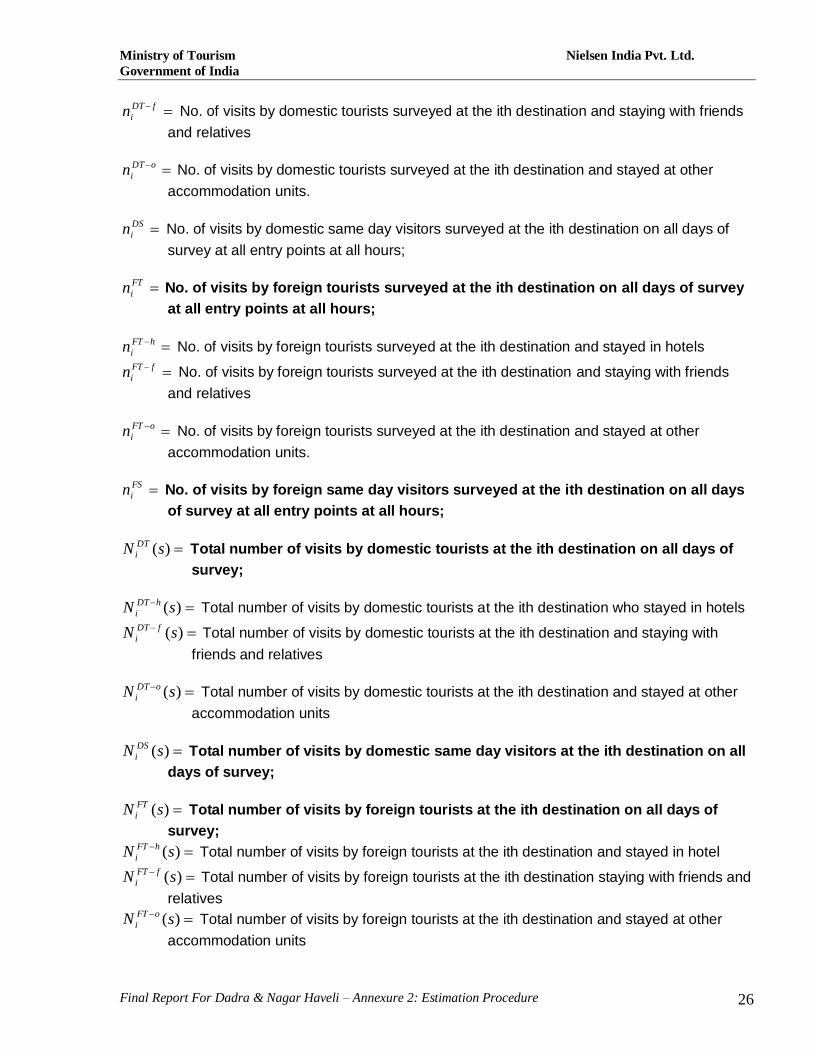
DT
in No. of visits by domestic tourists surveyed at the ith destination on all days of
survey at all entry points at all hours;
hDT
in No. of visits by domestic tourists surveyed at the ith destination and stayed in hotels,
Ministry of Tourism Nielsen India Pvt. Ltd.
Government of India
Final Report For Dadra & Nagar Haveli – Annexure 2: Estimation Procedure 26
fDT
in No. of visits by domestic tourists surveyed at the ith destination and staying with friends
and relatives
oDT
in No. of visits by domestic tourists surveyed at the ith destination and stayed at other
accommodation units.
DS
in No. of visits by domestic same day visitors surveyed at the ith destination on all days of
survey at all entry points at all hours;
FT
in No. of visits by foreign tourists surveyed at the ith destination on all days of survey
at all entry points at all hours;
hFT
in No. of visits by foreign tourists surveyed at the ith destination and stayed in hotels
fFT
in No. of visits by foreign tourists surveyed at the ith destination and staying with friends
and relatives
oFT
in No. of visits by foreign tourists surveyed at the ith destination and stayed at other
accommodation units.
FS
in No. of visits by foreign same day visitors surveyed at the ith destination on all days
of survey at all entry points at all hours;
)(sN DT
i Total number of visits by domestic tourists at the ith destination on all days of
survey;
)(sN hDT
i Total number of visits by domestic tourists at the ith destination who stayed in hotels
)(sN fDT
i Total number of visits by domestic tourists at the ith destination and staying with
friends and relatives
)(sN oDT
i Total number of visits by domestic tourists at the ith destination and stayed at other
accommodation units
)(sN DS
i Total number of visits by domestic same day visitors at the ith destination on all
days of survey;
)(sN FT
i Total number of visits by foreign tourists at the ith destination on all days of
survey;
)(sN hFT
i Total number of visits by foreign tourists at the ith destination and stayed in hotel
)(sN fFT
i Total number of visits by foreign tourists at the ith destination staying with friends and
relatives
)(sN oFT
i Total number of visits by foreign tourists at the ith destination and stayed at other
accommodation units

Ministry of Tourism Nielsen India Pvt. Ltd.
Government of India
Final Report For Dadra & Nagar Haveli – Annexure 2: Estimation Procedure 27
)(sN FS
i Total number of foreign same day visitors at the ith destination on all days of
survey;
DT
iN Total number of domestic tourists at the ith destination during the month
hDT
iN Total number of visits by domestic tourists at the ith destination during the month and
stayed in hotel
fDT
iN Total number of visits by domestic tourists at the ith destination during the month and
staying with friends and relatives
oDT
iN Total number of visits by domestic tourists at the ith destination during the month and
stayed at other accommodation units
DS
iN Total number of visits by domestic same day visitors at the ith destination during
the month;
FT
iN Total number of visits by foreign tourists at the ith destination during the month;
hFT
iN Total number of visits by foreign tourists at the ith destination during the month and
stayed in hotel
fFT
iN Total number of visits by foreign tourists at the ith destination during the month and
staying with friends and relatives
oFT
iN Total number of visits by foreign tourists at the ith destination during the month and
stayed at other accommodation units
FS
iN Total number of visits by foreign same day visitors at the ith destination during the
month;
iN Total number of visits at the ith destination during the month
= NiDT + Ni
DS + Ni FT + Ni
FS From the survey at the destination, following distribution is available:
The estimation of number of visits at the three distinct types of destinations will be as follows:
Case I: Non-ticketed destinations
Domestic Foreign hDT
in
hFT
in
fDT
in
fFT
in
oDT
in
oFT
in
DS
in FS
in

Ministry of Tourism Nielsen India Pvt. Ltd.
Government of India
Final Report For Dadra & Nagar Haveli – Annexure 2: Estimation Procedure 28
In this case, it may be observed that
i) iN is not available;
ii) )(sN D
i and )(sN F
i are to be estimated by a count of visitors;
iii) An estimate of iN is given by
)()( sNsNN F
i
D
ii x(No. of days in the month/ di ); (di = 7)
iv) Estimates of D
iN and F
iN are given by
D
iN = )(sN D
i X 31* / 7
F
iN = )(sN F
i X 31* / 7
* Number of days in the surveyed month
v) Estimates for tourists and same day visitors will be obtained as
D
iD
i
hDT
ihDT
i Nn
nN .
F
iF
i
hFT
ihFT
i Nn
nN .
D
iD
i
fDT
ifDT
i Nn
nN .
F
iF
i
fFT
ifFT
i Nn
nN .
D
iD
i
oDT
ioDT
i Nn
nN .
F
iF
i
oFT
ioFT
i Nn
nN .
D
iD
i
DS
iDS
i Nn
nN .
F
iF
i
FS
iFS
i Nn
nN .
For special occasions like Kumbh Mela, Surajkund Mela etc., it would be advisable to work out average number of tourists per day on the respective destination, based on the sample days observed during the occasion (Mela) period and estimate the number of tourists in that destination for the occasion (Mela) by multiplying the average number of tourists per day by the number of Mela days. The estimates for non-Mela days may be obtained as usual and monthly estimates may be obtained by pooling number of tourists for Mela and non-Mela days.
Case II: Destinations with common ticketing It may be observed that
i) iN is available
ii) )(sN D
i and )(sN F
i are to be estimated by a count of visitors.

Ministry of Tourism Nielsen India Pvt. Ltd.
Government of India
Final Report For Dadra & Nagar Haveli – Annexure 2: Estimation Procedure 29
iii) Steps (iv) and (v) of case I are to be followed. First divide iN into D
iN and F
iN , and
then D
iN into hDT
iN ,
fDT
iN ,
oDT
iN and
DS
iN , and F
iN into hFT
iN ,
fFT
iN ,
oFT
iN and
FS
iN respectively.
Case III: Destinations with differential ticketing
In this case,
i) iN , D
iN and F
iN are available.
ii) D
iN and F
iN will be split as in step (V) of case I
Exclusion of visitors for whom the destination is part of ‘usual environment’
In the case of a non-ticketed destination, the number of visitors, as recorded in the counting
sheet, also includes persons for whom the tourist destination is part of their ‘usual environment’.
Such persons are not to be included for the estimation of number of visitors in the current survey.
However, it is not possible to distinguish such persons while filling up the counting sheet. The
number of such persons has to be assessed on the basis of the number of persons who are
rejected for the short survey. For example, if 10 persons are interviewed for the short survey in a
day, the investigator may actually have contacted 30 persons, with 20 being rejected for interview
because the destination was part of their ‘usual environment’. Then the total number of visitors to
the destination would be assessed to be (10/30)*100% of the number available from the counting
sheet.
Estimation for a month including a special tourist Event
For each identified destination, the list of important tourist events for the whole year, along with
the corresponding time period, should be prepared in advance in consultation with the officials of
State Tourism Departments.
The estimation of number of visitors for such destinations is outlined below with the help of an example:- Suppose that the tourist destination is an important temple attracting (i) a very high number of visitors on a particular day of the week (say Monday), every week, and (ii) an exceptionally high number of visitors during a special event spanning a period of, say, 9 days of November. The field work and estimation of number of visitors in the months other than November and in the month of November would be done in different ways.

Ministry of Tourism Nielsen India Pvt. Ltd.
Government of India
Final Report For Dadra & Nagar Haveli – Annexure 2: Estimation Procedure 30
For the month of November The field work and surveys would be done for the following 3 categories of days:- (a) 9 days of the special event in November (b) 3 (or 4) Mondays of November excluding the 9 days of the special event (c) 18 (or 17) remaining days of November For (a), field work for adequate number of days (may be 2 or 3 or 4) would be done. For (b), field work would be done on 1 Monday selected as per the procedure described in the methodology note. For (c), field work would be done for 2 or 3 or 4 days depending on the number of days of field work for category (a). The estimation of number of visitors at this destination would be done separately for the three categories of days. For a month other than November (say January)
If there are any special events in January, the survey and estimation procedure would be as for November. If there are no such special events, the month would have the following two categories of days:- (a) 4 (or 5) Mondays (b) 27 (or 26) remaining days of the month The 7 days of the survey work would be selected as per the prescribed methodology (these will include 1 Monday). The estimation of number of visitors would be done separately for the above two categories of days.
III. Estimation of tourists for a town in a month Let the tourist destinations in uth town be numbered 1, 2,,………………t u . [Here, it may be noted that these destinations also include those that are not located in the town but are linked to the town from which the visitors visiting such destinations predominantly come from.] Let Mu = No. of visits by visitors to tourist destinations in the uth town in the month Mu
DT – h = No. of visits by domestic tourists staying in hotels to tourist destinations in the uth town in the month.

Ministry of Tourism Nielsen India Pvt. Ltd.
Government of India
Final Report For Dadra & Nagar Haveli – Annexure 2: Estimation Procedure 31
Similarly, we define Mu DT-f. Mu
DT-o , Mu DS, Mu
DT, Mu D, and Mu
FT-h, Mu FT-f, Mu
FT-o, Mu FS, Mu
FT, Mu F
Then, tu tu Mu
DT - h = ∑ NiDT –h Mu
FT - h = ∑ NiFT –h
i = 1 i = 1
tu tu Mu
DT - f = ∑ NiDT –f Mu
FT - f = ∑ NiFT –f
i = 1 i = 1 tu tu Mu
DT - o = ∑ NiDT –o Mu
FT - o = ∑ NiFT -o
i = 1 i = 1 Mu
DT = MuDT – h + Mu
DT - f + MuDT – o Mu
FT = MuFT – h + Mu
FT - f + MuFT - o
tu tu Mu
DS = ∑ NiDS Mu
FS = ∑ NiFS
i = 1 i = 1 Mu
D = MuDT + Mu
DS MuF = Mu
FT + MuFS
Mu = Mu
D + Mu F
Let the population of the town u be pu
IV. Estimation for a District in a month
Let Q = No. of visits by visitors at tourist destinations in all the surveyed towns (say u: 1, 2, …., t) in the district in the month. Q DT-h = No. of visits by domestic visitors at tourist destinations in all the surveyed towns in the district in the month who stayed in hotels. Similarly define Q DT-f, Q DT-o, Q DS, Q DT, Q D, Q FT-h, Q FT-f, Q FT-o, Q FS, QFT, QF
Then, t t QDT - h = ∑ Mu
DT –h QFT - h = ∑ MuFT –h
u = 1 u = 1

Ministry of Tourism Nielsen India Pvt. Ltd.
Government of India
Final Report For Dadra & Nagar Haveli – Annexure 2: Estimation Procedure 32
t t QDT - f = ∑ Mu
DT –f QFT - f = ∑ MuFT –f
u = 1 u = 1 t t QDT - o = ∑ Mu
DT –o QFT - o = ∑ MuFT –o
u = 1 u = 1 t t QDS = ∑ Mu
DS QFS = ∑ MuFS
u = 1 u = 1 QDT = QDT – h + QDT - f + QDT – o QFT = QFT – h + QFT - f + QFT - o QD = QDT + QDS QF = QFT + QFS Q = Q D + Q F Let the population of all the surveyed towns in the district be P t Then P = ∑ pu
u = 1 Let the urban population of the district be P*. That is , if the surveyed towns are numbered 1,2,3,……….., t and the other towns in the district are numbered t +1, t +2,…………t + s, then t +s t t +s t +s Then P* = ∑ pu = ∑ pu + ∑ pu = P +∑ pu u = 1 u = 1 u = t + 1 u = t + 1 Let Q* = No. of visits by visitors at tourist destination in the district in the month Similarly define Q* DT-h , Q* DT-f , Q* DT-o , Q* DS , Q* DT , Q* D and Q* FT-h , Q* FT-f , Q* FT-o , Q* FS , Q* FT , Q* F
P* Then, Q* = Q X P
P* Q * DT – h = Q DT – h X , and so on P Let Q # DT – h = No. of visitors who visited tourist destination in the district and stayed in hotels. Similarly define Q # DT – f, Q # DT – o, Q # DS
And

Ministry of Tourism Nielsen India Pvt. Ltd.
Government of India
Final Report For Dadra & Nagar Haveli – Annexure 2: Estimation Procedure 33
Q # FT – h ,Q # FT – f, Q # FT – o, Q # FS
Then,
Q # DT – h = Q *DT – h / a DT – h - l Q # FT – h = Q *FT – h / a FT – h - l
Q # DT – f = Q *DT – f / a DT – f - l Q # FT – f = Q *FT – f / a FT – f - l
Q # DT – o = Q *DT – o / a DT – o - l Q # FT – o = Q *FT – o / a FT – o - l
Q # DS = Q *DS / a DS - l Q # FS = Q *FS / a FS - l
V. Estimation of total visitors in the district In the steps mentioned above, only leisure tourists (those visiting the destination) have been estimated. However, visitors also include the non-leisure tourists. Estimation of total number of visitors in a district will be done as follows. Let R = No. of visitors ( leisure + non- leisure) in the district Similarly define, R DT-h, R DT-f, R DT-o, RDS, RDT, RD and R FT-h, R FT-f, R FT-o, RFS, RFT, RF
x DT-h-l + x DT – h - nl Then R DT-h = X Q # DT-h x DT-h-l
Similarly estimate RDT- f, RDT-o, RDS and RFT-h, R FT-f, R FT-o, RFS R DT = RDT-h + R DT-f + R DT-o, RD = RDT + RDS R FT = RFT-h + R FT-f + R FT-o, RF = RFT + RFS R = RD + RF
VI. Estimation of visitors at the State level District level estimates are to be added to obtain the state level estimates.

Ministry of Tourism Nielsen India Pvt. Ltd.
Government of India
Final Report For Dadra & Nagar Haveli – Annexure 3: Questionnaires / Survey Instruments 34
TOURIST SURVEY (EXIT POINTS)
Month: [1] April [2] May [3] June [4] July [5] August [6] September [7] October [8] November [9] December [10] January [11] February [12] March Week: [1] First [2] Second [3] Third [4] Fourth
1. Survey Point (RECORD BY TICKING ONE OPTION) [1] Railway Station [2] Airport [3] Bus Station [4] Hotel DEMOGRAPHIC PROFILE: (IN CASE OF FAMILY / GROUP, RESPONDENT IS THE HEAD OF THE FAMILY / GROUP) 2. Type of tourist: [1] Over-night visitor [2] Same-day visitor 3.Name: _____________________________Telephone No. (With STD/ISD Codes)_________________________ 4. Please tell me your approximate age? ______Years 5. Record gender: [1] Male [2] Female 6. Are you? [1] Married [2] Recently Married [3] Never Married [4] Others---------(Widow etc) 7. When did you arrive here? Date: _________ 8. Are you traveling…? READ OUT OPTIONS & TICK (SINGLE RESPONSE) [1] Alone [2] With Family [3] With Friends [4] With Family and Friends <IF ANSWER TO Q. 8 IS 2 OR 3 OR 4, THEN ASK Q. NO. 9 & 10 > 9. How many people have traveled with you? ___________ 10. Please give the information about gender and age of people, who have traveled with you? ASK & RECORD
Male Age Comp. Yrs Female Age Comp. YRS
11. How many nights have you spent in this place __________ 12. Are you a… [1] Indian (GO TO Q.13) [2] Foreigner (GO TO Q. 20 ) [3] NRI (GO TO Q. 26) <IF RESPONDENT IS AN INDIAN IN Q. 12, THEN ASK Q. 13>
State
Dist
Dest

Ministry of Tourism Nielsen India Pvt. Ltd.
Government of India
Final Report For Dadra & Nagar Haveli – Annexure 3: Questionnaires / Survey Instruments 35
13. Which state/ union territory of India do you reside in? _____________________ <ASK Q. 14 IF THE RESPONDENT BELONGS TO THE STATE OF (Name of the State) IN Q. 13 >
14. [1] Do you live in this city? Y/N [2] within same district [3] other district of same state 15. Have you traveled to this city before? [1] Yes [2] No 16. How have you traveled to this city? READ OUT OPTIONS & TICK (SINGLE RESPONSE) [1] By train [2] By bus [3] By air
[4] By personal vehicle [5] By taxi [6] Any other <ASK Q. 17 TO Q. 19 IF THE RESPONDENT BELONGS TO OTHER THAN THE STATE OF SURVEY
17. Is this your first visit to state? [1] Yes [2] No 18. Have you traveled to this STATE before? [1] Yes [2] No 19. How have you traveled to this state? READ OUT OPTIONS & TICK (SINGLE RESPONSE) [1] By train [2] By bus [3] By air
[4] By personal vehicle [5] By taxi [6] Any other_______________ < IF RESPONDENT IS FOREIGNER IN Q. 12, THEN ASK Q. 20 TO Q. 25> 20. Which country do you reside in? ______________________________________ 21. Is this your first visit to India? [1] Yes [2] No 22. Which was your port of entry in India? (Name of the port)________________________________ 23. Is this your first visit to this state? [1] Yes [2] No 24. Have you traveled to this city before? [1] Yes [2] No 25. How have you traveled to this state? READ OUT OPTIONS & TICK (SINGLE RESPONSE) [1] By train [2] By bus [3] By air
[4] By personal vehicle [5] By taxi [6] Any other_____________ < IF RESPONDENT IS AN NRI IN Q. 10, THEN ASK Q. No.26 TO Q 31 > 26. In which country do you live? ______________________________________ 27. How frequently you visit India? [1] Once in 3 months [2] Once in six months [3] Once in an year [4] Once in 2 years [5] Once in 3 years 28. Which was your port of entry in India? (NAME OF THE PORT) ________________________________ 29. Is this your first visit to this state? [1] Yes [2] No 30. Have you traveled to this city before? [1] Yes [2] No

Ministry of Tourism Nielsen India Pvt. Ltd.
Government of India
Final Report For Dadra & Nagar Haveli – Annexure 3: Questionnaires / Survey Instruments 36
31. How have you traveled to this state? READ OUT OPTIONS & TICK (SINGLE RESPONSE) [1] By train [2] By bus [3] By air
[4] By personal vehicle [5] By taxi [6] Any other_____________
<ASK ALL> 32. What type of activities are you engaged in? READ OUT OPTIONS & TICK (SINGLE RESPONSE) [1] Industrialist/ Trader/ Shop Owner [2] Self Employed Professional (Chartered Accountant, Cost Accountant, Doctor, Lawyer, Engineer, Consultant, Proprietor of a firm or institute) [3] Government Service [4] Private Service [5] Student/ Researcher [6] Business [7] Agriculturist [8] Housewife [9] If any other, please specify__________________________ 33. What is your educational qualification? READ OUT OPTIONS & TICK (SINGLE RESPONSE) [1] No Formal Education [2] Primary [3] Secondary [4] Higher Secondary [5] Graduate & Above [6] Technical / Professional of all levels [7]Any other, please specify_____ 34. What is your approximate annual household income? READ OUT OPTIONS & TICK (SINGLE RESPONSE) <ASK FROM INDIAN VISITOR> [1] Less than Rs. 60,000 [2] Rs. 60,001 – Rs. 1,00,000 [3] Rs. 1,00,001 – Rs. 2,00,000 [4] Rs. 2,00,001 – Rs. 5,00,000 [5] Above Rs. 5,00,000 <ASK FROM FOREIGN VISITOR> [1] Less than US $ 40,000 [2] US $ 40,001 – US $ 60,000 [3] US $ 60,001 – US $ 80,000 [4] US $ 80,001 – US $ 100,000 [5] Above US $ 100,000 TRAVEL BEHAVIOR: 35. How often do you travel? READ OUT OPTIONS & TICK (SINGLE RESPONSE) [1] Once a week or more often [2] Once a fortnight [3] Once a month [4] Once in 3 months [5] Once in 6 months [6] Once in a year [7] Less often 36. What was your main purpose of visit? READ OUT OPTIONS & TICK (MULTIPLE RESPONSE) [1] Business [2] Holidaying, leisure & recreation [3]Social (visiting friends & relatives, attending marriages etc) [4] Pilgrimage /Religious activity [5] Education /Trainging [6] Health & Medical [7] Shopping [8] Others 37 If in < Q 36 >, purpose is not [2} , THEN did you visit any tourist spot during your stay_______________ 38. Are you a part of an organized group/ package tour? [1] Yes [2] No 39 If in 38, YES, then ask what the package include [1] Travel + Food [2] Travel +Accommodation [3] Travel +Transport +Accommodation [4] Travel + Transport + Accommodation + Food [5] Any other 40. How did you make your travel arrangement? READ OUT OPTIONS & TICK (MULTIPLE RESPONSES)
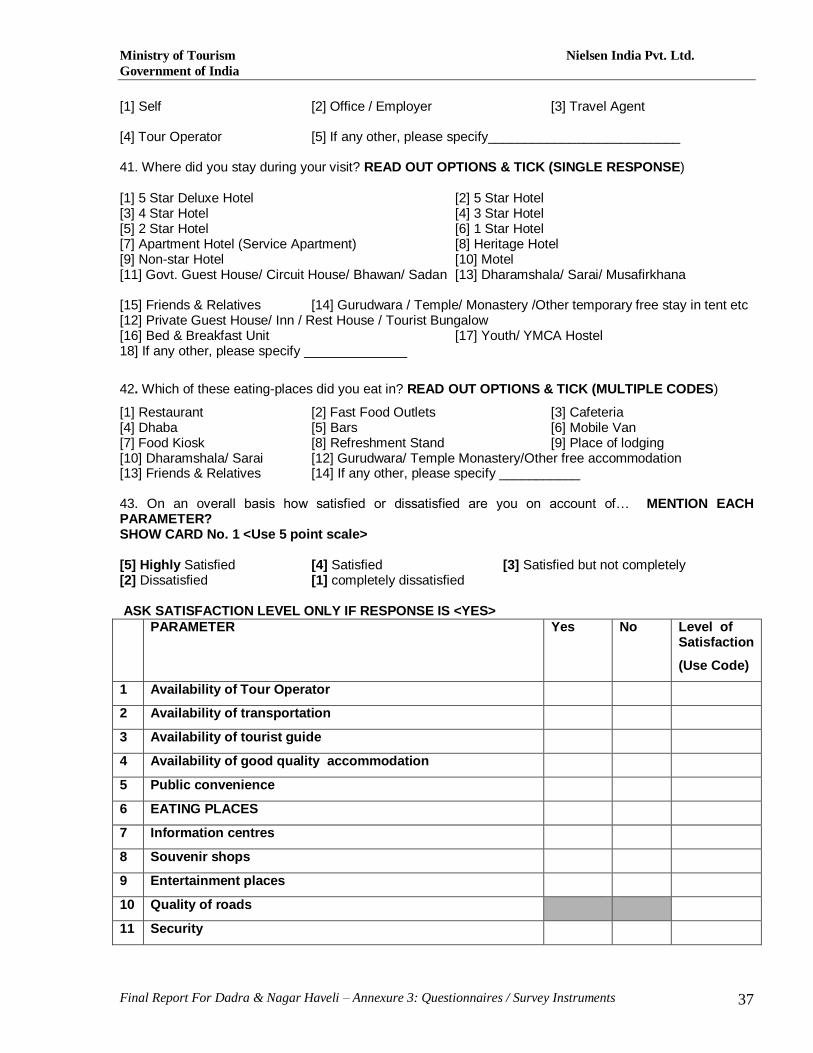
Ministry of Tourism Nielsen India Pvt. Ltd.
Government of India
Final Report For Dadra & Nagar Haveli – Annexure 3: Questionnaires / Survey Instruments 37
[1] Self [2] Office / Employer [3] Travel Agent [4] Tour Operator [5] If any other, please specify__________________________ 41. Where did you stay during your visit? READ OUT OPTIONS & TICK (SINGLE RESPONSE) [1] 5 Star Deluxe Hotel [2] 5 Star Hotel [3] 4 Star Hotel [4] 3 Star Hotel [5] 2 Star Hotel [6] 1 Star Hotel [7] Apartment Hotel (Service Apartment) [8] Heritage Hotel [9] Non-star Hotel [10] Motel [11] Govt. Guest House/ Circuit House/ Bhawan/ Sadan [13] Dharamshala/ Sarai/ Musafirkhana [15] Friends & Relatives [14] Gurudwara / Temple/ Monastery /Other temporary free stay in tent etc [12] Private Guest House/ Inn / Rest House / Tourist Bungalow [16] Bed & Breakfast Unit [17] Youth/ YMCA Hostel 18] If any other, please specify ______________
42. Which of these eating-places did you eat in? READ OUT OPTIONS & TICK (MULTIPLE CODES)
[1] Restaurant [2] Fast Food Outlets [3] Cafeteria [4] Dhaba [5] Bars [6] Mobile Van [7] Food Kiosk [8] Refreshment Stand [9] Place of lodging [10] Dharamshala/ Sarai [12] Gurudwara/ Temple Monastery/Other free accommodation [13] Friends & Relatives [14] If any other, please specify ___________ 43. On an overall basis how satisfied or dissatisfied are you on account of… MENTION EACH PARAMETER? SHOW CARD No. 1 <Use 5 point scale> [5] Highly Satisfied [4] Satisfied [3] Satisfied but not completely [2] Dissatisfied [1] completely dissatisfied ASK SATISFACTION LEVEL ONLY IF RESPONSE IS <YES>
PARAMETER Yes No Level of Satisfaction
(Use Code)
1 Availability of Tour Operator
2 Availability of transportation
3 Availability of tourist guide
4 Availability of good quality accommodation
5 Public convenience
6 EATING PLACES
7 Information centres
8 Souvenir shops
9 Entertainment places
10 Quality of roads
11 Security

Ministry of Tourism Nielsen India Pvt. Ltd.
Government of India
Final Report For Dadra & Nagar Haveli – Annexure 3: Questionnaires / Survey Instruments 38
12 Behavior of local people
13 Shops other than souvenir ones
14 Upkeep of tourist sites
15 Accommodation tariff
16 Quality of information provided
44. Did you find your visit to this State better than or worse than or as per your expectations? ASK & RECORD (SINGLE RESPONSE)
[5] Much better than expectation [4] Somewhat better than expectation [3] ] As per expectation
[2] Worse than expectation [1] Much worse than expectation
45. Which places have you visited in this district?
46. From where did you get information about tourist destinations in this State? READ OUT OPTIONS & TICK (MULTIPLE RESPONSE)
[1] Indian Embassy in you country [2] Indian tourism bureau in your country [3] Indian tourism offices in India [4] State tourism department [5] Travel agents [6] Internet: a) WEBSITE OF MOT b) OTHER WEBSITE [7] Travel books/ guides/ magazines / newspaper [8] Relatives/ friends [9] If any other, please specify ______________ EXPENDITURE PATTERN: 47. Please tell us, how much have you spent DURING YOUR VISIT? <READ OUT OPTIONS AND FILL THE AMOUNT> (MULTIPLE RESPONSES) Package Component in INR_______________________ 48. For Non Package Component, please ask the following
S No. Accommodations Before During THE TRIP ( Amt in INR )
TOTAL
1 Hotel
2 Private Guest House
3 Govt. Guest House/ Bhawan/ Sadan
4 Dharamshala
5 Rented house
6 Friends & Relatives
7 Others Total ( 48)
49. Food & Drink S No. Food & Drink Before During THE
TRIP ( Amt in INR )
TOTAL
1 In the accommodation unit
2 o/s accommodation unit & during journey and transit
Total (49)

Ministry of Tourism Nielsen India Pvt. Ltd.
Government of India
Final Report For Dadra & Nagar Haveli – Annexure 3: Questionnaires / Survey Instruments 39
50. Transport
S No. Transport Before During THE TRIP ( Amt in INR )
TOTAL
1 RAILWAYS
2 Road
3 WATER
4 AIR
5 Transport equipment rental
6 Travel agency services / tour operator
7 Others Total (50) 51. Shopping
S No. Shopping Before During THE TRIP ( Amt in INR )
TOTAL
1 Clothing & garments
2 Processed food
3 Tobacco products
4 Alcohol
5 Travel related consumer goods
6 Footwear
7 Toiletries
8 Gems & Jewellery
9 Books. Journals, Magazines ,Stationery etc
Total (51) 52. Recreation, Leisure, Cultural, Sporting activities
S No. Recreation, Leisure, Cultural, Sporting activities
Before During THE TRIP ( Amt in INR )
TOTAL
1 Cinema, theatre,amusement park
2 Entry fee & other expenses at religious places
3 Entry fee & other expenses at cultural sites
4 Sporting activities
5 Medicine & health related Total (52) 53. Others
S No. Others Before During THE TRIP ( Amt in INR )
TOTAL
1
2 54. GRAND TOTAL (SUMMATION OF Q 48+49+50+51+52+53)
*********************************************************************************************************************** Name of the investigator: ________________________________________Date: ____________________ Back Check Done: [ ] Tick Date: ______________ Back Checked by: _____________
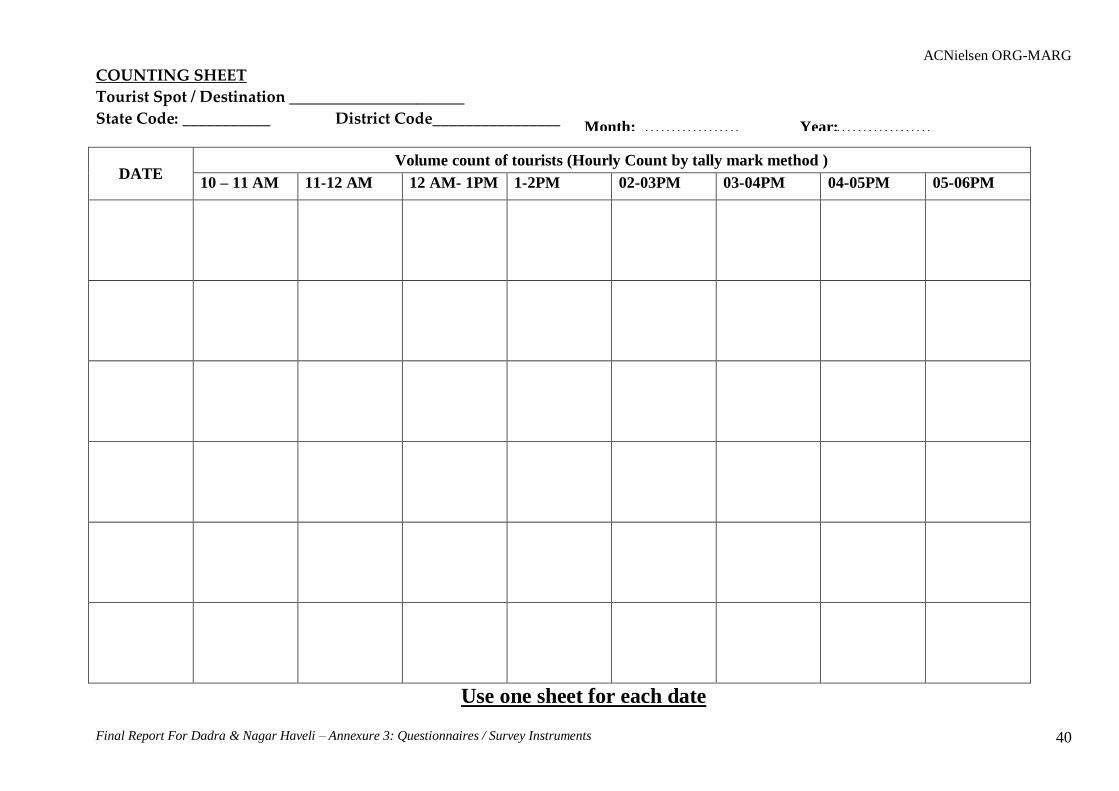
ACNielsen ORG-MARG
Final Report For Dadra & Nagar Haveli – Annexure 3: Questionnaires / Survey Instruments 40
COUNTING SHEET
Tourist Spot / Destination ______________________
State Code: ___________ District Code________________
DATE Volume count of tourists (Hourly Count by tally mark method )
10 – 11 AM 11-12 AM 12 AM- 1PM 1-2PM 02-03PM 03-04PM 04-05PM 05-06PM
Use one sheet for each date
Month: ………………
…………
Year: ………………
…………

ACNielsen ORG-MARG
Final Report For Dadra & Nagar Haveli – Annexure 3: Questionnaires / Survey Instruments 41
Short Survey Questionnaire:
Month: ________ Year: ___________ Entry Point:______________
1. Are you a [1] Indian [2] Foreigner [3] NRI 2 If Indian, where do you reside
i) Within same city ii) Same district iii) Other district of the state iv) Outside the state, specify state code
If the answer in 1 is WITHIN SAME CITY, ask the following Frequency of visit to this Tourist spot a) Once in 7 days b) once in 15 days c) Once in a month d) Once in six months If response is a) OR b) OR c) TERMINATE THE QUESTIONNAIRE
3. Type of Tourist [1] Overnight visitor [2] same day visitor 4. If Foreigner country of nationality____________________________ 5. If NRI, country of residence ____________________________ 6. If overnight visitor, place of stay [1] Hired accommodation [2] Friends & relatives [3] other free accommodation 7. Sex: MALE /FEMALE
Name of the investigator: ________________________________________Date: ____________________ Back Check Done: [ ] Tick Date: ______________ Back Checked by: _____________
State
Dist
Dest

ACNielsen ORG-MARG
Final Report For Dadra & Nagar Haveli – Annexure 3: Questionnaires / Survey Instruments 58
ACCOMODATION SURVEY (CENSUS)
1. Name of accommodation unit: (Pls collect visiting card)
2. Type of accommodation unit RECORD BY TICKING (SINGLE CODE)
[1] 5 Star Deluxe Hotel [2] 5 Star Hotel
[3] 4 Star Hotel [4] 3 Star Hotel
[5] 2 Star Hotel [6] 1 Star Hotel
[7] Apartment Hotel (Service Apartment) [8] Heritage Hotel
[9] Non-star Hotel [10] Youth/ YMCA Hostel
[11] Dharamshala / Sarai/ Musafirkhana [12]
Gurudwara/Temple/Monastry
[13] BED & Breakfast Unit [14] Motel
3. Does your hotel belong to any group / chain of hotels?
[1] Yes, Please specify_________________________ [2] No 4. In which year it was established? Year: ______________
5. Ownership RECORD BY TICKING (SINGLE CODE)
[1] Central Government [2] State Government [3] Private
Limited
[4] Proprietorship/ Partnership [5] Public Limited [6]
PSU
[7] Charitable Trust/ Society [8] If any other, please specify ______________ 6. Registered with…. RECORD BY TICKING (MULTIPLE CODES)
[1] State Tourism Department [2] Ministry of Tourism, New Delhi [3] Municipal Corporation [4] Police Department [5] Health Department [6] None [7] If any other, please specify ________________________
State
Dist
Dest

ACNielsen ORG-MARG
Final Report For Dadra & Nagar Haveli – Annexure 3: Questionnaires / Survey Instruments 59
7. Please furnish the details of the following:
S. No.
Type of Room Number of rooms
Number of beds
Room Tariff
Rs. US Dollar (US $)
1 Single AC
2 Double AC
3 Deluxe AC
4 Suits AC
5 Single Non AC
6 Double Non AC
7 Deluxe Non AC
8 Suits Non AC
9 Dormitory / Hall
10 Any other
Total (Post Code)
8. Total number of employees: ______ (Permanent & Temporary)
Departments Number of permanent employees
Number of casual or temporary employees
Total (Post Code)
Management Team
Front Office
F & B (Service)
F & B (Kitchen)
House Keeping
Accounts
EDP
Security
Sales & Marketing
Purchase & Stores
Human Resource
Public Relation
Engineering
Telephone
Health Club
Laundry
Other departments
Total

ACNielsen ORG-MARG
Final Report For Dadra & Nagar Haveli – Annexure 3: Questionnaires / Survey Instruments 60
9. Number of people working in the age group of:
18 – 25yrs 26 – 30yrs 31 – 40yrs 41 – 50yrs >50yrs
10. Category of accommodation unit for Sampling [1] Classified hotels [2] Having more than 20 rooms [3] 10 -20 rooms [4] less than 10 rooms
ACCOMODATION SURVEY
(MONTHLY) 1. Name of accommodation unit: (Pls collect visiting card) 2. Total number of employees: ______ (Permanent & Temporary)
Departments Number of permanent
employees Number of casual or
temporary employees Total
(Post Code)
Management Team
Front Office
F & B (Service)
F & B (Kitchen)
House Keeping
Accounts
EDP
Security
Sales & Marketing
Purchase & Stores
Human Resource
Public Relation
Engineering
Telephone
Health Club
Laundry
State
Dist
Dest

ACNielsen ORG-MARG
Final Report For Dadra & Nagar Haveli – Annexure 3: Questionnaires / Survey Instruments 61
Other departments
Total
3.1 Number of room days occupied in the last month: ______ 3.2 Occupancy %
____ (TO BE COMPUTED AS SUM OF NUMBER OF DAYS THAT EACH CUSTOMER HAS STAYED FOR) 3.3 Total number of customers: ____________
3.4 Total number of domestic customers: ____________ 3.5 Total number of bed nights for domestic customers____________
3.6 Total number of foreign customers: ____________
3.7 Total number of bed nights for foreign customers: ____________
4. Please generate the following statistics in respect of tourist inflow
Sl. No.
Type of Tourists (Domestic – 1 Foreign – 2)
Name of the State ( In case of domestic tourists) / Name of the country (in case foreign tourists). Post the relevant state code/country code as provided in the list
Number of tourists Bed night spent

ACNielsen ORG-MARG
Final Report For Dadra & Nagar Haveli – Annexure 3: Questionnaires / Survey Instruments 62
TOTAL
STATE CODES COUNTRY CODES
1 J & K 19 CHATTISGARH 1. UK 19 UAE
2 H.P. 20 BIHAR 2. USA 20 SPAIN 3 PUNJAB 21 JHARKHAND 3. CANADA 21 SWITZERLAND
4 HARYANA 22 A.P 4. GERMANY 22 CHINA
5 UTTARANCHAL 23 KARNATAKA 5. EUROPE 23 SAUDI ARABIA
6 U.P. 24 KERALA 6. AUSTRALIA 24 GREECE
7 DELHI 25 TAMIL NADU 7. SRI LANKA 25 ARGENTINA
8 MANIPUR 26 ARUNACHAL PRADESH
8. FRANCE 26 BELGIUM
9 TRIPURA 27 ASSAM 9. JAPAN 27 MOROCO
10 MEGHALAYA 28 NAGALAND 10. MALAYSIA 28 CAMBODIA
11 MIZORAM 29 GOA 11 SINGAPORE 29 MALDIVES
12 SIKKIM 30 ANDAMAN & NICOBAR
12 ITALY 30 NORWAY
13 WEST BENGAL 31 DAMAN & DIU 13 NEPAL 31 CYPRUS
14 ORISSA 32 LAKSHWADEEP 14 NETHERLANDS 32 PHILIPNIES
15 RAJASTHAN 33 PONDICHEERY 15 KOREA 33 DENMARK
16 GUJARAT 34 CHANDIGARH 16 ISRAEL 34 EGYPT
17 MAHARASHTRA 35 DADRA & NAGAR HAVELI
17 PAKISTAN 35 SOUTH AFRICA
18 M.P. 18 BANGLADESH 36 FINLAND