Survey on International Tourism - Banca d'Italia
19
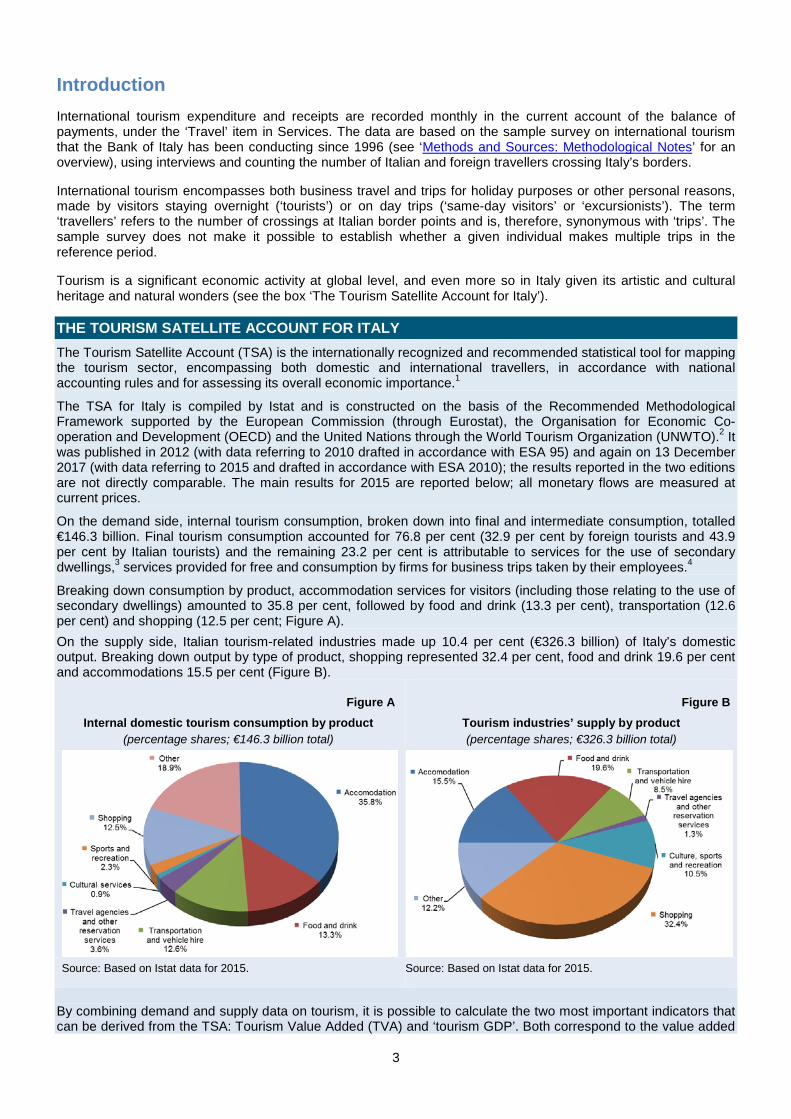
Main findings According to the Bank of Italy’s Survey on International Tourism, the inflows and outflows of both travellers and expenditure increased in 2017 compared with 2016. In the balance of payments, the travel surplus rose to 0.9 per cent of GDP (from 0.8 per cent in 2016) owing to a considerable increase in receipts (i.e. expenditure by foreign travellers in Italy; Figure 1). Italy’s receipts (€39.2 billion in 2017, or 2.3 per cent of GDP) increased at a rate of 7.7 per cent, more than double the rate for worldwide receipts generated by international travellers, which had a positive impact on Italy’s market share. Expenditure by foreign visitors rose in all of Italy’s macro-regions, especially in the South and the Centre. Almost 91 million foreign travellers visited Italy, 6 per cent more than in 2016. Holidaying in cities of art and culture remained the most popular type of vacation, making up the largest portion of foreign tourists’ spending; seaside holidays continued to regain ground. The opinion expressed by visitors interviewed at the end of their trips continued to be very positive, with negligible differences among the various macro-regions. After a decade of stagnation, expenditure by Italian travellers abroad also rose (8.9 per cent), along with the number of visitors and overnight stays; in 2017 expenditure equalled 1.4 per cent of GDP. Figure 1 Source: For GDP, Istat. Reference period: 2017 Statistics 11 June 2018 Survey on International Tourism For further information: [email protected] www.bancaditalia.it/statistiche/index.html
Transcript of Survey on International Tourism - Banca d'Italia
Main findings
According to the Bank of Italy’s Survey on International Tourism, the inflows and outflows of both travellers and expenditure increased in 2017 compared with 2016. In the balance of payments, the travel surplus rose to 0.9 per cent of GDP (from 0.8 per cent in 2016) owing to a considerable increase in receipts (i.e. expenditure by foreign travellers in Italy; Figure 1).
Italy’s receipts (€39.2 billion in 2017, or 2.3 per cent of GDP) increased at a rate of 7.7 per cent, more than double the rate for worldwide receipts generated by international travellers, which had a positive impact on Italy’s market share.
Expenditure by foreign visitors rose in all of Italy’s macro-regions, especially in the South and the Centre. Almost 91 million foreign travellers visited Italy, 6 per cent more than in 2016.
Holidaying in cities of art and culture remained the most popular type of vacation, making up the largest portion of foreign tourists’ spending; seaside holidays continued to regain ground. The opinion expressed by visitors interviewed at the end of their trips continued to be very positive, with negligible differences among the various macro-regions.
After a decade of stagnation, expenditure by Italian travellers abroad also rose (8.9 per cent), along with the number of visitors and overnight stays; in 2017 expenditure equalled 1.4 per cent of GDP.
Figure 1
Source: For GDP, Istat.
Reference period: 2017
Statistics
11 June 2018
Survey on International Tourism
For further information: [email protected] www.bancaditalia.it/statistiche/index.html
Contents
Main findings ................................................................................................................................... 1
Introduction ..................................................................................................................................... 3
Italy’s place in the international rankings ......................................................................................... 4
Foreign travellers in Italy ................................................................................................................. 5
Italian travellers abroad ................................................................................................................... 8
Tables ........................................................................................................................................... 10
Foreign travellers in Italy ............................................................................................................ 11
Italian travellers abroad .............................................................................................................. 15
Boxes
The Tourism Satellite Account for Italy ......................................................................................... 3
Italian tourism services: exports and foreign demand .................................................................. 8
2
Introduction International tourism expenditure and receipts are recorded monthly in the current account of the balance of payments, under the ‘Travel’ item in Services. The data are based on the sample survey on international tourism that the Bank of Italy has been conducting since 1996 (see ‘Methods and Sources: Methodological Notes’ for an overview), using interviews and counting the number of Italian and foreign travellers crossing Italy’s borders.
International tourism encompasses both business travel and trips for holiday purposes or other personal reasons, made by visitors staying overnight (‘tourists’) or on day trips (‘same-day visitors’ or ‘excursionists’). The term ‘travellers’ refers to the number of crossings at Italian border points and is, therefore, synonymous with ‘trips’. The sample survey does not make it possible to establish whether a given individual makes multiple trips in the reference period.
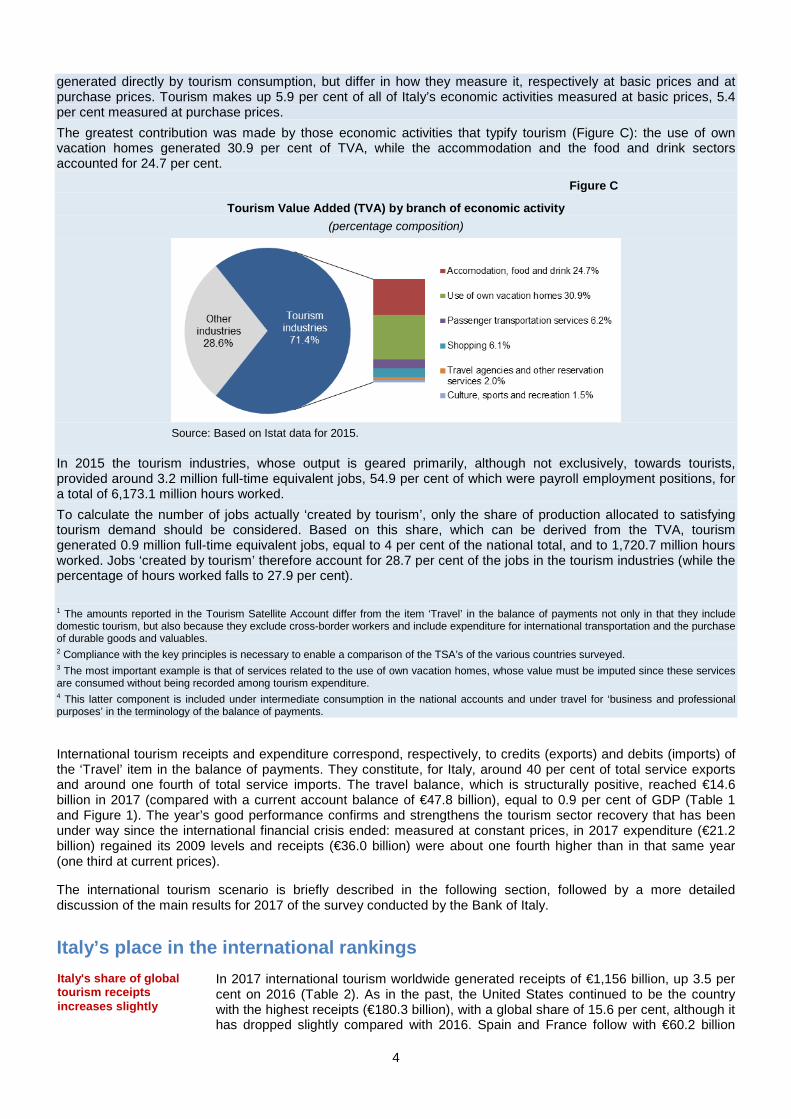
Tourism is a significant economic activity at global level, and even more so in Italy given its artistic and cultural heritage and natural wonders (see the box ‘The Tourism Satellite Account for Italy’).
THE TOURISM SATELLITE ACCOUNT FOR ITALY The Tourism Satellite Account (TSA) is the internationally recognized and recommended statistical tool for mapping the tourism sector, encompassing both domestic and international travellers, in accordance with national accounting rules and for assessing its overall economic importance.1
The TSA for Italy is compiled by Istat and is constructed on the basis of the Recommended Methodological Framework supported by the European Commission (through Eurostat), the Organisation for Economic Co-operation and Development (OECD) and the United Nations through the World Tourism Organization (UNWTO).2 It was published in 2012 (with data referring to 2010 drafted in accordance with ESA 95) and again on 13 December 2017 (with data referring to 2015 and drafted in accordance with ESA 2010); the results reported in the two editions are not directly comparable. The main results for 2015 are reported below; all monetary flows are measured at current prices.
On the demand side, internal tourism consumption, broken down into final and intermediate consumption, totalled €146.3 billion. Final tourism consumption accounted for 76.8 per cent (32.9 per cent by foreign tourists and 43.9 per cent by Italian tourists) and the remaining 23.2 per cent is attributable to services for the use of secondary dwellings,3 services provided for free and consumption by firms for business trips taken by their employees.4
Breaking down consumption by product, accommodation services for visitors (including those relating to the use of secondary dwellings) amounted to 35.8 per cent, followed by food and drink (13.3 per cent), transportation (12.6 per cent) and shopping (12.5 per cent; Figure A). On the supply side, Italian tourism-related industries made up 10.4 per cent (€326.3 billion) of Italy’s domestic output. Breaking down output by type of product, shopping represented 32.4 per cent, food and drink 19.6 per cent and accommodations 15.5 per cent (Figure B).
Figure A Figure B
Internal domestic tourism consumption by product (percentage shares; €146.3 billion total)
Tourism industries’ supply by product (percentage shares; €326.3 billion total)
Source: Based on Istat data for 2015. Source: Based on Istat data for 2015.
By combining demand and supply data on tourism, it is possible to calculate the two most important indicators that can be derived from the TSA: Tourism Value Added (TVA) and ‘tourism GDP’. Both correspond to the value added
3
generated directly by tourism consumption, but differ in how they measure it, respectively at basic prices and at purchase prices. Tourism makes up 5.9 per cent of all of Italy’s economic activities measured at basic prices, 5.4 per cent measured at purchase prices. The greatest contribution was made by those economic activities that typify tourism (Figure C): the use of own vacation homes generated 30.9 per cent of TVA, while the accommodation and the food and drink sectors accounted for 24.7 per cent.
Figure C
Tourism Value Added (TVA) by branch of economic activity (percentage composition)
Source: Based on Istat data for 2015.
In 2015 the tourism industries, whose output is geared primarily, although not exclusively, towards tourists, provided around 3.2 million full-time equivalent jobs, 54.9 per cent of which were payroll employment positions, for a total of 6,173.1 million hours worked. To calculate the number of jobs actually ‘created by tourism’, only the share of production allocated to satisfying tourism demand should be considered. Based on this share, which can be derived from the TVA, tourism generated 0.9 million full-time equivalent jobs, equal to 4 per cent of the national total, and to 1,720.7 million hours worked. Jobs ‘created by tourism’ therefore account for 28.7 per cent of the jobs in the tourism industries (while the percentage of hours worked falls to 27.9 per cent).
1 The amounts reported in the Tourism Satellite Account differ from the item ‘Travel’ in the balance of payments not only in that they include domestic tourism, but also because they exclude cross-border workers and include expenditure for international transportation and the purchase of durable goods and valuables. 2 Compliance with the key principles is necessary to enable a comparison of the TSA’s of the various countries surveyed. 3 The most important example is that of services related to the use of own vacation homes, whose value must be imputed since these services are consumed without being recorded among tourism expenditure. 4 This latter component is included under intermediate consumption in the national accounts and under travel for ‘business and professional purposes’ in the terminology of the balance of payments.
International tourism receipts and expenditure correspond, respectively, to credits (exports) and debits (imports) of the ‘Travel’ item in the balance of payments. They constitute, for Italy, around 40 per cent of total service exports and around one fourth of total service imports. The travel balance, which is structurally positive, reached €14.6 billion in 2017 (compared with a current account balance of €47.8 billion), equal to 0.9 per cent of GDP (Table 1 and Figure 1). The year’s good performance confirms and strengthens the tourism sector recovery that has been under way since the international financial crisis ended: measured at constant prices, in 2017 expenditure (€21.2 billion) regained its 2009 levels and receipts (€36.0 billion) were about one fourth higher than in that same year (one third at current prices).
The international tourism scenario is briefly described in the following section, followed by a more detailed discussion of the main results for 2017 of the survey conducted by the Bank of Italy.
Italy’s place in the international rankingsIn 2017 international tourism worldwide generated receipts of €1,156 billion, up 3.5 per cent on 2016 (Table 2). As in the past, the United States continued to be the country with the highest receipts (€180.3 billion), with a global share of 15.6 per cent, although it has dropped slightly compared with 2016. Spain and France follow with €60.2 billion
Italy's share of global tourism receipts increases slightly
4
and €53.7 billion respectively. Italy ranks fifth with €39.2 billion, corresponding to a market share of international tourism receipts of 3.4 per cent, slightly above where it was in 2016 and in line with the United Kingdom. Focusing on overnight stays, France remains the most visited destination, with 89.8 million arrivals from abroad, followed by Spain and the United States (respectively 81.8 million and 73.0 million arrivals). Italy ranks fifth by number of overnight visitors, trailing China.
More than 40 per cent of global expenditure for trips abroad in 2017 originated from four countries: China, the United States, Germany and the United Kingdom (Table 3). American and Russian tourists are those that contributed the most to the growth in global expenditure for the year; Russia’s expenditure abroad, measured in euros, rose
by over 27 per cent, but is still far below the peak recorded at the start of the decade. Of the top 15 countries for tourism expenditure abroad, the United Kingdom is the only one to have registered a decline in 2017.
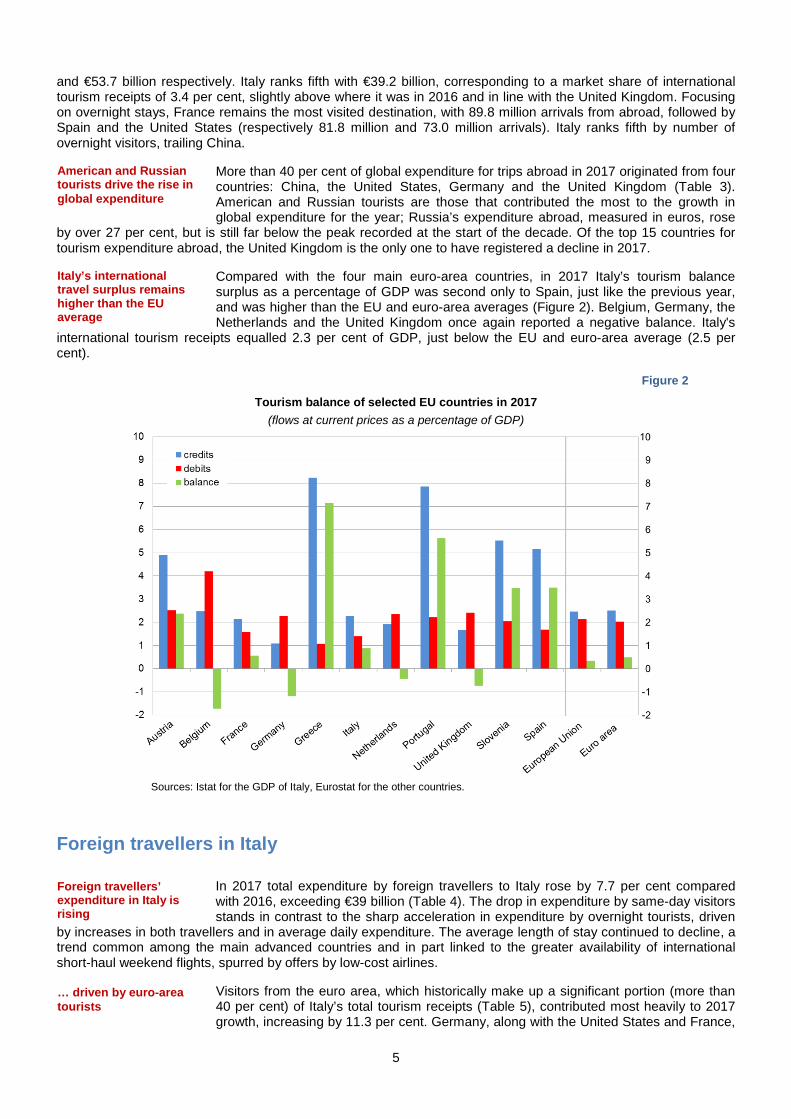
Compared with the four main euro-area countries, in 2017 Italy’s tourism balance surplus as a percentage of GDP was second only to Spain, just like the previous year, and was higher than the EU and euro-area averages (Figure 2). Belgium, Germany, the Netherlands and the United Kingdom once again reported a negative balance. Italy's
international tourism receipts equalled 2.3 per cent of GDP, just below the EU and euro-area average (2.5 per cent).
Figure 2
Tourism balance of selected EU countries in 2017 (flows at current prices as a percentage of GDP)
Sources: Istat for the GDP of Italy, Eurostat for the other countries.
Foreign travellers in Italy
In 2017 total expenditure by foreign travellers to Italy rose by 7.7 per cent compared with 2016, exceeding €39 billion (Table 4). The drop in expenditure by same-day visitors stands in contrast to the sharp acceleration in expenditure by overnight tourists, driven
by increases in both travellers and in average daily expenditure. The average length of stay continued to decline, a trend common among the main advanced countries and in part linked to the greater availability of international short-haul weekend flights, spurred by offers by low-cost airlines.
Visitors from the euro area, which historically make up a significant portion (more than 40 per cent) of Italy’s total tourism receipts (Table 5), contributed most heavily to 2017 growth, increasing by 11.3 per cent. Germany, along with the United States and France,
Foreign travellers’ expenditure in Italy is rising
American and Russian tourists drive the rise in global expenditure
Italy’s international travel surplus remains higher than the EU average
… driven by euro-areatourists
5
continues to be the largest importer of Italian tourism services; spending by German tourists in Italy rose by almost 15 per cent last year, second only to the Canadians.
In 2017 Germany was also the main country of origin in terms of number of visitors, surpassing Switzerland (Table 6). The number of Spanish tourists rose by over 20 per cent; the length of their trips also increased, but their average daily expenditure
decreased (Table 5).
Taking trips for personal reasons (holidaying and other personal reasons) remains the leading purpose for travel, with total expenditure and number of travellers rising by 8.4 per cent and 7.3 per cent, respectively (Table 7). However the largest increase in terms
of overnight stays was recorded for business trips, which continues to be the most profitable segment, with higher average daily expenditure than for trips taken for holiday purposes or other personal reasons.
The increase in expenditure by holiday travellers to Italy was particularly strong (8.0 per cent; Table 7 and 8), confirming a trend under way since 2010. Germany accounted for
almost 40 per cent of this rise, making up 19 per cent of total expenditure by foreign holidaymakers in Italy (this figure was around 33 per cent at the end of the 1990s). As for travellers’ geographical macro-areas of origin, there was a significant increase in expenditure by holidaymakers from other euro-area countries (10.0 per cent) and Asia
(9.6 per cent).
More than 20 million travellers visited Italy in 2017 to enjoy cities of art and culture (Table 9), spending around €15 billion (almost 60 per cent of total expenditure by foreign tourists on holiday); seaside holidays ranked second (8.2 million travellers and
21 per cent of expenditure). Receipts for the other types of vacations (lakeside, mountain and other holidays) were significantly less and, as a whole, decreased compared with 2016.
Hotels and holiday villages, while remaining the preferred accommodation establishments for overnight stays, declined as a share of total receipts (Table 10). By contrast, there was a significant increase (19.4 per cent) in expenditure on overnight stays in own or rented vacation homes, which accounted for 19.2 per cent of overall expenditure; this is the highest level on record, in part owing to a wider range of private
accommodation options available as a result of the growing use of online booking systems.
Road crossing points continue to be the most frequent means of entry into Italy used by foreign visitors, especially same-day visitors (Table 11). However the share of tourists
who choose to fly continues to grow, including in terms of overall spending, spurred by the spread of low-cost flights and competition in this segment among airlines.
Accommodation expenses still make up the largest item in the overall travel budget (42.2 per cent in 2017), followed by food and drink and by shopping (Table 12).
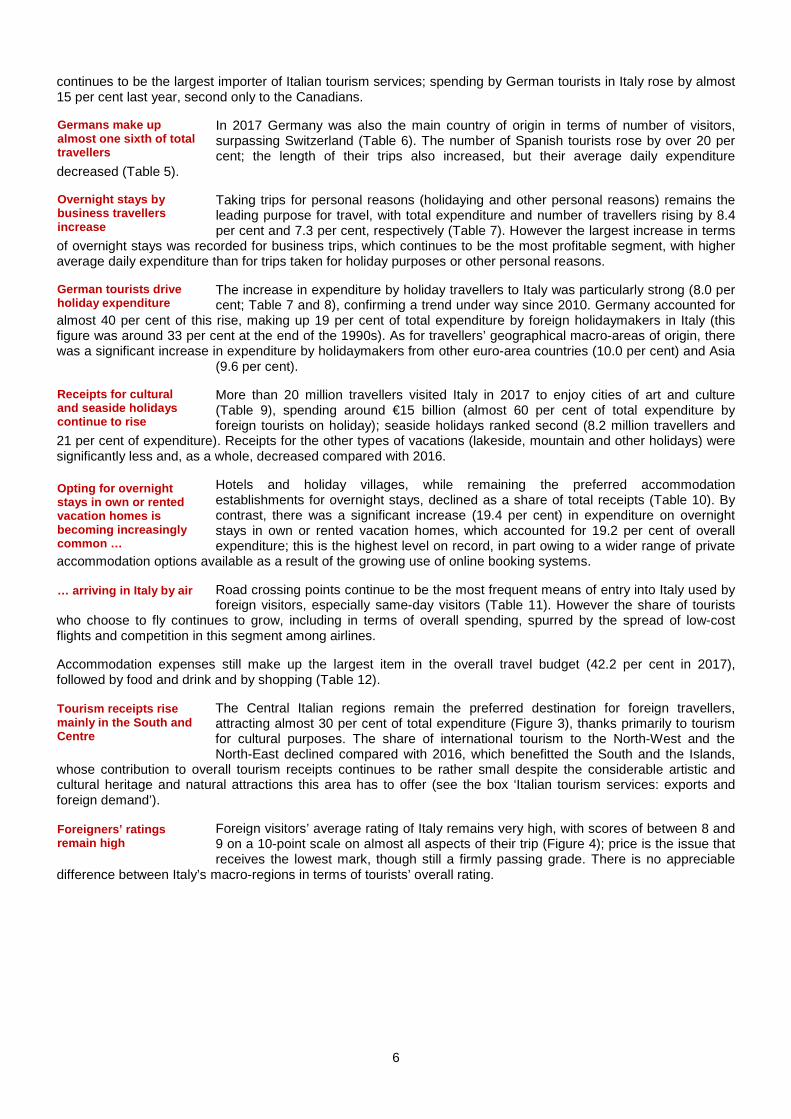
The Central Italian regions remain the preferred destination for foreign travellers, attracting almost 30 per cent of total expenditure (Figure 3), thanks primarily to tourism for cultural purposes. The share of international tourism to the North-West and the North-East declined compared with 2016, which benefitted the South and the Islands,
whose contribution to overall tourism receipts continues to be rather small despite the considerable artistic and cultural heritage and natural attractions this area has to offer (see the box ‘Italian tourism services: exports and foreign demand’).
Foreign visitors’ average rating of Italy remains very high, with scores of between 8 and 9 on a 10-point scale on almost all aspects of their trip (Figure 4); price is the issue that receives the lowest mark, though still a firmly passing grade. There is no appreciable
difference between Italy’s macro-regions in terms of tourists’ overall rating.
Germans make up almost one sixth of total travellers
Overnight stays by business travellers increase
German tourists drive holiday expenditure
Receipts for cultural and seaside holidays continue to rise
Opting for overnight stays in own or rented vacation homes is becoming increasingly common …
… arriving in Italy by air
Tourism receipts rise mainly in the South and Centre
Foreigners’ ratings remain high
6
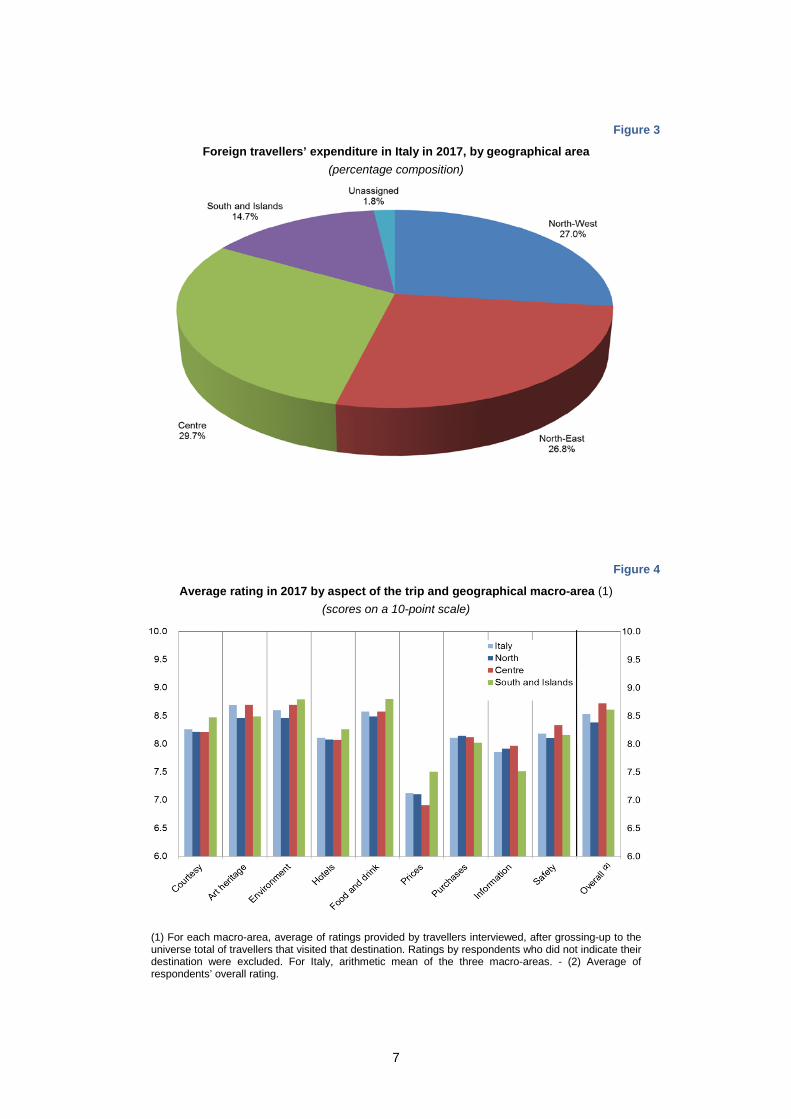
Figure 3
Foreign travellers’ expenditure in Italy in 2017, by geographical area (percentage composition)
Figure 4
Average rating in 2017 by aspect of the trip and geographical macro-area (1) (scores on a 10-point scale)
(1) For each macro-area, average of ratings provided by travellers interviewed, after grossing-up to the universe total of travellers that visited that destination. Ratings by respondents who did not indicate their destination were excluded. For Italy, arithmetic mean of the three macro-areas. - (2) Average of respondents’ overall rating.
7
ITALIAN TOURISM SERVICES: EXPORTS AND FOREIGN DEMAND
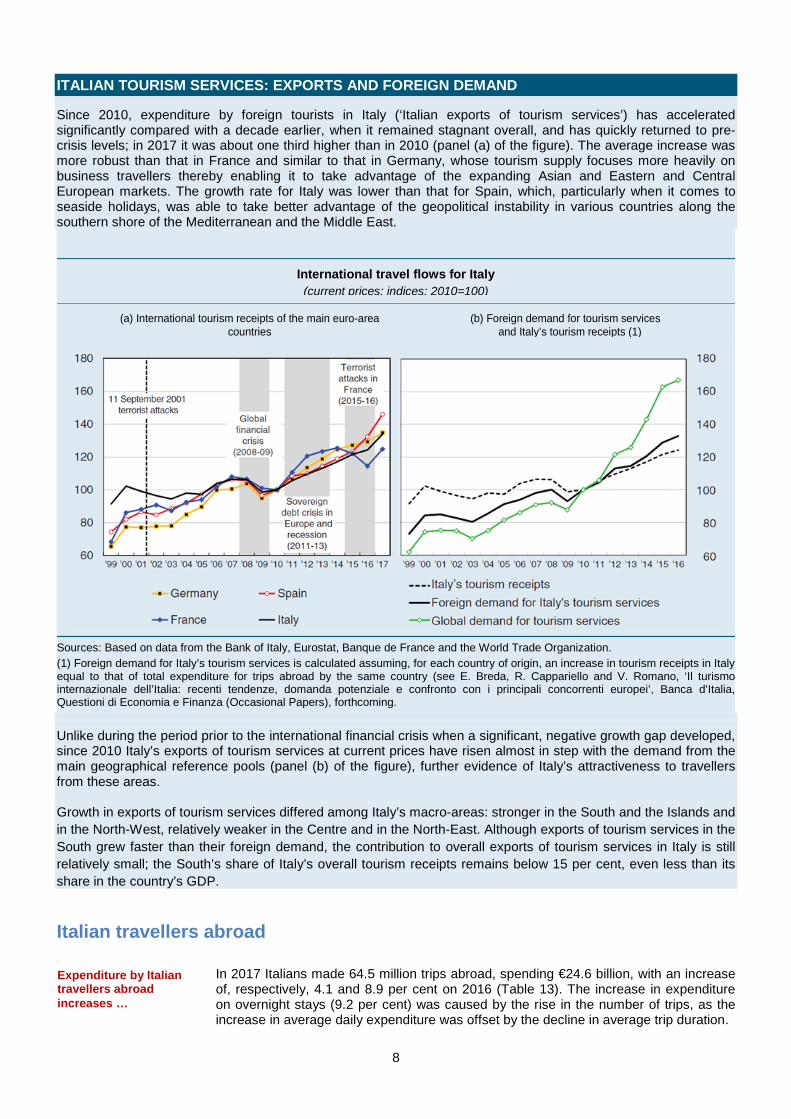
Since 2010, expenditure by foreign tourists in Italy (‘Italian exports of tourism services’) has accelerated significantly compared with a decade earlier, when it remained stagnant overall, and has quickly returned to pre-crisis levels; in 2017 it was about one third higher than in 2010 (panel (a) of the figure). The average increase was more robust than that in France and similar to that in Germany, whose tourism supply focuses more heavily on business travellers thereby enabling it to take advantage of the expanding Asian and Eastern and Central European markets. The growth rate for Italy was lower than that for Spain, which, particularly when it comes to seaside holidays, was able to take better advantage of the geopolitical instability in various countries along the southern shore of the Mediterranean and the Middle East.
International travel flows for Italy (current prices; indices: 2010=100)
(a) International tourism receipts of the main euro-area countries
(b) Foreign demand for tourism services and Italy’s tourism receipts (1)
Sources: Based on data from the Bank of Italy, Eurostat, Banque de France and the World Trade Organization. (1) Foreign demand for Italy’s tourism services is calculated assuming, for each country of origin, an increase in tourism receipts in Italy equal to that of total expenditure for trips abroad by the same country (see E. Breda, R. Cappariello and V. Romano, ‘Il turismo internazionale dell’Italia: recenti tendenze, domanda potenziale e confronto con i principali concorrenti europei’, Banca d’Italia, Questioni di Economia e Finanza (Occasional Papers), forthcoming. Unlike during the period prior to the international financial crisis when a significant, negative growth gap developed, since 2010 Italy’s exports of tourism services at current prices have risen almost in step with the demand from the main geographical reference pools (panel (b) of the figure), further evidence of Italy’s attractiveness to travellers from these areas.
Growth in exports of tourism services differed among Italy’s macro-areas: stronger in the South and the Islands and in the North-West, relatively weaker in the Centre and in the North-East. Although exports of tourism services in the South grew faster than their foreign demand, the contribution to overall exports of tourism services in Italy is still relatively small; the South’s share of Italy’s overall tourism receipts remains below 15 per cent, even less than its share in the country’s GDP.
Italian travellers abroad
In 2017 Italians made 64.5 million trips abroad, spending €24.6 billion, with an increase of, respectively, 4.1 and 8.9 per cent on 2016 (Table 13). The increase in expenditure on overnight stays (9.2 per cent) was caused by the rise in the number of trips, as the increase in average daily expenditure was offset by the decline in average trip duration.
Expenditure by Italian travellers abroad increases …
8
Expenditure by Italian travellers who visited other euro-area countries rose faster than the average (Table 14), particularly for three destinations: Greece and Spain, reflecting the increase in the number of travellers, and Austria, due to the lengthening of average
trip duration (Table 15). Italians’ preferred destinations were Switzerland, France and Austria, bordering countries with a high proportion of same-day visitors. Among the main destinations outside the euro area, the drop in expenditure in the United Kingdom, China and Australia are noteworthy.
Expenditure on business trips abroad scarcely rose in 2017 (0.7 per cent); the increase in total expenditure was caused by trips for personal reasons, especially for holidays (14.9 per cent more than in 2016; Table 16). As for destinations, over one third of the
increase was attributable to Spain, Greece and Austria (Table 17). With regard to reasons for travelling, the growth was almost entirely due to holidaying in cities of art, cultural tourism and seaside holidays (Table 18).
As in the past, travellers overwhelmingly chose hotels and holiday villages, with an increase in expenditure by 11.3 per cent and in the number of overnight stays by 7.2 per cent (Table 19), although the average expenditure per night by Italians that chose other accommodation establishments rose even more.
The preferred means of travel to reach foreign destinations for almost 42 million travellers (including same-day visitors) is still by road, but more than three quarters of total spending was borne by air travellers (Table 20).
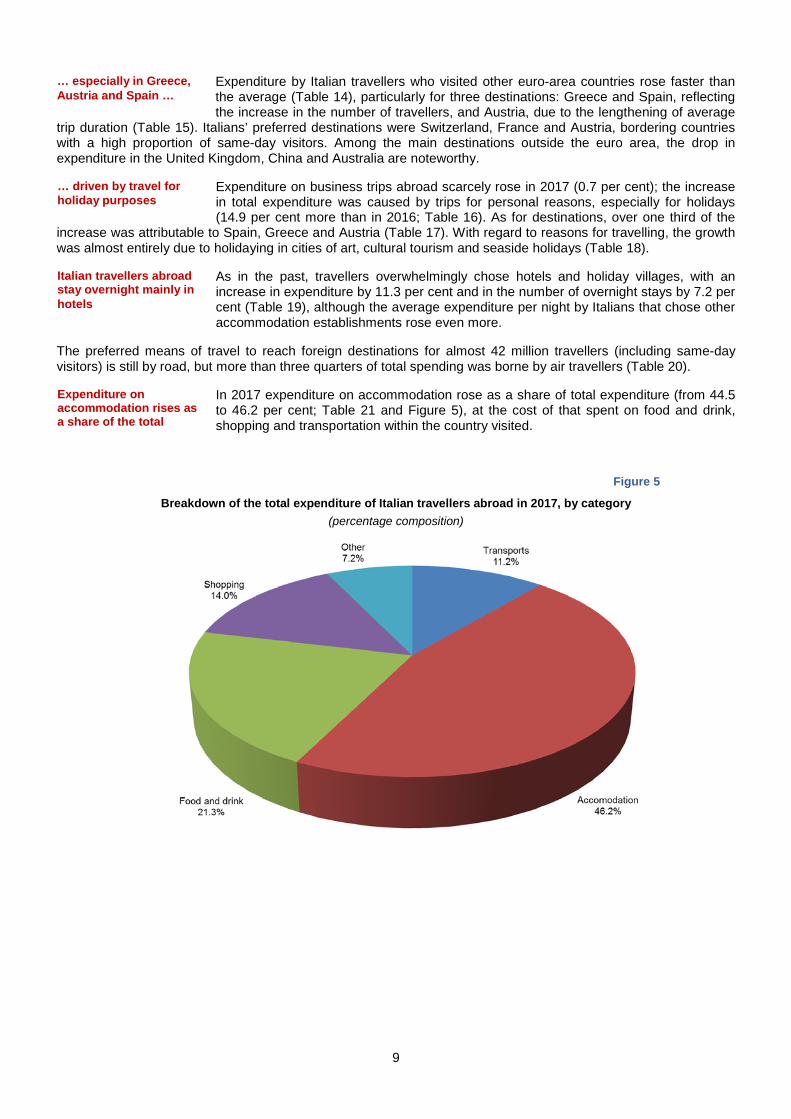
In 2017 expenditure on accommodation rose as a share of total expenditure (from 44.5 to 46.2 per cent; Table 21 and Figure 5), at the cost of that spent on food and drink, shopping and transportation within the country visited.
Figure 5
Breakdown of the total expenditure of Italian travellers abroad in 2017, by category (percentage composition)
… especially in Greece,Austria and Spain …
… driven by travel forholiday purposes
Italian travellers abroad stay overnight mainly in hotels
Expenditure on accommodation rises as a share of the total
9
Tables
Unless otherwise specified, the source of the data in this section is the Bank of Italy’s Survey on International Tourism. The data on monetary flows (receipts and expenditure) are at current prices and exchange rates, except for the lower portion of Table 1. Tables 4 to 12 refer to foreign travellers in Italy while Tables 13 to 21 refer to Italian travellers abroad.
Table 1
Source: Istat for GDP and the deflators.
Table 2
Source: Based on UNWTO World Tourism Barometer data (April 2018); receipts refer to all travellers (tourists and same-day visitors). Note: The table gives the top 15 countries in terms of international tourism receipts in 2017 (at current prices and exchange rates); for the last year world-wide receipts are partly estimated, while for some countries the number of foreign tourists is based on infra-annual trends.
2008 2009 2010 2011 2012 2013 2014 2015 2016 2017
Receipts 31.1 28.9 29.3 30.9 32.1 33.1 34.2 35.6 36.4 39.2Expenditure 20.9 20.0 20.4 20.6 20.5 20.3 21.7 22.0 22.5 24.6Balance 10.2 8.8 8.8 10.3 11.5 12.8 12.5 13.5 13.8 14.6Receipts (% of GDP) 1.9 1.8 1.8 1.9 2.0 2.1 2.1 2.2 2.2 2.3Expenditure (% of GDP) 1.3 1.3 1.3 1.3 1.3 1.3 1.3 1.3 1.3 1.4Balance (% of GDP) 0.6 0.6 0.6 0.6 0.7 0.8 0.8 0.8 0.8 0.9Memorandum item: Current account balance
-46.0 -29.7 -54.7 -49.1 -5.5 16.0 31.1 25.0 43.5 47.8
Receipts 31.8 29.3 29.3 30.0 30.3 30.8 31.9 33.1 33.9 36.0Expenditure 22.1 21.2 20.4 20.0 19.1 19.0 20.0 19.2 19.7 21.2Balance 9.7 8.1 8.8 10.1 11.2 11.8 11.9 13.8 14.1 14.9
International travel flows for Italy(billions of euros, unless otherwise specified)
Current prices
Chain-linked prices (base year 2010)
2015 2016 2017 2015 2016 2017 2017
share % change
% change
World 1,097.0 1,117.0 1,155.7 100.0 3.5 1,195.0 1,239.0 1,323.0 6.8United States 185.1 186.1 180.3 15.6 -3.1 77.5 75.9 73.0 -3.8Spain 51.0 54.7 60.2 5.2 10.1 68.2 75.3 81.8 8.6France 52.6 49.3 53.7 4.6 8.9 84.5 82.6 89.8 8.7Thailand 40.5 44.1 50.9 4.4 15.4 29.9 32.6 35.4 8.6Italy 35.6 36.4 39.2 3.4 7.7 50.9 52.5 58.7 11.8United Kingdom 41.0 37.5 38.8 3.4 3.5 34.4 35.8 37.0 3.4Australia 30.9 33.5 37.9 3.3 13.1 7.4 8.3 8.8 6.0Germany 33.3 33.8 35.3 3.1 4.4 35.0 35.6 37.5 5.3Macao (China) 27.9 27.4 31.5 2.7 15.0 14.3 15.7 17.3 10.2Japan 22.5 27.7 30.1 2.6 8.7 19.7 24.0 28.7 19.6Hong Kong (China) 32.6 29.7 29.4 2.5 -1.0 26.7 26.6 27.9 4.9China 40.5 40.1 28.9 2.5 -27.9 56.9 59.3 60.7 2.4India 18.9 20.3 24.2 2.1 19.2 13.3 14.6 16.9 15.6Mexico 16.0 17.8 18.9 1.6 6.2 32.1 35.1 39.3 12.0Utd Arab Emirates 15.8 17.6 18.6 1.6 5.7 14.2 14.9 15.8 6.0
Main destinations of international tourism
International travel receipts(billions of euros, percentage market shares and
percentage changes on the previous year)
Number of foreign tourists(millions and percentage changes on the
previous year)2017
billions of euros millions
10
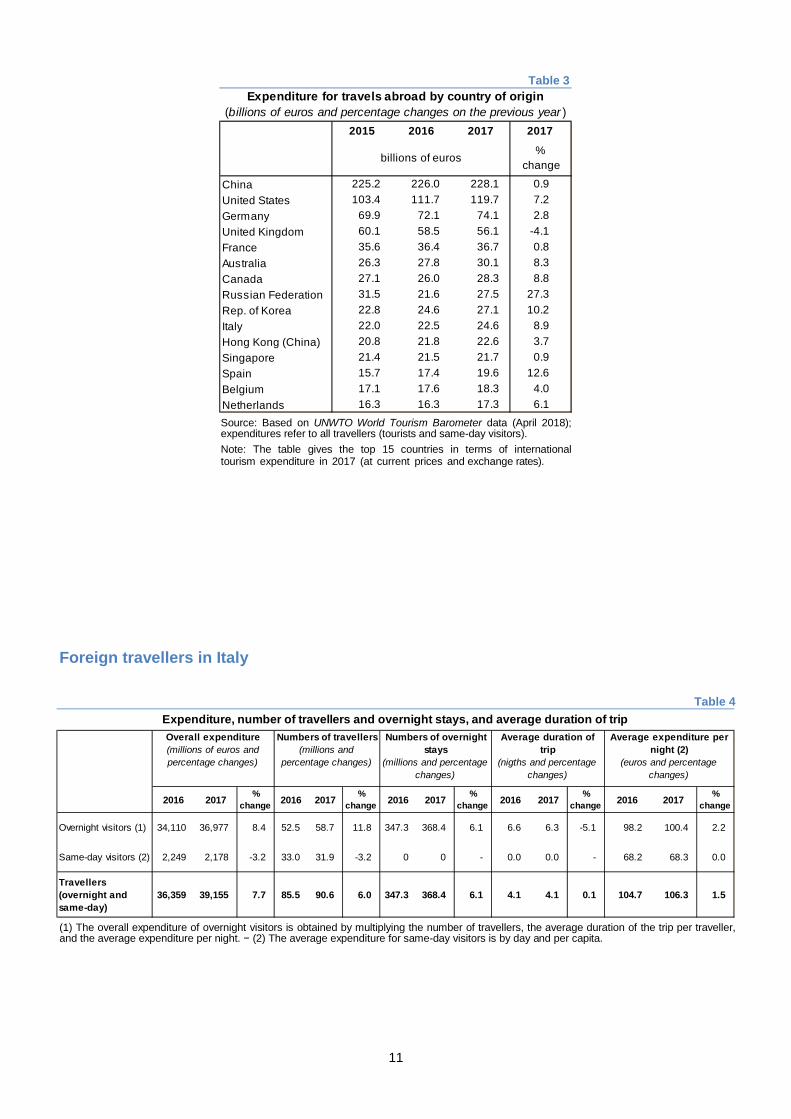
Table 3
Source: Based on UNWTO World Tourism Barometer data (April 2018); expenditures refer to all travellers (tourists and same-day visitors). Note: The table gives the top 15 countries in terms of international tourism expenditure in 2017 (at current prices and exchange rates).
Foreign travellers in Italy
Table 4
(1) The overall expenditure of overnight visitors is obtained by multiplying the number of travellers, the average duration of the trip per traveller, and the average expenditure per night. − (2) The average expenditure for same-day visitors is by day and per capita.
2015 2016 2017 2017
% change
China 225.2 226.0 228.1 0.9United States 103.4 111.7 119.7 7.2Germany 69.9 72.1 74.1 2.8United Kingdom 60.1 58.5 56.1 -4.1 France 35.6 36.4 36.7 0.8Australia 26.3 27.8 30.1 8.3Canada 27.1 26.0 28.3 8.8Russian Federation 31.5 21.6 27.5 27.3Rep. of Korea 22.8 24.6 27.1 10.2Italy 22.0 22.5 24.6 8.9Hong Kong (China) 20.8 21.8 22.6 3.7Singapore 21.4 21.5 21.7 0.9Spain 15.7 17.4 19.6 12.6Belgium 17.1 17.6 18.3 4.0Netherlands 16.3 16.3 17.3 6.1
Expenditure for travels abroad by country of origin(billions of euros and percentage changes on the previous year )
billions of euros
2016 2017 % change 2016 2017 %
change 2016 2017 % change 2016 2017 %
change 2016 2017 % change
Overnight visitors (1) 34,110 36,977 8.4 52.5 58.7 11.8 347.3 368.4 6.1 6.6 6.3 -5.1 98.2 100.4 2.2
Same-day visitors (2) 2,249 2,178 -3.2 33.0 31.9 -3.2 0 0 - 0.0 0.0 - 68.2 68.3 0.0
Travellers (overnight and same-day)
36,359 39,155 7.7 85.5 90.6 6.0 347.3 368.4 6.1 4.1 4.1 0.1 104.7 106.3 1.5
Expenditure, number of travellers and overnight stays, and average duration of tripOverall expenditure(millions of euros and percentage changes)
Numbers of travellers(millions and
percentage changes)
Numbers of overnight stays
(millions and percentage changes)
Average duration of trip
(nigths and percentage changes)
Average expenditure per night (2)
(euros and percentage changes)
11
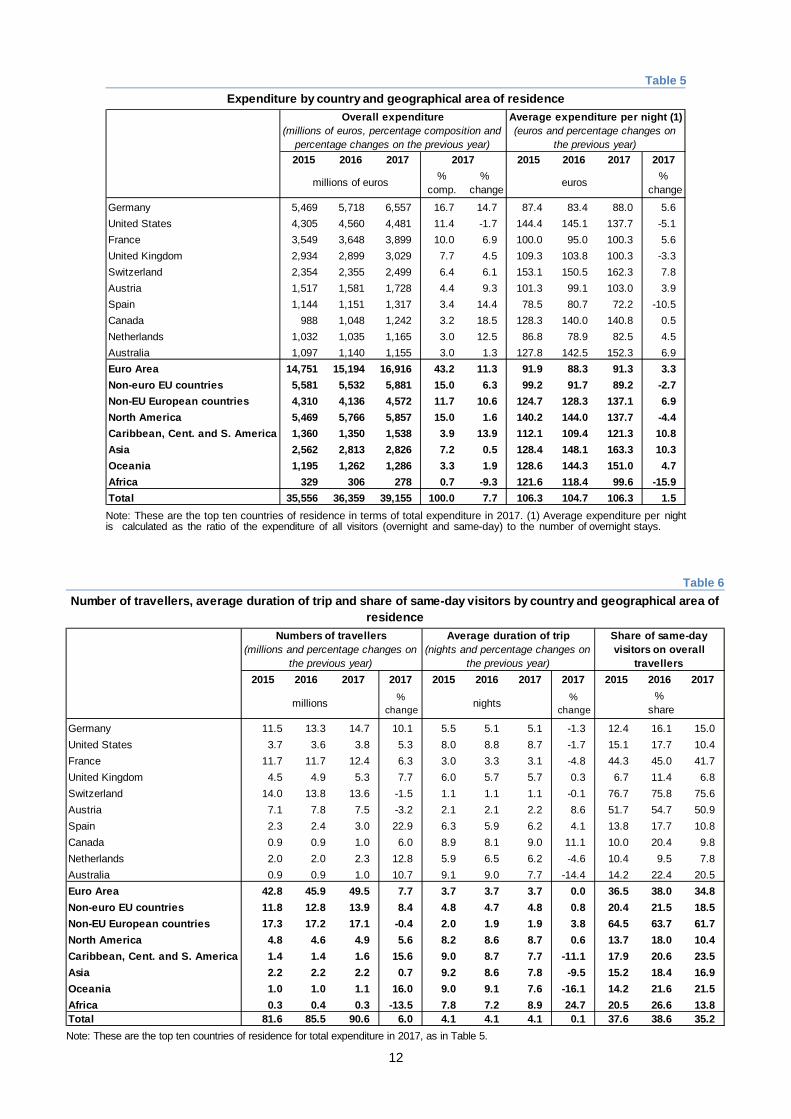
Table 5
Note: These are the top ten countries of residence in terms of total expenditure in 2017. (1) Average expenditure per night is calculated as the ratio of the expenditure of all visitors (overnight and same-day) to the number of overnight stays.
Table 6
Note: These are the top ten countries of residence for total expenditure in 2017, as in Table 5.
2015 2016 2017 2015 2016 2017 2017%
comp.%
change%
change
Germany 5,469 5,718 6,557 16.7 14.7 87.4 83.4 88.0 5.6United States 4,305 4,560 4,481 11.4 -1.7 144.4 145.1 137.7 -5.1France 3,549 3,648 3,899 10.0 6.9 100.0 95.0 100.3 5.6United Kingdom 2,934 2,899 3,029 7.7 4.5 109.3 103.8 100.3 -3.3Switzerland 2,354 2,355 2,499 6.4 6.1 153.1 150.5 162.3 7.8Austria 1,517 1,581 1,728 4.4 9.3 101.3 99.1 103.0 3.9Spain 1,144 1,151 1,317 3.4 14.4 78.5 80.7 72.2 -10.5Canada 988 1,048 1,242 3.2 18.5 128.3 140.0 140.8 0.5Netherlands 1,032 1,035 1,165 3.0 12.5 86.8 78.9 82.5 4.5Australia 1,097 1,140 1,155 3.0 1.3 127.8 142.5 152.3 6.9Euro Area 14,751 15,194 16,916 43.2 11.3 91.9 88.3 91.3 3.3Non-euro EU countries 5,581 5,532 5,881 15.0 6.3 99.2 91.7 89.2 -2.7Non-EU European countries 4,310 4,136 4,572 11.7 10.6 124.7 128.3 137.1 6.9North America 5,469 5,766 5,857 15.0 1.6 140.2 144.0 137.7 -4.4Caribbean, Cent. and S. America 1,360 1,350 1,538 3.9 13.9 112.1 109.4 121.3 10.8Asia 2,562 2,813 2,826 7.2 0.5 128.4 148.1 163.3 10.3Oceania 1,195 1,262 1,286 3.3 1.9 128.6 144.3 151.0 4.7Africa 329 306 278 0.7 -9.3 121.6 118.4 99.6 -15.9Total 35,556 36,359 39,155 100.0 7.7 106.3 104.7 106.3 1.5
Average expenditure per night (1)(euros and percentage changes on
the previous year)
Expenditure by country and geographical area of residenceOverall expenditure
(millions of euros, percentage composition and percentage changes on the previous year)
2017
millions of euros euros
2015 2016 2017 2017 2015 2016 2017 2017 2015 2016 2017%
change%
change
Germany 11.5 13.3 14.7 10.1 5.5 5.1 5.1 -1.3 12.4 16.1 15.0United States 3.7 3.6 3.8 5.3 8.0 8.8 8.7 -1.7 15.1 17.7 10.4France 11.7 11.7 12.4 6.3 3.0 3.3 3.1 -4.8 44.3 45.0 41.7United Kingdom 4.5 4.9 5.3 7.7 6.0 5.7 5.7 0.3 6.7 11.4 6.8Switzerland 14.0 13.8 13.6 -1.5 1.1 1.1 1.1 -0.1 76.7 75.8 75.6Austria 7.1 7.8 7.5 -3.2 2.1 2.1 2.2 8.6 51.7 54.7 50.9Spain 2.3 2.4 3.0 22.9 6.3 5.9 6.2 4.1 13.8 17.7 10.8Canada 0.9 0.9 1.0 6.0 8.9 8.1 9.0 11.1 10.0 20.4 9.8Netherlands 2.0 2.0 2.3 12.8 5.9 6.5 6.2 -4.6 10.4 9.5 7.8Australia 0.9 0.9 1.0 10.7 9.1 9.0 7.7 -14.4 14.2 22.4 20.5Euro Area 42.8 45.9 49.5 7.7 3.7 3.7 3.7 0.0 36.5 38.0 34.8Non-euro EU countries 11.8 12.8 13.9 8.4 4.8 4.7 4.8 0.8 20.4 21.5 18.5Non-EU European countries 17.3 17.2 17.1 -0.4 2.0 1.9 1.9 3.8 64.5 63.7 61.7North America 4.8 4.6 4.9 5.6 8.2 8.6 8.7 0.6 13.7 18.0 10.4Caribbean, Cent. and S. America 1.4 1.4 1.6 15.6 9.0 8.7 7.7 -11.1 17.9 20.6 23.5Asia 2.2 2.2 2.2 0.7 9.2 8.6 7.8 -9.5 15.2 18.4 16.9Oceania 1.0 1.0 1.1 16.0 9.0 9.1 7.6 -16.1 14.2 21.6 21.5Africa 0.3 0.4 0.3 -13.5 7.8 7.2 8.9 24.7 20.5 26.6 13.8Total 81.6 85.5 90.6 6.0 4.1 4.1 4.1 0.1 37.6 38.6 35.2
Average duration of trip(nights and percentage changes on
the previous year)
Share of same-day visitors on overall
travellers
Number of travellers, average duration of trip and share of same-day visitors by country and geographical area of residence
Numbers of travellers(millions and percentage changes on
the previous year)
millions nights%
share
12
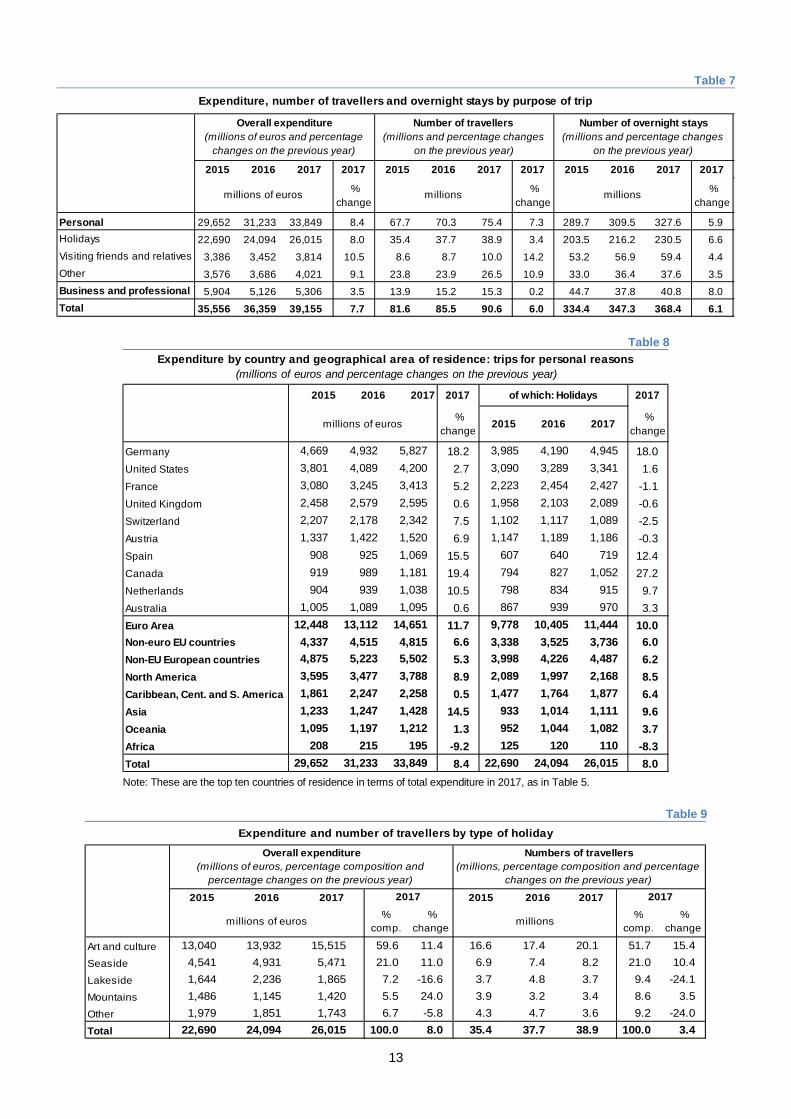
Table 7
Table 8
Note: These are the top ten countries of residence in terms of total expenditure in 2017, as in Table 5.
Table 9
2015 2016 2017 2017 2015 2016 2017 2017 2015 2016 2017 2017
%change
%change
%change
Personal 29,652 31,233 33,849 8.4 67.7 70.3 75.4 7.3 289.7 309.5 327.6 5.9Holidays 22,690 24,094 26,015 8.0 35.4 37.7 38.9 3.4 203.5 216.2 230.5 6.6Visiting friends and relatives 3,386 3,452 3,814 10.5 8.6 8.7 10.0 14.2 53.2 56.9 59.4 4.4Other 3,576 3,686 4,021 9.1 23.8 23.9 26.5 10.9 33.0 36.4 37.6 3.5Business and professional 5,904 5,126 5,306 3.5 13.9 15.2 15.3 0.2 44.7 37.8 40.8 8.0Total 35,556 36,359 39,155 7.7 81.6 85.5 90.6 6.0 334.4 347.3 368.4 6.1
millions of euros millions millions
Expenditure, number of travellers and overnight stays by purpose of trip
Purpose of trip
Number of travellers(millions and percentage changes
on the previous year)
Number of overnight stays (millions and percentage changes
on the previous year)
Overall expenditure(millions of euros and percentage
changes on the previous year)
2015 2016 2017 2017 2017
%change
2015 2016 2017 %change
Germany 4,669 4,932 5,827 18.2 3,985 4,190 4,945 18.0United States 3,801 4,089 4,200 2.7 3,090 3,289 3,341 1.6France 3,080 3,245 3,413 5.2 2,223 2,454 2,427 -1.1United Kingdom 2,458 2,579 2,595 0.6 1,958 2,103 2,089 -0.6Switzerland 2,207 2,178 2,342 7.5 1,102 1,117 1,089 -2.5Austria 1,337 1,422 1,520 6.9 1,147 1,189 1,186 -0.3Spain 908 925 1,069 15.5 607 640 719 12.4Canada 919 989 1,181 19.4 794 827 1,052 27.2Netherlands 904 939 1,038 10.5 798 834 915 9.7Australia 1,005 1,089 1,095 0.6 867 939 970 3.3Euro Area 12,448 13,112 14,651 11.7 9,778 10,405 11,444 10.0Non-euro EU countries 4,337 4,515 4,815 6.6 3,338 3,525 3,736 6.0Non-EU European countries 4,875 5,223 5,502 5.3 3,998 4,226 4,487 6.2North America 3,595 3,477 3,788 8.9 2,089 1,997 2,168 8.5Caribbean, Cent. and S. America 1,861 2,247 2,258 0.5 1,477 1,764 1,877 6.4Asia 1,233 1,247 1,428 14.5 933 1,014 1,111 9.6Oceania 1,095 1,197 1,212 1.3 952 1,044 1,082 3.7Africa 208 215 195 -9.2 125 120 110 -8.3Total 29,652 31,233 33,849 8.4 22,690 24,094 26,015 8.0
millions of euros
of which: Holidays
Expenditure by country and geographical area of residence: trips for personal reasons (millions of euros and percentage changes on the previous year)
2015 2016 2017 2015 2016 2017%
comp. %
change%
comp. %
change
Art and culture 13,040 13,932 15,515 59.6 11.4 16.6 17.4 20.1 51.7 15.4Seaside 4,541 4,931 5,471 21.0 11.0 6.9 7.4 8.2 21.0 10.4Lakeside 1,644 2,236 1,865 7.2 -16.6 3.7 4.8 3.7 9.4 -24.1Mountains 1,486 1,145 1,420 5.5 24.0 3.9 3.2 3.4 8.6 3.5Other 1,979 1,851 1,743 6.7 -5.8 4.3 4.7 3.6 9.2 -24.0Total 22,690 24,094 26,015 100.0 8.0 35.4 37.7 38.9 100.0 3.4
Type of holiday
Expenditure and number of travellers by type of holiday
Overall expenditure(millions of euros, percentage composition and
percentage changes on the previous year)
Numbers of travellers(millions, percentage composition and percentage
changes on the previous year)
millions of euros millions
2017 2017
13
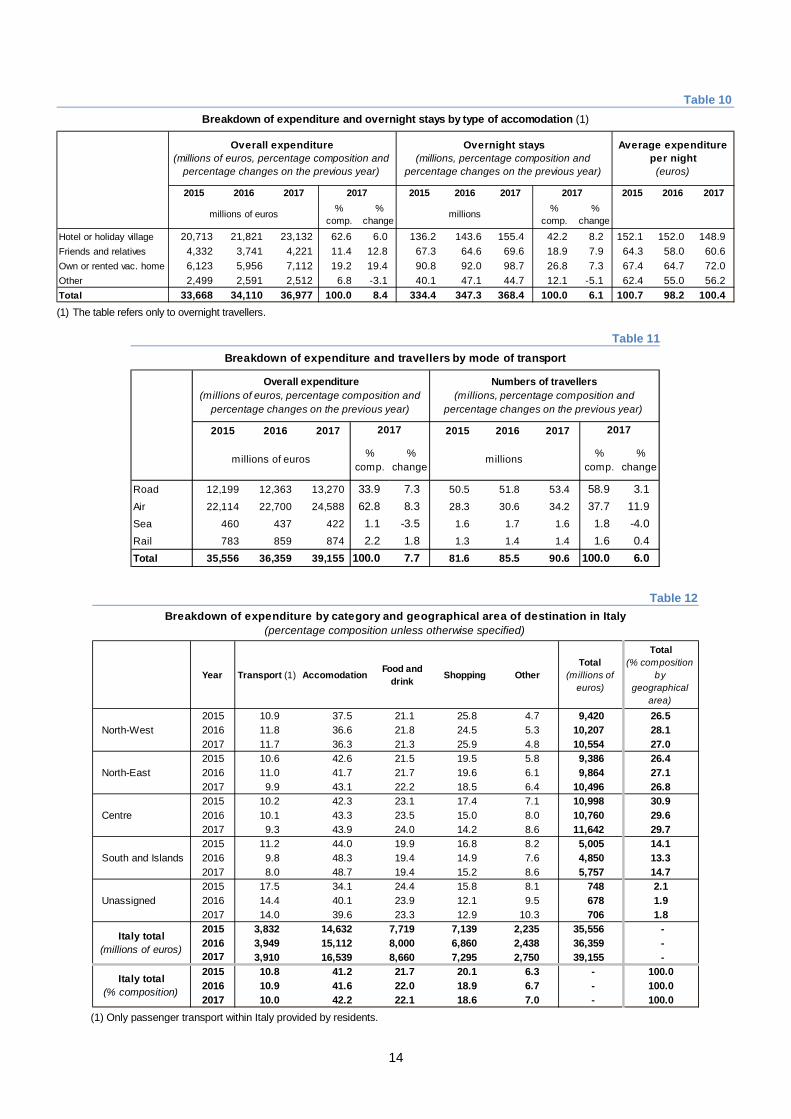
Table 10
(1) The table refers only to overnight travellers.
Table 11
Table 12
(1) Only passenger transport within Italy provided by residents.
2015 2016 2017 2015 2016 2017 2015 2016 2017%
comp. %
change%
comp. %
change
Hotel or holiday village 20,713 21,821 23,132 62.6 6.0 136.2 143.6 155.4 42.2 8.2 152.1 152.0 148.9Friends and relatives 4,332 3,741 4,221 11.4 12.8 67.3 64.6 69.6 18.9 7.9 64.3 58.0 60.6Own or rented vac. home 6,123 5,956 7,112 19.2 19.4 90.8 92.0 98.7 26.8 7.3 67.4 64.7 72.0Other 2,499 2,591 2,512 6.8 -3.1 40.1 47.1 44.7 12.1 -5.1 62.4 55.0 56.2Total 33,668 34,110 36,977 100.0 8.4 334.4 347.3 368.4 100.0 6.1 100.7 98.2 100.4
Breakdown of expenditure and overnight stays by type of accomodation (1)
Overnight stays(millions, percentage composition and
percentage changes on the previous year)
Average expenditure per night
(euros)Type of accomodation
millions of euros
Overall expenditure(millions of euros, percentage composition and
percentage changes on the previous year)
2017
millions
2017
2015 2016 2017 2015 2016 2017
%comp.
% change
%comp.
% change
Road 12,199 12,363 13,270 33.9 7.3 50.5 51.8 53.4 58.9 3.1Air 22,114 22,700 24,588 62.8 8.3 28.3 30.6 34.2 37.7 11.9Sea 460 437 422 1.1 -3.5 1.6 1.7 1.6 1.8 -4.0Rail 783 859 874 2.2 1.8 1.3 1.4 1.4 1.6 0.4Total 35,556 36,359 39,155 100.0 7.7 81.6 85.5 90.6 100.0 6.0
millions of euros millions
Mode of transport
Breakdown of expenditure and travellers by mode of transport
Numbers of travellers (millions, percentage composition and
percentage changes on the previous year)
2017
Overall expenditure(millions of euros, percentage composition and
percentage changes on the previous year)
2017
Year Transport (1) Accomodation Food and drink Shopping Other
Total (millions of
euros)
Total(% composition
by geographical
area)
2015 10.9 37.5 21.1 25.8 4.7 9,420 26.5North-West 2016 11.8 36.6 21.8 24.5 5.3 10,207 28.1
2017 11.7 36.3 21.3 25.9 4.8 10,554 27.02015 10.6 42.6 21.5 19.5 5.8 9,386 26.4
North-East 2016 11.0 41.7 21.7 19.6 6.1 9,864 27.12017 9.9 43.1 22.2 18.5 6.4 10,496 26.82015 10.2 42.3 23.1 17.4 7.1 10,998 30.9
Centre 2016 10.1 43.3 23.5 15.0 8.0 10,760 29.62017 9.3 43.9 24.0 14.2 8.6 11,642 29.72015 11.2 44.0 19.9 16.8 8.2 5,005 14.1
South and Islands 2016 9.8 48.3 19.4 14.9 7.6 4,850 13.32017 8.0 48.7 19.4 15.2 8.6 5,757 14.72015 17.5 34.1 24.4 15.8 8.1 748 2.1
Unassigned 2016 14.4 40.1 23.9 12.1 9.5 678 1.92017 14.0 39.6 23.3 12.9 10.3 706 1.82015 3,832 14,632 7,719 7,139 2,235 35,556 -2016 3,949 15,112 8,000 6,860 2,438 36,359 -2017 3,910 16,539 8,660 7,295 2,750 39,155 -2015 10.8 41.2 21.7 20.1 6.3 - 100.02016 10.9 41.6 22.0 18.9 6.7 - 100.02017 10.0 42.2 22.1 18.6 7.0 - 100.0
Italy total(% composition)
Italy total(millions of euros)
Breakdown of expenditure by category and geographical area of destination in Italy(percentage composition unless otherwise specified)
14
Italian travellers abroad
Table 13
(1) The overall expenditure of overnight visitors is obtained by multiplying the number of travellers, the average duration of the trip per traveller, and the average expenditure per night. − (2) The average expenditure for same-day visitors is by day and per capita.
Table 14
Note: These are the top ten countries of residence in terms of total expenditure in 2017. (1) Average expenditure per night is calculated as the ratio of the expenditure of all visitors (overnight and same-day) to the number of overnight stays.
2016 2017 % change 2016 2017 %
change 2016 2017 % change 2016 2017 %
change 2016 2017 % change
Overnight visitors (1) 20,531 22,418 9.2 29.3 32.0 9.2 272.6 277.5 1.8 9.3 8.7 -6.8 75.3 80.8 7.3
Same-day visitors (2) 2,016 2,139 6.1 32.7 32.5 -0.5 - - - - - - 61.7 65.8 6.7
Travellers (overnight and same-day)
22,547 24,557 8.9 62.0 64.5 4.1 272.6 277.5 1.8 4.4 4.3 -2.2 82.7 88.5 7.0
Expenditure, number of travellers, overnight stays and average duration of tripOverall expenditure(millions of euros and percentage changes)
Numbers of travellers(millions and
percentage changes)
Numbers of overnight stays
(millions and percentage changes)
Average duration of trip
(nigths and percentage changes)
Average expenditure per night (2)
(euros and percentage changes)
2015 2016 2017 2015 2016 2017 2017 %
comp. %
change %
change
United States 2,224 2,450 2,521 10.3 2.9 118.8 127.2 141.2 11.0
France 2,233 2,196 2,175 8.9 -0.9 60.2 61.1 67.2 9.9
Spain 1,654 1,750 2,024 8.2 15.6 63.1 68.0 72.4 6.3
Switzerland 1,573 1,609 1,577 6.4 -2.0 245.9 264.3 271.6 2.8
United Kingdom 1,436 1,455 1,333 5.4 -8.4 78.9 69.9 77.5 11.0
Germany 1,182 1,225 1,286 5.2 4.9 91.3 81.3 90.1 10.9
Austria 838 885 1,067 4.3 20.6 139.8 126.9 131.2 3.3
Greece 608 639 779 3.2 21.9 74.1 70.7 77.4 9.6
China 656 724 666 2.7 -8.1 74.8 87.6 96.6 10.3
Netherlands 367 364 474 1.9 30.1 74.5 72.3 86.6 19.8
Euro Area 8,236 8,298 9,437 38.4 13.7 74.5 74.0 81.7 10.3Non-euro EU countries 2,455 2,504 2,690 11.0 7.4 67.9 64.8 68.1 5.2Non-EU European countries 2,622 2,545 2,694 11.0 5.8 128.5 128.0 127.8 -0.1North America 2,634 2,934 3,168 12.9 8.0 112.6 122.5 136.7 11.6Caribbean, Cent. and S. America 1,161 1,302 1,470 6.0 12.9 67.9 81.4 87.0 6.9Asia 2,907 3,078 3,021 12.3 -1.9 84.0 97.6 96.9 -0.8Africa 1,404 1,290 1,571 6.4 21.7 65.1 58.3 68.5 17.4Oceania 488 546 449 1.8 -17.7 67.3 73.2 74.4 1.6Total 22,012 22,547 24,557 100.0 8.9 80.7 82.7 88.5 7.0
Expenditure by country and geographical area of destination
millions of euros euros
Destination
Overall expenditure(millions of euros, percentage composition and percent changes on the previous year)
Average expenditure per night (1)(euros and percentage changes on
the previous year)
2017
15
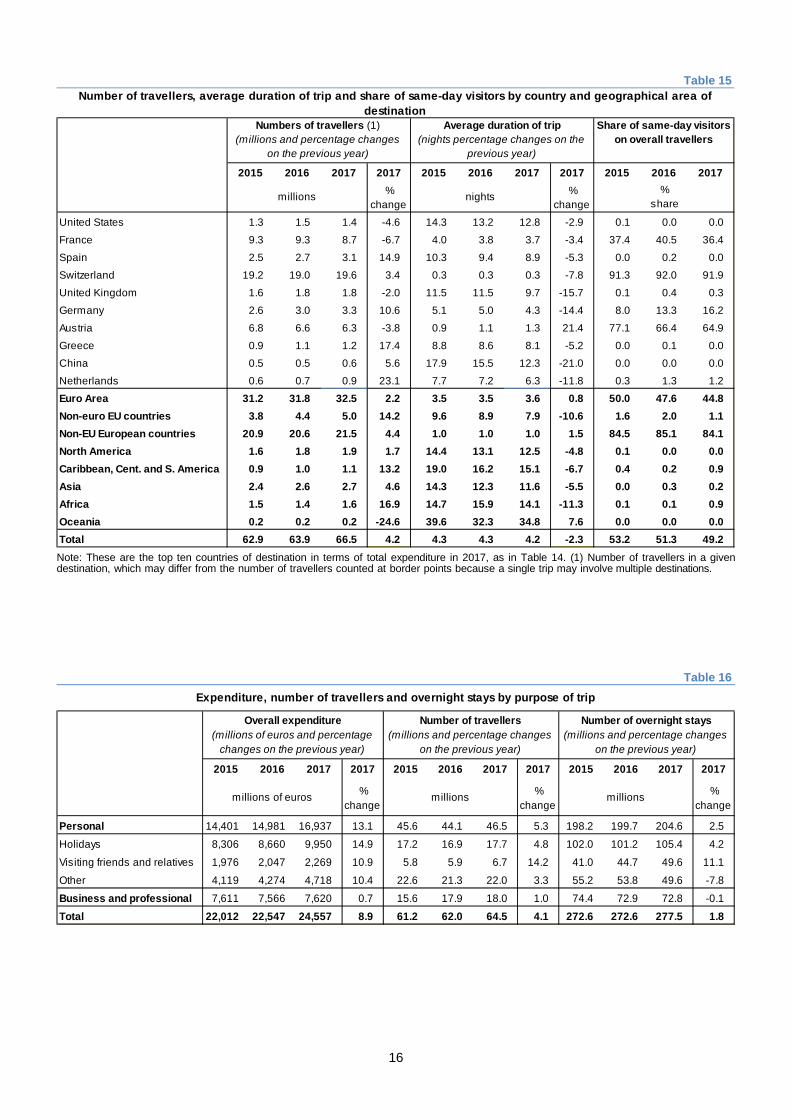
Table 15
Note: These are the top ten countries of destination in terms of total expenditure in 2017, as in Table 14. (1) Number of travellers in a given destination, which may differ from the number of travellers counted at border points because a single trip may involve multiple destinations.
Table 16
2015 2016 2017 2017 2015 2016 2017 2017 2015 2016 2017 %
change %
change
United States 1.3 1.5 1.4 -4.6 14.3 13.2 12.8 -2.9 0.1 0.0 0.0
France 9.3 9.3 8.7 -6.7 4.0 3.8 3.7 -3.4 37.4 40.5 36.4
Spain 2.5 2.7 3.1 14.9 10.3 9.4 8.9 -5.3 0.0 0.2 0.0
Switzerland 19.2 19.0 19.6 3.4 0.3 0.3 0.3 -7.8 91.3 92.0 91.9
United Kingdom 1.6 1.8 1.8 -2.0 11.5 11.5 9.7 -15.7 0.1 0.4 0.3
Germany 2.6 3.0 3.3 10.6 5.1 5.0 4.3 -14.4 8.0 13.3 16.2
Austria 6.8 6.6 6.3 -3.8 0.9 1.1 1.3 21.4 77.1 66.4 64.9
Greece 0.9 1.1 1.2 17.4 8.8 8.6 8.1 -5.2 0.0 0.1 0.0
China 0.5 0.5 0.6 5.6 17.9 15.5 12.3 -21.0 0.0 0.0 0.0
Netherlands 0.6 0.7 0.9 23.1 7.7 7.2 6.3 -11.8 0.3 1.3 1.2
Euro Area 31.2 31.8 32.5 2.2 3.5 3.5 3.6 0.8 50.0 47.6 44.8Non-euro EU countries 3.8 4.4 5.0 14.2 9.6 8.9 7.9 -10.6 1.6 2.0 1.1Non-EU European countries 20.9 20.6 21.5 4.4 1.0 1.0 1.0 1.5 84.5 85.1 84.1North America 1.6 1.8 1.9 1.7 14.4 13.1 12.5 -4.8 0.1 0.0 0.0Caribbean, Cent. and S. America 0.9 1.0 1.1 13.2 19.0 16.2 15.1 -6.7 0.4 0.2 0.9Asia 2.4 2.6 2.7 4.6 14.3 12.3 11.6 -5.5 0.0 0.3 0.2Africa 1.5 1.4 1.6 16.9 14.7 15.9 14.1 -11.3 0.1 0.1 0.9Oceania 0.2 0.2 0.2 -24.6 39.6 32.3 34.8 7.6 0.0 0.0 0.0Total 62.9 63.9 66.5 4.2 4.3 4.3 4.2 -2.3 53.2 51.3 49.2
millions nights %
share
Number of travellers, average duration of trip and share of same-day visitors by country and geographical area of destination
Destination
Numbers of travellers (1)(millions and percentage changes
on the previous year)
Average duration of trip(nights percentage changes on the
previous year)
Share of same-day visitors on overall travellers
2015 2016 2017 2017 2015 2016 2017 2017 2015 2016 2017 2017
% change
% change
% change
Personal 14,401 14,981 16,937 13.1 45.6 44.1 46.5 5.3 198.2 199.7 204.6 2.5
Holidays 8,306 8,660 9,950 14.9 17.2 16.9 17.7 4.8 102.0 101.2 105.4 4.2
Visiting friends and relatives 1,976 2,047 2,269 10.9 5.8 5.9 6.7 14.2 41.0 44.7 49.6 11.1
Other 4,119 4,274 4,718 10.4 22.6 21.3 22.0 3.3 55.2 53.8 49.6 -7.8
Business and professional 7,611 7,566 7,620 0.7 15.6 17.9 18.0 1.0 74.4 72.9 72.8 -0.1
Total 22,012 22,547 24,557 8.9 61.2 62.0 64.5 4.1 272.6 272.6 277.5 1.8
millions of euros millionsmillions
Purpose of trip
Number of travellers(millions and percentage changes
on the previous year)
Number of overnight stays (millions and percentage changes
on the previous year)
Overall expenditure(millions of euros and percentage
changes on the previous year)
Expenditure, number of travellers and overnight stays by purpose of trip
16
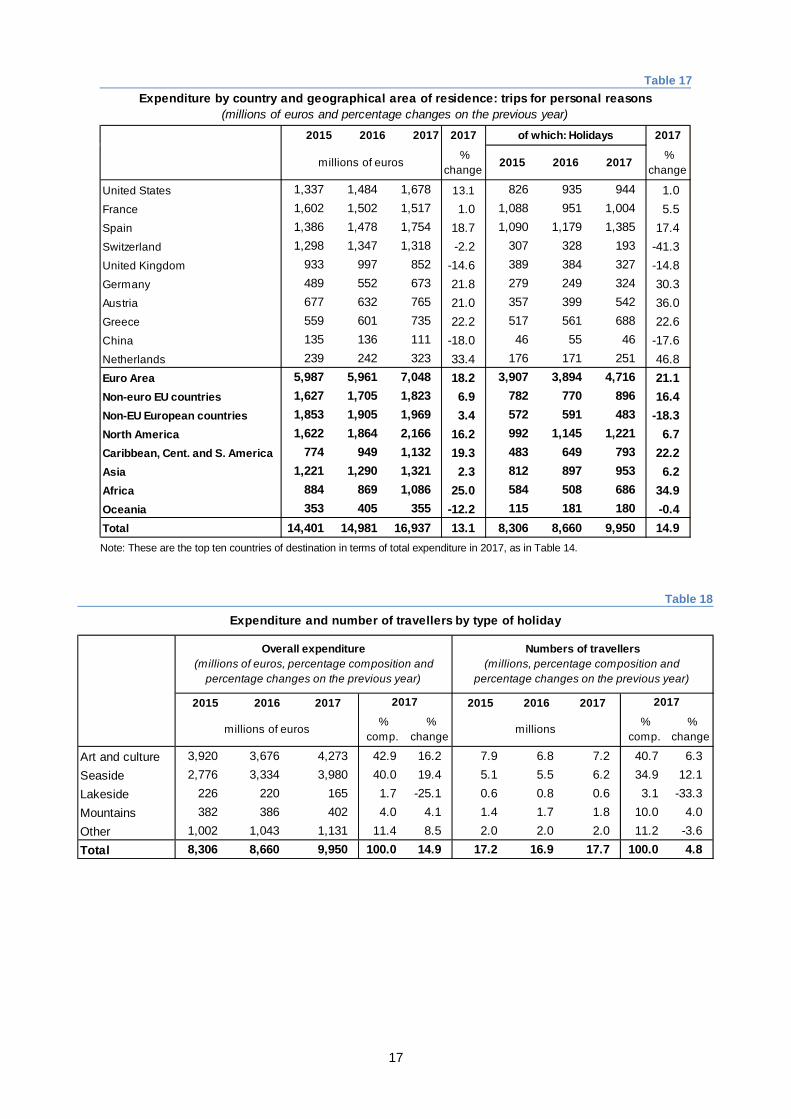
Table 17
Note: These are the top ten countries of destination in terms of total expenditure in 2017, as in Table 14.
Table 18
2015 2016 2017 2017 2017
% change
2015 2016 2017 % change
United States 1,337 1,484 1,678 13.1 826 935 944 1.0France 1,602 1,502 1,517 1.0 1,088 951 1,004 5.5Spain 1,386 1,478 1,754 18.7 1,090 1,179 1,385 17.4Switzerland 1,298 1,347 1,318 -2.2 307 328 193 -41.3United Kingdom 933 997 852 -14.6 389 384 327 -14.8Germany 489 552 673 21.8 279 249 324 30.3Austria 677 632 765 21.0 357 399 542 36.0Greece 559 601 735 22.2 517 561 688 22.6China 135 136 111 -18.0 46 55 46 -17.6Netherlands 239 242 323 33.4 176 171 251 46.8Euro Area 5,987 5,961 7,048 18.2 3,907 3,894 4,716 21.1Non-euro EU countries 1,627 1,705 1,823 6.9 782 770 896 16.4Non-EU European countries 1,853 1,905 1,969 3.4 572 591 483 -18.3North America 1,622 1,864 2,166 16.2 992 1,145 1,221 6.7Caribbean, Cent. and S. America 774 949 1,132 19.3 483 649 793 22.2Asia 1,221 1,290 1,321 2.3 812 897 953 6.2Africa 884 869 1,086 25.0 584 508 686 34.9Oceania 353 405 355 -12.2 115 181 180 -0.4Total 14,401 14,981 16,937 13.1 8,306 8,660 9,950 14.9
Expenditure by country and geographical area of residence: trips for personal reasons(millions of euros and percentage changes on the previous year)
of which: Holidays
millions of euros
2015 2016 2017 2015 2016 2017 %
comp. %
change %
comp. %
change
Art and culture 3,920 3,676 4,273 42.9 16.2 7.9 6.8 7.2 40.7 6.3Seaside 2,776 3,334 3,980 40.0 19.4 5.1 5.5 6.2 34.9 12.1Lakeside 226 220 165 1.7 -25.1 0.6 0.8 0.6 3.1 -33.3Mountains 382 386 402 4.0 4.1 1.4 1.7 1.8 10.0 4.0Other 1,002 1,043 1,131 11.4 8.5 2.0 2.0 2.0 11.2 -3.6Total 8,306 8,660 9,950 100.0 14.9 17.2 16.9 17.7 100.0 4.8
millions of euros
Overall expenditure (millions of euros, percentage composition and
percentage changes on the previous year)
2017Type of holiday
Numbers of travellers(millions, percentage composition and
percentage changes on the previous year)
2017
millions
Expenditure and number of travellers by type of holiday
17
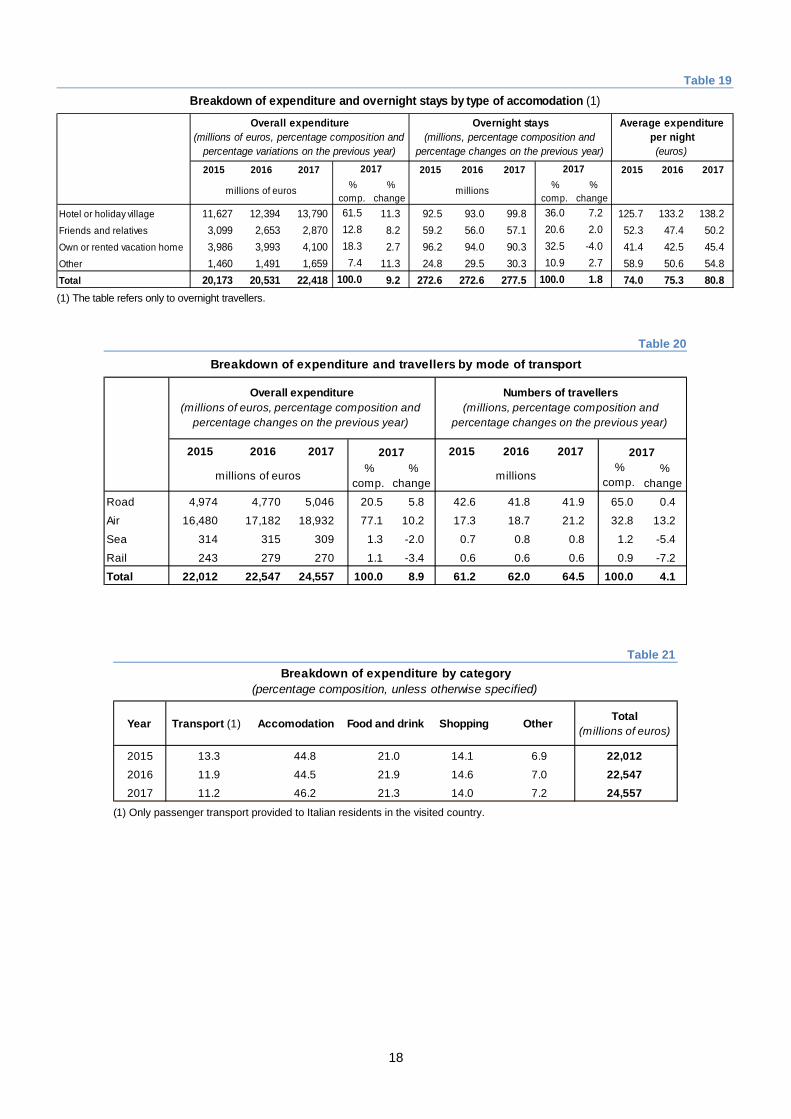
Table 19
(1) The table refers only to overnight travellers.
Table 20
Table 21
(1) Only passenger transport provided to Italian residents in the visited country.
2015 2016 2017 2015 2016 2017 2015 2016 2017 %
comp. %
change %
comp. %
changeHotel or holiday village 11,627 12,394 13,790 61.5 11.3 92.5 93.0 99.8 36.0 7.2 125.7 133.2 138.2Friends and relatives 3,099 2,653 2,870 12.8 8.2 59.2 56.0 57.1 20.6 2.0 52.3 47.4 50.2Own or rented vacation home 3,986 3,993 4,100 18.3 2.7 96.2 94.0 90.3 32.5 -4.0 41.4 42.5 45.4Other 1,460 1,491 1,659 7.4 11.3 24.8 29.5 30.3 10.9 2.7 58.9 50.6 54.8Total 20,173 20,531 22,418 100.0 9.2 272.6 272.6 277.5 100.0 1.8 74.0 75.3 80.8
Breakdown of expenditure and overnight stays by type of accomodation (1)
Type of accomodation
Overall expenditure(millions of euros, percentage composition and
percentage variations on the previous year)
Overnight stays(millions, percentage composition and
percentage changes on the previous year)
Average expenditure per night(euros)
millions of euros
2017
millions
2017
2015 2016 2017 2015 2016 2017 %
comp. %
change %
comp. %
change
Road 4,974 4,770 5,046 20.5 5.8 42.6 41.8 41.9 65.0 0.4
Air 16,480 17,182 18,932 77.1 10.2 17.3 18.7 21.2 32.8 13.2
Sea 314 315 309 1.3 -2.0 0.7 0.8 0.8 1.2 -5.4
Rail 243 279 270 1.1 -3.4 0.6 0.6 0.6 0.9 -7.2
Total 22,012 22,547 24,557 100.0 8.9 61.2 62.0 64.5 100.0 4.1
millions of euros
Overall expenditure(millions of euros, percentage composition and
percentage changes on the previous year)
millions
Numbers of travellers (millions, percentage composition and
percentage changes on the previous year)
20172017
Mode of transport
Breakdown of expenditure and travellers by mode of transport
Year Transport (1) Accomodation Food and drink Shopping Other Total (millions of euros)
2015 13.3 44.8 21.0 14.1 6.9 22,0122016 11.9 44.5 21.9 14.6 7.0 22,5472017 11.2 46.2 21.3 14.0 7.2 24,557
Breakdown of expenditure by category(percentage composition, unless otherwise specified)
18

The Statistical Appendix is available on the Bank of Italy’s website at: http://www.bancaditalia.it/statistics
Any questions relating to the contents of this publication may be addressed to: [email protected]
Publication exempted from registration pursuant to Article 3-bis of Law 103/2012.