TOPOGRAPHY SITE EFFECTS ON NUMERICAL AND … · Russian Building Codes (SNiP II-7-81*) - slopes...
7
TOPOGRAPHY SITE EFFECTS ON NUMERICAL AND EXPERIMENTAL DATA V.B. Zaalishvili, D.A. Melkov & I.L. Gabeeva Center of Geophysical Investigations of VSC RAS & RNO-A, Vladikavkaz, Russian Federation SUMMARY: There are sites on the territory of Vladikavkaz city "unfavorable" for construction in accordance with Russian Building Codes (SNiP II-7-81*) - slopes more than 15°. Topography effect estimation requires detailed instrumental investigations, empirical data and creation of mathematical models of ground medium. In the first stage of research slope on the right river bank was selected and microseisms registration performed. In the next stage seismic vibrations of case slope were modelled by final elements analysis (FEA). As a result seismic intensity increments along the slope were calculated and spectral features of vibrations defined. The nature of topography effects was identified. Furthermore, features of topography site effects on the territory of Vladikavkaz city were indicated. Keywords: site effect, topography, finite element analysis 1. INTRODUCTION There are sites on the territory of Vladikavkaz city "unfavorable" for construction in accordance with Russian Building Codes (SNiP II-7-81*) - slopes more than 15°. Main zone of such conditions is terrace slope on right bank of river Terek. At the same time this region is characterized by high density of individual buildings (of high vulnerability). Hydroelectric power station constructions are also located here. All that assumes more precise account of geomorphological conditions on seismic intensity. Topography effect estimation requires detailed instrumental investigations, empirical data and creation of mathematical models of ground medium. 2. INSTRUMENTAL INVESTIGATIONS At the first stage slope on the right bank of the river Terek in Vladikavkaz city was selected for investigations. (fig. 1, slope angle 25-35°). Recording of microseismic vibrations was performed on this site. Two seismic stations were simultaneously used; recording duration was 10 minutes and after one of the stations had been moved to the next point on the slope. Usage of such scheme allows accounting of temporal variations of amplitude level of microseismic field during performance of the work. Before recording calibration tests were performed and amplitude adjustment coefficients were obtained (for second station relative to the first one): KZ=1.36; KX=2.19; KY=1.13. Due to large value of adjustment coefficient for X-component (> 1.5) this component was not used in analysis. Considering that slope is oriented in West-East direction maximum relief influence must be registered on Y-component, oriented in the same direction
Transcript of TOPOGRAPHY SITE EFFECTS ON NUMERICAL AND … · Russian Building Codes (SNiP II-7-81*) - slopes...

TOPOGRAPHY SITE EFFECTS ON NUMERICAL
AND EXPERIMENTAL DATA
V.B. Zaalishvili, D.A. Melkov & I.L. Gabeeva Center of Geophysical Investigations of VSC RAS & RNO-A, Vladikavkaz, Russian Federation
SUMMARY:
There are sites on the territory of Vladikavkaz city "unfavorable" for construction in accordance with Russian
Building Codes (SNiP II-7-81*) - slopes more than 15°. Topography effect estimation requires detailed
instrumental investigations, empirical data and creation of mathematical models of ground medium.
In the first stage of research slope on the right river bank was selected and microseisms registration performed.
In the next stage seismic vibrations of case slope were modelled by final elements analysis (FEA).
As a result seismic intensity increments along the slope were calculated and spectral features of vibrations
defined. The nature of topography effects was identified. Furthermore, features of topography site effects on the
territory of Vladikavkaz city were indicated.
Keywords: site effect, topography, finite element analysis
1. INTRODUCTION
There are sites on the territory of Vladikavkaz city "unfavorable" for construction in accordance with
Russian Building Codes (SNiP II-7-81*) - slopes more than 15°. Main zone of such conditions is
terrace slope on right bank of river Terek. At the same time this region is characterized by high density
of individual buildings (of high vulnerability). Hydroelectric power station constructions are also
located here. All that assumes more precise account of geomorphological conditions on seismic
intensity.
Topography effect estimation requires detailed instrumental investigations, empirical data and creation
of mathematical models of ground medium.
2. INSTRUMENTAL INVESTIGATIONS
At the first stage slope on the right bank of the river Terek in Vladikavkaz city was selected for
investigations. (fig. 1, slope angle 25-35°). Recording of microseismic vibrations was performed on
this site.
Two seismic stations were simultaneously used; recording duration was 10 minutes and after one of
the stations had been moved to the next point on the slope. Usage of such scheme allows accounting of
temporal variations of amplitude level of microseismic field during performance of the work.
Before recording calibration tests were performed and amplitude adjustment coefficients were
obtained (for second station relative to the first one): KZ=1.36; KX=2.19; KY=1.13. Due to large
value of adjustment coefficient for X-component (> 1.5) this component was not used in analysis.
Considering that slope is oriented in West-East direction maximum relief influence must be registered
on Y-component, oriented in the same direction

Figure 1. Part of slope during microseisms recording
Mean amplitudes of microseismic vibrations (microseisms amplitude level) were referred to the point
at the base of the slope – Table 2.1. Corresponding scheme and curve are presented in figure 2.
Table 2.1. Maximum amplitudes of microseismic vibrations
Component
Distance L, m
0 20 40 60 80 100
Z 1.00 1.17 1.21 2.03 0.85 1.46
Y 1.00 1.28 1.78 2.96 2.97 2.22
Intensity variation of strong earthquake on data of maximum amplitude of microseismic vibrations
was calculated by the next formulae [RSN 65-87, Recommendations on seismic microzonation, 1985]:
e
i
A
AI
max
maxlg2 , (2.1)
where Amaxi and Amaxe – maximum amplitudes of microseismic vibrations on investigated and
etalon sites correspondingly.
Results of intensity increments relative to the base of the slope calculation are given in Table 2.2
Table 2.2. Intensity increments calculated on microseismic data
Component
Distance L m
0 20 40 60 80 100
Z 0,00 0,13 0,16 0,61 -0,14 0,33
Y 0,00 0,21 0,50 0,94 0,95 0,69
Calculations for vertical component (Z) show that there can be expected 1 point intensity
increment at the distance of 40 meters from the base of the slope. Amplification at the top of the slope
(L=100 m) is not so clear. Horizontal component (Y) analysis gives more stable and sustainable
results.
Registrator No.2
Registrator No.1

0 20 40 60 80 1000.5
1
1.5
2
2.5
3
3.5
4
L, m
A/A
0
Z
Y
a)
b)
Figure 2. Amplification of microseisms amplitudes А/А0 (a) along slope (b)
3. MATHEMATICAL MODELING
Finite element method (FEM) was selected for analysis as the most convenient tool for two- and three-
dimensional soil medium modeling. Finite elements method allows describing geometry of real cross-
sections in details [Zaalishvili et al., 2008]. Detalization level and model size are limited only by
technical capabilities of computing facilities and practicability. Maximum size of elements depends on
maximum frequency of interest sufficient for given problem solution.
Finite element method considers medium as complex of subdomains called elements connected with
each other in node points and assumes that continuum response is described by response of these
points.
Matrix of displacements transformations and matrix of displacements to deformations transformation
for each element are the main matrixes used in analysis. Law of displacements distribution within
element depending on node displacements is attributed to each element and stress-strain relations
depending on element material properties.
Rigidity matrix is calculated using virtual work principle. On the basis of d'Alembert's principle
inertial forces are considered as consistent part of volume forces. After summing up on all degrees of
freedom and taking into account damping forces one can obtain a system of linear differential
equations of the second order. And solution can be obtained with the help of standard procedures of
solution of differential equations with constant coefficients. At the same time these procedures become
ineffective for high-order matrixes. For this reason system was solved by Wilson method [Bathe,
Wilson, 1982], which is essentially evolution of linear acceleration method.
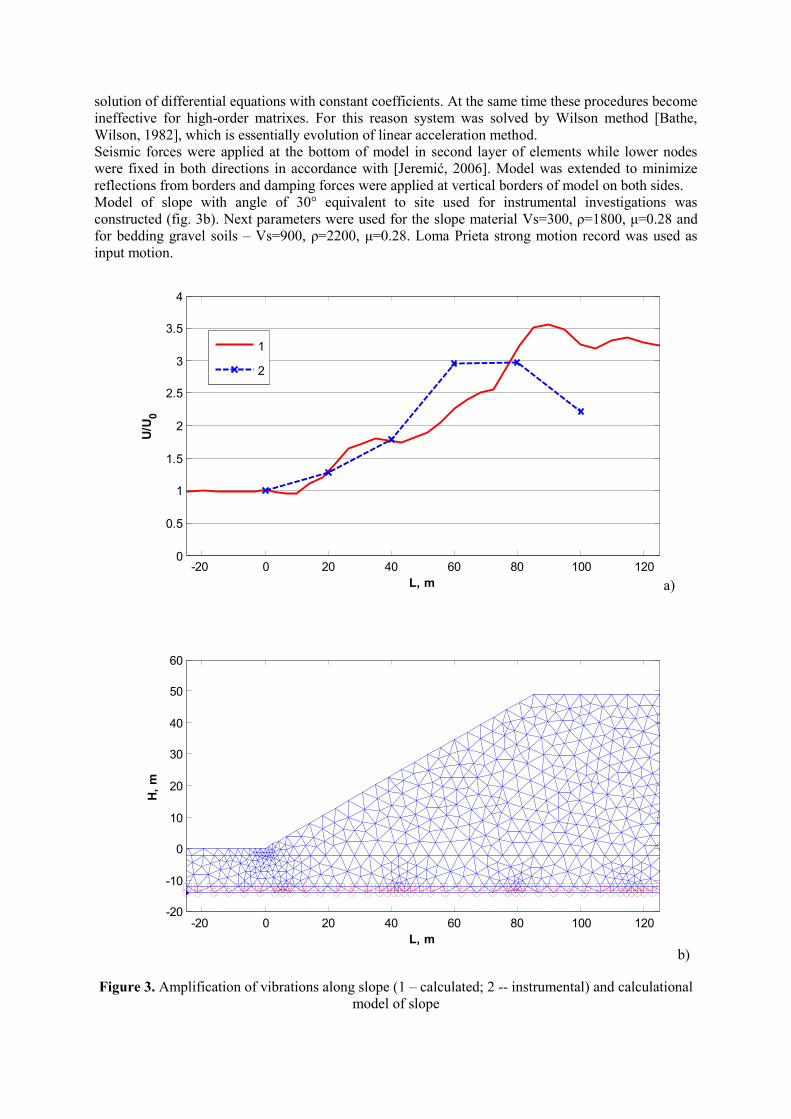
Seismic forces were applied at the bottom of model in second layer of elements while lower nodes
were fixed in both directions in accordance with [Jeremić, 2006]. Model was extended to minimize
reflections from borders and damping forces were applied at vertical borders of model on both sides.
Model of slope with angle of 30° equivalent to site used for instrumental investigations was
constructed (fig. 3b). Next parameters were used for the slope material Vs=300, ρ=1800, μ=0.28 and
for bedding gravel soils – Vs=900, ρ=2200, μ=0.28. Loma Prieta strong motion record was used as
input motion.
-20 0 20 40 60 80 100 1200
0.5
1
1.5
2
2.5
3
3.5
4
L, m
U/U
0
-20 0 20 40 60 80 100 120-20
-10
0
10
20
30
40
50
60
L, m
H,
m
1
2
b)
Figure 3. Amplification of vibrations along slope (1 – calculated; 2 -- instrumental) and calculational
model of slope
a)

Results of horizontal component amplification along profile are shown in figure 3a. Accordance of
both curves is observed in all points except located in 60 and 100 m. It must be noted that impacts of
different level and spectral content are comparing and this has effect on resulting amplitude level on
the surface.
3. EMPIRICAL DATA
Similar results were obtained with the help of empirical equation [Zaalishvili et al., 2010a,b]:
ΔI = –0,71 + 0,53 lg(αH) + K, (3.1)
where α – slope angle;
H – relative height;
K – soil type dependent coefficient: K = 0.3 for coarse-grained soils with the content of sand and clay
filler ≥ 30% , highly weathered rocks, clayey soils with consistency index IL ≤ 0.5 and porosity index
e<0.9 for clays and loams and e<0.7 for sandy loams.
The product of slope angle and relative height is referred as “relief coefficient” R as it was introduced
in [Zaalishvili, Gogmachadze, 1989].
Digital elevation model was constructed for the territory of Vladikavkaz city (fig. 4). Horizontals of
engineering-geological map topographic base of scale M 1: 10 000 were used. Two layers were
prepared for calculations – relative height and slope angles. Height of the central part of the city,
where flattering of terrain is observed was used as initial value for relative height calculation.
Calculated topographic intensity increments for whole territory are presented in figure 5. Red color
corresponds to intensity increments of 1-1.5 points.
Figure 4. Digital elevation model of the territory of Vladikavkaz city (absolute height varies from 630
(green) to 750 meters (brown))

Figure 5. Topographic intensity increments for the territory of Vladikavkaz city
-1
0
+1
Intensity increments

CONCLUSIONS
1. There are sites on the territory of Vladikavkaz city "unfavorable" for construction in
accordance with Russian Building Codes (SNiP II-7-81*) - slopes more than 15°. Main zone
of such conditions is terrace slope on right bank of river Terek with slopes of 25-35°. 2. Recording of microseismic vibrations was performed on the slope on the right bank of the river
Terek for instrumental investigations of intensity increments on the territory.
3. Sesimic vibrations of slope were modeled by means of finite element method. 4. For the whole territory of Vladikavkaz city topography influence on seismic intensity was
calculated by empirical equation
5. Topography influence on intensity increments can reach 1-1.5 points for some sites in
Vladikavkaz city.
REFERENCES
Bathe, K.-J., Wilson, E.L. (1976). Numerical Methods in finite element analysis. Prentice-Hall Inc., Englewood
Cliffs, New Jersey.
Recommendations on seismic microzonation in engineering investigations for construction. (1985) Moscow:
Gosstroy. 72. (in Russian)
RSN 65-87 (1988) Engineering construction surveys. Seismic microzonation. Standards for procedures
manufacturing. 1988.
Zaalishvili V.B., Melkov D.A., Gabeeva I.L (2010a) Influence of relief on earthquake intensity // Procs. of 14th
European Conference On Earthquake Engineering (14 ECEE 2010), paper #683, Ohrid, Macedonia, 30
Aug – 03 Sept 2010. 8 p.
Zaalishvili V.B., Melkov D.A., Gabeeva I.L (2010b) Technique of seismic microzonation. Patent of Russian
Federation RU 2399934, September 20, 2010.
Zaalishvili, V.B., Gogmachadze, S.A. (1989). Relief influence on wave field of pulsed and vibrational sources
//Investigation of fields of pulsed and vibrational sources for the means of seismic microzonation. Report
ISMEE AS GSSR. Tbilisi. Reg. 01.9.00.016412. 25-40. (in Russian)
Zaalishvili, V.B., Melkov, D.A., Otinashvili, M.G. (2008). Usage of finite element analysis in seismic hazard
assessment in mountainous regions / Journal «Earthquake engineering. safety of structures» (Moscow)
No. 3, 49-52. (in Russian)