Tommy Cleveland, PE NC Solar Center Solar Energy Today.
44
Tommy Cleveland, PE NC Solar Center Solar Energy Today
Transcript of Tommy Cleveland, PE NC Solar Center Solar Energy Today.
Tommy Cleveland, PENC Solar Center
Solar Energy Today
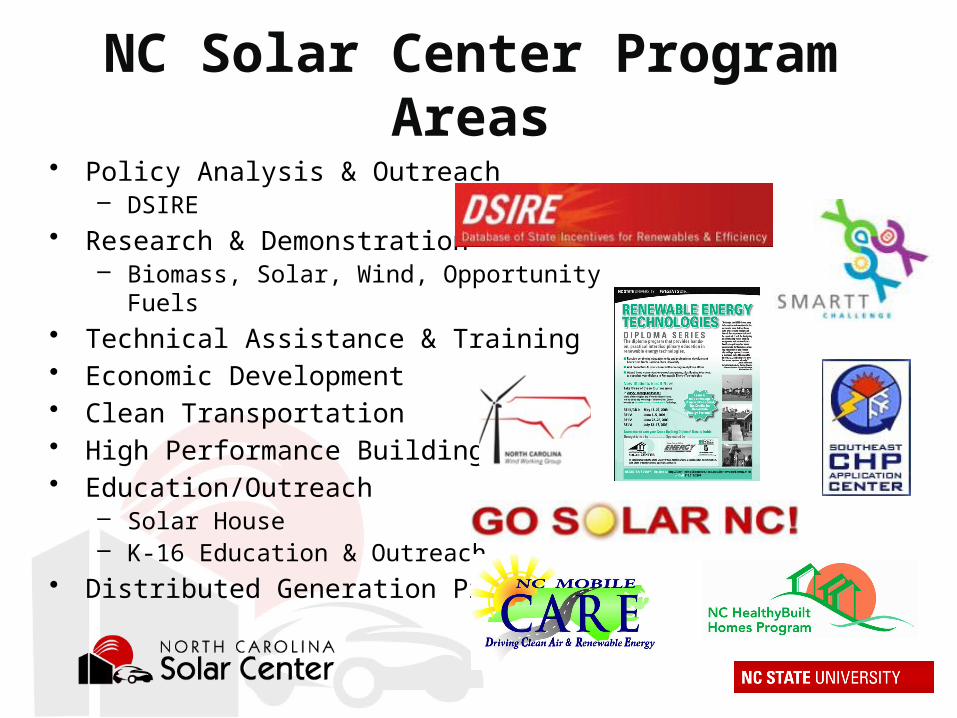
NC Solar Center Program Areas• Policy Analysis & Outreach
– DSIRE• Research & Demonstration
– Biomass, Solar, Wind, Opportunity Fuels• Technical Assistance & Training• Economic Development• Clean Transportation• High Performance Buildings • Education/Outreach
– Solar House– K-16 Education & Outreach
• Distributed Generation Program


The Fossil Fuel Era – Fueled by Millions of Years of Solar Energy

World Energy Resources
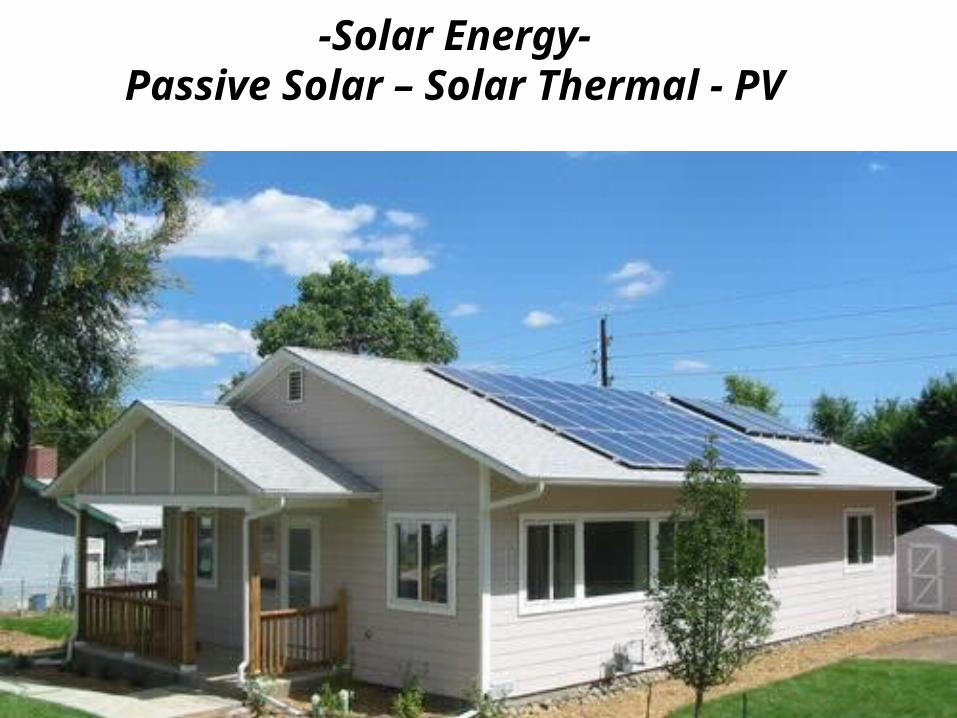
-Solar Energy-Passive Solar – Solar Thermal - PV
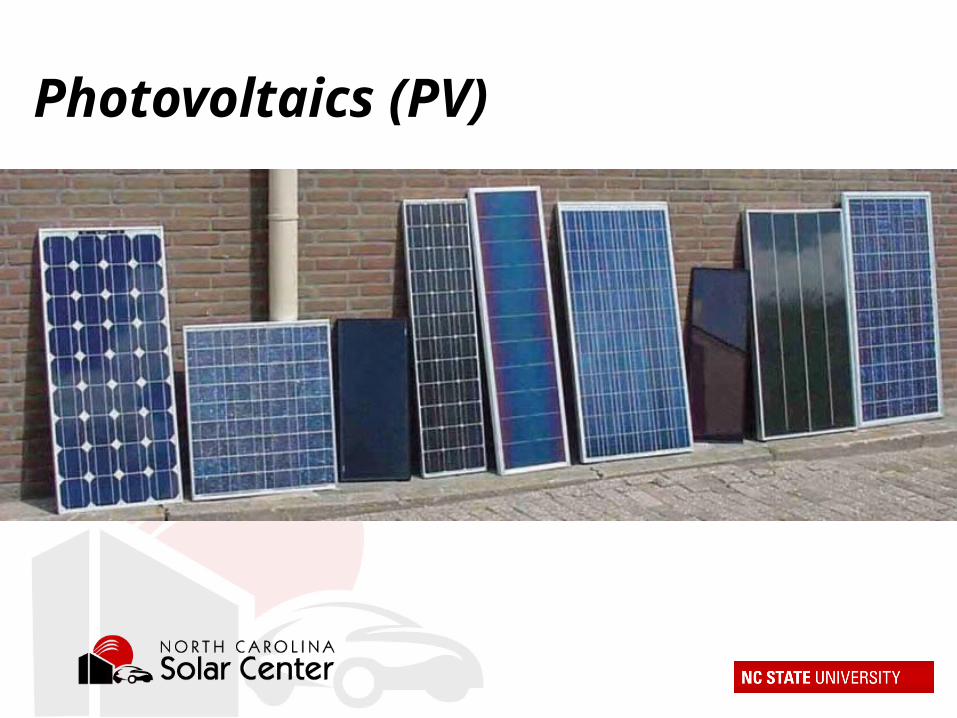
Photovoltaics (PV)
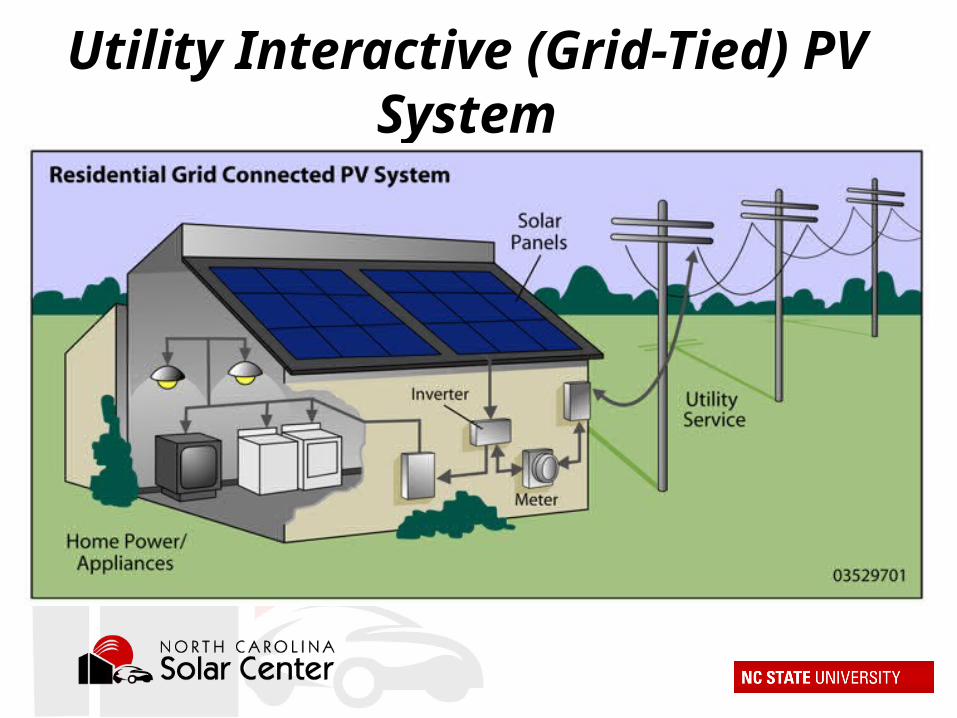
Utility Interactive (Grid-Tied) PV System

US PV Installations and Global Market Share, 2005-2016E (SEIA/GTM)
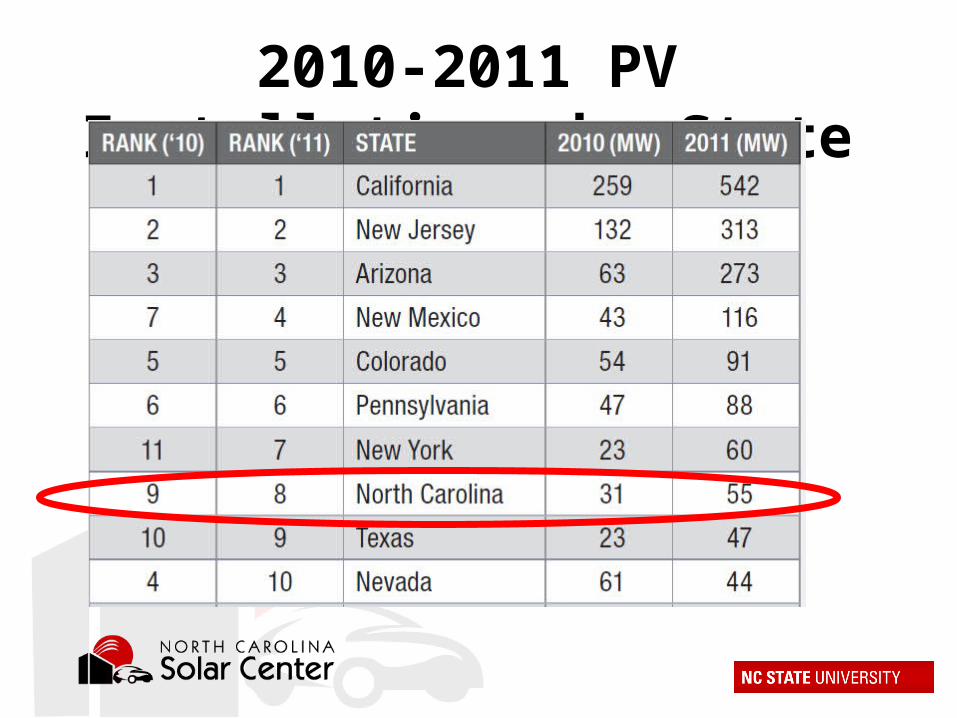
2010-2011 PV Installations by State
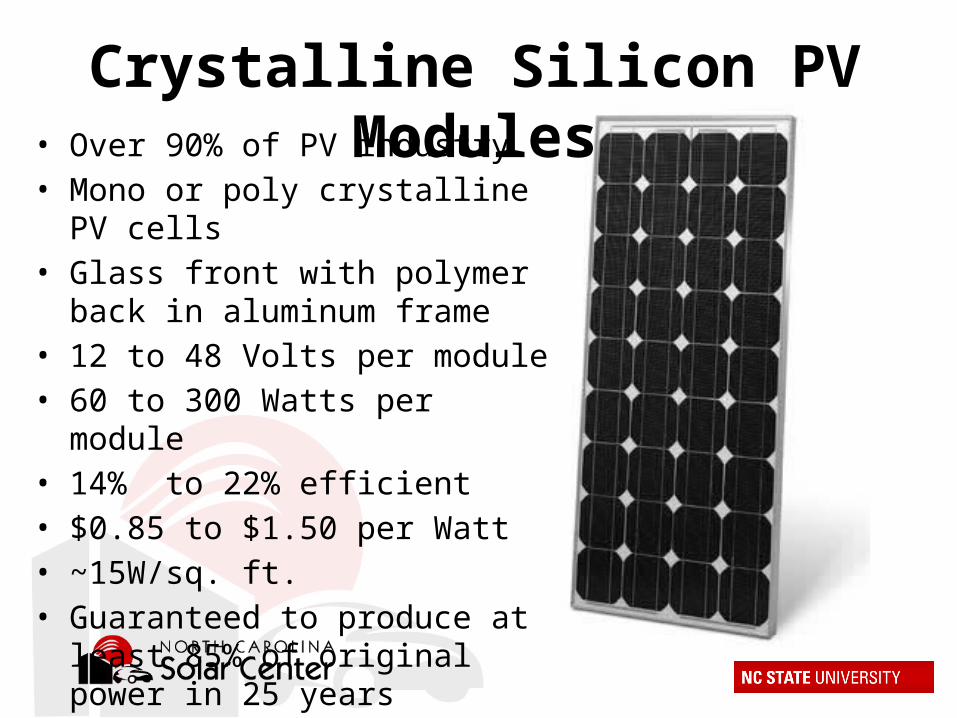
Crystalline Silicon PV Modules• Over 90% of PV industry• Mono or poly crystalline PV cells• Glass front with polymer back in
aluminum frame• 12 to 48 Volts per module• 60 to 300 Watts per module• 14% to 22% efficient• $0.85 to $1.50 per Watt • ~15W/sq. ft.• Guaranteed to produce at least 85%
of original power in 25 years
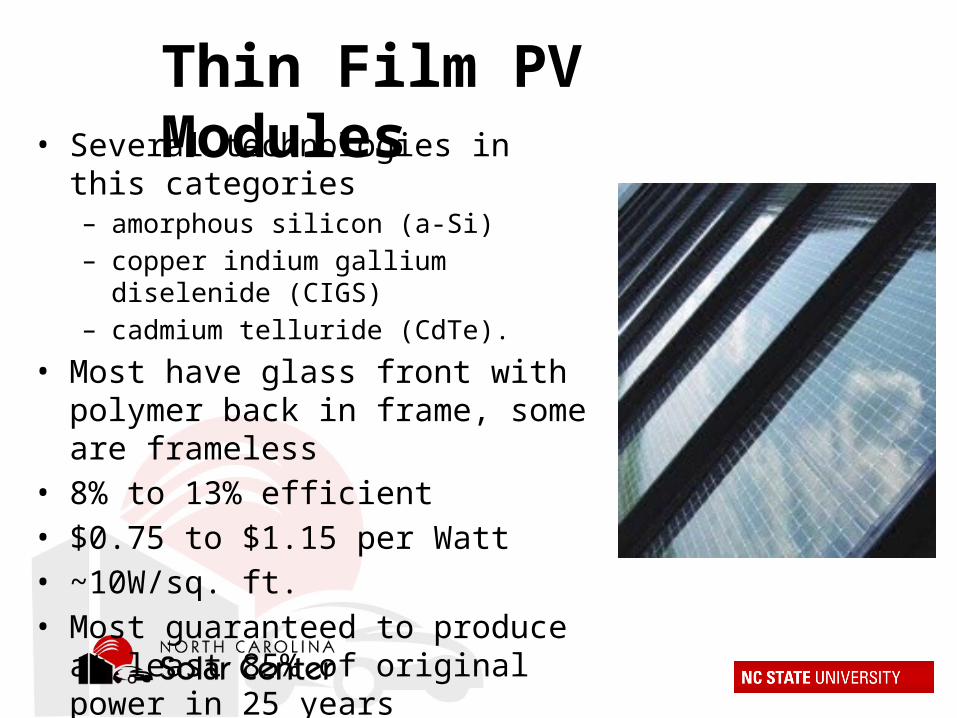
Thin Film PV Modules• Several technologies in this categories
– amorphous silicon (a-Si)– copper indium gallium diselenide (CIGS)– cadmium telluride (CdTe).
• Most have glass front with polymer back in frame, some are frameless
• 8% to 13% efficient• $0.75 to $1.15 per Watt• ~10W/sq. ft.• Most guaranteed to produce at least 85%
of original power in 25 years
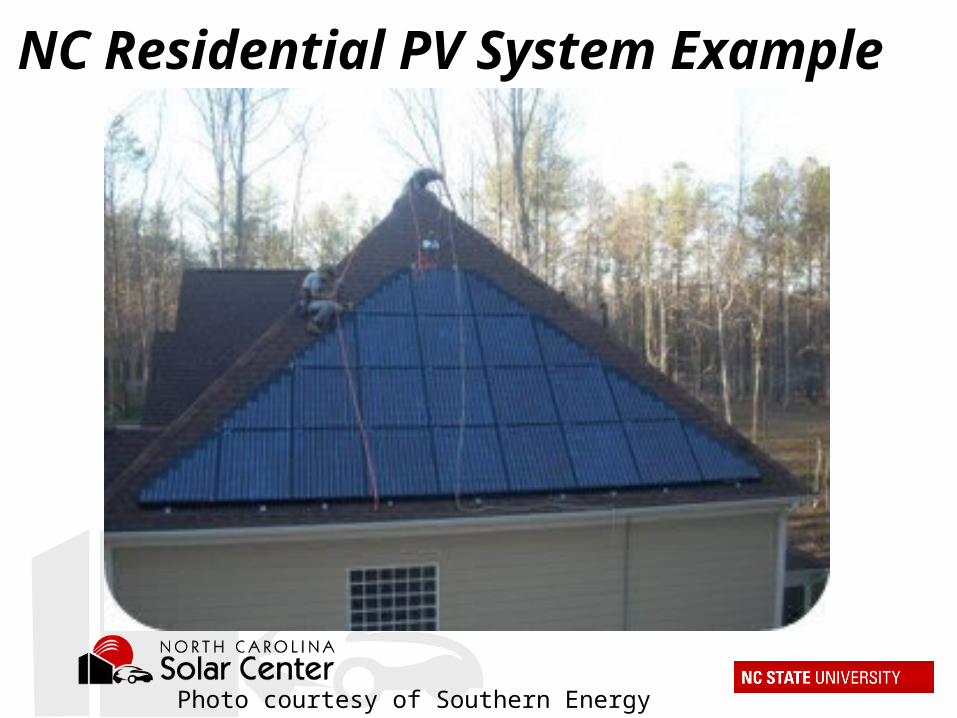
Photo courtesy of Southern Energy Management
NC Residential PV System Example

Photo courtesy of Southern Energy Management
NC Commercial PV System Example
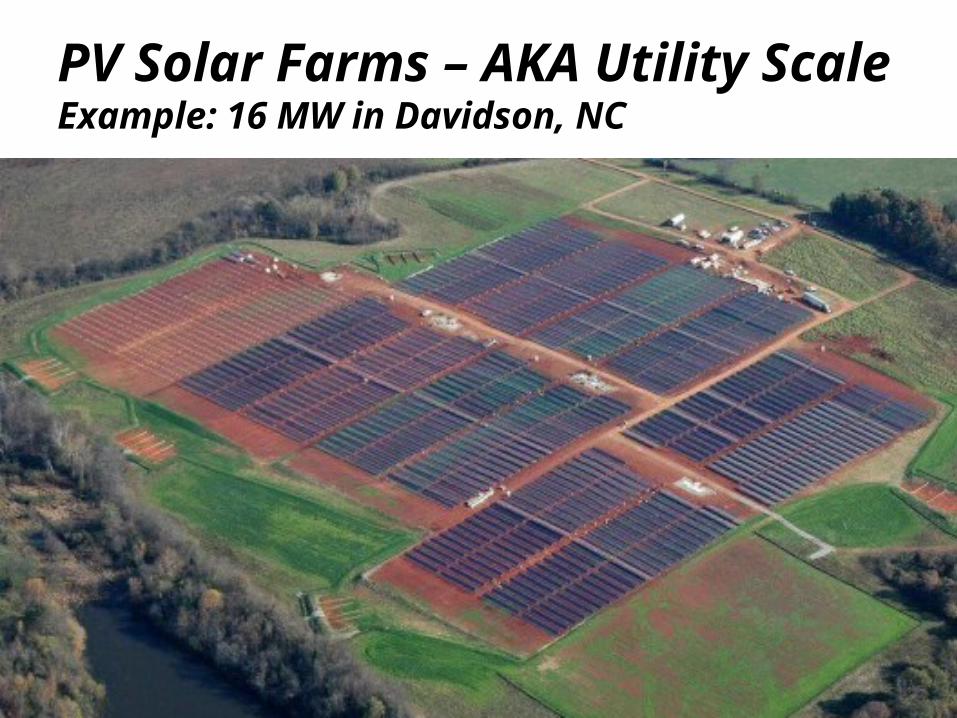
PV Solar Farms – AKA Utility ScaleExample: 16 MW in Davidson, NC
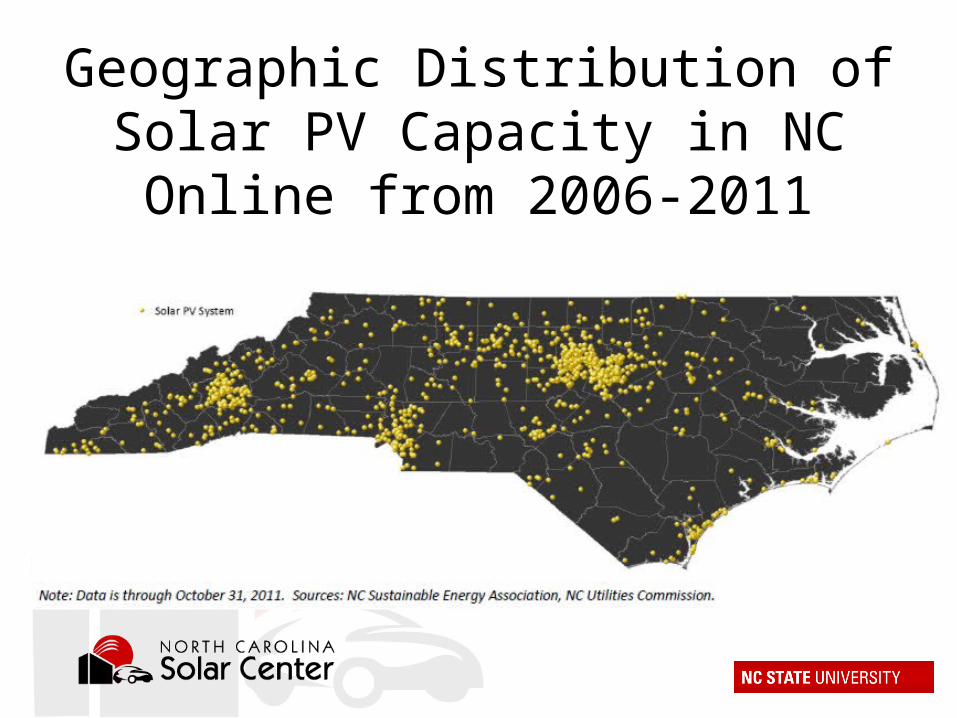
Geographic Distribution of Solar PV Capacity in NC Online from 2006-2011
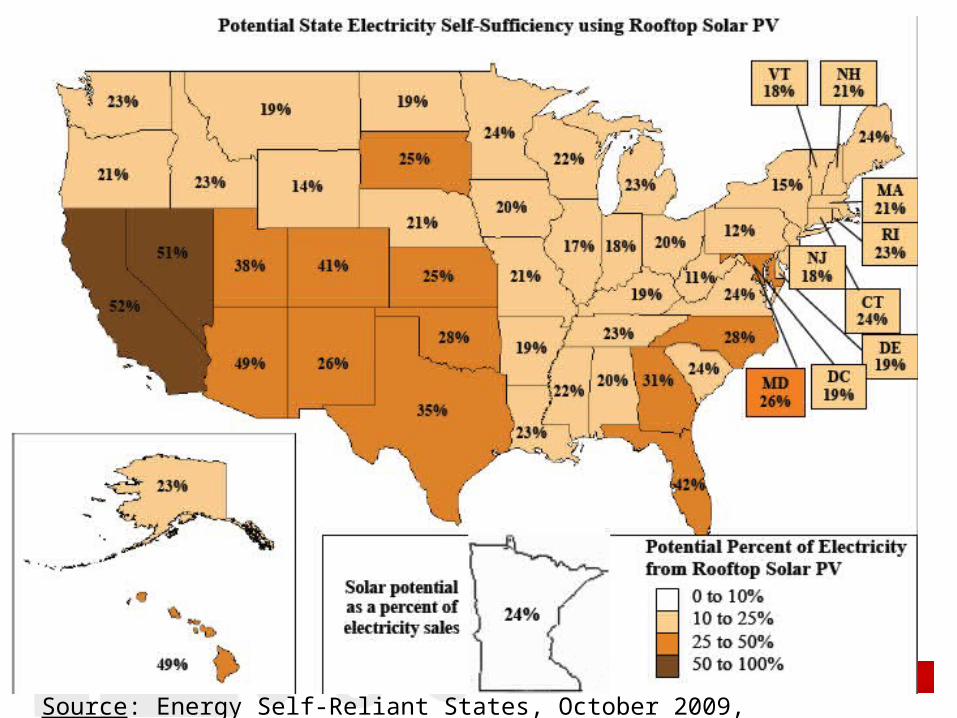
Source: Energy Self-Reliant States, October 2009, www.newrules.org
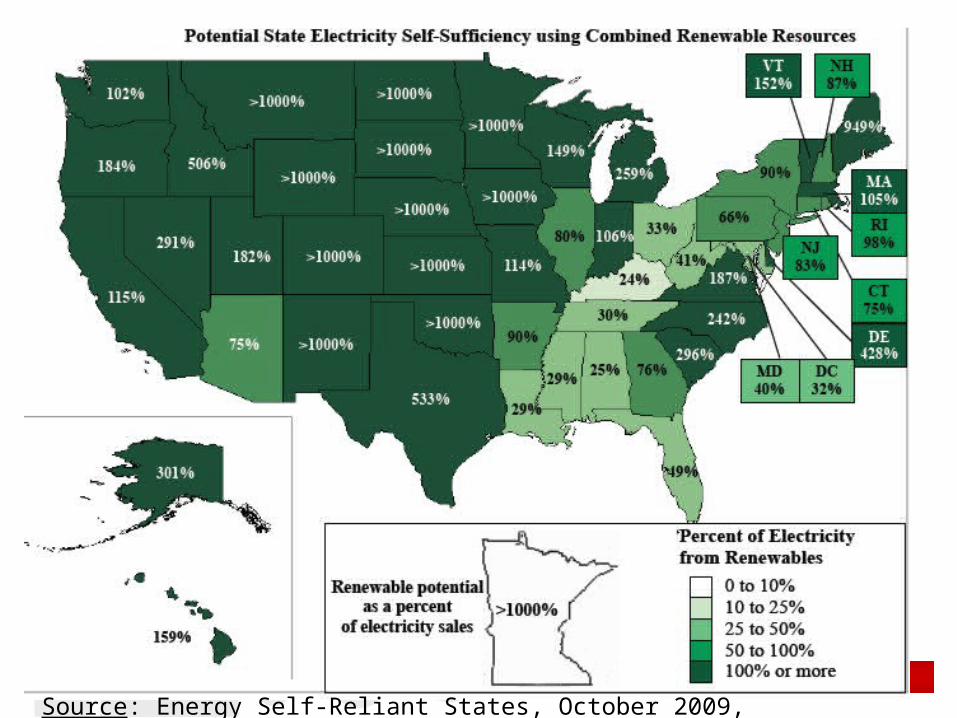
Source: Energy Self-Reliant States, October 2009, www.newrules.org
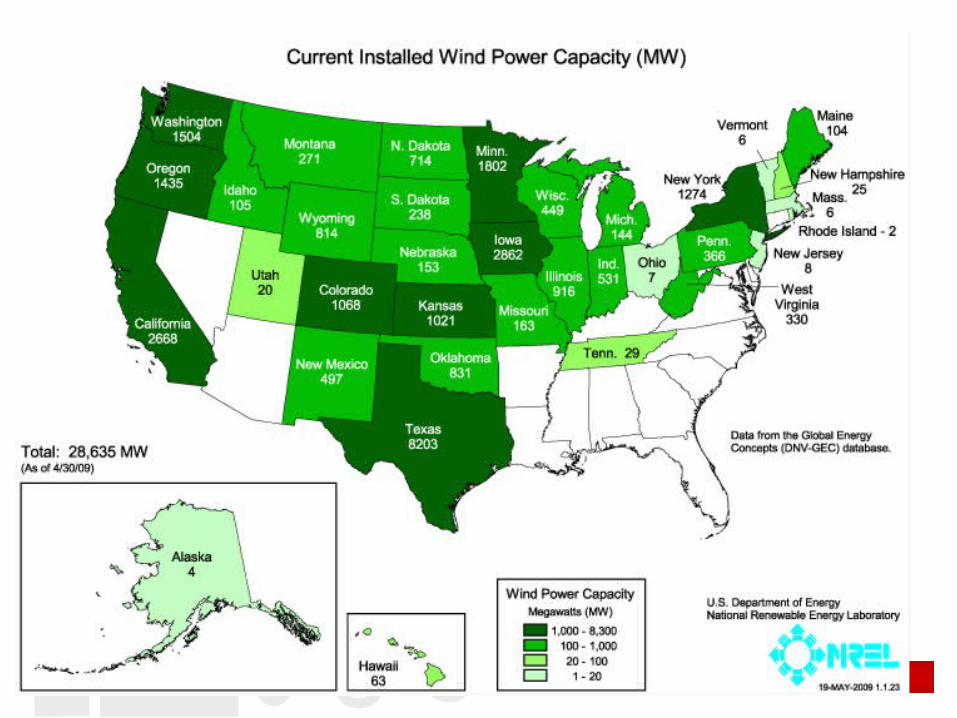

DOE 20% Wind by 2030 Scenario
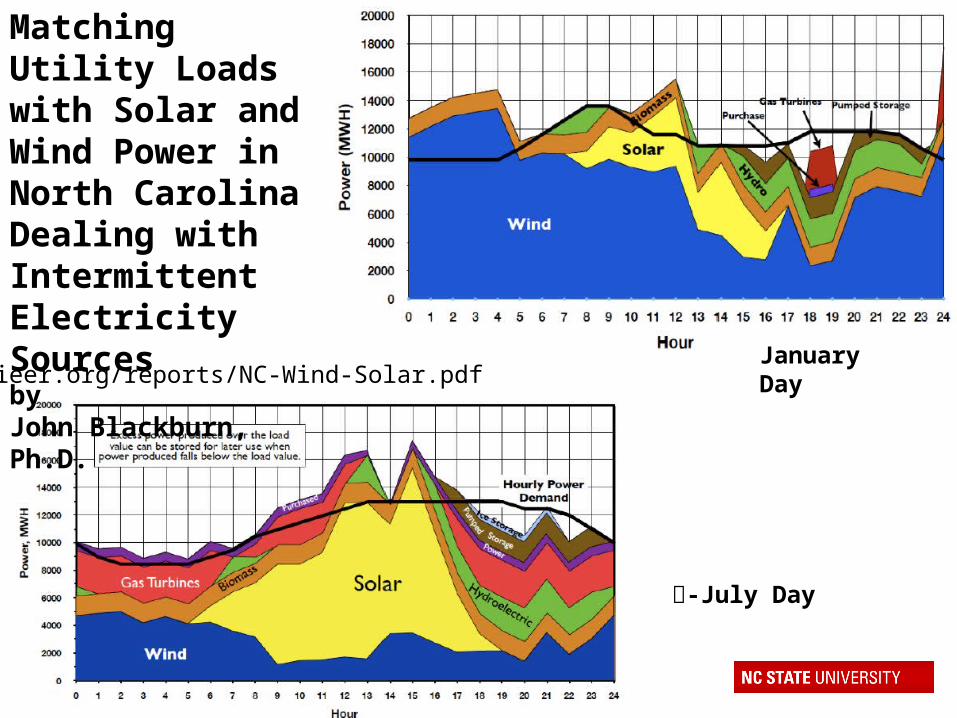
Matching Utility Loads with Solar and Wind Power in North CarolinaDealing with Intermittent Electricity SourcesbyJohn Blackburn, Ph.D.
-July Day
January Daywww.ieer.org/reports/NC-Wind-Solar.pdf
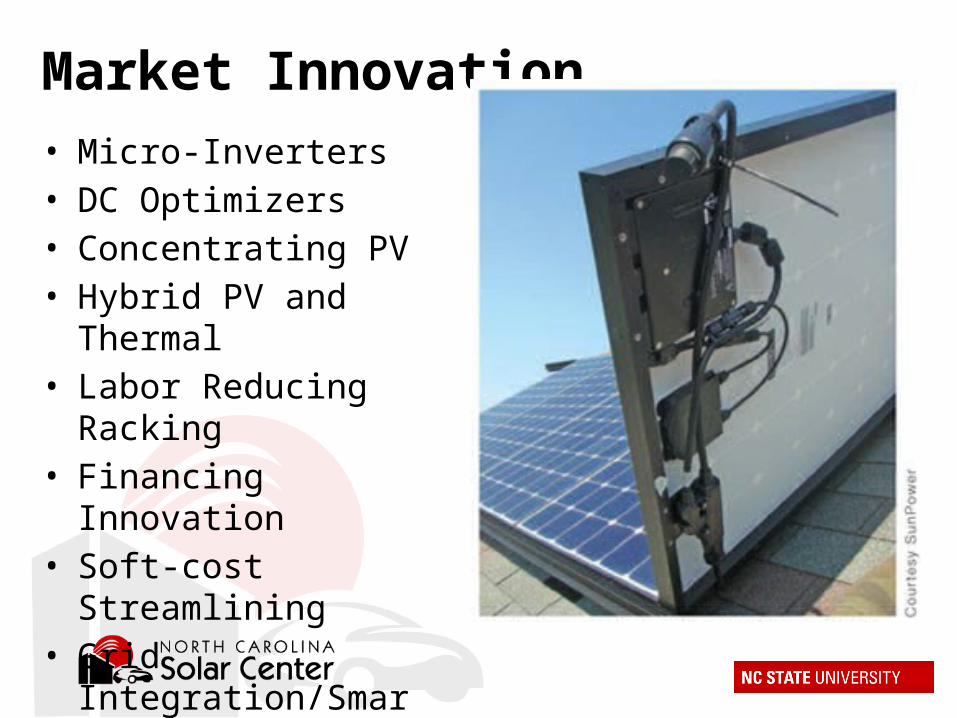
Market Innovation• Micro-Inverters• DC Optimizers• Concentrating PV• Hybrid PV and Thermal• Labor Reducing Racking• Financing Innovation• Soft-cost Streamlining• Grid Integration/Smart
Grid• Cost reductions….

When there is Grid Parity…

Percentage of NC Electric Customers at Grid Parity with LCOE of Solar PV Systems (NCSEA, 2012)
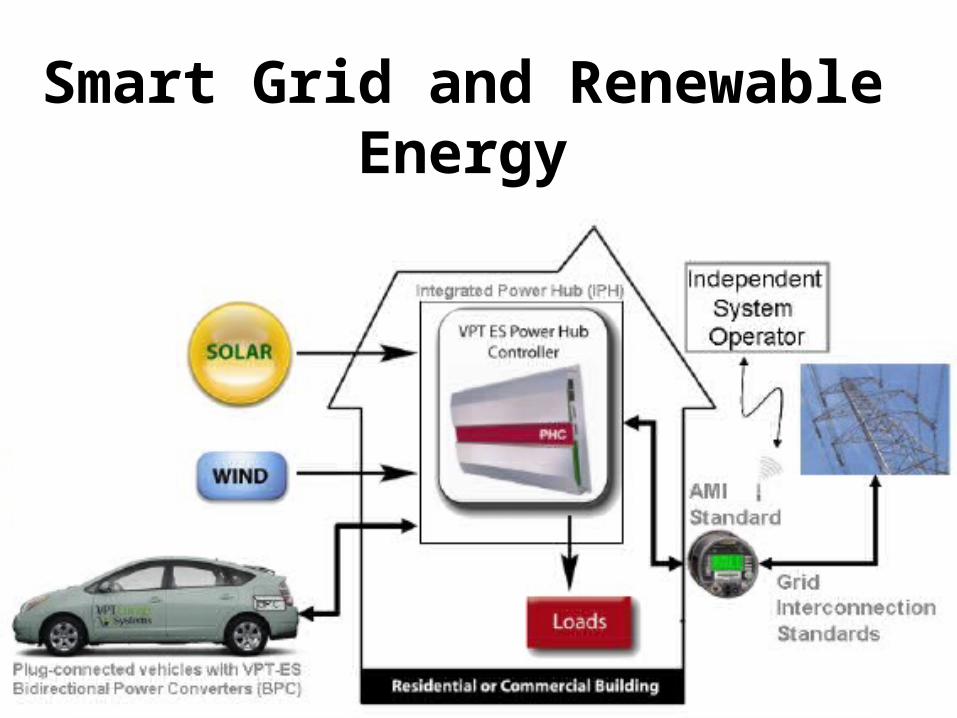
Smart Grid and Renewable Energy
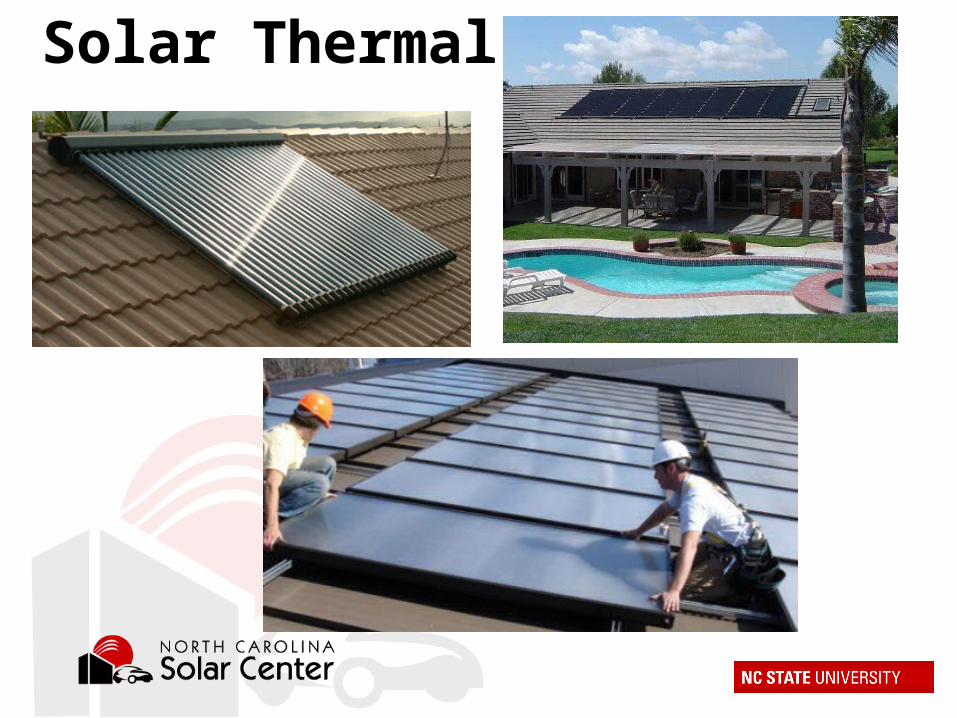
Solar Thermal

Installed Solar Water Heating Capacity by Country 2008 (Gigawatts thermal)
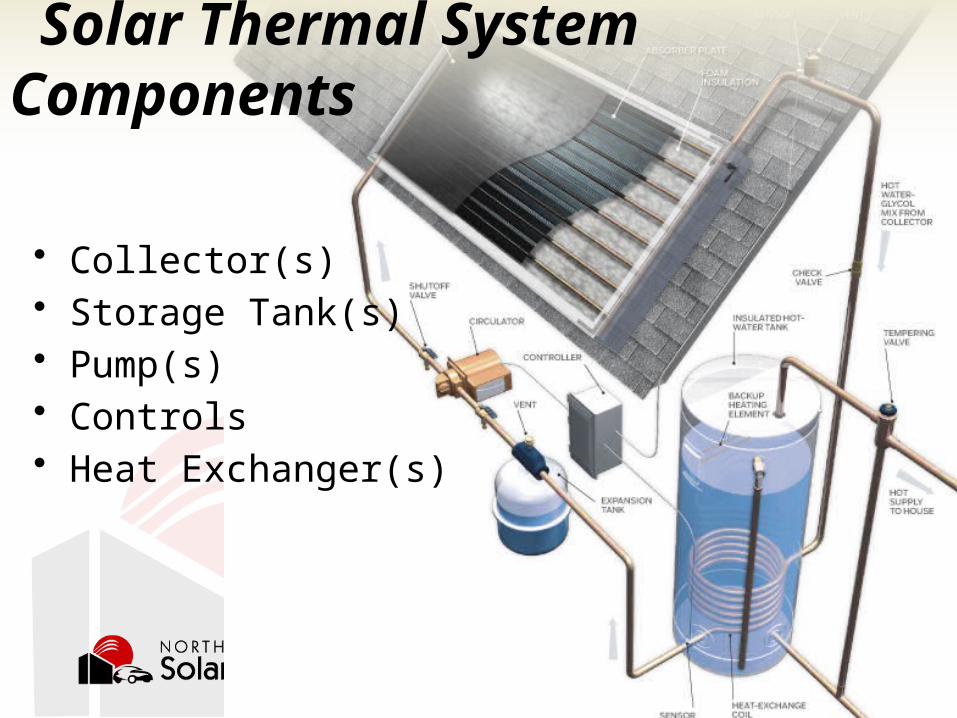
• Collector(s)• Storage Tank(s)• Pump(s)• Controls• Heat Exchanger(s)
Solar Thermal System Components
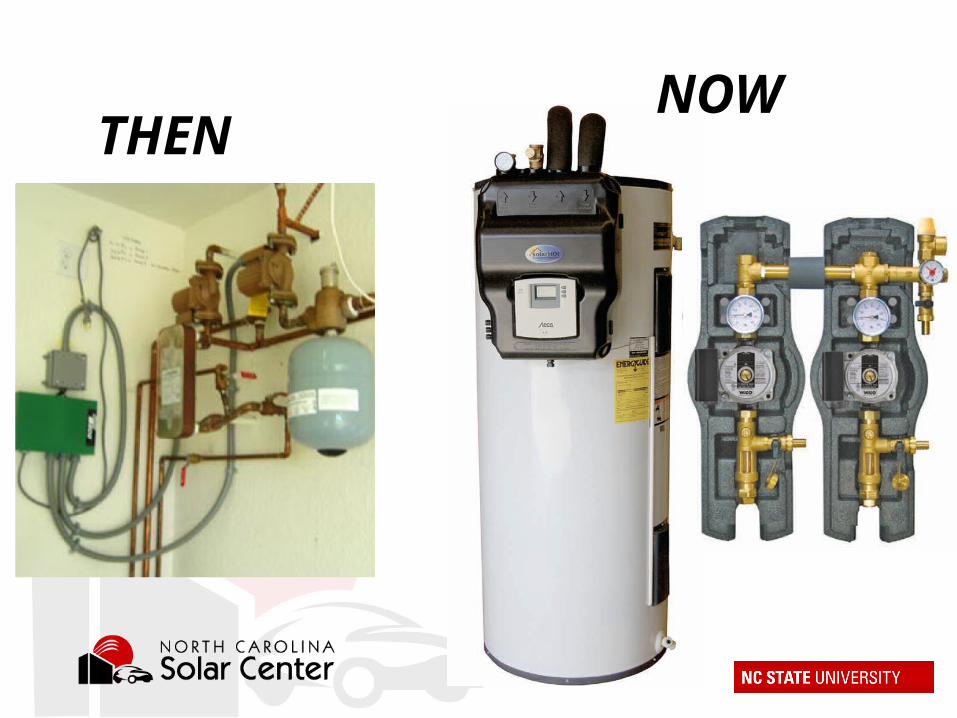
THENNOW

Flat Plate Collector

Evacuated Tube Collector

Photo courtesy of Southern Energy Management
NC Residential Solar Hot Water System Example

Photos courtesy of Southern Energy Management

The 208 solar panel system
Photos courtesy of FLS Energy
House of Raeford Farms, Rose Hill, NCHatchery Facility

• Hot water for Prestage processing plant• Completed in April 2012• 7-acre system, 2,100 panels• Nine x 25,000 gallon solar tanks• No capital expense from Prestage• Cost FLS $15 million• FLS will sell solar energy at lower rate
than propane, over 20% savings• FLS selling RECs
Nation’s Largest Solar Thermal System is in St. Pauls, NC
North Carolina Renewable Energy Policies
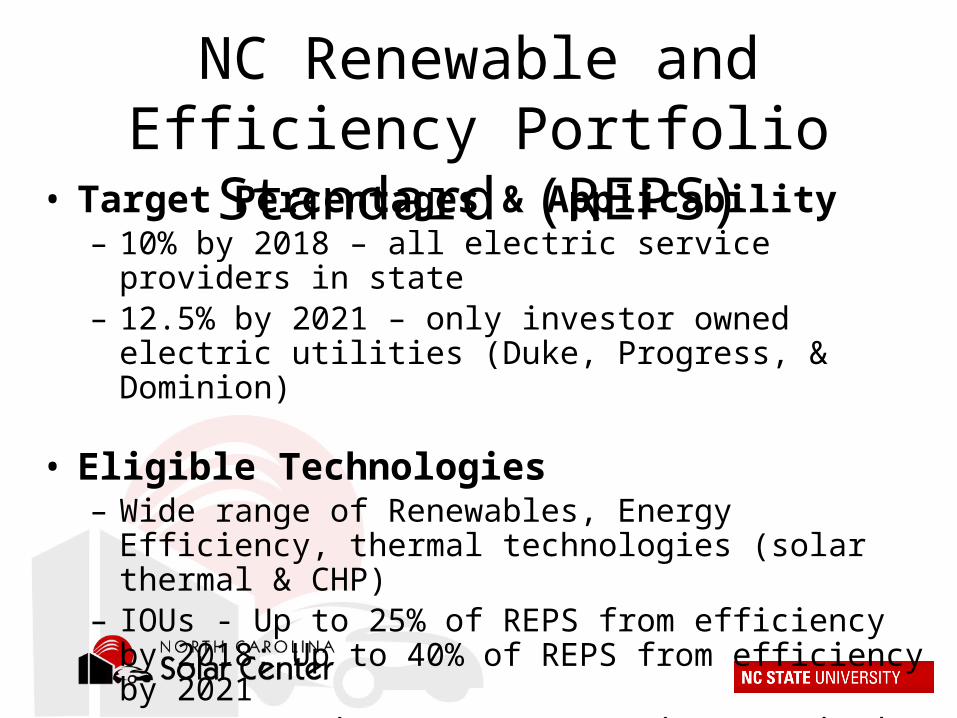
NC Renewable and Efficiency Portfolio Standard (REPS)
• Target Percentages & Applicability– 10% by 2018 – all electric service providers in state– 12.5% by 2021 – only investor owned electric utilities (Duke,
Progress, & Dominion)
• Eligible Technologies – Wide range of Renewables, Energy Efficiency, thermal
technologies (solar thermal & CHP)– IOUs - Up to 25% of REPS from efficiency by 2018; Up to 40%
of REPS from efficiency by 2021– Coops & Munis - Can meet entire standard (other than Solar,
Poultry, & Hog Set Aside) with efficiency
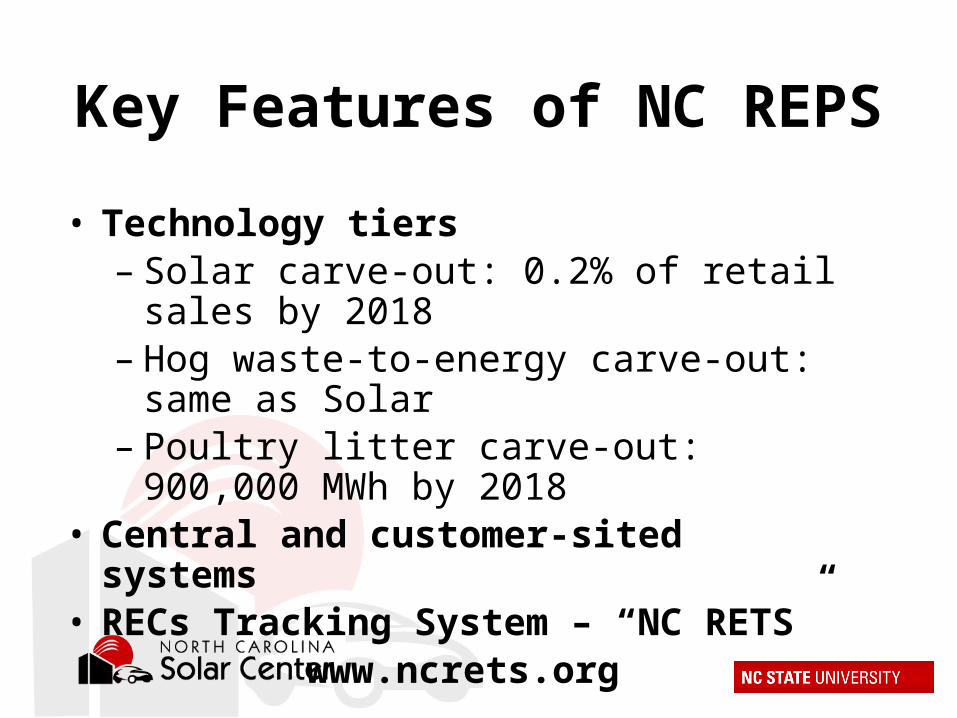
Key Features of NC REPS
• Technology tiers – Solar carve-out: 0.2% of retail sales by 2018 – Hog waste-to-energy carve-out: same as Solar– Poultry litter carve-out: 900,000 MWh by 2018
• Central and customer-sited systems • RECs Tracking System – “NC RETS”
www.ncrets.org
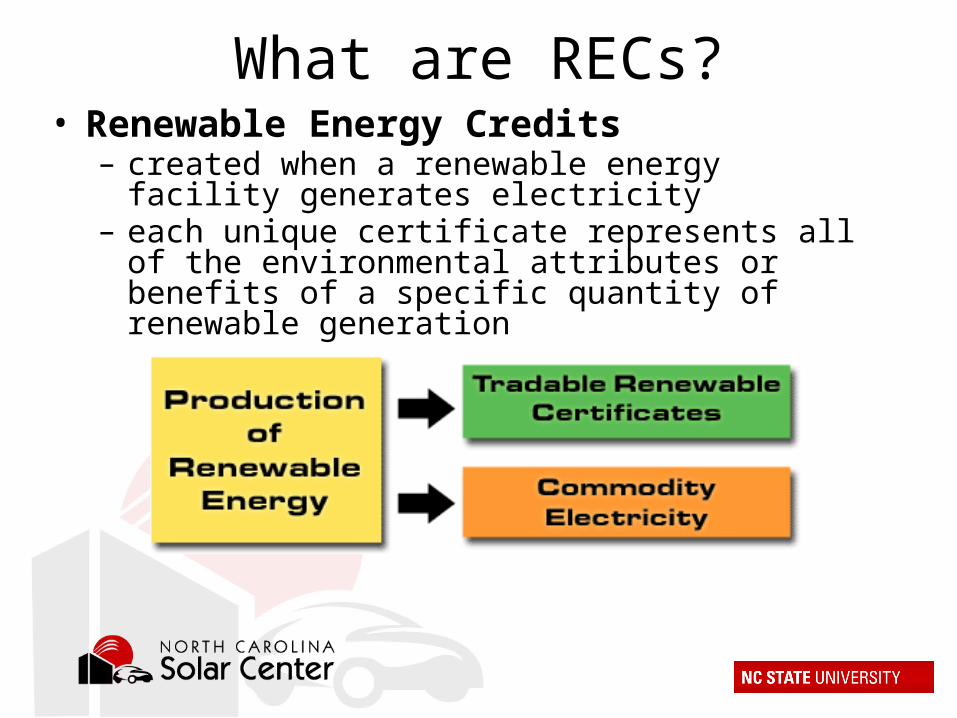
What are RECs?• Renewable Energy Credits
– created when a renewable energy facility generates electricity
– each unique certificate represents all of the environmental attributes or benefits of a specific quantity of renewable generation
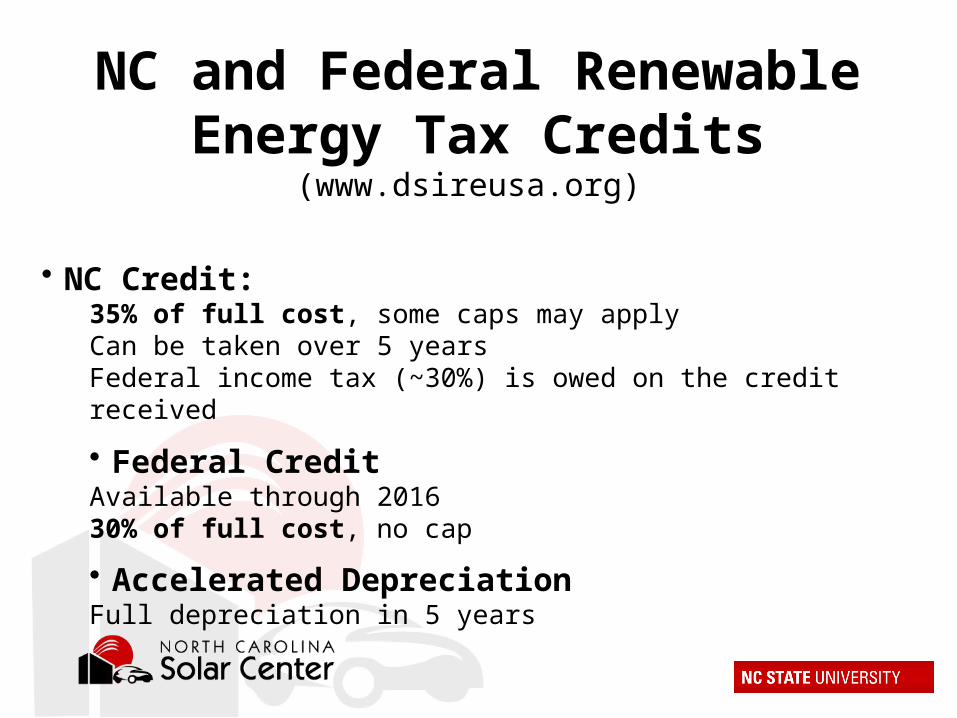
NC and Federal Renewable Energy Tax Credits (www.dsireusa.org)
• NC Credit:35% of full cost, some caps may applyCan be taken over 5 yearsFederal income tax (~30%) is owed on the credit received
• Federal CreditAvailable through 201630% of full cost, no cap
• Accelerated DepreciationFull depreciation in 5 years

NC Grid-Tied Solar Electricity Interconnection Options
• Buy All / Sell All – 2 meters• NC GreenPower www.ncgreenpower.org
• Currently paying 10 cents/kWh for <5kW• In addition utility pays ‘avoided costs’ for extra PV ~6
cents/kWh
• Power Purchase Agreement (PPA) with SRECs• Net Metering – 1 meter turns both ways
• PV electricity valued at retail kWh rate

• USDA Grant covers 75% of cost of renewable energy site assessment for– Rural small businesses– Agricultural producers
• Includes solar PV, solar thermal, wind, biomass
Solar Center USDA Renewable Energy Site Assessments
• Assessment of energy production and economics