Title: Analysis of MSW to Energy Conversion Process for ... · 6th International Workshop on...
27
6th International Workshop on Advances in Cleaner Production Title: Analysis of MSW to Energy Conversion Process for Sustainable Community Hossam A.Gabbar, Mohamed Aboughaly Industrial Partner: Janak Handa, ProFlange Inc.
Transcript of Title: Analysis of MSW to Energy Conversion Process for ... · 6th International Workshop on...

6th International Workshop on Advances in Cleaner Production
Title: Analysis of MSW to Energy Conversion Process for Sustainable Community
Hossam A.Gabbar, Mohamed Aboughaly
Industrial Partner: Janak Handa, ProFlange Inc.
Presentation Contents1.MSW Management as an Emerging Technology2.Pyrolysis and Gasification Flow Diagrams3.Waste to Energy Process Systems
1.Thermal and Electrical Efficiency2.Electricity Production and Operating Conditions
4.Life Cycle Assessment for Waste to Energy Process Systems5.Utilization of Thermal Plasma in Waste to Energy Systems6.ESCL – UOIT Experimental Work7.Conclusion8.Publications9.References

1. MSW Management as an Emerging Technology
Municipal solid wastewitnessed an exponentialglobal increase due toplastic, paper and organicmaterial high productionwithout consideringappropriate recyclingstrategies (Waste: AHandbook for Management ,2011) Figure 1 - World bank MSW mass composition

1. MSW Management as an Emerging Technology
Study also reveals that Canadaand the US generates enormousamount of waste per capita of778.36 kg/capita and 744kg/capita respectively, whilecountries like China emits 172million tons annually ( Theconference board of Canada,Municipal Waste generation ,2013)
Figure 1 - World bank MSW mass composition

1. MSW Management as an Emerging Technology
As seen on Figure 1, recyclingis still a minor activity incomparison with otherpractices such as landfillingand incineration(Environmental life-cyclecomparisons of recycling,landfilling and incineration: Areview of Recent Studies,R.A.Denison, 1996) Figure 1 - World bank MSW mass composition

1. MSW Management as an Emerging Technology
Chemical recycling is the mostpromising new technology toutilize MSW for electricityproduction and can be used toproduce chemicals by syngasFischer-Tropsch process(M.Li,N.Luo, Biomass EnergyTechnological Paradigm (BETP):Trends in this sector MDPI,Sustainability , 2017)
Figure 1 - World bank MSW mass composition

Figure 2 - MSW production per region in 2012 and 2015

2. Pyrolysis and Gasification Flow Diagrams• Waste thermal treatment: The waste is heated to elevated temperatures in a reaction
chamber (i.e. pyrolysis 500 - 900℃, gasification 900℃ - 1500℃) (A.Kumar, D.D.Jones,Thermochemical biomass gasification: A review of the current status technology, 2009)
• The processes can be used for any solid wastes releasing hydrocarbon products and thermalenergy
Municipal solid waste
Organic material
Inorganic material
Combustible material
Others
Pyrolysis and Gasification
Incineration
Lanfill
Air Residue/Slag
Hydrocarbon products
Electricity production
Thermal energy
Methane release
Figure 3 - MSW chemical recycling flowchart

L.Jewell, G.Hutchings, Hydrocarbon conversion in the production ofsynthetic fuels: general discussion, Royal Society of Chemistry, 2017
Figure 4 - MSW chemical recycling end products flowchart
Pyrolysis( 550 to 900 C )
Heating rate : 1 k/s
Gasification(1000 to 1300 C)
Heating rate: 1000 k/s
Gasoline Oil
Diesel Oil
Hydrocarbon Gas
Syngas
Tar
Gas TurbineBoiler Gas
BurnerHigh Pressure Steam Turbine
Electricity Grid
Syngas synthesis
Ammonia
Chemicals
Methanol
Chemical Upgrading
Combustion Engines
Gasoline
Kerosene
Urea Fertilizers
Acetic Acid
Refinery Fuels

Thermal process Thermal efficiency Electrical efficiency
Average (%) Average (%)
Incineration 44 19
Gasification 30 34
Pyrolysis 70.3 15.25
Combined gasification -
pyrolysis
40 35
Pyrolysis has highest thermal efficiency followed by Incineration and combinedpyrolysis-gasification cycle (A.M.Shakorfow Biomass. Incineration, Pyrolysis,Combustion and Gasification, 2013)• Pyrolysis has low thermal electrical efficiency due to production of fossil fuels rather
than syngas• Gasification and combined pyrolysis-gasification has highest electrical efficiency (D.
A. T.Astrup, "Life cycle assessment of thermal waste-to- energy technologies: Reviewand recommendations," Elsevier, Waste Management, vol. 37, p. 104 –115, 2015)
3. Waste to Energy Process Systems
Table 1 - Thermal and Electrical Efficiency data

0
100
200
300
400
500
600
700
INCINERATION PYROLYSIS PYROLYSIS /GASIFICATION
GASIFICATION
544 571
685 685
Ele
ctri
c p
rod
uct
ion
(K
Wh
) p
er
Ton
MSW thermal treatment processes
KWh
Electricity Production and Operating Conditions
Gasification and combined pyrolysis-gasification(P-G) processes shows highest electricity production
(G.C.Young, "Economic, technical, and renewable comparisons," in Municipal Solid Waste to Energy Conversion Processes, , Wiley, 2010, p.2)
Figure 5 - MSW thermal treatment electricity production

• Pyrolysis has three different reactions with different operating parameters
• Slow pyrolysis
• Fast pyrolysis
• Flash pyrolysis
• For MSW flash and fast pyrolysis are the most common for MSW , however for plasticwaste, pyrolysis is the most common
• MSW flash pyrolysis and gasification are considered continuous processes
Electricity Production and Operating Conditions
Slow pyrolysis Fast
pyrolysis
Flash pyrolysis Gasification
Pyrolysis temperature
(K)
573 - 973 873 - 1273 >1073 > 1273.15
Heating rate (K/ min) 0.1 to 1 10 to 200 >1000 >1000
Residence time (min) 5-9 <1 <0.01 <0.01
Table 2 - MSW Pyrolysis and gasification operating conditions

4. Life Cycle Assessment for Waste to Energy Process Systems
• Amount of syngas producedfrom 1 ton of MSW varybetween 0.8 – 1.1 nm3/kg.Below are the expectedgaseous emissions for MSWincineration, pyrolysis andgasification thermal systems
• In compared with Incineration,pyrolysis has less CO2, NOx,SOx, HCl and CO emissions( HClformation from RDF pyrolysisand combustion in a spouting-moving bed reactor, energy &fuels, ACS, 16 (3) 2002)
WTE process Gaseous effluent Mass percentage
IncinerationCO2 7.31 wt%
NOx 0.134 wt%
SO2 0.0335 wt%
HCl 0.00672 wt%
CO 0.0336 wt%
Dioxins and furans 0.0672 wt%
Pyrolysis &Gasification
CO2 0 wt% for pyrolysis
58% for Gasification
NOx 0.0147 wt%
SO2 0.000062 wt%
HCl 0.000407 wt%
CO 0.0091 wt%
Dioxins and furans 3.12 x 10⁻¹² wt%
Table 3 - MSW pyrolysis, gasification and incineration emissions

5. Utilization of Thermal Plasma in Waste to Energy Systems
1. Large Plasma Channel
2. Small Plasma Channel
3. Cooling Gas Channel
Figure 6 - Plasma array generator (PAG) Figure 7 - PAG temperature simulation Figure 8 - PAG mechanical design

Thermal Plasma Models1. PAG-1 Model
• Product functions: Inductively Couple RF Plasma Torch Array
• Electric Specifications
• Input power type: 208 VAC
• RF power level: 1 kW2. PAG-20 Model
• Product functions: Inductively Couple RF Plasma Torch Array
• Electric Specifications
• Input power type: 380 VAC
• RF power level: 20 kW
3. PAG-80 Model
• Product functions: Inductively Couple RF Plasma Torch Array
• Electric Specifications
• Input power type: 380 VAC
• RF power level: 80 kW
4. PAG-200 Model
• Product functions: Inductively Couple RF Plasma Torch Array
• Electric Specifications
• Input power type: 380 VAC
• RF power level: 200 kW
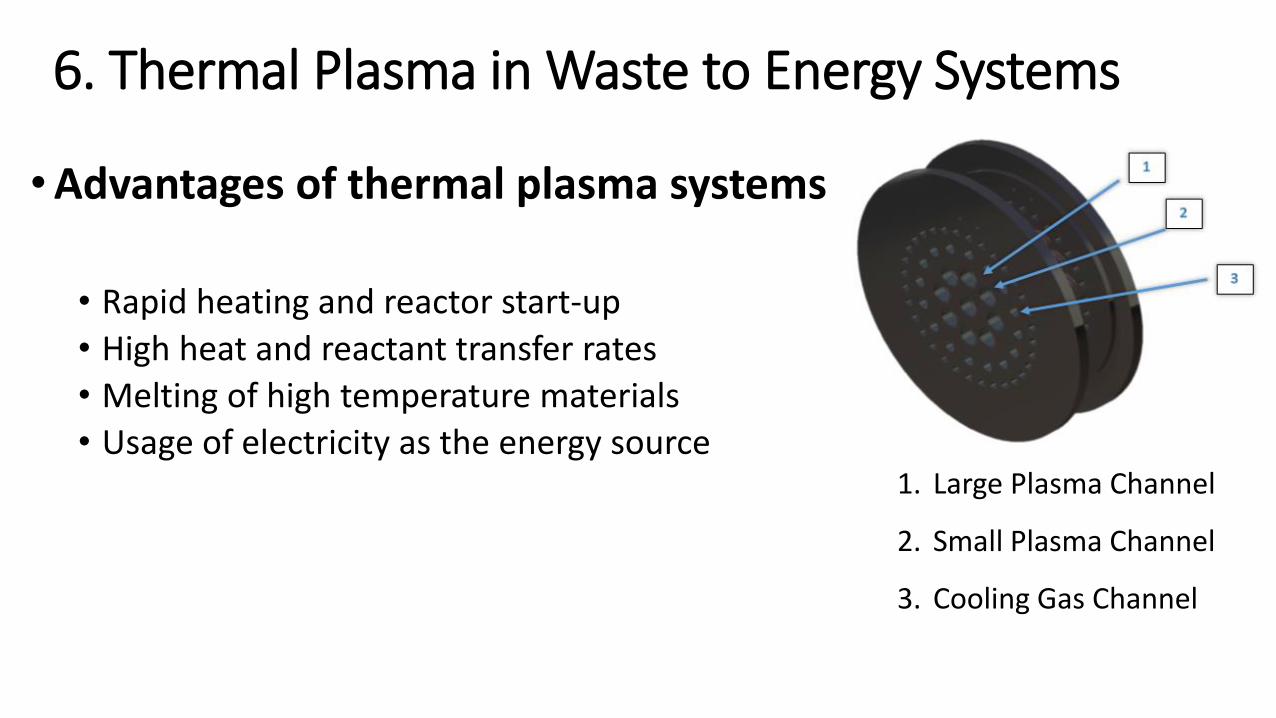
6. Thermal Plasma in Waste to Energy Systems
•Advantages of thermal plasma systems
• Rapid heating and reactor start-up
• High heat and reactant transfer rates
• Melting of high temperature materials
• Usage of electricity as the energy source1. Large Plasma Channel
2. Small Plasma Channel
3. Cooling Gas Channel

Thermal plasma process system integration
Figure 9 - Thermal plasma integration in waste to energy (WTE) systems

6. Energy Safety and Control Lab – UOIT Experimental Work
Pyrolysis Reactor
Nitrogen Gas
P-1
2. Vacuum Pump
P-3
6. Oil Collector
K -Type Thermocouple
7.Mass scale
8. Gas Chromatograph
Cooling Water Condenser
Plasma arc
V-2
P-4
V-1
V-3
Advantages of thermal plasma systems
• rapid heating and reactor start-up
• High heat and reactant transfer rates
• Melting of high temperature materials
• Usage of electricity as the energy source
Figure 10 - Thermal plasma plastic to oil pyrolysis experimental setup

Figure 12 - DC thermal plasma emissions
Ceramic nozzle emissions
Figure 11 - Oil sample collected from 15 g LDPE at 540℃ and 30 minutes in pyrolysis (Nitrogen) Conditions

9. MSW Pilot Plant Schematic Diagram
Land Area : 300 square metres

Plasma-Based Plastic to Oil Pyrolysis Process

Computers for Instrumentation
Instruments and Data
AcquisitionElectronics
for Equipment
RF Generator, HV DC Supply
Plasma Array Generator
Compressed Nitrogen
Turbine Generator
Gasifier
Plasma Array Generator (PAG) for Waste-to-Energy

High Performance Plasma Experimentation for Clean Energy and Industrial Applications

7. Conclusion
• The exponential increase of MSW justifies the priority of pyrolysisand gasification over incineration and landfilling treatments
• Pyrolysis and gasification produces hydrocarbon liquids and gasesrespectively which can be utilized for combustion and electricitygeneration
• The electricity generation of both chosen thermal process are higherthan incineration with higher CO2 emissions and lower SO2, dioxins,HCl and carbon monoxide emissions
• Maximum electrical efficiency is achieved by combined gasification-pyrolysis process around 35 % and minimum electrical efficiency ofonly 19% is achieved by incineration due to only thermal energyrelease

8. Publications
1. An energy evaluation For thermal conversion of thermoplastic waste torefined oil products using pyrolysis reaction process system , InternationalJournal Of Process Systems Engineering (IJPSE) , Vol.4, No.1, 2016
2. Comparative study of MSW heat treatment processes and electricitygeneration, Journal of the Energy Institute , May 2017
3. Analysis of MSW to energy conversion process for sustainable community,6th International Workshop on Advances in Cleaner Production, San Paulo,Brazil ,2017 ( Accepted)

9. References
1. T.Letcher, D.Vallero, Waste: A handbook for management , 2011
2. The conference board of Canada, Municipal waste generation , 2013
3. R.A.Denison, Environmental life-cycle comparisons of recycling, landfilling and incineration: A review of recentStudies, 1996
4. M.Li, N.Luo, Y.Lu, Biomass Energy Technological Paradigm (BETP):Trends in this sector, Sustainability, MDPI, 9 , 5672017
5. A.Kumar, D.D.Jones, Thermochemical biomass gasification: A review of the current status technology, 2009
6. A.M.Shakorfow, Biomass, incineration, pyrolysis, combustion and gasification, International Journal of Science andResearch (IJSR), 2013
7. D. A. T.Astrup, "Life cycle assessment of thermal waste-to- energy technologies: Review and recommendations,"Elsevier, Waste Management, vol. 37, p. 104 –115, 2015.
8. G.C.Young, "Economic, technical, and renewable comparisons," in Municipal Solid Waste to Energy ConversionProcesses, , Wiley, 2010, p.2
9. Z.Wang, H.Huang, H.Li, C.Wu, Y.Chen, HCl formation from RDF pyrolysis and combustion in a spouting-moving bedreactor, energy & fuels, ACS , 16 (3) 2002

THANK YOU