MSW energy conversion technologies and MSW gasification ...
81
MSW energy conversion technologies and MSW gasification Suani Teixeira Coelho Research Group on Bioenergy - GBIO Bogota, 18 de septiembre de 2015
Transcript of MSW energy conversion technologies and MSW gasification ...

MSW energy conversion technologies and MSW gasification Suani Teixeira Coelho
Research Group on Bioenergy - GBIO Bogota, 18 de septiembre de 2015

Summary
• World energy matrix and MSW
• MSW in Brazil – current situation
• Sinergies MSW energy conversion x basic sanitation
• Existing technologies for MSW energy conversion
• Small and medium municipalities and MSW gasification
• Barriers and proposals


MSW in Europe - 2008
Fonte: Kohler, 2010
Most developed Less developed

Avfall Sverige – Swedish Waste Management
http://www.avfallsverige.se/fileadmin/uploads/forbranning_eng.pdf
MSW in Sweden

Fotos: visita 2014 (Lisboa,Portugal)
MSW – Portugal

• 3 incineration chambers
• 37 MW steam turbine • LHV (MSW) = 7400-7800 kJ/kg • 2000 t/d MSW (Lisboa + 5 municipalities) • Investment: € 174 million (2011) • € 94 million (54% from EU) •Tariffs
Municipalities € 20 /t Inhabitants € 40 /t
Electricity sales € 84 euros/MWh (“green tariff”)
Visita pessoal, Junho 2012
VALORSUL Bobadella, Lisboa -
Portugal

Summary
• World energy matrix and MSW
• MSW in Brazil – current situation
• Sinergies MSW energy conversion x basic sanitation
• Existing technologies for MSW energy conversion
• Small and medium municipalities and MSW gasification
• Barriers and proposals

Brazilian Electricity Matrix
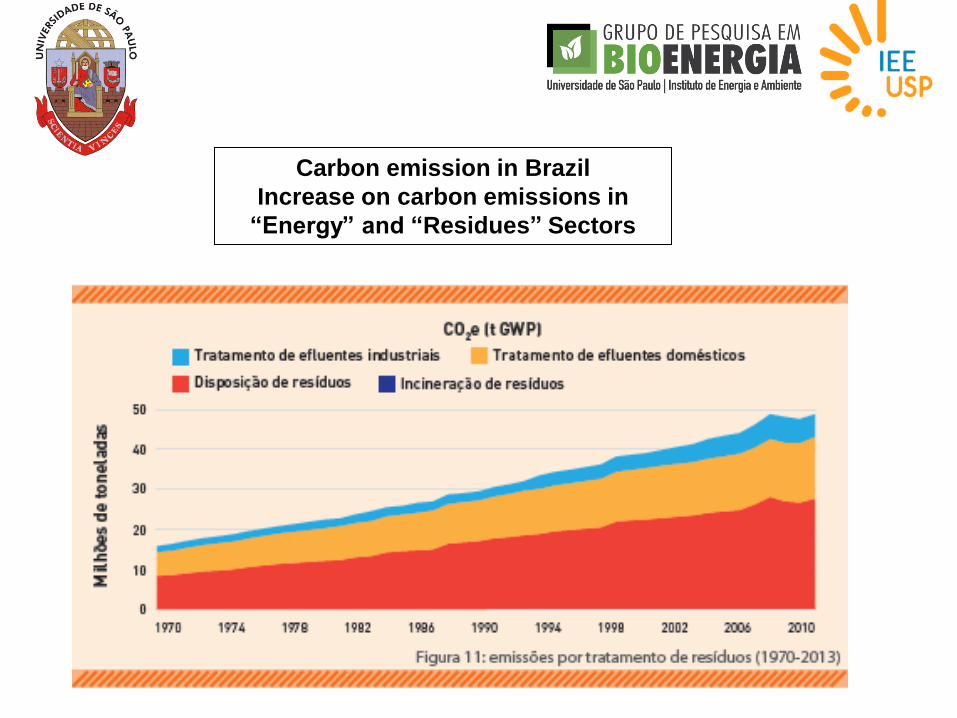
Carbon emission in Brazil
Increase on carbon emissions in
“Energy” and “Residues” Sectors
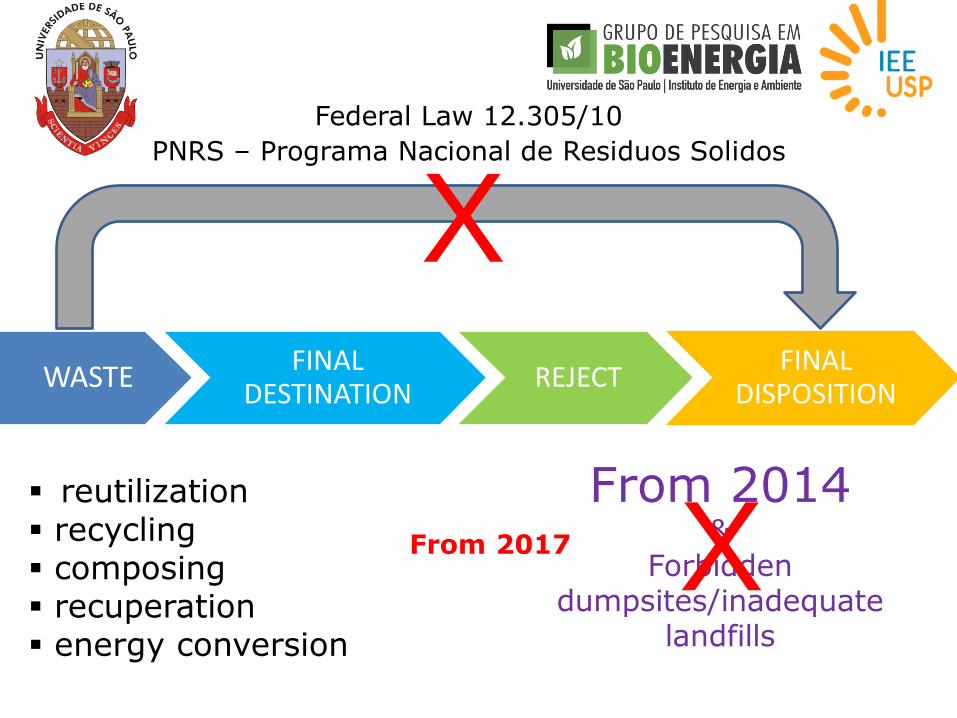
Federal Law 12.305/10
PNRS – Programa Nacional de Residuos Solidos
WASTE FINAL
DESTINATION REJECT
FINAL DISPOSITION
reutilization recycling composing recuperation energy conversion
X
From 2014 &
Forbidden dumpsites/inadequate
landfills
X From 2017


Synergies MSW energy conversion x basic sanitation

Summary
• World energy matrix and MSW
• MSW in Brazil – current situation
• Synergies MSW energy conversion x basic sanitation
• Existing technologies for MSW energy conversion
• Small and medium municipalities and MSW gasification
• Barriers and proposals

Main technology routes for biomass to energy conversion

FRATE, 2011
Main technology routes for MSW to energy conversion

MSW plasma gasification – Morcenx, France – 12 MW
http://www.waste-management-world.com/articles/2014/06/successful-tests-at-struggling-plasma-gasification-waste-to-energy-project-in-france.html http://www.dovetailinc.org/workshop_materials/plasma_gasification_presentation.pdf
Construction work on the facility was completed back in 2012, but commissioning has been delayed due to difficulties in achieving satisfactory performance testing. Start-up 2014
Landfills
Biogas
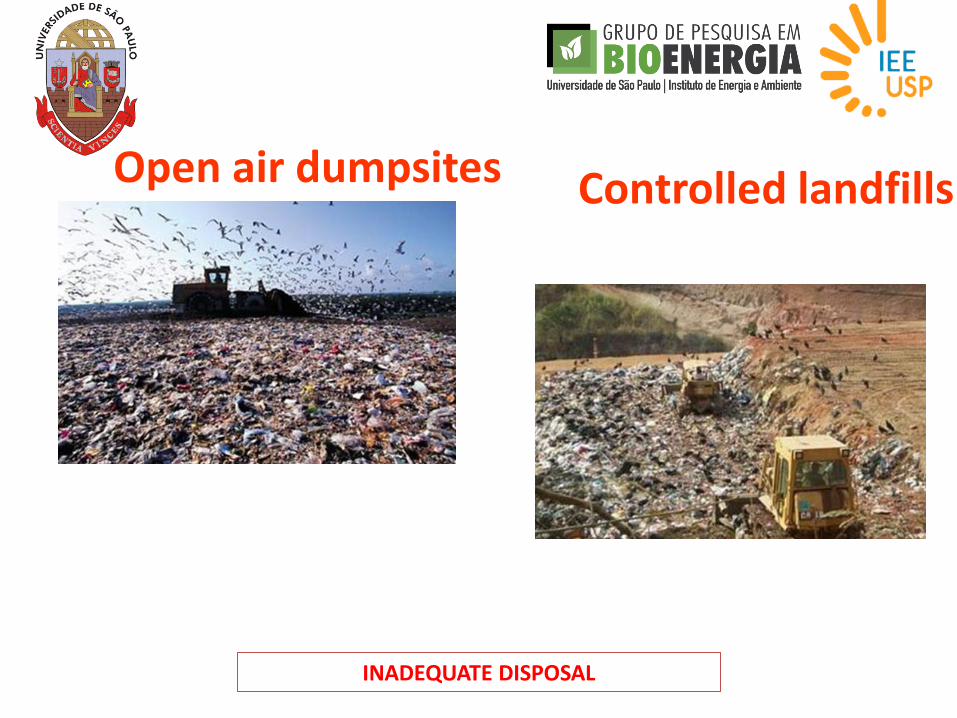
Open air dumpsites Controlled landfills
INADEQUATE DISPOSAL

São Joao Landfill
Bandeirantes Landfill ADEQUATE DISPOSAL

São Paulo State
EMAE, 2010

Sanitary Landfill
Biogas capture and transportation
Biogas burning - flare
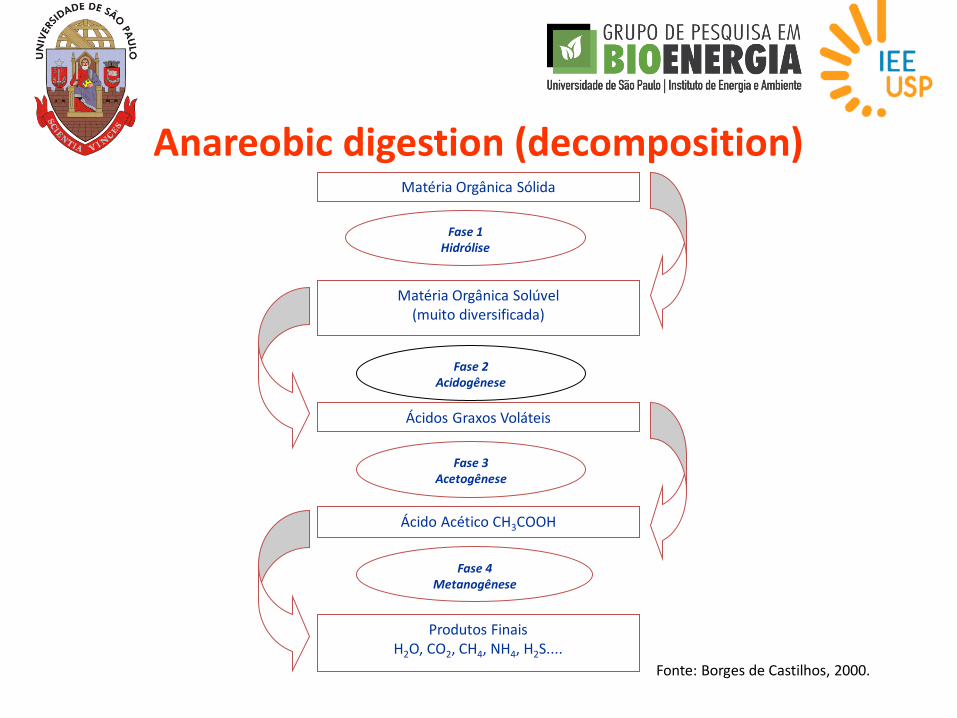
Anareobic digestion (decomposition) Matéria Orgânica Sólida
Matéria Orgânica Solúvel (muito diversificada)
Ácidos Graxos Voláteis
Ácido Acético CH3COOH
Fase 1 Hidrólise
Fase 2 Acidogênese
Fase 3 Acetogênese
Fase 4 Metanogênese
Produtos Finais H2O, CO2, CH4, NH4, H2S....
Fonte: Borges de Castilhos, 2000.

Average composition - biogas
Fonte: WEREKO-BROBBY; HAGEN, 2000
Compound Share
Methane – CH4 50-60%
Carbon dioxide – CO2 35-45%
Hydrogen, Nitrogen, Oxygen,
Ammonia, H2S, CO and others
5%

% Methane X LHV
Fonte: Alves (2000)
LHV (Low heating value: ~ 5,500 kcal/Nm3 (medium LHV))

Biogas production in landfills
Met
han
e p
rod
uct
ion
(m
3 /yea
r)
Year

Otto engines

Microturbines – biogas
Controlador de potência
Microturbina
Entrada de ar
Exaustão
Painel de controle
0-30; 0-60 kW 400-480 VAC/DC
Entrada de combustível

Microturbines – biogas
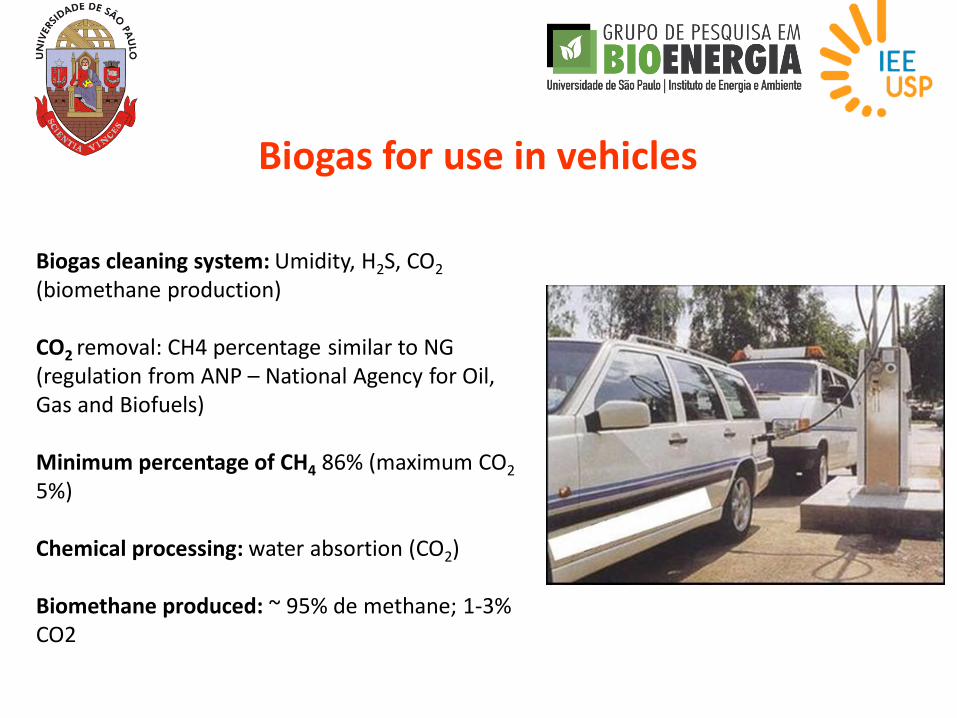
Biogas for use in vehicles
Biogas cleaning system: Umidity, H2S, CO2 (biomethane production)
CO2 removal: CH4 percentage similar to NG (regulation from ANP – National Agency for Oil, Gas and Biofuels) Minimum percentage of CH4 86% (maximum CO2 5%) Chemical processing: water absortion (CO2) Biomethane produced: ~ 95% de methane; 1-3% CO2

Waste – to – energy
Incineration

Fonte: SMA, 2009

Fotos: visita 2014 (Lisboa,Portugal)

EMISSÕES ATMOSFÉRICASRESULTADOS DA MONITORIZAÇÃO EM DESCONTÍNUO 2011
Emissões de Dioxinas e Furanos
0.00
0.01
0.02
0.03
0.04
0.05
0.06
0.07
0.08
0.09
0.10
FF1 FF2 FF3
ng
/Nm
3
Valor limite
Emissões de Cd+Tl
0.00
0.01
0.02
0.03
0.04
0.05
FF1 FF2 FF3
mg
/Nm
3Valor limite
Emissões de Hg
0.00
0.01
0.02
0.03
0.04
0.05
FF1 FF2 FF3
mg
/Nm
3
Valor limite
Emissões de Sb+As+Pb+Cr+Co+Cu+Mn+Ni+V
0.00
0.05
0.10
0.15
0.20
0.25
0.30
0.35
0.40
0.45
0.50
FF1 FF2 FF3
mg
/Nm
3
Valor limite
Legenda:1ºsem 11 2ºsem 11 Visita CENBIO, Junho 2012
Atmospheric emissions - Valorsul (Portugal)

Sweden
http://www.avfallsverige.se/fileadmin/uploads/for
branning_eng.pdf

MSW - Sweden
http://www.avfallsverige.se/fileadmin/uploads/for
branning_eng.pdf
District heating
Electricity

Avfall Sverige – Swedish Waste Management
http://www.avfallsverige.se/fileadmin/uploads/forbranning_eng.pdf
MSW incineration – Sweden Dioxine emissions

Resolution SMA 079/Nov, 2009
Emissions standards for Sao Paulo
(based on European Community standards)
Baseados nos limites em uso na C.E.
Fonte: São Paulo, 2010
Waste to energy - MSW plants BAVARIA/SÃO PAULO JOINT PROJECT
Res. CONAMA 382 (26/12/2006) MP < 730mg/Nm3 , NOx não se aplica

http://ciclovivo.com.br/noticia/sao-bernardo-do-campo-queima-lixo-para-gerar-energia
http://jornalggn.com.br/blog/luisnassif/a-termoeletrica-a-lixo-de-sao-bernardo-do-campo
Incineration plant in São Bernardo do Campo municipality – São Paulo State Start-up 2016
Mechanical Biologic Treatment

Mechanical Biological Treatment

Fermentador
http://www.kuttner.com.br/
Grupo de motogeradores

MBT plants installed in Europe
Características 1991-1995 1996-2000 2001-2005 2006-2010
Plantas inst. 15 44 52 73
Plantas / ano 3 8,8 10,4 14,6
Capacidade
total inst. (t) 194.000 1.117.500 2.077.950 2.246.450
Cap. inst. / ano
(t/ano) 38.800 223.500 415.590 449.290
Cap. média das
plantas (t) 12.933 25.398 39.961 30.773
Fonte: (Adaptado de BAERE; MATTHEEUWS, 2010)

Energy from MSW
Comparison between Solid Waste Energy Recovery
Technologies using Life Cycle Assessment
Objective: a comparative study thought the Life Cycle Assessment (LCA), of power generation from municipal solid waste and sludge of sewage treatment plant, using tree different treatment technologies
Mechanic – Biologic Treatment Landfill Incineration
The study considers Barbarian technology
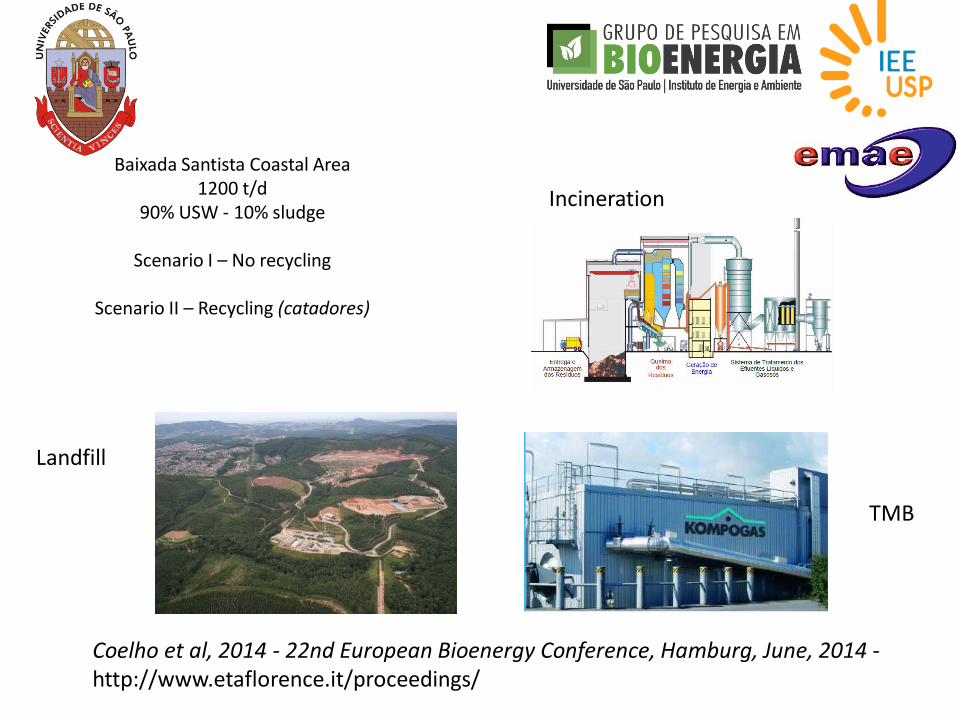
Baixada Santista Coastal Area 1200 t/d
90% USW - 10% sludge
Scenario I – No recycling
Scenario II – Recycling (catadores)
Landfill
TMB
Incineration
Coelho et al, 2014 - 22nd European Bioenergy Conference, Hamburg, June, 2014 - http://www.etaflorence.it/proceedings/

Tabela 1. Composição Gravimétrica do Mix em Base Úmida– Cenário I
Componentes Composição base úmida
Conversão para quantidade
absoluta (t/dia)
Papéis 4,77% 57,24 Papelões 4,14% 49,68 PS (poliestireno) 0,36% 4,32 PP (polipropileno) 0,81% 9,72 PET (politereftalato de etileno) 1,44% 17,28
PEAD (polietileno de alta densidade) 3,78% 45,36 PEBD (polietileno de baixa densidade) 4,68% 56,16 PVC (cloreto de polivinila) 1,98% 23,76 Plástico "filme" e isopor 5,40% 64,8 Embalagens Longa Vida 1,17% 14,04
Borracha 0,27% 3,24 Madeiras e podas 3,69% 44,28 Metais ferrosos 1,17% 14,04 Metais não ferrosos 0,63% 7,56 Vidros 1,26% 15,12 Couro 0,27% 3,24 Trapos 3,15% 37,8 Areias e pedras 2,43% 29,16 Matérias Orgânicas 45,09% 541,08 Fraldas descartáveis 3,51% 42,12 Lodo 10,00% 120
TOTAIS 100 1.200
Fonte: PROEMA, 2011
Tabela 1. Composição Gravimétrica do Mix em Base Úmida – Cenário II
Componentes Composição base úmida
(%)
Conversão para quantidade
absoluta
(t/dia) Papéis 5,76 57,24 Papelões 3,50 34,78 PS (poliestireno) 0,41 4,10 PP (polipropileno) 0,93 9,23 PET (politereftalato de etileno) 0,87 8,64 PEAD (polietileno de alta densidade) 4,11 40,82 PEBD (polietileno de baixa densidade) 5,09 50,54
PVC (cloreto de polivinila) 2,27 22,57 Plástico "filme" e isopor 6,52 64,8 Embalagens Longa Vida 1,34 13,34 Borracha 0,33 3,24 Madeiras e podas 3,35 33,21 Metais ferrosos 0,14 1,40 Metais não ferrosos 0,08 0,76 Vidros 1,06 10,58 Couro 0,33 3,24
Trapos 3,80 37,80 Areias e pedras 2,94 29,16 Matérias Orgânicas 40,85 405,81 Fraldas descartáveis 4,24 42,12 Lodo 12,08 120
TOTAL 100 993,38 Fonte: Elaboração própria

scenario 1 (MW)
438.000 t/year scenario 2 (MW)
375.000 t/year
Landfill 3.9 3.1
Incineration 27.5 24.5
MBT (total*) 9.6 7.5
• Incluindo a geração no aterro apos o TMB: C1- 3 MW ; C2- 2.8 MW
• cenario 1 – sem reciclagem; cenario 2 – reciclagem baseada nas perspectivas de mercado
Energy from MSW
Comparison between Solid Waste Energy Recovery Technologies using Life Cycle Assess

PECORA et al. COMPARAÇÃO DO DESEMPENHO AMBIENTAL DE ALTERNATIVAS PARA A DESTINAÇÃO DE RESÍDUOS SÓLIDOS URBANOS COM APROVEITAMENTO ENERGÉTICO. III Congresso Brasileiro em Gestão do Ciclo de Vida de Produtos e Serviços, Maringá, 2012
COELHO et al, COMPARISON OF MUNICIPAL SOLID WASTE TECHNOLOGIES THROUGH LCA METHODOLOGY AS A TOOL FOR ADEQUATE POLICIES 22nd European Bioenergy Conference, Hamburgo, June 2014.
Comparison of
environmental impacts from
LCA for the three
technologies (landfill,
incineration and MTB),
including the (avoided)
environmental impacts of
the electricity produced by
each one and released to the
national interlinked grid

Summary
• World energy matrix and MSW
• MSW in Brazil – current situation
• Sinergies MSW energy conversion x basic sanitation
• Existing technologies for MSW energy conversion
• Small and medium municipalities and MSW gasification
• Barriers and proposals

Incineration
- High costs
- High O&M costs
- Cleaning of Dioxines
and furanes
- Difficult economic
feasibility
Energy conversion from MSW in
small/medium municipalities

Electricity conversion technologies for MSW
AMOUNT OF USW ELECTRICITY PRODUCTION
POTENTIAL
1200 t/d (large municipalities) 20 MW (incineration)
60 t/d (60 000 people) 1 MW
5 t/d (5 000 people) 75 kW (gasification)
Incineration – > 10 MW Gasification: Fluidized bed > 200 kW Fixed bed < 200 kW

MSW fixed bed gasifiers
• Pre treatment (drying – pelletizing)
• Iinstalled power under 200 kW
• Gas cleaning
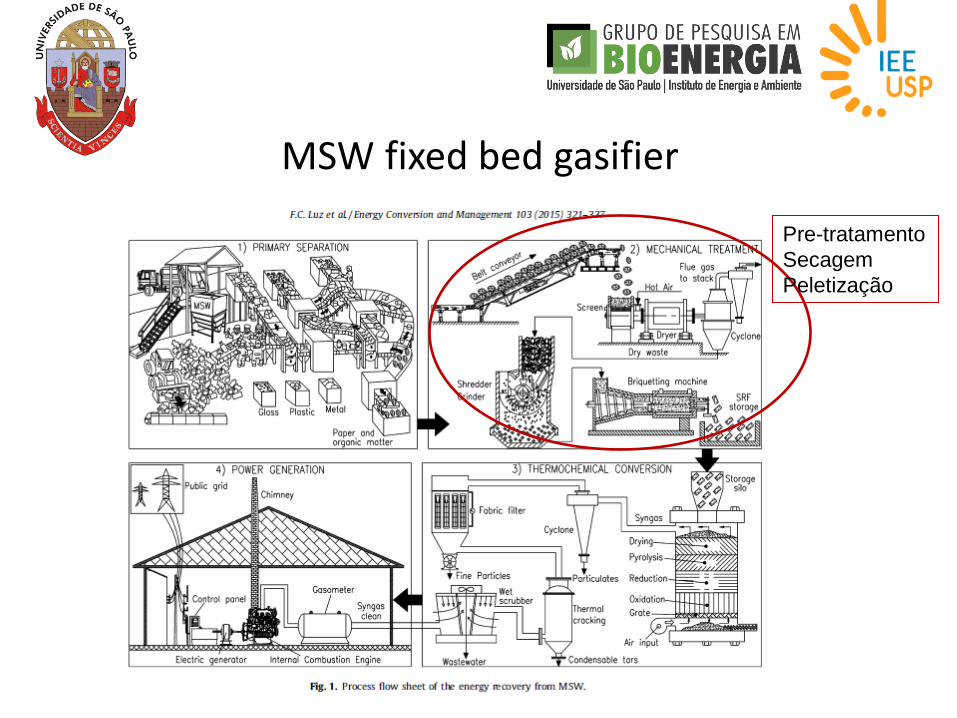
MSW fixed bed gasifier
Pre-tratamento
Secagem
Peletização

Down draft fixed bed gasifier < 200 kW
Economic feasibility is difficult IRR <0

Fluidized bed gasifiers
- MSW transformed into RDF (refuse derived fuel) - From 200 kW and up - Less gas cleaning needs

MSW Gasification Carbogás pilot plant - Maua, Sao Paulo, 2014

Consórcio Intermunicipal do Vale do Paranapanema
FONTE: Google Maps, 2014
Portaria n°256/CG5 2011

RDF – Refuse derived fuel
Source Carbogas 2014. LHV - RDF 4,190 kcal/kg

RDF processing system 207 ton/dia
RDF – flow rate 8626,96 Kg/h
Gasification system – conversion yield 75 %
Energy available for the boiler 36147619 kcal / h
Thermal power - Gcal/h 27,11 Gcal/h
Thermal power - MWth 31,5 MWth
N2 49% 11451,94 Nm³/h
H20 6% 1402,28 Nm³/h
C02 10% 2337,13 Nm³/h
CO 18% 4206,8 Nm³/h
H2 14% 3272,0 Nm³/h
CH4 3% 701,14 Nm³/h
FONTE: Infiesta/ Carbogas 2014. LHV - gas 1160 kcal/Nm³
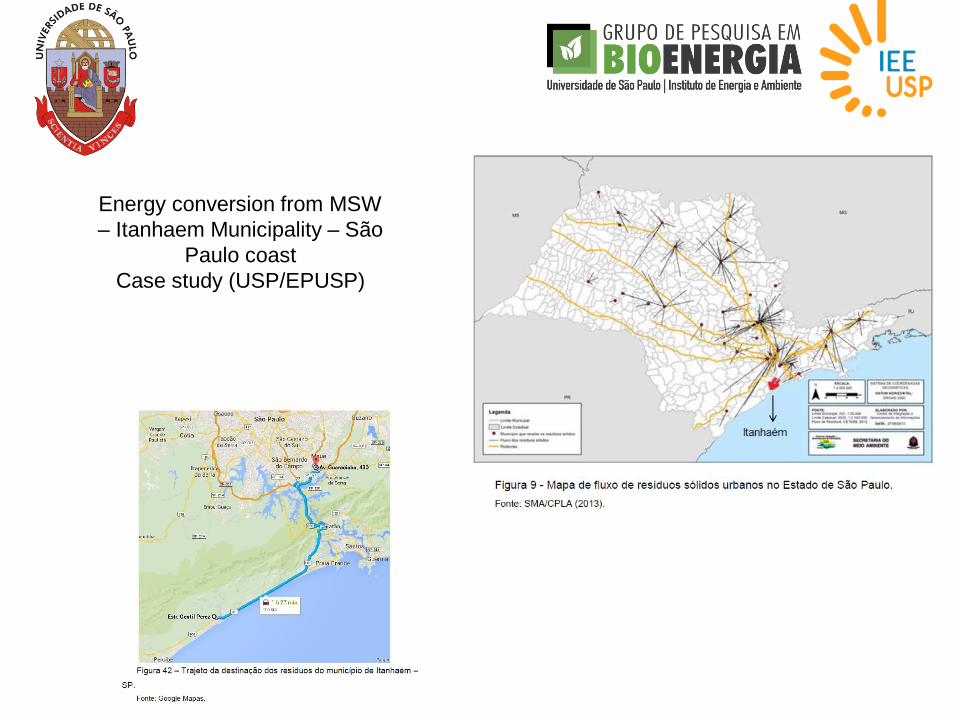
Energy conversion from MSW
– Itanhaem Municipality – São
Paulo coast
Case study (USP/EPUSP)

Summary
• World energy matrix and MSW
• MSW in Brazil – current situation
• Sinergies MSW energy conversion x basic sanitation
• Existing technologies for MSW energy conversion
• Small and medium municipalities and MSW gasification
• Barriers and proposals
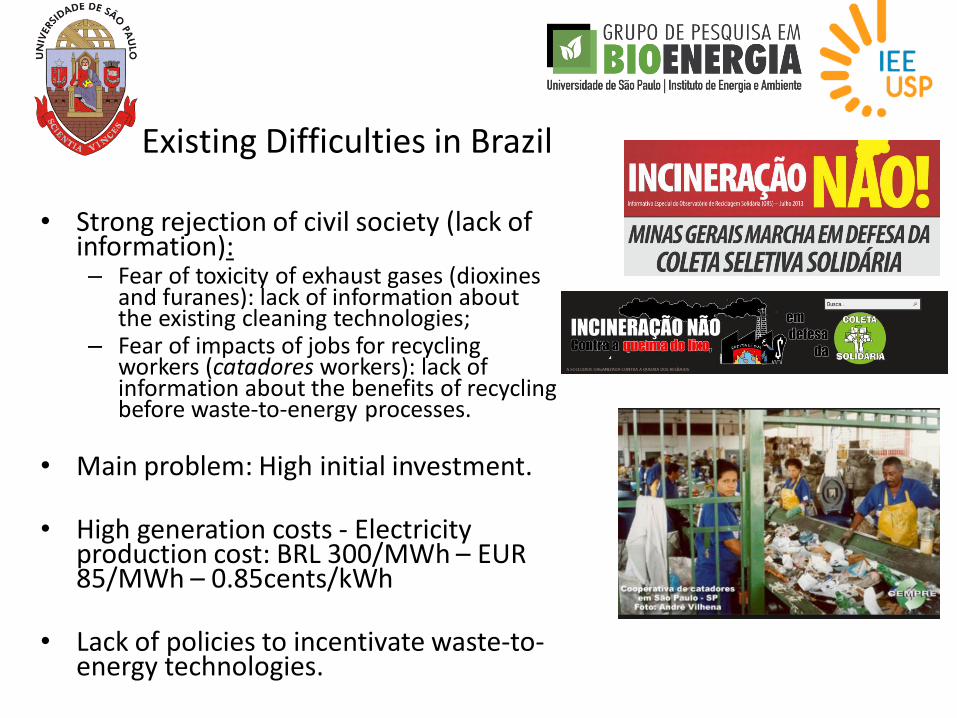
• Strong rejection of civil society (lack of information): – Fear of toxicity of exhaust gases (dioxines
and furanes): lack of information about the existing cleaning technologies;
– Fear of impacts of jobs for recycling workers (catadores workers): lack of information about the benefits of recycling before waste-to-energy processes.
• Main problem: High initial investment. • High generation costs - Electricity
production cost: BRL 300/MWh – EUR 85/MWh – 0.85cents/kWh
• Lack of policies to incentivate waste-to-
energy technologies.
Existing Difficulties in Brazil

Waste to energy
Fonte: EMAE, 2010

Fonte: EMAE, 2010
Waste to energy - MSW plants BAVARIA/SÃO PAULO JOINT PROJECT
Electricity production cost: BRL 300/MWh – EUR 85/MWh – 0.85cents/kWh

Ano € / Mg RSU
1998 * 23,59 €
1998 23,36 €
1999 23,06 €
2000 22,08 €
2001 22,60 €
2002 23,04 €
2003 23,83 €
2004 24,51 €
2005 20,59 €
2006 22,07 €
2007 21,97 €
2008 22,86 €
2009 22,86 €
2010 22,86 €
2011 20,97 €
2012 19,89 €
Tarifa cobrada aos clientes municipais (Lisboa e municipios do entorno) na descarga de resíduos indiferenciados.

Policy proposals
- Basic sanitation coupled to energy conversion with special tariffs for electricity produced:
- MSW
- Sewage
- Rural residues
- Special credit lines and policies for energy commercialization
- Development of joint demonstration projects
-Capacity building (universities and municipalities, mainly small municipalities)
- Others ??

Source: Observatorio do Clima https://s3-sa-east-
1.amazonaws.com/seeg.tracersoft.com.br/wp-
content/uploads/2015/08/sintese_2015.pdf
Thermoelectric power plants –
“emergence” (?)


Further information http://issuu.com/jornalbiomassabr/docs/jornal_biomassa_br_ed_15__low

Systhesis gas based-steam cycle
Energia de Entrada na Caldeira 113431228,4 kJ/h
Entalpia Agua de Entrada na
Caldeira - 42 bar (105°C) 440,1 kJ/kg
Entalpia Vapor de Saída na
Caldeira - 42 bar (420°C) 3255,80 kJ/kg
Rendimento + Temperatura
Gases de Exaustão 87%
Geração de Vapor 35048 kg/h
Dado - Consumo de Vapor na
Turbina 21501 kg/h
Dado - Geração de Energia
Elétrica na Turbina 2 unid. 5000 kW
Geração de Energia Elétrica
Real 8150 kW
Consumo da Própria Planta 1450 kW
Energia Exportável 6700 kW
FONTE: Texas / Mitre 2015.

Gaseificador
tipo down -
draft

Fonte: Elaborado a partir de PNSB (2008); EPA (2011): Kohler (2010)
260 mil t/day 1.4 kg/ hab /day


IQR (Index for residue quality) - from 4.0 in 1997, to 8.4 in 2010 (CETESB, 2010).

Technologies for energy conversion
Tecnologias de Conversão Energética
Biogás
Flare
Captação do Biogás
Energia Elétrica
Motor Ciclo Otto Microturbina
Energia Térmica
Ciclo a Vapor Tratamento de Chorume
Uso Veicular Uso nas redes de GN
Iluminação a Gás
under
development
– new
materials

Biomethane injection in NG pipelines in Brazil
• ANP – Biomethane only from agricultural/wood/animal sources • ANP - not allowed biomethane from landfills and sewage
treatment stations to be injected in NG pipelines (siloxanes – from cosmetic and personnal products – tooth paste, shaving cream,..)
• Need to discuss adequate limits for siloxanes...

MSW in Brazil
• Need for 448 new landfills
• 256 large landfills
• 192 small scale
• R$ 2 billion needed
• Where?
Source: ABLP (Assoc.
Bras. de Resíduos Sólidos e Limpeza Urbana)

http://fatosedados.blogspetrobras.com.br/2013/06/07/reduc-recebera-biogas-gerado-no-aterro-de-gramacho/
2016 – use of biomethane from Gramacho landfill for Petrobras refinery