![Weld Metal Solidification-2-Microstructure Within Grains[1]](https://static.fdocuments.us/doc/165x107/55157aa24a7959f1028b5208/weld-metal-solidification-2-microstructure-within-grains1.jpg)
Three Dimensional Modeling Weld Solidification Cracks
10
Three dimensional modeling weld solidification cracks in multipass welding Z.B. Dong a, * , Y.H. Wei b a State Key Labor atory of Advanc ed Weldi ng Techno logy Production , Harbi n Insti tute of Techno logy, Harbin 150001, China b Department of Material Science and Technology, Nanjing University of Aeronautics and Astronautics, Nanjing 210016, China Available online 24 August 2006 Abstract This paper utilizes element birth and death finite element technique to control the process of filling metal step by step during multipas s weldi ng proce ss. The dynami c thermal distr ibutions and strai n evolut ions are simulated in 10 mm SUS310 stainless steel in multipass welding after taking into consideration of the fluid flow in the weld pool, the latent heat, taking into account the effect of the deformation in weld pool, change of initial temperature and solidification shrink- age. At the same time, the driving forces to weld solidification cracks of each weld pass are obtained successfully according to simulated thermal cycle (temperature against time) and mechanical strain cycle (mechanical strain against time). The results show the patterns of distribution of the driving force are similar to those of surface fusion welding. The driving force of first weld pass is larger than following weld passes and the driving force decreases gradually in company with weld- ing processing. Sequent welding processes affect the mechanical strain distributions of previous weld pass, of which the tensile mechanical strain changes to compressive strain. In addition, the driving forces are analyzed and weld solidification cracks are predicted during multipass welding. The predicted results agree well with the experiments. Therefore, the sim- ulated results in this study provide the foundation for predicting weld solidification cracking in actual weldment. Ó 2006 Elsevier Ltd. All rights reserved. 1. Introduction Thick plates are widely not only used to joint actual welding structures in industry but also are normal ly accompanie d by the additio n of filler mate- ri al as new weld pass es e. g. Manual Metal Ar c (MMA) welding, Metal-Inert Gas (MIG) welding, Subme rged Arc weldin g. Multipass welding process is often used with taking into consideration of the limitation of fusion width and fusion depth of single pas s wel ding pr oces s betwe en the joins of thick plat es. However, this makes it difficult to model the multipass welding with Finite Element Method (FEM). Due to the intense concentration of heat in the heat source of welding, the regions near the weld line undergo severe thermal cycles, thereby maybe gene rati ng weld sol idi fica tion cra cks in the weld - ment. Therefore, predicting three dimensional weld solidi ficat ion cr acks ha ve been a major topi c in wel d- ing a variety of engineering alloys. 0167-8442/$ - see front matter Ó 2006 Elsevier Ltd. All rights reserved. doi:10.1016/j.tafmec.2006.07.007 * Corresponding author. Tel./fax: +86 451 86417650. E-mail address: [email protected] (Z.B. Dong). Theoretical and Applied Fracture Mechanics 46 (2006) 156–165 www.elsevier.com/locate/tafmec
-
Upload
debabrata-podder -
Category
Documents
-
view
221 -
download
0
Transcript of Three Dimensional Modeling Weld Solidification Cracks
8/6/2019 Three Dimensional Modeling Weld Solidification Cracks
http://slidepdf.com/reader/full/three-dimensional-modeling-weld-solidification-cracks 1/10
Three dimensional modeling weld solidification cracksin multipass welding
Z.B. Dong a,*, Y.H. Wei b
a State Key Laboratory of Advanced Welding Technology Production, Harbin Institute of Technology,
Harbin 150001, Chinab Department of Material Science and Technology, Nanjing University of Aeronautics and Astronautics,
Nanjing 210016, China
Available online 24 August 2006
Abstract
This paper utilizes element birth and death finite element technique to control the process of filling metal step by stepduring multipass welding process. The dynamic thermal distributions and strain evolutions are simulated in 10 mmSUS310 stainless steel in multipass welding after taking into consideration of the fluid flow in the weld pool, the latentheat, taking into account the effect of the deformation in weld pool, change of initial temperature and solidification shrink-age. At the same time, the driving forces to weld solidification cracks of each weld pass are obtained successfully accordingto simulated thermal cycle (temperature against time) and mechanical strain cycle (mechanical strain against time). The
results show the patterns of distribution of the driving force are similar to those of surface fusion welding. The drivingforce of first weld pass is larger than following weld passes and the driving force decreases gradually in company with weld-ing processing. Sequent welding processes affect the mechanical strain distributions of previous weld pass, of which thetensile mechanical strain changes to compressive strain. In addition, the driving forces are analyzed and weld solidificationcracks are predicted during multipass welding. The predicted results agree well with the experiments. Therefore, the sim-ulated results in this study provide the foundation for predicting weld solidification cracking in actual weldment.Ó 2006 Elsevier Ltd. All rights reserved.
1. Introduction
Thick plates are widely not only used to jointactual welding structures in industry but also arenormally accompanied by the addition of filler mate-rial as new weld passes e.g. Manual Metal Arc(MMA) welding, Metal-Inert Gas (MIG) welding,Submerged Arc welding. Multipass welding process
is often used with taking into consideration of thelimitation of fusion width and fusion depth of single
pass welding process between the joins of thickplates. However, this makes it difficult to modelthe multipass welding with Finite Element Method(FEM). Due to the intense concentration of heat inthe heat source of welding, the regions near the weldline undergo severe thermal cycles, thereby maybegenerating weld solidification cracks in the weld-ment. Therefore, predicting three dimensional weldsolidification cracks have been a major topic in weld-ing a variety of engineering alloys.
0167-8442/$ - see front matter Ó 2006 Elsevier Ltd. All rights reserved.
doi:10.1016/j.tafmec.2006.07.007
* Corresponding author. Tel./fax: +86 451 86417650.E-mail address: [email protected] (Z.B. Dong).
Theoretical and Applied Fracture Mechanics 46 (2006) 156–165
www.elsevier.com/locate/tafmec
8/6/2019 Three Dimensional Modeling Weld Solidification Cracks
http://slidepdf.com/reader/full/three-dimensional-modeling-weld-solidification-cracks 2/10
Full three dimensional simulation of fusionwelding process, for the purpose predicting residualstresses, is now feasible and practical, given recentdevelopments in computing capabilities. Manyresearchers have studied the thermal distributions
and residual stresses in multipass welding. Predictedin [1] are the residual stresses during multipass arcwelding in steel pipes using finite element techniquesand discussed the effects of pipe diameter and wallthickness on weld residual stresses. Adaptive meshrefinements [2] are used for a procedure to transportthe results between the different meshes. Thethermo-mechanical model used as well as the simu-lation methodology was detailed. Computed distor-tions and residual stresses were compared withexperimental measurements. Multipass circumferen-tial butt-welding is simulated [3] for stainless steel
pipes in a non-linear thermo-mechanical FE-analy-sis. In particular, the axial and hoop stresses andtheir sensitivity to variation in weld parameters werestudied. Described in [4–10] is a combined analyticaland experimental method for analyzing the residualstresses in a pipe formed with a girth-butt weld.
For the studying of weld solidification cracking,an analysis was performed [11,12] for a bead-on-plate weld for an aluminum plate and evaluatedthe mechanical strain near the weld pool. Hot-crack-ing was studied [13] for a butt-welded aluminum
plate. They assumed that the large solidificationshrinkage was compensated by refeeding from themelt until a critical strain of 2% was reached. Thisvalue was obtained by fitting simulations with exper-iments. A good agreement was obtained betweencomputed and measured locations of cracks nearthe edge of the plate. A detailed analysis was made[14] for the weld pool region as a preparation forcrack analysis observing that the computed strainswere sensitive to the high temperature properties.However, the weld metal solidification crack in mul-tipass welding was rarely studied and simulatedowing to the complex procedures involved with thesimulation, especially to structure weldments.
On the basis of simulating the single pass welding[15–17], the present investigation utilizes elementbirth and death finite element technique to controlthe process of filling metal step by step during multi-pass welding process. At the same time, the dynamicthermal distributions and strain evolutions are ana-lyzed in 10 mm plate-butt SUS310 stainless steel inmultipass welding with FEM. The driving forces toweld solidification cracks of each pass weld are
obtained successfully according to simulated ther-
mal cycle and mechanical strain cycle. The compar-ison between the calculated driving force and thematerial resistance predict the weld metal solidifica-tion cracking. Therefore, the simulated results in thisstudy provide the foundation for predicting weld
solidification cracking in actual weldment.
2. Computational model
2.1. Analysis procedure
For the model under consideration, the internalheating due to the plastic dissipation can beneglected considering the small transformation ratesgenerated by a welding operation. Therefore, anuncoupled thermal and thermo-mechanical analysisis adopted in this calculation. The thermal analysis
is performed first and the transient temperature his-tory obtained from heat transfer analysis is used asthe thermal loads for subsequent thermo-mechani-cal analysis. In the simulated results, the total strainis composed of thermal strain, elastic strain andplastic strain. The mechanical strain is obtained byelastic strain plus plastic strain.
This paper utilizes the double ellipsoidal heatsource proposed in [18] to analyze three dimensionalFE model. The process of filling metal can be trea-ted in commercial FE-codes MSC.Marc by compil-
ing specially defined user subroutines to activatenew elements in the model through so-called ‘‘ele-ment birth and death’’ finite element technique dur-ing multipass welding process.
2.2. Analysis of butt weld joint
Multiple passes are used to produce the weldbead layers in a butt weld joint. The numerical anal-ysis has multiple heat input steps to reflect the mul-tipass process. Fig. 1 shows the finite element meshof multipass welding.
Two plates of size 100 · 50 · 10 mm which wouldform a single Y -groove joint are used to simulate themultipass welding. Only one plate is discretized witheight-node isoparametric hexahedron elements dueto the symmetry along the weld center line.
Two plates to be welded are tacked together atboth ends before welding with a uniform gap of 2 mm between the plates, as it is used in industrialfabrication. The typical thermal–mechanical prop-erties of the material used are given in literature[15]. This paper takes into account the effect of the
latent heat and the fluid flow in the weld pool in
Z.B. Dong, Y.H. Wei / Theoretical and Applied Fracture Mechanics 46 (2006) 156–165 157

8/6/2019 Three Dimensional Modeling Weld Solidification Cracks
http://slidepdf.com/reader/full/three-dimensional-modeling-weld-solidification-cracks 3/10
thermal analysis and the deformation in weld pool,change of initial temperature for thermal stress/strain calculation and solidification shrinkage areconsidered in the mechanical model. These methodscan be seen in literature [15]. The overall fillingwelds are divided into three passes and the fillingmaterials are the same as the base metal.
In the heat transfer process, heat is lost from thesurfaces in the form of convection and radiation.They occur on all surfaces of the plate except theplane of symmetry, which is defined as adiabatic.In the mechanical model, all nodes on symmetricalsurface are fixed y-displacement. The other mechan-ical boundary conditions are applied to avoid therigid body movements of the plate.
The different sets of welding parameters are adop-ted during multipass welding as shown in Table 1.
3. Results and discussion
3.1. Thermal distributions during multipass welding
After deposition of each weld pass, the model
was allowed to cool down until the maximum tem-
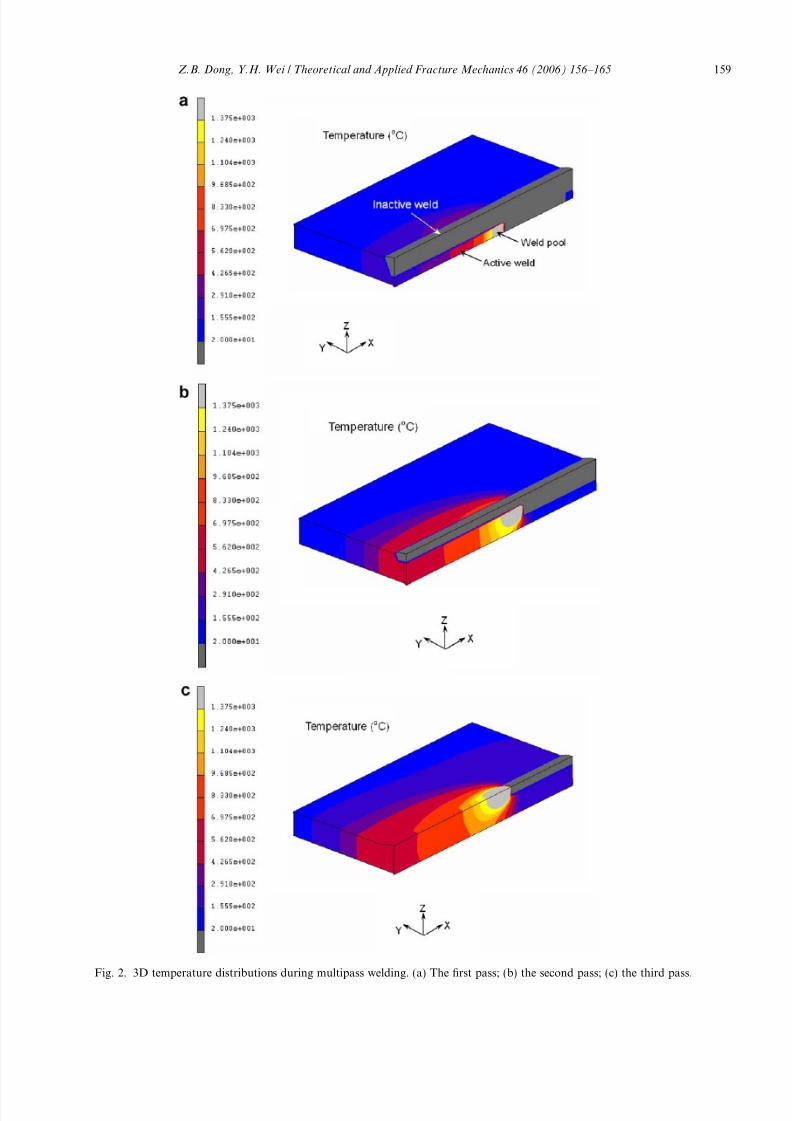
perature at any position along the deposited beadreached the specified inter-pass temperature foreach pass. Fig. 2 depicts the three-dimensional ther-mal distributions of different passes welding.
From Fig. 2, it can be seen that the temperature
in front of the weld molten pool is zero since the fill-ing metals are not activated. Whereas, the thermaldistributions at the back of weld molten pool areproper as well as actual welding since the activatedweld metals take part in simulating.
The thermal cycles of seven positions summa-rized in Table 2 in the model are shown inFig. 3.
It can be seen that different point has differenttime to reach the peak temperature. The time of point a, b, c, d , e and f is 30 s, 390 s, 750 s and after750 s.
Knowledge of average maximum temperaturerises will be useful in the estimation of maximumtemperatures attained by different regions of thebase plate during multipass welding. Likely changesin the microstructure and consequent degradationin mechanical properties can be estimated from thisinformation [19].
For any weld pass, the lowest and highest tem-peratures (in Fig. 3) seen by a point of simulationcan be found from the simulated results. The differ-ence (A–A 0) between these two values will give the
maximum temperature rise attained at the point of measurement during that pass. The average valueof these two maximum temperature rises will givethe average maximum temperature rise at thereferred measurement point. Similar average maxi-mum temperature rise values can be obtained forother simulated points also.
In Fig. 4, the average maximum temperature riseobtained as explained above, is plotted against dis-tance from the weld pad centre line. A similar curveis drawn in the same figure that corresponds to thefirst pass weld of the same plate.
From these curves, it can be seen that the averagemaximum temperature rise uniformly varies withdistance from the weld pad centre line. The averagemaximum temperature rise expected at any otherpoint lying between them can be read directly fromthese curves. It can be also seen that the heat energyinput for the three passes are different, as seen fromTable 1. These are 0.75 kJ/mm for pass No. 1 and1.44 kJ/mm for pass No. 2 and 2.4 kJ/mm for passNo. 3. It can be observed that for any other heatinput value between these two values, the corre-
sponding curve can be drawn by interpolation,
Fig. 1. The mesh used for multipass welding. (a) 3D mesh usedfor calculation and (b) cross-section of mesh.
Table 1Welding parameters during multipass welding
Passnumber
Weldingvoltage (V)
Weldingcurrent (A)
Speed(mm/s)
1 20 60 1.62 24 120 23 24 160 1.6
158 Z.B. Dong, Y.H. Wei / Theoretical and Applied Fracture Mechanics 46 (2006) 156–165
8/6/2019 Three Dimensional Modeling Weld Solidification Cracks
http://slidepdf.com/reader/full/three-dimensional-modeling-weld-solidification-cracks 4/10
Fig. 2. 3D temperature distributions during multipass welding. (a) The first pass; (b) the second pass; (c) the third pass.
Z.B. Dong, Y.H. Wei / Theoretical and Applied Fracture Mechanics 46 (2006) 156–165 159

8/6/2019 Three Dimensional Modeling Weld Solidification Cracks
http://slidepdf.com/reader/full/three-dimensional-modeling-weld-solidification-cracks 5/10
and the average maximum temperature rise valuecan be obtained.
3.2. Strain distributions and the driving force
during multipass welding
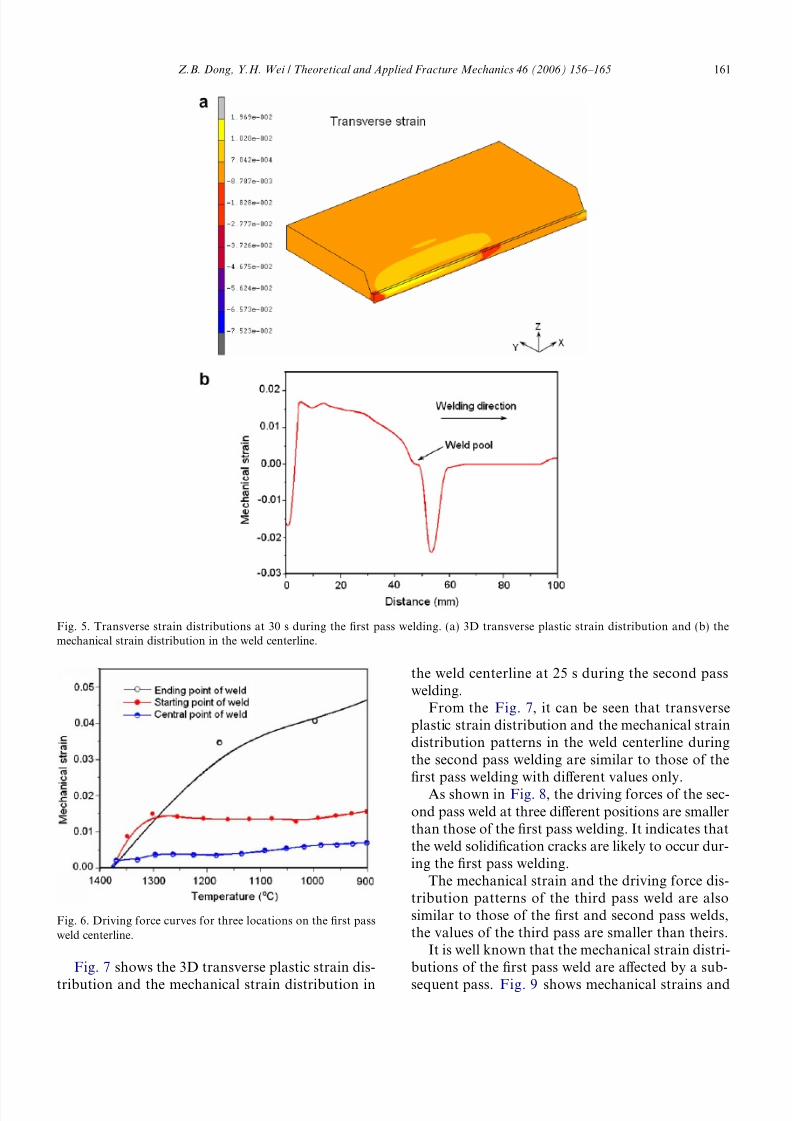
Fig. 5 presents the 3D transverse plastic straindistribution and the mechanical strain distributionin the weld centerline at 30 s during the first passwelding.
As shown in Fig. 5, the mechanical strain (thesum of the elastic and plastic strain) along the weldcentre line is compressive before the welding torch
approaches it. In the welding pool, the points
restore to its original strain free state at the instantof transforming from solid to liquid. Moreover, thetensile mechanical strain develops at the trailingedge of fusion weld pool due to the resolidified weldmetal. At the same time, this point situated in the
brittle temperature range, which the strength andductility of the metal are very low during solidifica-tion. Therefore solidification cracking occurs easilyin the brittle temperature range.
The driving forces are obtained according to sim-ulated thermal cycles (temperature against time)and mechanical strain cycles (mechanical strainagainst time). The evolution of the driving force toweld solidification cracks at different positions of the first pass weld is demonstrated in Fig. 6.
The mechanical strain curve for a particularpoint is plotted by monitoring both the temperaturedrop and the build-up of the mechanical strain asthat point is cooling down from the liquidus. Thecurve indicates how the driving force for solidifica-tion cracking varies during the solidification pro-cess. Fig. 6 suggests that the position at the end of the weld will experience the highest mechanicalstrain, and there is the smallest mechanical strainat the center of weld. The results predicate thatsolidification cracking is more likely to occur atthe start or end of the weld under the conditionsthat the plate is free of restraint, which agrees well
with the general concept.
Table 2The positions where temperature and strain were analyzed
Reference point a b c d e f
Coordinate (x, y, z) (50, 0, 3) (50, 4.05, 6.5) (50, 6, 10) (50, 7.7, 10) (50, 10, 10) (50, 15, 10)
0 100 200 300 400 500 600 700 8000
400
800
1200
1600
2000
2400
T e m p e r a t u r e ( º C )
Time (s)
Point aPoint bPoint c
0 100 200 300 400 500 600 700 8000
200
400
600
800
1000
1200
1400
A'
A
T e m p e r a t u r e ( º C )
Time (s)
Point dPoint ePoint f
Fig. 3. Thermal cycle during multipass welding. (a) The thermalcycle of point a, b, c and (b) the thermal cycle of point d , e, f .
5 10 15 20 25 300
200
400
600
800
1000
T e m p e r a t u r e ( º C )
Distance (mm)
Pass 3
Pass 2
Pass 1
Fig. 4. Average maximum temperature rise at different points onthe base plate.
160 Z.B. Dong, Y.H. Wei / Theoretical and Applied Fracture Mechanics 46 (2006) 156–165
8/6/2019 Three Dimensional Modeling Weld Solidification Cracks
http://slidepdf.com/reader/full/three-dimensional-modeling-weld-solidification-cracks 6/10
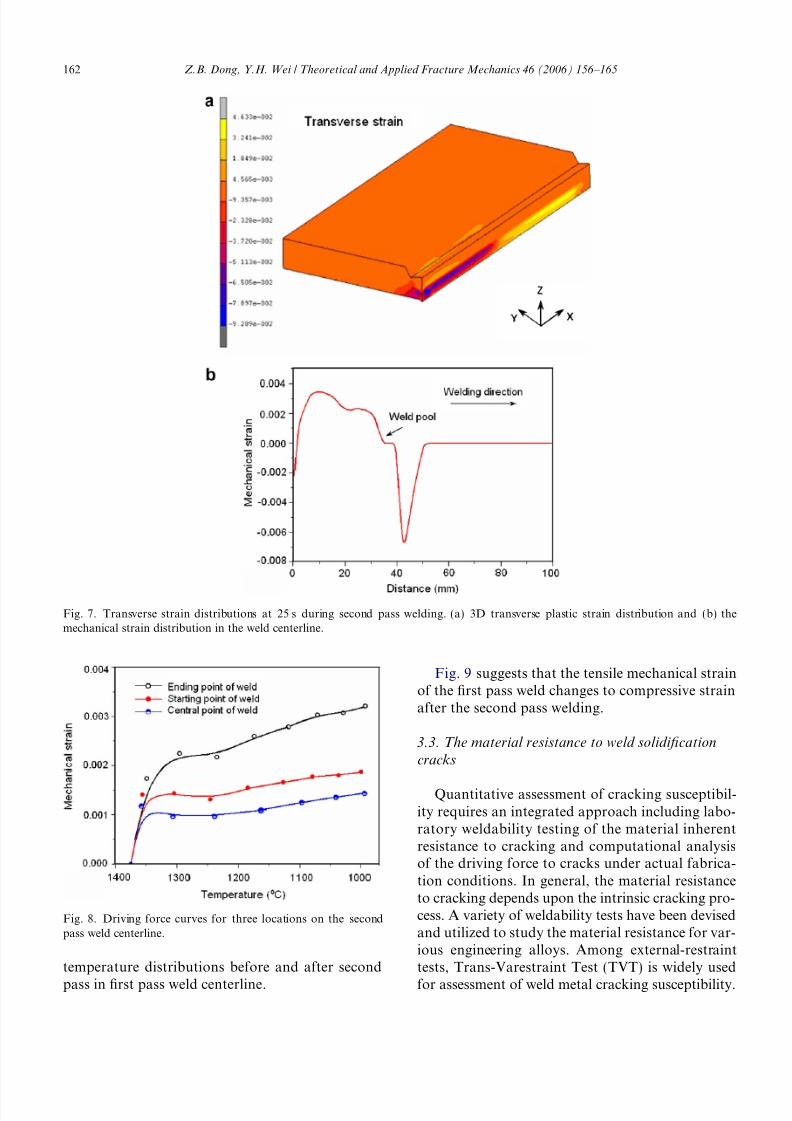
Fig. 7 shows the 3D transverse plastic strain dis-
tribution and the mechanical strain distribution in
the weld centerline at 25 s during the second passwelding.
From the Fig. 7, it can be seen that transverseplastic strain distribution and the mechanical straindistribution patterns in the weld centerline duringthe second pass welding are similar to those of thefirst pass welding with different values only.
As shown in Fig. 8, the driving forces of the sec-ond pass weld at three different positions are smallerthan those of the first pass welding. It indicates thatthe weld solidification cracks are likely to occur dur-ing the first pass welding.
The mechanical strain and the driving force dis-tribution patterns of the third pass weld are alsosimilar to those of the first and second pass welds,the values of the third pass are smaller than theirs.
It is well known that the mechanical strain distri-butions of the first pass weld are affected by a sub-
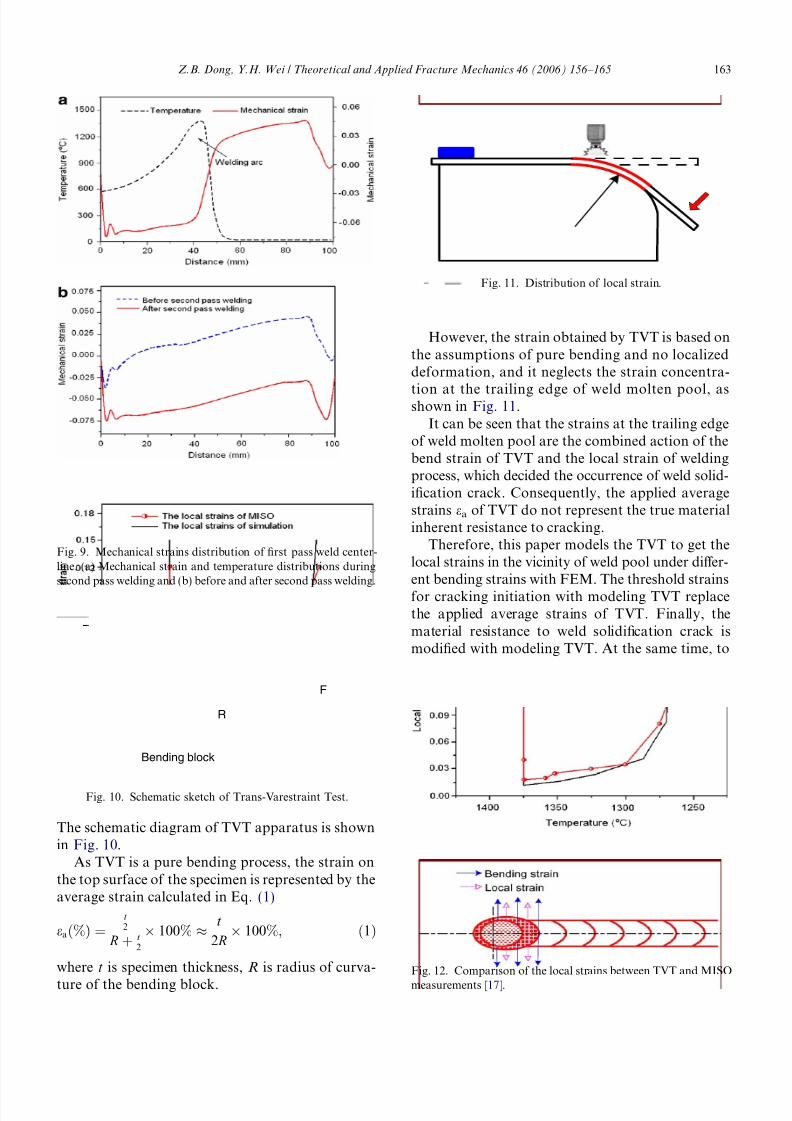
sequent pass. Fig. 9 shows mechanical strains and
Fig. 5. Transverse strain distributions at 30 s during the first pass welding. (a) 3D transverse plastic strain distribution and (b) themechanical strain distribution in the weld centerline.
Fig. 6. Driving force curves for three locations on the first passweld centerline.
Z.B. Dong, Y.H. Wei / Theoretical and Applied Fracture Mechanics 46 (2006) 156–165 161
8/6/2019 Three Dimensional Modeling Weld Solidification Cracks
http://slidepdf.com/reader/full/three-dimensional-modeling-weld-solidification-cracks 7/10
8/6/2019 Three Dimensional Modeling Weld Solidification Cracks
http://slidepdf.com/reader/full/three-dimensional-modeling-weld-solidification-cracks 8/10
The schematic diagram of TVT apparatus is shownin Fig. 10.
As TVT is a pure bending process, the strain onthe top surface of the specimen is represented by theaverage strain calculated in Eq. (1)
eað%Þ ¼t
2
Rþ t
2
 100% %t
2 RÂ 100%; ð1Þ
where t is specimen thickness, R is radius of curva-
ture of the bending block.
However, the strain obtained by TVT is based onthe assumptions of pure bending and no localizeddeformation, and it neglects the strain concentra-
tion at the trailing edge of weld molten pool, asshown in Fig. 11.It can be seen that the strains at the trailing edge
of weld molten pool are the combined action of thebend strain of TVT and the local strain of weldingprocess, which decided the occurrence of weld solid-ification crack. Consequently, the applied averagestrains ea of TVT do not represent the true materialinherent resistance to cracking.
Therefore, this paper models the TVT to get thelocal strains in the vicinity of weld pool under differ-ent bending strains with FEM. The threshold strainsfor cracking initiation with modeling TVT replacethe applied average strains of TVT. Finally, thematerial resistance to weld solidification crack ismodified with modeling TVT. At the same time, to
R
F
Bending block
Fig. 10. Schematic sketch of Trans-Varestraint Test.
Fig. 11. Distribution of local strain.
Fig. 9. Mechanical strains distribution of first pass weld center-line. (a) Mechanical strain and temperature distributions duringsecond pass welding and (b) before and after second pass welding.
Fig. 12. Comparison of the local strains between TVT and MISO
measurements [17].
Z.B. Dong, Y.H. Wei / Theoretical and Applied Fracture Mechanics 46 (2006) 156–165 163

8/6/2019 Three Dimensional Modeling Weld Solidification Cracks
http://slidepdf.com/reader/full/three-dimensional-modeling-weld-solidification-cracks 9/10
testify the computational local threshold strains inthe cracking susceptible temperature range, TVT issimulated at different bending strains. The localstrains are compared with the MISO [20] measure-ment of the local strain curve for solidification
cracks initiation as shown in Fig. 12 [17].It can be observed that the local strains obtainedwith modeling TVT coincide well with those mea-sured by MISO method.
4. Prediction of weld solidification cracks of walled
plates
The formation of weld metal solidification crack-ing results from the competition between the mate-rial resistance to cracking and the driving force to
cracking during the course of solidification of weldmetal, as shown in Fig. 13 [15]. Weld solidificationcracks occur only when the mechanical strainexceeds the threshold strain in the entire brittle tem-perature range.
Therefore, according to the relative position of the curves, the comparisons between the drivingforce of each pass and the material resistance canpredict the weld solidification cracks as shown inFig. 14.
Fig. 14 shows that the driving forces are smallerthan the material resistance of simulating TVT, so
there will not be solidification crack during multi-pass welding. The predicted result agrees well withthe experiments in the same welding conditionsand boundary conditions.
5. Conclusions
1. The multipass welding process of 10 mm SUS310stainless steel is modeled with finite elementmethod. The thermal cycle and strain cycle of each pass are simulated after taking into consid-eration of the fluid flow in the weld pool, thelatent heat, taking into account the effect of thedeformation in weld pool, change of initial tem-perature and solidification shrinkage.
2. The driving forces to weld solidification cracks of each weld pass are obtained successfully accord-ing to simulated results. It is found that the driv-ing force of first weld pass is larger than followingweld passes. Moreover, sequent welding processesaffect the mechanical strain distributions of previ-ous weld pass, of which the tensile mechanicalstrain changes to compressive strain.
3. Weld metal solidification cracks are predictedduring multipass welding according to the mate-rial resistance and the driving force. The pre-dicted results agree well with experiments.Therefore, the simulated results in this study pro-vide the foundation for predicting weld solidifica-tion cracking in actual weldment.
References
[1] T. Liang Teng, P.H. Chang, A study of residual stresses inmulti-pass girth-butt welded pipes, Int. J. Pres. Ves. Piping74 (1997) 59–70.
[2] P. Duranton, J. Devaus, V. Robin, 3D modelling of multipass welding of a 316L stainless steel pipe, J. Mater.
Proc. Technol. 153 (2004) 457–463.
ε
ΤTs
BTR
Material resistance
Tl
Liquid
Liquidus
Solidus Solid
Driving force
Fig. 13. Schematic explanations for occurrence of weld metal
solidification cracks [15].
Fig. 14. The prediction of weld metal solidification cracks of walled plates.
164 Z.B. Dong, Y.H. Wei / Theoretical and Applied Fracture Mechanics 46 (2006) 156–165

8/6/2019 Three Dimensional Modeling Weld Solidification Cracks
http://slidepdf.com/reader/full/three-dimensional-modeling-weld-solidification-cracks 10/10
[3] B. Brickstad, B.L. Josefson, A parametric study of residualstresses in multi-pass butt-welded stainless steel pipes, Int. J.Pre. Ves. Piping 75 (1998) 11–25.
[4] C.D. Elcoate, R.J. Dennis, P.J. Bouchard, Three dimen-sional multi-pass repair weld simulation, Int. J. Pre. Ves.Piping 82 (2005) 244–257.
[5] P.J. Bouchard, D. George, Measurement of the residualstresses in a stainless steel pipe girth weld containing longand short repairs, Int. J. Pre. Ves. Piping 105 (2004) 81–91.
[6] Y. Shim, Determination of residual stresses in thick-sectionweldments, Weld. J. 71 (1992) 305–312.
[7] S. Murugan, K. Sanjai, B. Rai, P.V. Kumar, Temperaturedistribution and residual stresses due to multipass welding intype 304 stainless steel and low carbon steel weld pads, Int. J.Pre. Ves. Piping 78 (2001) 307–317.
[8] J.R. Cho, B.Y. Lee, Y.H. Moon, Investigation of residualstress and post weld heat treatment of multi-pass welds byfinite element method and experiments, J. Mater. Proc.Technol. 154 (2004) 1690–1695.
[9] A.R. Ortega, Analysis and validation of multi-pass girth in
pipes, in: 8th Int. Conf. of Casting, June 779–786, 998, SanDiego, USA.[10] H.L. Pang, S.R. Pukas, Residual stress measurements in a
Crusi-form welded joint using hole drilling and strain gauges,Strain (2) (1989) 7–14.
[11] Z.L. Feng, T. Zagharia, S.A. David, Thermal stress devel-opment in a nickel based superalloy during weldability test,Weld. J. 76 (1997) 470–483.
[12] Z.L. Feng, C.L. Tsai, A computational analysis of thermaland mechanical conditions for weld metal solidificationcracking, Weld. Res. Abroad 42 (1996) 34–41.
[13] H. Bergmann, R. Hilbinger, Numerical simulation of centreline hot cracks in laser beam welding of aluminium close tothe sheet edge, in: Mathematical Modelling of WeldPhenomena 4, Graz, Austria, 1998.
[14] J. Dike, J. Brooks, J. Krafcik, Finite element modeling andverification of thermal–mechanical behavior in the weld poolregion, in: 4th International Conference on Trends inWelding Research. Gatlinburg, USA, 1995.
[15] Y.H. Wei, Z.B. Dong, Three dimensional numerical simu-lation of weld solidification cracking, Model. Simul. Mater.Sci. 13 (2005) 437–454.
[16] Z.B. Dong, Y.H. Wei, Three dimensional numerical simu-lation of the driving force to solidification cracking, J. Mater.Sci. Technol. 21 (2005) 399–402.
[17] Y.H. Wei, Z.B. Dong, Modeling the trans-varestraint testwith finite element method, Comput. Mater. Sci. 35 (2006)84–91.
[18] J. Goldak, A new finite element model for welding heatsources, Metall. Trans. 15B (1984) 299–305.[19] S. Murugan, P.V. Kumar, B. Raj, Temperature distribution
during multi-pass welding plates, Int. J. Pre. Ves. Piping 75(1998) 891–905.
[20] F. Matsuda, H. Nakagawa, Quantitative evaluation of solidification brittleness of weld metal during solidificationby means of in situ observation and measurement.
Z.B. Dong, Y.H. Wei / Theoretical and Applied Fracture Mechanics 46 (2006) 156–165 165