Solidification de leau. au stylo noir (°C) Solidification de leau.

Synthesis of Weld Solidification Using Crystalline Organic Materials
Because of their transparency, low melting points and suitable crystal structures, carbon tetrabromide and camphene proved to be excellent materials for study by means of 16 mm motion picture film
BY W. F. SAVAGE AND ROBERT J. HRUBEC
ABSTRACT. A program was undertaken to apply crystalline organic compounds to the study of the welding process by taking advantage of the transparency, low melting temperature and suitable body centered cubic (bec) and face centered cubic (fee) crystal structures of this group of organic compounds. The two compounds selected for primary consideration were carbon tetrabromide, with an fee structure, and camphene, with a bec structure. The purity of the camphene restricted its use to qualitative studies of solidification mechanics under conditions of branched growth since planar and cellular substructures could not be obtained. However, the cellular dendritic structure characteristic of this material proved sufficient for qualitative examination.
Observations were made and documented on 16 mm motion picture film of the mechanics of "weld" solidification using camphene. The film shows nucleation, competitive growth, effects of puddle geometry and other phenomena which corresponded favorably with observations of metallic systems.
Results of these experiments led to a quantitative investigation of substructure size, growth rates and thermal gradients. Carbon tetrabromide which is available in sufficient purity to obtain both planar and cellular growth modes was chosen for this study.
A documentation of the thermal field in the liquid weld pool was made in the vicinity of the advancing solid-liquid interface by taking a series of temperature profiles using fine wire thermocouples implanted in the carbon tetrabromide. The temperature profiles were then used to obtain temperature gradients in the liquid
W. F. SAVAGE is director of Welding Research, Rensselaer Polytechnic Institute, Troy, N. Y. and R. J. HRUBEC is research metallurgist, The International Nickel Co., Inc., Suffern, N. Y.
pool. Also, examination of the substructure growth led to the documentation on film of a number of significant findings with regard to cell size and shape, the transition from planar to cellular growth, the formation of "hot cracks" and the propagation of porosity.
First, it was found that the minimum average cell size was influenced by the angle between the weld puddle interface and the welding direction as expected. At the same time, a variation in cell size within a grain depending on the instantaneous difference between the interface angle and the growth angle could be explained in terms of the accelerated growth rate resulting from the puddle shape, the changing thermal gradient and the interfacial energy considerations at the solid-liquid interface.
Second, the transition from planar to cellular growth was shown to occur in much the way other authors have explained on the basis of perturbation theory. Breakdown was shown to occur first at grain boundaries with the resultant formation of hills or ridges along the boundaries. These ridges then developed into the cellular substructure.
Finally, the initiation of "hot cracks" and wormhole porosity was observed and recorded. The formation of "hot cracks" was shown to occur in grain boundaries in the fusion zone of the welds. Propagation of the cracks was predominantly intergranular or intercellular with some short segments of transcellular cracks. The formation of porosity was shown to occur at grain boundary intersections with the solid-liquid interface.
Introduction The study of weld solidification
mechanics involves for the most par t post facto techniques because of the nature of the welding process. The solid-liquid interface produced during solidification of metallic materials has been
studied to a limited extent by means of liquid decanting1, transmission electron microscopy1 and surface growth techniques1 but the opacity of metals makes in-situ observations virtually impossible except at the top surface of the melt. The added restriction imposed by the arc welding processes such as the relatively small size of the weld pool , the glare and intense heat of the welding arc and the rapid solidification rates complicate the application of even the above techniques to the study of weld solidification mechanics. Thus , the interpretation of metallographic features with the aid of the principles of solidification mechanics has served as the principal technique.
Recently, a group of organic compounds which solidify in a crystalline manner much the same as metals has made possible in-situ observations of the solid-liquid interface. The transparency of these materials and their low melting temperatures makes such observations possible. The present investigat ion has adapted several organic compounds to permit direct visual observation of the manner in which weld metal solidifies.
Historical Review The principles of solidification me
chanics have been developed by a number of authors . 1 Tiller, Jackson, Rut te r and Chalmers2 developed a mathematical model of alloy solidification using the concept of "constitutional supercooling". The term constitutional "supercool ing" was applied by Rut ter and Chalmers 3 since the concept explains the supercooling of the liquid in terms
260-s I MAY 19 72

of its varying constitution. Generalizations based upon the study of the solidification of castings correlate the solidification substructure formed during freezing with the extent of constitutional supercooling as controlled by the concentration of solute, the growth rate and the thermal gradient in the liquid.
Rutter and Chalmers3 investigated the effect of growth rate and temperature gradient on cellular substructures and found that an increase in either the growth rate or the temperature gradient produced a decrease in the width of the substructure. Likewise, using a refined experimental apparatus, Tiller and Rutter4 found that the cell size could be related to a parameter, 1/(GR); the cell size increased linearly with 1/(GR).
The effect of solute concentration on substructure morphology has also been studied. The general results show that for fixed conditions of growth rate and thermal gradient, an increase in concentration of solute results in a progressive change in growth structure from planar through cellular, cellular dendritic, col-
ORGANIC COMPOUND
performed by Savage, Lundin and Chase10 and the result of that early study led to this investigation.
The recognition of a solidification substructure in welds has led to increasing interest in studying both the influence of welding parameters on the solidification substructure and the influence of the solidification substructure on the properties of welds. Micro-segregation, the result of solute redistribution during solidification, was shown by Savage, Lundin and Aronson11 to have a significant influence on the properties of tne fusion zone of welds. Both the type ahd severity of this microsegregation was shown to be related to the weld solidification substructure.
Since microsegregation results in a point-to-point variation in the composition of the weld fusion zone, it is logical that those properties which are a function of the composition of a metal vary from point to point. Changes in such properties as melting point, strength, toughness, reactions with the environment and response to subsequent
EPOXY CEMENT PYREX COVER GLASS
COPPER STRIP
Fig. 1—Schematic diagram of specimen cell used to encapsulate organic compound
umnar dendritic and finally to equiaxed dendritic growth.
A group of organic compounds, first used by Jackson5, have since become an increasingly popular media for synthesizing metallic solidification. These compounds release their latent heat of fusion on solidifying while retaining their rotational entropy. Thus, the entropy of melting for these materials is in the same range as that of metals
0H Therefore, these compounds solidify in the crystal structures most commonly found in metals, specifically, the face centered cubic and body centered cubic. Jackson and coworkers5 - 8 have utilized degree as analogs of metallic systems. Recently, Schaefer and Glick-man9 used organic materials to study dendrite initiation during solidification. The first attempt to apply these or-ganics to the study of welding was
heat treatments would be important consequences of microsegregation. Also, since the microsegregation in welds is intimately related to the solidification substructure, both the microscopic and macroscopic factors which control the size and morphology of the solidification substructure will affect the properties of a weld.
The microscopic factors controlling cell size and shape act at the solid-liquid interface and vary with position along the trailing edge of the weld pool. These factors include the solute concentration, growth rate and the temperature gradient in the liquid.
The macroscopic factors of importance are those which control the shape of the weld pool. These include both physical properties of the material, such as thermal diffusivity, melting temperature and the latent' heat of fusion; and process variables, such as welding velocity, arc power, joint geometry and initial plate temperature. In general,
the epitaxially nucleated grains in the fusion zone would tend to grow parallel to the maximum temperature gradient if a preferred dendritic growth direction did not exist. However, in both body centered cubic and face centered cubic materials dendritic growth tends to occur preferentially in the (100) direction. Thus, the cell axes tend to be aligned with the particular easy growth direction with the largest resolved component of the temperature gradient at any instant. Therefore, the shape of the weld pool, which controls the variation in the direction of the temperature gradient from point to point on the trailing edge of the pool has a profound influence on the macroscopic shape of the grains, and consequently on weld properties.
Statement of the Problem While most investigators agree that
the factors which control cell size and morphology are solute concentration, temperature gradient in the liquid and the growth rate, the manner in which these factors interact during the solidification of a weld has been examined only under limited and controlled conditions. Furthermore, the complicating factor of puddle geometry, which influences the rate of change of the growth rate as well as both the magnitude and direction of the temperature gradient, and the fact that the solid-liquid interface is not visible has prevented a satisfactory explanation for the influence of welding conditions on the weld solidification substructure.
The availability of crystalline organic compounds, which permits viewing of the solid-liquid interface, presents the possibility of relating the solidification of a simulated weld to the factors controlling the size and shape of the substructure. This led to a research prog-gram with objectives as set forth in the following section.
Objectives The objectives of this investigation
were to use crystalline organic compounds for the purpose of:
1. Visually demonstrating the solidification mechanics of welding
2. Determining the temperature distribution in the liquid in the vicinity of the solid-liquid interface for various welding conditions
3. Determining how variations in the growth rate and temperature gradient in the liquid affect the size and shape of the cellular substructure.
Materials and Procedure
Materials
Camphene and carbon tetrabromide were the two crystalline organic compounds chosen for this investigation. Camphene has an bec crystal structure
W E L D I N G R E S E A R C H S U P P L E M E N T [ 261-s

Fig. 2—Photograph of specimen cell in position on movable travel carriage
with a melting point of 123.8F. Carbon tetrabromide has a fee crystal structure with a melting point of 194.2F and experiences a solid state phase transformation at 119.3F.
Reagent grade camphene was available commercially; however, the impurity level was sufficiently high to produce branched growth which restricted the use of the camphene to qualitative studies only.
High purity carbon tetrabromide was available in limited quantities and was used for the quantitative portions of the investigation, the impurity content being low enough to achieve both the planar and cellular growth modes. However, solution of atmospheric gases in carbon tetrabromide was sufficient to raise the impurity content during initial preparation of specimens before final refining. This led to observed cracking and rejection of the gases in the form of porosity.
Apparatus
Specimens suitable for weld simulation were prepared by encapsulating the organic compound in a glass cell. Two Y2 in. by 6 in. by 6 mil glass sheets were sealed with epoxy cement leaving a 2 mil gap between them. This cell was then filled with the organic compound and attached with epoxy cement to a 3 in. by 12 in. by 5 mil copper strip having a 34 in. slot. A schematic diagram of a specimen cell is shown in Fig. 1. An actual specimen cell can be seen in Fig. 2.
Specimen cells were positioned on a movable travel carriage as shown in Fig. 3. The travel carriage was attached to a variable speed motor drive allowing continuous variation in travel speed
over the range of 0.24 to 1.63 ipm. A fixed 4 mil diam stainless steel wire hairpin filament resting on the upper glass surface of the specimen cell served as the heat source. Current to the filament was also variable over the range of 0.50 to 0.80 amp providing control of heat input to the specimen. Thus, a simulation of a full penetration GTA weld in thin sheet was achieved in the organic materials. In the interest of brevity, these weld simulations in the organic materials will be referred to as welds throughout the balance of this paper without further qualifications.
Solidification of the welds was documented on both 35 mm still photographs
Table 1—Welding Conditions
Filament current, 0.70 amp ± 0.01 amp Filament voltage, 2.70 volts ± 0.05 volt Travel speed (MC 15), 0.43 ipm ± 0.02 ipm
(MC20), 0.63 ipm ± 0.02 ipm (MC25), 0.80 ipm ± 0.02 ipm
Specimen cell temperature = 72F± 3F
and 16 mm motion pictures through the binocular microscope built into the system as seen in Fig. 3. Figure 4 shows the position of the wire filament and the weld pool through the microscops system at low magnification. Photography was performed at magnifications ranging from 1 to 25 x on the film.
Documentation of Weld Solidification Mechanics
As noted earlier, camphene solidified with a branched or cellular dendritic structure. As a result, it was used only in qualitative studies of weld solidification mechanics.
A complete documentation of epitaxial nucleation, competitive growth and effects of puddle geometry was made using motion pictures and still photographs.
Cell Size Measurements
A series of welds were made in carbon tetrabromide using the conditions shown in Table 1. At each of the indicated travel speeds, 35 mm slides were taken of the solid-liquid interface at the trailing edge of the weld pool. A print of such a slide is shown in Fig. 5.
Before proceeding with the manner in which the data were analyzed, it is helpful to consider the schematic weld pool in Fig. 6. The actual growth rate of cells growing at some angle 4> to the welding direction at a point where the
Fig. 3—Photo of welding apparatus
262-s j MAY 19 72

07--::
Fig. 4—Photo taken through microscope system showing weld pool and heating filament
normal to the solid-liquid interface makes an angle 8 with the welding direction can be calculated by:
0)
Fig. 5—Photo showing solid-liquid interface in a carbon tetrabromide weld (approx. 100X)
* cos (<•/> - 6») where:
R4, = growth rate along cell axes
V = welding travel speed 4> = angle between cell axis and
welding direction 8 = angle between normal to the
solid-liquid interface and welding direction at observation site
Thus, the data from the slides were analyzed in the following manner:
RA =
• " cos(<£-0)
RA = Vcos0 + ~ cos(4>-e)
1. The slides were projected to a magnification of 500 X
2. Tangents to the interface were drawn at points where the normal to the interface made angles of 45, 50, 55 and 60 deg to the welding direction. These angles correspond to the interface angle 8 in Equation 1
3. The width of 5 cells, normal to the cell axes, at each of the angles 8 was measured whenever possible. The aver-cell width W was then calculated
4. The angle between the cell axes and the welding direction was also measured.
This angle corresponds to the growth angle </> in Equation 1
5. At each value of travel speed, the average cell width was plotted as a function of growth angle for each of the four interface angles
6. A least squares polynomial curve-fitting computer program was used to obtain a second order polynomial curve for the data.
Additional documentation of the cellular growth was made using motion pictures. The change in size and shape of the growing cells as solidification proceeded from the fusion line to the weld centerline was recorded at different travel speeds to show the influence of the puddle geometry, growth rate, growth direction and gradient on the cells.
-WELD POOL ISOTHERM
,t+dt
(*-0)v7
WELDING DIRECTION
Fig. 6—Schematic instantaneous weld pool showing growth rate derivation
W E L D I N G R E S E A R C H S U P P L E M E N T I 263-s

• I
•
^ 1
iiii-(
/ Fig.7a—Photomicrograph of epitaxial nucleation from heat affected zone grains in camphene (approx. 75X)
Temperature Gradient Measurements
To measure the temperature gradients in the vicinity of the solid-liquid interface of the welds at the conditions stated in Table 1, one mil chromel-alumel thermocouples were incorporated into the carbon tetrabromide specimen cells. Four or five thermocouples were placed in a specimen cell at Vi in. distances from one another along the length of the specimen cell. The position of the thermocouple junction with respect to the longitudinal center-line of the specimen cell was varied from one thermocouple to another to obtain multiple thermal cycles for one weld pass. The thermocouple output, referenced to an ice-water cold junction, was fed directly to an X-Y recorder. The temperature-time traces were then converted to temperature gradients by converting the time base to distance using the travel speed to eliminate time as a parameter.
The position of the thermocouple junction with respect to the weld center-line was obtained by photographing the weld pool with the thermocouple visible while recording the thermal cycle. A lateral shift of the entire travel carriage assembly in relation to the fixed filament heat source provided a means of obtaining a different set of thermal cycles with each weld pass since the relative position of the thermocouple junctions and the weld centerline changed with each carriage shift.
Temperature gradients in the liquid were obtained for each of the conditions at which cell size measurements were taken. The gradient normal to the interface and gradients in directions ±20 deg from the normal were calculated.
Fig. 7b—Photomicrograph of epitaxial nucleation from a previous pass weld structure in camphene (approx. 25X)
Results and Discussion
Weld Solidification Mechanics
The initial phase of this investigation involved the documentation of various factors associated with the solidification of the weld fusion zone. The two most important factors which affect the properties of the weld fusion zone are the composition and the microstructure. Of these, the factors controlling the micro-structure of the fusion zone were documented using camphene in a film entitled "Weld Solidification Mechanics Using Crystalline Organic Materials".
The microstructure of the weld fusion zone is affected by epitaxial nucleation, competitive growth and the macroscopic shape of the puddle. These factors interact with one another to alter the size and shape of the grains in the fusion zone. Epitaxial nucleation, the con-tigous growth of partially melted grains lying along the fusion boundary, was shown to occur in metallic welds by Savage and Aronson.11 Figure 7a shows this contiguous growth of the weld solidification substructure from existing grains at the weld fusion line in camphene. Epitaxial nucleation of solidification substructure from the existing substructure of a previous weld pass was also observed as shown in Fig. 7b. The growth of cellular dendrites on partially melted dendrites with no change in the dendrite axes indicates a continuation of the same crystallographic orientation across the fusion line. Thus, it can be seen that the size of fusion zone grains would be in part controlled by the grain size of the existing grains in the base material at the fusion boundary.
The process of competitive growth also contributes to the size and shape of grains in the fusion zone of welds. An example of the "crowding out" of a grain whose easy growth direction was less favorably oriented with respect to the temperature gradient than adjacent grains is shown (arrows) in Fig. 8a. Furthermore, the change in the direction of growth within a grain from one easy growth direction to an alternate easy growth direction more favorably aligned with the temperature gradient can be seen (arrows) in Fig. 8b. Thus, the relative orientation of adjacent grains and the direction of the temperature gradient contribute to the extent to which grains grow and to the macroscopic shape of the growing grains.
Finally, since the normal to the weld puddle solid-liquid interface is in the direction of the maximum temperature gradient, the macroscopic shape of the weld puddle also influences the size and shape of fusion zone grains. Generally, the puddle geometry can be described as ranging from circular to elliptical to tear drop.
As the puddle shape changes from circular to tear drop, the solid-liquid interface at the trailing edge of the weld becomes less curved, eventually taking up a flat sided V shape. This results in establishing an invariant orientation of the maximum temperature gradient in contrast to the situation associated with a circular or elliptical pool where the orientation of the maximum gradient changes continuously along the solid-liquid interface from the fusion line to the weld centerline.
Thus, a grain at the fusion line whose easy growth direction is aligned with the
264-s I MAY 19 72

- . . - . •
. „ ^ . : * .
•
•
•
Fig. 8a—Photomicrograph showing "crowding out" of a grain in camphene (approx. 50X)
temperature gradient might grow continuously to the centerline with a teardrop shaped puddle but would probably be crowded out by another grain whose orientation becomes more favorably aligned with the gradient in a circular shaped puddle. These two cases are shown schematically in Fig. 9.
/
Fig. 8b—Photomicrog growth direction of a
Quantitative Measurements of Cell Size, GLand R
The results of the quantitative measurements of cell size, temperature gradient in the liquid and growth rate are presented separately in the following sections followed by a final section presenting the relationships of cell size to temperature gradient and growth rate.
Cell Size Measurement
The average cell width W and the growth angle aS of the cellular substructure in carbon tetrabromide welds were measured for the different values of the travel speed and interface angle given in the Material and Procedure section. At each of these conditions, W was plotted as a function of the parameter (<j> — 8), the deviation of the growth direction from the interface normal (i.e. from the direction of the maximum gradient). The number of data points obtained for each ranged from 17 to 51.
Figure 10 gives a plot of the data for a travel speed of 0.80 ipm and an interface angle of 45 deg. The figure indicates the general variation in W versus (4> — 8) found at all conditions. The average cell width increased with an increase in |(<£ — 8)\; the values of W of W ranging from 0.41 to 0.98 mils. The curve drawn through the data points represents a least squares polynomial fit to the data for a second order equation. Furthermore, the dashed lines on the figure represent one standard error of estimate for the curve.
The minimum values in the plots of W versus (rp — 8) with one exception fell within ±5 deg of f> - ff) = 0. One
condition showed a minimum at —10 deg; however, the lack of data at large negative values of (0 — 8) may have biased the shape of this curve.
As a result of this small deviation in (</> — 8) at the minimum of the curves and the fact that the minimum value of W did not change significantly with the
raph showing change to an alternate easy grain in camphene (approx. 25X)
shift from (4> — 8) = 0 over the range of ± 5 deg, the minimum average cell width WMIN was chosen as the value of W at (4> - 8) = 0. This value W* = e represents the average width of cells growing normal to the solid-liquid interface, i.e. d> = 8, for a given set of welding conditons and interface angle.
FOR TEAR DROP SHAPED WELD PUDDLE
b. FOR ELLIPTICAL SHAPED WELD PUDDLE Fig. 9—Schematic representation illustrating modification of macroscopic growth pattern caused by competitive growth favoring grains with a (100) direction nearly parallel to maximum temperature gradient in weld puddle
W E L D I N G R E S E A R C H S U P P L E M E N T ! 265-s

The value of W+ = e and its error limits for each of the curves is shown in Table 2. These values represent the measured cell size data which will be related to growth rate and temperature gradient in the liquid in the following sections.
Temperature Gradient Measurements
The calculated temperature gradients in the liquid both normal to the solid-liquid interface, Gt^L e>, and at ±20 deg, from the normal, G;.(9±2o°). for each of the conditions at which cell size data were taken are listed in Table 2. The range of gradients over all measured directions was from 1070F.in. to 1760F/in. Since the temperature-distance data obtained for all cases appeared to fall on straight lines for distances as far as 40 to 50 mils from the solid-liquid interface, the temperature gradients were chosen as the slopes of the least squares straight line computed from the temperature-distance data.
Several problems arose in making the measurements of temperature gradients from the photographic data and thermal profiles. The width of the thermocouple junction was found to be approximately 3 % of the weld width, resulting in an uncertainty in the exact position of the thermal trace with respect to the weld centerline. Furthermore, the variation in puddle width from run to run resulted in some variation in puddle geometry with respect to the measured distances used in calculating the temperature gradients. Finally, several of the calculated gradients in Table 2 were arrived at from only one or two available temperature-distance data points plus the melting poi nt of carbon tetrabromide at the solid-liquid interface.
In general, the results of the temperature gradient measurements showed that the gradient normal to the interface, GL ( 8) , was greater than the gradients in directions oriented ±20 deg, on either side of the normal, GL{e ± 20°), in agreement with expected results. Also, with the exception of two points in the data, GL{i) was found to decrease as 8 decreased at a given travel speed. This also agreed with expected results.
Growth Rate Measurements
The actual growth rates of cells at the conditions of travel speed (8 and <f>) studied in this investigation were calculated using Equation 1. The values of R at 4> = 8 and (<p - 8) = ±20 deg, are shown in Table 2. These values ranged from 0.22 ipm to 0.59 ipm. Since the results are strictly geometrical calculations, no discussion is necessary.
Cell Size Vs. Thermal Gradient and Growth Rate
For the general case of an elliptical weld puddle geometry, both the growth
rate and the temperature gradient in the liquid vary from point-to-point along the trailing edge of the solid-liquid interface. As a result, the size of the solidfication substructure at different points along the solid-liquid interface is influenced by changing factors. Over the
portion of the interface considered in this investigation the growth rate variation normal to the interface Re was found to be 4 1 % at each travel speed. On the other hand, the variation in the maximum thermal gradient G Li «j ranged from 7 to 16% over the same portion of
Table 2—Growth Rates and Temperature Gradients at Three
Angle 8
45
50
55
60
45
50
55
60
Angle e
45
50
55
60
45
50
55
60
Angle e
45
50
55
60
45
50
55
60
MC15-
— Tempe G L (8 + 20°)
1500 (°F/ in . )
1420 (°F/ in . )
1490 (°F/ in . )
1390 (°F/ in . )
—Travel Speed 1 - 0.43 Ipm
i rature Grad ien t— GLB
1590 ( °F / in . )
1610 (°F/ in . )
1750 (°F/ in . )
1750 (°F/ in . )
. Average Cell Width Upper Error
L im i t
0.56 (mi l ) 0.63 (mi l ) 0.64 (mi l ) 0.67 (mi l )
W ^ . e
0.52 (mi l ) 0.58 (mi l ) 0.59 (mi l ) 0.61 (mi l )
MC20—Travel Speed =
— Tempera tu re Gradient G L ( 6 + 50°)
1260 (°F/ in . )
1250 (°F/ in . )
1220 ( °F / in . )
1270 (°F/ in . )
GL«
1470 (°F/ in . )
1510 (°F/ in . )
1470 ( °F / in . )
1570 (°F/ in . )
Average Cell Width Upper Error
L im i t
0.56 (mi l ) 0.58 (m i l ) 0.58 (m i l ) 0.69 (mi l )
MC25-
— Tempe G L < 9 + 20°)
1070 (°F/ in . )
1120 (°F/ in . )
1240 (°F/ in . )
1360 (°F/ in . )
*— Averag Upper Error
L im i t
0.49 (mi l ) 0.52 (mi l ) 0.58 (mi l ) 0.57 (m i l )
W 0 _ e
0.51 (mi l ) 0.53 (m i l ) 0.53 (mi l ) 0.62 (mil)
-Trave l Speed
G L ( 8 - 20°)
1390 °(F/ in . )
1600 (°F/ in . )
1600 (°F/ in . )
1760 (°F/ in . )
> Lower Error
L im i t
0.47 (mi l ) 0.52 (m i l 0.53 (m i l ) 0.55 (m i l )
= 0.63 Ipm
: - , Gi,(8 - 20°)
1490 ( °F / in . )
1290 (°F/in.)
1360 ( °F / in . )
1550 (°F/ in . )
. Lower Error
L im i t
0.45 (m i l ) 0.48 (m i l ) 0.47 (mi l ) 0.56 (m i l )
= 0.80 Ipm
rature Grad ien t— G L 0
1410 (°F/in.)
1510 (°F/ in . )
1640 (°F/in.)
— ( °F/ in . )
r- Ct-\ 1 W i r l f h C L/Cl 1 VV IU U l
W i _ 8
0.43 (m i l ) 0.48 (mi l ) 0.52 (m i l ) 0.53 (m i l )
G L ( 8 - 20°)
1290 (°F/ in . )
1380 C/F in . )
Lower Error L im i t
0.38 (mi l ) 0.43 (mi l ) 0.47 (mi l ) 0.48 (m i l )
Travel Speeds
—Growth Rate—-> Re Rcs ± 200)
0.30 0.33 ( i pm) ( i pm) 0.28 0.32 ( i pm) ( i pm) 0.25 0.31
( ipm) ( i pm) 0.22 0.29
( i pm) ( i pm)
—Inverse Cool ing R a t e ^
(Gt.s Re)-1
2.10 X 10-;l
(m in / °F ) 2.22 X 10-s
( m i n / ° F ) 2.28 X 10-s
( m i n / ° F ) 2.60 X IO"3
(m in / °F )
. Growth Rate , Ra Rce ± 20°)
0.45 0.50 ( i pm) ( i pm) 0.41 0.47
( i pm) ( ipm) 0.36 0.45
( i pm) ( i pm) 0.31 0.41
( i pm) ( i pm)
—Inverse Cool ing Rate—.
(GLe Rfl)-1
1.51 X IO-3
(m in / °F ) 1.62 x 10~3
(m in / °F ) 1.89 X 10~3
(m in / °F ) 2.06 X 10"3
(m in / °F )
. Growth Rate , Re R(8±2o°)
0.57 0.63 ( i pm) ( ipm) 0.51 0.59
( i pm) ( i pm) 0.46 0.56
( i pm) ( ipm) 0.40 0.52 ( ipm) ( i pm)
—Inverse Cool ing Rate—,
(G L 6 Re)"1
1.24 X IO"3
( m i n / ° F ) 1.30 X 10~3
( m i n / ° F ) 1.33 X IO"3
(m in / °F ) 1.82 X 10--'
( m i n / ° F )
266-s [ M A Y 1 9 7 2

0.80
i r AVERAGE CELL WIDTH vs
GROWTH ORIENTATION 0=45°
TRAVEL SPEED = 0 . 8 0 ^
- 2 0 ° -10° 0° (<D-<8>) (DEGREES)
Fig. 10—Average cell width versus growth orientation at an interface angle of 45 deg and a travel speed of 0.80 ipm
0.7
0.6
_i
II
•e-£ 0.5
0.4
0.20
MINIMUM AVERAGE CELL WIDTH
vs GROWTH RATE • 0.43 in/min A 0.63 in/min • 0.80 in/min
0.30 0.40 Re (in/min)
Fig. 11—Minimum average cell width versus Re
0.50 0.60
W E L D I N G R E S E A R C H S U P P L E M E N T I 267-s
0.7
0 . 6 -ifi _l
I I
0.5
0.4
MINIMUM AVERAGE CELL WIDTH
vs / GRADIENTx GROWTH RATE
• 0.43 in/min A 0.63 in/min • 0 8 0 in/min
1.20 1.60 2.0 2.40
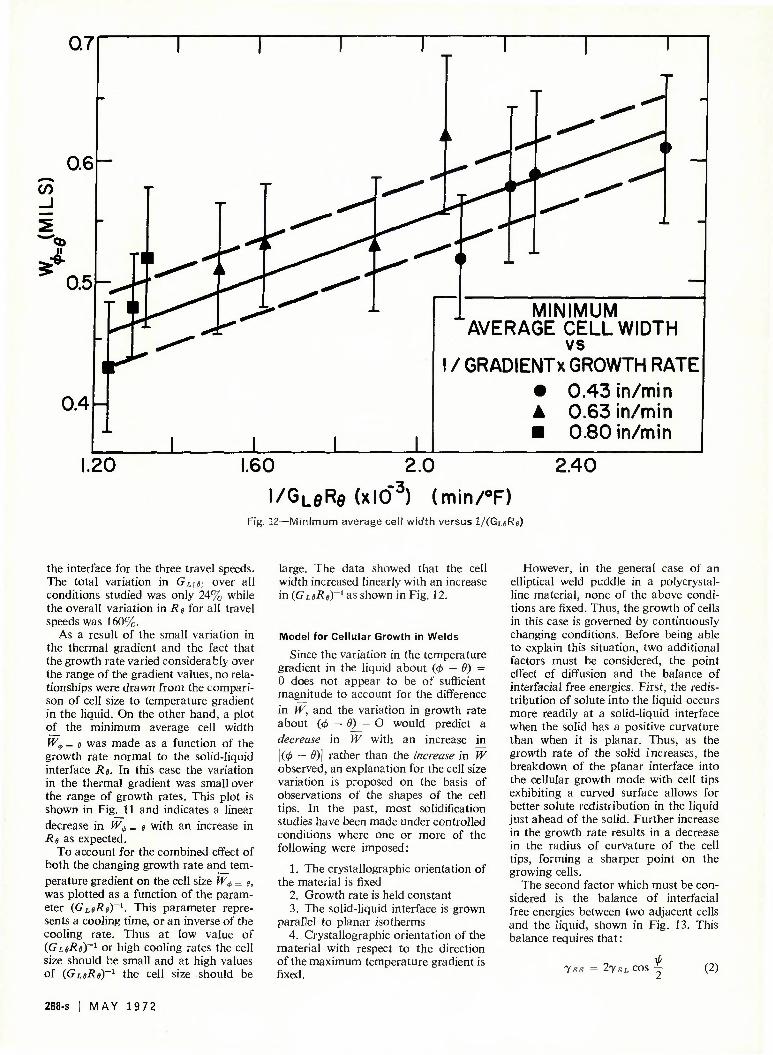
l/GL0Ra (xl0~5) (min/°F) Fig. 12—Minimum average cell width versus l/(GLeRe)
the interface for the three travel speeds. The total variation in G l ( e , over all conditions studied was only 24% while the overall variation in Re for all travel speeds was 160%.
As a result of the small variation in the thermal gradient and the fact that the growth rate varied considerably over the range of the gradient values, no relationships were drawn from the comparison of cell size to temperature gradient in the liquid. On the other hand, a plot of the minimum average cell width W$ _ e was made as a function of the growth rate normal to the solid-liquid interface Re- In this case the variation in the thermal gradient was small over the range of growth rates. This plot is shown in Fig. 11 and indicates a linear
decrease in W^, _ e with an increase in Re as expected.
To account for the combined effect of both the changing growth rate and temperature gradient on the cell size W^ = 9, was plotted as a function of the parameter {GLeRe)~l. This parameter represents a cooling time, or an inverse of the cooling rate. Thus at low value of (GLeRey~l or high cooling rates the cell size should be small and at high values of (GLeRe)*1 the cell size should be
large. The data showed that the cell width increased linearly with an increase in (Gxe^e) -1 as shown in Fig. 12.
Model for Cellular Growth in Welds
Since the variation in the temperature gradient in the liquid about (4> — 8) = 0 does not appear to be of sufficient magnitude to account for the difference in IV, and the variation in growth rate about {<p — 8) = O would predict a decrease in W with an increase in (0 - 0)| rather than the increase in W
observed, an explanation for the cell size variation is proposed on the basis of observations of the shapes of the cell tips. In the past, most solidification studies have been made under controlled conditions where one or more of the following were imposed:
1. The crystallographic orientation of the material is fixed
2. Growth rate is held constant 3. The solid-liquid interface is grown
parallel to planar isotherms 4. Crystallographic orientation of the
material with respect to the direction of the maximum temperature gradient is fixed.
However, in the general case of an elliptical weld puddle in a polycrystalline material, none of the above conditions are fixed. Thus, the growth of cells in this case is governed by continuously changing conditions. Before being able to explain this situation, two additional factors must be considered, the point effect of diffusion and the balance of interfacial free energies. First, the redistribution of solute into the liquid occurs more readily at a solid-liquid interface when the solid has a positive curvature than when it is planar. Thus, as the growth rate of the solid increases, the breakdown of the planar interface into the cellular growth mode with cell tips exhibiting a curved surface allows for better solute redistribution in the liquid just ahead of the solid. Further increase in the growth rate results in a decrease in the radius of curvature of the cell tips, forming a sharper point on the growing cells.
The second factor which must be considered is the balance of interfacial free energies between two adjacent cells and the liquid, shown in Fig. 13. This balance requires that:
T.ss 27.*;/, cos •— (2)
268-s I MAY 19 72
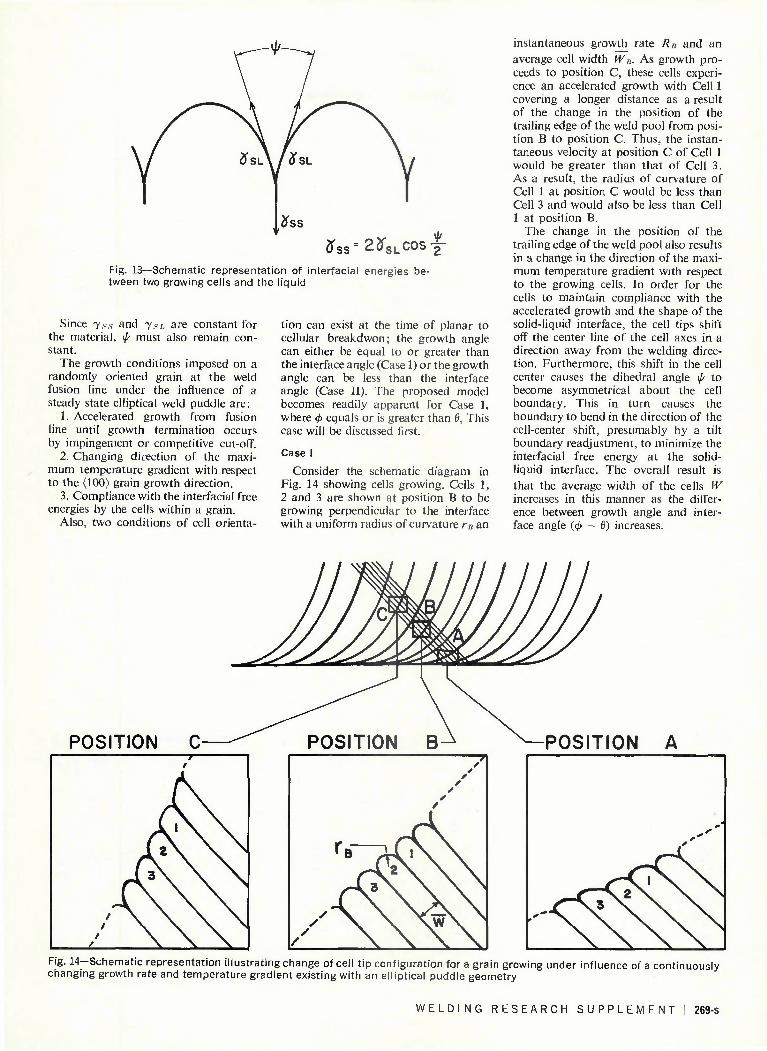
cTss= 2 t f S L c o s T Fig. 13—Schematic representation of interfacial energies between two growing cells and the liquid
Since yss and 7.SL are constant for the material, tp must also remain constant.
The growth conditions imposed on a randomly oriented grain at the weld fusion line under the influence of a steady state elliptical weld puddle are:
1. Accelerated growth from fusion line until growth termination occurs by impingement or competitive cut-off.
2. Changing direction of the maximum temperature gradient with respect to the (100) grain growth direction.
3. Compliance with the interfacial free energies by the cells within a grain.
Also, two conditions of cell orienta
tion can exist at the time of planar to cellular breakdwon; the growth angle can either be equal to or greater than the interface angle (Case I) or the growth angle can be less than the interface angle (Case II). The proposed model becomes readily apparent for Case I, where <f> equals or is greater than 8, This case will be discussed first.
Case I
Consider the schematic diagram in Fig. 14 showing cells growing. Cells 1, 2 and 3 are shown at position B to be growing perpendicular to the interface with a uniform radius of curvature rB an
instantaneous growth rate RB and an average cell width WB. As growth proceeds to position C, these cells experience an accelerated growth with Cell 1 covering a longer distance as a result of the change in the position of the trailing edge of the weld pool from position B to position C. Thus, the instantaneous velocity at position C of Cell 1 would be greater than that of Cell 3. As a result, the radius of curvature of Cell 1 at position C would be less than Cell 3 and would also be less than Cell 1 at position B.
The change in the position of the trailing edge of the weld pool also results in a change in the direction of the maximum temperature gradient with respect to the growing cells. In order for the cells to maintain compliance with the accelerated growth and the shape of the solid-liquid interface, the cell tips shift off the center line of the cell axes in a direction away from the welding direction. Furthermore, this shift in the cell center causes the dihedral angle i/- to become asymmetrical about the cell boundary. This in turn causes the boundary to bend in the direction of the cell-center shift, presumably by a tilt boundary readjustment, to minimize the interfacial free energy at the solid-liquid interface. The overall result is that the average width of the cells W increases in this manner as the difference between growth angle and interface angle (cp — 8) increases.
POSITION POSITION B POSITION A
Fig. 14—Schematic representation illustrating change of cell tip configuration for a grain growing under influence of a continuously changing growth rate and temperature gradient existing with an elliptical puddle geometry
W E L D I N G R E S E A R C H S U P P L E M E N T ! 269-s
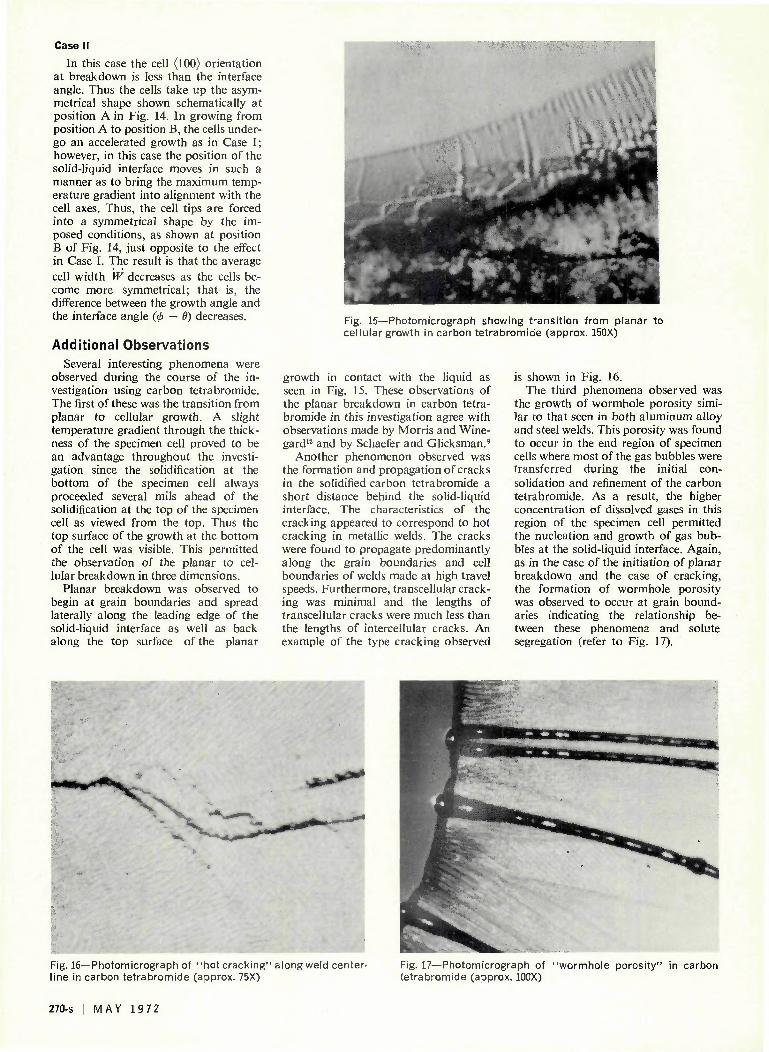
Case II
In this case the cell (100) orientation at breakdown is less than the interface angle. Thus the cells take up the asymmetrical shape shown schematically at position A in Fig. 14. In growing from position A to position B, the cells undergo an accelerated growth as in Case I; however, in this case the position of the solid-liquid interface moves in such a manner as to bring the maximum temperature gradient into alignment with the cell axes. Thus, the cell tips are forced into a symmetrical shape by the imposed conditions, as shown at position B of Fig. 14, just opposite to the effect in Case I. The result is that the average cell width W decreases as the cells become more symmetrical; that is, the difference between the growth angle and the interface angle (<t> — 6) decreases.
Additional Observations Several interesting phenomena were
observed during the course of the investigation using carbon tetrabromide. The first of these was the transition from planar to cellular growth. A slight temperature gradient through the thickness of the specimen cell proved to be an advantage throughout the investigation since the solidification at the bottom of the specimen cell always proceeded several mils ahead of the solidification at the top of the specimen cell as viewed from the top. Thus the top surface of the growth at the bottom of the cell was visible. This permitted the observation of the planar to cellular breakdown in three dimensions.
Planar breakdown was observed to begin at grain boundaries and spread laterally along the leading edge of the solid-liquid interface as well as back along the top surface of the planar
Fig. 15—Photomicrograph showing transition from planar to cellular growth in carbon tetrabromide (approx. 150X)
growth in contact with the liquid as seen in Fig. 15. These observations of the planar breakdown in carbon tetrabromide in this investigation agree with observations made by Morris and Wine-gard12 and by Schaefer and Glicksman.9
Another phenomenon observed was the formation and propagation of cracks in the solidified carbon tetrabromide a short distance behind the solid-liquid interface. The characteristics of the cracking appeared to correspond to hot cracking in metallic welds. The cracks were found to propagate predominantly along the grain boundaries and cell boundaries of welds made at high travel speeds. Furthermore, transcellular cracking was minimal and the lengths of transcellular cracks were much less than the lengths of intercellular cracks. An example of the type cracking observed
is shown in Fig. 16. The third phenomena observed was
the growth of wormhole porosity similar to that seen in both aluminum alloy and steel welds. This porosity was found to occur in the end region of specimen cells where most of the gas bubbles were transferred during the initial consolidation and refinement of the carbon tetrabromide. As a result, the higher concentration of dissolved gases in this region of the specimen cell permitted the nucleation and growth of gas bubbles at the solid-liquid interface. Again, as in the case of the initiation of planar breakdown and the case of cracking, the formation of wormhole porosity was observed to occur at grain boundaries indicating the relationship between these phenomena and solute segregation (refer to Fig. 17).
Fig. 16—Photomicrograph of "hot cracking" along weld center-line in carbon tetrabromide (approx. 75X)
Fig. 17—Photomicrograph of "wormhole porosity" in carbon tetrabromide (approx. 100X)
270-s I MAY 1972

Conclusions The following conclusions are drawn
from the qualitative observations of camphene and carbon tetrabromide:
1. Solidification substructures similar to those found in metallographic examinations of metallic welds were observed in these crystalline organic materials
2. The development of a cellular growth mode from a planar growth mode was observed and recorded
3. Weld defects such as hot cracks and porosity were observed during formation and recorded.
Quantitative measurements in carbon tetrabromide showed that:
1. Cell size increased with increasing deviation of the growth direction from the normal to the solid-liquid interface at a given interface angle, being a minimum where the growth of the cellular substructure was perpendicular to the
solid-liquid interface 2. The minimum average cell width
was found to decrease linearly with increasing growth rate
3. The minimum average cell width was found to increase linearly with the inverse of the product of the growth rate times the temperature gradient in the liquid.
References 1. Chalmers . B. . Principles of Solidifica
tion, John Wiley & Sons. Inc.. New York 1967. (A genera l s u m m a r y of research efforts in the field of solidification is available in the chapte r references.)
2. Tiller, W. A.. Jackson. K. A.. Rut te r , J. W. and Chalmers . B., " T h e Redistr ibut ion of Solute Atoms Dur ing Solidification of Meta ls ," Acta Metallurgica, Vol. 1. 1953
3. Ru t te r . J. W. and Chalmers, B., "A Pr i smat ic Subs t ruc tu re Fo rmed Dur ing Solidification of Meta ls . " Canadian Journal of Physics, Vol. 31. 1953
4. Tiller, W. A. and Rut ter , J . W.. " T h e Effect of Growth Conditions Upon the Solidification of a Binary Alloy," ibid. Vol. 34, 1956
5. Jackson, K. A. and Hunt . J. D., " T r a n s p a r e n t Compounds Tha t Freeze Like Meta ls ." Acta Metallurgica, Vol. 13, 1212, 1965
6. Jackson K. A.. Hunt . J. D.. Uhlmann, D. R. and Seward T. P. . I I I . Ti*ansactions of the Metal lurgical Society of AIME. 236, Feb. . 1966
7. Hunt . J. D. and Jackson, K. A,. "Binary Eutect ic Solidification," ibid. 236, June . 1966
8. Jackson. K. A.. Uhlmann. D. R. and Hunt . .1. D.. "On the Na tu re of Crystal Growth from the Melt. Journal of Crystal Growth," Vol. 1. 1967
9. Schaefer. R. J. and Glicksman, M. E.. " In i t ia t ion of Dendr i tes by Crystal Imper fect ions." Metal lurgical Transact ions , Vol. 1. Ju ly 1970
10. Savage. W. F . . Lundin . C. D. and Chase, T. F . , "Direc t Observation of Micro-s t ruc tura l Changes Associated With Fusion Weld ing ," Technical Note, T H E WELDING JOURNAL, Research Supplement, Vol. 47, November 1968
11. Savage. W. F . . Lundin . C. D. and Aronson. A. H.. "Weld Metal Solidification Mechanics ." ibid. 44. April 1965
12. Morris . L. R and Winegard, W. C . " T h e Cell to Dendr i te Trans i t ion . " Journal of Crystal Growth, Vol. 6. 1969 ^
WRC BULLETIN No. 171
APRIL 1972
"Fatigue Behavior of Aluminum Alloy Weldments"
by W. W. Sanders, Jr.
The primary objective of this study, carried out for the Aluminum Alloys Committee of the Welding Research Council, was to conduct a literature search related to fatigue of aluminum weldments and to prepare an interpretive report on the work which has already been completed. In particular, this study includes:
• accumulation of all available fatigue data on welded aluminum • analyses of these data • preparation of a report indicating the present state of knowledge in the field • recommendations for future research
This report presents a summary of this study, including: (1) descriptions of the methods of fatigue testing and analysis; (2) factors affecting fatigue strength of welded joints; (3) static and fatigue properties of unwelded aluminum; (4) a comprehensive survey and analysis of the behavior of butt-welded, fillet-welded and miscellaneous welded joints; and (5) a comprehensive bibliography on fatigue behavior of welded aluminum structures.
The results reported include tests of 21 different alloys with 40 different heat treatments and tempers. The alloys include two from the 2000 series, one from the 3000 series, eight from the 5000 series, three from the 6000 series, and seven from the 7000 series.
About 300 different reports and papers were reviewed and over 400 test series with about 5000 individual tests were analyzed. The data from the applicable studies were summarized so that an independent analysis of all data could be conducted.
The price of WRC Bulletin 171 is $3.00 per copy. Orders for single copies should be sent to the American Welding Society, 2501 N.W. 7th Street, Miami, Fla. 33125. Orders for bulk lots, 10 or more copies, should be sent to the Welding Research Council, 345 East 47th Street, New York, N.Y. 10017.
W E L D I N G R E S E A R C H S U P P L E M E N T i 271-s


![Weld Metal Solidification-2-Microstructure Within Grains[1]](https://static.fdocuments.us/doc/165x107/55157aa24a7959f1028b5208/weld-metal-solidification-2-microstructure-within-grains1.jpg)