
THE UNIVERSITY OF ALABAMA IN HUNTSVILLE P.I? · 2013-08-30 · THE UNIVERSITY OF ALABAMA IN...
19
NASA-CR-192]1.28 THE UNIVERSITY OF ALABAMA IN HUNTSVILLE P.I? semi-annual progress report November 1, 1990 - April 30, 1991 NAGW-2128 "A New Approach to Plasmasphere Refilling: Anomalous Plasma Effects" Prepared by N. Singh, Ph.D. Principal Investigator Department of Electrical & Computer Engineering College of Engineering The University of Alabama in Huntsville Huntsville, AL 35899 (NASA-CR-192128) A NEW APPROACH TO PLASMASPHERE REFILLING: ANOMALOUS PLASMA EFFECTS Semiannual Progress Report, 1 Nov. 1990 - 30 Apr. 1991 (Alabama Univ.) 19 p N93-19945 Unclas G3/75 0145540 https://ntrs.nasa.gov/search.jsp?R=19930010756 2020-04-29T12:38:40+00:00Z
Transcript of THE UNIVERSITY OF ALABAMA IN HUNTSVILLE P.I? · 2013-08-30 · THE UNIVERSITY OF ALABAMA IN...

NASA-CR-192]1.28
THE UNIVERSITY OF ALABAMA IN HUNTSVILLE P.I?
semi-annual progress report
November 1, 1990 - April 30, 1991
NAGW-2128
"A New Approach to Plasmasphere Refilling:
Anomalous Plasma Effects"
Prepared by
N. Singh, Ph.D.
Principal Investigator
Department of Electrical & Computer Engineering
College of Engineering
The University of Alabama in Huntsville
Huntsville, AL 35899
(NASA-CR-192128) A NEW APPROACH TO
PLASMASPHERE REFILLING: ANOMALOUS
PLASMA EFFECTS Semiannual Progress
Report, 1 Nov. 1990 - 30 Apr. 1991
(Alabama Univ.) 19 p
N93-19945
Unclas
G3/75 0145540
https://ntrs.nasa.gov/search.jsp?R=19930010756 2020-04-29T12:38:40+00:00Z

, WORK PERFORMED
Dunng the last 10 months of the grant we have investigated both laminar andanomalous plasma processes occurnng during the refilling of the outer plasmasphere aftermagnetic storms. Our theoretical investigations have been based on two types of models:(1) two-stream hydrodynamic model in which plasma flows from the conjugate ionospheresare treated as separate fluids [Singh, 1988; Rasmussen and Schunk, 1998; Singh, 1990a] and
the ion temperature anisotropies are treated self-consistently_ [Singh and Torr, 1990; Singh,1990b, 1991], (2) large---scale particle-in---cell code [Wilson et al., 1990; Horwitz et at.,
1990]. We briefly describe here our findings. _...__ _i:-.
" Temperature Anisotropy (TAN) Model:
In view of the observations that temperature anisotropies are endemic to themagnetic field-aligned flows of the thermal plasma in the outer plasmasphere [Young,1983], we have extended the previous two-stream hydrodynamic models [Singh, 1988;Rasmussen and Schunk, 1988, Singh, 1990a] to include the ion temperature anisotropy bysolving separate equations for the temperatures associated with the motions of ions parallel
and perpendicular to the magnetic field. The relevant equations which we solve for eachplasma stream along a closed field line (Fig. 1) are
0Ni O 1 3A+ _ (NiVi) = -NiV i _- _ (1)
3Vi q i k b 0_si+_s(1ViVi )=mlE mi
k b 1 ON. k b 0A ['0Vii
-_ii T]]i _ii ]_-g]] m-i'i (Till - T±i) ]_ +(2)
-_-_ + _s (VaTt]i) - -T]]i _.--_- + -_-_ [Aql[i I (3)Ot c
--_+ VaT±i) = T.d _y'-TdV i + TurbL--gy-Jc X_'sIAq,.il(4)
where s is the distance along the field line from a ionospheric boundary (Figure 1), A is the
cross---sectional area of the flux tube; A = B -1, B is the magnetic field magnitude; qi and
m i are the charge and mass of an ion. The subscript 'i' stands for the streams originating
from the northern (i = n) or southern (i = s) ionospheres. These streams are treated as
separate fluids [Singh, 1988]. V i and N i are the flow velocity and the density. T]] i and Tli
are the parallel and perpendicular temperatures and q[[i and q_.i are, respectively, the heat
flows associated with T[[ i and Tj.i, along the magnetic field lines.
The interstream collision terms (b'F/&)c appearing in the equations for Vi, TII i and
Tj. i are similar to those given by Burger [1969], but the self---collisions which are effective
2PREGEDING P/IIGE BLANK NOT FILMED

in relaxation of temperature anisotropy are given by [Ickimaru, 1973]
ii =-:i ii -(TA- -F!li) Ti t
8 r 1/2N. e 4--i Ir. - in A
T a/2I 15mi elf
2 (1_9)
-i [(1-_2)W_i ÷#2Tj.i]3/2
!Lh)
When needed, the heating term (STj&)Tur b appearing in (4) is chosen to
represent ion heating by broadband waves in the limit of long wavelength waves;
!b'Tt_-=?Turb ~127f_ _ _ (8)1
where ¢ is the wave power spectral density in units of V2m -2 Hz -1 [Singh and Schunk,
1984; Chang et al., 1986].
In a collision-dominated plasma, it is possible to describe the heat flows qJ.i and q[[i
in terms of the thermal conductivities [Holzer et al., 1972]. In a collisionless situation, likethat in the initial stage of the refilling it is not obvious how to calculate heat flows. It ispossible that one can solve additional time--dependent heat flow equations [Mitchell andPalmadesso, 1983; Ganguli and Palmadesso, 1987], but it turns out to be quite tricky to
solve such equations numerically [Palmadesso et al., I988].
In a collisionless situation the maximum heat flow is qti = (nkbTti) Vth where 't'
stands for parallel (t = [[) or perpendicular (t = J.) directions. Note that the quantity in the
parentheses in the expression for qti is the thermal energy density nkbTll i or nkbTi and
is the parallel thermal velocity given by (kbT[[i/mi)1/2. It is known that in aVth
collisionless plasma the heat flows are likely to be severely limited by plasma instabilities[Manheimer, 1977]. In the solar wind literature such situations have been handled byassuming [Metzler et al., 1979]
qti = e 77nikbTti Vth (9)
where e is • 1 depending on the sign of the gradient in temperatures (T A or Till) and r? is a
heat flow reduction factor due to the plasma turbulence. The transition from thecollision-dominated to the collisionless situation is handled by calculating an effective heat
flow qeff by
A_=L+A_ (10)qeff qc qt a
where qc is the heat flow associated with TII or T._ determined by the collision frequencies.
In a collisionless plasma qc -+ _ and (10) gives qeff : qta' On the other hand, in a collision
dominated plasma when qc < < qt a' qeff = qc"
3

We note that the heat flow reduction factor is determined by the plasma turbulence.[n large scalemodels,it is difficult to determine this factor quantitatively. Thus, i_ is usedas a free parameter so that the predictions from the hydrodynamic model agree withobservationsor with more rigorous kinetic models. Thus, there is definite need to studythe issue of heat flow in collisioniess plasma using both kinetic and hydJ:odynamic models.This is a part of our proposed research described in section 3.1
The electric field E is calculated by assuming that the plasma remains quasi-neutral
and the electrons obey the Boltzmann law; E = - (k Te/e)(1/n)(dn/dn ) where n = Z ni1
Electron temperature T e is assumed to be constant equal to the ionospheric temperature
T o. The set of equations (1) to (4) are solved subject to the following initial and boundary
conditions. At the initial time the flux tube is assumed to be highly depleted, a typical
condition after geomagnetic storms. The depletion is represented by n i = n o (A, t = 0) (sin
A/sinAo)7 with the minimum density limited to 10--'4no , when n o is the density at the
ionospheric bases at A = =_Ao (Figure 1). Initial flow velocity V i (A, t = 0) = 0 and
temperatures T.L(A t = 0) = T (A, t = 0) = T O = 0.31 eV. The sensitivity of the results
to the initial conditions was examined and it was found that for a severely depleted flux-3
tubes (neq z 1 cm ), the details of the initial conditions do not significantly affect the
flow and the refilling scenarios [Singh, 1991]. Boundary conditions for the fluid from the
northern hemisphere are: nn(A = Ao, t) = no, Vn(A = Ao' t) = 0, Tn(Ao, t) = T n(Ao, t)
= To; at the boundary _ = -)_o floating boundary conditions are apphed. A set of similar
boundary conditions are used for the fluid originating from the southern hemisphere but
with the roles of *)_o interchanged.
The anisotropy force a_Tt - TII ) in the momentum equation plays important roles
in the refilling process. Usually the origin of this force is not clearly understood, therefore,we briefly describe it here.
2.1.1 The Physics Behind the Anisotropy Force:
The momentum equation contains a force term which is proportional to (T[1 -Tj.)
OA/0s. We call this force the Anisotropy force. Since this force is found to have aconsiderable affect on the refilling, we briefly describe here the physical origin of the force.
i 0B i 3AThe mirror force per unit volume is F = -nkT._ B" _ = nkTj. X J-f" where them
cross-sectional area of the flux tube A which is proportional to B -I. The other force
which is relevant here isthe pressure force,which isessentiallythe net momentum transfer
across an area. This force is operative in both collisional and collisionless plasmas. Thepressure force on an element of plasma in a diverging flux tube is
0 (11)- N (nkTllA )
where A is the area of the cross sectionof the tube and _s is the elemental length along the
tube. The above force can be decomposed into two parts:
1 0A (12)-A _s_s (nkTt[) - nkTll (A&) _-_-

Dividing the above force by A&, the pressure force per unit volume becomes
= ,) nkTT I I 0AFp -N (nkTi])- ,, X-Js-
Thus the sum of the mirror and pressure force per unit volume is
0 1 0A
F = Fp + F m = -N (nkTll) - nk (TII-r) X?Y
(13a)
(13b)
The first term is the usual pressure term in the momentum equation for a uniform fluxtube (B = constant). The second term is called the anisotropy force; in fact it is thecombination of the mirror force and the partial pressure force arising due to the divergencein the flux tube. In an isotropic plasma the two terms in this so---called anisotropy force
cancel out. But in an anisotropic plasma the force remains non---zero. When Ts > TI] the
force is upward as the mirror force. When T|] > T., this force is downward simply because
the pressure on the top surface of a plasma element in a diverging flux tube acts on a largerarea than that on its bottom surface.
Generation of Equatorially Trapped Ion.s and Their Effects on Refilling
Observations from DE-1 and SCATHA Satellites [Olsen, et. al., 1987] have shownthe presence of equatorially trapped ions in the outer plasmaspheric flux tubes. Normallysuch ions are H ÷ and they have perpendicular temperatures (Tj.) in the range 5 - 100 eV
and the temperature anisotropy TaJTII _ 10 - 50. Such ions occur in conjunction with a
broadband electromagnetic noise over the frequency spectrum from ion-cyclotron frequencyto the lower-hybrid frequency. Such waves axe generated by the energetic ions in theequatorial region. It is worth pointing out that the production of trapped ions through
their interactions with the waves generated by the energetic ions of plasma sheet and/or ofnng current origins is an interesting example of hot-cold plasma interactions, where thecold plasma is supplied from the ionosphere through the field-aligned plasma flows.Recently Singh and Tort [1990] studied for the first time the effects of equatorial ionheating on interhemispheric plasma transport by solving a self-consistent set of plasmatransport equations. Here we briefly summarize the results from our recent studies on theeffects of ion heating on the refilling of the outer plasmasphere. The temperatureanisotropies resulting from both the polar wind type of outflow from the conjugateionospheres in an empty flux tube and the equatorial ion heating are found to haveprofound effects on the refilling. Since some of the results from this study are alreadypublished [Singh and Torr, 1990] or are in press [Singh, 1990b], we present here only themain conclusions of this study.
(1)
(2)
(3)
The equatorial heating inhibits interhemispheric plasma exchange due to thelarge mirror force on the heated ions. The penetration of the flow originatingfrom one hemisphere into the opposite one depends on the heating rate at theequator (Fig. 2).The stoppage of the flow just beyond the equator in the opposite hemisphere
launches a shock wave which propagates down to the ionosphere of its origin(Fig. 2e to 2g). Through the passage of this shock, the supersonic flowsubsides in the flux tube. The transit time of the shock is found to be only a
few hours (~ 4-6 hours) for flux tubes with 4 i L <_6.After the shock crosses the heating region, temperature anisotropy across it
changes from Tj. > T[[ near the equator to Tll > Tj. (Figs. 2g and 2h).

(4)
(2)
(6)
(7)
(8).
In the region with T N > T. the anisotropy force (a(Tj. - Tll)) becomes
downward and it prevents the flux tube from refilling (Fig. 2e).After the passage of the shock when the flow velocity becomes quite small,and Coulomb collisions begin to become effective, first near the ionosphericboundaries where the densities are relatively high, the temperature
anisotropy Ttl > T begin to relax leading to TII ~TL (Fig. 2k and 2l).
When the anisotropy relaxes, a new plasma flux develops into the flux tube(Fig. 2j). This second stage of flow is generally subsonic.In the second stage the flux tube refills from bottom to top with a coldisotropic plasma (Figs. 2i, 2k and 2l).As the flux tube refills a variety of temperature and density structuresappear in the flux tube, some illustrative examples are shown in Fig. 3. In
the late stage of the refilling the trapped ions with T± > TI[ have a
twin-peaked structure (Fig. 3c) and this type of temperature anisotropy isfound to extend in latitude beyond the equatorial region [Olsen et al., 1987].
Refilling Time, of a, Flux Tube
In the previous section we saw a two--stage refilling consisting of supersonic andsubsonic flows. A similar two-stage refilling occurs even when equatorial ion heating is not
included. Here the temperature anisotropy TII > Tj., which develops due to the supersonic
nature of the flow in the depleted flux tube and which is further enhanced by the formationof a shock, plays a crucial role in determining the life time of the supersonic flow and,hence, in the refilling time of the flux tube. In several previous models temperatureisotropy (TISO) is explicitly assumed [Singh et al., 1986; Rasmussen and Schunk, 1988;G"uiter and Gombosi, 1990]. TISO models show a substantial refilling of the flux tube
during the supersonic flows from the conjugate ionospheres. The refilling process from aTISO model is shown in Figure 4, which shows that by the time t __ 12.3 hours, the
equatorial density neq _ 400 cm -3. Rasmussen and Schunk [1988] reported a similar
refilling in about 24 hours, but they did not include the energy equation in their solution.
When the equation for the H + temperature is solved along with the continuity and
momentum equations, the refilling is found to be even faster. This is primarily due to theenhancement of temperature behind the shock. The temperature enhancement leads to afaster shock velocity. Guiter and Gombosi [1990] noted a similar beMvior of the shocksduring refilling.
The refilling time predicted by the TISO model is too short in comparison to theobserved time of several days [Park, 1970]. The TAN model described above in Section 2.1predicts a much slower refilling process.
Figure 5 shows the evolution of the flow from the northern to the southern
hemisphere. A similar flow develops in the opposite direction. The density profile (Fig.ha) at t = 0 shows the state of the empty flux tube. By t = 2.31 hours, the flow has causeda substantial accumulation of plasma in the southern hemisphere. This accumulationoccurs when the supersonic flow from the northern hemisphere encounters the relativelydense plasma in the southern hemisphere. The supersonic flow is slowed down by theCoulomb collisions and by polarization electric fields. The accumulated plasma evolvesinto a shock as seen at t = 2.31 hours from the density (Fig. 5a), velocity (Fig. 5b) andparallel temperature profiles (Fig. 5d). The shock first propagates upward to the equator
and then downward to the ionosphere. Behind the shock TII > T.. Thus, the anisotropy
force is downward, and the shock is accelerated downward and it reaches the ionospheric
6

boundary in a relatively short time of t = 4.61 hours. The transit time of the shock fromthe equator to the boundary is less than two hours. During the phase of the downwardshock propagation, there is very little refilling. As a matter of fact, the flow behind theshock is downward as seen from the velocity profiles at t = 3.84 hours (Fig. 5b). This is incontrast to the refilling seen in the TISO model, which predicts a substantial L'efillin_
behind the shock (Fig. 4).The TAN model shows a second stage of refilling if the Coulomb collisions become
effective in isotropizing the temperature anisotropy. This begins near the ionosphericboundaries, where plasma density is relatively large. Figure 5e shows the state of theisotropization at t = 7.68 hours, when T ~ T up to about A > 30" near the northern
J-- II "_boundary. In response to this isotropization, flow develops from the ionosphere (Fig. 5g).
In this stage the flow is generally subsonic. The evolution of the density profile of the flowfrom the northern ionosphere shows an expanding plasma front shown by the arrows in Fig.
5f. This plasma is found to be cold and isotropic with a temperature Tj._ ~ TII_'- To" The
evolution of the total density in the flux tube is shown in Fig. 5h, which suggest amonotonic refilling. We find that at t = 153.69 hours = 6 days, the equatorial density
._ cm-3, ~neq_ 325 which should be contrasted with neq _ 400 cm -3 in about 12 hours as
predicted from the TISO mode/(Fig. 5). The TAN model predicts that after about a day
the L = 4 flux tube refills with a rate of about ~ 15 cm-3/day, although the refilling rate
progressively decreases.Summarizing the study on the refilling time, we emphasize that the ion temperature
anisotropy plays a crucial role in determining the refilling time. If the anisotropv isself---consistently allowed to evolve with the flow, the supersonic stage last a few hours (< 4hours). At the end of the supersonic stage the flux tube remains depleted, and the forcesassociated with the density gradients in the depleted flux tube are balanced by the
downward anisotropy force for TII > Tj.. When Coulomb collisions begin to isotropize the
plasma, first beginning near the ionospheric boundaries, the second stage of refilling withsubsonic flows starts. The refilling with subsonic flows can last over several days asindicated by observations.
This study comparing the results from the TAN and TISO models will soon appear
in Geophysical Research Letters [Singh, 1991].Besides, the above major effort in developing the two-stream TAN model and its
applications to refilling processes, we also dealt with some other aspects of refilling. In a
recent commentary we contributed to the ongoing debate on the coupling of ion streams atthe equator and pointed out the factors distinguishing electrostatic shock formation by
ion-ion instability from the hydrodynamic shock arising OUt of pressure differences [Sing.h,1990a]. We have studied the characteristics of the h_'drodynamic shocks ininterhemispheric flows during the plasmaspheric refilling problem [Singh et al, 1991].
Kinetic Model and Results
Under the reduced budget awarded for the current NSF grant, resources associatedwith Horwitz went almost entirely toward supporting a research assistantship for Ms.Joyce Lin, a physics graduate student at UAH. Ms. Lin's efforts, as part of what willultimately be her doctoral dissertation, have been directed toward the incrementaldevelopment of a kinetic model for the early stage of plasmasphere refilling. Here we shalldescribe the approach used and results obtained so far.
Although most models describing plasmasphere refilling are hydrodynamic in nature(e.g., Banks et al., 1971; Grebowsky, 1972; Rosner, 1971; Khazanov et al., 1984; Rasmussenand Schunk, 1989), processes which may only be described kinetically may be significant,

perhapsdominant, in the physics of the early, 'collisionless' stageof the refilling process.These include the possible scattering, perpendicular heating and trapping effects ofwave-particle interactions on inflowing polar wind ions. A first examination of the effectsof perpendicularheating on inflowing ions into the flux tube in terms of 'average motionsand encrgizationwaspursuedby Singhand Hwang (1987).
In the past two years,we have developeda model for the early, 'collisiouless' stageof refilling basedon the hypothesisthat the principal processesfor trapping and heating ofthese incoming ions occurs through wave-particle interactions. Along an L = 4 magneticfield hne, we presume a distribution of wave fields/power levels that lead to two types ofvelocity alterations of individual ions, pitch angle scattering and perpendicularenergization. Following the discussion by Singh and Tort (1988), it is presumed that thepitch angle scattering results from ion interactions with left-hand circularly polarizedelectromagnetic waves, while the perpendicular heating results form broadband fluctuating
perpendicular electric fields that have significant power near the ion cyclotron frequency.Individual ion trajectories are obtained by integrating the equations of motion for
the parallel velocities and perpendicular energies. These motions are influenced by gravity,the magnetic mirror force, and the impulses due to the wave-induced scattering andheating. These velocity and energy impulses are calculated each time step that an ion is
advanced via velocity---diffusion coefficients D aa and D ,for the pitch angle scattering and
perpendicular heating rates. The expressions given by Singh and Tort (1988) are used torelate these diffusion coefficients to wave power levels. Information on the distribution of
we havewave powers is sparse, but generally used levels consistent with observationsand/or thermal noise level nuctuations from densities and characteristic thermal energiesfor superthermal/ring current particles. From various observational considerations(Kintner and Gurnett, 1977; Gurnett et al., 1984; Young, 1983; Olsen et al., 1987), the
power spectral levels for perpendicular heating are in the broad range 10 -9 to
10-14 v 2 m -2 ttz -1.
Considering wave power level distributions consistent with these general estimatesand often with significant concentration at the magnetic equator, we have integratedindividual ion trajectories during bounces along the L = 4 field line. Figure 6 shows anexample of a trajectory in which a proton was injected at the topside ionosphere andallowed to move through perpendicular heating effects which were highly concentrated atthe equator, but no pitch angle scattering was included. The upper panel, which displaysshe latitude versus time, shows the ion initially becoming trapped at a mirror latitude ofabout 20", and then abruptly at a much smaller latitude of ~ 3". This sudden confinedtrapping is associated with dramatic and erratic gains in energy of up to !00 eV. Theerratic nature of the energy gain and trapping is directly due to the stochastic nature of theenergy impulses, which can, during any given time step, be negative.
To directly simulate the early--stage refilling process, we injected polar wind protonsin the form of upgoing halves of bi-Maxwellian distributions at the topside ionospherealtitudes at both ends of the L = 4 flux tube. These base distributions are turned on into
an initially 'empty' flux tube at t = 0 and left on at constant flux levels. The trajectoriesfor all the ions are integrated forward as they are injected, and the evolution of bulkparameters, such as density, as well as distribution functions, are obtained all along thefield hne. Figure 7 displays the total number of ions contained in the flux tube as afunction of time for four different combinations of wave-particle interaction power levels.
Except for the case where both pitch-angle scattering and perpendicular heating areinvolved at the indicated power levels (case d), the ion content has attained an asymptoticlimit by 7---8 hours. For this case, equatorial ion densities exceed 10 ions/cc by twelvehours.
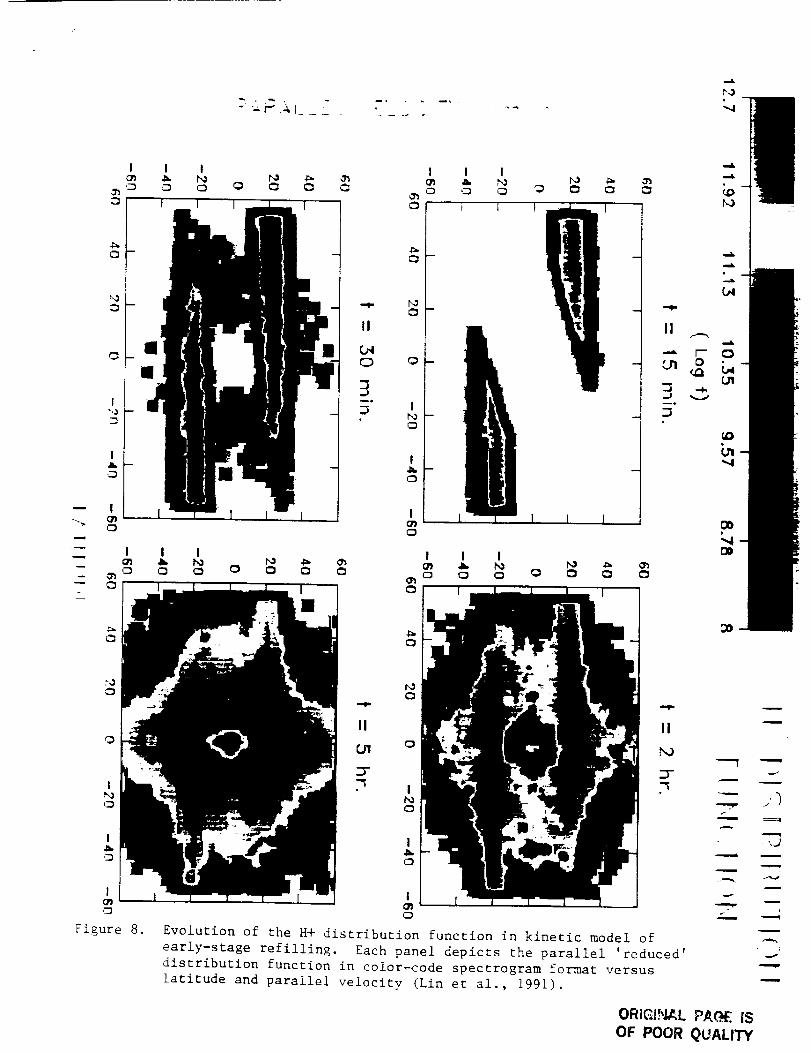
Examination of the distribution functions illustrates further interesting properties of
refilling from the kinetic perspective. Figure 8 shows in color--coded formation 'reduced'
8

_iistribution functions, at various times after initiation, versus parallel velocity andgeocentricdistance. About fifteen minutes, the streams from each of the two conjugateionospheresexhibit significant dispersion,with the fastest particles having traveled acrossthe equator. By thirty minutes, the dispersion is further extended and the fastest ions(~ 38 kin/s) have arrived at the opposite hemisphere. After two hours, two oppositely-
directed streams are observed across the range of distance and the dispersive features havewashed out, owing to the fact that most ions have had sufficient time to execute one fullbounce.
There is also some initial energization and trapping around the equator. By fivehours after initiation, the two oppositely---directed streams still retain their distinctidentity but some broadening of each stream's main distribution is observed and there is anincreased supertherma] tail especially for the equatorial regions.
Several presentations on this effect have been made Ms. Lin (Lin et al., 1989a, b,;1990a, b), with her presentation at the San Francisco American Geophysical Union meeting
being selected as an outstanding student paper; only four student papers among forty-twoin the Solar-Planetary Relationships Section. A short paper for the Monograph on
Magnetosphere-Ionosphere Plasma Modeling has been accepted (Lin et al., 1990c).Very recently, we have incorporated the effects of binary Coulomb collisions and a
neutralizing electron fluid into the semi-kinetic model. The incorporation of the Coulombcollisions was particularly inspired by a talk presented by Lemaire (1990) at the HuntsvillePlasmasphere Refilling Workshop, who had done some calculations suggesting thatmultiple small angle collisions of protons with other protons and with electrons along theflux tube would lead to rather large pitch angle scattering and consequent accumulation ofions and accelerated refilling.
The Coulomb collisions were incorporated using a model for computer particlesimulations developed by Takizuka and Abe (1977). This model takes account of Debyeshielding and tests both by those authors and ourselves demonstrate that both totalmomentum and energy are conserved.
The neutralizing electron fluid was simulated both by an isothermal Boltzmanndistribution similar to that used by, for example, Wilson et al. (1990), as well as a modified
version in which a non-uniform electron temperature distribution is assumed. This lattersituation has been discussed, for example, by Hultquist (1970) and recently in asemi-kinetic outflow study Ho et al. (1990). In this case the parallel electric field is givenby
k(l+ a dTe kTedneEli = -_ 2) dr n e dr (14)
where k and e are the Boltzmann constant and the magnitude of the electronic charge; T e
is the (non-uniform) electron temperature, and a is taken to be 1.4. In the absence oftemperature gradients, the electric field is consistent with the electrostatic potentialassociated with a Boltzmann distribution of electrons.
Both of the above effects have only recently been put into the model and we arecurrently undertaking a thorough study of their effects in the refilling process. However,the initial results are extremely intriguing. Figures 10a, b and c show the time-evolutionof H* density, and parallel and perpendicular temperature as a function of latitude. In thiscase, the injected H ÷ distribution at each topside ionosphere was the upgoing portion of anupward drifting Maxwellian distribution with parallel velocity of 10 km/s and density of200 ions/cc. In these initial runs, we have not included wave-particle interaction effectsand the electron distribution was taken to be isothermal with a temperature of 3000" K.
The density profiles in Figure 9a at various times up to about 28 hours after initiation ofrefilhng show that the effects of Coulomb collisions lead to equatorial densities of about 100particles/cc after a day. Hence, the collisions lead to a rapid accumulation of plasma.
9

Furthermore, there is no shockformation in this model. The densitiesfill in smoothly and,to someextent, can be regardedasfilling from the low-altitude end upward.
The H÷ perpendicular and parallel temperatures displayed in Figures 9b and cfurther illustrate the effects of including the Coulomb collisions in the refilling process.The effective parallel temperature in the initial period of refilling is rather high, about30,000° K. This high value derives from the fact that initially we have two oppositely-directed streamsflowing at ~ +]-20 kin/s, so that the temperature moment is large eventhough the individual streams are cold (injected from the ionosphere with 3000" Ktemperature). As time progresses,the parallel temperatures cool to about 4000° K. Thisis due to the frictional slowing down of eachbeam toward coalescenceat zero relative drift.In the perpendicular temperatures, one observesthe initial distribution having a strongdechnefrom the ionospheretoward the equator owing to the conservationof the magneticmoments. The increasewith time of the temperatures is then due to the frictional heatingof the ions as the parallel directed flow motion is converted to random parallel andperpendicularenergiesthrough the collisions.
Figure 10 shows a simulated pitch-angle/latitude spectrogram of H* fluxes from asemi-kinetic model in which we have included wave-particle interactions with strongequatorial heating and an electron temperature distribution with a peak at the magneticequator. In this case, we have not included Coulomb collisions. We started with acollisionless equihbrium distribution with an isothermal electron distribution atTe = 3000" K, turned on the wave-particle interactions and then after one hour introduced
a "trapezoidal" electron temperature distribution in which the temperature is flat around
the magnetic equator at kT e = 1 eV, then declines to 3000" K over a narrow latitudinal
range and then stays at this temperature downward to the ionospheric base. As can beseen from equation (14), this electron temperature distribution leads to narrow regions ofdownward pointing electric fields on either side of the magnetic equator. This spectrogramplots the H* number fluxes (in 1.5" wide bins) versus pitch angle and the magnetic latitudeabout 1 hour after the introduction of this non-uniform electron temperature distribution.As can be seen, this situation results in trapped ion distributions (peak at 90" ) around themagnetic equator and double-stream ion distributions with peaks near 0 and 180 ° outsidethe equatorial region. This is similar to certain observations of Olsen et al. (1987) (see, forexample, Plate 5). Although we beheve the physics involved in producing these parallelelectric fields may be better represented by a semi-kinetic model in which the electrons aretreated as a fluid with temperature anisotropy and perpendicular and parallel heating (seenext section), it is nevertheless interesting that our model does reproduce those m_n
features seen in Olsen et al. (1987).For the special issue of the Journal of Geophysical Research on plasmasphere
refilhng that we have organized as an outgrowth of our October workshop, we will besubmitting two papers deahng with semi-kinetic models for plasmasphere refilling. One ofthese will deal with the effects of Coulomb collisions on refilling (Wilson et al., 1991), whilethe other will examine mainly the effects of wave-particle interactions (Lin et al., 1991).These should be submitted by the end of February.
The studies reported above in Sections 2.1 and 2.2 are based on two differentmodels. During the past 18 months these studies have been pursued almost independentlyas it was the phase of code developments and their apphcations to some selected problems.In the next section, we have proposed to carry out comparisons between the two modelsand use the comparison to verify the results from the hydrodynamic model against themore rigorous kinetic model.
10

REFERENCES
Horwitz, J.L., L.H. Brace, lt.H. Comfort and C.R. Chappell, Dual-spacecraft
measurements of plasmasphere-ionosphere couphng, J. Geophys. Res., 91, 11203, 1986.
Horwitz, J.L., R.H. Comfort, P. Pdchards, M.O. Chandler, C.R. Chappell, P. Anderson,W.B. Hanson and L.H. Brace, Plasmasphere-ionosphere couphng II: Ion compositionmeasurements at plasmaspheric and ionospheric altitudes and comparison with modelingresults, J. Geophys. Res., 95, 7949, 1990.
Horwitz, J.L., T.E. Moore, B.L. Giles, G.R. Wilson, C.W. Ho, J. Lin and K.R. Swinney,
Kinetic features of core plasmas in the magnetosphere: A new generation of observationsand simulations, submitted to J_ Ge0mag. Geoelect., 1990.
Horwitz, J.L., Toward a 'quasi---empirical' scenario for plasmasphere refilling based onthermal ion measurements, presented at the Huntsville Workshop of PlasmasphereRefilling, October, 1990.
Lin, J., J.L. Horwitz and K.S. Hwang, An early--stage model for the refilling of theplasmasphere: Effect of turbulent heating and pitch-angle scattering, presented at theSecond Workshop on Magnetosphere/Ionosphere Plasma Models, 1989a.
Lin, J., J.L. Horwitz and G.R. Wilson, An early--stage refilling model based on a "kinetic"approach with trapping due to turbulent ion heating, presented at the Fall 1989 SanFrancisco AGU meeting, EOS, 70, 1297, 1989b.
Lin, J., J.L. Horwitz, G.R. Wilson and C.W. Ho, A model for early--stage plasmasphererefilling based on kinetic approach with wave--particle interactions, presented at Workshopon Plasmasphere Refilling, Huntsville, Alabama, October, 1990a.
Lin, J., J.L. Horwitz, G.R. Wilson and C.W. Ho, An early--stage refilling model based on akinetic approach with trapping due to ion heating and pitch-angle scattering, submittedfor AGU monograph on Magnet.ospheric Plasma Models, 1990b.
Lin, J., J. L. Horwitz, G. R. Wilson, D. G. Brown, and C. W. Ho, A semi-kinetic model['or early-stage plasmasphere refilling, 2: Effects of wave-particle interactions, to besubmitted to J. Geophys. Res., 1991.
Singh, N., Role of ion temperature anisotropy in multistage refilling of the outerplasmasphere, Geophys. Res. Lett., in press, 1991.
Singh, N., Role of Electromagnetic noise in the interhemispheric plasma exchange alongclosed field fines, Advances in Space Res., in press, 1990.
Singh, N. and D.G. Torr, Effects of temperature anisotropy on the interhemispheric plasmatransport during plasmaspheric refilling, Geophys. Res. Lett., 1.7,925, 1990.
Singh, N., Comment on "Multistream Hydrodynamic Modeling of Interhemispheric PlasmaFlow," by C. E. Rasmussen and R. W. Schunk, J. Geophys. Res., 95, 17,272-17,279, 1990.
Singh, N., Plasmasphere refilling issues as seen from models, presented at the HuntsvilleWorkshop on Plasmaspheric Refilling, October 15-16, 1990.
Singh, N., P. Craven, D.G. Torr and P. Richards, Properties of large scale plasma flow
1IS

along a closed field line, submitted to J. Geophvs. Kes., 1991.
Wilson, G. R., J. H. Horwitz, and J. !.in, A semi-kinetic model for e3.rly-stage
ptasmasphere refilling, 1: Effects of Coulomb collisions, to be submitted to J. Geophvs.Re_As.,1991.
12

/\
Fig. 1. Geometry of the flux tube. Ionospheric boundaxies ate at s = 0 (northern
ionosphere) and s - Sma x (southern ionosphere). *Ao are the geomagnetic
latitudes(A) of the two boundaries and ro istheirgeocentric altitude.
O_¢iC_r"_,L ;-'AC-,E IS
OF POOR QUALITY
i
f==
v-q
vm
>-
• ,.
"' " ;g) i ,k) I
-- t _ t C [ r " '/ ) : '
-" .......... -L_" .'.v--;,. , '- _- .s
_JO 0 -80 SO 0 -80 60 O -80
,\ (Delrl_es) ,_ (Deles) _ {Decl'_es)
Fig. :2, The early and latetime evolutions of the pl_m_ flow developing from _he northern
hemisphere (A > 0). Panels (a) to (d) show the e_rly time profiles of nn(A ), Vn(_),
T n(A), and Tlln(A),respectively,at some selected times. Pands (e) to (h) show _he same
quantities _t later times. Panels (i)to (_) show the same quantities during the subsomc
stage of the flows.

/"
t
-- 0.5
- -0.5 _-w
..o
,C
-L.5_
Ii a J
ra, i1
"2 _...._
I ':}
_ -0.5
0.5i
E
-t.5
_.o (D_tp"Hs)
60 80 0 -_0
Fig. 3 gvoluUons of iota3 den_ty and &vera_ temperatures Tj.iv _d T
04tl- --
t
L 1 I 1 1
i i i I I(d)
.-.Z._.. _ I '
F--
-2 1 I I 1 I l
60 40 20 0 -20 -40 -60
>o (De=tees)
1.S
A 1_P
E-
e- 0.5
cho
0
I i I ' ; t it=7.68 P-
J_ _ ' -1
-- (f)
I I L____
¢
=
"o
>
0.8
> ii__ 0.4
o -I0 _,
>
2
t.5
I.
0.5
060
l(g) I t=7.68- _
30.74.- - -61.48- --- -
t 53.69-- - -
I 1 I I I
' I t 1 I
__it.=,\t 53 (h) J_
, _ _. tav/_.. . ,'-,61\ _ ..'
1 [ t=3u.74" l I
4-0 20 0 -20 -40 -60
X ° (De=rees)
Fig.5
OR_J..N,t_t p_ t_OF pOOr4 _|.:,C_L_TY
.-,o.,,. ==,,-- ,=,o.,..o,o,,o,I tdensity nn, (b) flow velocity Vn, (c) parallel temperature Tlln
perpendicular temperature T. n are shown up to t = 4.61 hours, when the-
shock reaches the northern ionospheric boundary, (e) relaxation of the
emperature anisotropy near this boundary, "" evolution of the densitynn(A)) profile at later times, (g) evolution of the velocity profile at later
times, and (h) evolution of the total density profile (n = n n + ns) and the
profile of the average temperature Tav at t = I53 hr.

,..<
w
.3
80_
:\
40
'iq20 L_
0;.. , /
-20
-40 t
O tO0
_, o 10""00="3. V ._'H=' . P., ,. 0
i L.... I '200 300 400 500
Time (ram.)
600I
"_oo
tO0 _P, • t0""coll). V_n=iH.z_ . P, = 0
> 80 _v
>,,=, 80 _L_
C
al 4o
"_ 2(1
o0 100
1
200J-_ - 1 I
300 400 500 600 ?00
Time (ram.)
Fig. 6 The time ,'i, rilitioa of in indlviduil lllriide'l triliectory ind tot =I eaeil7
with llellmdiculi: beating deer.
OF POOR QUALITY
ioooo
A
.o 4000O
z40000
N
¢ 20000¢
2
/
o(0
p, = iO-tS¢_ V_'_l_b¢ "i , P,. = lO'%os_ "f_Lt" (d)
.I
,/"" P, =0 P.=O/
.j4 . - -- ...... " ...................... 0
- tie
i i Ii0000 10000 30000 40000
Time (se¢. )
Fig. 7 T'lm,,i--wo_dlemlnmmb,=._iammmat_m_fm.dlefo,.,rcu_.I_ie imemcm_ uecL
I
I
O
O
I
o
I
I
Figure 8.
II
L_O
I
o
I
o
I
o
Evolution of the H+ distribution function in kinetic model of
early-stage refilling. Each panel depicts the parallel 'reduced'
distribution function in color-code spectrogram format versus
latitude and parallel velocity (Linet al., i991)•
O4
D_
II
bO
gr ___
m
ORIC|N_L PAt"_. IS
OF POOR QUALITY
9
I
i

10 24-"i
"-"tO I
'"A
c_ tO0
tOa "- i i _ i "
- -
10 6
I i i I I
i I I I i
0
v, i0,_
(b)
1 I l 1 I
I I t I i
A
0V
tOa
10 ;_
t(]'6O
(°) 1I 1 t _ t
40 20 0 -20 -40 -60
LatLLude
Timein hours
7 - 27.8
6- t6.?
5- tt.t
4 - 8.33
3 - 5.56
2 - 2.78
t - 0.56
Fig. 9' Plotsofthe density(a),paralleltemperature (b),aJadperpendiculartemperature(c) at the indicatedtimes for the kineticplasma.sphererefillingmodel which includesthe effectsof Coulomb collisionsbut does not include the effectsof any wave-pazticleinteractions.

/
//
I
(_>ee • ,Ill ,,_uI/il_oI) :Xli"Lt _,1t_I_!
_qDNV HDAI6
_ .-_,_,_,_,_,_,_,_*'-" .'I,
O C--CO _-
0 ._ '_ 0 '0",
A-_ _ Q_ I_ •
0_j Q_ _ _ AJ
-t- _ I_ .,lv
U-4 I
•"- _ 0 0 ,':D
,'D