The UMass Ascender System for 3D Site Model Construction ... · multi-image triangulation. ......
14
Abstract The Automated Site Construction, Extension, Det- ection and Refinement system (Ascender) has been developed to automatically populate a site model with 3D buildings extracted from multiple, over- lapping views. Image Understanding (IU) algo- rithms hypothesize potential building roofs in one image, automatically locate supporting geometric evidence in other images, and determine the pre- cise shape and position of the new buildings via multi-image triangulation. Backprojecting image intensities onto the recovered object surfaces leads to realistic graphical site model displays, and to extraction of symbolic features such as windows and doors. This paper describes how the Ascender system acquires and extends an initial site model. System performance is evaluated using imagery from Fort Hood, Texas. 1.0 Introduction The University of Massachusetts has a long-term commitment to the development of knowledge- based computer vision systems, and the UMass RADIUS project is the latest example of this focus. Image understanding modules have been devel- oped to acquire, extend and refine 3D volumetric building models from multiple, overlapping aerial views. The system design emphasizes model- directed processing, rigorous camera geometry, and fusion of information across multiple images for increased accuracy and reliability. Site model acquisition involves processing a set of images to detect man-made and natural features of *Funded by the RADIUS project under ARPA/Army TEC contract number DACA76-92-C-0041, and the National Sci- ence Foundation grant number CDA8922572. interest, and to determine their 3D shape and place- ment in the scene. The site models produced have obvious applications in areas such as surveying, surveillance and automated cartography. For example, acquired site models can be used for automated model-to-image registration of new images [Collins93], allowing features in the model to be overlaid on the images to aid visual change detection. Two other important site modeling tasks are model extension, updating the geometric site model by adding or removing features (Section 4), and model refinement, iteratively refining the shape and placement of features as more views become available. Model extension and refinement are ongoing processes applied whenever new images become available, each updated model becoming the current site model for the next iteration. Thus, over time, the site model is steadily improved to become more complete and more accurate. The Ascender system has been developed to auto- matically extract buildings from multiple, overlap- ping images of a site. Since buildings come in all sizes and shapes, an initial generic class of flat- roofed, rectilinear buildings was chosen to main- tain tractable implementation goals. This class contains all buildings where pairs of adjacent roof edges are perpendicular and lie in a single, hori- zontal plane; the simplest examples are rectangular box-shapes, L-shapes, and U-shapes. The most prevalent building types not included in this class are peaked-roof and multi-level structures. 2.0 Automatic Model Acquisition Acquisition of an initial site model begins with a set of overlapping images for which intrinsic and extrinsic camera parameters are known. We break the processing into five distinct stages that each The UMass Ascender System for 3D Site Model Construction * Robert T. Collins, Christopher O. Jaynes, Yong-Qing Cheng, XiaoGuang Wang, Frank R. Stolle, Howard Schultz, Allen R. Hanson, Edward M. Riseman Computer Vision Laboratory Computer Science Department University of Massachusetts, Amherst Amherst, Massachusetts 01003
Transcript of The UMass Ascender System for 3D Site Model Construction ... · multi-image triangulation. ......

AbstractThe Automated Site Construction, Extension, Det-ection and Refinement system (Ascender) has beendeveloped to automatically populate a site modelwith 3D buildings extracted from multiple, over-lapping views. Image Understanding (IU) algo-rithms hypothesize potential building roofs in oneimage, automatically locate supporting geometricevidence in other images, and determine the pre-cise shape and position of the new buildings viamulti-image triangulation. Backprojecting imageintensities onto the recovered object surfaces leadsto realistic graphical site model displays, and toextraction of symbolic features such as windowsand doors. This paper describes how the Ascendersystem acquires and extends an initial site model.System performance is evaluated using imageryfrom Fort Hood, Texas.
1.0 Introduction
The University of Massachusetts has a long-termcommitment to the development of knowledge-based computer vision systems, and the UMassRADIUS project is the latest example of this focus.Image understanding modules have been devel-oped to acquire, extend and refine 3D volumetricbuilding models from multiple, overlapping aerialviews. The system design emphasizes model-directed processing, rigorous camera geometry,and fusion of information across multiple imagesfor increased accuracy and reliability.
Sitemodel acquisition involves processing a set ofimages to detect man-made and natural features of
*Funded by the RADIUS project under ARPA/Army TECcontract number DACA76-92-C-0041, and the National Sci-ence Foundation grant number CDA8922572.
interest, and to determine their 3D shape and place-ment in the scene. The site models produced haveobvious applications in areas such as surveying,surveillance and automated cartography. Forexample, acquired site models can be used forautomated model-to-image registration of newimages [Collins93], allowing features in the modelto be overlaid on the images to aid visual changedetection. Two other important site modeling tasksare model extension, updating the geometric sitemodel by adding or removing features (Section 4),andmodel refinement, iteratively refining the shapeand placement of features as more views becomeavailable. Model extension and refinement areongoing processes applied whenever new imagesbecome available, each updated model becomingthe current site model for the next iteration. Thus,over time, the site model is steadily improved tobecome more complete and more accurate.
The Ascender system has been developed to auto-matically extract buildings from multiple, overlap-ping images of a site. Since buildings come in allsizes and shapes, an initial generic class of flat-roofed, rectilinear buildings was chosen to main-tain tractable implementation goals. This classcontains all buildings where pairs of adjacent roofedges are perpendicular and lie in a single, hori-zontal plane; the simplest examples are rectangularbox-shapes, L-shapes, and U-shapes. The mostprevalent building types not included in this classare peaked-roof and multi-level structures.
2.0 Automatic Model Acquisition
Acquisition of an initial site model begins with aset of overlapping images for which intrinsic andextrinsic camera parameters are known. We breakthe processing into five distinct stages that each
The UMass Ascender System for 3D Site Model Construction*
Robert T. Collins, Christopher O. Jaynes, Yong-Qing Cheng, XiaoGuang Wang,Frank R. Stolle, Howard Schultz, Allen R. Hanson, Edward M. Riseman
Computer Vision LaboratoryComputer Science Department
University of Massachusetts, AmherstAmherst, Massachusetts 01003

contribute to producing the final, three-dimensionalmodel: 1) line segment extraction, 2) rooftop polygon detection, 3) multi-image epipolar matching, 4) constrained, multi-image triangulation, and 5) projective intensity mapping.
Brief descriptions of each of these component tasksare presented; detailed algorithmic descriptions areoutside the scope of this paper, and references toadditional material are provided for the interestedreader. The algorithms are illustrated using a run-ning example performed using images J1-J8 fromthe RADIUS Model Board 1 data set. Figure 1shows a sample image from the data set. The sceneis a 1:500 inch scale model of an industrial site,with ground truth measurements available forabout 110 points scattered throughout the model.The scale model is built on a table top that can beraised and tilted to simulate a variety of cameraaltitudes and orientations. For model board imagesJ1-J8 the table was set to simulate aerial photo-graphs taken with a ground sample distance of 18inches, that is, pixels near the center of the imagebackproject to quadrilaterals on the ground withsides approximately 18 inches long (all measure-ments will be reported in scaled-up object spacecoordinates). Each image contains approximately1320x1035 pixels, with roughly 11 bits of greylevel information per pixel. The dimensions ofeach image vary slightly because the images havebeen subjected to unmodeled geometric and photo-metric distortions that were intended to simulateactual operating conditions.
Figure 1. A sample image from Model Board 1
2.1 Line Segment Extraction
To help bridge the huge representational gapbetween pixels and site models, feature extractionroutines are applied to produce symbolic, geomet-ric representations of potentially important imagefeatures. The Ascender system relies on straightline segments extracted by the Boldt algorithm[Boldt89], developed at UMass. At the heart of theBoldt algorithm is a hierarchical grouping systeminspired by the Gestalt laws of perceptual organiza-tion. Zero-crossings of the Laplacian of the inten-sity image provide an initial set of local intensityedges. Hierarchical grouping then proceeds itera-tively; at each iteration edge pairs are linked andreplaced by a single longer edge if their end pointsare close and their orientation and contrast valuesare similar. The resulting line set can be filteredaccording to user-supplied length and contrastthresholds that can be set interactively by the IAusing one-dimensional slider bars.
The Boldt line algorithm is employed in thisproject because of its precision and sensitivity,even though it dominates the computation time forthe entire model acquisition process. The Boldtline detector, run on a typical modelboard subim-age of 512x512 pixels takes approximately 14 min-utes of CPU time on a Sun Sparc-20 workstation.Since significant off-line computation is allowablefor initial model acquisition, and since the accuracyof the derived three-dimensional models dependsdirectly on the two-dimensional accuracy ofextracted line features, we continue to use theBoldt algorithm even though faster (but less accu-rate) line extraction algorithms are available. Thecurrent implementation of the Boldt algorithm can-not directly handle the memory requirements of thevery large images that are common in the RADIUSapplication domain (even the 1320x1035 modelboard images are fairly small in comparison).Therefore, large images are cut into overlappingsubimages, each of which is processed separatelyto extract line segments. All lines found are thentranslated and scaled back into the original imagecoordinate system. Breaking the image into over-lapping pieces introduces some artifacts into theline data. In particular, lines are fragmented at sub-image boundaries, and lines lying totally within anoverlapping area are duplicated. However, all ofthe building extraction algorithms that use line seg-ments are built to operate under the assumption of

noisy, fragmented data. Thus, although no attempthas been made to post-process the line data toremove these artifacts, the performance of thebuilding detection process does not appear to bedegraded.
For model board images J1-J8, subimages of size266x266 with an overlap of 10 pixels were used.For the results presented here, image resolutionwas also reduced by half using Gaussian filteringand subsampling, even though full resolution isused by default in the Ascender system (in thisexample, it was found that Gaussian image reduc-tion eliminated the peculiar “sawtooth” noise pat-tern that corrupted some of the model boardimages). The line segments were filtered to keeplines longer than 10 pixels that have a contrast of atleast 15 gray levels. This resulted in roughly 2800line segments per image. Figure 2 shows a repre-sentative set of line segments extracted from theimage shown in Figure 1.
2.2 Building Rooftop Detection
The goal of automated rooftop detection is toroughly delineate building boundaries that willlater be verified in other images and triangulated tocreate 3D geometric building models. The rooftopdetection algorithm is based on finding image poly-gons corresponding to the boundaries of flat, recti-linear rooftops in the scene (for more details, see[Jaynes94]). Briefly, possible roof corners areidentified by pairs of line segments with spatiallyproximate endpoints, meeting at an angle thatcould correspond to the projection of a horizontal,orthogonal roof corner in the scene. Perceptually
Figure 2. Line segments extracted from Figure 1
compatible corner pairs are linked with surround-ing line data and entered into a feature-relationgraph (Figure 3), weighted according to theamount of support they receive from the low-levelimage data. Potential building roof polygonsappear as cycles in the graph, and virtual cornerfeatures may be hypothesized automatically tocomplete a cycle, if necessary. Rooftops are finallyextracted by partitioning the feature-relation graphinto a set of maximally weighted, independentcycles representing closed, high-confidence build-ing roofs.
The building detector was run on image J3 in thisexample. This is a near-nadir view, but nothing inthe code precludes using one of the oblique viewsinstead. Since rooftop detection is computationallyexpensive due to low-level feature extraction andthe rapid growth of the feature-relation graph withimage size, the image was partitioned manuallyinto nine separate regions, loosely representing dif-ferent “functional areas”. The roof detector gener-ated 40 polygonal rooftop hypotheses, shown inFigure 4. Most of the hypothesized roofs are rect-angular, but six are L-shaped. Note that the overallperformance is quite good for buildings entirely inview. Most of the major roof boundaries in thescene have been extracted, and in the central clus-ter of buildings (see areaA in Figure 4) the seg-mentation is nearly perfect.
There were some false positives - polygonsextracted that do not in fact delineate the bound-aries of a roof. The most obvious example is theset of overlapping polygonal rooftops detectedover the large building with many parallel roofvents (markedB in Figure 4). Nevertheless itshould be noted that the correct outer boundary ofthis building roof is detected. The set of parallel
Figure 3. Corners and lines are represented in afeature relation graph with perceptually compatiblecorners linked.

roof vents on this building, coupled with the closeproximity of other buildings and three tall smoke-stacks (and their shadows!) that occlude and frag-ment the building boundary in many of the images,make this one of the most challenging buildings inthe site for rooftop detection, epipolar matching,and intensity mapping. The detection of these roofvents typifies a common problem of false alarms,where significant rooftop details are extracted asrooftop hypotheses in their own right. At the levelof 2D polygon extraction, it is difficult to providean effective method to distinguish between roofsand roof substructures; however, three-dimensionalinformation introduced in subsequent stages ofprocessing may provide the additional informationnecessary for making this decision.
There are also some false negatives, which arebuildings that should have been detected, but werenot. The most prevalent example of this is a set ofbuildings (seeC) that are only partially in view atthe edge of the image. Since image boundaries arenot used as possible lines, these buildings cannotpossibly generate complete polygons, and thus
Figure 4. Rooftop hypotheses extracted from model board image J3. Alphabetic labels are referred toin the text.
A
B
C
D
E
should not really be considered as failures.Although the current system is designed to detectonly complete building models, subsequent epipo-lar feature matching and multi-image line triangu-lation routines are able to handle partial building“fragments”, and therefore future control strategiescould be developed to allow merging of partialbuilding wireframes produced from differentimages into a single building model [Jaynes, com-panion chapter in this book]. LabelD marks afalse negative that is in full view. Two adjacentcorners in the rooftop polygon were missed by thecorner extraction algorithm. Although a top-downvirtual feature hypothesis can be invoked to inserta single missing corner in an incomplete rooftoppolygon, there is currently no recovery mechanismwhen two adjacent corners are missing. It shouldbe stressed that even though a single image wasused here for bottom-up hypotheses, buildings thatare not extracted in one image will often be foundeasily in other images with different viewpointsand sun angles (see Section 4).

There are several cases that cannot be strictly clas-sified as false positives or false negatives. Severalsplit-level buildings appearing along the right edgeof the image (for exampleE and the buildingabove) are outlined with single polygons ratherthan with one polygon per roof level. Somepeaked roof buildings were also outlined (at thebottom right, for example), even though they donot conform to the assumptions underlying thisversion of the system.
2.3 Multi-image Epipolar Matching
After detecting a potential rooftop in one image,corroborating geometric evidence is sought inother images (often taken from widely differentviewpoints) via epipolar feature matching. Roof-top polygons are matched by searching for eachcomponent 2D line segment separately and thenfusing the results. For each polygon segment fromone image, an epipolar search area is formed ineach of the other images, based on the known cam-era projection equations and the assumption thatthe roof is flat. This quadrilateral search area isscanned for possible matching line segments, eachpotential match implying a different height of a 3Droofline in the scene (see Figure 5). Results fromeach line search are combined in a one-dimen-sional histogram, with each 2D match voting for arange of 3D roof heights centered at each match,weighted by compatibility of the match in terms ofexpected line segment orientation and length. Thisapproach allows fragmented line data to be handled
Figure 5. Matches of a reference line segment in oneimage are found in other images. Each match contributesa Guassian-weighted vote into a 1D height histogram forthe roof surface.
FIRST IMAGE
H
min H
max H
SECOND IMAGE
Height Histogram : H
ComputedRoof Height
H
Vot
es
correctly without any knowledge or additional pro-cessing, since the combined votes of all subpiecesof a fragmented line count the same as the vote of afull-sized, unfragmented line.
A single global histogram accumulates heightvotes from multiple edges in a rooftop polygonacross multiple images. After all votes have beentallied, the histogram bucket containing the mostvotes yields an estimate of the 3D height of theroof polygon in the scene, as well as the set of cor-respondences between rooftop edges and imageline segments in multiple views. The reader shouldnote that building rooftops are assumed to be hori-zontal relative to the ground plane, thus the match-ing algorithm is able to use a simple one-dimensional height histogram for collecting votes.The approach is not limited to this assumption,however, and can be extended to vote for planarsurfaces at other orientations using a multidimen-sional histogram.
Minimum and maximum values for the epipolarheight histogram are chosen by the user based onwhatever collateral or assumed knowledge is avail-able. These set the bounds for the epipolar searchregion, and if they are set too wide could reduce thelikelihood of finding a clear, unique peak due to theintroduction of numerous incorrect matches. Forthe Model Board 1 experiment, the minimum andmaximum height values were set at -92 ft and 146ft, respectively, and the histogram contained 24buckets with a height range of roughly 12 feet perbucket. After epipolar voting is completed for arooftop polygon, line segment correspondences areextracted from the histogram bucket containing thehighest number of votes and those buckets immedi-ately adjacent to it. Epipolar matching of a rooftophypothesis is considered to have failed when, forany edge in the rooftop polygon, no line segmentcorrespondences are found in any image. Based onthis criterion, epipolar matching failed on eightrooftop polygons in this example. Six were eitherpeaked or multi-layer roofs that did not satisfy ourassumption of generic flat-roofed building models,and the other two were building fragments withsome sides shorter than the minimum lengththreshold applied to the line segment data. Whenmulti-level or peaked roof buildings vote in theepipolar matching process, their votes get diluteddue to lines occuring at different heights, and there-fore no clear peak can be found. This automati-

cally filters out buildings that do not have flatroofs. Note, however, that epipolar matching canalso be applied to individual polygon edges ratherthan all of them, leading to a mechanism forextracting horizontal lines at different heightsalong the boundaries of multi-level roofs [Jaynes,attached companion paper].
At this stage in the experiment we also removedsix obviously incorrect building hypotheses byhand. Five of them comprised the set of overlap-ping polygons within the building labeledB inFigure 4. The sixth was the fenced in area appear-ing directly below labelD in that image. Typically,false hypotheses intersect correct hypotheses and asimple arbitration scheme can be used to removethe conflicting building model with the lowest con-fidence measure. Detecting and removing suchconflicts automatically in this manner is a recentimprovement to the system that was not in place atthe time this example was run.
2.4 Multi-image Line Triangulation
Multi-image triangulation is performed to deter-mine the precise size, shape, and position of abuilding in the local 3D site coordinate system.Object-level constraints such as perpendicularityand coplanarity are imposed on the solution toassure reliable results. This algorithm is used fortriangulating 3D rooftop polygons from the linesegment correspondences determined by epipolarfeature matching.
The parameters estimated for each rooftop polygonare shown in Figure 6. The horizontal plane con-
taining the polygon is parameterized by a singlevariableZ. The orientation of the rectilinear struc-ture within that plane is represented by a singleparameterθ. Finally, each separate line within thepolygon is represented by a single valuer i repre-senting the signed perpendicular distance of thatline from some nominal point in the plane. Therepresentation is simple and compact, and the nec-essary coplanarity and rectangularity constraints onthe polygon’s shape are built in. (A more generalapproach based on the Plucker coordinate repre-sentation of 3D lines has also been implementedfor triangulating general wireframe structures[Cheng94]).
A standard Levenberg-Marquardt algorithm isemployed to determine the set of polygon parame-ters that minimize an objective “fit” function thatmeasures how well each projected rooftop edgealigns with the 2D image segments that correspondto it. Such nonlinear estimation algorithms typi-cally require an initial estimate that is then itera-tively refined. In this system, the original 2Drooftop polygon extracted by the building detector,and the roof height estimate computed by the epi-polar matching algorithm, are used to generate theinitial flat-roofed polygon estimate. After triangu-lation, each refined 3D roof polygon is thenextruded down to the ground to form a volumetricmodel. For the Model Board 1 site, the ground wasrepresented as a horizontal plane with Z-coordinatevalue determined from the ground truth measure-ments. More generally, the system can use digitalelevation maps produced by the UMass TerrainReconstruction System [Schultz94], or any otheravailable terrain map that is sufficiently accurate.
Figure 6. (a) Multiple views are used as input to constrain a nonlinear estimation algorithm thatenforces geometric constraints of perpend-icularity and coplanarity. (b) Parameterization of aflat, rectlinear polygon for multi-image rooftop triangulation.
Z
x
y
z
r1r2
r3 r4
θ

Outlines of the final set of triangulated rooftops areshown in Figure 7. The rightmost polygon in theimage is noticeably incorrect. This polygon actu-ally corresponds to a split-level building contain-ing two roofs at different heights in the scene.Most multi-level buildings were automatically fil-tered out during epipolar matching, but this onemanaged to survive. To evaluate the 3D accuracyof the triangulated building polygons, 21 roof ver-tices were identified where ground truth measure-ments are known (numbered vertices in Figure 7).The average Euclidean distance between triangu-lated polygon vertices and their ground truth loca-tions is 4.31 feet, which is reasonable given thelevel of artificially introduced geometric distortionpresent in the images. The average horizontal dis-tance error is 3.76 feet, while the average verticalerror is only 1.61 feet. This is understandable,since all observed rooftop lines are consideredsimultaneously when estimating the buildingheight (vertical position), whereas the horizontalposition of a rooftop vertex is primarily affectedonly by its two adjacent edges. In most cases, the
vertical position of a vertex is constrained by atleast twice as many lines as the horizontal position.
2.5 Projective Intensity Mapping
Backprojection of image intensities onto polygonalfaces of building models enhances their visual real-ism and also provides a convenient storage mecha-nism for later symbolic extraction of detailedsurface structure. Planar projective transforma-tions provide a mathematical description of howsurface structure from a planar building facet mapsinto a perspective image. By inverting this trans-formation using known building position and cam-era transformations, intensity information fromeach image is backprojected to “paint” the wallsand roof of the building model. Since multipleimages are used, intensity information from many(sometime all) faces is available, even though theyare not all visible from any single view. The result-ing intensity-mapped site model can then be ren-dered to predict how the scene will appear from anew view, and on high-end workstations realisticreal-time “fly-throughs” are achievable.
Figure 7. Reprojection of 3D triangulated rooftops back into image J3. Numerical labels mark roofvertices where ground truth measurements are known.
10
4749
68
67
69
70
71
74
75
41
42
40 39
43
17
18
37
90
79
22

For each of the 25 volumetric building modelsextracted from Model Board 1, a set of intensitymaps was generated for each planar facet by pro-jectively mapping intensity values from the imagesin which the facet is visible. When multipleimages showing a single building facet are avail-able (the typical case for building rooftops), a com-posite intensity map is automatically generated tosynthesize the best available image information ateach point in terms of resolution and contrast. Thisprocess is described in detail in [Wang96].Figure 8 shows an example of a generated site dis-play of Model Board 1 using automatically derivedbuilding models and intensity maps.
Although intensity mapping enhances the virtualrealism of graphic displays, this illusion of realismis greatly reduced as the observer’s viewpointcomes closer to the rendered object surface, or asthe viewing orientation becomes significantly dif-ferent than the sensor viewpoint used to producethe texture map. For example, a highly obliqueview of a wall will not produce effective texturemaps for generating perpendicular views. What isneeded to go beyond simple intensity mapping isexplicit, symbolic extraction and graphical modelinsertion of detailed surface structures such as win-dows, doors and roof vents. Backprojected inten-sity maps provide a convenient starting point, sincerectangular lattices of windows or roof vents canbe searched for without complication from the
Figure 8. Rendered view of the acquired Model Board 1 site model.
effects of perspective distortion, and model-basedextraction of surface structure can be applied onlywhere relevant, i.e. window and door extractioncan be focused on wall intensity maps, while roofvent computations are performed only on roofs.As one example, a generic algorithm has beendeveloped for extracting windows and doors onwall surfaces, based on a rectangular region grow-ing method applied at local intensity minima in theunwarped intensity map. Extracted window anddoor hypotheses are used to compose a refinedbuilding model that explicitly represents thosearchitectural details. An example is shown inFigure 9. The windows and doors have been ren-dered as dark and opaque, but since they are nowsymbolically represented, it would be possible torender the windows with glass-like properties suchas transparency and reflectivity.
Figure 9. Detailed building model rendered usingsymbolically extracted windows and doors.

3.0 Evaluation on Fort Hood
The success of the Ascender system will ultimatelybe judged by its performance on classified imagery.As of this writing, a series of such tests is beingperformed at Lockheed-Martin and at the NationalExploitation Lab (NEL). In parallel with thateffort, UMass is performing an in-depth, quantita-tive system evaluation using unclassified data.This section summarizes the results of an evalua-tion on a large data set from Fort Hood, Texas. Amore detailed description of this experiment can befound in [Collins96].
An evaluation data set was cropped from the FortHood imagery to yield seven subimages with vary-ing viewpoints (two nadir views: 711 and 713, twoslightly off-nadir views: 525 and 927, and threeoblique views: 1025, 1125 and 1325). Groundsample distances are roughly 0.3 meters for thenadir views, 0.6 meters for the off-nadir views, and1.0 meter for the oblique views. The region ofoverlap for the evaluation area covers roughly760x740 meters, containing a good blend of bothsimple and complex roof structures. Thirty groundtruth building models were created by hand usinginteractive modelling tools provided by the
RADIUS Common Development Environment(RCDE) [Mundy92]. Each building is composedof RCDE “cube”, “house” and/or “extrusion”objects that were shaped and positioned to projectas well as possible (as determined by eye) simulta-neously into the set of seven images. The groundtruth data set is overlaid on one of the nadir viewsin Figure 10. Some 3D building models producedautomatically by the Ascender system on thisdataset are shown in Figure 11.
Since the Ascender system explicitly recovers onlyrooftop polygons (the rest of the building wire-frame is formed by vertical extrusion), the evalua-tion is based on comparing detected 2D andtriangulated 3D roof polygons vs. their groundtruth counterparts. There are 73 ground truth roof-top polygons among the set of 30 buildings.Ground truth 2D polygons for each image aredetermined by projecting the ground truth 3D poly-gons into that image using the known camera pro-jection equations.
3.1 Evaluation of 2D Detection Rates
One important module of the Ascender system isthe 2D polygonal rooftop detector. The detector
Figure 10. Fort Hood evaluation area with 30 ground truth building models. There are 73 rooffacets in all.

was tested on four images from the test set (twonadir, two slightly off-nadir) to see how well it per-formed at different grouping sensitivity settings,and with different length and contrast settings ofthe Boldt line extraction algorithm. The detectorwas tested by projecting each ground truth roofpolygon into an image, growing its 2D boundingbox out by 20 pixels on each side, then invokingthe building detector in that region to hypothesize2D rooftop polygons. The evaluation goal of thisexperiment was to determine the true positivedetection ratewhen the building detector wasinvoked on an area containing a building.
Graph 1 plots the number of true positive hypothe-ses produced by the building detector on each ofthe four images, for nine different sensitivity set-tings ranging from 0.1 to 0.9 (very low to veryhigh) that control the perceptual grouping pro-cess. The line segments used were computed bythe Boldt algorithm with length and contrastthresholds of 10. This set of lines was deemed areasonable trade-off between reducing computa-tion in generating the initial feature set of lines andextracting the required information for buildingdetection. For the highest sensitivity setting, thepercentage of rooftops detected was 51% and 59%respectively for the two nadir views, and 45% and47% for the two off-nadir views. The graph alsoshows the number of true positives achieved bycombining the hypotheses from all four images,
Figure 11. Sample building models extracted automatically by the Ascender system.
either by pooling hypotheses computed separatelyfor each image, or by recursively masking out pre-viously detected buildings and focusing on theunmodeled areas in each new image. For the high-est sensitivity setting, this strategy detects 81% (59out of 73) of the rooftops in the scene.
To measure the best possible performance of therooftop detector on this data, it was run on all fourimages at sensitivity level 0.9, using a more com-plete set of Boldt line data computed with lengthand contrast thresholds of 5. These were judged tobe the highest sensitivity levels for both lineextractor and building detector that were feasible,and the results represent the best possible perfor-
Graph 1. Building detector sensitivity vs. number oftrue positives. The horizontal line marks the actualnumber of ground truth polygons. Combining resultsfrom all four views yields a “best” detection rate of81% for Boldt lines of length > 10, and 97% with linesof length > 5.
.1 .2 .3 .4 .5 .6 .7 .8 .9
10
20
30
40
50
60
70
80
90
73 ground truth polygons
Detector Sensitivity
Num
ber
of P
olyg
ons
525927711713
combinedL>10, 81%
combinedL>5, 97%
mance of the building detector on each image. Thepercentages of rooftops detected in each of the fourimages under these conditions were 86%, 84%,74%, and 67%, with a combined image detectionrate of 97% (71 out of 73).
3.2 Evaluation of 3D Accuracy
The second major subsystem in Ascender takes 2Droof hypotheses detected in one image and recon-structs 3D rooftop polygons via multi-image linesegment matching and triangulation. The finalreconstruction accuracy depends on the numberand geometry of the views used, and also on the 2Dimage accuracy of the hypothesized roof polygons.An evaluation experiment was performed to deter-mine the typical end-to-end performance of thesystem by taking the true positive 2D polygonsdetected in the last section for each of the fourviews, and performing matching and triangulationusing the other six views.
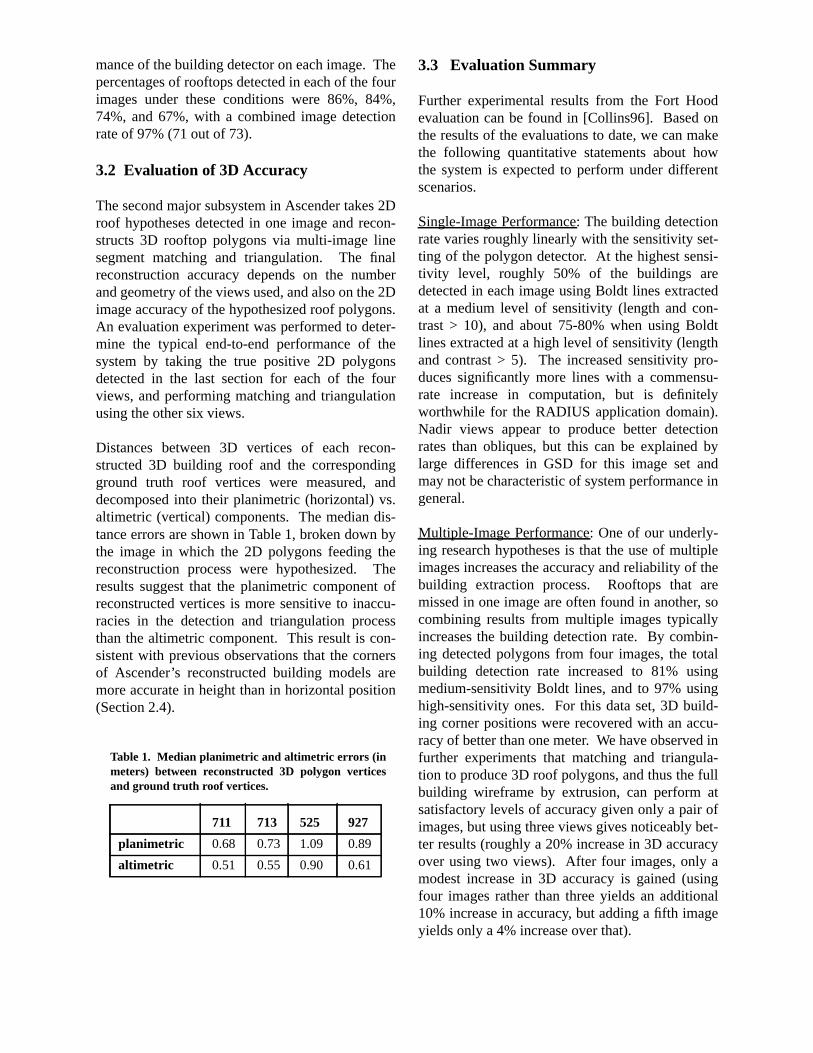
Distances between 3D vertices of each recon-structed 3D building roof and the correspondingground truth roof vertices were measured, anddecomposed into their planimetric (horizontal) vs.altimetric (vertical) components. The median dis-tance errors are shown in Table 1, broken down bythe image in which the 2D polygons feeding thereconstruction process were hypothesized. Theresults suggest that the planimetric component ofreconstructed vertices is more sensitive to inaccu-racies in the detection and triangulation processthan the altimetric component. This result is con-sistent with previous observations that the cornersof Ascender’s reconstructed building models aremore accurate in height than in horizontal position(Section 2.4).
Table 1. Median planimetric and altimetric errors (inmeters) between reconstructed 3D polygon verticesand ground truth roof vertices.
711 713 525 927
planimetric 0.68 0.73 1.09 0.89
altimetric 0.51 0.55 0.90 0.61
3.3 Evaluation Summary
Further experimental results from the Fort Hoodevaluation can be found in [Collins96]. Based onthe results of the evaluations to date, we can makethe following quantitative statements about howthe system is expected to perform under differentscenarios.
Single-Image Performance: The building detectionrate varies roughly linearly with the sensitivity set-ting of the polygon detector. At the highest sensi-tivity level, roughly 50% of the buildings aredetected in each image using Boldt lines extractedat a medium level of sensitivity (length and con-trast > 10), and about 75-80% when using Boldtlines extracted at a high level of sensitivity (lengthand contrast > 5). The increased sensitivity pro-duces significantly more lines with a commensu-rate increase in computation, but is definitelyworthwhile for the RADIUS application domain).Nadir views appear to produce better detectionrates than obliques, but this can be explained bylarge differences in GSD for this image set andmay not be characteristic of system performance ingeneral.
Multiple-Image Performance: One of our underly-ing research hypotheses is that the use of multipleimages increases the accuracy and reliability of thebuilding extraction process. Rooftops that aremissed in one image are often found in another, socombining results from multiple images typicallyincreases the building detection rate. By combin-ing detected polygons from four images, the totalbuilding detection rate increased to 81% usingmedium-sensitivity Boldt lines, and to 97% usinghigh-sensitivity ones. For this data set, 3D build-ing corner positions were recovered with an accu-racy of better than one meter. We have observed infurther experiments that matching and triangula-tion to produce 3D roof polygons, and thus the fullbuilding wireframe by extrusion, can perform atsatisfactory levels of accuracy given only a pair ofimages, but using three views gives noticeably bet-ter results (roughly a 20% increase in 3D accuracyover using two views). After four images, only amodest increase in 3D accuracy is gained (usingfour images rather than three yields an additional10% increase in accuracy, but adding a fifth imageyields only a 4% increase over that).

4.0 Site Model Extension
After an initial site model has been acquired, it maybe necessary to periodically update it based on newimagery. New buildings may have been built at thesite, and old buildings may have been destroyed.This section briefly addresses the problem ofextending a site model database to include build-ings that were previously unmodeled, eitherbecause they were not detected in previous images,or because they were recently constructed. Themain difference between model extension andmodel acquisition is that now a partial site modelexists that can be used to guide the processing ofnew images. In particular, camera pose for eachimage can be determined via model-to-image reg-istration. Our approach to model-to-image regis-tration involves two components: model matchingand pose determination.
The goal ofmodel matching is to find the corre-spondence between 3D features in a site model and2D features that have been extracted from animage; in this case determining correspondencesbetween edges in a 3D building wireframe and 2Dextracted line segments from the image. Themodel matching algorithm described in[Beveridge95] is used. Based on a local searchapproach to combinatorial optimization, this algo-rithm searches the discrete space of correspon-dence mappings between model and image linefeatures for one that minimizes a match error func-tion. The match error depends upon how well theprojected model geometrically aligns with the data,as well as how much of the model is accounted forby the data. The result of model matching is a setof correspondences between model edges andimage line segments, and an estimate of the trans-formation that brings the projected model into thebest possible geometric alignment with the under-lying image data.
The second aspect of model-to-image registrationis precisepose determination. It is important tonote that since model-to-image correspondencesare being found automatically, the pose determina-tion routine must take into account the possibilityof outliers (gross mistakes) in the set of correspon-dences found. The robust pose estimation proce-dure described in [Kumar94] is used. At the heartof this code is an iterative, weighted least-squares
algorithm for computing pose from a set of corre-spondences that are assumed to be free from outli-ers. The pose parameters are found by minimizingan objective function that measures how closelythe projected model features map to their corre-sponding image features. Since it is well knownthat least squares optimization techniques can failcatastrophically when outliers are present in thedata, this basic pose algorithm is embedded insidea least-median-squares (LMS) procedure thatrepeatedly samples subsets of correspondences tofind one devoid of outliers. LMS is robust overdata sets containing up to 50% outliers. The finalresults of pose determination are a set of camerapose parameters and a covariance matrix that esti-mates the accuracy of the solution.
This process is illustrated using the partial sitemodel constructed in Section 2, and image J8 fromthe Radius Model Board 1 dataset. Results ofmodel-to-image registration of image J8 with thepartial site model can be seen in Figure 12, whichshows projected building rooftops from the sitemodel (thin lines) overlaid on the image. It isimmediately apparent that the current model doesnot account for all the building structures in thenew image. To extend the site model, image areascontaining known buildings were masked off, andthe Ascender system was run on the unmodeledareas to hypothesize an additional set of 3D volu-metric building models. These were added to thesite model database to produce the extended model,shown projected into Figure 12 (thick lines). Mostof the buildings that remain unmodeled are locatedat the periphery of the site. Since this area is notvisible in many of the eight views, these buildingsfail to generate the necessary multi-image evidencethat is needed for construction of a high-confidence3D building hypothesis. If more images were usedwith greater site coverage, most of these buildingswould appear in the 3D site model.
5.0 Conclusion
An extensive research effort is underway at UMassto develop capabilities for automated 3D site mod-eling from aerial images. The Ascender system hasbeen developed to extract and model flat-roofed,rectilinear buildings from multiple views. Version1.0 of Ascender has been delivered to Lockheed-Martin for testing on classified imagery and for

Figure 12. Updated site model projected onto image J8. Thin lines denote the registeredpartial site model. Thick lines delineate buildings that were automatically detected and addedvia model extension.
integration into the RADIUS Testbed. An evalua-tion of Ascender on an unclassified data set of FortHood has been performed at UMass. The resultssuggest that the system performs reasonably wellin terms of detection rate and accuracy, and thatperformance degrades gracefully when the numberof images used is small. Much more testing will beneeded to determine how the system performsunder various weather and viewing conditions, inorder to formulate a set of recommendations as tohow and when to use the system.
Algorithms and strategies for extracting other com-mon building classes with peaked, curved andmulti-level flat roofs are currently being developedand tested for eventual inclusion into future ver-sions of Ascender. Much of this new research isdescribed in [Jaynes, companion paper in this vol-ume]. Moving beyond a single control strategy fordetecting a single class of buildings brings to theforefront complex issues of context-sensitive con-trol strategies, model class selection, data fusion,and hypothesis arbitration, and these topics are thefocus of our current research efforts.
Bibliography
[Beveridge95] J.R.Beveridge and E.Riseman,“Optimal Geometric Model Matching underFull 3D Perspective,”CVGIP: Image Under-standing, Vol.61(3), 1995, pp.351-364.
[Boldt89] M.Boldt, R.Weiss and E.Riseman,“Token-Based Extraction of Straight Lines,”IEEE Transactions on Systems, Man andCybernetics, Vol.19(6), 1989, pp.1581-1594.
[Cheng94] Y.Cheng, R. Collins, A. Hanson and E.Riseman, “Triangulation Without Correspon-dences,”ARPA Image Understanding Work-shop, Monterey, CA, 1994, pp.993-1000.
[Collins96] R.Collins, A.Hanson, E.Riseman,C.Jaynes, F.Stolle, X.Wang, and Y.Cheng,“UMass Progress in 3D Building ModelAcquisition,” ARPA Image UnderstandingWorkshop, Palm Springs, CA, Feb.1996,pp.305-315.
[Collins93] R.Collins, A.Hanson, E.Riseman andY.Cheng, “Model Matching and Extension forAutomated 3D Site Modeling,”DARPA Image

Understanding Workshop, Washington, DC,April 1993, pp.97-203.
[Jaynes94] C.Jaynes, F.Stolle and R.Collins, “TaskDriven Perceptual Organization for Extractionof Rooftop Polygons,”IEEE Workshop onApplications of Computer Vision, Sarasota, FL,Dec.1994, pp.152-159.
[Kumar94] R.Kumar and A.Hanson, “RobustMethods for Estimating Pose and SensitivityAnalysis,” CVGIP: Image Understanding,Vol.60(3), Nov.1994, pp.313-342.
[Mundy92] J.Mundy, R.Welty, L.Quam, T.Strat,W.Bremner, M.Horwedel, D.Hackett andA.Hoogs, “The RADIUS Common Develop-ment Environment,”DARPA Image Under-standing Workshop, San Diego, CA, Jan.1992,pp.215-226.
[Schultz94] H.Schultz, “Terrain Reconstructionfrom Oblique Views,” ARPA Image Under-standing Workshop, Monterey, CA, Nov.1994,pp.1001-1008.
[Wang96] X.Wang, W.J.Lim, R.Collins andA.Hanson, “Automated Texture Extractionfrom Multiple Images to Support Site ModelRefinement and Visualization,”Proc. Com-puter Graphics and Visualization, Plzen,Czech Republic, 1996.