The Turkish economy and the evolution of the financial sector · The Turkish economy and the...
20
Matteo Ferrazzi, Unicredit Group Rome, 22 February 2011 The Turkish economy and the evolution of the financial sector
Transcript of The Turkish economy and the evolution of the financial sector · The Turkish economy and the...
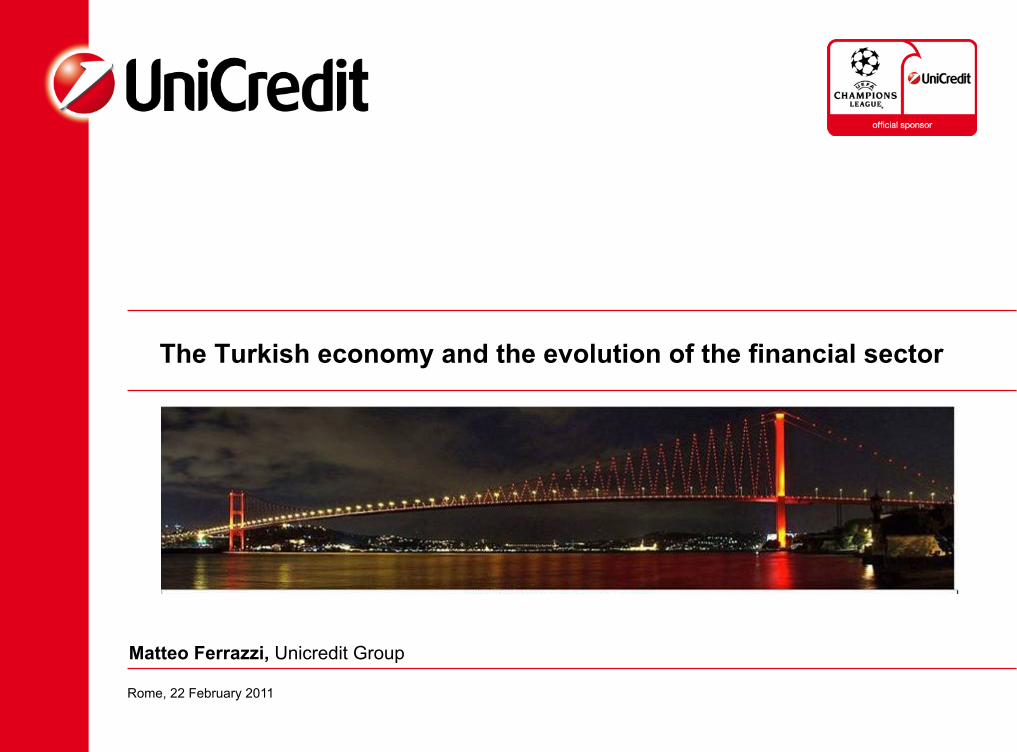
Matteo Ferrazzi, Unicredit Group
Rome, 22 February 2011
The Turkish economy and the evolution of the financial sector
2
AGENDA
The Turkish economy
From crisis to solidity: the Turkish banking sector during the last decade
The Italian presence in Turkey
The Turkish economy is running fast ….
Turkish GDP grew by around 7-8% in 2010 – the fastest growing economy in Europe and among the top20 fastest economies worldwide
Lending growth is at full steam: around +35% yoy in 2010 (deposit growth around +20% yoy; profits +9% yoy)
4
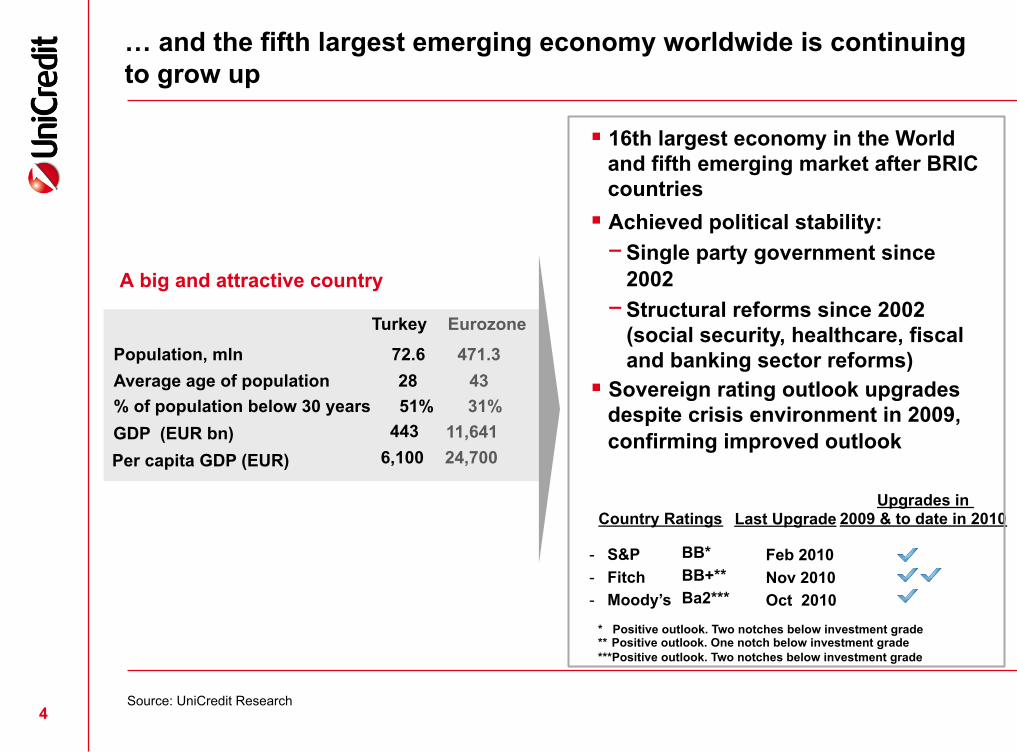
A big and attractive country Turkey
Population, mln 72.6 471.3
Per capita GDP (EUR) 6,100 24,700 GDP (EUR bn) 443
Average age of population 28 43 % of population below 30 years 51% 31%
11,641
16th largest economy in the World and fifth emerging market after BRIC countries
Achieved political stability: − Single party government since
2002 − Structural reforms since 2002
(social security, healthcare, fiscal and banking sector reforms)
Sovereign rating outlook upgrades despite crisis environment in 2009, confirming improved outlook
Eurozone
- S&P - Fitch - Moody’s
Country Ratings Upgrades in
2009 & to date in 2010
BB* BB+** Ba2***
* Positive outlook. Two notches below investment grade ** Positive outlook. One notch below investment grade ***Positive outlook. Two notches below investment grade
Last Upgrade
Feb 2010 Nov 2010 Oct 2010
… and the fifth largest emerging economy worldwide is continuing to grow up
4 Source: UniCredit Research
5
AGENDA
The Turkish economy
From crisis to solidity: the Turkish banking sector during the last decade
The Italian presence in Turkey
6
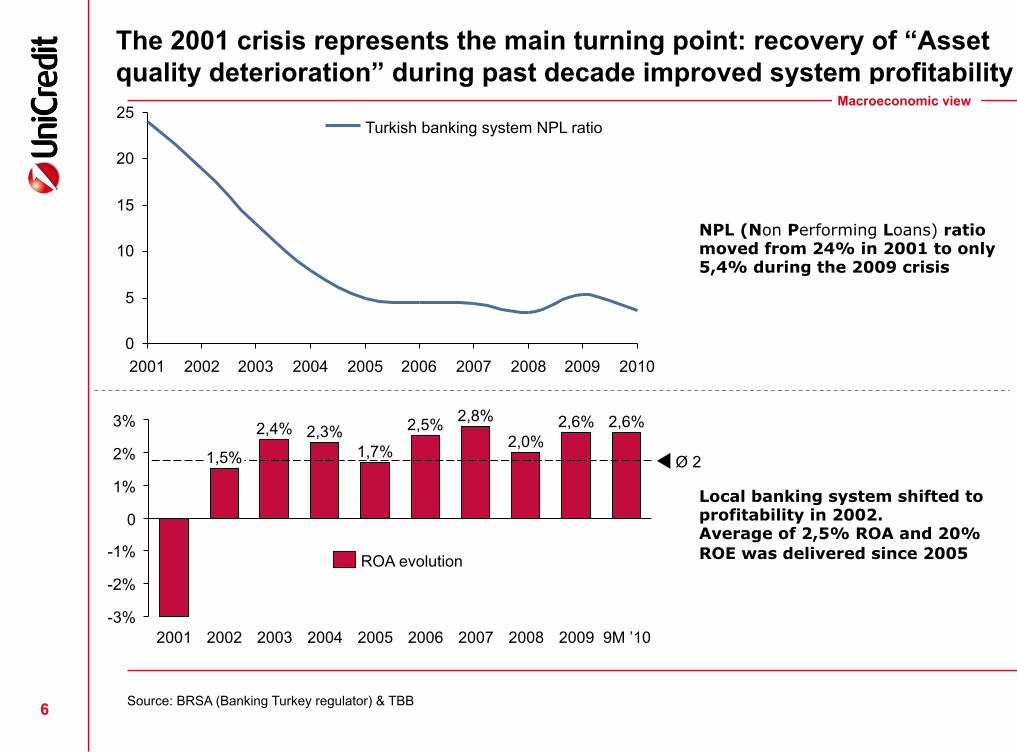
The 2001 crisis represents the main turning point: recovery of “Asset quality deterioration” during past decade improved system profitability
Turkey
Source: BRSA (Banking Turkey regulator) & TBB
0
5
10
15
20
25
2001 2002 2003 2004 2005 2006 2007 2008 2009 2010
Turkish banking system NPL ratio
NPL (Non Performing Loans) ratio moved from 24% in 2001 to only 5,4% during the 2009 crisis
2,4%
2002
1,5%
2001
3%
2%
1%
0
-1%
-2%
-3%
Ø 2
9M ’10
2,6%
2009
2,6%
2008
2,0%
2007
2,8%
2006
2,5%
2005
1,7%
2004
2,3%
2003
Local banking system shifted to profitability in 2002. Average of 2,5% ROA and 20% ROE was delivered since 2005 ROA evolution
Macroeconomic view
7
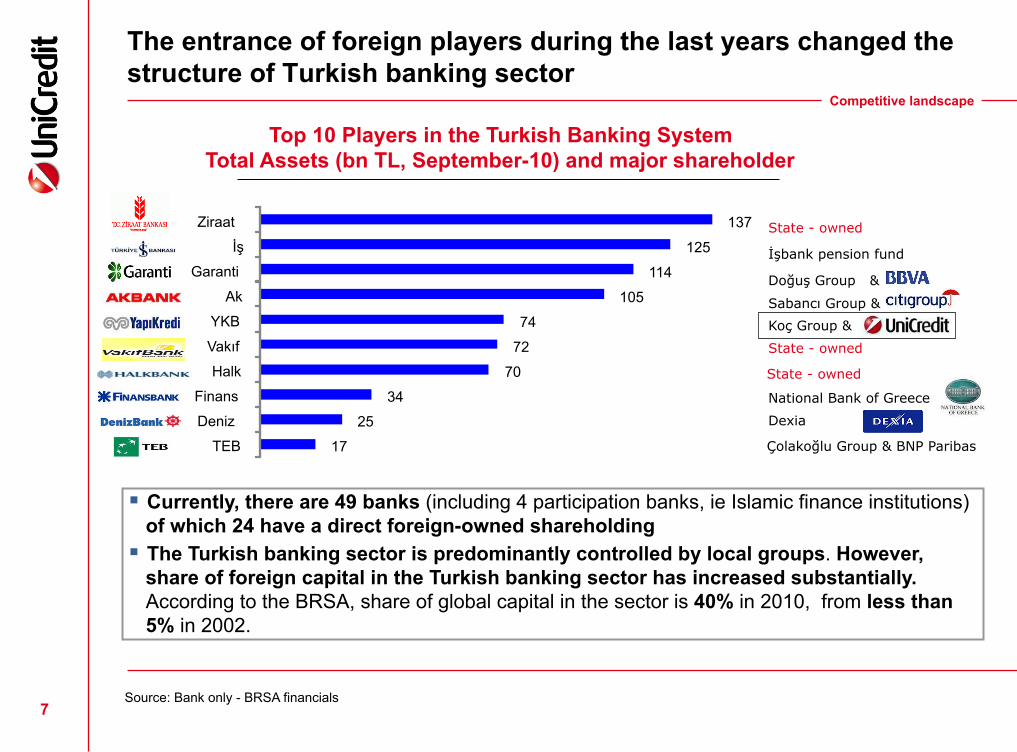
The entrance of foreign players during the last years changed the structure of Turkish banking sector
Competitive landscape
Source: Bank only - BRSA financials
Top 10 Players in the Turkish Banking System Total Assets (bn TL, September-10) and major shareholder
İşbank pension fund
State - owned
Sabancı Group &
Doğuş Group &
Koç Group &
State - owned
National Bank of Greece
Dexia
Çolakoğlu Group & BNP Paribas
Currently, there are 49 banks (including 4 participation banks, ie Islamic finance institutions) of which 24 have a direct foreign-owned shareholding
The Turkish banking sector is predominantly controlled by local groups. However, share of foreign capital in the Turkish banking sector has increased substantially. According to the BRSA, share of global capital in the sector is 40% in 2010, from less than 5% in 2002.
State - owned
137 125
114 105
74 72
70 34
25 17
Ziraat İş
Garanti Ak
YKB Vakıf Halk
Finans Deniz
TEB
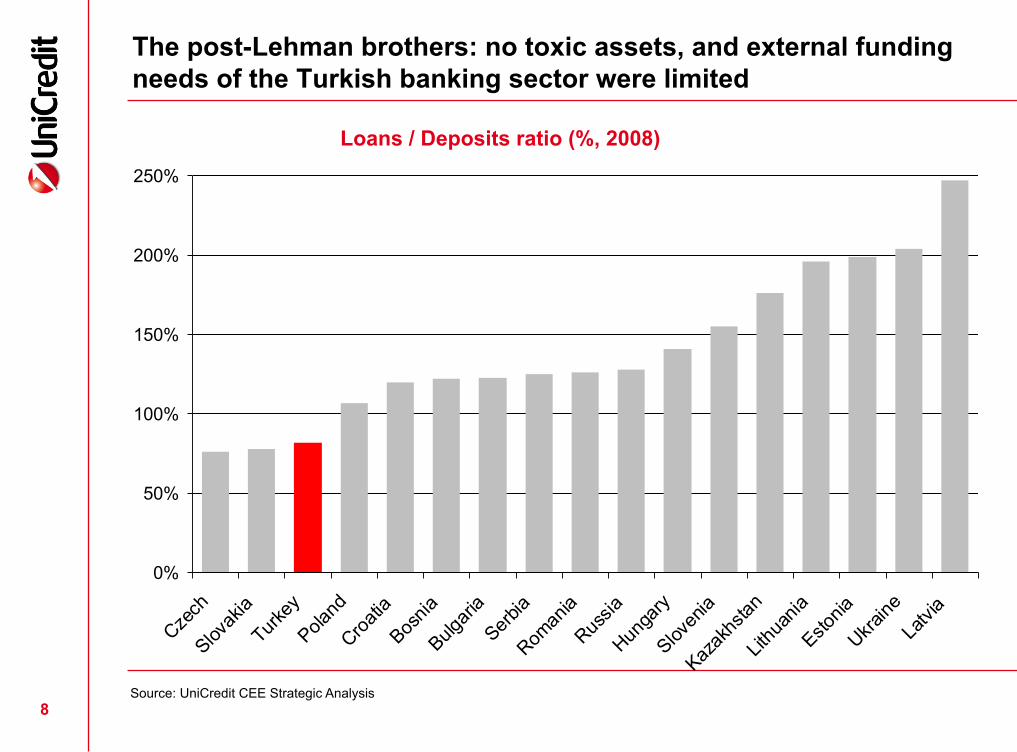
The post-Lehman brothers: no toxic assets, and external funding needs of the Turkish banking sector were limited
8
0%
50%
100%
150%
200%
250%
Czech
Slovakia
Turkey
Poland
Croatia
Bosnia
BulgariaSerbia
Romania
Russia
Hungary
Slovenia
Kazakhstan
Lithuania
Estonia
UkraineLatvia
Loans / Deposits ratio (%, 2008)
Source: UniCredit CEE Strategic Analysis
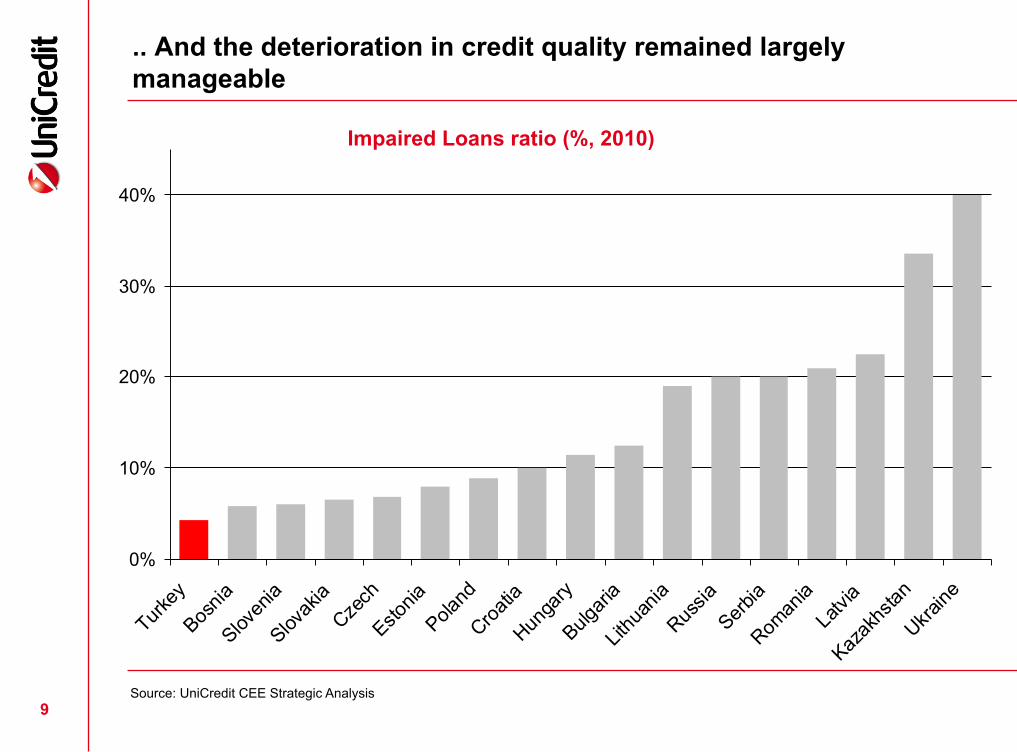
.. And the deterioration in credit quality remained largely manageable
9
0%
10%
20%
30%
40%
Turkey
Bosnia
Slovenia
SlovakiaCzech
Estonia
Poland
Croatia
Hungary
Bulgaria
Lithuania
RussiaSerbia
RomaniaLatvia
Kazakhstan
Ukraine
Impaired Loans ratio (%, 2010)
Source: UniCredit CEE Strategic Analysis
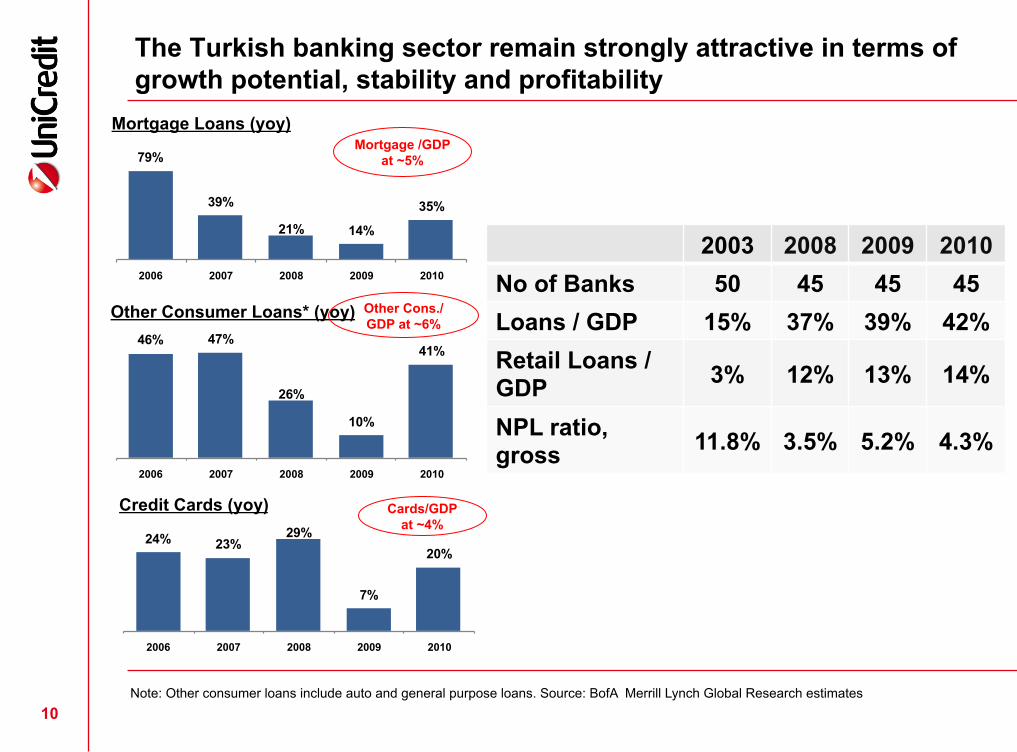
79%
39%
21% 14%
35%
2006 2007 2008 2009 2010
46% 47%
26%
10%
41%
2006 2007 2008 2009 2010
24% 23%29%
7%
20%
2006 2007 2008 2009 2010
The Turkish banking sector remain strongly attractive in terms of growth potential, stability and profitability
10
Mortgage Loans (yoy)
Other Consumer Loans* (yoy)
Credit Cards (yoy)
2003 2008 2009 2010 No of Banks 50 45 45 45 Loans / GDP 15% 37% 39% 42% Retail Loans / GDP 3% 12% 13% 14%
NPL ratio, gross 11.8% 3.5% 5.2% 4.3%
Mortgage /GDP at ~5%
Cards/GDP at ~4%
Other Cons./GDP at ~6%
Note: Other consumer loans include auto and general purpose loans. Source: BofA Merrill Lynch Global Research estimates 10
11
AGENDA
The Turkish economy
From crisis to solidity: the Turkish banking sector during the last decade
The Italian presence in Turkey
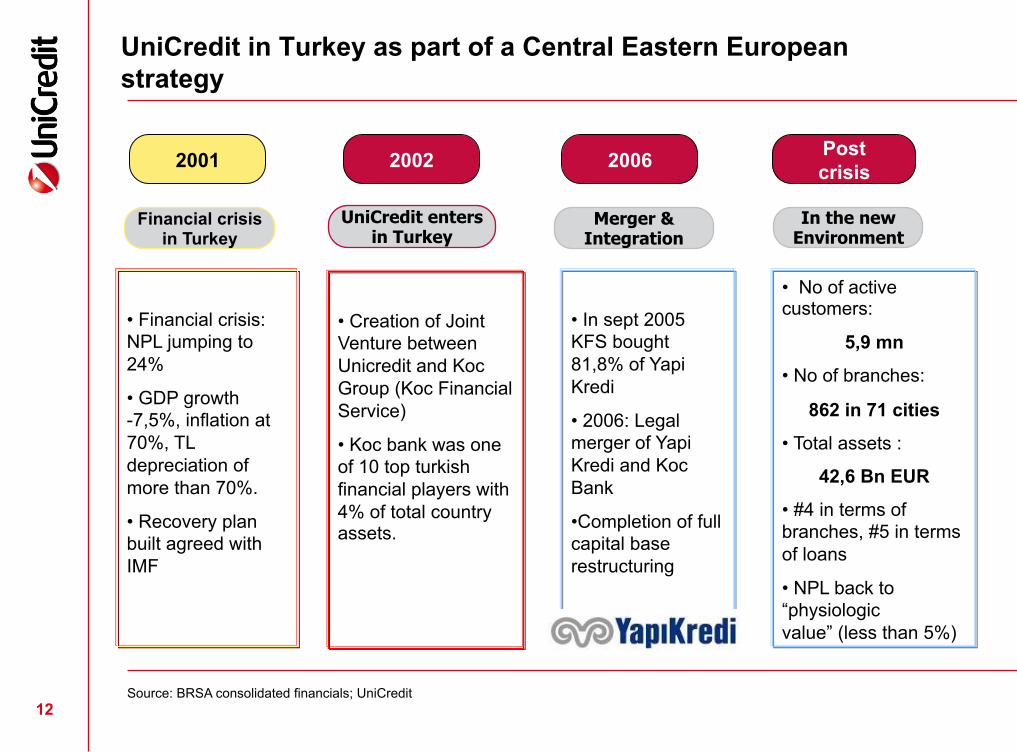
UniCredit in Turkey as part of a Central Eastern European strategy
2006
Post crisis
Merger &
Integration In the new
Environment
• In sept 2005 KFS bought 81,8% of Yapi Kredi
• 2006: Legal merger of Yapi Kredi and Koc Bank
• Completion of full capital base restructuring
2002
UniCredit enters in Turkey
• Creation of Joint Venture between Unicredit and Koc Group (Koc Financial Service)
• Koc bank was one of 10 top turkish financial players with 4% of total country assets.
• No of active customers:
5,9 mn
• No of branches:
862 in 71 cities
• Total assets :
42,6 Bn EUR
• #4 in terms of branches, #5 in terms of loans
• NPL back to “physiologic value” (less than 5%)
12 Source: BRSA consolidated financials; UniCredit
2001
Financial crisis in Turkey
• Financial crisis: NPL jumping to 24%
• GDP growth -7,5%, inflation at 70%, TL depreciation of more than 70%.
• Recovery plan built agreed with IMF
13
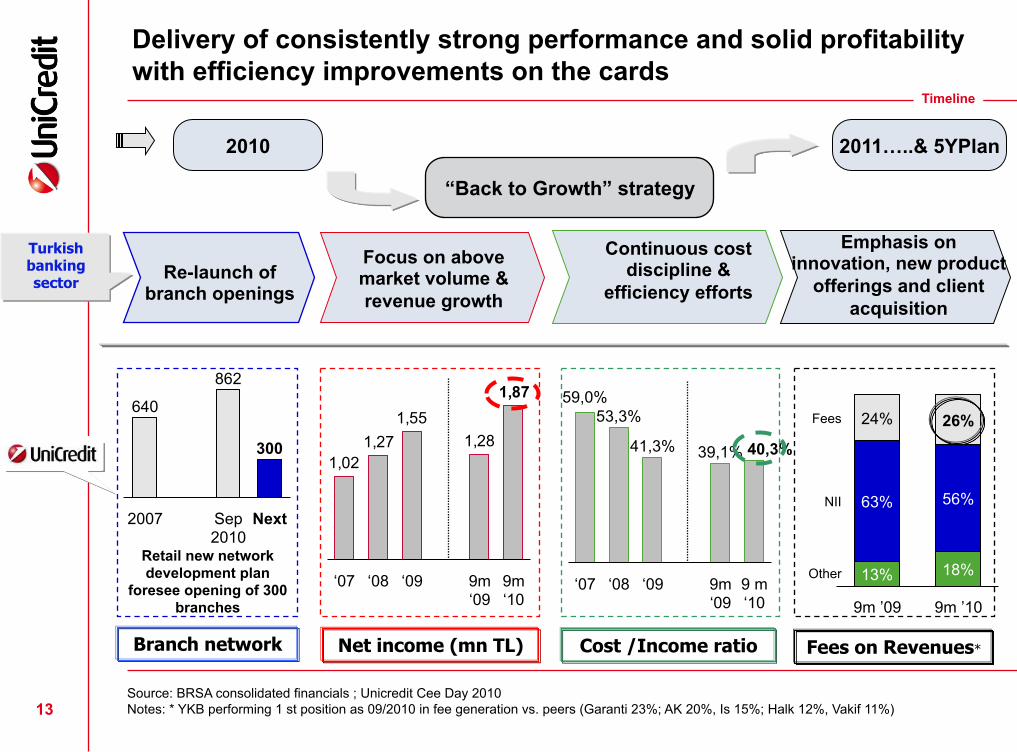
2010
“Back to Growth” strategy
Delivery of consistently strong performance and solid profitability with efficiency improvements on the cards
Re-launch of branch openings
Focus on above market volume & revenue growth
Continuous cost discipline &
efficiency efforts
Emphasis on innovation, new product
offerings and client acquisition
1,87
1,281,55
1,271,02
9m ‘10
9m ‘09
‘09 ‘08 ‘07 ‘09
53,3%
‘07
59,0%
41,3%
‘08 9m ‘09
39,1% 40,3%
9 m ‘10
Net income (mn TL) Cost /Income ratio Fees on Revenues* Branch network
862
2007
640
Next Sep 2010
300
Retail new network development plan
foresee opening of 300 branches
Other
Fees
NII
13%
24%
63%
26%
56%
18%
9m ’10 9m ’09
2011…..& 5YPlan
Source: BRSA consolidated financials ; Unicredit Cee Day 2010 Notes: * YKB performing 1 st position as 09/2010 in fee generation vs. peers (Garanti 23%; AK 20%, Is 15%; Halk 12%, Vakif 11%)
Timeline
Turkish banking sector
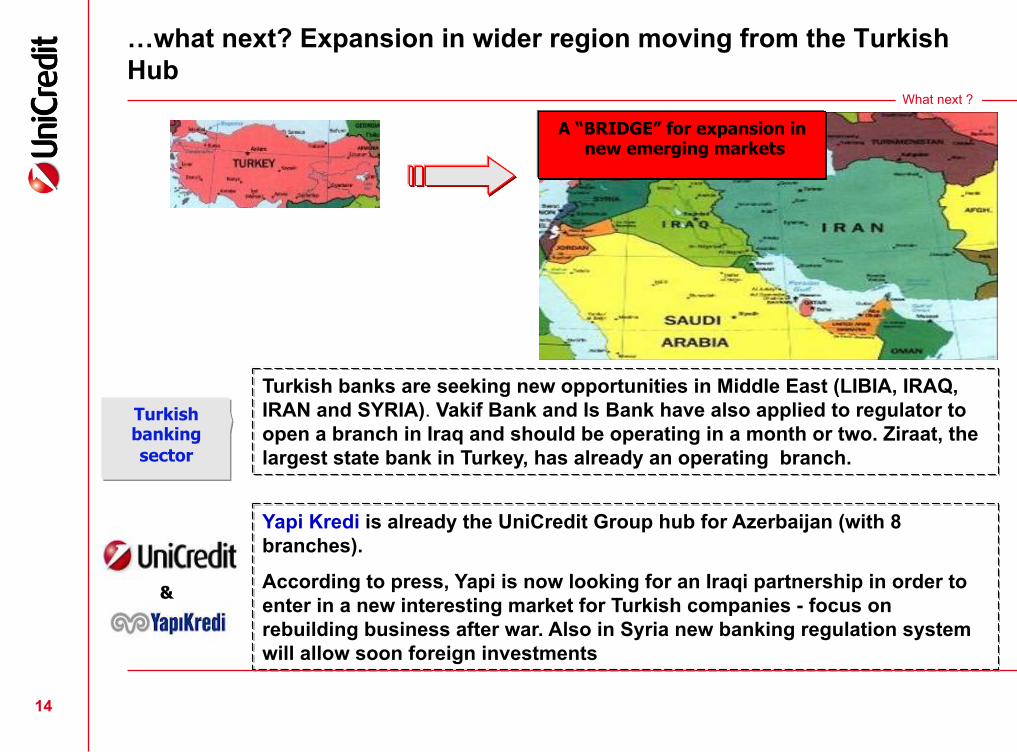
…what next? Expansion in wider region moving from the Turkish Hub
Yapi Kredi is already the UniCredit Group hub for Azerbaijan (with 8 branches).
According to press, Yapi is now looking for an Iraqi partnership in order to enter in a new interesting market for Turkish companies - focus on rebuilding business after war. Also in Syria new banking regulation system will allow soon foreign investments
14
Turkish banks are seeking new opportunities in Middle East (LIBIA, IRAQ, IRAN and SYRIA). Vakif Bank and Is Bank have also applied to regulator to open a branch in Iraq and should be operating in a month or two. Ziraat, the largest state bank in Turkey, has already an operating branch.
What next ?
A “BRIDGE” for expansion in new emerging markets
&
Turkish banking sector

Matteo Ferrazzi Tel. +39.334.6569238 [email protected]

ANNEX
17
What next ?
Source: BofA Merrill Lynch Global Research estimates
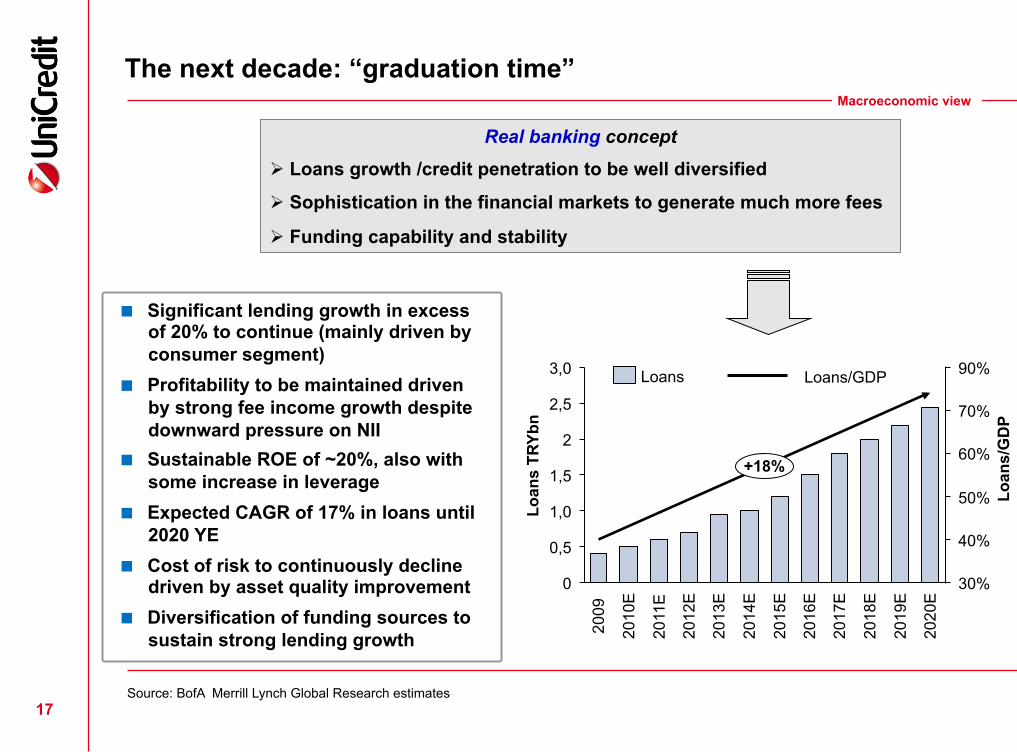
The next decade: “graduation time”
Real banking concept
Loans growth /credit penetration to be well diversified
Sophistication in the financial markets to generate much more fees
Funding capability and stability
Significant lending growth in excess of 20% to continue (mainly driven by consumer segment)
Profitability to be maintained driven by strong fee income growth despite downward pressure on NII
Sustainable ROE of ~20%, also with some increase in leverage
Expected CAGR of 17% in loans until 2020 YE
Cost of risk to continuously decline driven by asset quality improvement
Diversification of funding sources to sustain strong lending growth 20
12E
2011
E
2010
E
2009
2016
E
+18%
2017
E
2013
E
3,0
2
2014
E
2019
E
2015
E
90%
70%
60%
0,5
1,5
30%
50%
0
1,0
2020
E
40%
2018
E
2,5
Loans Loans/GDP
Loan
s/G
DP
Loan
s TR
Ybn
Macroeconomic view
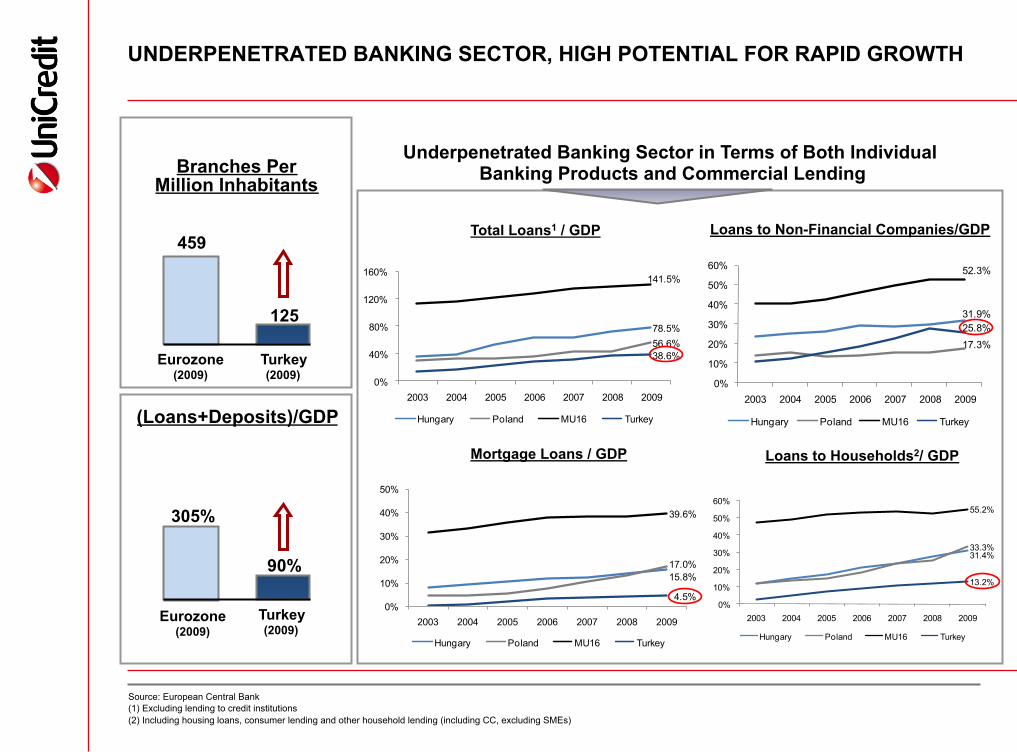
38.6%56.6%78.5%
141.5%
0%
40%
80%
120%
160%
2003 2004 2005 2006 2007 2008 2009
Hungary Poland MU16 Turkey
52.3%
31.9%25.8%17.3%
0%
10%
20%
30%
40%
50%
60%
2003 2004 2005 2006 2007 2008 2009
Hungary Poland MU16 Turkey
Branches Per Million Inhabitants
UNDERPENETRATED BANKING SECTOR, HIGH POTENTIAL FOR RAPID GROWTH
Eurozone (2009)
125
459
Turkey (2009)
90%
305%
(Loans+Deposits)/GDP
Turkey (2009)
Eurozone (2009)
Underpenetrated Banking Sector in Terms of Both Individual Banking Products and Commercial Lending
Source: European Central Bank (1) Excluding lending to credit institutions (2) Including housing loans, consumer lending and other household lending (including CC, excluding SMEs)
Loans to Non-Financial Companies/GDP
18
Mortgage Loans / GDP
Total Loans1 / GDP
Loans to Households2/ GDP
39.6%
17.0%15.8%
4.5%0%
10%
20%
30%
40%
50%
2003 2004 2005 2006 2007 2008 2009
Hungary Poland MU16 Turkey
55.2%
33.3%31.4%
13.2%
0%
10%
20%
30%
40%
50%
60%
2003 2004 2005 2006 2007 2008 2009
Hungary Poland MU16 Turkey
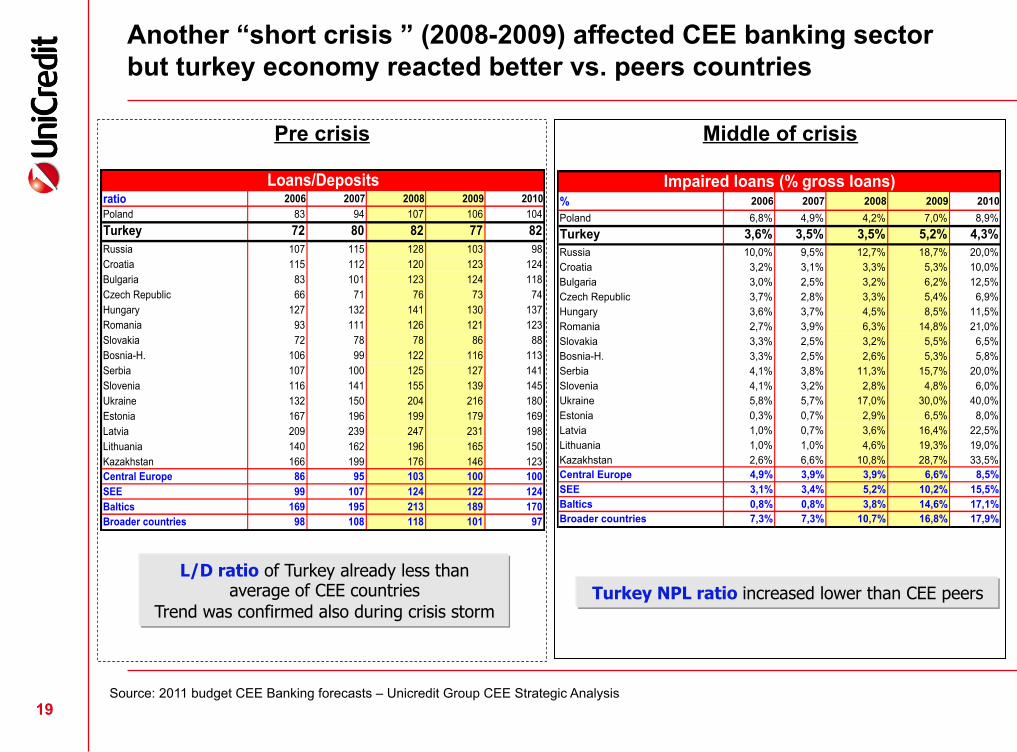
Another “short crisis ” (2008-2009) affected CEE banking sector but turkey economy reacted better vs. peers countries
Pre crisis Middle of crisis
L/D ratio of Turkey already less than average of CEE countries
Trend was confirmed also during crisis storm
% 2006 2007 2008 2009 2010Poland 6,8% 4,9% 4,2% 7,0% 8,9%Turkey 3,6% 3,5% 3,5% 5,2% 4,3%Russia 10,0% 9,5% 12,7% 18,7% 20,0%Croatia 3,2% 3,1% 3,3% 5,3% 10,0%Bulgaria 3,0% 2,5% 3,2% 6,2% 12,5%Czech Republic 3,7% 2,8% 3,3% 5,4% 6,9%Hungary 3,6% 3,7% 4,5% 8,5% 11,5%Romania 2,7% 3,9% 6,3% 14,8% 21,0%Slovakia 3,3% 2,5% 3,2% 5,5% 6,5%Bosnia-H. 3,3% 2,5% 2,6% 5,3% 5,8%Serbia 4,1% 3,8% 11,3% 15,7% 20,0%Slovenia 4,1% 3,2% 2,8% 4,8% 6,0%Ukraine 5,8% 5,7% 17,0% 30,0% 40,0%Estonia 0,3% 0,7% 2,9% 6,5% 8,0%Latvia 1,0% 0,7% 3,6% 16,4% 22,5%Lithuania 1,0% 1,0% 4,6% 19,3% 19,0%Kazakhstan 2,6% 6,6% 10,8% 28,7% 33,5%Central Europe 4,9% 3,9% 3,9% 6,6% 8,5%SEE 3,1% 3,4% 5,2% 10,2% 15,5%Baltics 0,8% 0,8% 3,8% 14,6% 17,1%Broader countries 7,3% 7,3% 10,7% 16,8% 17,9%
Impaired loans (% gross loans)ratio 2006 2007 2008 2009 2010Poland 83 94 107 106 104Turkey 72 80 82 77 82Russia 107 115 128 103 98Croatia 115 112 120 123 124Bulgaria 83 101 123 124 118Czech Republic 66 71 76 73 74Hungary 127 132 141 130 137Romania 93 111 126 121 123Slovakia 72 78 78 86 88Bosnia-H. 106 99 122 116 113Serbia 107 100 125 127 141Slovenia 116 141 155 139 145Ukraine 132 150 204 216 180Estonia 167 196 199 179 169Latvia 209 239 247 231 198Lithuania 140 162 196 165 150Kazakhstan 166 199 176 146 123Central Europe 86 95 103 100 100SEE 99 107 124 122 124Baltics 169 195 213 189 170Broader countries 98 108 118 101 97
Loans/Deposits
Turkey NPL ratio increased lower than CEE peers
Source: 2011 budget CEE Banking forecasts – Unicredit Group CEE Strategic Analysis 19
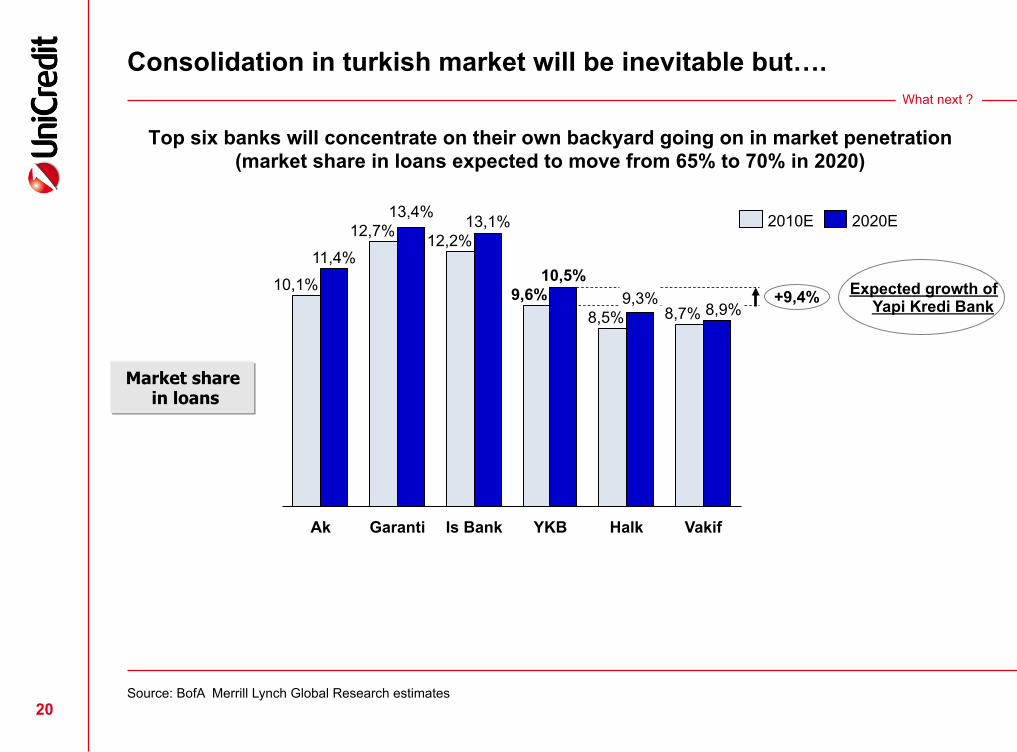
Consolidation in turkish market will be inevitable but….
Top six banks will concentrate on their own backyard going on in market penetration (market share in loans expected to move from 65% to 70% in 2020)
20
11,4%
12,7%
Ak
10,1% 9,6%
Is Bank Garanti
13,1% 12,2%
13,4%
8,9% +9,4%
Vakif
8,7%
Halk
9,3% 8,5%
YKB
10,5%
2010E 2020E
Expected growth of Yapi Kredi Bank
Source: BofA Merrill Lynch Global Research estimates
Market share in loans
What next ?