TURKISH ECONOMY AND BANKING SECTOR
50
1 1 TURKISH ECONOMY AND BANKING SECTOR INTERNATIONAL BANKING FORUM 2011 Brescia, 16 - 17 June 2011 A. Erdal ARAL Deputy Chief Executive Türkiye İş Bankası A.Ş.
Transcript of TURKISH ECONOMY AND BANKING SECTOR
11
TURKISH ECONOMY AND BANKING
SECTOR
INTERNATIONAL BANKING FORUM 2011
Brescia, 16 - 17 June 2011
A. Erdal ARAL
Deputy Chief Executive
Türkiye İş Bankası A.Ş.
22
TURKISH ECONOMY
33
CONTENTS
I. TURKISH ECONOMY
II. BANKING SECTOR
III. FINANCING OPPORTUNITIES IN INFRASTRUCTURE AND ENERGY PROJECTS OF
TURKEY
44
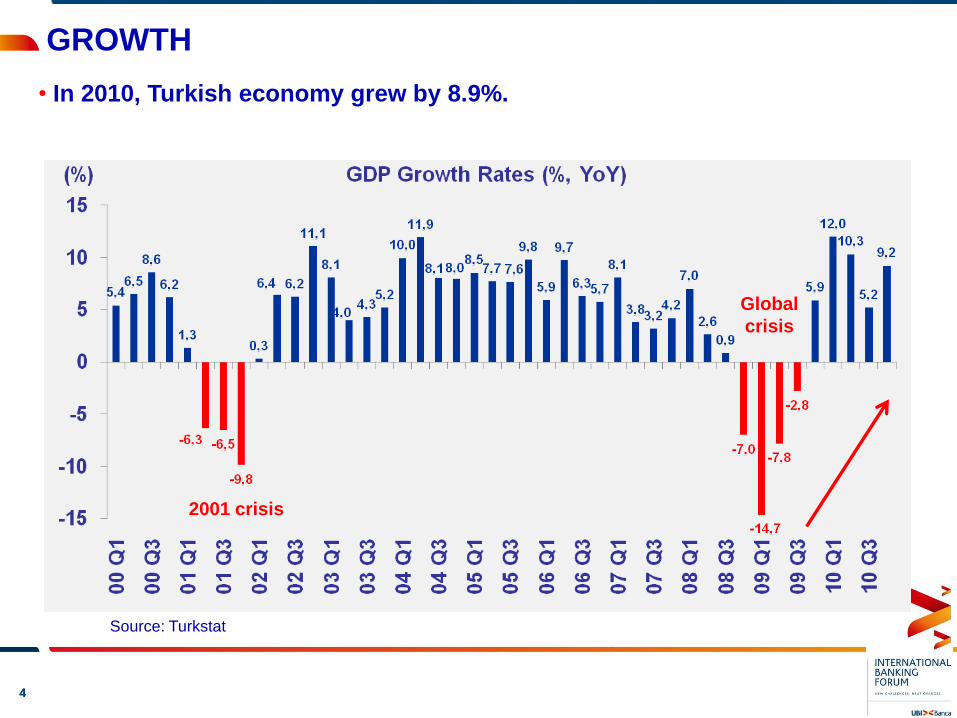
GROWTH
Source: Turkstat
• In 2010, Turkish economy grew by 8.9%.
2001 crisis
Global
crisis
ECONOMIC RESEARCH DIVISION
55
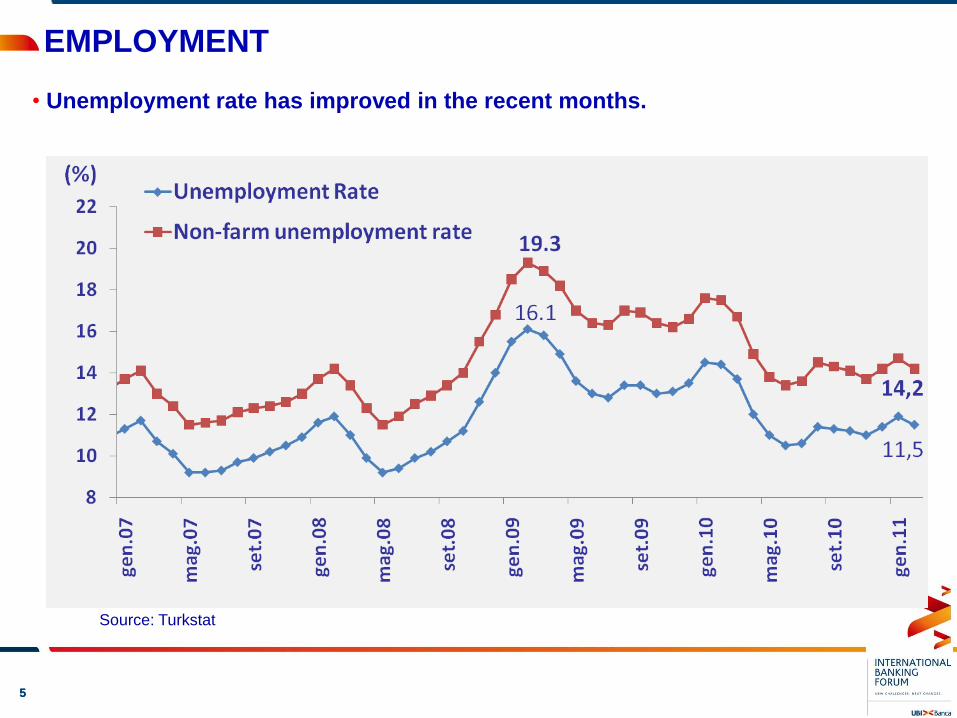
EMPLOYMENT
Source: Turkstat
• Unemployment rate has improved in the recent months.
ECONOMIC RESEARCH DIVISION
66
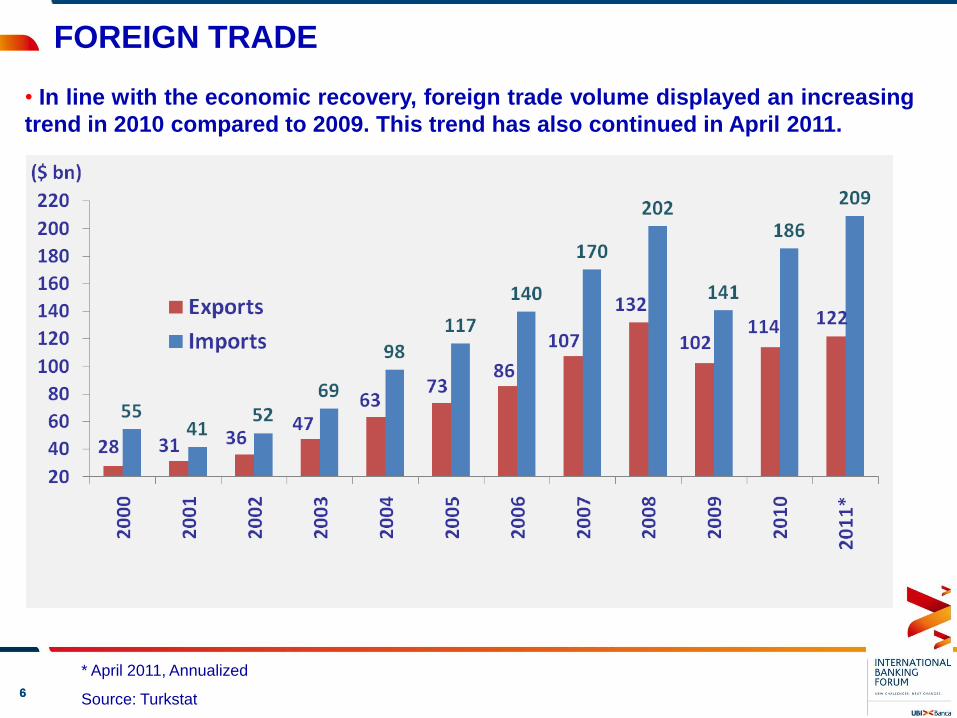
FOREIGN TRADE
* April 2011, Annualized
Source: Turkstat
• In line with the economic recovery, foreign trade volume displayed an increasing
trend in 2010 compared to 2009. This trend has also continued in April 2011.
ECONOMIC RESEARCH DIVISION
77
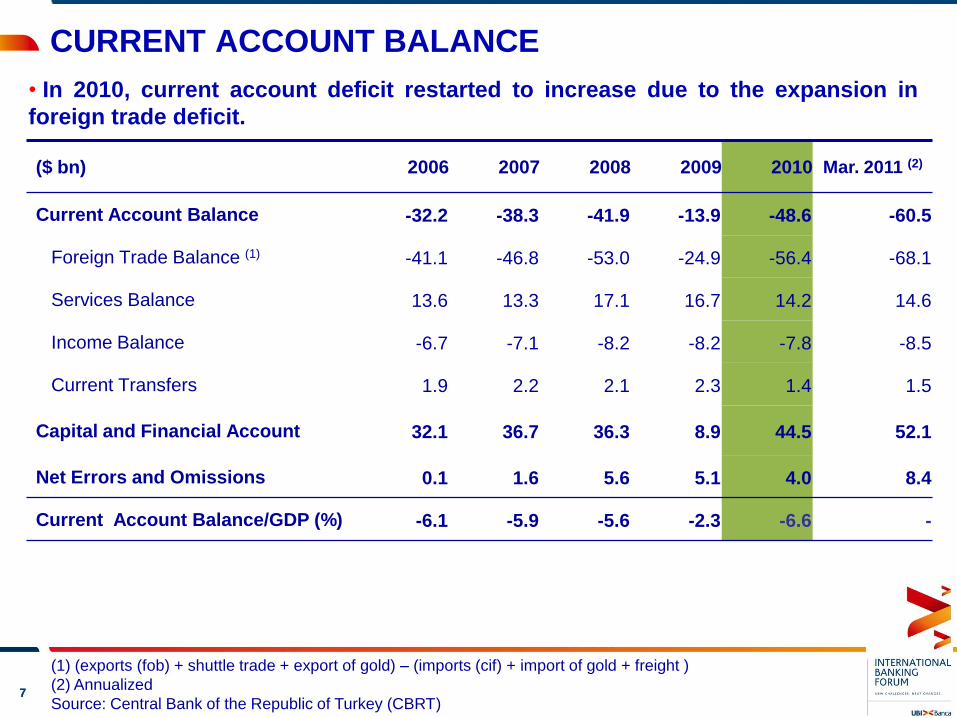
• In 2010, current account deficit restarted to increase due to the expansion in
foreign trade deficit.
($ bn) 2006 2007 2008 2009 2010 Mar. 2011 (2)
Current Account Balance -32.2 -38.3 -41.9 -13.9 -48.6 -60.5
Foreign Trade Balance (1) -41.1 -46.8 -53.0 -24.9 -56.4 -68.1
Services Balance 13.6 13.3 17.1 16.7 14.2 14.6
Income Balance -6.7 -7.1 -8.2 -8.2 -7.8 -8.5
Current Transfers 1.9 2.2 2.1 2.3 1.4 1.5
Capital and Financial Account 32.1 36.7 36.3 8.9 44.5 52.1
Net Errors and Omissions 0.1 1.6 5.6 5.1 4.0 8.4
Current Account Balance/GDP (%) -6.1 -5.9 -5.6 -2.3 -6.6 -
(1) (exports (fob) + shuttle trade + export of gold) – (imports (cif) + import of gold + freight )
(2) Annualized
Source: Central Bank of the Republic of Turkey (CBRT)
CURRENT ACCOUNT BALANCE ECONOMIC RESEARCH DIVISION
88
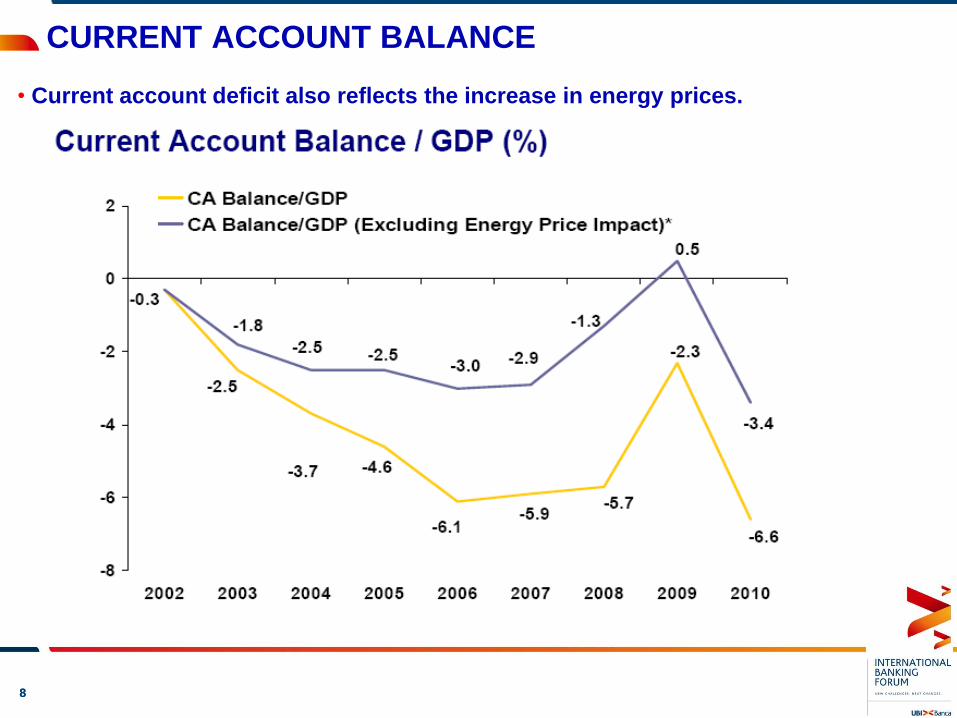
• Current account deficit also reflects the increase in energy prices.
CURRENT ACCOUNT BALANCE ECONOMIC RESEARCH DIVISION
99
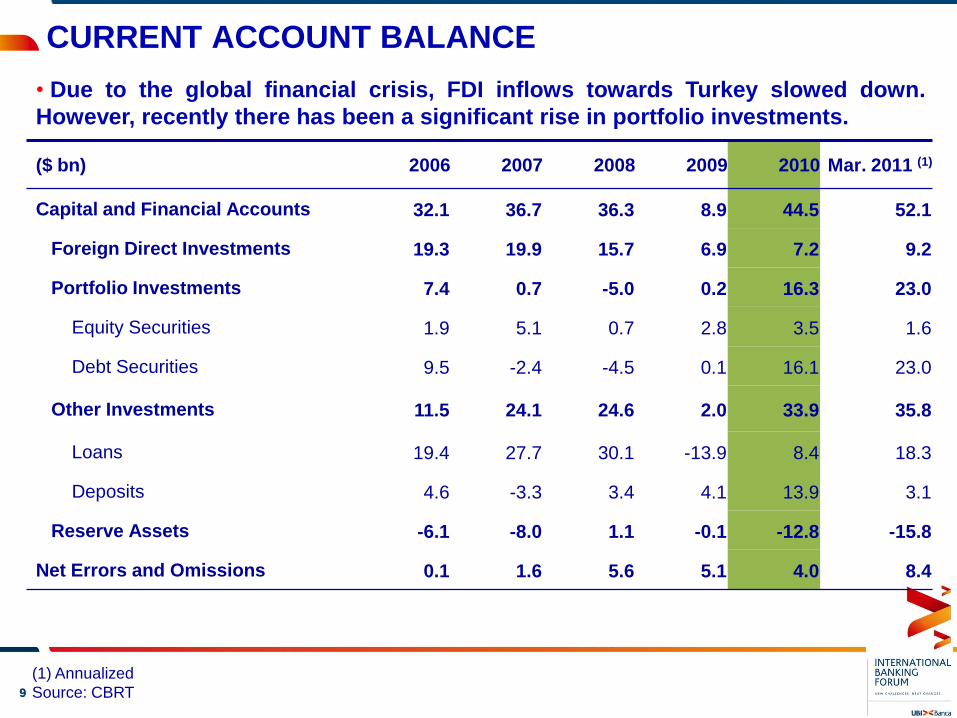
• Due to the global financial crisis, FDI inflows towards Turkey slowed down.
However, recently there has been a significant rise in portfolio investments.
($ bn) 2006 2007 2008 2009 2010 Mar. 2011 (1)
Capital and Financial Accounts 32.1 36.7 36.3 8.9 44.5 52.1
Foreign Direct Investments 19.3 19.9 15.7 6.9 7.2 9.2
Portfolio Investments 7.4 0.7 -5.0 0.2 16.3 23.0
Equity Securities 1.9 5.1 0.7 2.8 3.5 1.6
Debt Securities 9.5 -2.4 -4.5 0.1 16.1 23.0
Other Investments 11.5 24.1 24.6 2.0 33.9 35.8
Loans 19.4 27.7 30.1 -13.9 8.4 18.3
Deposits 4.6 -3.3 3.4 4.1 13.9 3.1
Reserve Assets -6.1 -8.0 1.1 -0.1 -12.8 -15.8
Net Errors and Omissions 0.1 1.6 5.6 5.1 4.0 8.4
(1) Annualized
Source: CBRT
CURRENT ACCOUNT BALANCE ECONOMIC RESEARCH DIVISION
1010
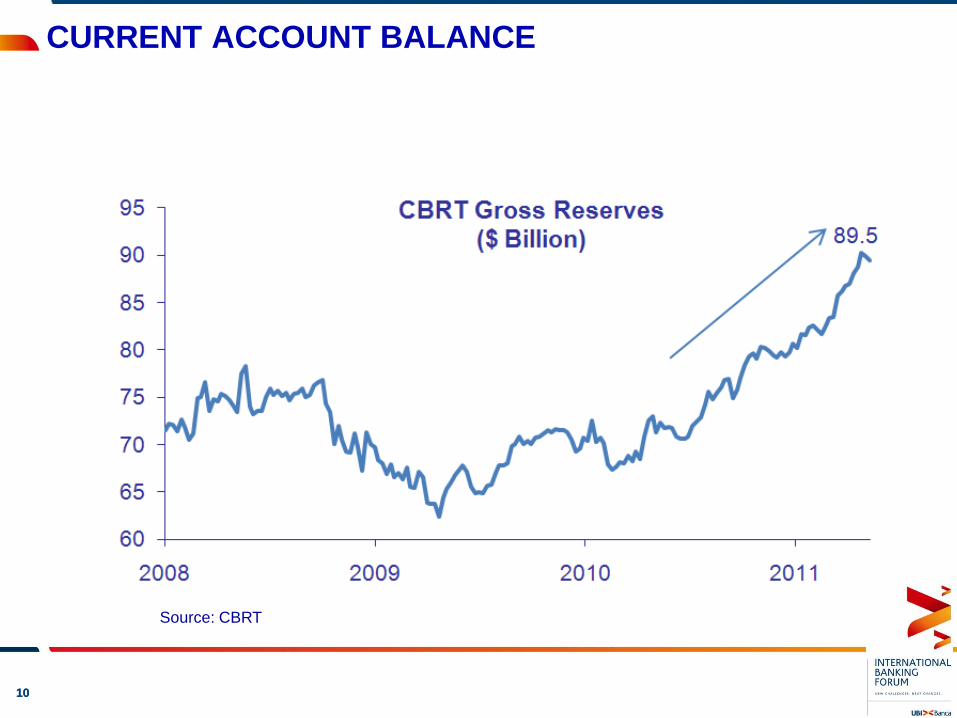
CURRENT ACCOUNT BALANCE ECONOMIC RESEARCH DIVISION
Source: CBRT
1111
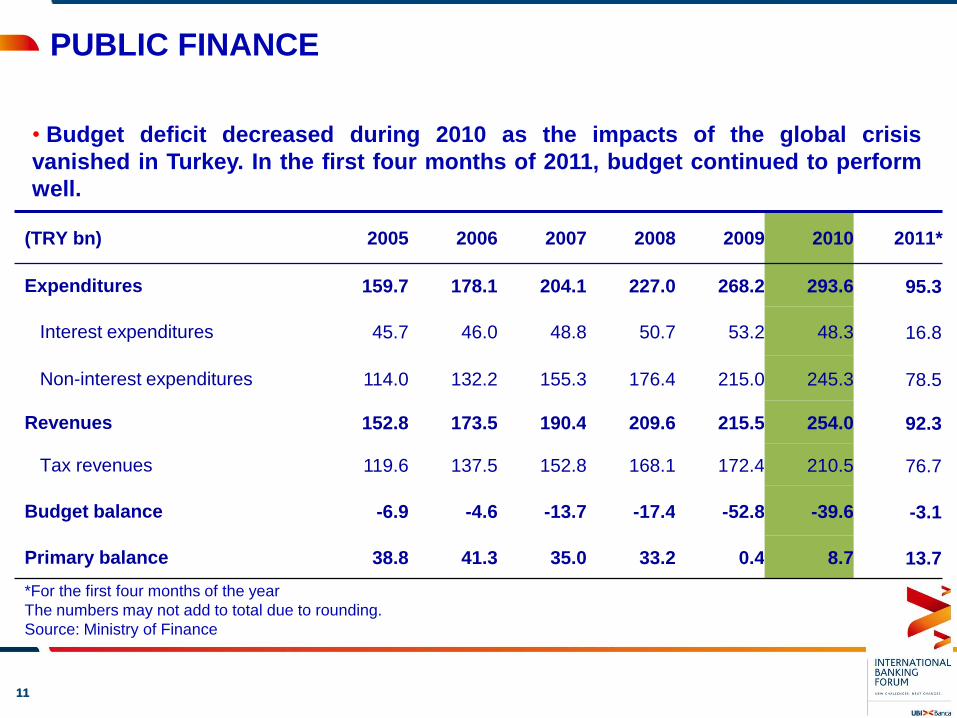
• Budget deficit decreased during 2010 as the impacts of the global crisis
vanished in Turkey. In the first four months of 2011, budget continued to perform
well.
(TRY bn) 2005 2006 2007 2008 2009 2010 2011*
Expenditures 159.7 178.1 204.1 227.0 268.2 293.6 95.3
Interest expenditures 45.7 46.0 48.8 50.7 53.2 48.3 16.8
Non-interest expenditures 114.0 132.2 155.3 176.4 215.0 245.3 78.5
Revenues 152.8 173.5 190.4 209.6 215.5 254.0 92.3
Tax revenues 119.6 137.5 152.8 168.1 172.4 210.5 76.7
Budget balance -6.9 -4.6 -13.7 -17.4 -52.8 -39.6 -3.1
Primary balance 38.8 41.3 35.0 33.2 0.4 8.7 13.7
PUBLIC FINANCE
*For the first four months of the year
The numbers may not add to total due to rounding.
Source: Ministry of Finance
ECONOMIC RESEARCH DIVISION
1212
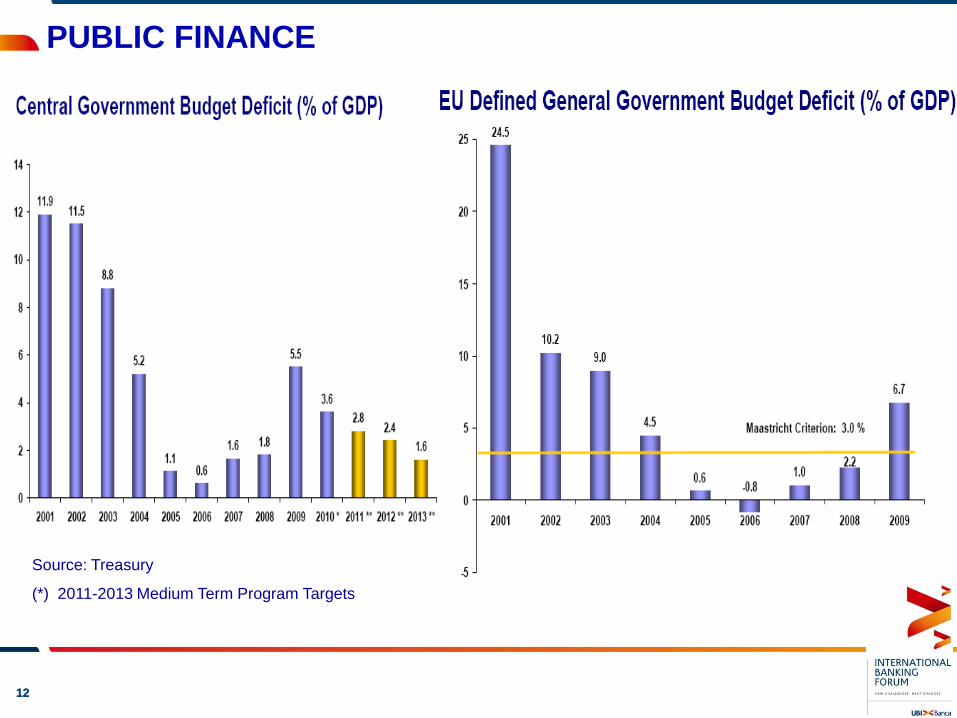
Source: Treasury
(*) 2011-2013 Medium Term Program Targets
PUBLIC FINANCE ECONOMIC RESEARCH DIVISION
1313
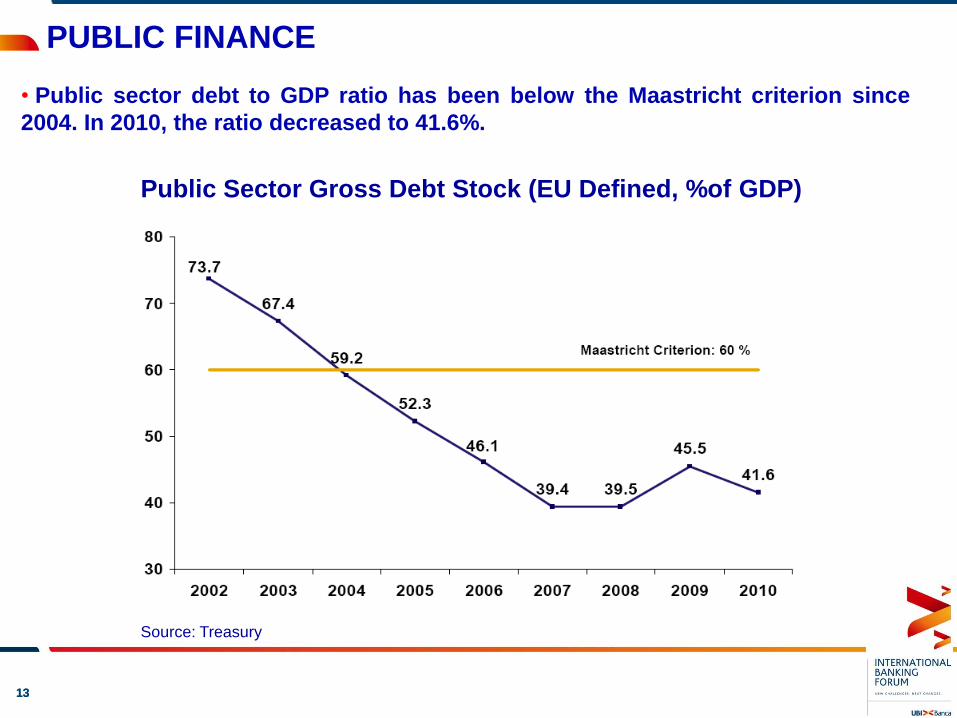
• Public sector debt to GDP ratio has been below the Maastricht criterion since
2004. In 2010, the ratio decreased to 41.6%.
Source: Treasury
PUBLIC FINANCE ECONOMIC RESEARCH DIVISION
Public Sector Gross Debt Stock (EU Defined, %of GDP)
1414
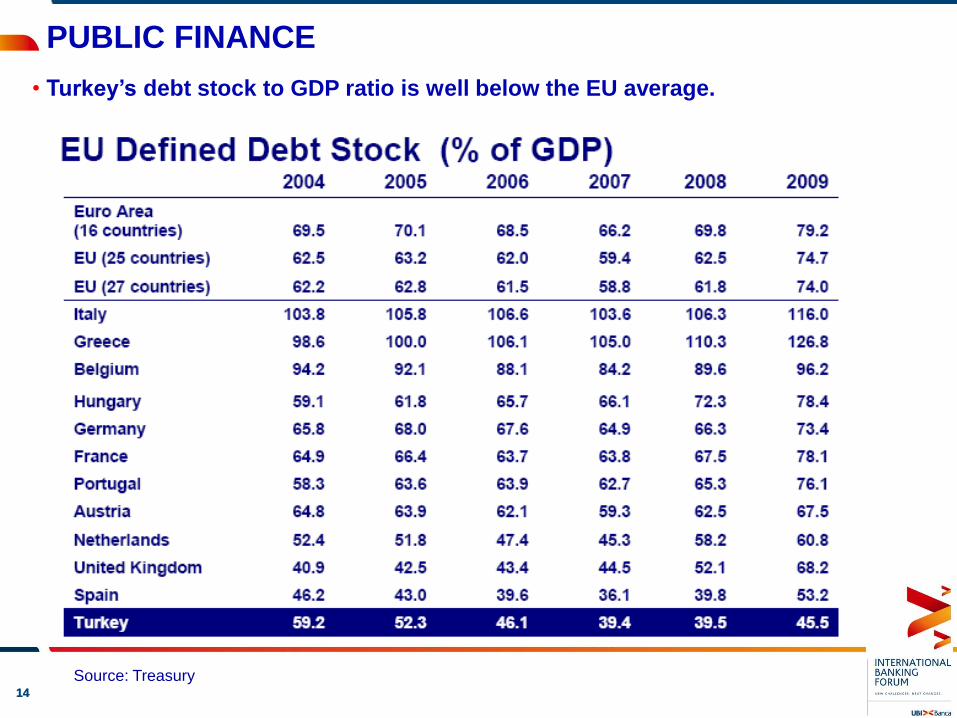
• Turkey’s debt stock to GDP ratio is well below the EU average.
Source: Treasury
PUBLIC FINANCE ECONOMIC RESEARCH DIVISION
1515
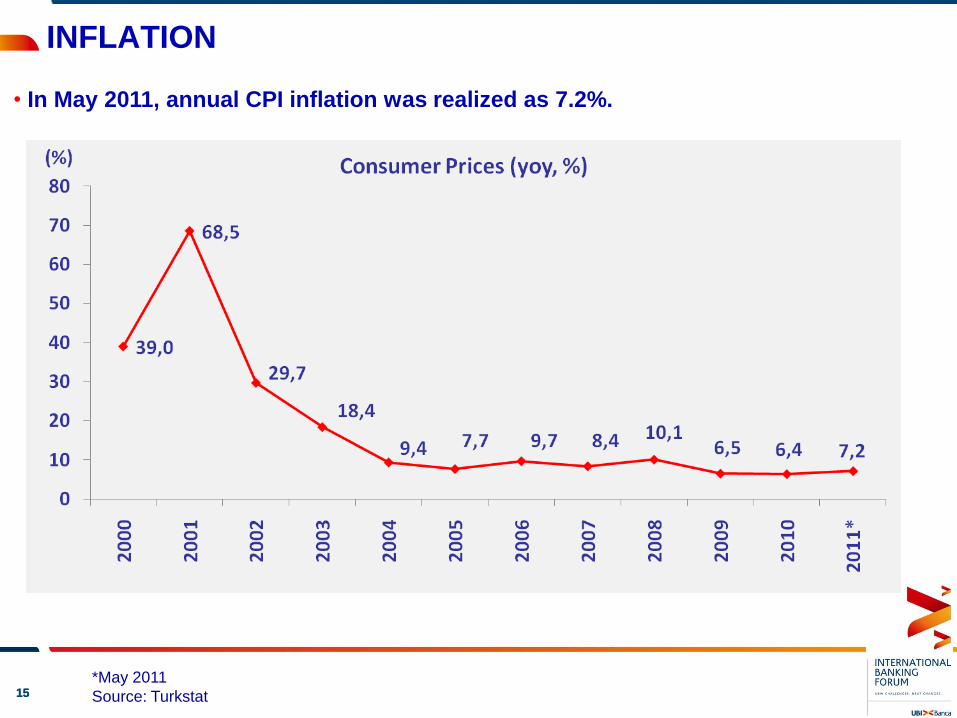
• In May 2011, annual CPI inflation was realized as 7.2%.
*May 2011
Source: Turkstat
INFLATION ECONOMIC RESEARCH DIVISION
1616
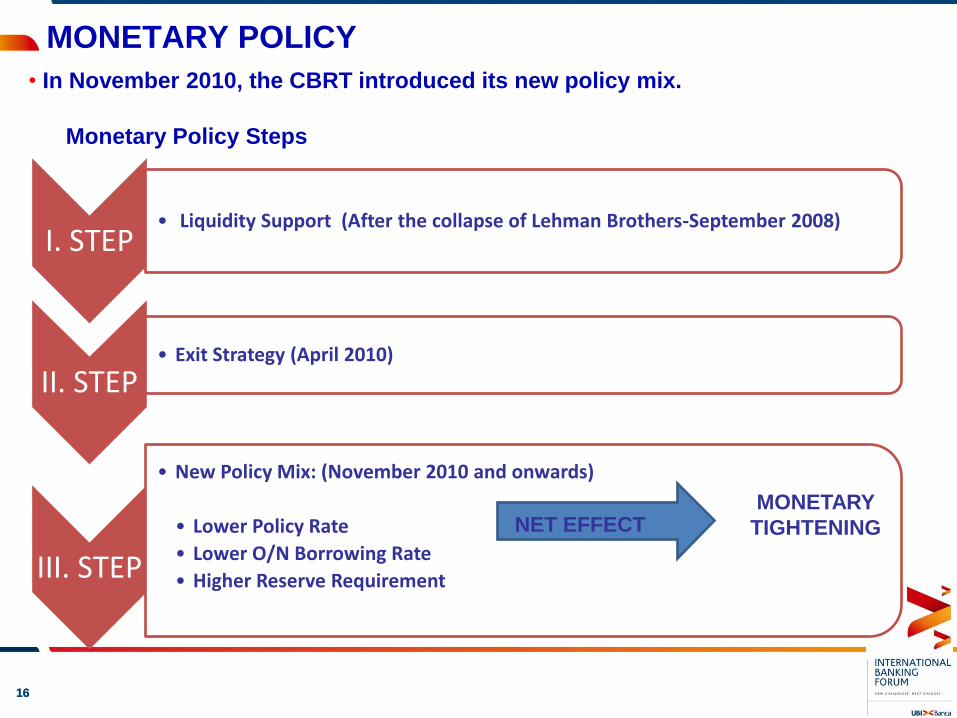
• In November 2010, the CBRT introduced its new policy mix.
MONETARY POLICY ECONOMIC RESEARCH DIVISION
I. STEP• Liquidity Support (After the collapse of Lehman Brothers-September 2008)
II. STEP• Exit Strategy (April 2010)
III. STEP
• New Policy Mix: (November 2010 and onwards)
• Lower Policy Rate
• Lower O/N Borrowing Rate
• Higher Reserve Requirement
Monetary Policy Steps
MONETARY
TIGHTENINGNET EFFECT
1717
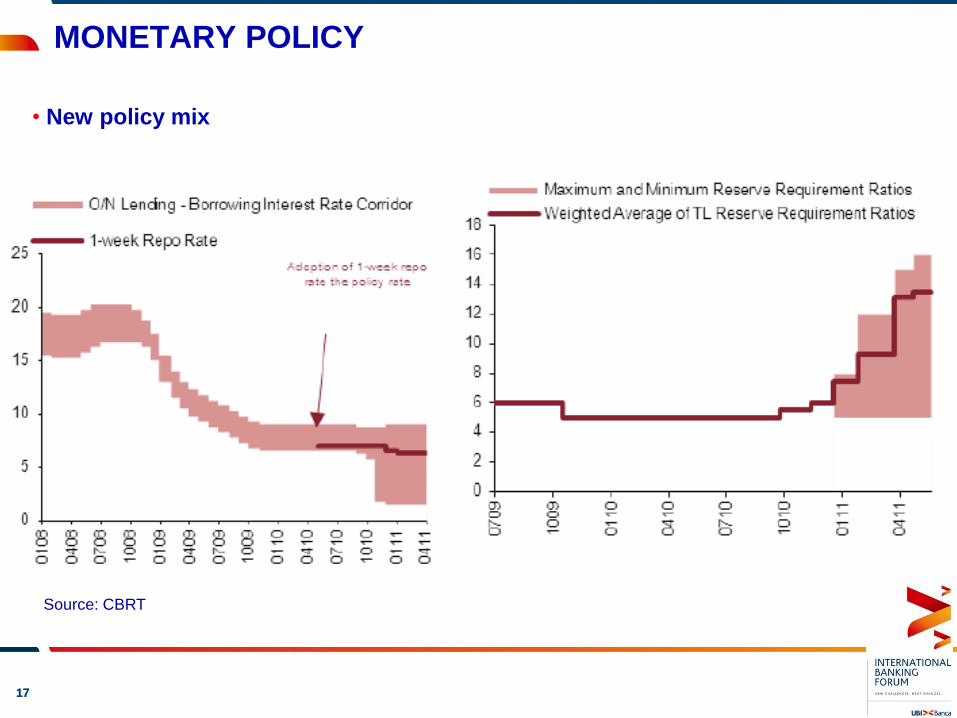
• New policy mix
Source: CBRT
MONETARY POLICY ECONOMIC RESEARCH DIVISION
1818
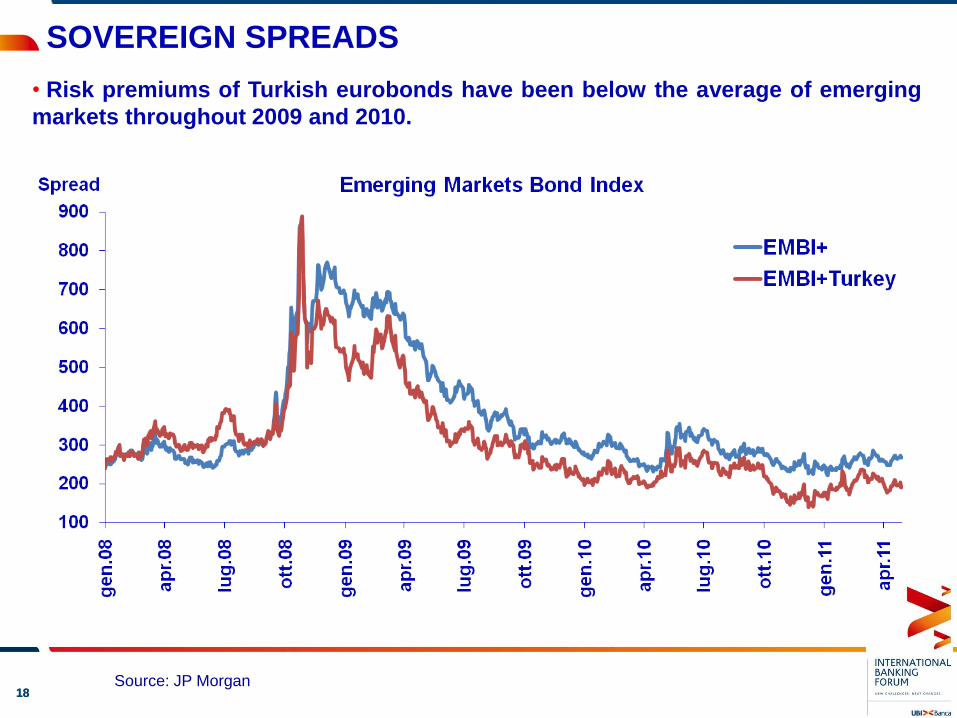
• Risk premiums of Turkish eurobonds have been below the average of emerging
markets throughout 2009 and 2010.
Source: JP Morgan
SOVEREIGN SPREADS ECONOMIC RESEARCH DIVISION
1919
CREDIT RATING ECONOMIC RESEARCH DIVISION
Rating/Outlook Change
Date
Rating Outlook
Old New Old New
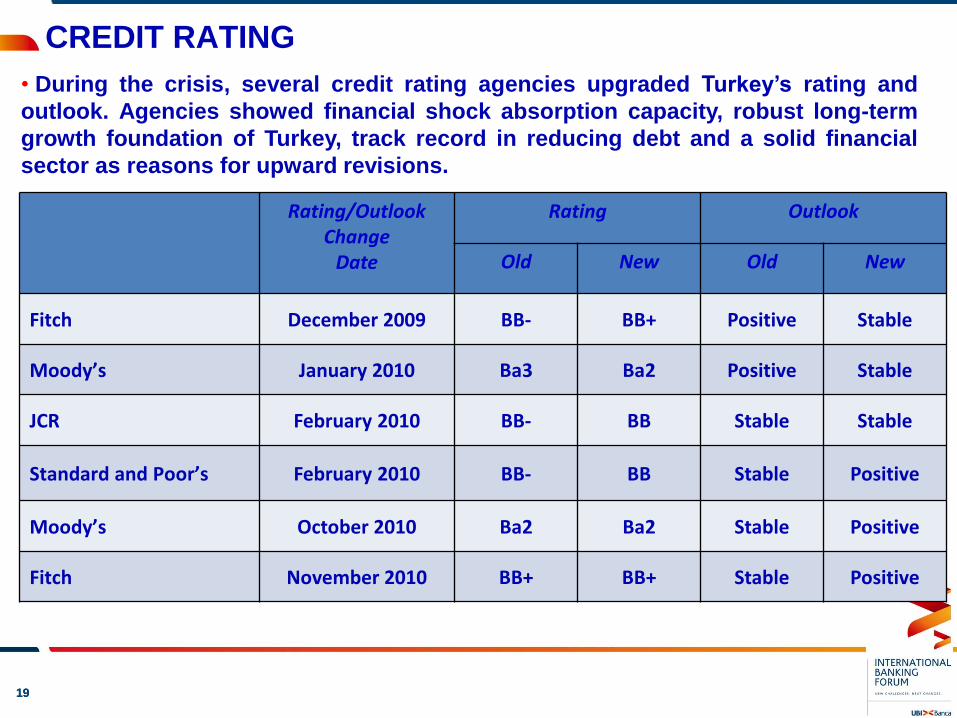
Fitch December 2009 BB- BB+ Positive Stable
Moody’s January 2010 Ba3 Ba2 Positive Stable
JCR February 2010 BB- BB Stable Stable
Standard and Poor’s February 2010 BB- BB Stable Positive
Moody’s October 2010 Ba2 Ba2 Stable Positive
Fitch November 2010 BB+ BB+ Stable Positive
• During the crisis, several credit rating agencies upgraded Turkey’s rating and
outlook. Agencies showed financial shock absorption capacity, robust long-term
growth foundation of Turkey, track record in reducing debt and a solid financial
sector as reasons for upward revisions.
2020
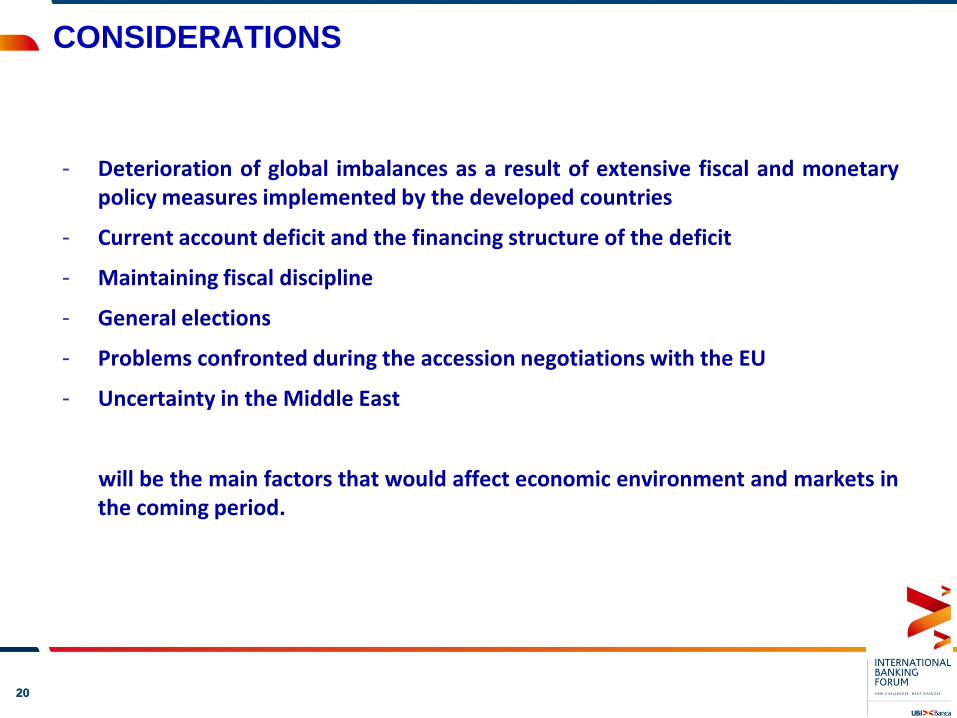
CONSIDERATIONS
- Deterioration of global imbalances as a result of extensive fiscal and monetarypolicy measures implemented by the developed countries
- Current account deficit and the financing structure of the deficit
- Maintaining fiscal discipline
- General elections
- Problems confronted during the accession negotiations with the EU
- Uncertainty in the Middle East
will be the main factors that would affect economic environment and markets inthe coming period.
ECONOMIC RESEARCH DIVISION
2121
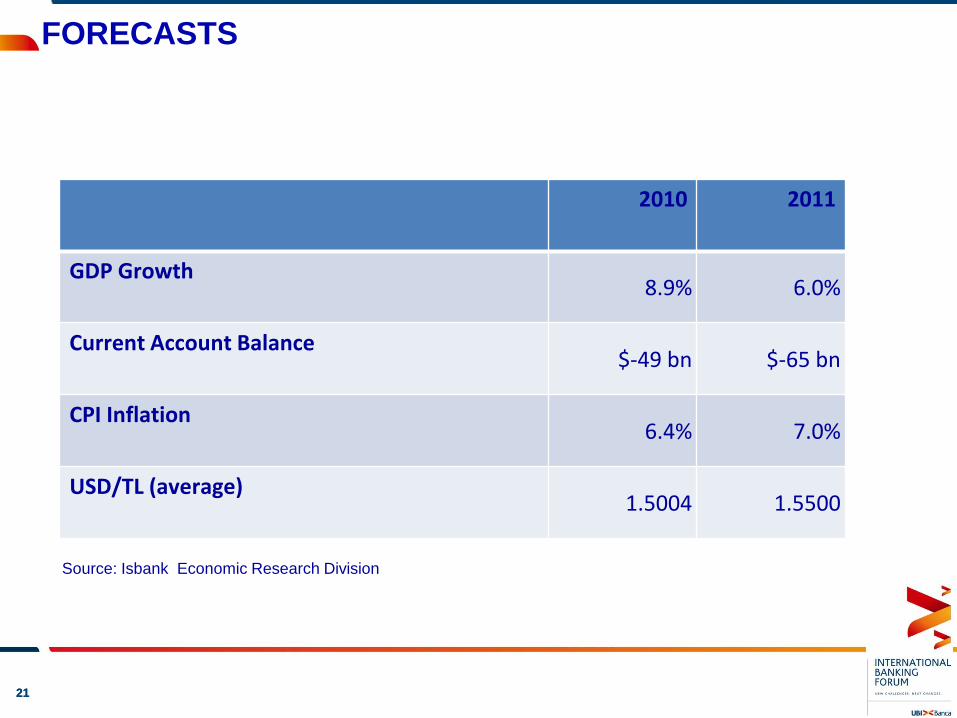
2010 2011
GDP Growth 8.9% 6.0%
Current Account Balance$-49 bn $-65 bn
CPI Inflation6.4% 7.0%
USD/TL (average)1.5004 1.5500
FORECASTS
Source: Isbank Economic Research Division
ECONOMIC RESEARCH DIVISION
2222
ECONOMIC RESEARCH DIVISION
BANKING SECTOR
2323
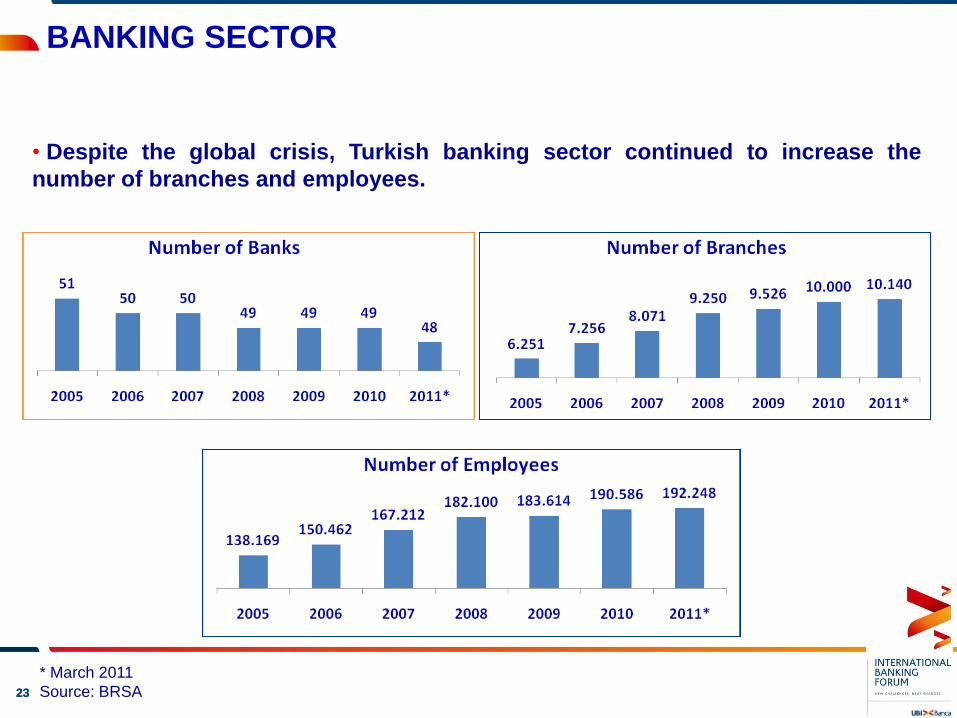
• Despite the global crisis, Turkish banking sector continued to increase the
number of branches and employees.
* March 2011
Source: BRSA
BANKING SECTOR ECONOMIC RESEARCH DIVISION
2424
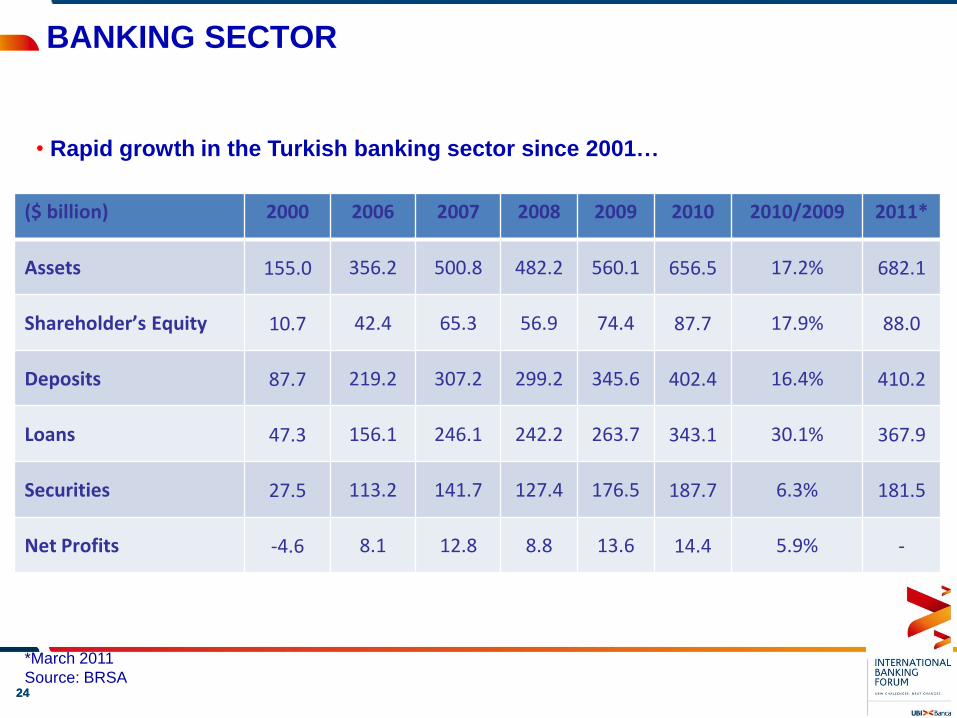
• Rapid growth in the Turkish banking sector since 2001…
*March 2011
Source: BRSA
($ billion) 2000 2006 2007 2008 2009 2010 2010/2009 2011*
Assets 155.0 356.2 500.8 482.2 560.1 656.5 17.2% 682.1
Shareholder’s Equity 10.7 42.4 65.3 56.9 74.4 87.7 17.9% 88.0
Deposits 87.7 219.2 307.2 299.2 345.6 402.4 16.4% 410.2
Loans 47.3 156.1 246.1 242.2 263.7 343.1 30.1% 367.9
Securities 27.5 113.2 141.7 127.4 176.5 187.7 6.3% 181.5
Net Profits -4.6 8.1 12.8 8.8 13.6 14.4 5.9% -
BANKING SECTOR ECONOMIC RESEARCH DIVISION
2525
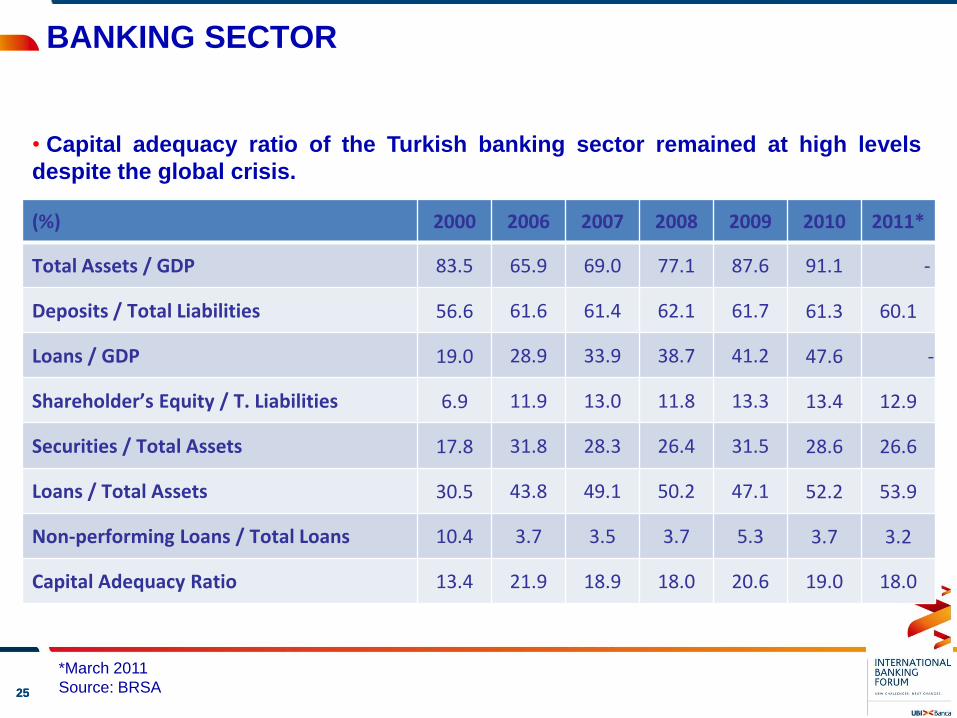
• Capital adequacy ratio of the Turkish banking sector remained at high levels
despite the global crisis.
(%) 2000 2006 2007 2008 2009 2010 2011*
Total Assets / GDP 83.5 65.9 69.0 77.1 87.6 91.1 -
Deposits / Total Liabilities 56.6 61.6 61.4 62.1 61.7 61.3 60.1
Loans / GDP 19.0 28.9 33.9 38.7 41.2 47.6 -
Shareholder’s Equity / T. Liabilities 6.9 11.9 13.0 11.8 13.3 13.4 12.9
Securities / Total Assets 17.8 31.8 28.3 26.4 31.5 28.6 26.6
Loans / Total Assets 30.5 43.8 49.1 50.2 47.1 52.2 53.9
Non-performing Loans / Total Loans 10.4 3.7 3.5 3.7 5.3 3.7 3.2
Capital Adequacy Ratio 13.4 21.9 18.9 18.0 20.6 19.0 18.0
BANKING SECTOR
*March 2011
Source: BRSA
ECONOMIC RESEARCH DIVISION
2626
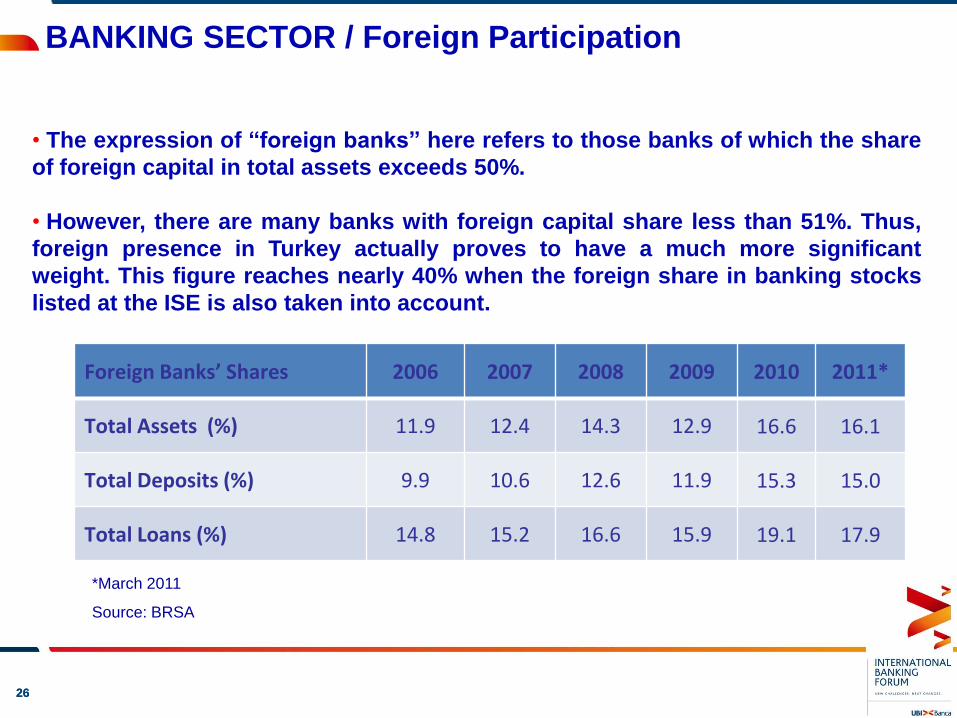
• The expression of “foreign banks” here refers to those banks of which the share
of foreign capital in total assets exceeds 50%.
• However, there are many banks with foreign capital share less than 51%. Thus,
foreign presence in Turkey actually proves to have a much more significant
weight. This figure reaches nearly 40% when the foreign share in banking stocks
listed at the ISE is also taken into account.
BANKING SECTOR / Foreign Participation
*March 2011
Source: BRSA
Foreign Banks’ Shares 2006 2007 2008 2009 2010 2011*
Total Assets (%) 11.9 12.4 14.3 12.9 16.6 16.1
Total Deposits (%) 9.9 10.6 12.6 11.9 15.3 15.0
Total Loans (%) 14.8 15.2 16.6 15.9 19.1 17.9
ECONOMIC RESEARCH DIVISION
2727
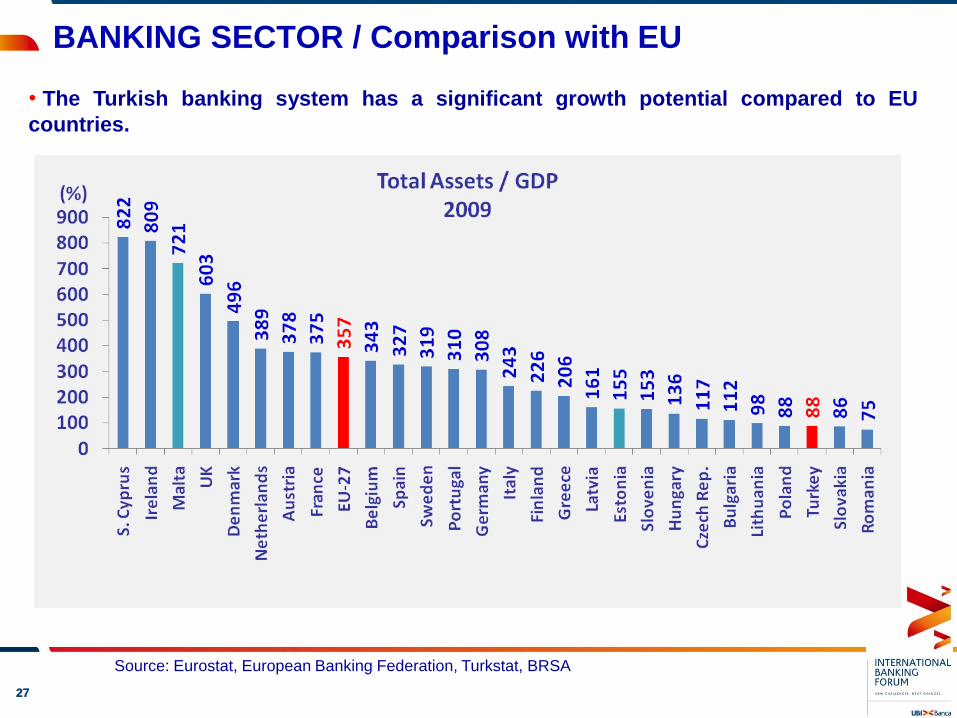
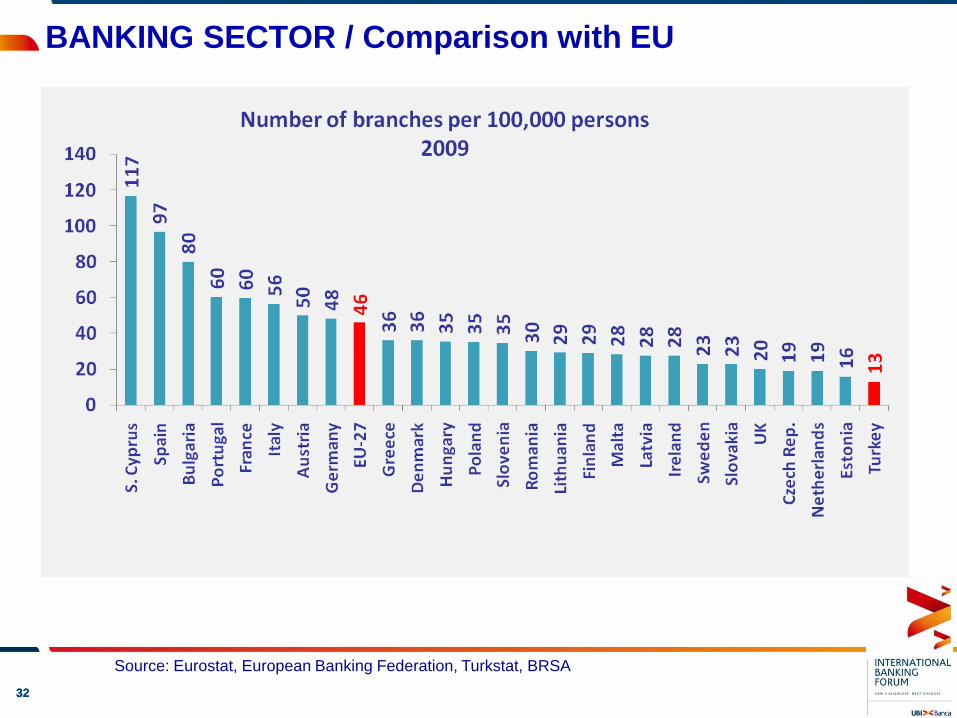
BANKING SECTOR / Comparison with EU
• The Turkish banking system has a significant growth potential compared to EU
countries.
Source: Eurostat, European Banking Federation, Turkstat, BRSA
ECONOMIC RESEARCH DIVISION
2828
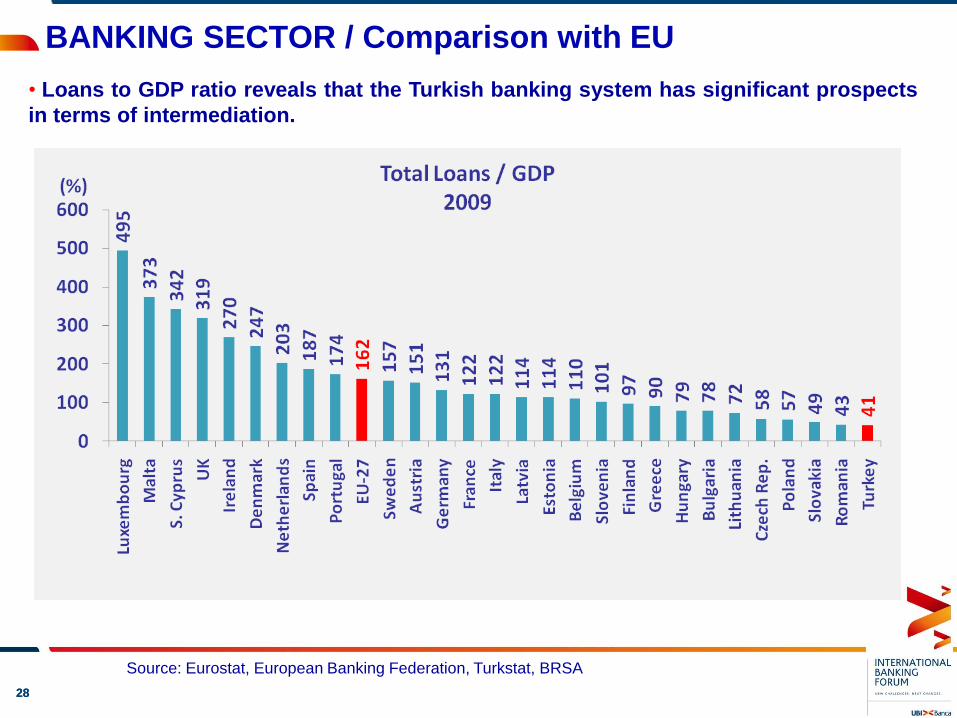
• Loans to GDP ratio reveals that the Turkish banking system has significant prospects
in terms of intermediation.
BANKING SECTOR / Comparison with EU
Source: Eurostat, European Banking Federation, Turkstat, BRSA
ECONOMIC RESEARCH DIVISION
2929
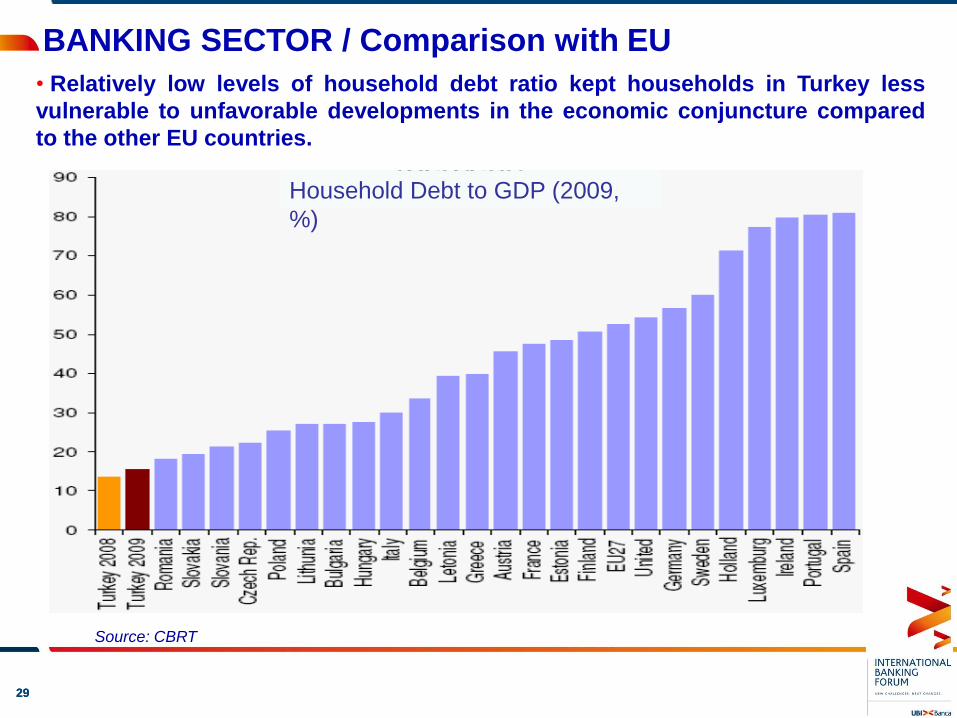
• Relatively low levels of household debt ratio kept households in Turkey less
vulnerable to unfavorable developments in the economic conjuncture compared
to the other EU countries.
ECONOMIC RESEARCH DIVISIONBANKING SECTOR / Comparison with EU
Source: CBRT
Household Debt to GDP (2009,
%)
3030
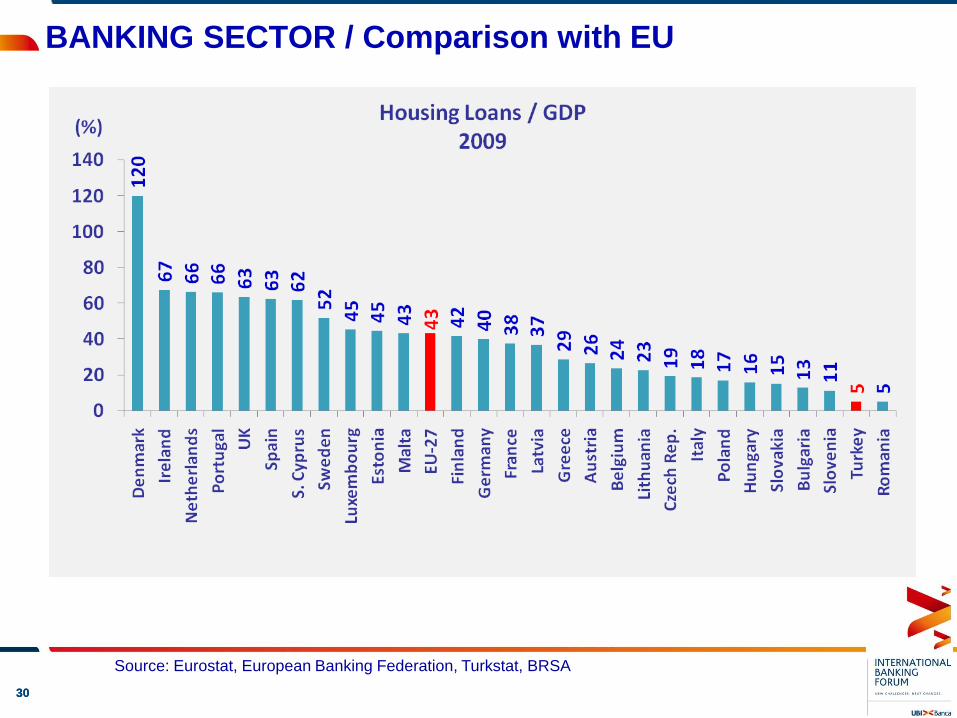
BANKING SECTOR / Comparison with EU
Source: Eurostat, European Banking Federation, Turkstat, BRSA
ECONOMIC RESEARCH DIVISION
3131
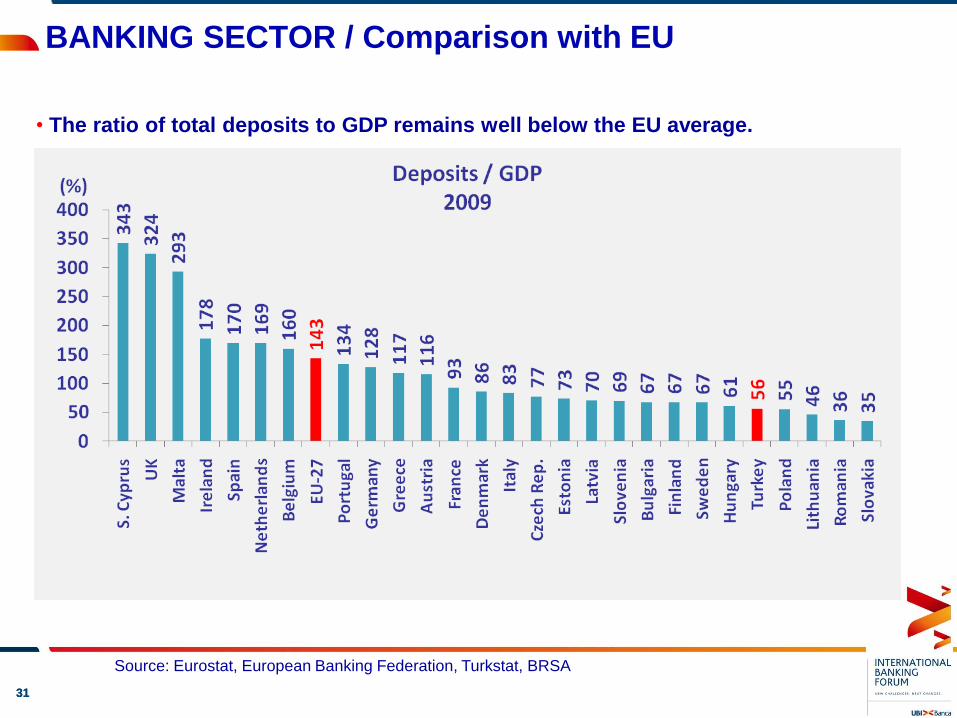
• The ratio of total deposits to GDP remains well below the EU average.
BANKING SECTOR / Comparison with EU
Source: Eurostat, European Banking Federation, Turkstat, BRSA
ECONOMIC RESEARCH DIVISION
3232
BANKING SECTOR / Comparison with EU
Source: Eurostat, European Banking Federation, Turkstat, BRSA
ECONOMIC RESEARCH DIVISION
3333
ECONOMIC RESEARCH DIVISION
FINANCING OPPORTUNITIES IN
INFRASTRUCTURE AND ENERGY
PROJECTS OF TURKEY
3434
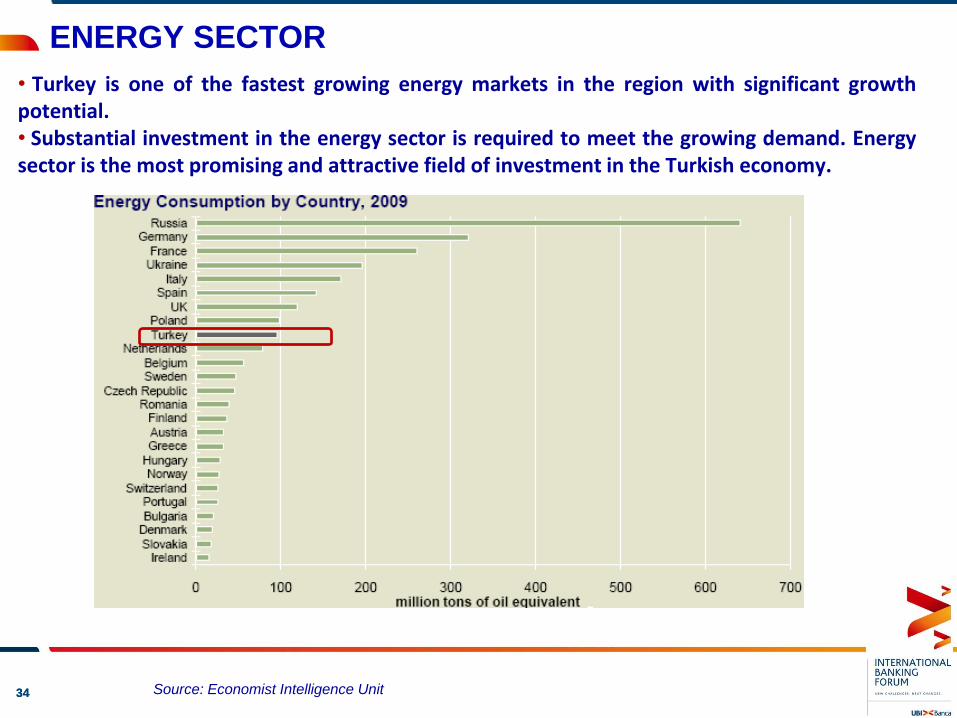
ENERGY SECTOR
• Turkey is one of the fastest growing energy markets in the region with significant growthpotential.• Substantial investment in the energy sector is required to meet the growing demand. Energysector is the most promising and attractive field of investment in the Turkish economy.
Source: Economist Intelligence Unit
3535
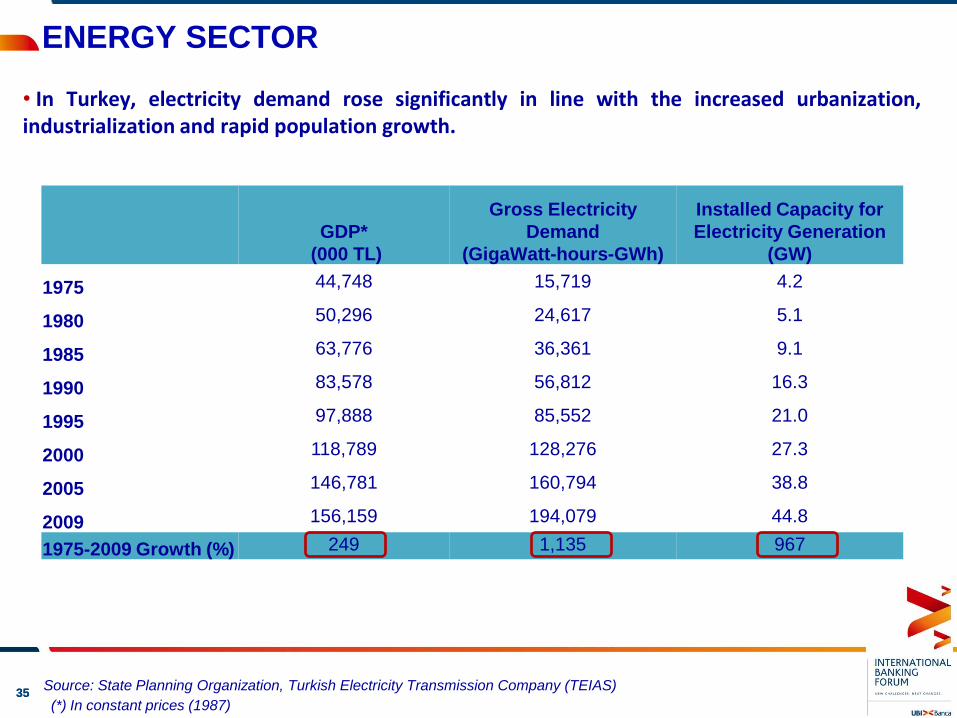
ENERGY SECTOR
GDP*
(000 TL)
Gross Electricity
Demand
(GigaWatt-hours-GWh)
Installed Capacity for
Electricity Generation
(GW)
1975 44,748 15,719 4.2
1980 50,296 24,617 5.1
1985 63,776 36,361 9.1
1990 83,578 56,812 16.3
1995 97,888 85,552 21.0
2000 118,789 128,276 27.3
2005 146,781 160,794 38.8
2009 156,159 194,079 44.8
1975-2009 Growth (%) 249 1,135 967
Source: State Planning Organization, Turkish Electricity Transmission Company (TEIAS)
• In Turkey, electricity demand rose significantly in line with the increased urbanization,industrialization and rapid population growth.
(*) In constant prices (1987)
3636
ENERGY SECTOR
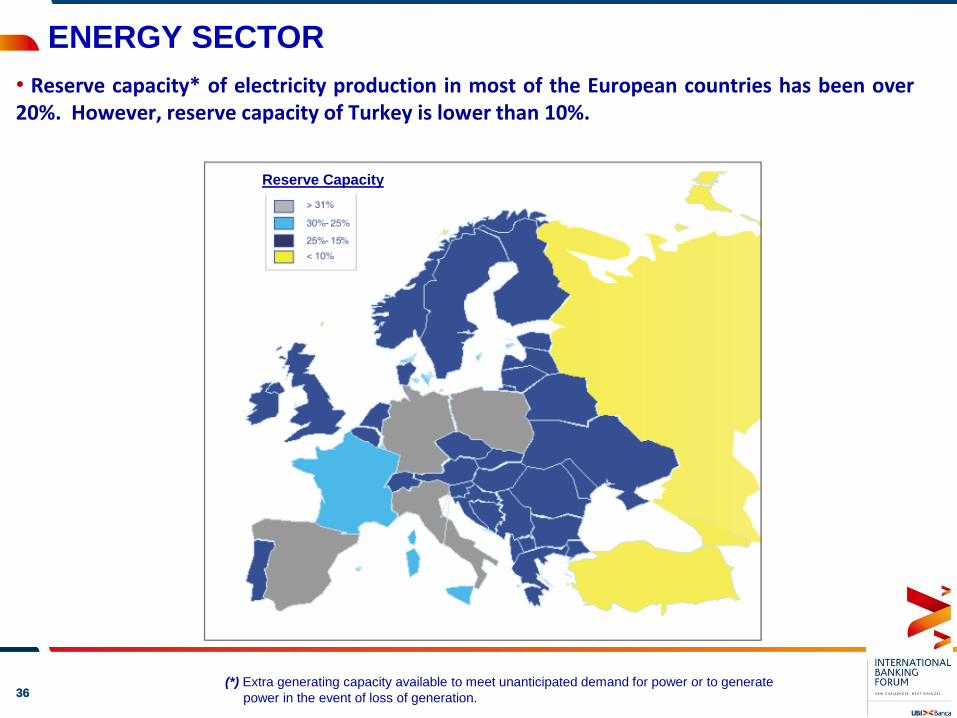
• Reserve capacity* of electricity production in most of the European countries has been over20%. However, reserve capacity of Turkey is lower than 10%.
Reserve Capacity
(*) Extra generating capacity available to meet unanticipated demand for power or to generate
power in the event of loss of generation.
3737
ENERGY SECTOR
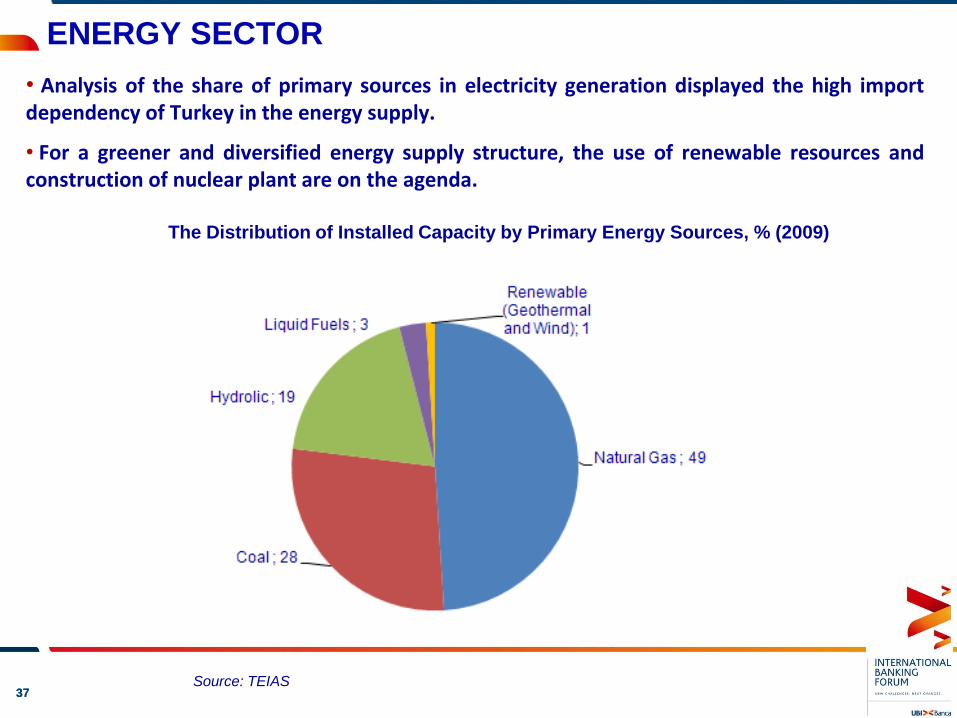
Source: TEIAS
The Distribution of Installed Capacity by Primary Energy Sources, % (2009)
• Analysis of the share of primary sources in electricity generation displayed the high importdependency of Turkey in the energy supply.
• For a greener and diversified energy supply structure, the use of renewable resources andconstruction of nuclear plant are on the agenda.
3838
ENERGY SECTOR
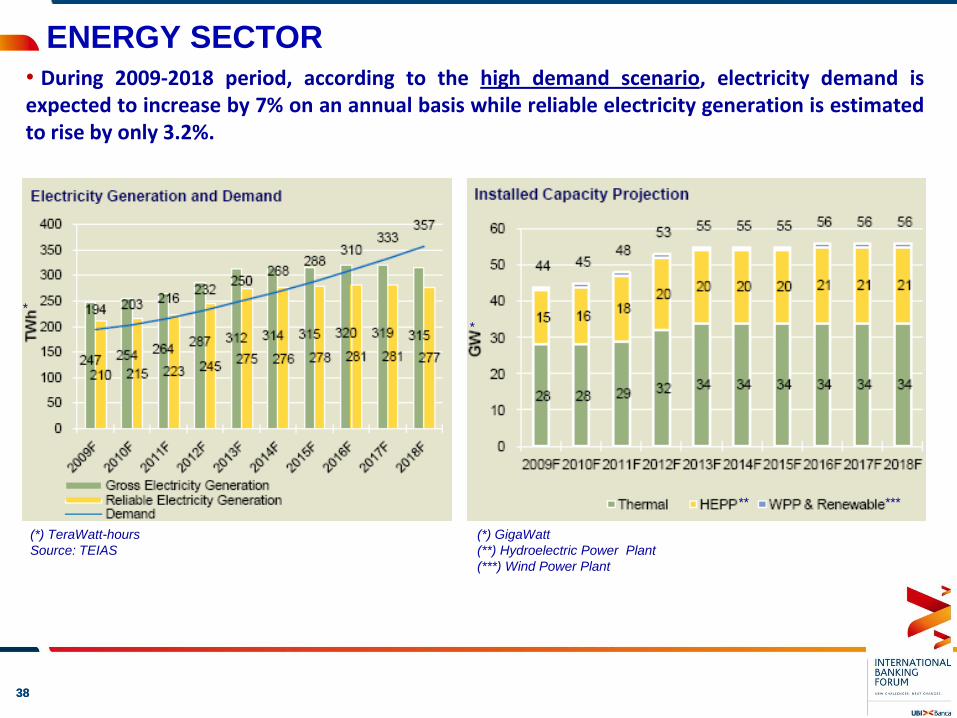
(*) TeraWatt-hours
Source: TEIAS
• During 2009-2018 period, according to the high demand scenario, electricity demand isexpected to increase by 7% on an annual basis while reliable electricity generation is estimatedto rise by only 3.2%.
** ***
(*) GigaWatt
(**) Hydroelectric Power Plant
(***) Wind Power Plant
*
*
3939
ENERGY SECTOR
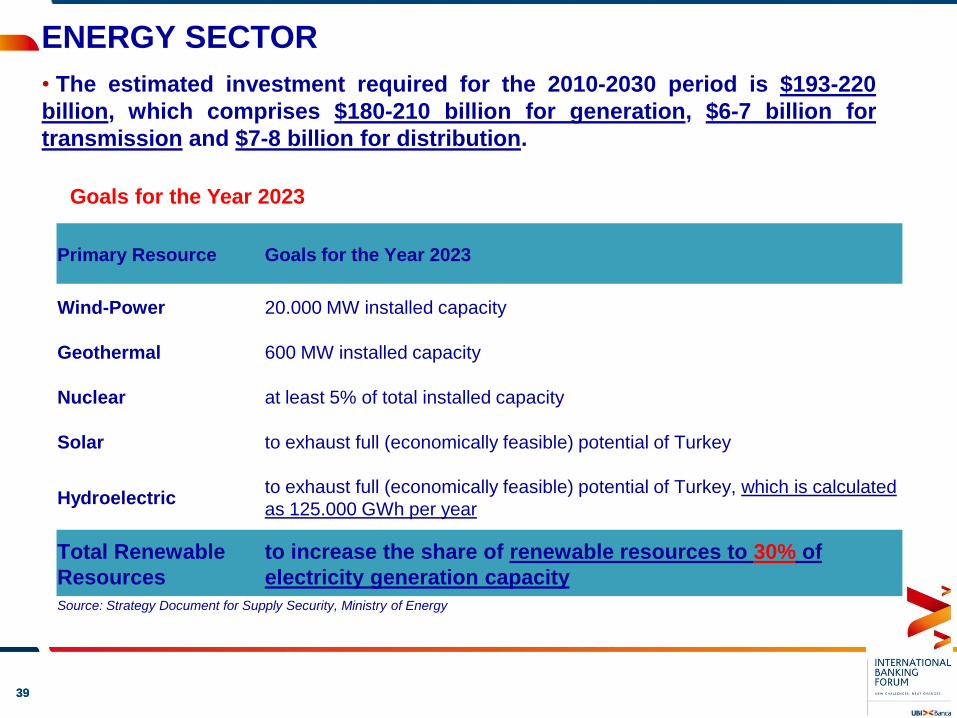
Primary Resource Goals for the Year 2023
Wind-Power 20.000 MW installed capacity
Geothermal 600 MW installed capacity
Nuclear at least 5% of total installed capacity
Solar to exhaust full (economically feasible) potential of Turkey
Hydroelectricto exhaust full (economically feasible) potential of Turkey, which is calculated
as 125.000 GWh per year
Total Renewable
Resources
to increase the share of renewable resources to 30% of
electricity generation capacity
Source: Strategy Document for Supply Security, Ministry of Energy
Goals for the Year 2023
• The estimated investment required for the 2010-2030 period is $193-220
billion, which comprises $180-210 billion for generation, $6-7 billion for
transmission and $7-8 billion for distribution.
4040
INFRASTRUCTURE INVESTMENTS
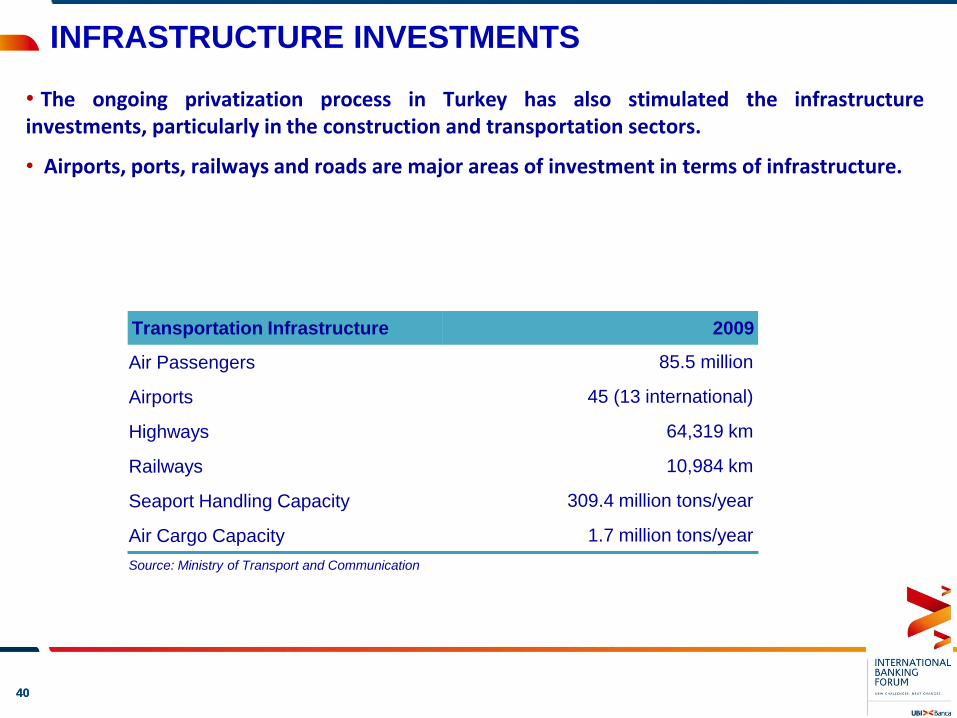
• The ongoing privatization process in Turkey has also stimulated the infrastructureinvestments, particularly in the construction and transportation sectors.
• Airports, ports, railways and roads are major areas of investment in terms of infrastructure.
Transportation Infrastructure 2009
Air Passengers 85.5 million
Airports 45 (13 international)
Highways 64,319 km
Railways 10,984 km
Seaport Handling Capacity 309.4 million tons/year
Air Cargo Capacity 1.7 million tons/year
Source: Ministry of Transport and Communication
4141
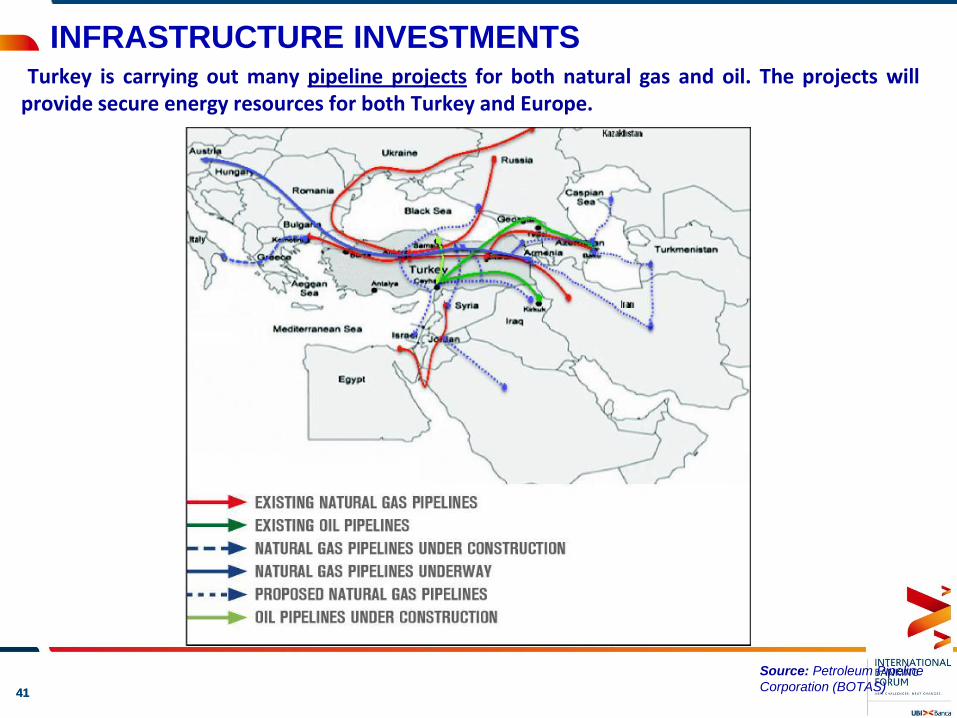
INFRASTRUCTURE INVESTMENTS Turkey is carrying out many pipeline projects for both natural gas and oil. The projects will
provide secure energy resources for both Turkey and Europe.
Source: Petroleum Pipeline
Corporation (BOTAS)
4242
INFRASTRUCTURE INVESTMENTS
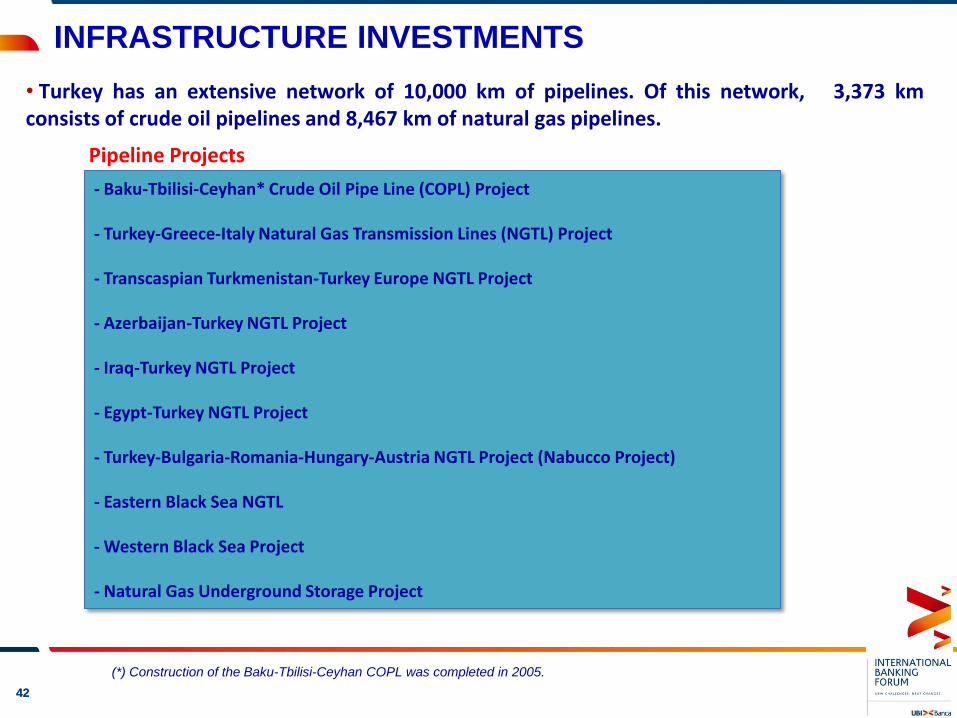
• Turkey has an extensive network of 10,000 km of pipelines. Of this network, 3,373 kmconsists of crude oil pipelines and 8,467 km of natural gas pipelines.
Pipeline Projects
- Baku-Tbilisi-Ceyhan* Crude Oil Pipe Line (COPL) Project
- Turkey-Greece-Italy Natural Gas Transmission Lines (NGTL) Project
- Transcaspian Turkmenistan-Turkey Europe NGTL Project
- Azerbaijan-Turkey NGTL Project
- Iraq-Turkey NGTL Project
- Egypt-Turkey NGTL Project
- Turkey-Bulgaria-Romania-Hungary-Austria NGTL Project (Nabucco Project)
- Eastern Black Sea NGTL
- Western Black Sea Project
- Natural Gas Underground Storage Project
(*) Construction of the Baku-Tbilisi-Ceyhan COPL was completed in 2005.
4343
INFRASTRUCTURE INVESTMENTS
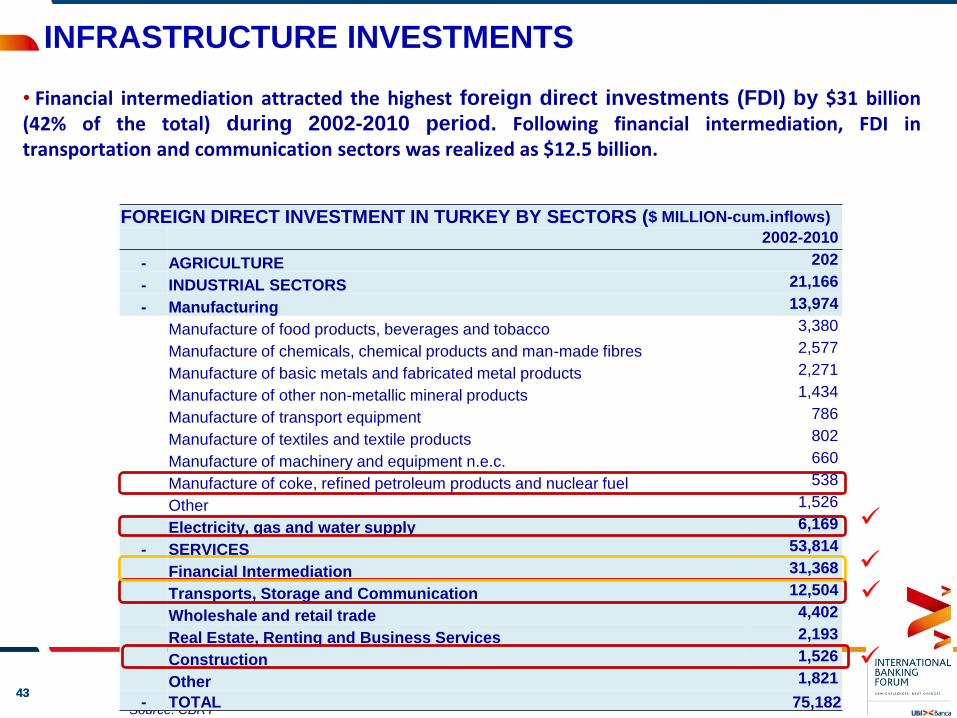
• Financial intermediation attracted the highest foreign direct investments (FDI) by $31 billion(42% of the total) during 2002-2010 period. Following financial intermediation, FDI intransportation and communication sectors was realized as $12.5 billion.
Source: CBRT
FOREIGN DIRECT INVESTMENT IN TURKEY BY SECTORS ($ MILLION-cum.inflows)
2002-2010
- AGRICULTURE 202
- INDUSTRIAL SECTORS 21,166
- Manufacturing 13,974
Manufacture of food products, beverages and tobacco 3,380
Manufacture of chemicals, chemical products and man-made fibres 2,577
Manufacture of basic metals and fabricated metal products 2,271
Manufacture of other non-metallic mineral products 1,434
Manufacture of transport equipment 786
Manufacture of textiles and textile products 802
Manufacture of machinery and equipment n.e.c. 660
Manufacture of coke, refined petroleum products and nuclear fuel 538
Other 1,526
Electricity, gas and water supply 6,169
- SERVICES 53,814
Financial Intermediation 31,368
Transports, Storage and Communication 12,504
Wholeshale and retail trade 4,402
Real Estate, Renting and Business Services 2,193
Construction 1,526
Other 1,821
- TOTAL 75,182
4444
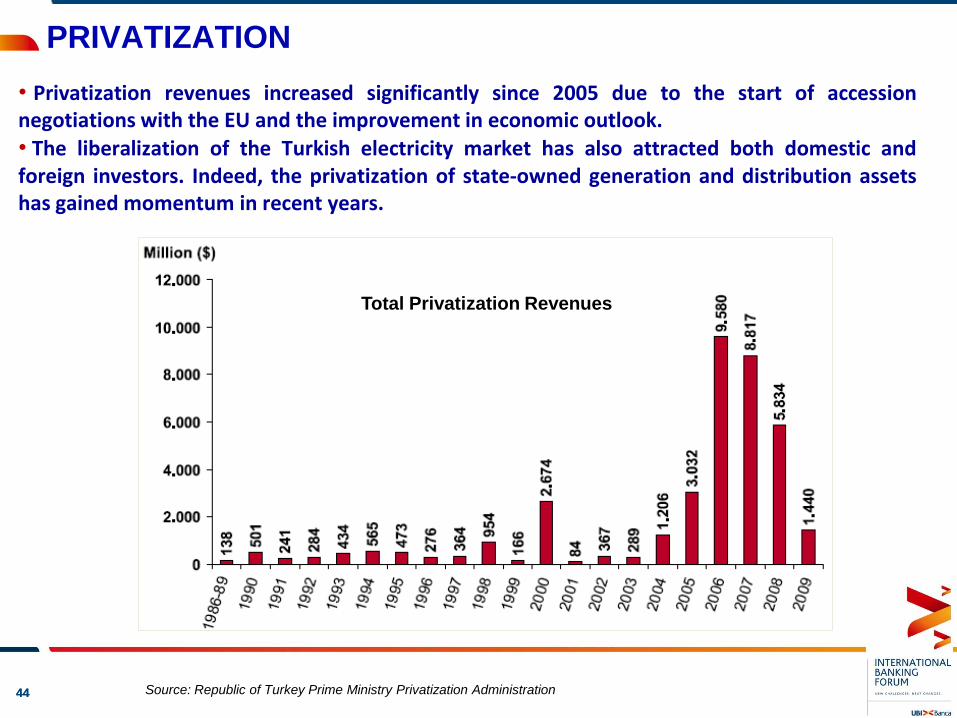
PRIVATIZATION
• Privatization revenues increased significantly since 2005 due to the start of accessionnegotiations with the EU and the improvement in economic outlook.• The liberalization of the Turkish electricity market has also attracted both domestic andforeign investors. Indeed, the privatization of state-owned generation and distribution assetshas gained momentum in recent years.
Total Privatization Revenues
Source: Republic of Turkey Prime Ministry Privatization Administration
4545
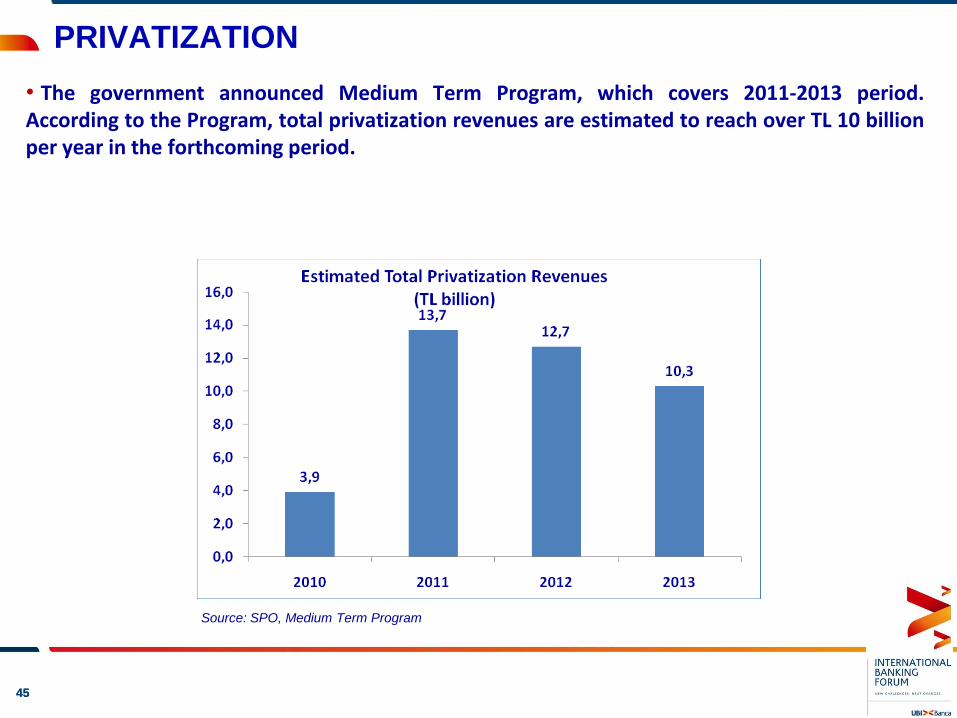
PRIVATIZATION
• The government announced Medium Term Program, which covers 2011-2013 period.According to the Program, total privatization revenues are estimated to reach over TL 10 billionper year in the forthcoming period.
Source: SPO, Medium Term Program
4646
FINANCING
• Project Loans Long-term and large scale
Win-Win Game
• Sources of Financing FDI, World Bank, European Investment Bank, DevelopmentAgencies and Banks
4747
CONCLUSION
• During 2011, in Turkey investments are estimated to realize around $30-40 billion in theenergy sector, $5 billion in the transportation sector (especially in highways).
• Commercial and corporate loans constitute half of the total loan portfolio of İşbank. Projectloans’ share in total corporate loans is around 30%.
• İşbank’s activities in project financing have been in the forefront. Having faith in Turkeyand the future of its real sector, İşbank signed project finance deals with maturities of up to10 years during the crisis period when global investment banking giants were forced intobankruptcy or a take-over. The resources our Bank provides for projects that constitute asfoundation stones for the future of Turkey, especially in the energy sector, have reachedsignificant levels.
4848
• Turkish Government targets: “Turkey will become the world's 10th largest economy by 2023”.Within this perspective, Turkish economy will need to grow at an average rate of 8% annuallyto achieve this goal.
• Energy demand is increasing steadily as a result of high economic growth, industrializationand urbanization. Turkey is a major energy importer since energy consumption exceeding itsproduction.
• Turkish energy sector has a high growth potential compared to other European countries.Turkey also has an advantage of operating as an energy hub between Europe and the MiddleEast.
• Turkish electricity market represents one of the most promising markets in the region withrespect to the growth potential in the coming years. The liberalization of the Turkish electricitymarket has attracted both domestic and foreign investors and more opportunities will occur inthe coming period.
• Turkey has also a high potential of resources for the use of new renewable energytechnologies. Turkey started to focus on renewable energy to decrease import dependency anddiversification of energy sources. Thus, tremendous investment opportunities exist inrenewable energy market.
CONCLUSION
4949
• Turkey attracted $75 billion FDI during 2002-2010 period. Financial intermediation,transportation and communication sectors attracted a great deal of FDI in this
period.
• The ongoing privatization process has also stimulated the infrastructure industry, particularlyin the construction and transportation sectors. Airports, ports, railways and roads are majorareas of investment in terms of infrastructure.
• The pipeline projects will provide secure energy resources for both Turkey and Europe.
• Privatization revenues rose significantly since 2005 due to the start of accession negotiationswith the EU and favorable economic outlook. According to the Government’s projections,privatization revenues are estimated to reach over TL 10 billion on annual basis during 2011-2013 period. Privatization of electricity generation and distribution companies would makesignificant contribution to revenues.
CONCLUSION
5050
Phone: E-mail:
İzlem Erdem +90 212 316 16 50 [email protected]
Mehtap Bingöl +90 212 316 16 58 [email protected]
Kıvılcım Eraydın +90 212 316 16 86 [email protected]
Erhan Gül +90 212 316 16 72 [email protected]
Aslı Göksun Şat +90 212 316 16 94 [email protected]
Bora Çevik +90 212 316 16 83 [email protected]
Eren Demir +90 212 316 16 73 [email protected]
ECONOMIC RESEARCH DIVISION
CONTACT INFO
This report has been prepared by Türkiye İş Bankası A.Ş. by using the information from publicly available sources believed to be reliable, solely for
information purposes. It is not intended to be construed as an offer or solicitation for the purchase or sale of any financial instrument or the provision
of an offer to provide investment services. No representation or warranty, express or implied, is made as to the accuracy or completeness of the
information contained in this report. All information contained in this report is subject to change without notice. Türkiye İş Bankası A.Ş. accepts no
liability whatsoever for any direct or consequential loss arising from any use of its publication or its contents.
Copyright and database rights protection exists in this publication and it may not be reproduced, distributed or published wholly or partially by any
person for any reason without the prior express consent of Türkiye İş Bankası A.Ş. All rights reserved.
ECONOMIC RESEARCH DIVISION