THE TRANSSHIPMENT PROBLEM IN TRAVEL FORECASTING… · THE TRANSSHIPMENT PROBLEM IN TRAVEL...
30
THE TRANSSHIPMENT PROBLEM IN TRAVEL FORECASTING: TOUR STRUCTURES FROM THE ONTARIO COMMERCIAL VEHICLE SURVEY University of Wisconsin – Milwaukee Paper No. 09-3 National Center for Freight & Infrastructure Research & Education College of Engineering Department of Civil and Environmental Engineering University of Wisconsin, Madison Authors: William Melendez-Melendez and Alan J. Horowitz Center for Urban Transportation Studies University of Wisconsin – Milwaukee Principal Investigator: Alan J. Horowitz Professor, Civil Engineering and Mechanics Department, University of Wisconsin – Milwaukee December 4, 2009
Transcript of THE TRANSSHIPMENT PROBLEM IN TRAVEL FORECASTING… · THE TRANSSHIPMENT PROBLEM IN TRAVEL...
THE TRANSSHIPMENT PROBLEM IN TRAVEL FORECASTING: TOUR STRUCTURES FROM THE ONTARIO COMMERCIAL VEHICLE SURVEY University of Wisconsin – Milwaukee Paper No. 09-3
National Center for Freight & Infrastructure Research & Education College of Engineering Department of Civil and Environmental Engineering University of Wisconsin, Madison
Authors: William Melendez-Melendez and Alan J. Horowitz Center for Urban Transportation Studies University of Wisconsin – Milwaukee Principal Investigator: Alan J. Horowitz Professor, Civil Engineering and Mechanics Department, University of Wisconsin – Milwaukee December 4, 2009
2
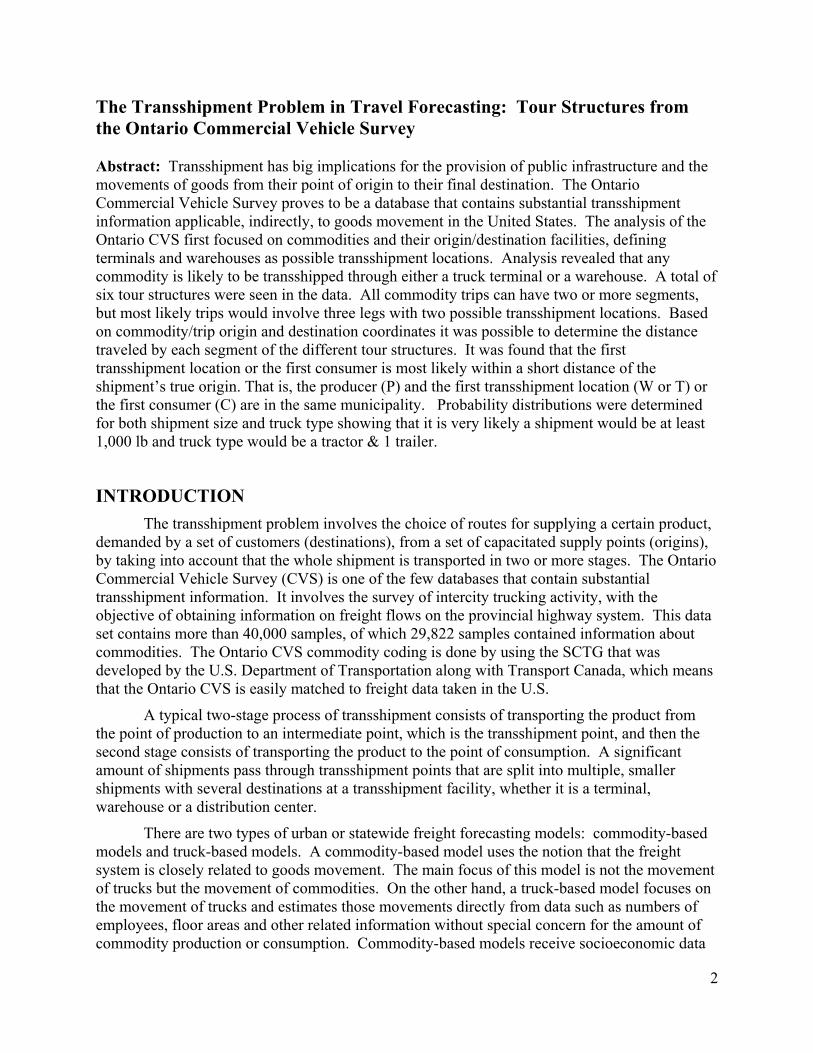
The Transshipment Problem in Travel Forecasting: Tour Structures from the Ontario Commercial Vehicle Survey Abstract: Transshipment has big implications for the provision of public infrastructure and the movements of goods from their point of origin to their final destination. The Ontario Commercial Vehicle Survey proves to be a database that contains substantial transshipment information applicable, indirectly, to goods movement in the United States. The analysis of the Ontario CVS first focused on commodities and their origin/destination facilities, defining terminals and warehouses as possible transshipment locations. Analysis revealed that any commodity is likely to be transshipped through either a truck terminal or a warehouse. A total of six tour structures were seen in the data. All commodity trips can have two or more segments, but most likely trips would involve three legs with two possible transshipment locations. Based on commodity/trip origin and destination coordinates it was possible to determine the distance traveled by each segment of the different tour structures. It was found that the first transshipment location or the first consumer is most likely within a short distance of the shipment’s true origin. That is, the producer (P) and the first transshipment location (W or T) or the first consumer (C) are in the same municipality. Probability distributions were determined for both shipment size and truck type showing that it is very likely a shipment would be at least 1,000 lb and truck type would be a tractor & 1 trailer.
INTRODUCTION The transshipment problem involves the choice of routes for supplying a certain product,
demanded by a set of customers (destinations), from a set of capacitated supply points (origins), by taking into account that the whole shipment is transported in two or more stages. The Ontario Commercial Vehicle Survey (CVS) is one of the few databases that contain substantial transshipment information. It involves the survey of intercity trucking activity, with the objective of obtaining information on freight flows on the provincial highway system. This data set contains more than 40,000 samples, of which 29,822 samples contained information about commodities. The Ontario CVS commodity coding is done by using the SCTG that was developed by the U.S. Department of Transportation along with Transport Canada, which means that the Ontario CVS is easily matched to freight data taken in the U.S.
A typical two-stage process of transshipment consists of transporting the product from the point of production to an intermediate point, which is the transshipment point, and then the second stage consists of transporting the product to the point of consumption. A significant amount of shipments pass through transshipment points that are split into multiple, smaller shipments with several destinations at a transshipment facility, whether it is a terminal, warehouse or a distribution center.
There are two types of urban or statewide freight forecasting models: commodity-based models and truck-based models. A commodity-based model uses the notion that the freight system is closely related to goods movement. The main focus of this model is not the movement of trucks but the movement of commodities. On the other hand, a truck-based model focuses on the movement of trucks and estimates those movements directly from data such as numbers of employees, floor areas and other related information without special concern for the amount of commodity production or consumption. Commodity-based models receive socioeconomic data
as input and give as output commodity quantity flows that can be converted into truck flows by vehicle load factors. The inputs to truck-based models are often similar but less detailed as they are able to skip commodities and provide truck flows directly as output. However, one of the most commonly seen approaches used for modeling is the synthesis of origin-destination (OD) matrices of commercial vehicle trips using one of many available expansion techniques. Commodity-based models are similar to standard four-step passenger models, with generation of shipments, distribution of shipments, mode split allocation of these shipments and the network assignment of the resulting vehicles.
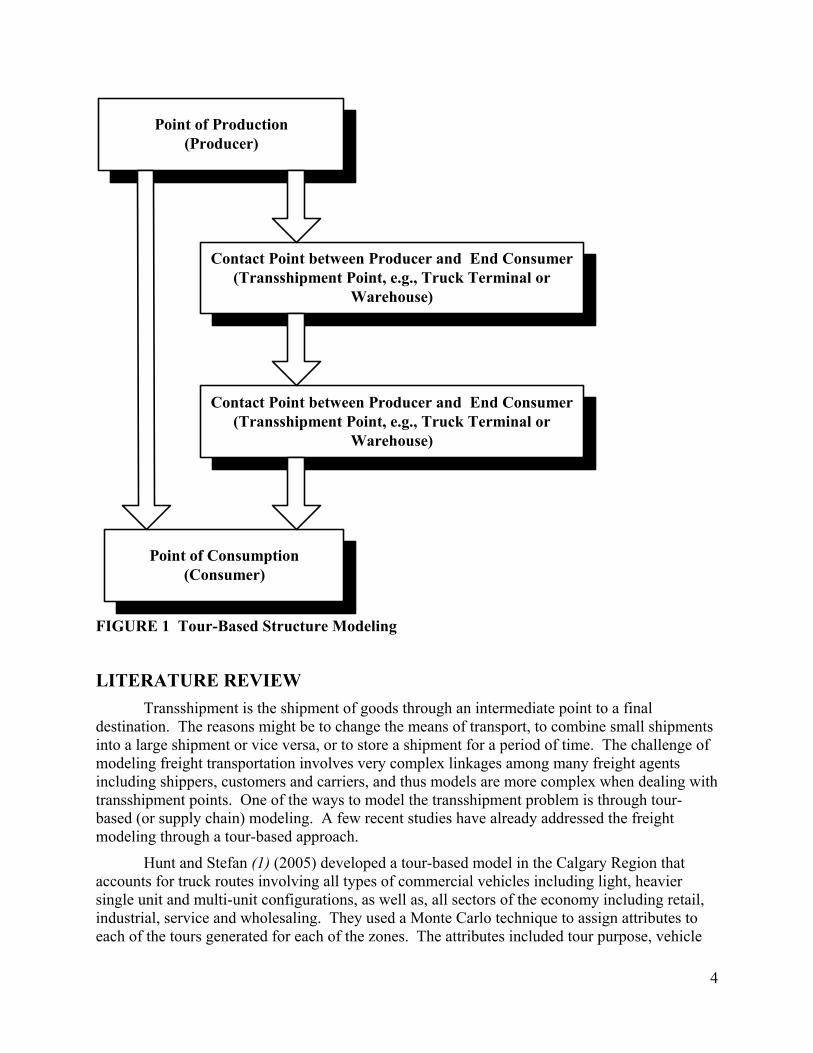
Two main classes of freight movements can be identified: end-consumer and logistics. End-consumer movements are those in which the freight is moved by the customer who purchases and consumes the freight, whereas logistics movements are those in which the freight reaches the facilities where it is delivered to markets for producing other products (goods) or services (for example, a movement from the warehouse to the retail outlet). A supply chain (or tour-based) modeling might be related as follows:
• The freight is moved from the production location to where it will be consumed by the end-consumer;
• One contact point between producer and end-consumer exists in which the freight is transferred from the producer to the end-consumer;
• There are one or more additional points for consolidating or deconsolidating a shipment between the producer and end-consumer
Figure 1 shows tour-based modeling. In this structure, the supply chain exists so long as the commodity remains intact or separately identifiable. As a convenience for data analysis, once the commodity is used as a raw material in another product or process, the supply chain is terminated.
3
Point of Production(Producer)
Point of Consumption(Consumer)
Contact Point between Producer and End Consumer(Transshipment Point, e.g., Truck Terminal or
Warehouse)
Contact Point between Producer and End Consumer(Transshipment Point, e.g., Truck Terminal or
Warehouse)
FIGURE 1 Tour-Based Structure Modeling
LITERATURE REVIEW Transshipment is the shipment of goods through an intermediate point to a final
destination. The reasons might be to change the means of transport, to combine small shipments into a large shipment or vice versa, or to store a shipment for a period of time. The challenge of modeling freight transportation involves very complex linkages among many freight agents including shippers, customers and carriers, and thus models are more complex when dealing with transshipment points. One of the ways to model the transshipment problem is through tour-based (or supply chain) modeling. A few recent studies have already addressed the freight modeling through a tour-based approach.
Hunt and Stefan (1) (2005) developed a tour-based model in the Calgary Region that accounts for truck routes involving all types of commercial vehicles including light, heavier single unit and multi-unit configurations, as well as, all sectors of the economy including retail, industrial, service and wholesaling. They used a Monte Carlo technique to assign attributes to each of the tours generated for each of the zones. The attributes included tour purpose, vehicle
4
type, next stop purpose, next stop location and next stop duration. Their overall framework first consisted of the number of tours based in each zone using an aggregate trip generation model. Then using a Monte Carlo process, the vehicle type and purpose for the tour were identified, followed by the specific tour start time, at which time the characteristics for the stops on the tour were identified, iterating stop by stop until the tour was finished. The tours were incrementally growing having a “return to establishment” alternative within the next stop purpose allocation. Their selection of probabilities used in the microsimulation process were established using logit models estimated using the choice data collected in the surveys for different segments of the full range commercial movements. They considered three vehicle categories: light vehicles, medium vehicles and heavy vehicles. Four stop and related trip purposes were considered: Goods, Services, Others and Return to Establishment. Five different establishments categories were considered: Industrial, Wholesale, Retail, Transport and Services. Each of these five categories were handled separately throughout the microsimulation, each with a largely unique set of coefficients throughout the process. The zones in the model were classified into five land uses types: Low Density, Residential, Retail and Commercial, Industrial and Employment Node. These types were used to differentiate coefficient values and resulting model sensitivities.
Gliebe, Cohen and Hunt (2) (2007) presented an activity-based model of commercial vehicle and person movements with data from Ohio. They were focused on the work done by Hunt and Stefan but enhanced the treatment of the temporal dimension within a behavioral, tour-based framework with explicit consideration of worker and vehicle movements rather than shipment movements. The model uses a dynamic discrete choice formulation that steps each simulated worker through their day, building up tours composed of stops for various purposes (Goods, Service, Meeting, Other and Return to Establishment), while tracking the elapsed time, time of day and adjusting probabilities. A tour-based location choice model selects activity stop locations, with location choices made later in the tour becoming increasingly sensitive to distance from the home establishment. All the models were then applied using Monte Carlo methods.
Wisetjindawat, Sano, Matsumoto and Raothanachonkun (3) (2007) developed a microsimulation model in such a way that the behavior of each freight agent is individually considered to determine the characteristics of each freight movement. The attributes of each freight agent were determined using a Monte Carlo simulation technique. They covered three of the four steps of the traditional approach including commodity production and consumption, commodity distribution, and conversion of commodity flows to truck flows through three stages: the delivery lot size and frequency, vehicle choice selection and vehicle routing models. The first step involved the amount of commodity production and consumption that were estimated using regression techniques. Then the generated commodities were linked from consumption points to production points according to the attractiveness of each production point resulting in commodity flows between consumption and production points. The commodities were then distributed over the entire area according to their relationships in supply chains, which were then converted to truck flows. The results finally were truck origin-destination matrices and the approximated distance traveled of truck by each truck type.
These three studies show that it is possible to incorporate transshipment within a microscopic simulation. However, such models require detailed statistics on tour formation and the lengths of each leg of the tour, among other important data items.
5
PRELIMINARY ANALISIS OF THE ONTARIO CVS
Commodities One key way of viewing possible transshipment location is through the different
commodities the trucks are shipping. The Ontario Commercial Vehicle Survey contains data from about 40,000 samples with 29,822 of them containing commodities. The Ontario CVS commodity codes are based on the SCTG, but the survey reported on more aggregated commodity categories, which are also consistent with the U.S. Commodity Flow Survey. The aggregated commodities are as follows.
1. Agricultural Products 2. Food 3. Minerals & Products 4. Petroleum & Products 5. Chemicals & Products 6. Wood & Products 7. Metals & Products 8. Machinery & Electrical 9. Manufactured Products 10. Transportation 11. Waste & Scrap
Facilities The facilities where the trips originate or end also has relevance in the transshipment
analysis. The Ontario CVS has established the following trip facilities for their database.
1. Truck Terminal- Your Carrier 2. Truck Terminal- Another Carrier 3. Rail Terminal 4. Marine Terminal 5. Airport Terminal 6. Primary Producer 7. Manufacturer 8. Warehouse/Distribution Center 9. Retail Outlet 10. Commercial/Office Building 11. Construction Sites 12. Residences 13. Home 14. Waste Facilities 15. Recreational Sites
Preliminary Data Analysis
As a matter of summary, the following tables resume the data analysis made in the previous paper (5) (2009). These results are further analyzed with the creation of tour structures.
6
7 T
AB
LE
1 T
rip
O-D
Fac
ility
Mat
rix
T
rip
Des
tinat
ion
Faci
lity
Tri
p O
rigi
n Fa
cilit
y
Tru
ck
Ter
min
al
- You
r C
arri
er
Tru
ck
Ter
min
al
- Ano
ther
C
arri
er
Rai
l T
erm
inal
M
arin
e T
erm
inal
A
irpo
rt
Ter
min
al
Prim
ary
Prod
ucer
M
anu-
fact
urer
T
ruck
Ter
min
al -
You
r C
arri
er56
34
120
1211
25
0 23
23
18
T
ruck
Ter
min
al -
Ano
ther
Car
rier
143
11
83
17
3 0
1 40
19
4
2
5
29
45
0 7
127
305
699
1048
12
4 66
36
18
17
0 47
66
533
61
19
23
22
93
782
96
8 0
5 2
20
72
6 1
1 1
1 2
3 19
2
0 1
0 1
5 11
0
0 0
0 4
5 10
0
0 0
1 3
16
10
1 0
0 0
4 49
10
0
0 0
0 3
1
189
46
4R
ail T
erm
inal
151
Mar
ine
Ter
min
al10
0A
irpo
rt T
erm
inal
81
00
Prim
ary
Prod
ucer
199
95
Man
ufac
ture
rW
areh
ouse
/Dis
trib
utio
n C
ente
rR
etai
l Out
let
Com
mer
cial
/Off
ice
Bui
ldin
gC
onst
ruct
ions
Site
sR
esid
ence
sH
ome
Was
te F
acili
ties
Rec
reat
iona
l Site
s

TA
BL
E 1
Tri
p O
-D F
acili
ty M
atri
x (c
ontin
uatio
n)
T
rip
Des
tinat
ion
Faci
lity
Tri
p O
rigi
n Fa
cilit
y
Tru
ck
Ter
min
al
- You
r C
arri
er
Tru
ck
Ter
min
al
- Ano
ther
C
arri
er
Rai
l T
erm
inal
M
arin
e T
erm
inal
A
irpo
rt
Ter
min
al
Prim
ary
Prod
ucer
M
anu-
fact
urer
T
ruck
Ter
min
al -
You
r C
arri
er56
34
250
23
23
18
120
1211
T
ruck
Ter
min
al -
Ano
ther
Car
rier
143
189
4 6
4 11
83
R
ail T
erm
inal
15
1 17
3
0 1
40
Mar
ine
Ter
min
al19
4
2 10
0
5 29
A
irpo
rt T
erm
inal
8 1
0 0
45
0 7
Prim
ary
Prod
ucer
127
19
9 9
5 30
5 69
9 M
anuf
actu
rer
1048
12
4 66
36
18
17
0 47
66
War
ehou
se/D
istr
ibut
ion
Cen
ter
533
61
19
23
22
93
782
Ret
ail O
utle
t96
8
0 5
2 20
72
C
omm
erci
al/O
ffic
e B
uild
ing
6 1
1 1
1 2
3 C
onst
ruct
ions
Site
s19
2
0 1
0 1
5 R
esid
ence
s11
0
0 0
0 4
5 H
ome
10
0 0
0 1
3 16
W
aste
Fac
ilitie
s10
1
0 0
0 4
49
Rec
reat
iona
l Site
s10
0
0 0
0 3
1
8
9
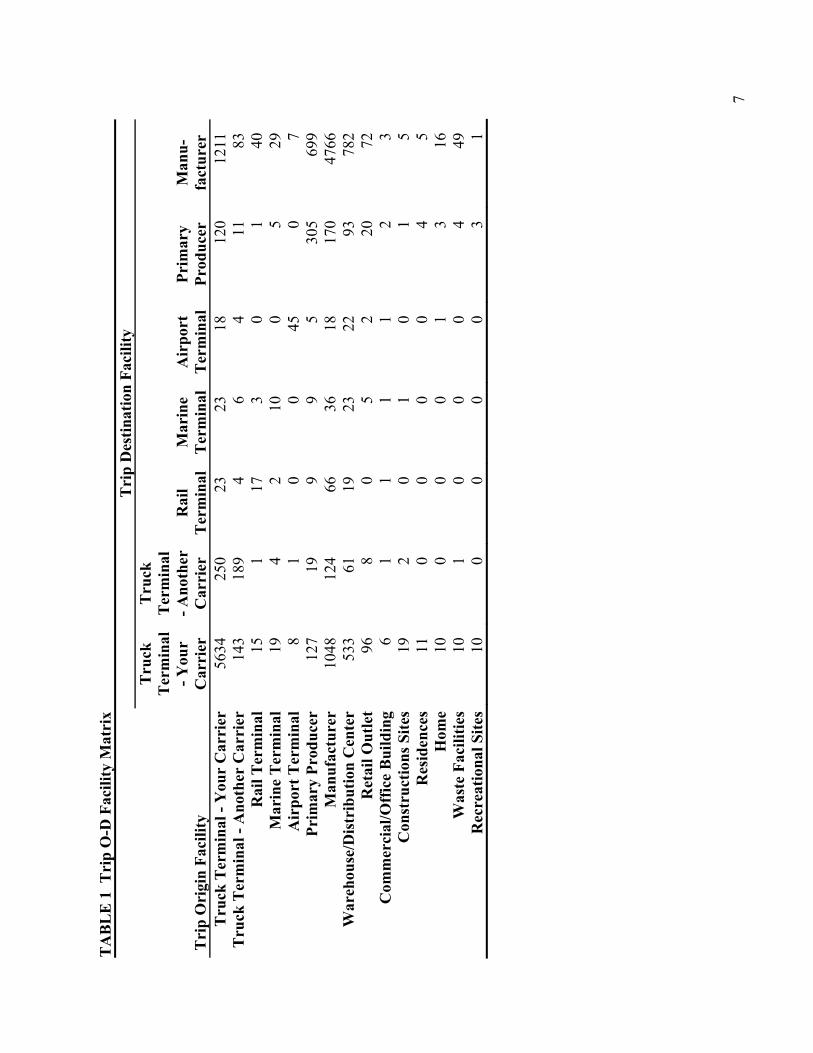
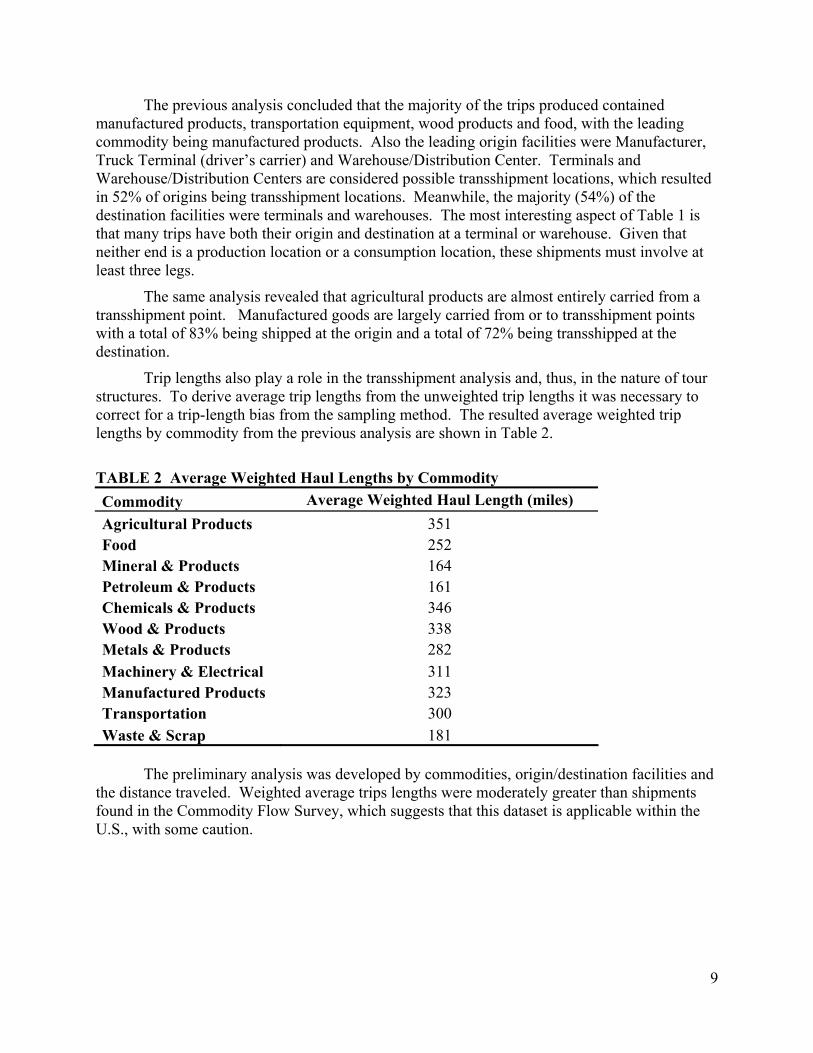
The previous analysis concluded that the majority of the trips produced contained manufactured products, transportation equipment, wood products and food, with the leading commodity being manufactured products. Also the leading origin facilities were Manufacturer, Truck Terminal (driver’s carrier) and Warehouse/Distribution Center. Terminals and Warehouse/Distribution Centers are considered possible transshipment locations, which resulted in 52% of origins being transshipment locations. Meanwhile, the majority (54%) of the destination facilities were terminals and warehouses. The most interesting aspect of Table 1 is that many trips have both their origin and destination at a terminal or warehouse. Given that neither end is a production location or a consumption location, these shipments must involve at least three legs.
The same analysis revealed that agricultural products are almost entirely carried from a transshipment point. Manufactured goods are largely carried from or to transshipment points with a total of 83% being shipped at the origin and a total of 72% being transshipped at the destination.
Trip lengths also play a role in the transshipment analysis and, thus, in the nature of tour structures. To derive average trip lengths from the unweighted trip lengths it was necessary to correct for a trip-length bias from the sampling method. The resulted average weighted trip lengths by commodity from the previous analysis are shown in Table 2.
TABLE 2 Average Weighted Haul Lengths by Commodity Commodity Average Weighted Haul Length (miles) Agricultural Products 351 Food 252 Mineral & Products 164 Petroleum & Products 161 Chemicals & Products 346 Wood & Products 338 Metals & Products 282 Machinery & Electrical 311 Manufactured Products 323 Transportation 300 Waste & Scrap 181
The preliminary analysis was developed by commodities, origin/destination facilities and
the distance traveled. Weighted average trips lengths were moderately greater than shipments found in the Commodity Flow Survey, which suggests that this dataset is applicable within the U.S., with some caution.
TOUR-BASED APPROACH DEVELOPMENT
Overview In order to develop an OD truck table to be assigned to a traffic network, a tour-based
approach has been developed using the Ontario Commercial Vehicle Survey database. This tour-based approach accounts for all the commodities provided in the database, involving two preliminary steps:
1. Establishment Selection 2. Shipment Generation
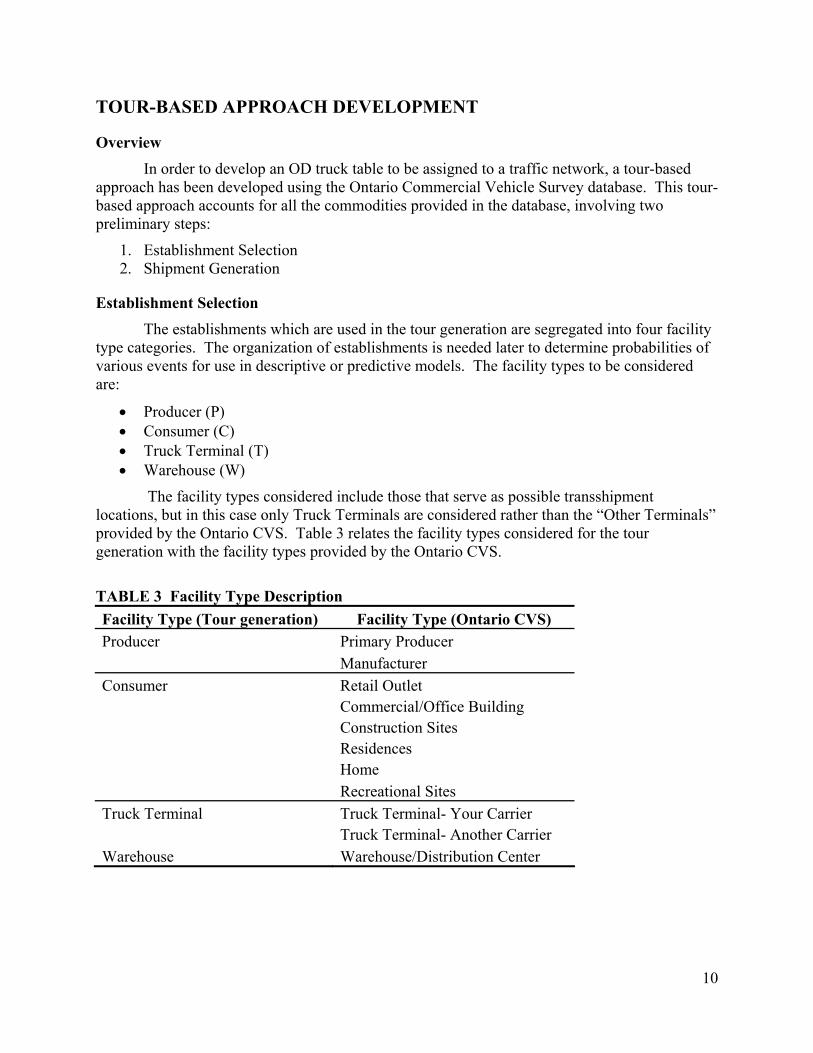
Establishment Selection The establishments which are used in the tour generation are segregated into four facility
type categories. The organization of establishments is needed later to determine probabilities of various events for use in descriptive or predictive models. The facility types to be considered are:
• Producer (P) • Consumer (C) • Truck Terminal (T) • Warehouse (W)
The facility types considered include those that serve as possible transshipment locations, but in this case only Truck Terminals are considered rather than the “Other Terminals” provided by the Ontario CVS. Table 3 relates the facility types considered for the tour generation with the facility types provided by the Ontario CVS.
TABLE 3 Facility Type Description Facility Type (Tour generation) Facility Type (Ontario CVS) Producer Primary Producer Manufacturer Consumer Retail Outlet Commercial/Office Building Construction Sites Residences Home Recreational Sites Truck Terminal Truck Terminal- Your Carrier Truck Terminal- Another Carrier Warehouse Warehouse/Distribution Center
10
11
TA
BL
E 4
Pro
babi
lity
Dis
trib
utio
n fo
r Fa
cilit
y T
ype
Com
mod
ity
Agr
icul
-tu
ral
Prod
ucts
Fo
od
Min
eral
s &
Pr
oduc
ts
Petr
oleu
m
& P
rodu
cts
Che
mic
als
& P
rodu
cts
Woo
d &
Pr
oduc
ts
Prod
ucer
of P
rodu
ct
0.41
0 0.
364
0.59
4 0.
448
0.48
5 0.
505
Con
sum
er o
f Pro
duct
0.
214
0.23
7 0.
242
0.30
2 0.
091
0.11
0 0.
260
0.31
5 0.
253
0.27
7 0.
307
0.30
7 0.
219
0.24
3 0.
210
0.22
6 0.
260
0.24
0 0.
267
0.28
7 0.
101
0.24
3 0.
171
0.14
6 0.
292
0.35
6 0.
166
0.18
4 0.
245
0.23
6
Tru
ck T
erm
inal
for
Prod
uct (
out)
Tru
ck T
erm
inal
for
Prod
uct (
in)
War
ehou
se fo
r Pr
oduc
ts (o
ut)
Prob
abili
ty
War
ehou
se fo
r Pr
oduc
ts (i
n)
TA
BL
E 4
Pro
babi
lity
Dis
trib
utio
n fo
r Fa
cilit
y T
ype
(con
tinua
tion)
C
omm
odity
Met
als &
Pr
oduc
ts
Mac
hine
ry
&
Ele
ctri
cal
Man
ufac
ture
d Pr
oduc
ts
Tra
nspo
rtat
ion
Was
te &
Sc
rap
Prod
ucer
of P
rodu
ct
0.53
4 0.
409
0.17
5 0.
492
0.40
2 C
onsu
mer
of P
rodu
ct
0.09
7 0.
156
0.17
7 0.
094
0.03
5 0.
481
0.35
0 0.
246
0.42
6 0.
314
0.20
9 0.
251
0.09
9 0.
114
0.26
9 0.
147
0.08
6
Tru
ck T
erm
inal
for
Prod
uct (
out)
0.
269
0.32
4 T
ruck
Ter
min
al fo
r Pr
oduc
t (in
) 0.
212
0.26
6 W
areh
ouse
for
Prod
ucts
(out
) 0.
150
0.17
8
Prob
abili
ty
War
ehou
se fo
r Pr
oduc
ts (i
n)
0.21
7 0.
235
12
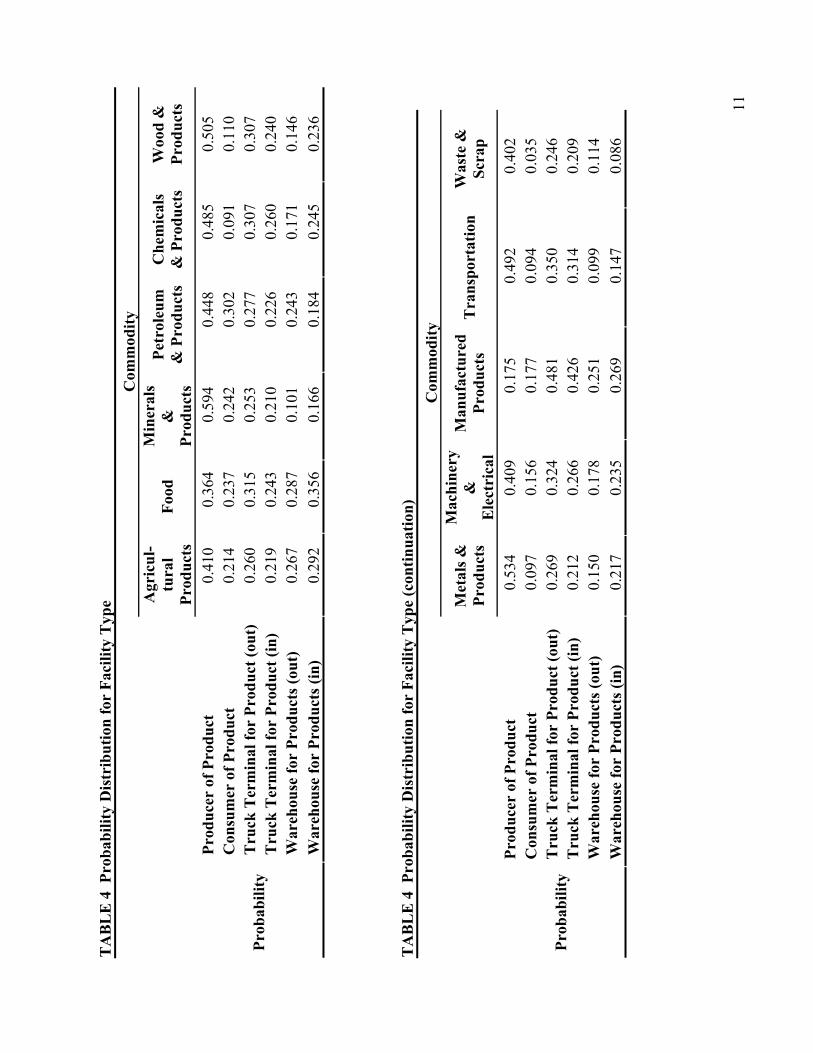
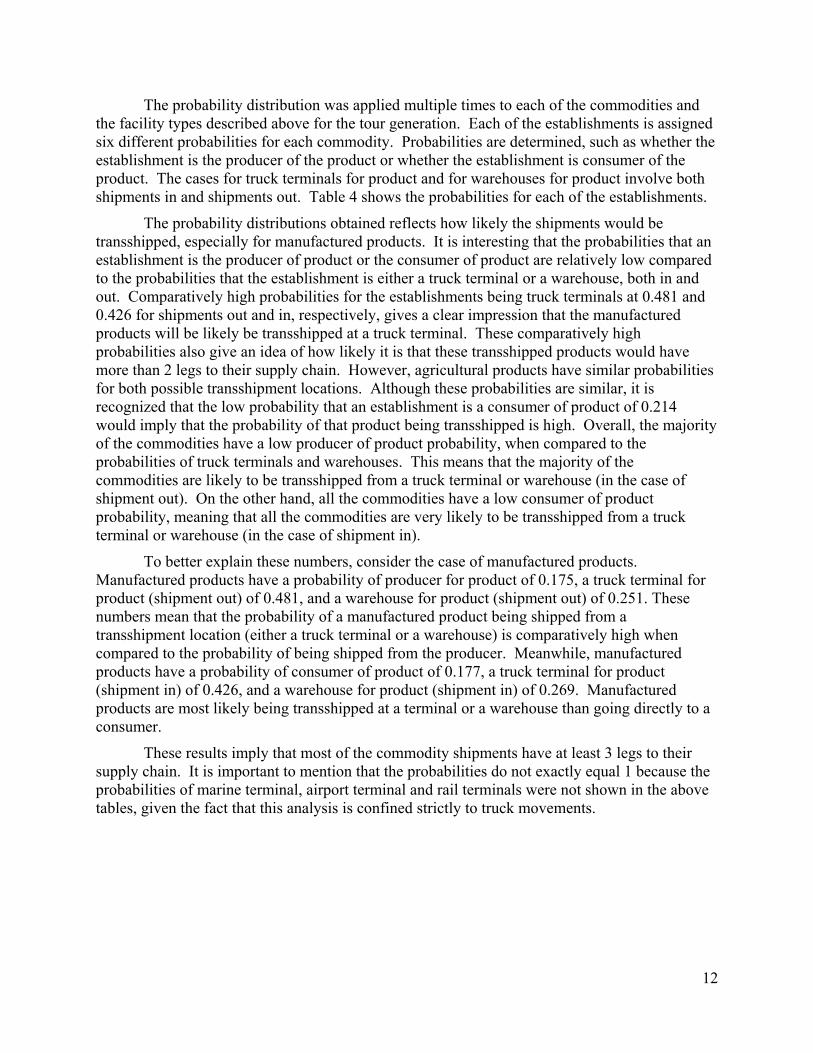
The probability distribution was applied multiple times to each of the commodities and the facility types described above for the tour generation. Each of the establishments is assigned six different probabilities for each commodity. Probabilities are determined, such as whether the establishment is the producer of the product or whether the establishment is consumer of the product. The cases for truck terminals for product and for warehouses for product involve both shipments in and shipments out. Table 4 shows the probabilities for each of the establishments.
The probability distributions obtained reflects how likely the shipments would be transshipped, especially for manufactured products. It is interesting that the probabilities that an establishment is the producer of product or the consumer of product are relatively low compared to the probabilities that the establishment is either a truck terminal or a warehouse, both in and out. Comparatively high probabilities for the establishments being truck terminals at 0.481 and 0.426 for shipments out and in, respectively, gives a clear impression that the manufactured products will be likely be transshipped at a truck terminal. These comparatively high probabilities also give an idea of how likely it is that these transshipped products would have more than 2 legs to their supply chain. However, agricultural products have similar probabilities for both possible transshipment locations. Although these probabilities are similar, it is recognized that the low probability that an establishment is a consumer of product of 0.214 would imply that the probability of that product being transshipped is high. Overall, the majority of the commodities have a low producer of product probability, when compared to the probabilities of truck terminals and warehouses. This means that the majority of the commodities are likely to be transshipped from a truck terminal or warehouse (in the case of shipment out). On the other hand, all the commodities have a low consumer of product probability, meaning that all the commodities are very likely to be transshipped from a truck terminal or warehouse (in the case of shipment in).
To better explain these numbers, consider the case of manufactured products. Manufactured products have a probability of producer for product of 0.175, a truck terminal for product (shipment out) of 0.481, and a warehouse for product (shipment out) of 0.251. These numbers mean that the probability of a manufactured product being shipped from a transshipment location (either a truck terminal or a warehouse) is comparatively high when compared to the probability of being shipped from the producer. Meanwhile, manufactured products have a probability of consumer of product of 0.177, a truck terminal for product (shipment in) of 0.426, and a warehouse for product (shipment in) of 0.269. Manufactured products are most likely being transshipped at a terminal or a warehouse than going directly to a consumer.
These results imply that most of the commodity shipments have at least 3 legs to their supply chain. It is important to mention that the probabilities do not exactly equal 1 because the probabilities of marine terminal, airport terminal and rail terminals were not shown in the above tables, given the fact that this analysis is confined strictly to truck movements.
13
Prod
ucer
(P)
Con
sum
er (C
)
Prod
ucer
(P)
Con
sum
er (C
)
War
ehou
se (W
)
Prod
ucer
(P)
Con
sum
er (C
)
Con
sum
er (C
)
Prod
ucer
(P)
Con
sum
er (C
)
War
ehou
se (W
)
War
ehou
se (W
)
Prod
ucer
(P)
Con
sum
er (C
)
War
ehou
se (W
)
Con
sum
er (C
)
Prod
ucer
(P)
Con
sum
er (C
)
Con
sum
er (C
)
Con
sum
er
(C)
FI
GU
RE
2 T
our
Stru
ctur
es
14
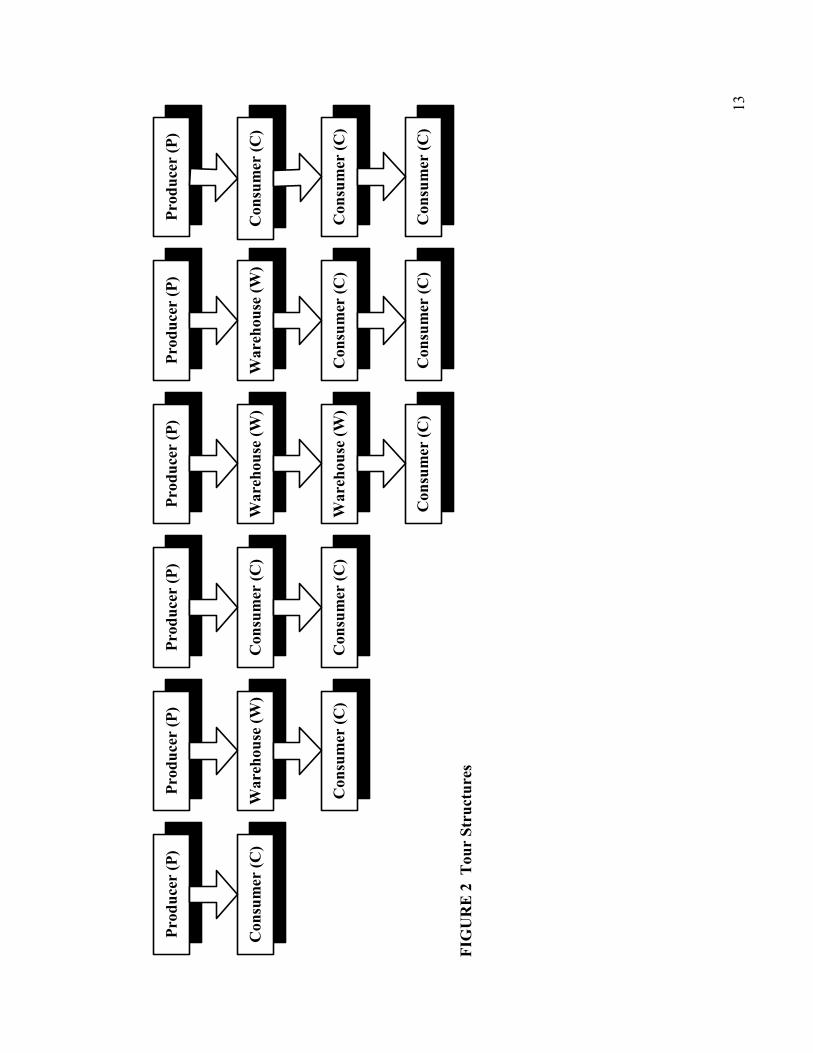
Tour Structures The above analysis revealed that most of the commodities would likely be involved on a
supply chain of at least 3 legs. This involves its point of origin (from its producer), going through at least two transshipment locations (truck terminals or warehouses), and finally to its point of destination or its consumer. The next analysis involves tour structures. Table 3 relates the facility types considered based on the Ontario CVS and the facility types organized for this analysis, but within the tour structures the “W” term includes both truck terminals and warehouses. Figure 2 summarizes those structures that could be discerned from the Ontario CVS.
The tour structures were generated based on information about commodity origin/destination and trip origin/destination on the Ontario CVS, recognizing that the trip and commodity may not travel between the same locations. Full information was available only about trip origins and destinations, so it was necessary to assume that the producer (P) was nearer the commodity origin and the last consumer (C) was nearer the commodity destination. For those tour structures that have three legs, the middle two establishments were taken to be the trip origin and the trip destination, while the outer establishments were taken to be the commodity origin and commodity destination. For those tours of exactly two legs either the commodity origin and trip origin or the commodity destination and trip destination were the same. Finally, the simplist case was P-C, where commodity origin was the same as the trip origin and commodity destination was the same as trip destination. Some trips identified multiple destinations in the database, so these were classified separately (P-C-C, P-W-C-C or P-C-C-C). Table 5 shows the number of tour structures that could be found in the database.
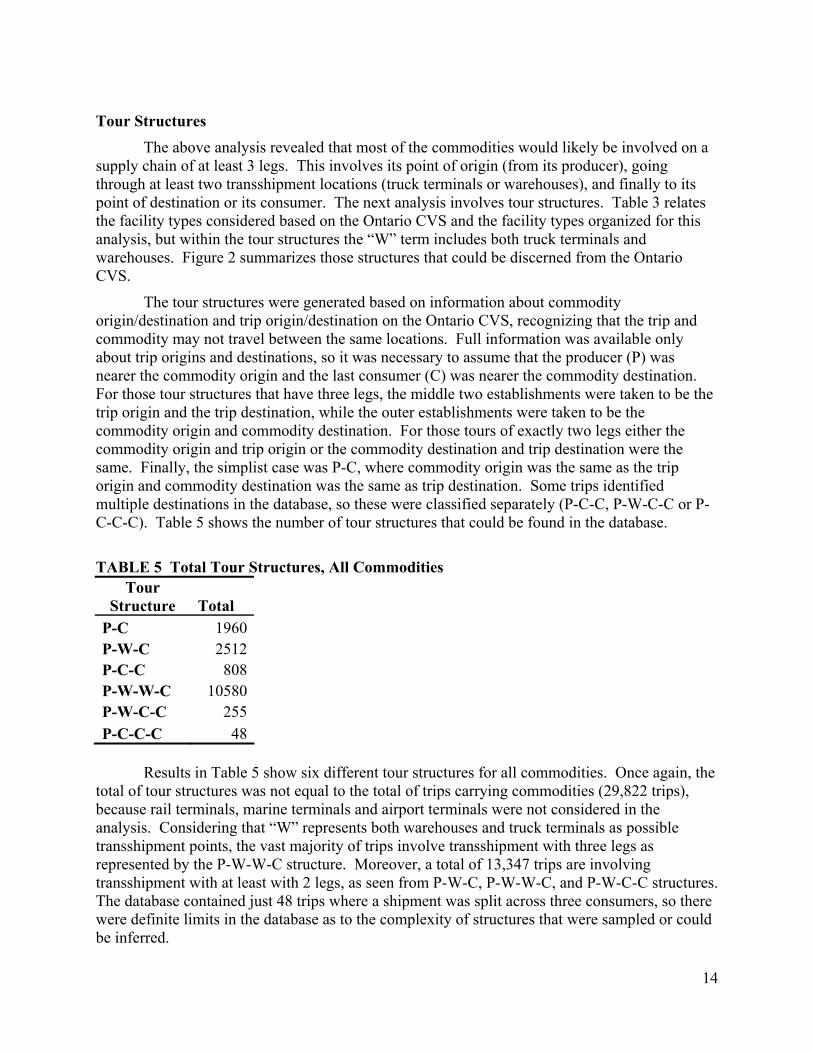
TABLE 5 Total Tour Structures, All Commodities
Tour Structure Total
P-C 1960 P-W-C 2512 P-C-C 808 P-W-W-C 10580 P-W-C-C 255 P-C-C-C 48
Results in Table 5 show six different tour structures for all commodities. Once again, the
total of tour structures was not equal to the total of trips carrying commodities (29,822 trips), because rail terminals, marine terminals and airport terminals were not considered in the analysis. Considering that “W” represents both warehouses and truck terminals as possible transshipment points, the vast majority of trips involve transshipment with three legs as represented by the P-W-W-C structure. Moreover, a total of 13,347 trips are involving transshipment with at least with 2 legs, as seen from P-W-C, P-W-W-C, and P-W-C-C structures. The database contained just 48 trips where a shipment was split across three consumers, so there were definite limits in the database as to the complexity of structures that were sampled or could be inferred.
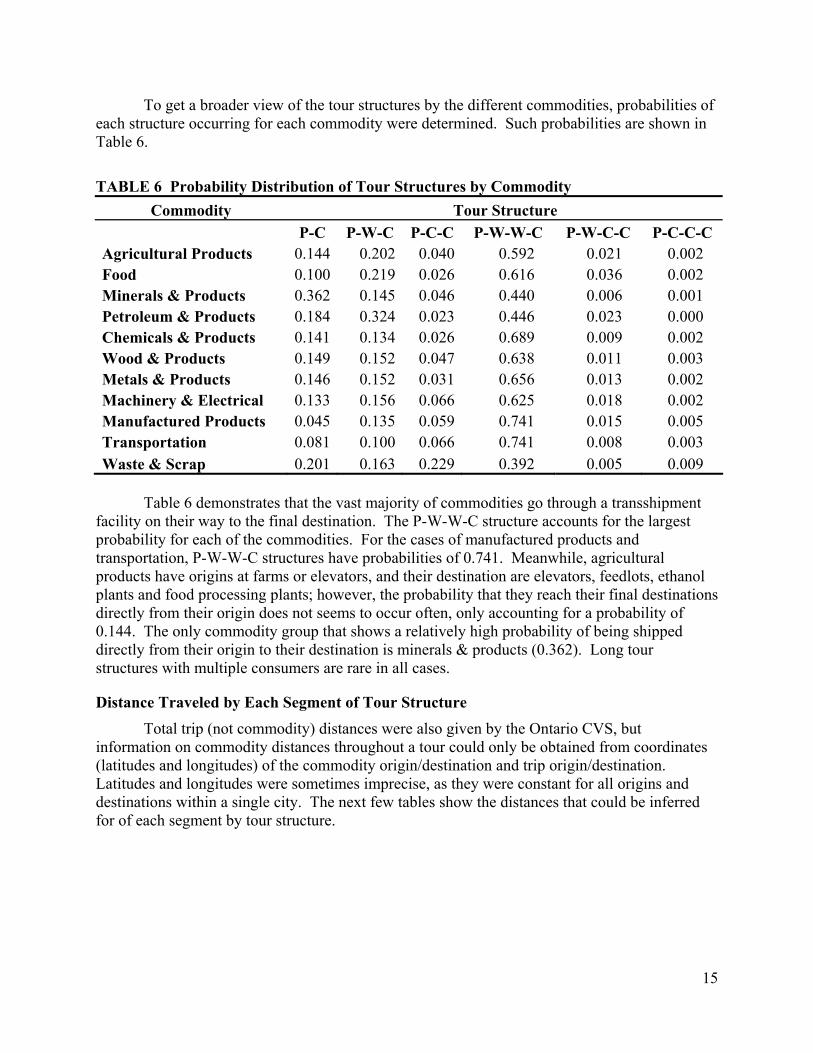
To get a broader view of the tour structures by the different commodities, probabilities of each structure occurring for each commodity were determined. Such probabilities are shown in Table 6.
TABLE 6 Probability Distribution of Tour Structures by Commodity
Commodity Tour Structure P-C P-W-C P-C-C P-W-W-C P-W-C-C P-C-C-C Agricultural Products 0.144 0.202 0.040 0.592 0.021 0.002 Food 0.100 0.219 0.026 0.616 0.036 0.002 Minerals & Products 0.362 0.145 0.046 0.440 0.006 0.001 Petroleum & Products 0.184 0.324 0.023 0.446 0.023 0.000 Chemicals & Products 0.141 0.134 0.026 0.689 0.009 0.002 Wood & Products 0.149 0.152 0.047 0.638 0.011 0.003 Metals & Products 0.146 0.152 0.031 0.656 0.013 0.002 Machinery & Electrical 0.133 0.156 0.066 0.625 0.018 0.002 Manufactured Products 0.045 0.135 0.059 0.741 0.015 0.005 Transportation 0.081 0.100 0.066 0.741 0.008 0.003 Waste & Scrap 0.201 0.163 0.229 0.392 0.005 0.009
Table 6 demonstrates that the vast majority of commodities go through a transshipment
facility on their way to the final destination. The P-W-W-C structure accounts for the largest probability for each of the commodities. For the cases of manufactured products and transportation, P-W-W-C structures have probabilities of 0.741. Meanwhile, agricultural products have origins at farms or elevators, and their destination are elevators, feedlots, ethanol plants and food processing plants; however, the probability that they reach their final destinations directly from their origin does not seems to occur often, only accounting for a probability of 0.144. The only commodity group that shows a relatively high probability of being shipped directly from their origin to their destination is minerals & products (0.362). Long tour structures with multiple consumers are rare in all cases.
Distance Traveled by Each Segment of Tour Structure Total trip (not commodity) distances were also given by the Ontario CVS, but
information on commodity distances throughout a tour could only be obtained from coordinates (latitudes and longitudes) of the commodity origin/destination and trip origin/destination. Latitudes and longitudes were sometimes imprecise, as they were constant for all origins and destinations within a single city. The next few tables show the distances that could be inferred for of each segment by tour structure.
15
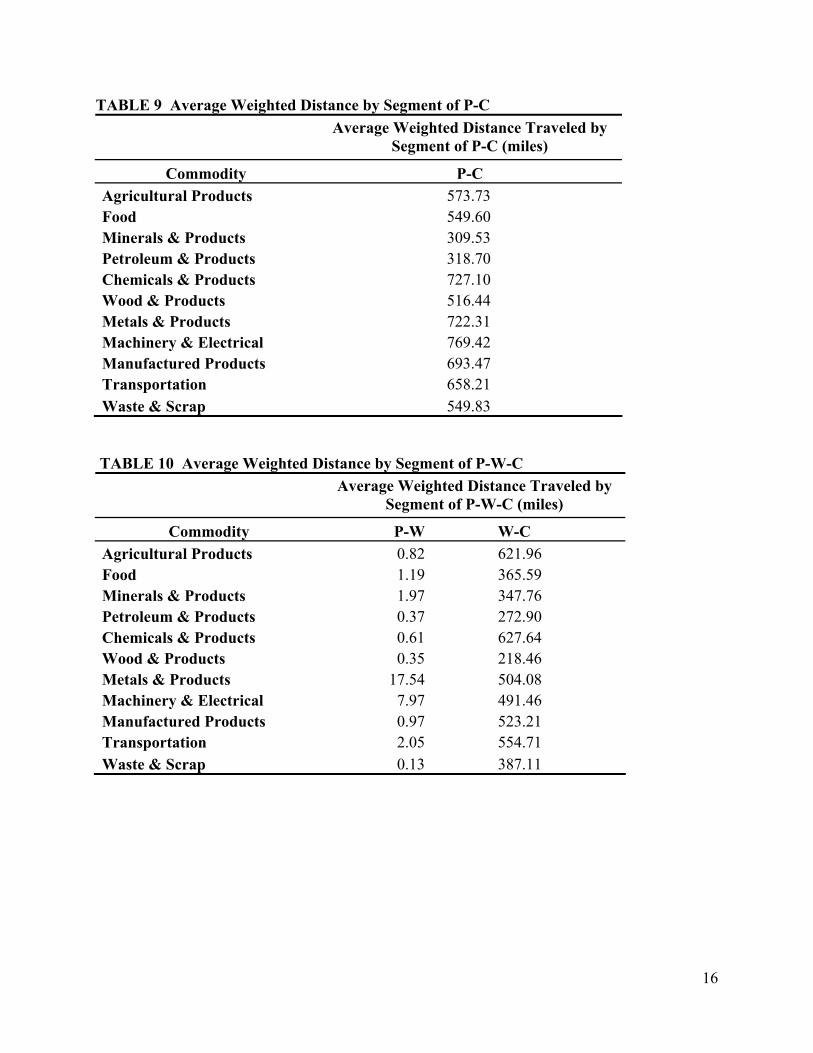
TABLE 9 Average Weighted Distance by Segment of P-C
Average Weighted Distance Traveled by Segment of P-C (miles)
Commodity P-C Agricultural Products 573.73 Food 549.60 Minerals & Products 309.53 Petroleum & Products 318.70 Chemicals & Products 727.10 Wood & Products 516.44 Metals & Products 722.31 Machinery & Electrical 769.42 Manufactured Products 693.47 Transportation 658.21 Waste & Scrap 549.83
TABLE 10 Average Weighted Distance by Segment of P-W-C
Average Weighted Distance Traveled by Segment of P-W-C (miles)
Commodity P-W W-C Agricultural Products 0.82 621.96 Food 1.19 365.59 Minerals & Products 1.97 347.76 Petroleum & Products 0.37 272.90 Chemicals & Products 0.61 627.64 Wood & Products 0.35 218.46 Metals & Products 17.54 504.08 Machinery & Electrical 7.97 491.46 Manufactured Products 0.97 523.21 Transportation 2.05 554.71 Waste & Scrap 0.13 387.11
16
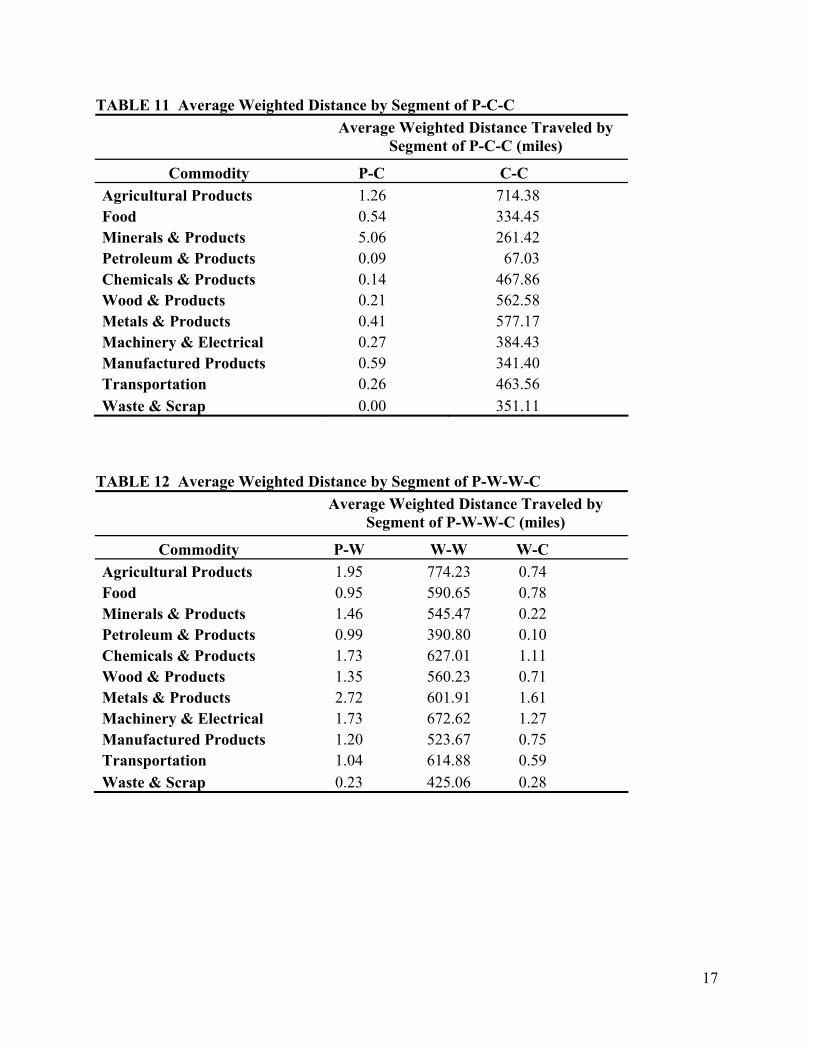
TABLE 11 Average Weighted Distance by Segment of P-C-C
Average Weighted Distance Traveled by Segment of P-C-C (miles)
Commodity P-C C-C Agricultural Products 1.26 714.38 Food 0.54 334.45 Minerals & Products 5.06 261.42 Petroleum & Products 0.09 67.03 Chemicals & Products 0.14 467.86 Wood & Products 0.21 562.58 Metals & Products 0.41 577.17 Machinery & Electrical 0.27 384.43 Manufactured Products 0.59 341.40 Transportation 0.26 463.56 Waste & Scrap 0.00 351.11
TABLE 12 Average Weighted Distance by Segment of P-W-W-C
Average Weighted Distance Traveled by Segment of P-W-W-C (miles)
Commodity P-W W-W W-C Agricultural Products 1.95 774.23 0.74 Food 0.95 590.65 0.78 Minerals & Products 1.46 545.47 0.22 Petroleum & Products 0.99 390.80 0.10 Chemicals & Products 1.73 627.01 1.11 Wood & Products 1.35 560.23 0.71 Metals & Products 2.72 601.91 1.61 Machinery & Electrical 1.73 672.62 1.27 Manufactured Products 1.20 523.67 0.75 Transportation 1.04 614.88 0.59 Waste & Scrap 0.23 425.06 0.28
17
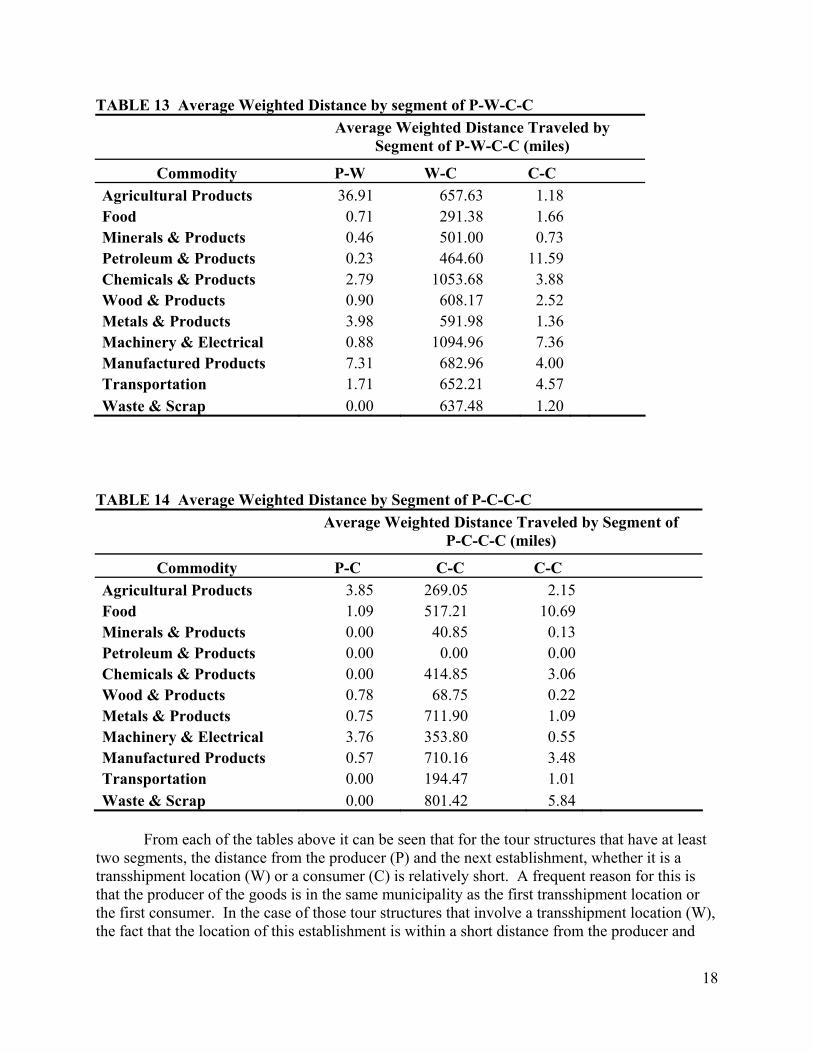
TABLE 13 Average Weighted Distance by segment of P-W-C-C
Average Weighted Distance Traveled by Segment of P-W-C-C (miles)
Commodity P-W W-C C-C Agricultural Products 36.91 657.63 1.18 Food 0.71 291.38 1.66 Minerals & Products 0.46 501.00 0.73 Petroleum & Products 0.23 464.60 11.59 Chemicals & Products 2.79 1053.68 3.88 Wood & Products 0.90 608.17 2.52 Metals & Products 3.98 591.98 1.36 Machinery & Electrical 0.88 1094.96 7.36 Manufactured Products 7.31 682.96 4.00 Transportation 1.71 652.21 4.57 Waste & Scrap 0.00 637.48 1.20
TABLE 14 Average Weighted Distance by Segment of P-C-C-C
Average Weighted Distance Traveled by Segment of P-C-C-C (miles)
Commodity P-C C-C C-C Agricultural Products 3.85 269.05 2.15 Food 1.09 517.21 10.69 Minerals & Products 0.00 40.85 0.13 Petroleum & Products 0.00 0.00 0.00 Chemicals & Products 0.00 414.85 3.06 Wood & Products 0.78 68.75 0.22 Metals & Products 0.75 711.90 1.09 Machinery & Electrical 3.76 353.80 0.55 Manufactured Products 0.57 710.16 3.48 Transportation 0.00 194.47 1.01 Waste & Scrap 0.00 801.42 5.84
From each of the tables above it can be seen that for the tour structures that have at least
two segments, the distance from the producer (P) and the next establishment, whether it is a transshipment location (W) or a consumer (C) is relatively short. A frequent reason for this is that the producer of the goods is in the same municipality as the first transshipment location or the first consumer. In the case of those tour structures that involve a transshipment location (W), the fact that the location of this establishment is within a short distance from the producer and
18
that the second segment has a much larger distance traveled is very reasonable. If a shipment is going to be transshipped, it is very likely that the distance from the transshipment facility to its final destination (could be a final consumer or another transshipment location) will be large. The distances shown for the last segment of the P-W-W-C structure are also very reasonable because after the shipment is transshipped to any location, then the distance to its final destination would be short. Some commodities did not show any distance traveled for the first segment of some tour structure, like P-C-C-C, because both the producer and the next establishment have the same coordinates latitude and longitude.
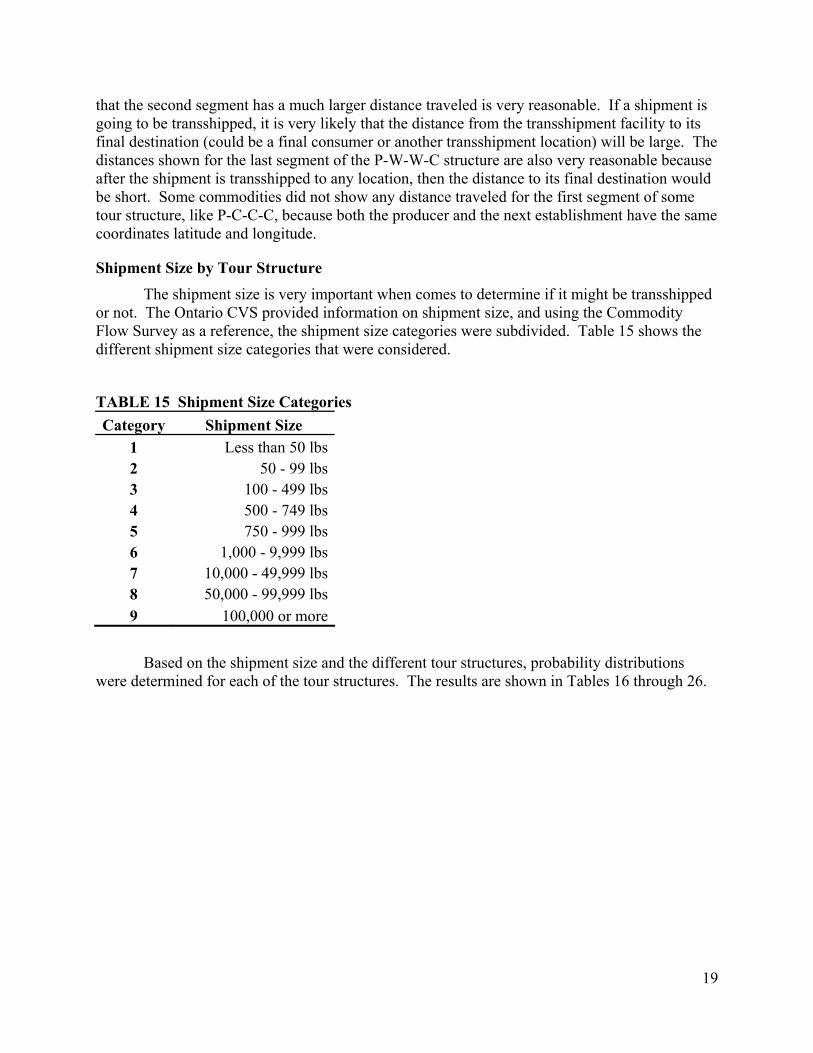
Shipment Size by Tour Structure The shipment size is very important when comes to determine if it might be transshipped or not. The Ontario CVS provided information on shipment size, and using the Commodity Flow Survey as a reference, the shipment size categories were subdivided. Table 15 shows the different shipment size categories that were considered.
TABLE 15 Shipment Size Categories Category Shipment Size
1 Less than 50 lbs2 50 - 99 lbs3 100 - 499 lbs4 500 - 749 lbs5 750 - 999 lbs6 1,000 - 9,999 lbs7 10,000 - 49,999 lbs8 50,000 - 99,999 lbs9 100,000 or more
Based on the shipment size and the different tour structures, probability distributions were determined for each of the tour structures. The results are shown in Tables 16 through 26.
19

TABLE 16 Probability Distributions of Shipment Size by Tour Structure for Agricultural Products
Agricultural Products Category P-C P-W-C P-C-C P-W-W-C P-W-C-C P-C-C-C
1 0.000 0.000 0.024 0.000 0.000 0.000 2 0.000 0.014 0.000 0.002 0.000 0.000 3 0.013 0.033 0.048 0.029 0.000 0.000 4 0.033 0.033 0.024 0.024 0.091 0.500 5 0.053 0.051 0.024 0.065 0.000 0.000 6 0.322 0.256 0.310 0.306 0.182 0.500 7 0.250 0.256 0.262 0.239 0.364 0.000 8 0.105 0.107 0.095 0.083 0.136 0.000 9 0.224 0.251 0.214 0.252 0.227 0.000
TABLE 17 Probability Distributions of Shipment Size by Tour Structure for Food Food
Category P-C P-W-C P-C-C P-W-W-C P-W-C-C P-C-C-C 1 0.005 0.008 0.018 0.003 0.013 0.000 2 0.014 0.011 0.000 0.003 0.000 0.000 3 0.028 0.044 0.071 0.026 0.064 0.000 4 0.019 0.030 0.000 0.031 0.051 0.250 5 0.037 0.034 0.054 0.035 0.013 0.000 6 0.292 0.294 0.518 0.304 0.308 0.000 7 0.259 0.228 0.161 0.216 0.308 0.500 8 0.088 0.110 0.107 0.100 0.090 0.000 9 0.259 0.241 0.071 0.283 0.154 0.250
20
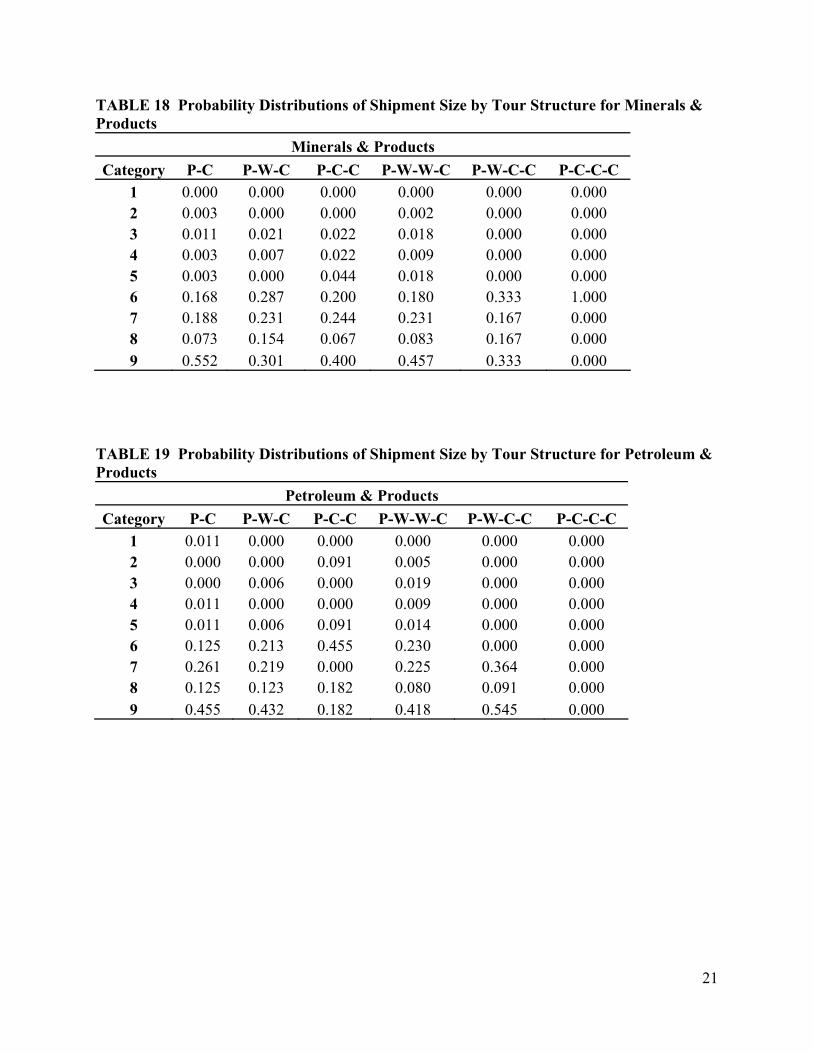
TABLE 18 Probability Distributions of Shipment Size by Tour Structure for Minerals & Products
Minerals & Products Category P-C P-W-C P-C-C P-W-W-C P-W-C-C P-C-C-C
1 0.000 0.000 0.000 0.000 0.000 0.000 2 0.003 0.000 0.000 0.002 0.000 0.000 3 0.011 0.021 0.022 0.018 0.000 0.000 4 0.003 0.007 0.022 0.009 0.000 0.000 5 0.003 0.000 0.044 0.018 0.000 0.000 6 0.168 0.287 0.200 0.180 0.333 1.000 7 0.188 0.231 0.244 0.231 0.167 0.000 8 0.073 0.154 0.067 0.083 0.167 0.000 9 0.552 0.301 0.400 0.457 0.333 0.000
TABLE 19 Probability Distributions of Shipment Size by Tour Structure for Petroleum & Products
Petroleum & Products Category P-C P-W-C P-C-C P-W-W-C P-W-C-C P-C-C-C
1 0.011 0.000 0.000 0.000 0.000 0.000 2 0.000 0.000 0.091 0.005 0.000 0.000 3 0.000 0.006 0.000 0.019 0.000 0.000 4 0.011 0.000 0.000 0.009 0.000 0.000 5 0.011 0.006 0.091 0.014 0.000 0.000 6 0.125 0.213 0.455 0.230 0.000 0.000 7 0.261 0.219 0.000 0.225 0.364 0.000 8 0.125 0.123 0.182 0.080 0.091 0.000 9 0.455 0.432 0.182 0.418 0.545 0.000
21
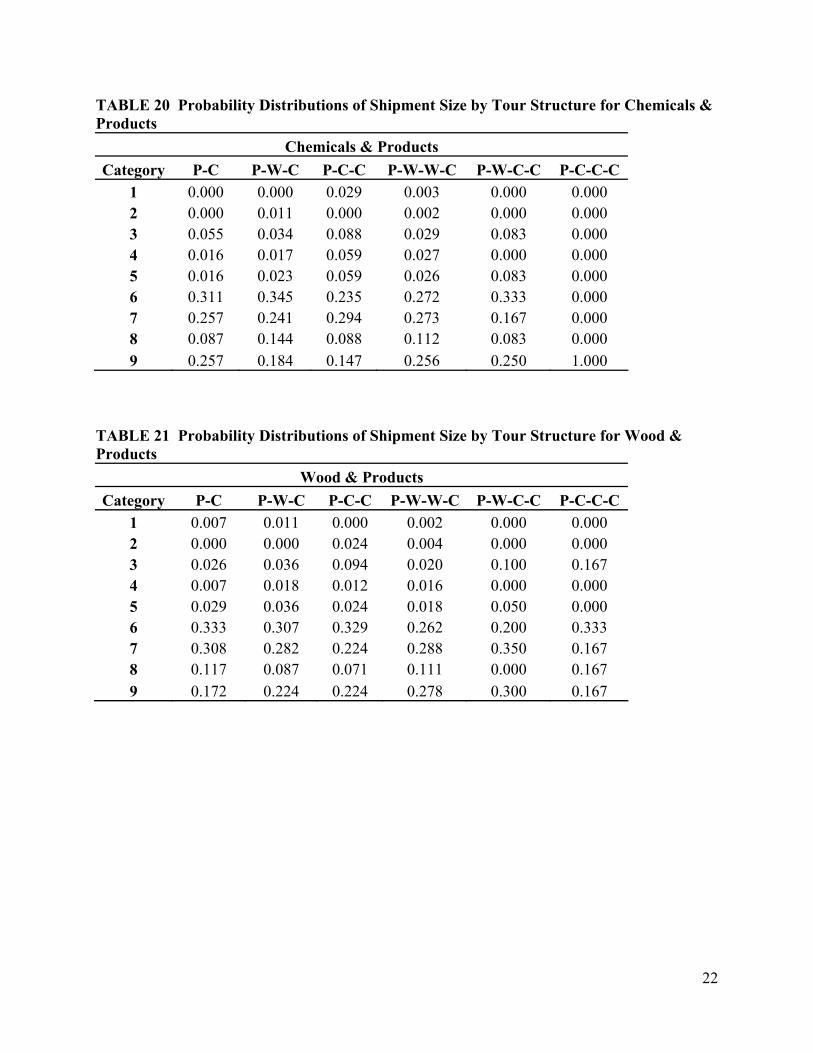
TABLE 20 Probability Distributions of Shipment Size by Tour Structure for Chemicals & Products
Chemicals & Products Category P-C P-W-C P-C-C P-W-W-C P-W-C-C P-C-C-C
1 0.000 0.000 0.029 0.003 0.000 0.000 2 0.000 0.011 0.000 0.002 0.000 0.000 3 0.055 0.034 0.088 0.029 0.083 0.000 4 0.016 0.017 0.059 0.027 0.000 0.000 5 0.016 0.023 0.059 0.026 0.083 0.000 6 0.311 0.345 0.235 0.272 0.333 0.000 7 0.257 0.241 0.294 0.273 0.167 0.000 8 0.087 0.144 0.088 0.112 0.083 0.000 9 0.257 0.184 0.147 0.256 0.250 1.000
TABLE 21 Probability Distributions of Shipment Size by Tour Structure for Wood & Products
Wood & Products Category P-C P-W-C P-C-C P-W-W-C P-W-C-C P-C-C-C
1 0.007 0.011 0.000 0.002 0.000 0.000 2 0.000 0.000 0.024 0.004 0.000 0.000 3 0.026 0.036 0.094 0.020 0.100 0.167 4 0.007 0.018 0.012 0.016 0.000 0.000 5 0.029 0.036 0.024 0.018 0.050 0.000 6 0.333 0.307 0.329 0.262 0.200 0.333 7 0.308 0.282 0.224 0.288 0.350 0.167 8 0.117 0.087 0.071 0.111 0.000 0.167 9 0.172 0.224 0.224 0.278 0.300 0.167
22
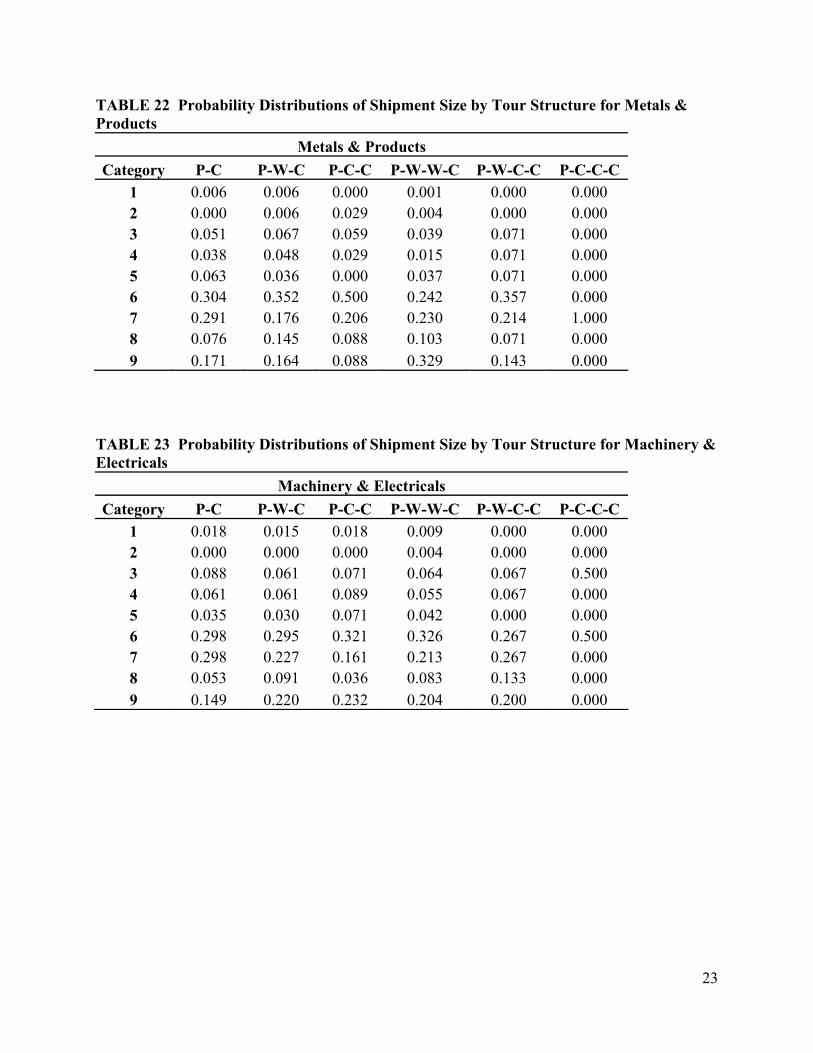
TABLE 22 Probability Distributions of Shipment Size by Tour Structure for Metals & Products
Metals & Products Category P-C P-W-C P-C-C P-W-W-C P-W-C-C P-C-C-C
1 0.006 0.006 0.000 0.001 0.000 0.000 2 0.000 0.006 0.029 0.004 0.000 0.000 3 0.051 0.067 0.059 0.039 0.071 0.000 4 0.038 0.048 0.029 0.015 0.071 0.000 5 0.063 0.036 0.000 0.037 0.071 0.000 6 0.304 0.352 0.500 0.242 0.357 0.000 7 0.291 0.176 0.206 0.230 0.214 1.000 8 0.076 0.145 0.088 0.103 0.071 0.000 9 0.171 0.164 0.088 0.329 0.143 0.000
TABLE 23 Probability Distributions of Shipment Size by Tour Structure for Machinery & Electricals
Machinery & Electricals Category P-C P-W-C P-C-C P-W-W-C P-W-C-C P-C-C-C
1 0.018 0.015 0.018 0.009 0.000 0.000 2 0.000 0.000 0.000 0.004 0.000 0.000 3 0.088 0.061 0.071 0.064 0.067 0.500 4 0.061 0.061 0.089 0.055 0.067 0.000 5 0.035 0.030 0.071 0.042 0.000 0.000 6 0.298 0.295 0.321 0.326 0.267 0.500 7 0.298 0.227 0.161 0.213 0.267 0.000 8 0.053 0.091 0.036 0.083 0.133 0.000 9 0.149 0.220 0.232 0.204 0.200 0.000
23

TABLE 24 Probability Distributions of Shipment Size by Tour Structure for Manufactured Products
Manufactured Products Category P-C P-W-C P-C-C P-W-W-C P-W-C-C P-C-C-C
1 0.006 0.014 0.004 0.003 0.018 0.000 2 0.012 0.008 0.018 0.006 0.000 0.053 3 0.089 0.091 0.155 0.067 0.053 0.105 4 0.018 0.027 0.062 0.054 0.018 0.105 5 0.071 0.039 0.080 0.051 0.000 0.053 6 0.396 0.344 0.385 0.352 0.316 0.263 7 0.207 0.239 0.164 0.224 0.263 0.211 8 0.077 0.078 0.044 0.074 0.088 0.053 9 0.124 0.160 0.088 0.168 0.246 0.158
TABLE 25 Probability Distributions of Shipment Size by Tour Structure for Transportation
Transportation Category P-C P-W-C P-C-C P-W-W-C P-W-C-C P-C-C-C
1 0.014 0.006 0.008 0.002 0.067 0.000 2 0.014 0.011 0.000 0.002 0.000 0.000 3 0.082 0.056 0.110 0.034 0.000 0.000 4 0.048 0.039 0.042 0.020 0.000 0.000 5 0.034 0.028 0.034 0.021 0.000 0.333 6 0.315 0.330 0.356 0.231 0.533 0.333 7 0.267 0.279 0.254 0.308 0.133 0.000 8 0.075 0.073 0.093 0.115 0.200 0.333 9 0.151 0.179 0.102 0.268 0.067 0.000
24
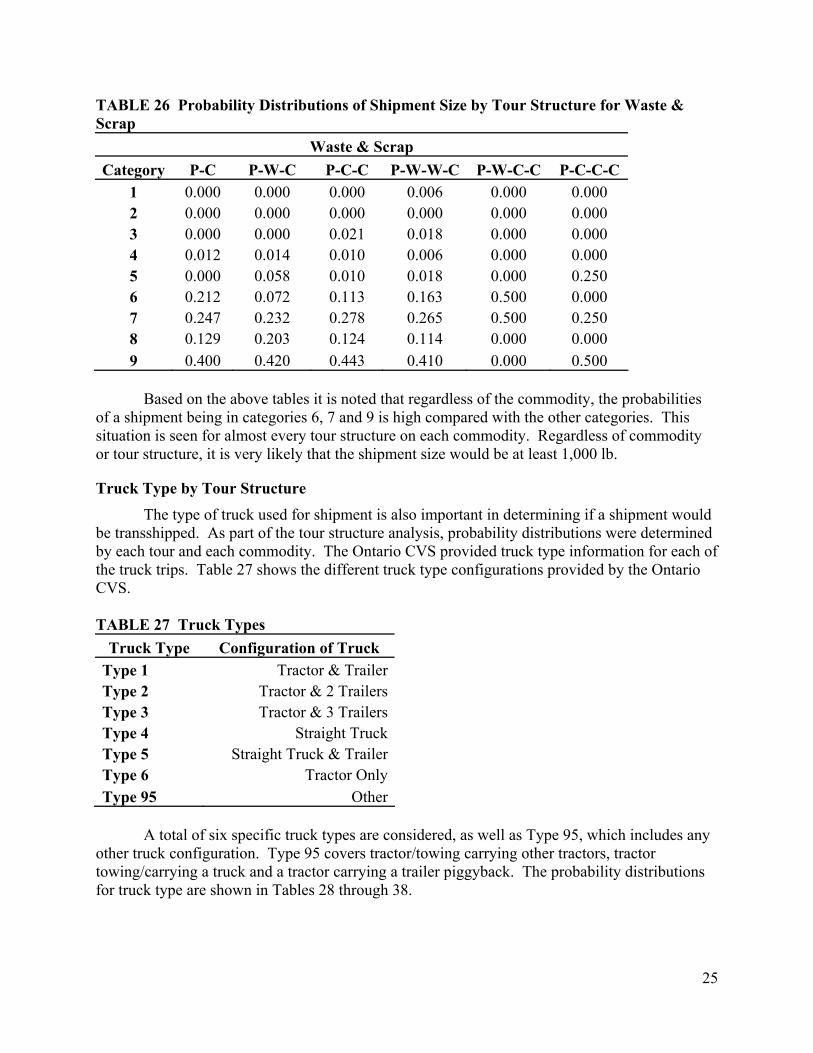
TABLE 26 Probability Distributions of Shipment Size by Tour Structure for Waste & Scrap
Waste & Scrap Category P-C P-W-C P-C-C P-W-W-C P-W-C-C P-C-C-C
1 0.000 0.000 0.000 0.006 0.000 0.000 2 0.000 0.000 0.000 0.000 0.000 0.000 3 0.000 0.000 0.021 0.018 0.000 0.000 4 0.012 0.014 0.010 0.006 0.000 0.000 5 0.000 0.058 0.010 0.018 0.000 0.250 6 0.212 0.072 0.113 0.163 0.500 0.000 7 0.247 0.232 0.278 0.265 0.500 0.250 8 0.129 0.203 0.124 0.114 0.000 0.000 9 0.400 0.420 0.443 0.410 0.000 0.500
Based on the above tables it is noted that regardless of the commodity, the probabilities of a shipment being in categories 6, 7 and 9 is high compared with the other categories. This situation is seen for almost every tour structure on each commodity. Regardless of commodity or tour structure, it is very likely that the shipment size would be at least 1,000 lb.
Truck Type by Tour Structure The type of truck used for shipment is also important in determining if a shipment would be transshipped. As part of the tour structure analysis, probability distributions were determined by each tour and each commodity. The Ontario CVS provided truck type information for each of the truck trips. Table 27 shows the different truck type configurations provided by the Ontario CVS. TABLE 27 Truck Types
Truck Type Configuration of Truck Type 1 Tractor & TrailerType 2 Tractor & 2 TrailersType 3 Tractor & 3 TrailersType 4 Straight TruckType 5 Straight Truck & TrailerType 6 Tractor OnlyType 95 Other
A total of six specific truck types are considered, as well as Type 95, which includes any other truck configuration. Type 95 covers tractor/towing carrying other tractors, tractor towing/carrying a truck and a tractor carrying a trailer piggyback. The probability distributions for truck type are shown in Tables 28 through 38.
25
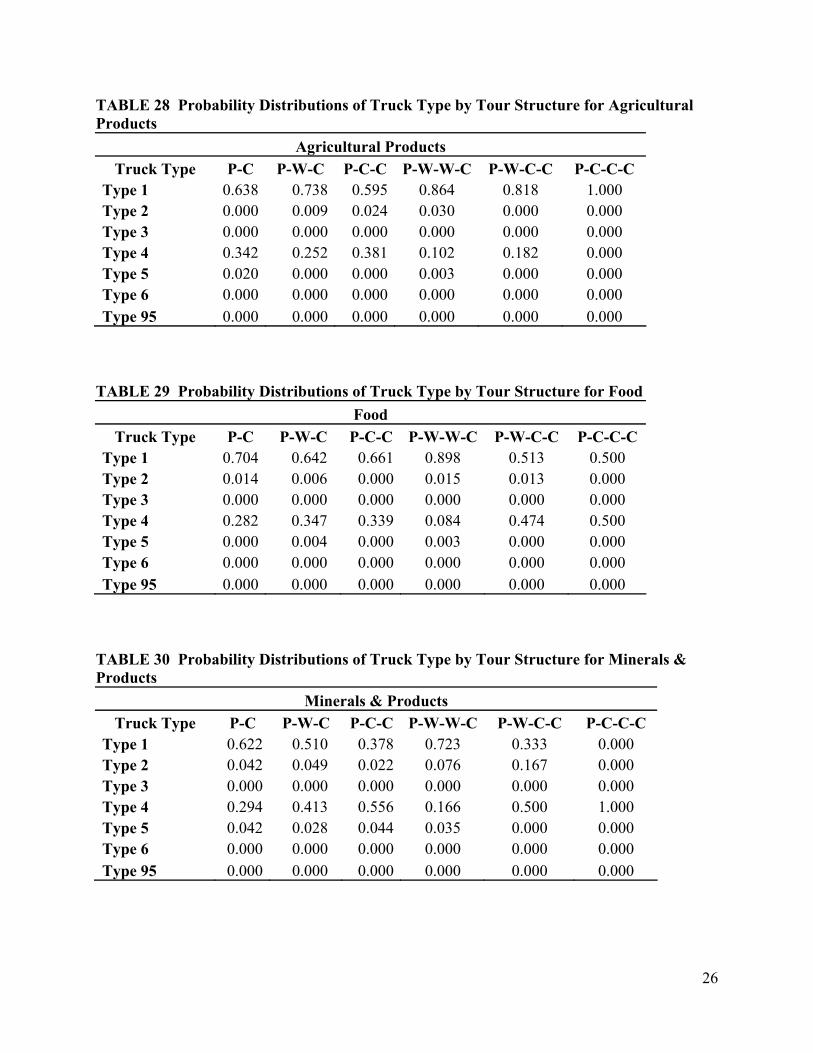
TABLE 28 Probability Distributions of Truck Type by Tour Structure for Agricultural Products
Agricultural Products Truck Type P-C P-W-C P-C-C P-W-W-C P-W-C-C P-C-C-C
Type 1 0.638 0.738 0.595 0.864 0.818 1.000 Type 2 0.000 0.009 0.024 0.030 0.000 0.000 Type 3 0.000 0.000 0.000 0.000 0.000 0.000 Type 4 0.342 0.252 0.381 0.102 0.182 0.000 Type 5 0.020 0.000 0.000 0.003 0.000 0.000 Type 6 0.000 0.000 0.000 0.000 0.000 0.000 Type 95 0.000 0.000 0.000 0.000 0.000 0.000
TABLE 29 Probability Distributions of Truck Type by Tour Structure for Food
Food Truck Type P-C P-W-C P-C-C P-W-W-C P-W-C-C P-C-C-C
Type 1 0.704 0.642 0.661 0.898 0.513 0.500 Type 2 0.014 0.006 0.000 0.015 0.013 0.000 Type 3 0.000 0.000 0.000 0.000 0.000 0.000 Type 4 0.282 0.347 0.339 0.084 0.474 0.500 Type 5 0.000 0.004 0.000 0.003 0.000 0.000 Type 6 0.000 0.000 0.000 0.000 0.000 0.000 Type 95 0.000 0.000 0.000 0.000 0.000 0.000
TABLE 30 Probability Distributions of Truck Type by Tour Structure for Minerals & Products
Minerals & Products Truck Type P-C P-W-C P-C-C P-W-W-C P-W-C-C P-C-C-C
Type 1 0.622 0.510 0.378 0.723 0.333 0.000 Type 2 0.042 0.049 0.022 0.076 0.167 0.000 Type 3 0.000 0.000 0.000 0.000 0.000 0.000 Type 4 0.294 0.413 0.556 0.166 0.500 1.000 Type 5 0.042 0.028 0.044 0.035 0.000 0.000 Type 6 0.000 0.000 0.000 0.000 0.000 0.000 Type 95 0.000 0.000 0.000 0.000 0.000 0.000
26
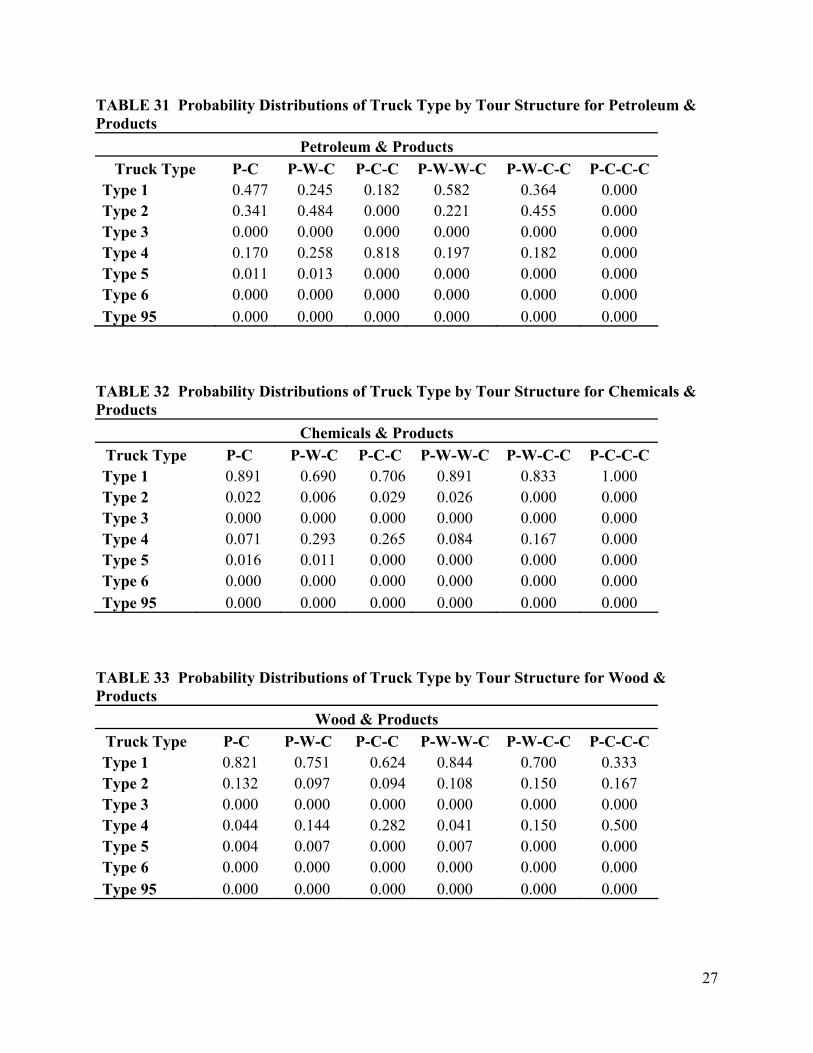
TABLE 31 Probability Distributions of Truck Type by Tour Structure for Petroleum & Products
Petroleum & Products Truck Type P-C P-W-C P-C-C P-W-W-C P-W-C-C P-C-C-C
Type 1 0.477 0.245 0.182 0.582 0.364 0.000 Type 2 0.341 0.484 0.000 0.221 0.455 0.000 Type 3 0.000 0.000 0.000 0.000 0.000 0.000 Type 4 0.170 0.258 0.818 0.197 0.182 0.000 Type 5 0.011 0.013 0.000 0.000 0.000 0.000 Type 6 0.000 0.000 0.000 0.000 0.000 0.000 Type 95 0.000 0.000 0.000 0.000 0.000 0.000
TABLE 32 Probability Distributions of Truck Type by Tour Structure for Chemicals & Products
Chemicals & Products Truck Type P-C P-W-C P-C-C P-W-W-C P-W-C-C P-C-C-C Type 1 0.891 0.690 0.706 0.891 0.833 1.000 Type 2 0.022 0.006 0.029 0.026 0.000 0.000 Type 3 0.000 0.000 0.000 0.000 0.000 0.000 Type 4 0.071 0.293 0.265 0.084 0.167 0.000 Type 5 0.016 0.011 0.000 0.000 0.000 0.000 Type 6 0.000 0.000 0.000 0.000 0.000 0.000 Type 95 0.000 0.000 0.000 0.000 0.000 0.000
TABLE 33 Probability Distributions of Truck Type by Tour Structure for Wood & Products
Wood & Products Truck Type P-C P-W-C P-C-C P-W-W-C P-W-C-C P-C-C-C Type 1 0.821 0.751 0.624 0.844 0.700 0.333 Type 2 0.132 0.097 0.094 0.108 0.150 0.167 Type 3 0.000 0.000 0.000 0.000 0.000 0.000 Type 4 0.044 0.144 0.282 0.041 0.150 0.500 Type 5 0.004 0.007 0.000 0.007 0.000 0.000 Type 6 0.000 0.000 0.000 0.000 0.000 0.000 Type 95 0.000 0.000 0.000 0.000 0.000 0.000
27
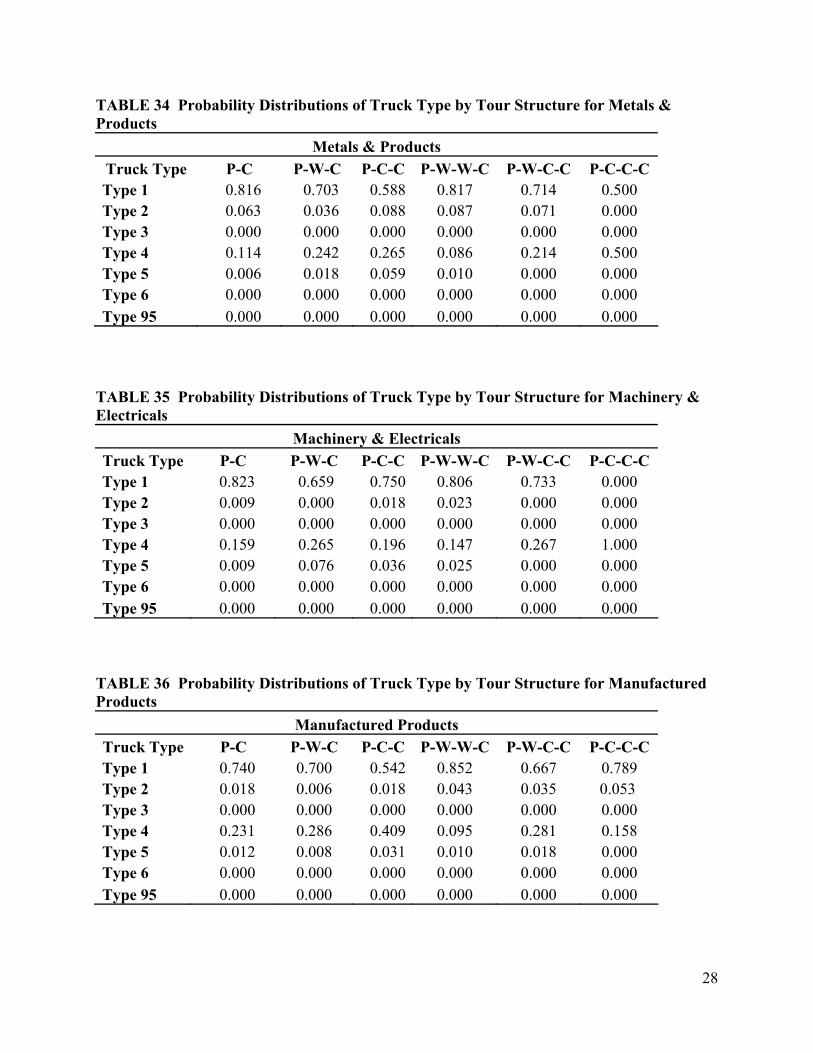
TABLE 34 Probability Distributions of Truck Type by Tour Structure for Metals & Products
Metals & Products Truck Type P-C P-W-C P-C-C P-W-W-C P-W-C-C P-C-C-C Type 1 0.816 0.703 0.588 0.817 0.714 0.500 Type 2 0.063 0.036 0.088 0.087 0.071 0.000 Type 3 0.000 0.000 0.000 0.000 0.000 0.000 Type 4 0.114 0.242 0.265 0.086 0.214 0.500 Type 5 0.006 0.018 0.059 0.010 0.000 0.000 Type 6 0.000 0.000 0.000 0.000 0.000 0.000 Type 95 0.000 0.000 0.000 0.000 0.000 0.000
TABLE 35 Probability Distributions of Truck Type by Tour Structure for Machinery & Electricals
Machinery & Electricals Truck Type P-C P-W-C P-C-C P-W-W-C P-W-C-C P-C-C-C Type 1 0.823 0.659 0.750 0.806 0.733 0.000 Type 2 0.009 0.000 0.018 0.023 0.000 0.000 Type 3 0.000 0.000 0.000 0.000 0.000 0.000 Type 4 0.159 0.265 0.196 0.147 0.267 1.000 Type 5 0.009 0.076 0.036 0.025 0.000 0.000 Type 6 0.000 0.000 0.000 0.000 0.000 0.000 Type 95 0.000 0.000 0.000 0.000 0.000 0.000
TABLE 36 Probability Distributions of Truck Type by Tour Structure for Manufactured Products
Manufactured Products Truck Type P-C P-W-C P-C-C P-W-W-C P-W-C-C P-C-C-C Type 1 0.740 0.700 0.542 0.852 0.667 0.789 Type 2 0.018 0.006 0.018 0.043 0.035 0.053 Type 3 0.000 0.000 0.000 0.000 0.000 0.000 Type 4 0.231 0.286 0.409 0.095 0.281 0.158 Type 5 0.012 0.008 0.031 0.010 0.018 0.000 Type 6 0.000 0.000 0.000 0.000 0.000 0.000 Type 95 0.000 0.000 0.000 0.000 0.000 0.000
28

TABLE 37 Probability Distributions of Truck Type by Tour Structure for Transportation Transportation
Truck Type P-C P-W-C P-C-C P-W-W-C P-W-C-C P-C-C-C Type 1 0.589 0.425 0.424 0.795 0.600 0.333 Type 2 0.021 0.022 0.017 0.015 0.067 0.000 Type 3 0.000 0.000 0.000 0.000 0.000 0.000 Type 4 0.055 0.196 0.229 0.088 0.200 0.333 Type 5 0.295 0.330 0.322 0.096 0.133 0.333 Type 6 0.000 0.000 0.000 0.000 0.000 0.000 Type 95 0.041 0.028 0.008 0.005 0.000 0.000
TABLE 38 Probability Distributions of Truck Type by Tour Structure for Waste & Scrap
Waste & Scrap Truck Type P-C P-W-C P-C-C P-W-W-C P-W-C-C P-C-C-C
Type 1 0.706 0.826 0.629 0.855 0.500 0.750 Type 2 0.082 0.014 0.031 0.036 0.000 0.000 Type 3 0.000 0.000 0.000 0.000 0.000 0.000 Type 4 0.176 0.130 0.278 0.102 0.500 0.250 Type 5 0.035 0.029 0.062 0.006 0.000 0.000 Type 6 0.000 0.000 0.000 0.000 0.000 0.000 Type 95 0.000 0.000 0.000 0.000 0.000 0.000
The results from these tables reveals that regardless of the commodity or tour structure, it is very likely that the truck type would be a tractor & 1 trailer (Type 1). However, there might be some situations where a straight truck (Type 4) would be used, and there are a small number of situations where a straight truck & 1 trailer (Type 5) would be used. An interesting fact is that any other truck configuration (Type 95) is really only used for transportation commodities.
CONCLUSIONS This working paper continued the analysis in further detail of the Ontario Commercial
Vehicle Survey for transshipment information, which had been preliminarily analyzed by commodities, origin/destination facilities and distance traveled. The analysis presented here consisted of creating tour structures, their probability distributions and distances associated with various legs of the structures.
First, establishments were segregated into three categories (producer, consumer, or warehouse/terminal) to simplify the number of structures. Computed probabilities revealed that there is a likelihood of any shipment passing through a transshipment location, that is, either a truck terminal or a warehouse.
29
30
A total of six tour structures were ascertained from the data, and probability distributions were associated with each structure as it relates to broad commodity categories. The most likely tour structure involved two transshipment points.
Distances traveled for each segment by each tour structure were determined and showed that the producer and the first transshipment location (W) or first consumer (C) are in the same municipality for all the tour structures involving more than 2 segments. The same situation holds for the distances of the last two establishments, that is after the shipment has been transshipped then its final consumer is in the same municipality.
This working paper presented a further analysis of the Ontario CVS dataset based on tour structures and their probabilities. The results revealed the dataset contains solid information on transshipment that would be appropriate for further model development of the transshipment problem of travel forecasting.
ACKNOWLEDGEMENTS This study was funded by the National Center for Freight & Infrastructure Research &
Education, a university research center of the U.S. Department of Transportation. The database analyzed in this study was provided by the Ontario Ministry of Transportation.
REFERENCES 1. Hunt J.D. and Stephan K.J. “Tour-Based Microsimulation of Urban Commercial
Movements”. 84th Annual Meeting, Transportation Research Board, Washington D.C., 2005.
2. Gliebe J., Cohen O. and Hunt J.D. “A Dynamic Choice Model of Urban Commercial Vehicle and Person Activity Patterns”. 86th Annual Meeting, Transportation Research Board, Washington D.C., 2007
3. Wisetjindawat W., Sano K., Matsumoto S. and Raothanachonkun P. “Micro-Simulation Model for Modeling Freight Agents Interactions in Urban Freight Movement”. 86th Annual Meeting, Transportation Research Board, Washington D.C., 2007.
4. Kim G., Kim W., Im H. and Kang K. “Analysis of Trip Length Distribution between Commodity-Based Model and Truck Trip-Based Model in Seoul Metropolitan Area”. Proceedings of the Eastern Asia Society for Transportation Studies, Volume 4. October 2003.
5. Melendez W. and Horowitz A. “The Transshipment Problem in Travel Forecasting: Preliminary Analysis of the Ontario Commercial Vehicle Survey” National Center for Freight & Infrastructure Research & Education, Center for Urban Transportation Studies, University of Wisconsin-Milwaukee, 2009.