THE ROLE OF AGRICULTURE AND FARM HOUSEHOLD DIVERSIFICATION ... · Definition of rural areas ... THE...
18
1 TRADE AND AGRICULTURE DIRECTORATE THE ROLE OF AGRICULTURE AND FARM HOUSEHOLD DIVERSIFICATION IN THE RURAL ECONOMY OF JAPAN
Transcript of THE ROLE OF AGRICULTURE AND FARM HOUSEHOLD DIVERSIFICATION ... · Definition of rural areas ... THE...

1
TRADE AND AGRICULTURE DIRECTORATE
THE ROLE OF AGRICULTURE AND
FARM HOUSEHOLD DIVERSIFICATION
IN THE RURAL ECONOMY OF
JAPAN

2
Foreword
This report reviews information on the role of agriculture and farm household diversification in the
rural economy of Japan. It was prepared by Toru Kumagai of the OECD Secretariat.
It is one of 13 country reviews prepared under Output area 3.2.1: Agricultural policy reform
(Item 3.2) of the programme of work and budget of the Committee for Agriculture for 2007-08.
Based on material compiled from the available literature, these country reviews address all or most of
the topics listed below:
Definitions and underlying concepts of “rural” as they exist at the national level.
The availability of data pertaining to the share of agriculture and the agro-food sector in the
economies of OECD countries at the national level and in rural areas and trends therein.
The availability of data relating to the income situation of farm households and in particular the
availability of information related to non-farming activities.
The extent to which non-farming income-earning activities of farm households are farm based
(i.e using farm resources as in the case of farm tourism) or rural based (located in rural areas).
The extent to which the industries upstream and downstream from primary agriculture are located
in rural areas.
The strength of multiplier effects between farm/farm based and up/downstream industries and
rural economies.
The information in these country reviews was used as background to the report "The role of
agriculture and farm household diversification in the rural economy: evidence and initial policy
implications" [TAD/CA/APM/WP(2009)1/FINAL], which was declassified by the Working Party on
Agricultural Policies and Markets in February 2009.

3
TABLE OF CONTENTS
Definition of rural areas ................................................................................................................................ 5
Rural areas in the national economy ............................................................................................................. 7
Role of agriculture in rural areas .................................................................................................................. 7
The role of the agro-food sector in rural areas ............................................................................................ 11
Diversification of activities by farm households in rural areas................................................................... 13
Factors enhancing/limiting farm household diversification into non-farm activities ................................. 15
Multiplier effects of agriculture and other rural activities .......................................................................... 16
References ................................................................................................................................................... 18

4
THE ROLE OF AGRICULTURE AND FARM HOUSEHOLD DIVERSIFICATION
IN THE RURAL ECONOMY OF JAPAN
Approximately 78% of the total land area in Japan is devoted to agriculture and forestry (12% and
66% respectively), and 70% of total water use is concentrated on agricultural activities. However, the
percentage of those employed in farming has declined constantly since 1965 and in 2005 stood at 8.9%
(this figure includes those with part-time off-farm employment). Total agricultural output has also declined
since the peak year of 1985 and the share of agriculture in total GDP was 1.7% in 2004.
Japanese agriculture is characterized by the following elements: i) the majority of farm households
are scattered throughout the country; ii) farms are generally small and fragmented due to both
topographical constraints and the land reforms implemented after World War II; iii) ageing farmers and
depopulation of rural communities; and iv) the majority of farmers have a second non-farm business from
which 90% of their income is derived.
Figure 1. Evolution of population and agricultural production in Japan
(Base 1965=100)

5
Definition of rural areas
In general, a rural community is where most of its population is in some way involved in the primary
sector and the areas which consist of rural communities are called “rural areas”.
According to the “Classification of Agricultural Area” by MAFF statistics, “rural areas” refer to areas
which are not “urban areas”. For the MAFF methodology, the former municipalities are used as a unit for
classification (prior to the “Heisei Municipalities Merger”, there were approximately 3 300 municipalities
in Japan); in contrast, for the OECD methodology, prefectures (47 in Japan) are used as a unit for
classification. Both methodologies are mainly based on the population density of the unit area.
Another classification is based on the City Planning Act, which distinguishes “City Planning Areas”
(covering 25.7% of the land area and 92% of the population)” from the other areas. The boundary of each
area is determined mainly by the municipality. Statistical data based on this classification are not available.
Table 1. Classification of agricultural area by MAFF statistics
Classification1 Classified bases of municipality
Urban Area
Former municipalities or municipalities where the proportion of Densely Inhabited Districts (DIDs
2) in habitable areas (total land area except lakes or forest) is 5% or more
and where the population density is 500 or more inhabitants per square kilometre (or a DID with a population of 20 000 or more inhabitants). This does not include municipalities where the percentage of forest and grazing land is 80% or more.
Rural Area
Flat farming area
Former municipalities or municipalities where the percentage of cultivated land is 20% or more and the proportion of forest and grazing land is less than 50%, or where if it is 50% or more, the unfavourable nature of (steep) the farmland is less than 10% of total land.
Hilly farming area
Intermediate area between “flat farming area” and “mountainous farming area”, where the proportion of forest land and grazing land is mainly between 50% and 80% of the total land area.
Mountainous farming area
Former municipalities or municipalities where the proportion of forest and grazing land in total land is 80 % or more and the proportion of cultivated land is less than 10% of the total land area.
1. Order of classification: urban area, mountainous farming area, flat farming area, hilly farming area.
2. In principle, a Densely Inhabited District (DID) is a district composed of a group of contiguous Population Census enumeration districts, each with a population density of about 4 000 inhabitants and over per square kilometre, and whose population of the contiguous districts exceeds 5 000.
Source: MAFF
The Census of Agriculture and Forestry defines “farm household” as “a household that operates a
farm with 1 000 m2 or more of cultivated land or a household whose agricultural product sales amount to
JPY 150 000 or over in the year prior to the survey date; this includes even those farms where the
cultivated land is less than 1 000 m2. All farm households are further divided as shown in Table 2 and
income structure of each category is shown in Figure 2.

6
Table 2. Types of farm households
Source: MAFF Statistical Yearbook, 2006.
Figure 2. Farm household income by household type 2005
Non-farm Income includes Wages and salaries, Social transfers, Property income, Non-farm businesses and Other
receipt.
All Households: Total number of all households is 49 529 000 in 2005 (Census).
Source: MAFF Statistical Yearbook, 2006.
Commercial farm household (1 963 424 households in 2005)
A farm household farming 3 000 m2 or more, or with annual sales of agricultural products amounting to JPY 500 000
or more in the year prior to the survey date.
in which Business farm household (429 467 households in 2005)
A farm household whose percentage of agricultural income is more than 50% of its income and which has one or more family members under 65 years who was engaged in farming (the household’s own land) for at least 60 days per year
Semi-business farm household (443 389 households in 2005)
(a farm household whose percentage of non-agricultural income accounts for the majority of the household’s income and which has one or more family members under 65 years who was engaged in farming (the household’s own land) for 60 days or more.
Side-business farm household (1 090 568 households in 2005)
A farm household which has no family members under 65 years who was engaged in farming (the household’s own land) for more than 60 days.
Non-commercial farm household (884 742 households in 2005)
A farm household with a cultivated land area of less than 3 000 m2 and annual sales of less than
JPY 500 000.
(Thousand JPY)

7
Rural areas in the national economy
The intention here is to collect data on land area, population, GDP and employment by prefecture and
to compile the data according to OECD regional typology. In doing so, the share of OECD defined “rural
areas” in the national economy will be shown.
Table 3. Share of land, population, GDP and employment in different types of regions, 2005
OECD regional type
Total land area (ha)
Population (person)
Number of households
GDP (million JPY)
Employment (persons)
Rural (PR) 14 Prefectures
10 962 115 (29.0%)
17 249 674 (13.5%)
6 271 551 (12.7%)
57 028 324 (11.2%)
8 602 648 (13.8%)
Intermediate(IR) 21 Prefectures
21 017 454 (55.6%)
40 018 897 (31.3%)
14 663 627 (29.6%)
147 710 634 (29.1%)
19 636 760 (31.4%)
Urban (PU) 12 Prefectures
5 799 380 (15.3%)
70 488 244 (55.2%)
28,594,054 (57.7%)
303 672 154 (59.7%)
34 208 976 (54.8%)
National Total 47 Prefectures
37 785 147 (100.0%)
127 756 815 (100.0%)
49 529 232 (100.0%)
508 411 112 (100.0%)
62 448 384 (100.0%)
Fourteen Rural Prefectures: Aomori, Iwate, Akita, Yamagata, Fukui, Yamanashi, Nagano, Shimane, Yamaguchi, Kochi, Saga, Miyazaki, Kagoshima and Okinawa.
Twenty-one Intermediate Prefectures: Hokkaido, Fukushima, Ibaraki, Tochigi, Gunma, Niigata, Toyama, Ishikawa, Gifu, Shizuoka, Mie, Shiga, Wakayama, Tottori, Okayama, Tokushima, Kagawa, Ehime, Nagasaki, Kumamoto and Oita.
Twelve Urban Prefectures: Miyagi, Saitama, Chiba, Tokyo, Kanagawa, Aichi, Kyoto, Osaka, Hyogo, Nara, Hiroshima and Fukuoka.
Source: National Census 2005; MAFF statistics database.
According to OECD typology, there are 35 (out of an overall total of 47) rural prefectures (PR+IR)
covering 84.6% of the land area. They comprise 44.8% of the population, 42.3% of all households, 40.3%
of the GDP, and 45.2%of the overall national employment. Thus, urban prefectures cover only 15.3% of
the national land area dominate in terms of population, household numbers, GDP and employment.
Nevertheless, although it is clear that urban prefectures are very important in terms of the national
economy, rural prefectures have considerable weight.
In addition, there are urban centres with a population of between 200 000 and 600 000 in every rural
prefecture and there is farmland and numerous rural communities in all urban prefectures. Almost all
prefectures in Japan have diversified characteristics ranging from dense forests to densely populated city
centres.
Role of agriculture in rural areas
The share of agriculture in GDP, employment and land use at national level is shown in Table 4.
Table 4. The share of agriculture in GDP, employment and land use at the national level
Agricultural Employment in OECD Statistics excludes those farmers who have a second activity as the main source of income. MAFF Statistics, however, does include these farmers. Both set of statistics exclude non-commercial farmers.
Source: OECD Statistics and FAO Database
1985 1990 1995 2000
Share of Primary Sector GDP (%) 2.99 2.51 1.88 1.70
Share of Agricultural Employment (%) 8.2 7.1 5.5 4.8
Share of Agriculture in Land-use (%) 16.1 15.6 14.9 14.4
8
According to these indicators, the share of agriculture has declined constantly since 1985. A
particularly sharp drop is seen in the primary sector GDP and agricultural employment (a decrease of more
than 40% since 1985); on the other hand, agricultural land use is 10% less since 1985.
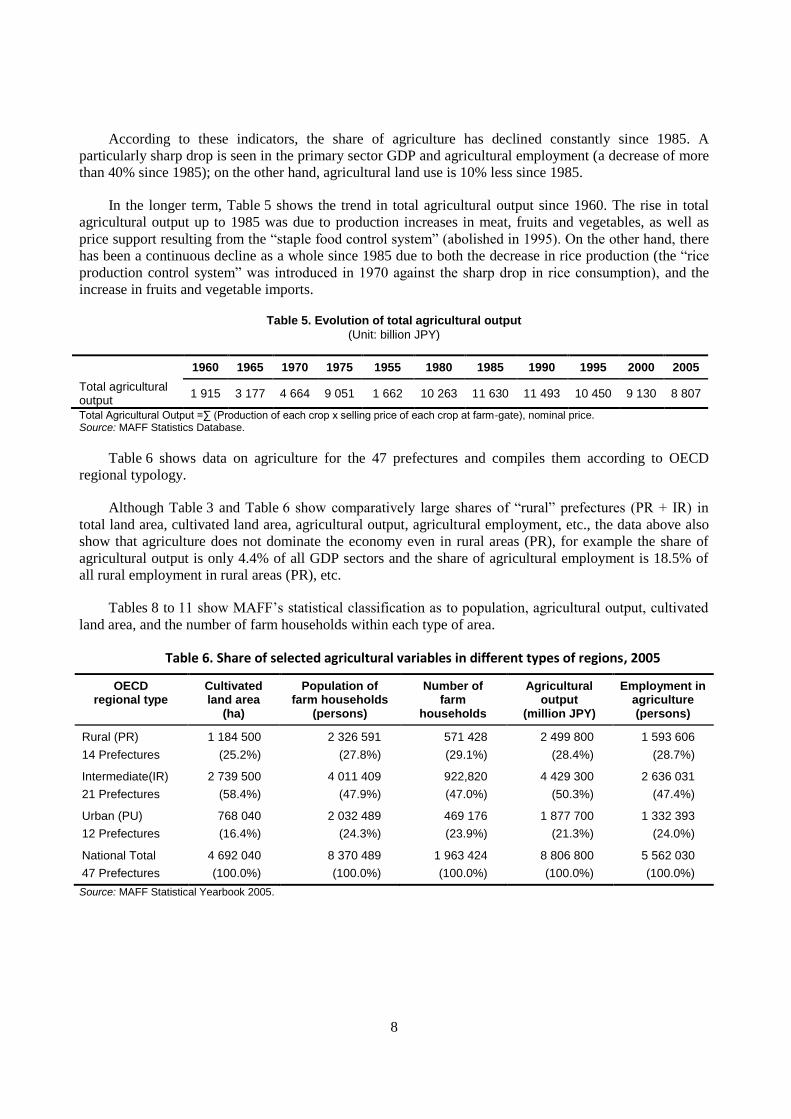
In the longer term, Table 5 shows the trend in total agricultural output since 1960. The rise in total
agricultural output up to 1985 was due to production increases in meat, fruits and vegetables, as well as
price support resulting from the “staple food control system” (abolished in 1995). On the other hand, there
has been a continuous decline as a whole since 1985 due to both the decrease in rice production (the “rice
production control system” was introduced in 1970 against the sharp drop in rice consumption), and the
increase in fruits and vegetable imports.
Table 5. Evolution of total agricultural output
(Unit: billion JPY)
Total Agricultural Output =∑ (Production of each crop x selling price of each crop at farm-gate), nominal price. Source: MAFF Statistics Database.
Table 6 shows data on agriculture for the 47 prefectures and compiles them according to OECD
regional typology.
Although Table 3 and Table 6 show comparatively large shares of “rural” prefectures (PR + IR) in
total land area, cultivated land area, agricultural output, agricultural employment, etc., the data above also
show that agriculture does not dominate the economy even in rural areas (PR), for example the share of
agricultural output is only 4.4% of all GDP sectors and the share of agricultural employment is 18.5% of
all rural employment in rural areas (PR), etc.
Tables 8 to 11 show MAFF’s statistical classification as to population, agricultural output, cultivated
land area, and the number of farm households within each type of area.
Table 6. Share of selected agricultural variables in different types of regions, 2005
Source: MAFF Statistical Yearbook 2005.
1960 1965 1970 1975 1955 1980 1985 1990 1995 2000 2005
Total agricultural output
1 915 3 177 4 664 9 051 1 662 10 263 11 630 11 493 10 450 9 130 8 807
OECD regional type
Cultivated land area
(ha)
Population of farm households
(persons)
Number of farm
households
Agricultural output
(million JPY)
Employment in agriculture (persons)
Rural (PR)
14 Prefectures
1 184 500
(25.2%)
2 326 591
(27.8%)
571 428
(29.1%)
2 499 800
(28.4%)
1 593 606
(28.7%)
Intermediate(IR)
21 Prefectures
2 739 500
(58.4%)
4 011 409
(47.9%)
922,820
(47.0%)
4 429 300
(50.3%)
2 636 031
(47.4%)
Urban (PU)
12 Prefectures
768 040
(16.4%)
2 032 489
(24.3%)
469 176
(23.9%)
1 877 700
(21.3%)
1 332 393
(24.0%)
National Total
47 Prefectures
4 692 040
(100.0%)
8 370 489
(100.0%)
1 963 424
(100.0%)
8 806 800
(100.0%)
5 562 030
(100.0%)

9
Table 7. Share of agriculture in the regional economy: selected variables, 20051
Rural area (PR) Share (%)
Cultivated Land Area / Total Land Area 10.8%
Farm Household Population / Total Population 13.5%
Farm Household Number / Total Household Number 9.1%
Agricultural Output / All sectors GDP 4.4%
Agricultural Employment / Total Employment 18.5%
Intermediate area (IR) Cultivated Land Area / Total Land Area 13.0%
Farm Household Population / Total Population 10.0%
Farm Household Number / Total Household Number 6.3%
Agricultural Output / All sectors GDP 3.0%
Agricultural Employment / Total Employment 13.4%
Urban area (PU) Cultivated Land Area / Total Land Area 13.2%
Farm Household Population / Total Population 2.9%
Farm Household Number / Total Household Number 1.6%
Agricultural Output / All sectors GDP 0.6%
Agricultural Employment / Total Employment 3.9%
National average Cultivated Land Area / Total Land Area 12.4%
Farm Household Population / Total Population 6.6%
Farm Household Number / Total Household Number 4.0%
Agricultural Output / All sectors GDP 1.7%
Agricultural Employment / Total Employment 8.9%
1. See Tables 3 and 6.
Table 8. Share of population in rural and urban areas, 1995
Rural Area
Flat farming area 11 612 000 9%
23% Hilly farming area 12 864 000 10%
Mountainous farming area 4 601 000 4%
Urban Area 96 493 000 77% 77%
Total 125 570 000 100%
Source: National Census 1995
Table 9. Share of agricultural output in rural and urban areas, 2005
Rural Area
Flat farming area 2 600 billion JPY 30%
69% Hilly farming area 2 700 billion JPY 31%
Mountainous farming area 700 billion JPY 8%
Urban Area 2 800 billion JPY 31% 31%
Total 8 800 billion JPY 100%
Source: MAFF Statistical Yearbook 2005 and Annual Report FY2006 (p.165)

10
Table 10. Share of cultivated area in rural and urban areas, 2005
Rural Area
Flat farming area 1 382 000 ha 30%
73% Hilly farming area 1 587 000 ha 34%
Mountainous farming area 443 000 ha 9%
Urban Area 1 280 000 ha 27% 27%
Total 4 692 000 ha 100%
Source: MAFF Statistical Yearbook 2005 and Annual Rert FY2006.
Table 11. Number of farm households in rural and urban areas, 2005
Rural Area
Flat farming area 927 000 33%
76% Hilly farming area 868 000 30%
Mountainous farming area 368 000 13%
Urban Area 686 000 24% 24%
Total 2 848 000 100%
All farm households including non-commercial farm households
Source: MAFF Statistical Yearbook 2005 and Annual Report FY2006.
The difference in the share of “rural area” between MAFF and OECD classifications is seen in
“Agricultural Output” and “Cultivated Area”. Agricultural output in rural areas accounts for 69% of total
agricultural output according to the MAFF classification, as opposed to 79% according to OECD
classification. The cultivated area in rural areas accounts for 73% of the total cultivated area according to
MAFF, as opposed to 84% according to OECD classification. The number of farm households accounts for
76% in both classifications.
MAFF statistics also show data concerning rural communities in Japan (here, defined as
“communities which have been developed over time and served as a basic unit of society, where various
groups and social relationships have been formed on land or between blood relations among households”).
Table 12 shows the composition of farm households and non-farm households in “rural communities.
Table 12. Share of farm and non-farm households in rural communities, 2000
“Rural communities” in total (135 163 communities) Farm households Non-farm households
10.7% 89.3%
In rural areas (103 575 communities: 77%) Farm households Non-farm households
28.5% 71.5%
In urban areas (31 588 communities: 23%) Farm households Non-farm households
3.5% 96.5%
Source: MAFF Statistics Pocket Version 2006

11
This data shows a distinctive characteristic of Japan’s rural communities in recent years; that is, the
dominance of non-farmers in rural communities either through migration or occupational change. This
results in considerable complexity in developing coherent policies between agriculture and rural
development in Japan.
The role of the agro-food sector in rural areas
The data on agro-food sector GDP is available only at the national level. The share of the agro-food
sector in national GDP is shown in Table 13.
Table 13. Share of the agro-food sector in the national GDP
1990 1995 2000
% % % JPY billion
Agriculture, forestry and fisheries 2.4 1.8 1.6 7 978
Food processing industry 3.1 3.1 3.1 15 526
Input industry 0.5 0.6 0.5 2 299
Food and beverage service sector 2.0 2.2 2.0 9 965
Wholesale and retail trade of agriculture and food commodities 3.7 4.3 4.2 21 035
Total 11.8 12.1 11.4 56 801
Source: MAFF Statistics Pocket Version 2003 and 2006, derived from National Input/Output Data.
The share of agriculture, forestry and fisheries in national GDP declined by 2.4% in 1990, 1.8% in
1995, and 1.6% in 2000; however, the agro-food sector in total has maintained its share of the national
GDP at 11% to 12%. This table also shows that the agricultural sector (including forestry and fisheries) has
six times, or higher, of directly-related industries attached to it, although these are not necessarily located
in rural areas.
In addition to the analysis found in Input/Output data, the Japanese MAFF completed its own survey
on local industrial structures (agriculture and fisheries, food processing, and food service and
wholesale/retailer) in nine regions (Figure 3). The national GDP share of the agro-food sector (in this
survey, forestry and input industries are not included) is 10.4%. There are, however, significant differences
between regions; for example, 14.8% in Hokkaido and 9.4% in the Kinki region. In general, it can be said
that the agro-food sector plays an important role in many of the regional economies, especially in rural
communities such as Hokkaido, Tohoku, Shikoku and Kyushu regions.

12
Figure 3. Share of agro-food industries in the GDP of nine regions, 2000
According to MAFF Statistics (2005), forests (248 609 km2) occupy 65.8% of the total national land
area. The role of most forests varies from producing forestry products (wood, mushrooms, nuts, charcoal,
etc.), natural environmental conservation, recreational activities, etc. Approximately 55% (136 363 km2) of
the total forestry area is owned by the private sector, of which 38% is owned by one million forestry
households (here, defined as a household which has more than one hectare of forest land), and the
remaining 62% is owned by companies, cooperatives, etc. The public sector owns 112 246 km2
of forest
land, most of which is maintained for public services such as water source conservation, soil run-off
prevention, and public health reasons. According to MAFF Statistics (2000), approximately 65% of one
million forestry households were commercial farm households as well.
Table 14 shows the share of forestry in land use of three regional types according to OECD typology.
This table indicates that the share of forestry in land use is 65.8% at the national level: the highest share is
72.1% in rural areas, 65.6% in intermediate areas and the lowest 54.8% in urban areas. In other words,
more than half of land area in Japan is forestry even in urban prefectures. The distribution of forest land
area among three types of regions is nearly the same as the total land area distribution, which means that
forests exist evenly over the country.
Table 14. Share of forest in total land area
OECD regional type
Total land area (ha)
Forest land area (ha)
Forest / total (%)
Rural (PR) 14 prefectures
10 962 115 (29.0%)
7 905 553 (31.8%)
72.1%
Intermediate (IR) 21 prefectures
21 017 454 (55.6%)
13 776 950 (55.4%)
65.6%
Urban 12 prefectures
5 799 380 (15.3%)
3 178 438 (12.8%)
54.8%
National total 47 prefectures
37 785 147 (100%)
24 860 941 (100%)
65.8%
Source: MAFF Statistical Yearbook 2005.

13
Diversification of activities by farm households in rural areas
MAFF statistics has classified Japanese farm income data since 2004 as follows:
All Income of Farm Household
= Farm Income + Farm Related Business
+ Non-Farm Income + Social Transfer
It is further divided as follows:
Non-Farm Income = Rent of Leased Land +
Non-Farm Business + Wages and Salaries + Others
Among various income sources, “Farm Income” and “Farm Related Business (food processing, direct
sales, farm restaurant, etc)” are closely linked to agricultural production, and a certain proportion of “Rent
of Leased Land” and “Wages & Salaries” can be related to agriculture or rural-based industries in some
way. However, most “Non-farm Income” and “Social Transfer” (annuity, gifts, etc) have little relation with
either agriculture or rural-based industries. Table 15 and Figure 4 show the evolution of farm household
income level and composition from 1990 to 2005.
Table 15. Composition of farm household income
(Thousand JPY per household)
Farm income
Farm- related
business1
Non-farm income Social
Transfer
All Income of farm
household Rent Non-farm business
Wages & salaries
Others
1990 1 163 (13.8%)
0 (0.0%)
79 (0.9%)
442 (5.3%)
4 590 (54.6%)
328 (3.9%)
1 797 (21.4%)
8 399 (100%)
1995 1 442 (16.2%)
0 (0.0%)
111 (1.2%)
437 (4.9%)
4 621 (51.8%)
284 (3.2%)
2 022 (22.7%)
8 917 (100%)
2000 1 084 (13.1%)
0 (0.0%)
124 (1.5%)
389 (4.7%)
4 354 (52.6%)
108 (1.3%)
2 221 (26.8%)
8 280 (100%)
20052 1 235
(24.6%) 5
(0.1%) 121
(2.4%) 369
(7.3%) 1 676
(33.3%) 25
(0.5%) 1 598
(31.8%) 5 029
(100%)
1. New category since 2004. 2. The income of household members who are not engaged in agriculture has been excluded since 2004. As a consequence, there has been a sharp drop in “Wages & Salaries”. Source: MAFF Statistical Yearbook (1990 – 2006).
Figure 4. Composition of farm household income
(Thousand JPY per household)
Source: Table 15.
14
These data show the average figure of farm household income; the majority of diversified income
comes from Non-farm Income and Social Transfers. Income diversification or pluriactivity through farm-
related business is miniscule in terms of amount of money.
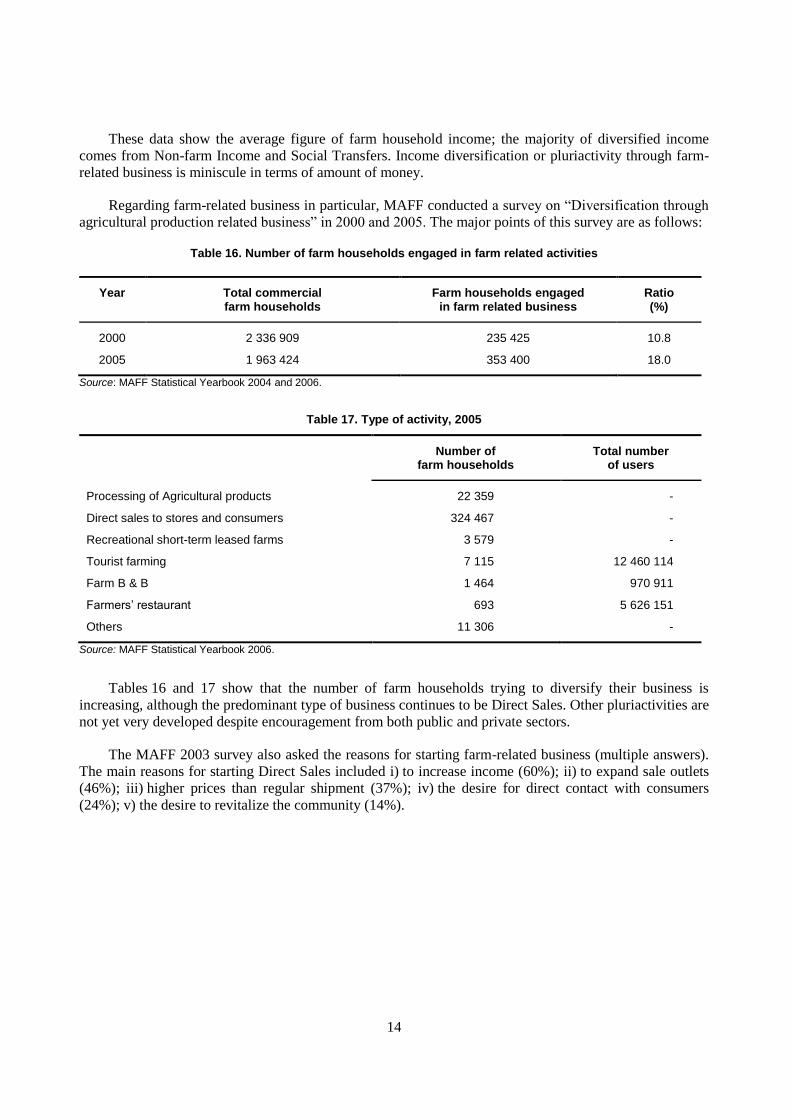
Regarding farm-related business in particular, MAFF conducted a survey on “Diversification through
agricultural production related business” in 2000 and 2005. The major points of this survey are as follows:
Table 16. Number of farm households engaged in farm related activities
Year Total commercial farm households
Farm households engaged in farm related business
Ratio (%)
2000 2 336 909 235 425 10.8
2005 1 963 424 353 400 18.0
Source: MAFF Statistical Yearbook 2004 and 2006.
Table 17. Type of activity, 2005
Number of farm households
Total number of users
Processing of Agricultural products 22 359 -
Direct sales to stores and consumers 324 467 -
Recreational short-term leased farms 3 579 -
Tourist farming 7 115 12 460 114
Farm B & B 1 464 970 911
Farmers’ restaurant 693 5 626 151
Others 11 306 -
Source: MAFF Statistical Yearbook 2006.
Tables 16 and 17 show that the number of farm households trying to diversify their business is
increasing, although the predominant type of business continues to be Direct Sales. Other pluriactivities are
not yet very developed despite encouragement from both public and private sectors.
The MAFF 2003 survey also asked the reasons for starting farm-related business (multiple answers).
The main reasons for starting Direct Sales included i) to increase income (60%); ii) to expand sale outlets
(46%); iii) higher prices than regular shipment (37%); iv) the desire for direct contact with consumers
(24%); v) the desire to revitalize the community (14%).

15
Factors enhancing/limiting farm household diversification into non-farm activities
In recent years, the rural development policy “Complementarities and Interrelationships between
Urban and Rural Areas” has been vigorously promoted by both the public and private sectors. The
objectives of this policy can be summarised as follows:
1. Urban residents feel an increasing need to integrate rural amenities in their lifestyle.
Residents in urban areas have their own image of agriculture and rural community life.
They would like to find comfort, relaxation, safety, as well as fresh and high quality
agricultural products in the countryside.
Most Japanese believe that children should learn about agriculture and rural life to
promote understanding of the importance of nature and food.
2. There is an increasing need for other gainful activities by farm households in order to maintain
the demographic and social structure of rural communities.
Ageing and depopulation have continued, and in some cases the population rate of certain
communities is at a critical stage. The concern of losing the benefits of rural amenities
has provoked policy demand for rural revitalization.
3. There is demand to move away from policy measures that encourage higher levels of resource
and input use to measures that aim at environmental and rural amenities preservation.
Historically, Japanese agricultural policy had been developed under the Basic Law on Agriculture
(1961-1999), the main target of which was “to equalize differences in productivity and income between
agriculture and other industries”. National and local governments have been trying to introduce other
industries into rural economy for rural income diversification since 1970s, but the results to date have been
limited.
Reflecting these circumstances, the new targeted areas of Japanese policy on farm household income
diversification is “on-farm” or “off-farm, but local-specific” pluriactivity which is deeply related to
farming or rural traditions, such as direct sales with practical experiences, green tourism with farmhouse
accommodation and foods, and participatory activities in farming and harvesting.
According to Ohe (2003), the technical terms of Japanese rural tourism are as follows:
Farm tourism: Activities run by farm households or farm enterprises.
Agri tourism: Farm-tourism plus activities run by farmers’ cooperatives or other farmers’
organisations.
Green tourism: Agri-tourism plus activities run by municipalities or the third sector
(Municipalities often become main organizers of local festivals and events).
Rural tourism: Green-tourism plus activities run by non-farm sector or rural inhabitants in
general.
Ohe (2003) also indicates a classification of rural pluriactivity (Table 18). In particular, (*) marked
activities are recognized as farm activities closely related to rural tourism.

16
Table 18. Type of farm and rural diversification
Farming Related to farming Non-farming
On-farm Crop diversification * Allotment gardens * Tourist farming
* Processing of agricultural products * Farm shops
* Farm B & B * Craft art (* Farmers restaurant)
Off-farm Contract works Farm helper * Allotment gardens Instructor
* Direct sales * Processing factory
Migrant works Full-time employment * Accommodation run by third sector * Restaurant
Source: Based on Ohe (2003), p. 151, partially complemented.
As mentioned above, farm households or rural economy diversification has been supported by
government policy in general, although there are various limiting factors. These include the following:
i) Common restricting factors
Japanese holidays are normally short and concentrated in specific periods, which results in
congestion during peak periods and a low rate of facility occupation on average.
Depopulation and ageing have been a problem for some time in many rural communities,
leading to a serious lack of leaders or volunteers to establish new businesses.
Lack of experience and finance in administrations at the municipality level to support
ambitious farmers.
ii) Restricting factors against farmers’ efforts
Various regulations and lack of guidance to farmers, e.g. laws and regulations on tourism
business, building standards, fire protection, food sanitation, cooking license, etc.
In many rural villages, poor transport access, old sewage system, low accessibility to high-
speed internet, etc. are barriers to welcoming people from urban areas.
Mismatch of services between urban-side needs and rural-side provision (caused by
inexperience and lack of information).
iii) Restricting factors against non-farmers’ access to farm-based resources
Regulations in obtaining agricultural land (for both farming and other purposes)
Difficulty in negotiations with vested interests for existing resources (water, common land,
woods for fuel, etc.)
Difficulty in new participation in existing production and marketing networks.
Multiplier effects of agriculture and other rural activities
Not many studies on multiplier effects of agriculture and other rural activities, in particular at the
national level, were found. This is likely because of the difficulty in getting huge amounts of data sets and
the big lag in the timing of the data found. Yoshida (1987), however, conducted quantitative analysis on all
nine regions in Japan using the 1980 National Input/Output Data and clarified that the proportion of
agricultural production in the regional economy was relatively higher in many regions than was the
national average. In addition, he indicated that promotion of agricultural production was linked to the
revitalization of regional economy, with bigger impacts in rural regions than at the national level overall.

17
Yoshida (1990) also analysed the 1985 National Input/Output Data and found that fluctuations in
agricultural production showed larger impacts on indirectly related industries, such as commerce, finance
and insurance, than on directly related industries, such as farm input industries, in terms of the amount of
money.
Concerning the measurement of the economic effect of agri-tourism on the rural economy, there are
some studies based on Regional Input/Output Data. These include Kurihara (2002) – a case study on
Iiyama City in Nagano Prefecture, Fujimoto (2000) – a case study on Totsukawa Village in Nara
Prefecture, and Yoshida (1992) – a case study on Izu-matsuzaki Town in Shizuoka Prefecture which
concluded that the utilization of local products in agri-tourism had greater effects on the local economy
than did the importation of materials.
Although the studies on the economic effects of agri-tourism are mostly local specific, Ohe (2003)
tried to analyse the direct economic gains from Farm B&B (accommodation and food with farm activity
experiences) at the national level. He indicated that a characteristic of Japanese agri-tourism is the “low
operational rate on average due to the shortness and concentration of Japanese holidays. It is necessary to
receive more day tourists and to move away from seasonality by introducing more diversified activities.”
(Ohe, 2003)
These studies imply that Japanese rural pluriactivity is in a transitional phase from “side-business
during off-farm seasons” to “new gainful opportunity, using various rural resources.” They also suggest
that appropriate measures, such as institutional development (law, regulations, etc.) and support to improve
management ability (information, training, etc.), should be discussed on the basis of accurate information
on on-going farmers’ pluriactivities and the evaluation of present policy on rural economy diversification.

18
REFERENCES
Fujimoto, Takashi (2000), “Estimation of Income and Employment Creating Effects of Tourism in Rural
Region”, The Japanese Journal of Rural Economics, Special Issue 2000, Tokyo.
Kurihara, Shinichi, et al. (2002), “Estimating the Local Economic Impact of Farmhouse Accommodation
in Iiyama-city”, The Technical Bulletin of Faculty of Horticulture, Chiba University, Vol. 56, Chiba
University, Chiba.
Kuwabara, Takashi (2005), “A Study on Green Tourism’s Characteristics as Tourism: Case Analysis of
Shiozawa Town”, The Japanese Journal of Rural Economics, Special Issue 2005, Tokyo.
MAFF (2006), MAFF Statistics Pocketbook 2006, MAFF, Tokyo.
MAFF (2007), The 79th – 81
st Statistical Yearbook of Ministry of Agriculture, Forestry and Fisheries,
MAFF, Tokyo.
MAFF (2007), Annual Report on Food, Agriculture and Rural Areas in Japan FY2006 Summary, MAFF,
Tokyo.
Ohe, Yasuo (2000), “A Conceptual Framework for the Rural Diversification”, The Japanese Journal of
Rural Economics, Special Issue 2000, Tokyo.
Ohe, Yasuo (2003), Economic Analysis of Agriculture and Rural Diversification, Norin Tokei Kyokai,
Tokyo.
Ono, Hiroshi, et al. (2005), “Measurement of Economic Impact of Farmers’ Markets on Regional
Economy”, The Japanese Journal of Rural Economics, Special Issue 2005, Tokyo.
Statistics Bureau of the Ministry of Internal Affairs and Communications, National Census 2005, MIAC,
Tokyo.
Yagi, Hironori (2006), Eyes on Agriculture in New Era, Norin Tokei Kyokai, Tokyo.
Yoshida, Taiji (1990), “Agricultural Production Fluctuation and Related Industries”, Quarterly Journal of
Agricultural Economics, Vol. 44 (2), 163, PRIMAFF, Tokyo.
Yoshida, Taiji (1992), “Input/Output Table for Rural Area Revitalization and its Application”, Quarterly
Journal of Agricultural Economics, Vol. 46 (4), 134, PRIMAFF, Tokyo.