![Collecting household level data on varietal diversification [manual] · 2018-03-28 · Collecting household level data on varietal diversification and adaptation strategies to climate](https://static.fdocuments.us/doc/165x107/5e7e497adfd8246d5e506dba/collecting-household-level-data-on-varietal-diversification-manual-2018-03-28.jpg)
THE ROLE OF AGRICULTURE AND FARM HOUSEHOLD DIVERSIFICATION ... · agriculture and farm household...
37
1 TRADE AND AGRICULTURE DIRECTORATE THE ROLE OF AGRICULTURE AND FARM HOUSEHOLD DIVERSIFICATION IN THE RURAL ECONOMY OF POLAND
Transcript of THE ROLE OF AGRICULTURE AND FARM HOUSEHOLD DIVERSIFICATION ... · agriculture and farm household...
1
TRADE AND AGRICULTURE DIRECTORATE
THE ROLE OF AGRICULTURE AND
FARM HOUSEHOLD DIVERSIFICATION
IN THE RURAL ECONOMY OF
POLAND
Foreword
This report reviews information on the role of agriculture and farm household diversification in the
rural economy of Poland. It was prepared by a consultant, Dorota Klepacka-Kołodziejska, Institute of
Rural and Agricultural Development, Polish Academy of Sciences.
It is one of 13 country reviews prepared under Output area 3.2.1: Agricultural policy reform
(Item 3.2) of the programme of work and budget of the Committee for Agriculture for 2007-08.
Based on material compiled from the available literature, these country reviews address all or most of
the topics listed below:
Definitions and underlying concepts of ―rural‖ as they exist at the national level.
The availability of data pertaining to the share of agriculture and the agro-food sector in the economies of
OECD countries at the national level and in rural areas and trends therein.
The availability of data relating to the income situation of farm households and in particular the availability
of information related to non-farming activities.
The extent to which non-farming income-earning activities of farm households are farm based (i.e using
farm resources as in the case of farm tourism) or rural based (located in rural areas).
The extent to which the industries upstream and downstream from primary agriculture are located in rural
areas.
The strength of multiplier effects between farm/farm based and up/downstream industries and rural
economies.
The information in these country reviews was used as background to the report "The role of
agriculture and farm household diversification in the rural economy: evidence and initial policy
implications" [TAD/CA/APM/WP(2009)1/FINAL], which was declassified by the Working Party on
Agricultural Policies and Markets in February 2009.
3
TABLE OF CONTENTS
Definition of rural areas ............................................................................................................................... 5
Land use ....................................................................................................................................................... 6
Population .................................................................................................................................................... 9
Employment ............................................................................................................................................... 11
Food industry ............................................................................................................................................. 16
Forests ........................................................................................................................................................ 19
Gross Domestic Product ............................................................................................................................ 19
Diversity of agricultural holdings .............................................................................................................. 20
Diversification - regional dimension ......................................................................................................... 25
Factors enhancing farm households diversification into non-agricultural activities .................................. 25
Tourism ...................................................................................................................................................... 27
Factors explaining the development of farm tourism in Poland ................................................................ 29
Multipliers effects of agriculture and other rural activities ........................................................................ 30
References ..................................................................................................................................................... 32
Annex 1. The map of poland with division by voivodships .......................................................................... 34
Annex 2. The specification of territorial districts division (1 January 2008) ................................................ 35
Annex 3. TERYT Register ........................................................................................................................... 36
THE ROLE OF AGRICULTURE AND FARM HOUSEHOLD DIVERSIFICATION
IN THE RURAL ECONOMY OF POLAND
The development of rural areas is at the centre of the debate on agricultural and rural policy in Poland.
The agri-food sector continues to represent an important part of the rural economy, but this is declining. It
is characterised by a low degree of concentration: there are still almost two million farms in Poland and
food processing industries and services are not very concentrated. This means that both agriculture and up-
and downstream activities have a very local character and contribute to the development of local
economies.
This reports contains information compiled from the available literature on the following topics:
definition of rural areas; land use; population; employment; food industry; forestry; gross domestic
product; diversity of agricultural holdings; regional dimension of farm diversification; factors
enhancing farm households diversification into non-agricultural activities ; rural tourism, factors
explaining the development of farm tourism; and multipliers effects of agriculture and other rural activities.
Sources of information
The Central Statistic Office (CSO) is the main source of information in Poland that provides data at
the national, micro-regional and the 16 voivodship levels. More detailed data is available for voivodships
from several censuses in particular, but there is very little, if any, data on rural areas. This report has also
used the following publications as sources of information:
a. Statistical Yearbook of The Republic of Poland : updated annually, this is the main publication of
the CSO. It contains 27 chapters, including one on agriculture, hunting and forestry, and fishing.
The annual up-dating of the data allows for a comparison of developments and for monitoring a
range of micro and macro-economic issues. However, the lack of specific data on rural areas is a
drawback.
b. Publications based on the Agricultural Census 2002 (Powszechny Spis Rolny 2002): the annual
research results published by the CSO over several years contain some of the most detailed data on
agriculture. The most recent, from 2002, is used in this report.
c. Statistical Yearbook of Agriculture and Rural Areas (Rocznik Statystyczny Rolnictwa i Obszarów
Wiejskich): it is more detailed and has more rural data than the agricultural chapter in the
Statistical Yearbook. Despite the title, however, the data covers mainly agriculture. The most
recent issue was published in 2006.
d. Characteristics of rural areas, 2005 (Charakterystyka obszarów wiejskich 2005): This is the first
publication of the CSO explicitly containing data on rural areas, but covers only basic issues.
e. Land use, sawn area and livestock units 2007 (Użytkowanie gruntów, powierzchnia zasiewów i
pogłowie zwierząt gospodarskich w roku 2007).
f. Forestry 2007 (Polish title: Leśnictwo 2007).
g. Labour Force Survey in Poland (third quarter 2007).
5
The need for data on rural areas (and not only on agriculture) is new in Poland. As a result, this kind
of data is scarce especially where it concerns agro-food industry, forest industry, and gross domestic
product.
Data information was also obtained from research by the Institute of Agriculture and Food
Economics, a national research institute supervised by the Ministry of Agriculture and Rural Development,
as well as work by the Ministry of Agriculture and Rural Development, the Agency for Restructuring and
Modernisation of Agriculture (ARMA),1 and non-governmental organisations such as the Foundation for
the Development of Polish Agriculture (FDPA). In addition, studies, papers, and personal consultations
with agri-food industry and diversification experts also contributed to this study.
Regional issues are presented at the voivodship level (16 in all) (NUTS 2) (Map in Annex 1). Annex 2
includes details of the territorial districts.
Definition of rural areas
In the Statistical Yearbook, rural areas are defined in opposition to urban areas: "the term urban areas
is understood as being an area located within the administrative borders of these units, while a rural area is
understood as being the remaining territory of the country‖ (Statistical Yearbook, 2006).
The boundaries of rural areas are based on the territorial divisions of the TERYT Register (see
Annex 3 for a description of this register). In this register, rural areas are comprised of rural gminas and
partly of urban-rural gminas/communes (Charakterystyka, 2006). The Council of Ministers is responsible
for creating, joining, dividing and cancelling gminas as well as establishing their borders, names and urban
status based on specific criteria. Urban gminas include only cities/towns. Within rural gminas there are
exclusively rural areas, but urban–rural gminas are mixed (both city/town and rural areas). A gmina or
city/town can obtain ―urban status‖ when the following criteria are fulfilled: sufficient infrastructure, urban
character, spatial arrangement plan, at least 2 000 inhabitants (in fact this last condition is not always
fulfilled).
The administrative logic for granting (or depriving) a village with city status can lead to paradoxical
situations. There are some very small cities, often with an agricultural function, but also large ―villages‖
with a considerably higher population. There are a few towns in Poland with a population less than 1 000
(e.g. Wyśmierzyce – 921, Suraż – 985).The average population of a village is estimated to be about 300,
but there are numerous villages with a population of over 1 000 and still others with a population slightly
above 3 000 (Rosner, 2008).
When relevant, the designation of rural areas can be extended to small towns, which are functionally
strictly tied to rural areas. Separate definitions of rural areas are created in programmes supporting rural
areas, for instance:
a. Post Accession Rural Support Project for 2006-092 is a loan from The World Bank for 500 gminas.
―Rural areas‖ are restricted to villages and small towns with a population of up to 4 000.
1. The Agency deals with the implementation of European Union programmes and provides national support.
The activities of ARMA are supervised by the Minister of Agriculture and Rural Development.
2. The Ministry of Labour and Social Policy has prepared Post Accession Rural Support Project for 2006-09
(PPWOW). Most gminas which qualified for the programme are situated in eastern Poland. The
Preparation of PPWOW was financed by the so-called Japanese grant (Grantu Japońskiego) to the Polish
government. The Programme itself will be financed mainly from a World Bank loan for
USD 84.04 million. Ten per cent of the whole capital is financed from public funds.
b. Regional Operational Programme for Dolnośląskie Voievodship for 2007-13. Rural areas and small
towns–settlement units set outside city borders and towns where the population is below 10 000
(on 31 December 2005).
c. Supplement to the Integrated Regional Development Operational Programme – in measure 3.1:
―Rural areas‖ projects are expected to cover the fields of tourism and culture having a local impact
in towns with a population of between 5 000 and 20 000 or smaller units which are centres of local
development.
d. Rural Development Programme – towns/cities within administrative borders:
1) rural gminas;
2) rural-urban gminas, excluding cities with over 20 000 inhabitants;
3) urban gminas excluding towns with over 5 000 inhabitants (Ministerstwo, 2006).
The literature also lists the OECD and the EU definitions, but for practical reasons these are not used.
For instance, according to TERYT, using the OECD and Eurostat definitions, in 2005 rural areas covered
respectively 93.2%, 91.0% and 85.7% of total area of country and were populated by 38.6%, 34.4% and
29.3% of the total population (Charakterystyka, 2006).
Land use
In 2006, Poland covered a total area of 31.3 million hectares (ha), of which 29.2 million ha was rural
land. Rural areas covered 93.2% of the total area of the country, with farm land occupying about
18.7 million ha, or 59.7% of the country’s area. In 2007, the land occupied by all private farms was
estimated at 17.9 million ha, 401.1 thousand ha (or 2.3%) more than in 2006. The size of agricultural land
belonging to the State was estimated to be over 0.7 million ha, 82 000 ha (or 9.9%), less than in the
previous year.
In 2007, agricultural land covered almost 16.2 million ha, an increase of 219 800 ha (or 1.4%) in
comparison to the previous year. Arable land covered 63.6% of all agricultural land; permanent meadows
and pastures covered 3.3 million ha, taking 20.2% agricultural land area and 17.5% of total agricultural
holdings area (pastures 4.1%, meadows 13.4%). Orchards covered 336 800 ha or 2.1% of agricultural
land area and 1.8% of total agricultural holdings area (in 2006 it was 1.8% and 1.6% respectively)
(Użytkowanie, 2007). Forests and forest land covered 6.7% of total agricultural area, other agricultural
land 3.8%, and other land 6.6% (Table 1).
During the last 12 years, there has been a considerable decrease in pasture area, following a decline in
cattle heads. Moreover, arable land was reduced in favour of forests. Out of total agricultural land covering
almost 16.2 million ha, about 15.5 million ha was kept in good agricultural condition.
In 2007, arable land covered about 11.5 million ha, about 9 200 ha (0.1%) less than the previous
year. Arable land of private farms covered about 11.3 million ha, about 7 800 ha (by 0.1%) less than the
previous year. Arable land of agricultural farms belonging to the public sector also decreased by about
1 500 ha (or 0.8%).
7
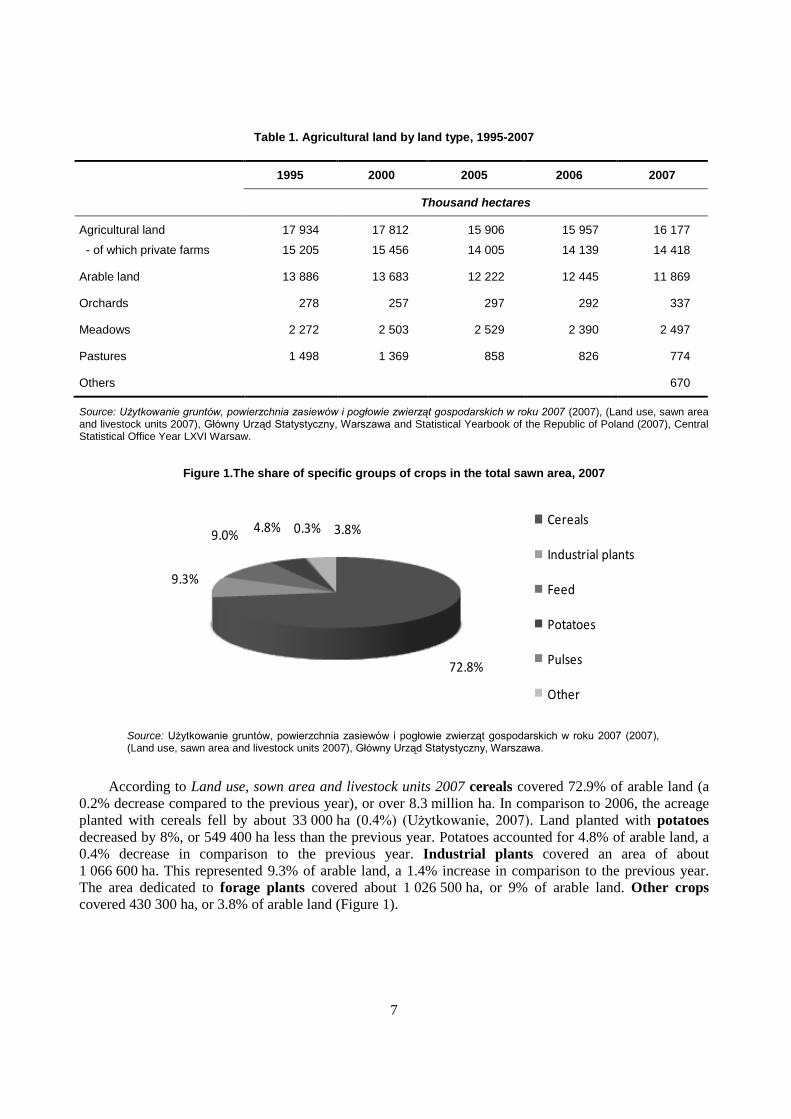
Table 1. Agricultural land by land type, 1995-2007
1995 2000 2005 2006 2007
Thousand hectares
Agricultural land
- of which private farms
17 934
15 205
17 812
15 456
15 906
14 005
15 957
14 139
16 177
14 418
Arable land 13 886 13 683 12 222 12 445 11 869
Orchards 278 257 297 292 337
Meadows 2 272 2 503 2 529 2 390 2 497
Pastures 1 498 1 369 858 826 774
Others 670
Source: Użytkowanie gruntów, powierzchnia zasiewów i pogłowie zwierząt gospodarskich w roku 2007 (2007), (Land use, sawn area and livestock units 2007), Główny Urząd Statystyczny, Warszawa and Statistical Yearbook of the Republic of Poland (2007), Central Statistical Office Year LXVI Warsaw.
Figure 1.The share of specific groups of crops in the total sawn area, 2007
72.8%
9.3%
9.0%4.8% 0.3% 3.8%
Cereals
Industrial plants
Feed
Potatoes
Pulses
Other
Source: Użytkowanie gruntów, powierzchnia zasiewów i pogłowie zwierząt gospodarskich w roku 2007 (2007), (Land use, sawn area and livestock units 2007), Główny Urząd Statystyczny, Warszawa.
According to Land use, sown area and livestock units 2007 cereals covered 72.9% of arable land (a
0.2% decrease compared to the previous year), or over 8.3 million ha. In comparison to 2006, the acreage
planted with cereals fell by about 33 000 ha (0.4%) (Użytkowanie, 2007). Land planted with potatoes
decreased by 8%, or 549 400 ha less than the previous year. Potatoes accounted for 4.8% of arable land, a
0.4% decrease in comparison to the previous year. Industrial plants covered an area of about
1 066 600 ha. This represented 9.3% of arable land, a 1.4% increase in comparison to the previous year.
The area dedicated to forage plants covered about 1 026 500 ha, or 9% of arable land. Other crops
covered 430 300 ha, or 3.8% of arable land (Figure 1).
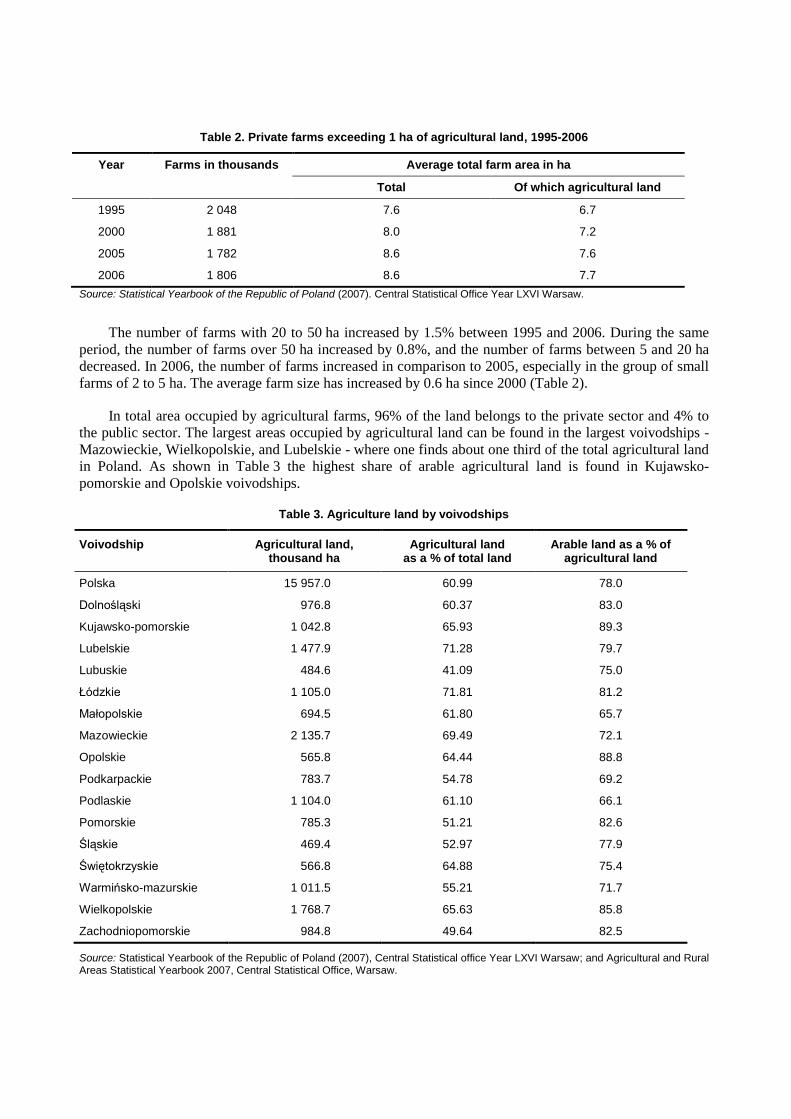
Table 2. Private farms exceeding 1 ha of agricultural land, 1995-2006
Year Farms in thousands Average total farm area in ha
Total Of which agricultural land
1995 2 048 7.6 6.7
2000 1 881 8.0 7.2
2005 1 782 8.6 7.6
2006 1 806 8.6 7.7
Source: Statistical Yearbook of the Republic of Poland (2007). Central Statistical Office Year LXVI Warsaw.
The number of farms with 20 to 50 ha increased by 1.5% between 1995 and 2006. During the same
period, the number of farms over 50 ha increased by 0.8%, and the number of farms between 5 and 20 ha
decreased. In 2006, the number of farms increased in comparison to 2005, especially in the group of small
farms of 2 to 5 ha. The average farm size has increased by 0.6 ha since 2000 (Table 2).
In total area occupied by agricultural farms, 96% of the land belongs to the private sector and 4% to
the public sector. The largest areas occupied by agricultural land can be found in the largest voivodships -
Mazowieckie, Wielkopolskie, and Lubelskie - where one finds about one third of the total agricultural land
in Poland. As shown in Table 3 the highest share of arable agricultural land is found in Kujawsko-
pomorskie and Opolskie voivodships.
Table 3. Agriculture land by voivodships
Voivodship Agricultural land, thousand ha
Agricultural land as a % of total land
Arable land as a % of agricultural land
Polska 15 957.0 60.99 78.0
Dolnośląski 976.8 60.37 83.0
Kujawsko-pomorskie 1 042.8 65.93 89.3
Lubelskie 1 477.9 71.28 79.7
Lubuskie 484.6 41.09 75.0
Łódzkie 1 105.0 71.81 81.2
Małopolskie 694.5 61.80 65.7
Mazowieckie 2 135.7 69.49 72.1
Opolskie 565.8 64.44 88.8
Podkarpackie 783.7 54.78 69.2
Podlaskie 1 104.0 61.10 66.1
Pomorskie 785.3 51.21 82.6
Śląskie 469.4 52.97 77.9
Świętokrzyskie 566.8 64.88 75.4
Warmińsko-mazurskie 1 011.5 55.21 71.7
Wielkopolskie 1 768.7 65.63 85.8
Zachodniopomorskie 984.8 49.64 82.5
Source: Statistical Yearbook of the Republic of Poland (2007), Central Statistical office Year LXVI Warsaw; and Agricultural and Rural Areas Statistical Yearbook 2007, Central Statistical Office, Warsaw.
9
The quality of farmland in Poland is relatively low – only about 25% of farmland fall under higher
soil quality classes (I-III).
There are 53 000 rural localities, including 42 800 villages and 10 200 settlements, with an average of
277 inhabitants per rural locality.
Population
The population of rural areas in 2006 was 14.76 million, representing 38.7% of the national
population, more or less the same number as in 1946, when the population was 16.11 million persons. This
means that during 60 years the population decreased by 8.4%. The percentage of the rural population in the
total population during this period decreased from 68.2% to 38.7% as a result of urbanisation, and the
development of industry and services (Statistical Yearbook, 2007).
In 2005, the lowest percentage of rural population was recorded in the Śląskie voivodship (21.4%)
and the highest in eastern and south-eastern Poland: Podkarpackie, Świętokrzyskie, Lubelskie and
Małopolskie, where the rural population was respectively: 59.5%. 54.7%. 53.4% and 50.5% (Statistical
Yearbook, 2006). These voivodships are regarded as being the most rural.
The rural population grew in absolute terms in 11 voivodships (from 0.5% in Mazowieckie to 5.3% in
Warmińsko-Mazurskie voivodships) and fell in the remaining ones (from 0.2% in Świętokrzyskie to 1.8%
in Podlaskie) (Frenkel, 2006).
From 2000 to 2003 there was a downward trend in the natural increase of the rural population, which
began in the mid-1980s. It fell from 1.4 person per 1 000 inhabitants in 2000 to 0.2 person in 2003 (in
towns, the value of this coefficient was negative during this same period, increasing from -0.4‰ to -0.7‰
respectively). In 2004, the natural increase index grew for the first time in rural areas (to 0.3‰) and the
negative value of that coefficient was reduced in towns (to -0.5‰.) and at the national level (from -0.4‰ in
2003 to -0.2‰ in 2004) (Frenkel, 2006).
The share of the rural population in the total population has been increasing since 2000. In the years
2000-06 the increase reached 172 900. A high increase is observed in rural areas situated close to large
agglomerations and in regions that are attractive in terms of natural values. There is an increase in the
number of rural area inhabitants who have willingly chosen to live there. Today, most village inhabitants
have lived there since birth. It is estimated that in the next years we will witness an increase in residential
villages, which will be expected to secure good living and social conditions. Well-off pensioners/retired
people and foreigners will start inhabiting these villages, some of whom will start agricultural activity,
benefiting from low land prices and the lack of limits in purchasing land (Charakterystyka, 2006).
On average, the population density in rural areas is 50 people per km2, as compared to an average of
122 in Poland and 1 116 in towns and cities. The greatest population density is found in central Poland
with over 225 localities having over 1 000 people per km2. In more than 80% of rural localities, the number
of inhabitants per km2 is 500 or less, and in 15% the population density is less than 100 inhabitant per km
2
(Agriculture, 2007).
The density of population varies between 24 persons per km2 in Warmińsko-mazurskie and
Zachodniopomorskie voivodeships to 119 persons per km2 in Małopolskie voivodeship. Of the
2 171 gminas that include rural areas, 242 have a population density below 25 persons per km2 and
137 gminas 150 or more (Rural, 2004).
A high population density is found mainly in gminas with small farms but located near big cities;
numerous inhabitants commute to town for work (which prevents out-migration). Low density of
population is characteristic of rural areas located far from cities but with relatively good agrarian
structures; here there is strong out-migrations to towns (Rural, 2004).
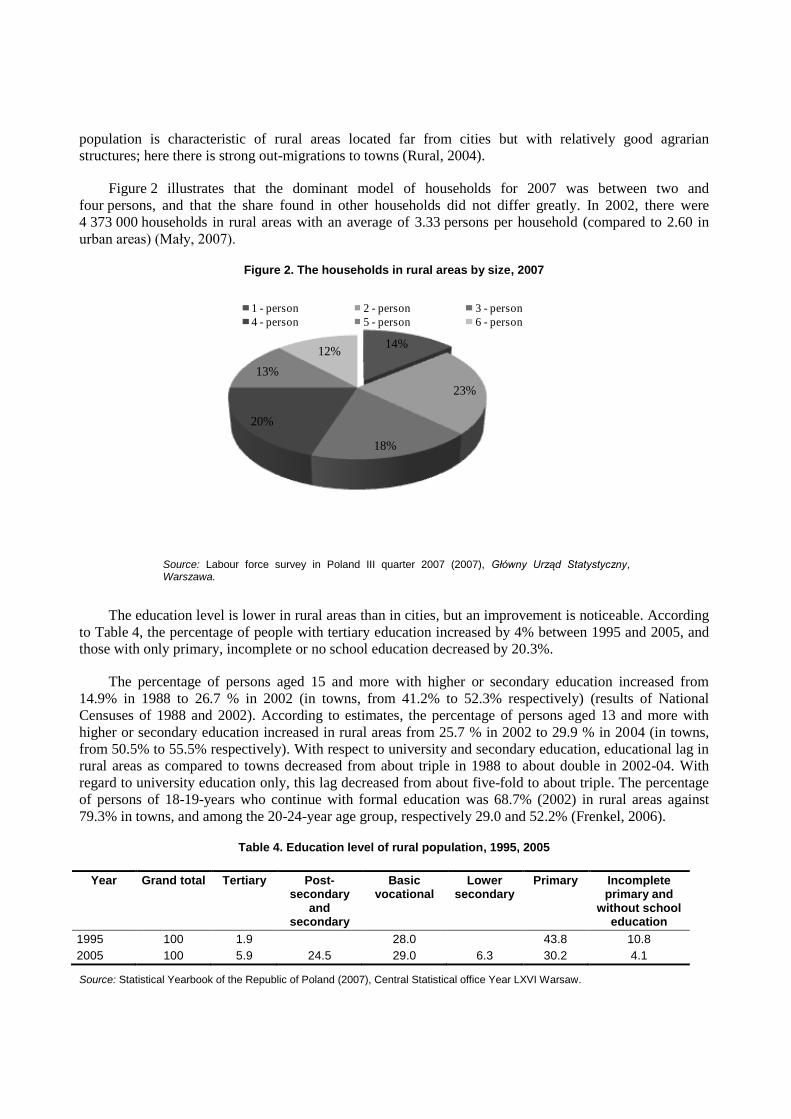
Figure 2 illustrates that the dominant model of households for 2007 was between two and
four persons, and that the share found in other households did not differ greatly. In 2002, there were
4 373 000 households in rural areas with an average of 3.33 persons per household (compared to 2.60 in
urban areas) (Mały, 2007).
Figure 2. The households in rural areas by size, 2007
14%
23%
18%
20%
13%
12%
1 - person 2 - person 3 - person
4 - person 5 - person 6 - person
Source: Labour force survey in Poland III quarter 2007 (2007), Główny Urząd Statystyczny, Warszawa.
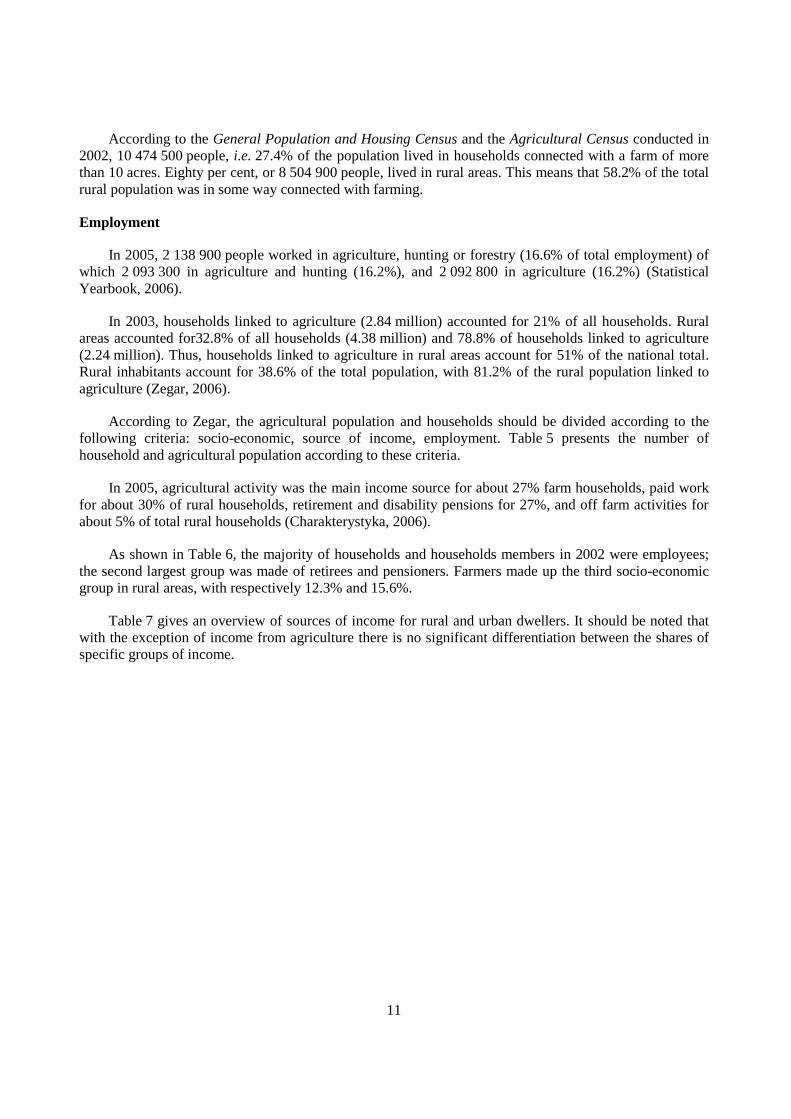
The education level is lower in rural areas than in cities, but an improvement is noticeable. According
to Table 4, the percentage of people with tertiary education increased by 4% between 1995 and 2005, and
those with only primary, incomplete or no school education decreased by 20.3%.
The percentage of persons aged 15 and more with higher or secondary education increased from
14.9% in 1988 to 26.7 % in 2002 (in towns, from 41.2% to 52.3% respectively) (results of National
Censuses of 1988 and 2002). According to estimates, the percentage of persons aged 13 and more with
higher or secondary education increased in rural areas from 25.7 % in 2002 to 29.9 % in 2004 (in towns,
from 50.5% to 55.5% respectively). With respect to university and secondary education, educational lag in
rural areas as compared to towns decreased from about triple in 1988 to about double in 2002-04. With
regard to university education only, this lag decreased from about five-fold to about triple. The percentage
of persons of 18-19-years who continue with formal education was 68.7% (2002) in rural areas against
79.3% in towns, and among the 20-24-year age group, respectively 29.0 and 52.2% (Frenkel, 2006).
Table 4. Education level of rural population, 1995, 2005
Year Grand total Tertiary Post-secondary
and secondary
Basic vocational
Lower secondary
Primary Incomplete primary and
without school education
1995 100 1.9 28.0 43.8 10.8
2005 100 5.9 24.5 29.0 6.3 30.2 4.1
Source: Statistical Yearbook of the Republic of Poland (2007), Central Statistical office Year LXVI Warsaw.
11
According to the General Population and Housing Census and the Agricultural Census conducted in
2002, 10 474 500 people, i.e. 27.4% of the population lived in households connected with a farm of more
than 10 acres. Eighty per cent, or 8 504 900 people, lived in rural areas. This means that 58.2% of the total
rural population was in some way connected with farming.
Employment
In 2005, 2 138 900 people worked in agriculture, hunting or forestry (16.6% of total employment) of
which 2 093 300 in agriculture and hunting (16.2%), and 2 092 800 in agriculture (16.2%) (Statistical
Yearbook, 2006).
In 2003, households linked to agriculture (2.84 million) accounted for 21% of all households. Rural
areas accounted for32.8% of all households (4.38 million) and 78.8% of households linked to agriculture
(2.24 million). Thus, households linked to agriculture in rural areas account for 51% of the national total.
Rural inhabitants account for 38.6% of the total population, with 81.2% of the rural population linked to
agriculture (Zegar, 2006).
According to Zegar, the agricultural population and households should be divided according to the
following criteria: socio-economic, source of income, employment. Table 5 presents the number of
household and agricultural population according to these criteria.
In 2005, agricultural activity was the main income source for about 27% farm households, paid work
for about 30% of rural households, retirement and disability pensions for 27%, and off farm activities for
about 5% of total rural households (Charakterystyka, 2006).
As shown in Table 6, the majority of households and households members in 2002 were employees;
the second largest group was made of retirees and pensioners. Farmers made up the third socio-economic
group in rural areas, with respectively 12.3% and 15.6%.
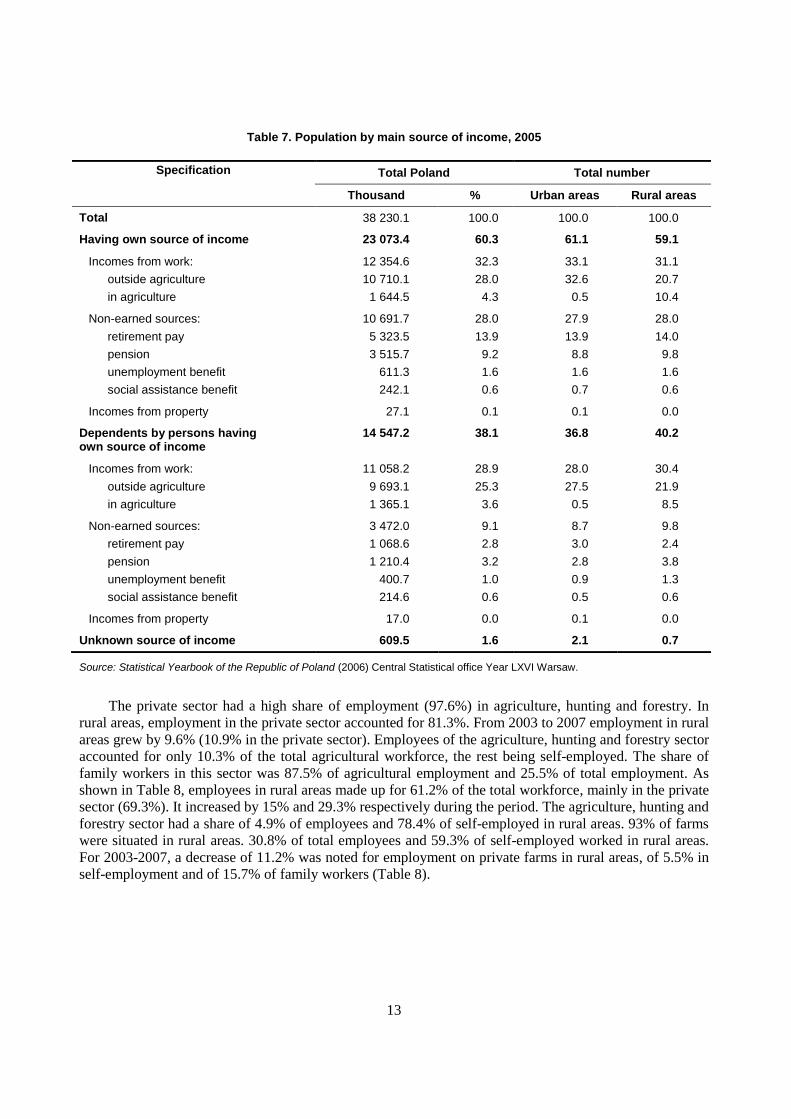
Table 7 gives an overview of sources of income for rural and urban dwellers. It should be noted that
with the exception of income from agriculture there is no significant differentiation between the shares of
specific groups of income.
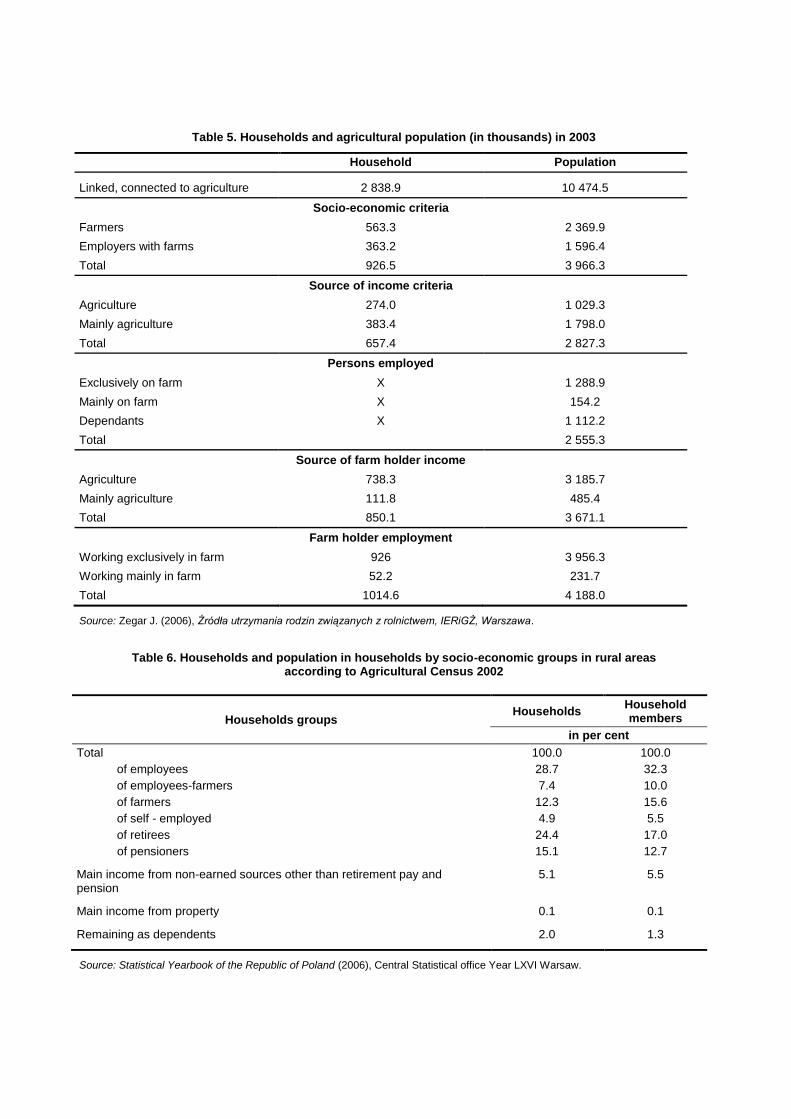
Table 5. Households and agricultural population (in thousands) in 2003
Household Population
Linked, connected to agriculture 2 838.9 10 474.5
Socio-economic criteria
Farmers 563.3 2 369.9
Employers with farms 363.2 1 596.4
Total 926.5 3 966.3
Source of income criteria
Agriculture 274.0 1 029.3
Mainly agriculture 383.4 1 798.0
Total 657.4 2 827.3
Persons employed
Exclusively on farm X 1 288.9
Mainly on farm X 154.2
Dependants X 1 112.2
Total 2 555.3
Source of farm holder income
Agriculture 738.3 3 185.7
Mainly agriculture 111.8 485.4
Total 850.1 3 671.1
Farm holder employment
Working exclusively in farm 926 3 956.3
Working mainly in farm 52.2 231.7
Total 1014.6 4 188.0
Source: Zegar J. (2006), Źródła utrzymania rodzin związanych z rolnictwem, IERiGŻ, Warszawa.
Table 6. Households and population in households by socio-economic groups in rural areas according to Agricultural Census 2002
Households groups Households
Household members
in per cent
Total 100.0 100.0
of employees 28.7 32.3
of employees-farmers 7.4 10.0
of farmers 12.3 15.6
of self - employed 4.9 5.5
of retirees 24.4 17.0
of pensioners 15.1 12.7
Main income from non-earned sources other than retirement pay and pension
5.1 5.5
Main income from property 0.1 0.1
Remaining as dependents 2.0 1.3
Source: Statistical Yearbook of the Republic of Poland (2006), Central Statistical office Year LXVI Warsaw.
13
Table 7. Population by main source of income, 2005
Specification Total Poland Total number
Thousand % Urban areas Rural areas
Total 38 230.1 100.0 100.0 100.0
Having own source of income 23 073.4 60.3 61.1 59.1
Incomes from work:
outside agriculture
in agriculture
12 354.6
10 710.1
1 644.5
32.3
28.0
4.3
33.1
32.6
0.5
31.1
20.7
10.4
Non-earned sources:
retirement pay
pension
unemployment benefit
social assistance benefit
10 691.7
5 323.5
3 515.7
611.3
242.1
28.0
13.9
9.2
1.6
0.6
27.9
13.9
8.8
1.6
0.7
28.0
14.0
9.8
1.6
0.6
Incomes from property 27.1 0.1 0.1 0.0
Dependents by persons having own source of income
14 547.2 38.1 36.8 40.2
Incomes from work:
outside agriculture
in agriculture
11 058.2
9 693.1
1 365.1
28.9
25.3
3.6
28.0
27.5
0.5
30.4
21.9
8.5
Non-earned sources:
retirement pay
pension
unemployment benefit
social assistance benefit
3 472.0
1 068.6
1 210.4
400.7
214.6
9.1
2.8
3.2
1.0
0.6
8.7
3.0
2.8
0.9
0.5
9.8
2.4
3.8
1.3
0.6
Incomes from property 17.0 0.0 0.1 0.0
Unknown source of income 609.5 1.6 2.1 0.7
Source: Statistical Yearbook of the Republic of Poland (2006) Central Statistical office Year LXVI Warsaw.
The private sector had a high share of employment (97.6%) in agriculture, hunting and forestry. In
rural areas, employment in the private sector accounted for 81.3%. From 2003 to 2007 employment in rural
areas grew by 9.6% (10.9% in the private sector). Employees of the agriculture, hunting and forestry sector
accounted for only 10.3% of the total agricultural workforce, the rest being self-employed. The share of
family workers in this sector was 87.5% of agricultural employment and 25.5% of total employment. As
shown in Table 8, employees in rural areas made up for 61.2% of the total workforce, mainly in the private
sector (69.3%). It increased by 15% and 29.3% respectively during the period. The agriculture, hunting and
forestry sector had a share of 4.9% of employees and 78.4% of self-employed in rural areas. 93% of farms
were situated in rural areas. 30.8% of total employees and 59.3% of self-employed worked in rural areas.
For 2003-2007, a decrease of 11.2% was noted for employment on private farms in rural areas, of 5.5% in
self-employment and of 15.7% of family workers (Table 8).
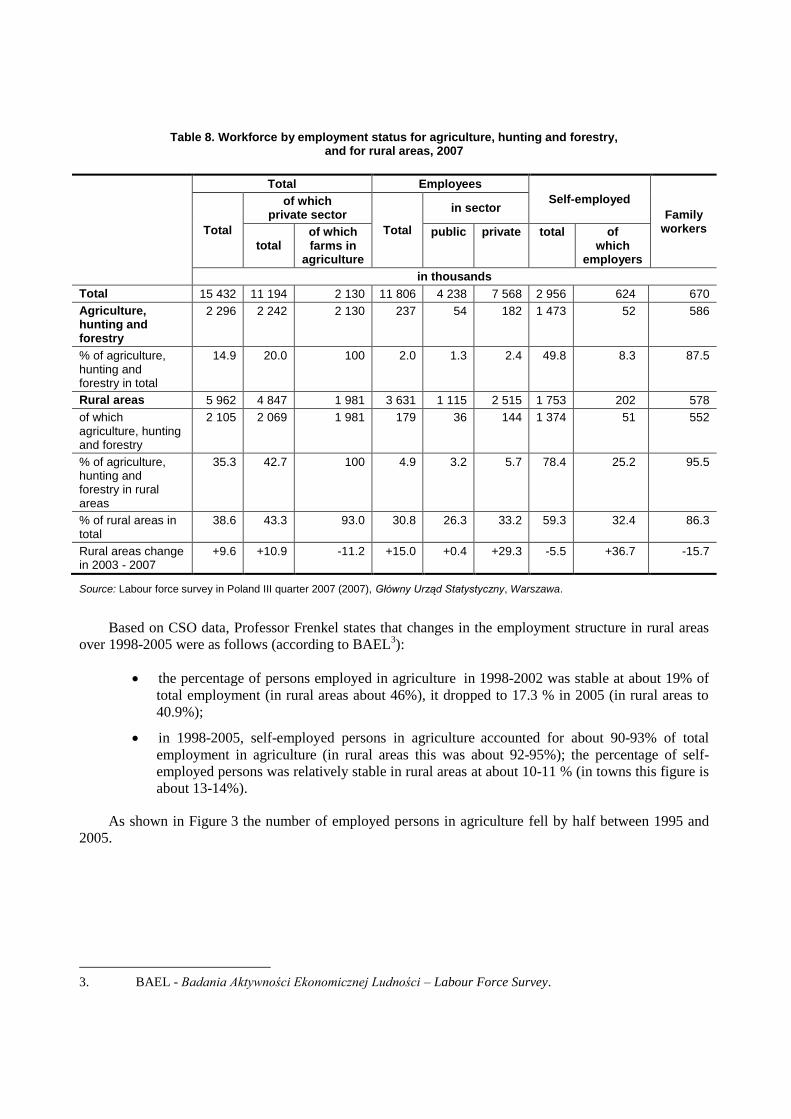
Table 8. Workforce by employment status for agriculture, hunting and forestry, and for rural areas, 2007
Total Employees
Self-employed
Family workers Total
of which private sector
Total
in sector
total of which farms in
agriculture
public private total of which
employers
in thousands
Total 15 432 11 194 2 130 11 806 4 238 7 568 2 956 624 670
Agriculture, hunting and forestry
2 296 2 242 2 130 237 54 182 1 473 52 586
% of agriculture, hunting and forestry in total
14.9 20.0 100 2.0 1.3 2.4 49.8 8.3 87.5
Rural areas 5 962 4 847 1 981 3 631 1 115 2 515 1 753 202 578
of which agriculture, hunting and forestry
2 105 2 069 1 981 179 36 144 1 374 51 552
% of agriculture, hunting and forestry in rural areas
35.3 42.7 100 4.9 3.2 5.7 78.4 25.2 95.5
% of rural areas in total
38.6 43.3 93.0 30.8 26.3 33.2 59.3 32.4 86.3
Rural areas change in 2003 - 2007
+9.6 +10.9 -11.2 +15.0 +0.4 +29.3 -5.5 +36.7 -15.7
Source: Labour force survey in Poland III quarter 2007 (2007), Główny Urząd Statystyczny, Warszawa.
Based on CSO data, Professor Frenkel states that changes in the employment structure in rural areas
over 1998-2005 were as follows (according to BAEL3):
the percentage of persons employed in agriculture in 1998-2002 was stable at about 19% of
total employment (in rural areas about 46%), it dropped to 17.3 % in 2005 (in rural areas to
40.9%);
in 1998-2005, self-employed persons in agriculture accounted for about 90-93% of total
employment in agriculture (in rural areas this was about 92-95%); the percentage of self-
employed persons was relatively stable in rural areas at about 10-11 % (in towns this figure is
about 13-14%).
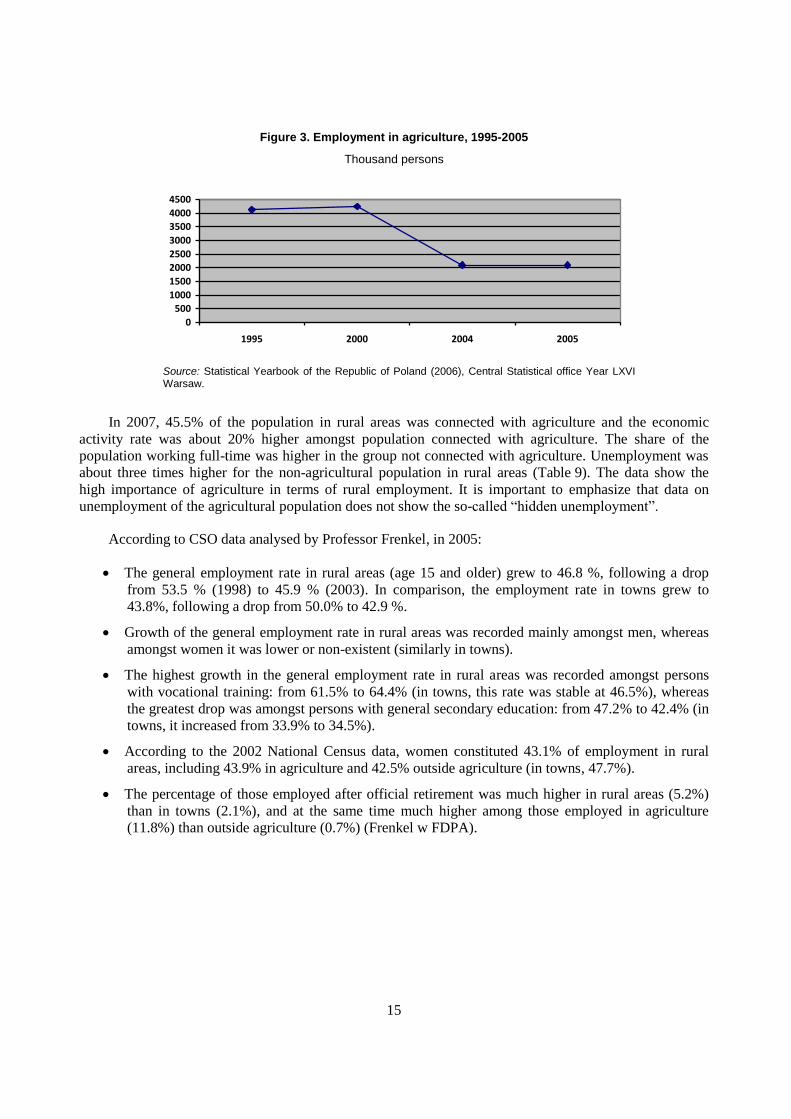
As shown in Figure 3 the number of employed persons in agriculture fell by half between 1995 and
2005.
3. BAEL - Badania Aktywności Ekonomicznej Ludności – Labour Force Survey.
15
Figure 3. Employment in agriculture, 1995-2005
Thousand persons
0
500
1000
1500
2000
2500
3000
3500
4000
4500
1995 2000 2004 2005
Source: Statistical Yearbook of the Republic of Poland (2006), Central Statistical office Year LXVI Warsaw.
In 2007, 45.5% of the population in rural areas was connected with agriculture and the economic
activity rate was about 20% higher amongst population connected with agriculture. The share of the
population working full-time was higher in the group not connected with agriculture. Unemployment was
about three times higher for the non-agricultural population in rural areas (Table 9). The data show the
high importance of agriculture in terms of rural employment. It is important to emphasize that data on
unemployment of the agricultural population does not show the so-called ―hidden unemployment‖.
According to CSO data analysed by Professor Frenkel, in 2005:
The general employment rate in rural areas (age 15 and older) grew to 46.8 %, following a drop
from 53.5 % (1998) to 45.9 % (2003). In comparison, the employment rate in towns grew to
43.8%, following a drop from 50.0% to 42.9 %.
Growth of the general employment rate in rural areas was recorded mainly amongst men, whereas
amongst women it was lower or non-existent (similarly in towns).
The highest growth in the general employment rate in rural areas was recorded amongst persons
with vocational training: from 61.5% to 64.4% (in towns, this rate was stable at 46.5%), whereas
the greatest drop was amongst persons with general secondary education: from 47.2% to 42.4% (in
towns, it increased from 33.9% to 34.5%).
According to the 2002 National Census data, women constituted 43.1% of employment in rural
areas, including 43.9% in agriculture and 42.5% outside agriculture (in towns, 47.7%).
The percentage of those employed after official retirement was much higher in rural areas (5.2%)
than in towns (2.1%), and at the same time much higher among those employed in agriculture
(11.8%) than outside agriculture (0.7%) (Frenkel w FDPA).
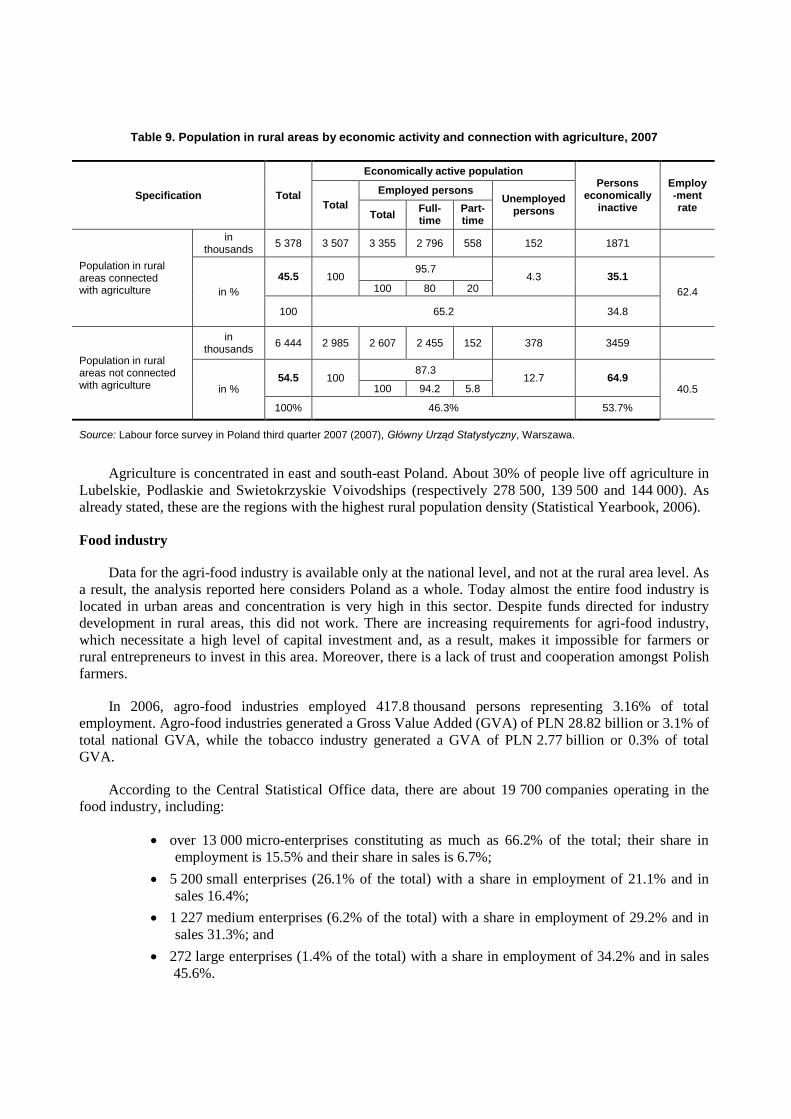
Table 9. Population in rural areas by economic activity and connection with agriculture, 2007
Specification Total
Economically active population Persons
economically inactive
Employ-ment rate Total
Employed persons Unemployed
persons Total Full-time
Part-time
Population in rural areas connected with agriculture
in thousands
5 378 3 507 3 355 2 796 558 152 1871
in %
45.5 100 95.7
4.3 35.1
62.4 100 80 20
100 65.2 34.8
Population in rural areas not connected with agriculture
in thousands
6 444 2 985 2 607 2 455 152 378 3459
in % 54.5 100
87.3 12.7 64.9
40.5 100 94.2 5.8
100% 46.3% 53.7%
Source: Labour force survey in Poland third quarter 2007 (2007), Główny Urząd Statystyczny, Warszawa.
Agriculture is concentrated in east and south-east Poland. About 30% of people live off agriculture in
Lubelskie, Podlaskie and Swietokrzyskie Voivodships (respectively 278 500, 139 500 and 144 000). As
already stated, these are the regions with the highest rural population density (Statistical Yearbook, 2006).
Food industry
Data for the agri-food industry is available only at the national level, and not at the rural area level. As
a result, the analysis reported here considers Poland as a whole. Today almost the entire food industry is
located in urban areas and concentration is very high in this sector. Despite funds directed for industry
development in rural areas, this did not work. There are increasing requirements for agri-food industry,
which necessitate a high level of capital investment and, as a result, makes it impossible for farmers or
rural entrepreneurs to invest in this area. Moreover, there is a lack of trust and cooperation amongst Polish
farmers.
In 2006, agro-food industries employed 417.8 thousand persons representing 3.16% of total
employment. Agro-food industries generated a Gross Value Added (GVA) of PLN 28.82 billion or 3.1% of
total national GVA, while the tobacco industry generated a GVA of PLN 2.77 billion or 0.3% of total
GVA.
According to the Central Statistical Office data, there are about 19 700 companies operating in the
food industry, including:
over 13 000 micro-enterprises constituting as much as 66.2% of the total; their share in
employment is 15.5% and their share in sales is 6.7%;
5 200 small enterprises (26.1% of the total) with a share in employment of 21.1% and in
sales 16.4%;
1 227 medium enterprises (6.2% of the total) with a share in employment of 29.2% and in
sales 31.3%; and
272 large enterprises (1.4% of the total) with a share in employment of 34.2% and in sales
45.6%.
17
According to the Ministry of Agriculture and Rural Development the results of the Polish food
industry between 2004 and 2006 demonstrated that the industry was well-prepared for integration with the
EU. This is reflected by the rapid increase in the number of plants in ―sensitive‖ sectors entitled to trade
with other EU Member States. Starting from 2004, the number of such plants increased from 61 to 856 in
the meat sector, from 40 to 218 in the poultry sector, from 55 to 272 in the dairy sector, and from 62 to 192
in the fish sector.
Progress in the adjustment of food industry plants to EU standards resulted from an investment revival
in this branch of the Polish economy. Admittedly, it took place only on the eve of Poland’s accession to the
EU, but its scale was wide. Investment outlay in the food sector in 2003 increased by over 20%, and in the
next two years they were twice as high as between 2000 and 2003. This high level was maintained in 2006,
amounting to over PLN 6 billion, a 9% increase from 2005.
The few years preceding accession were a period of great production revival for the food industry. In
2003, production sold by the food industry increased by 7.7%. The fast pace of development was
maintained in the first months of 2004. Its decrease (to about 3% per annum) took place in the first year
after Poland’s accession to the EU. This was a period of stability of national demand for food due to both
the increase in prices (by about 7-8%) and the decrease in actual income of the non-agricultural population.
At the same time, the only food production increase factor was the fast increasing export market. The
situation at the national market level changed in mid-2005, when there was another production revival of
this sector. The pace of food industry production exceeded 5-6% per annum in the second and third year
after accession to the EU. Increasing export and national demand are sector development factors. Increase
in production, in sales of foodstuffs and drinks by 7.3% and a decrease in tobacco industry products by
5.4% were noted in 2006 (Agriculture, 2007).
Economic and financial results of the food industry improved after Poland’s accession to the EU.
They stabilised at a relatively high and safe level. For years, the net profit of the sector enterprises
exceeded PLN 4 billion, and profitability exceeded 3.5% of the value of net turnover. The indicators are
twice as high as in previous years, obtained in conditions of constant PLN strengthening and lower
increase of food industry market prices than of the prices paid to farmers. The improvement is therefore the
outcome of better use of production factors and restructuring of companies (Agriculture, 2007).
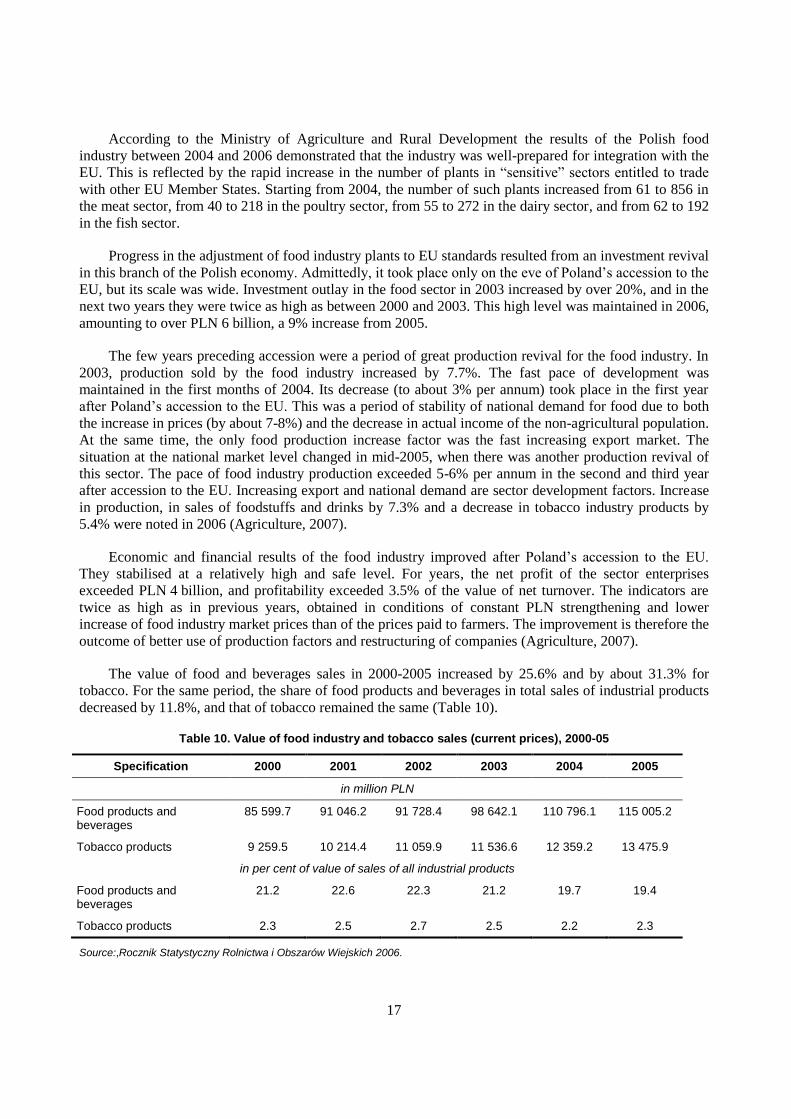
The value of food and beverages sales in 2000-2005 increased by 25.6% and by about 31.3% for
tobacco. For the same period, the share of food products and beverages in total sales of industrial products
decreased by 11.8%, and that of tobacco remained the same (Table 10).
Table 10. Value of food industry and tobacco sales (current prices), 2000-05
Specification 2000 2001 2002 2003 2004 2005
in million PLN
Food products and beverages
85 599.7 91 046.2 91 728.4 98 642.1 110 796.1 115 005.2
Tobacco products 9 259.5 10 214.4 11 059.9 11 536.6 12 359.2 13 475.9
in per cent of value of sales of all industrial products
Food products and beverages
21.2 22.6 22.3 21.2 19.7 19.4
Tobacco products 2.3 2.5 2.7 2.5 2.2 2.3
Source:,Rocznik Statystyczny Rolnictwa i Obszarów Wiejskich 2006.
In 2006, half of the branches of the food industry noted an improvement in their financial results. All
sub-sectors producing food and drinks reached a positive financial result; only tobacco producers noted a
net loss. Considerable diversification in profitability level between the branches of food processing
continued (Agriculture, 2007).
The financial result of animal products and fish processing firms increased over the last few years.
Since 2005, results have exceeded PLN 1 billion and were three times lower than in previous years.
However, the profitability of these processing industries was not high and did not exceed 2% of net
income. For the last few years, all branches of these processing industries have been profitable, yet the
profitability indicators are not high. The worse financial results were noted for poultry processing, where
the profitability was less than 1% and the rate of return was twice as small as for all animal and fish
processing industries. The situation of the dairy and fish industries was the most stable (Agriculture, 2007).
As far as crop processing industries are concerned, the financial result also increased and the after-tax
profit was nearly PLN 1.2 billion, nearly twice as high as in 2005. It facilitated the achievement of high
profitability (4.6% of net income), and cash accumulation was above 8% of sales. High net profitability
was noted for all branches of these processing industries, with the exception of potato processing, where it
reached 2%. In 2006, crop processing industries were in a good financial situation, displaying high running
financial liquidity indicator and high share of their own resources in the working capital financing structure
(Agriculture, 2007).
As far as second-stage processing is concerned, financial results have been improving for several
years and in 2006 exceeded PLN 1.7 billion (this was twice as high as in the 2001-03 period). Net
profitability was 5.2% of net income. The ability to generate own resources stood at nearly 9% of net
income. The rate of return reached 15% and was higher than the average of the food industry. As regards
all the branches of processing, net profitability and the rate of return have considerably exceeded the
average level of these indicators in the food industry (Agriculture, 2007).
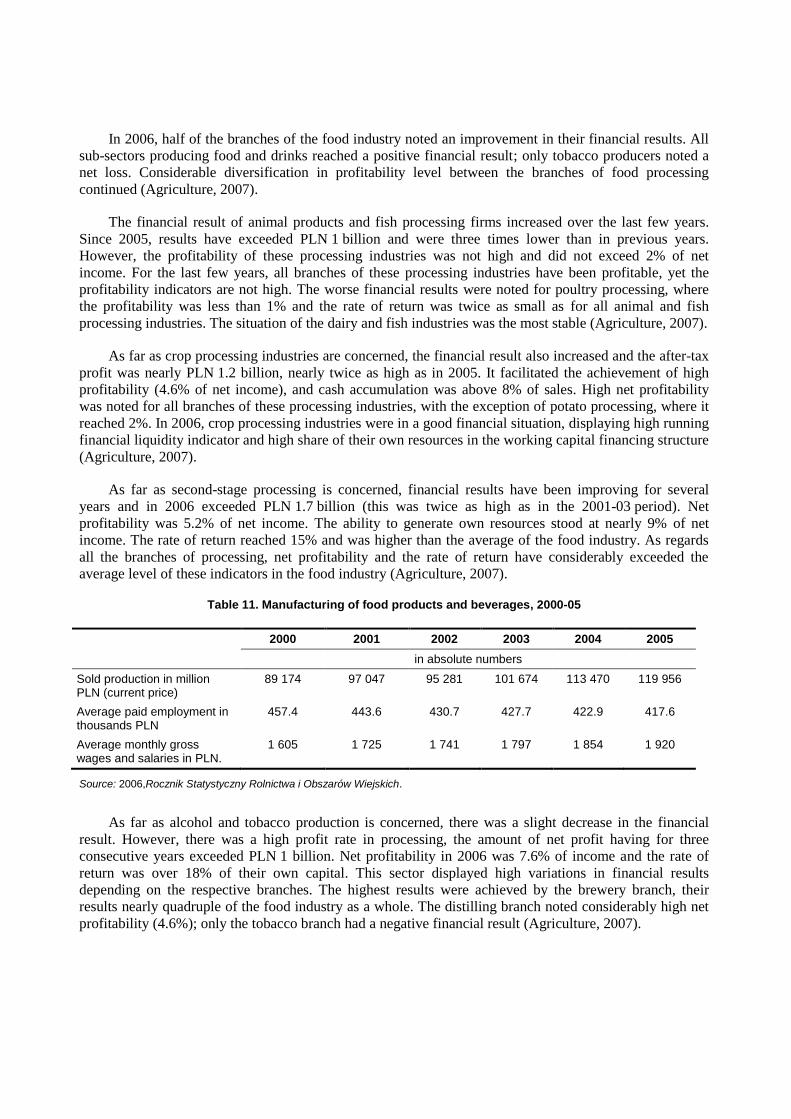
Table 11. Manufacturing of food products and beverages, 2000-05
2000 2001 2002 2003 2004 2005
in absolute numbers
Sold production in million PLN (current price)
89 174 97 047 95 281 101 674 113 470 119 956
Average paid employment in thousands PLN
457.4 443.6 430.7 427.7 422.9 417.6
Average monthly gross wages and salaries in PLN.
1 605 1 725 1 741 1 797 1 854 1 920
Source: 2006,Rocznik Statystyczny Rolnictwa i Obszarów Wiejskich.
As far as alcohol and tobacco production is concerned, there was a slight decrease in the financial
result. However, there was a high profit rate in processing, the amount of net profit having for three
consecutive years exceeded PLN 1 billion. Net profitability in 2006 was 7.6% of income and the rate of
return was over 18% of their own capital. This sector displayed high variations in financial results
depending on the respective branches. The highest results were achieved by the brewery branch, their
results nearly quadruple of the food industry as a whole. The distilling branch noted considerably high net
profitability (4.6%); only the tobacco branch had a negative financial result (Agriculture, 2007).
19
Forests
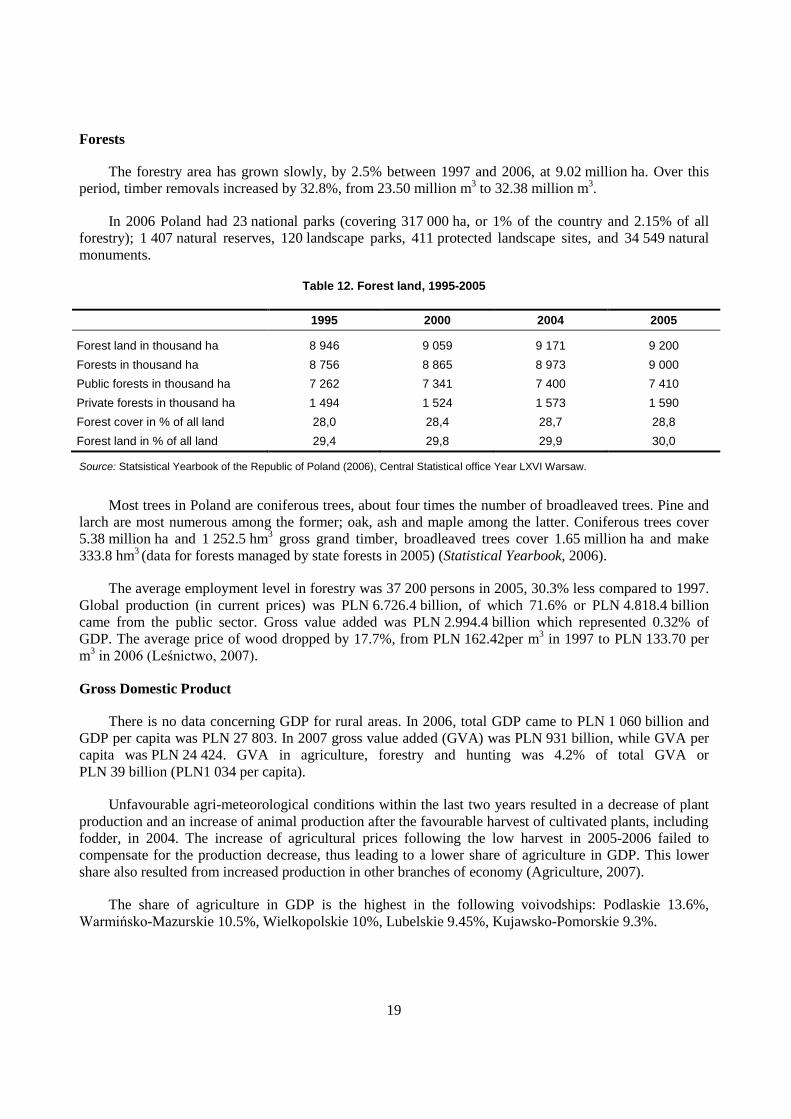
The forestry area has grown slowly, by 2.5% between 1997 and 2006, at 9.02 million ha. Over this
period, timber removals increased by 32.8%, from 23.50 million m3 to 32.38 million m
3.
In 2006 Poland had 23 national parks (covering 317 000 ha, or 1% of the country and 2.15% of all
forestry); 1 407 natural reserves, 120 landscape parks, 411 protected landscape sites, and 34 549 natural
monuments.
Table 12. Forest land, 1995-2005
1995 2000 2004 2005
Forest land in thousand ha 8 946 9 059 9 171 9 200
Forests in thousand ha 8 756 8 865 8 973 9 000
Public forests in thousand ha 7 262 7 341 7 400 7 410
Private forests in thousand ha 1 494 1 524 1 573 1 590
Forest cover in % of all land 28,0 28,4 28,7 28,8
Forest land in % of all land 29,4 29,8 29,9 30,0
Source: Statsistical Yearbook of the Republic of Poland (2006), Central Statistical office Year LXVI Warsaw.
Most trees in Poland are coniferous trees, about four times the number of broadleaved trees. Pine and
larch are most numerous among the former; oak, ash and maple among the latter. Coniferous trees cover
5.38 million ha and 1 252.5 hm3 gross grand timber, broadleaved trees cover 1.65 million ha and make
333.8 hm3 (data for forests managed by state forests in 2005) (Statistical Yearbook, 2006).
The average employment level in forestry was 37 200 persons in 2005, 30.3% less compared to 1997.
Global production (in current prices) was PLN 6.726.4 billion, of which 71.6% or PLN 4.818.4 billion
came from the public sector. Gross value added was PLN 2.994.4 billion which represented 0.32% of
GDP. The average price of wood dropped by 17.7%, from PLN 162.42per m3 in 1997 to PLN 133.70 per
m3 in 2006 (Leśnictwo, 2007).
Gross Domestic Product
There is no data concerning GDP for rural areas. In 2006, total GDP came to PLN 1 060 billion and
GDP per capita was PLN 27 803. In 2007 gross value added (GVA) was PLN 931 billion, while GVA per
capita was PLN 24 424. GVA in agriculture, forestry and hunting was 4.2% of total GVA or
PLN 39 billion (PLN1 034 per capita).
Unfavourable agri-meteorological conditions within the last two years resulted in a decrease of plant
production and an increase of animal production after the favourable harvest of cultivated plants, including
fodder, in 2004. The increase of agricultural prices following the low harvest in 2005-2006 failed to
compensate for the production decrease, thus leading to a lower share of agriculture in GDP. This lower
share also resulted from increased production in other branches of economy (Agriculture, 2007).
The share of agriculture in GDP is the highest in the following voivodships: Podlaskie 13.6%,
Warmińsko-Mazurskie 10.5%, Wielkopolskie 10%, Lubelskie 9.45%, Kujawsko-Pomorskie 9.3%.
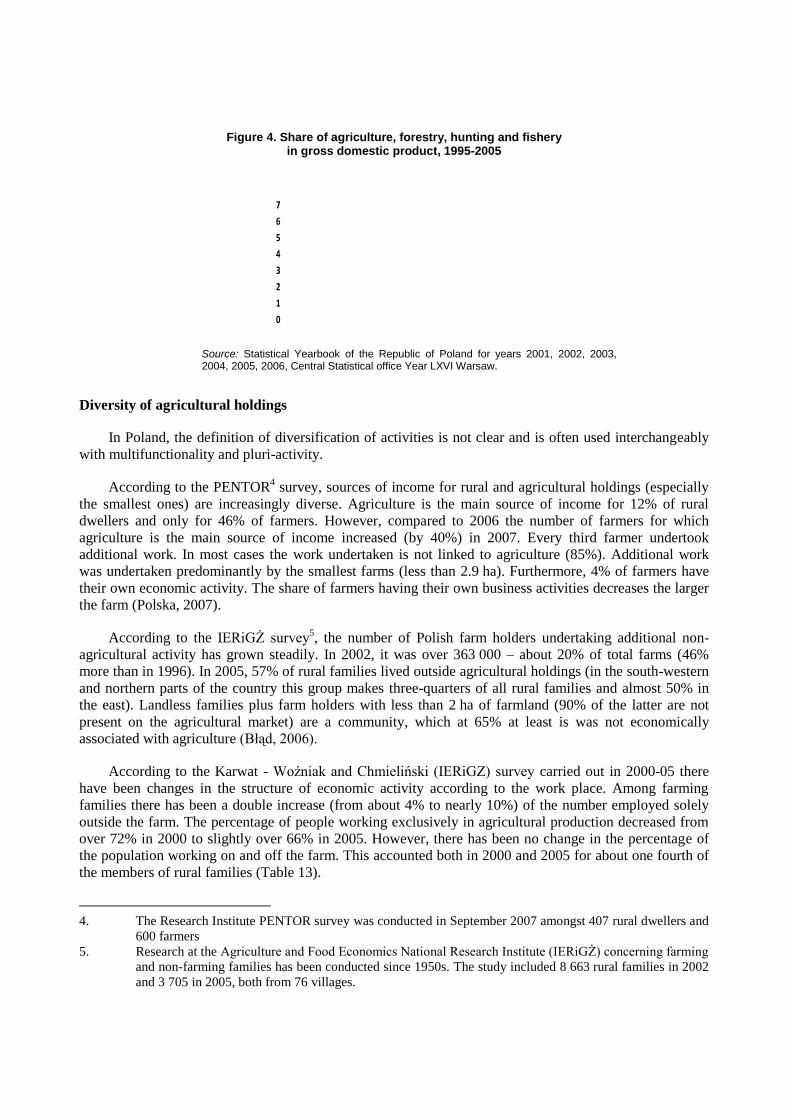
Figure 4. Share of agriculture, forestry, hunting and fishery in gross domestic product, 1995-2005
0
1
2
3
4
5
6
7
1995 2000 2001 2002 2003 2004 2005
Source: Statistical Yearbook of the Republic of Poland for years 2001, 2002, 2003, 2004, 2005, 2006, Central Statistical office Year LXVI Warsaw.
Diversity of agricultural holdings
In Poland, the definition of diversification of activities is not clear and is often used interchangeably
with multifunctionality and pluri-activity.
According to the PENTOR4 survey, sources of income for rural and agricultural holdings (especially
the smallest ones) are increasingly diverse. Agriculture is the main source of income for 12% of rural
dwellers and only for 46% of farmers. However, compared to 2006 the number of farmers for which
agriculture is the main source of income increased (by 40%) in 2007. Every third farmer undertook
additional work. In most cases the work undertaken is not linked to agriculture (85%). Additional work
was undertaken predominantly by the smallest farms (less than 2.9 ha). Furthermore, 4% of farmers have
their own economic activity. The share of farmers having their own business activities decreases the larger
the farm (Polska, 2007).
According to the IERiGŻ survey5, the number of Polish farm holders undertaking additional non-
agricultural activity has grown steadily. In 2002, it was over 363 000 – about 20% of total farms (46%
more than in 1996). In 2005, 57% of rural families lived outside agricultural holdings (in the south-western
and northern parts of the country this group makes three-quarters of all rural families and almost 50% in
the east). Landless families plus farm holders with less than 2 ha of farmland (90% of the latter are not
present on the agricultural market) are a community, which at 65% at least is was not economically
associated with agriculture (Błąd, 2006).
According to the Karwat - Woźniak and Chmieliński (IERiGZ) survey carried out in 2000-05 there
have been changes in the structure of economic activity according to the work place. Among farming
families there has been a double increase (from about 4% to nearly 10%) of the number employed solely
outside the farm. The percentage of people working exclusively in agricultural production decreased from
over 72% in 2000 to slightly over 66% in 2005. However, there has been no change in the percentage of
the population working on and off the farm. This accounted both in 2000 and 2005 for about one fourth of
the members of rural families (Table 13).
4. The Research Institute PENTOR survey was conducted in September 2007 amongst 407 rural dwellers and
600 farmers
5. Research at the Agriculture and Food Economics National Research Institute (IERiGŻ) concerning farming
and non-farming families has been conducted since 1950s. The study included 8 663 rural families in 2002
and 3 705 in 2005, both from 76 villages.
21
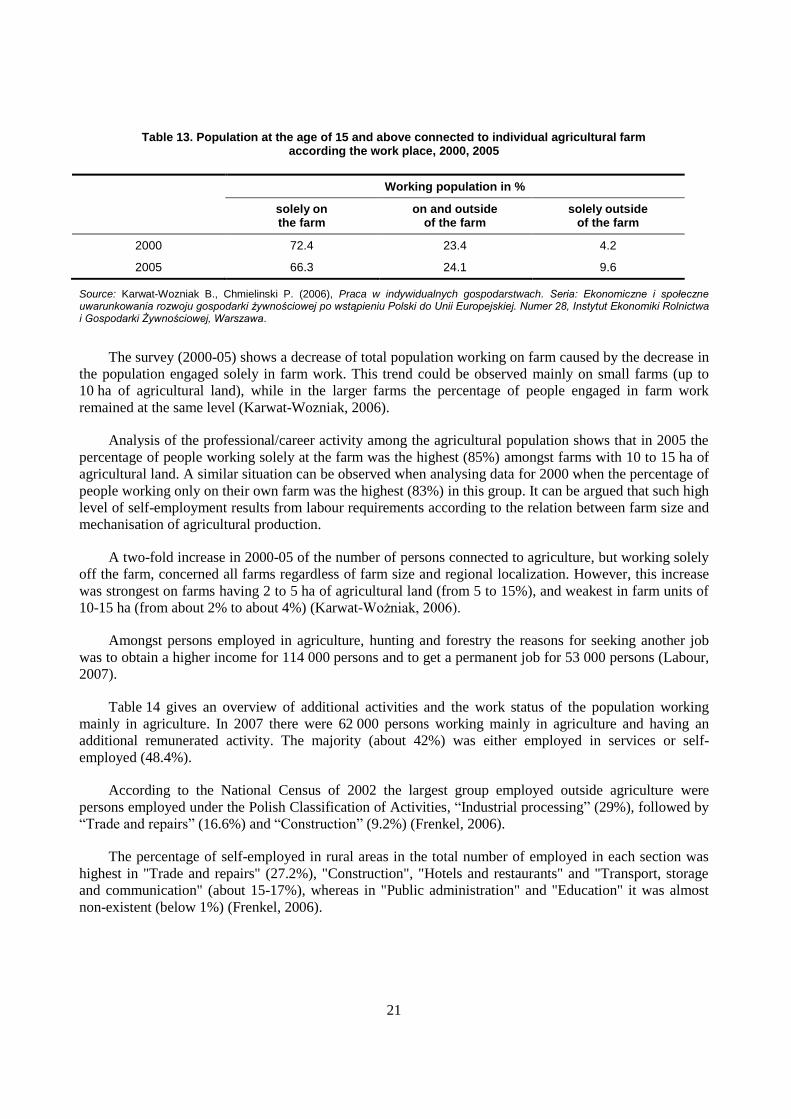
Table 13. Population at the age of 15 and above connected to individual agricultural farm according the work place, 2000, 2005
Working population in %
solely on the farm
on and outside of the farm
solely outside of the farm
2000 72.4 23.4 4.2
2005 66.3 24.1 9.6
Source: Karwat-Wozniak B., Chmielinski P. (2006), Praca w indywidualnych gospodarstwach. Seria: Ekonomiczne i społeczne uwarunkowania rozwoju gospodarki żywnościowej po wstąpieniu Polski do Unii Europejskiej. Numer 28, Instytut Ekonomiki Rolnictwa i Gospodarki Żywnościowej, Warszawa.
The survey (2000-05) shows a decrease of total population working on farm caused by the decrease in
the population engaged solely in farm work. This trend could be observed mainly on small farms (up to
10 ha of agricultural land), while in the larger farms the percentage of people engaged in farm work
remained at the same level (Karwat-Wozniak, 2006).
Analysis of the professional/career activity among the agricultural population shows that in 2005 the
percentage of people working solely at the farm was the highest (85%) amongst farms with 10 to 15 ha of
agricultural land. A similar situation can be observed when analysing data for 2000 when the percentage of
people working only on their own farm was the highest (83%) in this group. It can be argued that such high
level of self-employment results from labour requirements according to the relation between farm size and
mechanisation of agricultural production.
A two-fold increase in 2000-05 of the number of persons connected to agriculture, but working solely
off the farm, concerned all farms regardless of farm size and regional localization. However, this increase
was strongest on farms having 2 to 5 ha of agricultural land (from 5 to 15%), and weakest in farm units of
10-15 ha (from about 2% to about 4%) (Karwat-Wożniak, 2006).
Amongst persons employed in agriculture, hunting and forestry the reasons for seeking another job
was to obtain a higher income for 114 000 persons and to get a permanent job for 53 000 persons (Labour,
2007).
Table 14 gives an overview of additional activities and the work status of the population working
mainly in agriculture. In 2007 there were 62 000 persons working mainly in agriculture and having an
additional remunerated activity. The majority (about 42%) was either employed in services or self-
employed (48.4%).
According to the National Census of 2002 the largest group employed outside agriculture were
persons employed under the Polish Classification of Activities, ―Industrial processing‖ (29%), followed by
―Trade and repairs‖ (16.6%) and ―Construction‖ (9.2%) (Frenkel, 2006).
The percentage of self-employed in rural areas in the total number of employed in each section was
highest in "Trade and repairs" (27.2%), "Construction", "Hotels and restaurants" and "Transport, storage
and communication" (about 15-17%), whereas in "Public administration" and "Education" it was almost
non-existent (below 1%) (Frenkel, 2006).
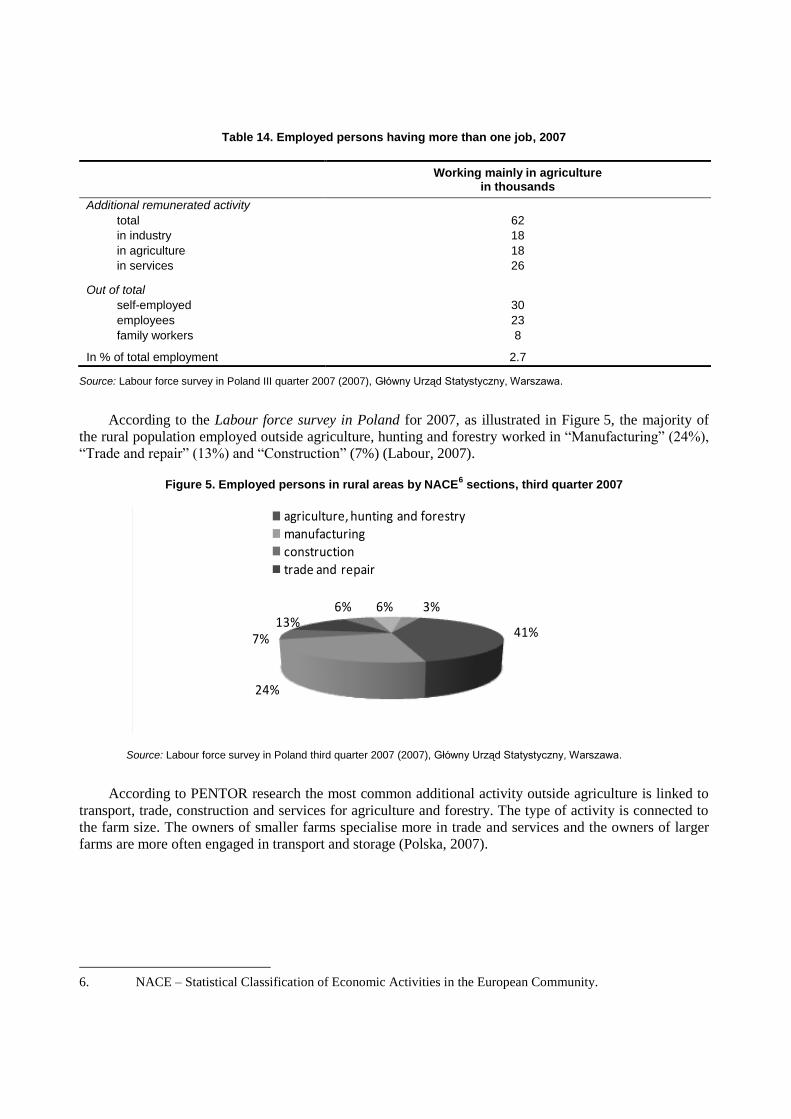
Table 14. Employed persons having more than one job, 2007
Working mainly in agriculture in thousands
Additional remunerated activity
total
in industry
in agriculture
in services
62
18
18
26
Out of total
self-employed
employees
family workers
30
23
8
In % of total employment 2.7
Source: Labour force survey in Poland III quarter 2007 (2007), Główny Urząd Statystyczny, Warszawa.
According to the Labour force survey in Poland for 2007, as illustrated in Figure 5, the majority of
the rural population employed outside agriculture, hunting and forestry worked in ―Manufacturing‖ (24%),
―Trade and repair‖ (13%) and ―Construction‖ (7%) (Labour, 2007).
Figure 5. Employed persons in rural areas by NACE6 sections, third quarter 2007
41%
24%
7%13%
6% 6% 3%
agriculture, hunting and forestrymanufacturingconstructiontrade and repair
Source: Labour force survey in Poland third quarter 2007 (2007), Główny Urząd Statystyczny, Warszawa.
According to PENTOR research the most common additional activity outside agriculture is linked to
transport, trade, construction and services for agriculture and forestry. The type of activity is connected to
the farm size. The owners of smaller farms specialise more in trade and services and the owners of larger
farms are more often engaged in transport and storage (Polska, 2007).
6. NACE – Statistical Classification of Economic Activities in the European Community.
23
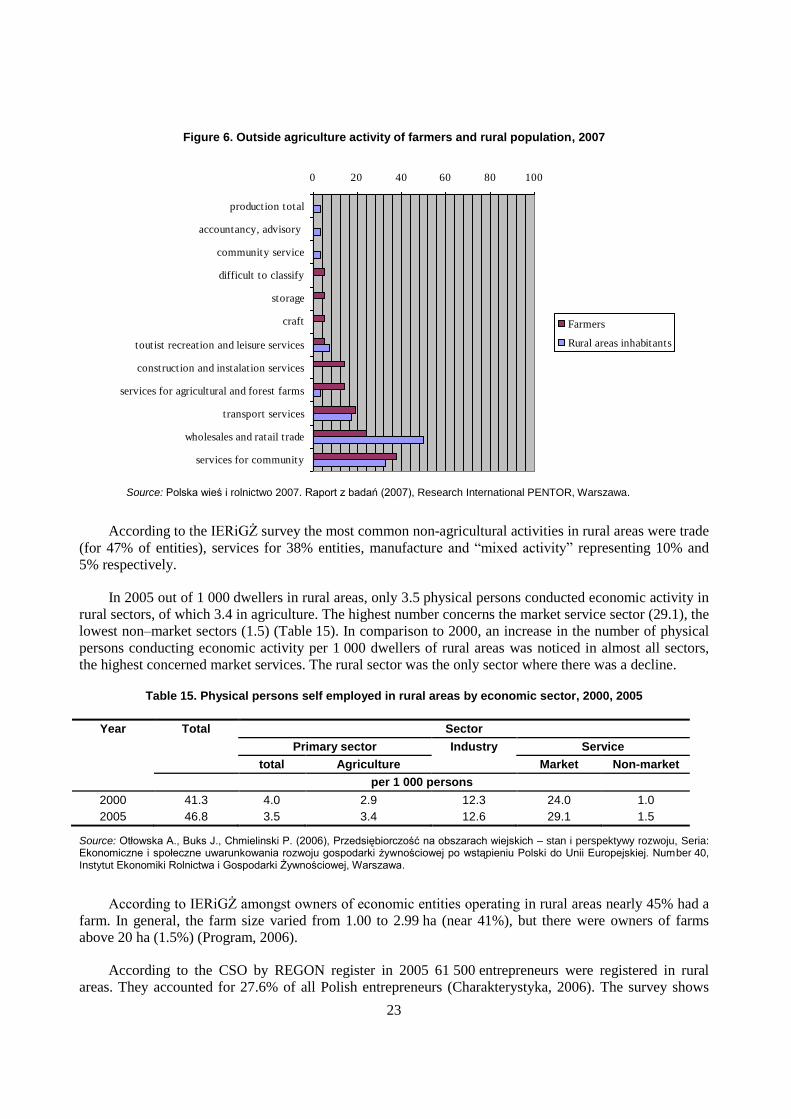
Figure 6. Outside agriculture activity of farmers and rural population, 2007
0 20 40 60 80 100
services for community
wholesales and ratail trade
transport services
services for agricultural and forest farms
construction and instalation services
toutist recreation and leisure services
craft
storage
difficult to classify
community service
accountancy, advisory
production total
Farmers
Rural areas inhabitants
Source: Polska wieś i rolnictwo 2007. Raport z badań (2007), Research International PENTOR, Warszawa.
According to the IERiGŻ survey the most common non-agricultural activities in rural areas were trade
(for 47% of entities), services for 38% entities, manufacture and ―mixed activity‖ representing 10% and
5% respectively.
In 2005 out of 1 000 dwellers in rural areas, only 3.5 physical persons conducted economic activity in
rural sectors, of which 3.4 in agriculture. The highest number concerns the market service sector (29.1), the
lowest non–market sectors (1.5) (Table 15). In comparison to 2000, an increase in the number of physical
persons conducting economic activity per 1 000 dwellers of rural areas was noticed in almost all sectors,
the highest concerned market services. The rural sector was the only sector where there was a decline.
Table 15. Physical persons self employed in rural areas by economic sector, 2000, 2005
Year Total Sector
Primary sector Industry Service
total Agriculture Market Non-market
per 1 000 persons
2000 41.3 4.0 2.9 12.3 24.0 1.0
2005 46.8 3.5 3.4 12.6 29.1 1.5
Source: Otłowska A., Buks J., Chmielinski P. (2006), Przedsiębiorczość na obszarach wiejskich – stan i perspektywy rozwoju, Seria: Ekonomiczne i społeczne uwarunkowania rozwoju gospodarki żywnościowej po wstąpieniu Polski do Unii Europejskiej. Number 40, Instytut Ekonomiki Rolnictwa i Gospodarki Żywnościowej, Warszawa.
According to IERiGŻ amongst owners of economic entities operating in rural areas nearly 45% had a
farm. In general, the farm size varied from 1.00 to 2.99 ha (near 41%), but there were owners of farms
above 20 ha (1.5%) (Program, 2006).
According to the CSO by REGON register in 2005 61 500 entrepreneurs were registered in rural
areas. They accounted for 27.6% of all Polish entrepreneurs (Charakterystyka, 2006). The survey shows
that men were more often engaged in service activities (almost 46%) and women in trade activities
(64.2%). The type of activity is strongly linked to spatial range, men operating more often their business
above local markets. In cases where women own the entity, in 83% they were acting at the local level
(village and the nearest neighbourhood) (Otłowska, 2006).
Off-farm activities were most often undertaken by farmers and household members between 36-
55 years old (68.1% of total examined population), and the average age was 44 years for both men and
women. Most women having their own business were in their fifties and men in their forties. This
difference comes from the fact that women raise their children and do the housekeeping which postpones
their entering professional life (Otłowska, 2006).
According to the IERiGŻ survey, income outside agriculture was sought mainly by farm household
members with secondary, post-secondary and basic vocational education (above 84% the population
examined). Only 6% of farm household members with primary education pursued non-agricultural
activities (Program, 2006)
The results of the SAPARD Program Measure 4 Economic diversification in rural areas reflect the
interest of farmers and their family members (scheme 4.1 providing additional income sources to farm
households), entrepreneurs (scheme 4.2 providing new jobs in rural areas) and self governments and NGOs
(scheme 4.3 public tourist infrastructure in rural areas) in selected diversification activities
(www.arimr.gov.pl).
In scheme 4.1, the greatest number (69%) of completed projects was in farm tourism, 11.7% in farm
services, 9.7% in transport services (transportation of people and goods), and 5.3% in small scale
production (crafts, handicraft). In scheme 4.2, 45.8% of projects was directed to small scale production
(crafts, handicraft), 19.9% to transport services (transport of people and goods), and 13.6% to tourists
services. In scheme 4.3, the most popular activity was construction or modernization of components of the
public tourist infrastructure – 82.4% (www.arimr.gov.pl).
In the Sectoral Operational Program (SOP) 2004–2006 for rural areas and agri-food sector,
measure 2.1: Diversification of rural areas and alternative sources of income7 accounted for 38.8% of
projects realized in priority "Sustainable development of rural areas" and 9.8% of projects for the whole
programme. This measure accounted for 28.6% and 21.9% of funds respectively (www.minrol.gov.pl).
In general, new sources of financing related to the accession of Poland to the EU allowed for the
implementation of additional investment projects and the creation of new jobs. As a result, some of the
inhabitants in rural areas, mainly working on small agricultural holdings, decided to restrict or abandon
agricultural activity. According to CSO studies, in 2007 there was an increase in the average area of
agricultural land per agricultural holding carrying out agricultural activity, as compared to 20058. In
parallel, there was also a growth in the proportion of households whose income from agricultural activity
exceeded 50% of total income – from 2.5% in the area group 0-1 ha of agricultural land and 6.5% in the
group 1-2 ha to 89.7% in the group of 50-100 ha of agricultural land (which then decreased to 86.4% for
holdings of 100 ha and more of agricultural land). It should also be stressed that, together with the increase
in the area of agricultural land in 2007, there was a decrease in the per cent of households whose income
from hired labour exceeded 50% of total income – with 41% in area group of 0-1 ha of agricultural land
and 42.9% in group of 1-2 ha of agricultural land to 1.6% in area group of 100 ha and more of agricultural
land.
7. There are 15 measures in the SPO, including 7 in priority "Sustainable development of rural areas".
8. Charakterystyka gospodarstw rolnych w 2007 r. [Characteristics of agricultural holdings in 2007], GUS,
Warszawa 2008, p. 70.
25
It is a fact that the per cent of households in which income from non-agricultural activity exceeds 50%
of total income is the highest in the group of agricultural holdings with an area of 2 ha of agricultural land
(6.4%), and the lowest in the group of holdings with an area of 15-20 ha (2.2%).9 Households whose main
source of income is agricultural activity possess the biggest agricultural holdings in terms of area.
Diversification — regional dimension
The percentage of people employed outside agriculture differs in individual parts of the country and
depends on the degree of industrial and urban development in the given area, development of the road
network and the area structure of agricultural holdings. According to the National Census 2002 the lowest
percentage of persons employed outside agriculture was in Lubelskie voivodship (63.8%) and in the rural
areas of Podlaskie (30.8%), and the highest – both nationwide and in rural areas – the Śląskie voivodship
(95.0% and 81.7%) (Frenkel, 2006).
Agriculture was a source of income for relatively more farms from north, mid-west and south west
regions. Paid work becomes the main source of income for farms from Warmińsko-mazurskie and
Podlaskie voivodships. The percentage of farmers whose main income comes from paid work compared to
those living off the income generated by their farm is 39% to 31%.
Comparing 2000 and 2005, the number of self-employed in rural farms has increased in almost all
voivodships. The highest increase was with those having an economic activity employing more than ten
people. Also, per 1 000 inhabitants, both in Poland and in rural areas, there were more people having their
own economic activity in particular groups characterized by the number of employees. According to the
REGON register in 2005, there were 61 500 of self-employed people in rural areas who were registered,
which accounted for 27.6% of all new registered in 2005. In the same year, there were 49 300 (24.8%)
unregistered physical persons (Charakterystyka, 2006).
Factors enhancing farm households diversification into non-agricultural activities
According to numerous surveys there is a strong trend towards diversification of farm households'
activities. Diversification is a complex process which is driven by a wide set of factors. In addition to
general macro-economic forces, including developments in GDP and inflation levels, labour markets,
demographic factors, migration and infrastructure, the following factors have been identified in the
literature.
1. Since Polish accession to the European Union in 2004, EU co-funded programmes have become
the most important source of funding diversification of economic activities in rural areas.10
Farmers and rural dwellers can take advantage of programmes supporting rural areas and
agriculture. There are programmes enhancing the creation of off farm incomes which is important
for small and medium-sized farms. Sectoral Operational Programme (SPO) for 2004-2006
provided the measure ―Diversification of agriculture and near-to-agriculture activity to ensure
diversity or alternative source of income‖. The Rural Development Programme operating during
the period 2007-13 offers similar support. Before 2004, pre-accession SAPARD Programmes
included Measure 4 that encouraged farm diversification. ―The Rural Activation Programme‖, a
loan from the World Bank, included funds for the set up small enterprises and the development of
human resources.
9. Ibidem, p. 136.
10. It should be noted, however, that farms below one hectare were not eligible for all types of support
measures under rural development programmes for the period 2004-06, as they were not considered farm
holdings. Therefore, they did not have access to enough capital to diversify their activities.
2. European Union membership, including adoption of acquis communautaire, participation in the
single market and technological changes have accelerated the pace of production structures,
which represented an important factor for many households to diversify their income or leave the
sector. It also offered to the Polish agri-food sector opportunities to make use of its comparative
advantages on the European single market. This led to increasing specialisation and higher farm
incomes for certain farms and regions. As a result, the value of agro-food exports has more than
doubled since 2004.
3. The Common Agricultural Policy of the European Union includes various types of market price
support measures and direct payments, which have both positive and negative effects on the
diversification of farm activities and income sources. According to several surveys, EU funds
force farmers to make decision on how to develop the farm. There are three groups of farmers.
First, farmers with the largest farms, deciding to strengthen the economic situation of their farm
operation (or/and farm size) and allow all family of working age to contribute to farm work.
Second, farmers with medium and small-sized farms who decide to remain on the farm, to take
advantage of rural life and EU payments, but whose main source of income comes from off farm
sources. Third, farmers with the smallest farms decide to cease farming and work solely outside
agriculture.
4. In addition to programmes that directly influence farm diversification, there are also direct and
indirect programmes that channel funds to farmers and give them additional possibilities.
Examples are the LEADER Programme, traditional products projects, and the incentives to
increase the attractiveness of rural areas for tourists and other activities.
5. According to the IERiGŻ survey, the success of setting up one’s own business was strongly
related to qualifications. The continued increase of the rural population’s level of education has
contributed to the growing rural entrepreneurship. Moreover, the EU’s rural development
programmes contain measures that increase farmers' knowledge, know-how and skills. One of the
topics of vocational trainings for rural dwellers and farmers was how to set up one’s own
business and attract clients. This kind of educational programmes give farmers not only
knowledge but also self-confidence, motivation and new ideas to start up a business. In
SAPARD’s pre-accession Programme, 20.6% of beneficiaries of measure 6 ―Vocational training‖
were trained in enterprise development in rural areas (www.arimr.gov.pl). Fifty-five thousand
rural dwellers participated in non-school forms of education (within the last four weeks from the
survey) (Labour, 2007). In addition, there is ―generational change‖ and young people who decide
to stay in rural areas are more innovative, educated, look to foreign countries for examples, and
are not risk-averse.
6. Farmers' accessibility to EU funds, especially measures supporting structural changes on farms,
resulted in an increase of new farm technologies. This, in turn, resulted in an on-farm workforce
surplus and forced rural families to look for other sources of income. It should be highlighted that
the decrease of self-employment in peasant agriculture has been observed throughout the 1990s.
However, the years between 2000 and 2005 have witnessed the strongest trend of that
phenomenon. The rationalization of employment is mainly due to the increasing concentration of
land, the increase of significantly big farms, and the improvement of technical equipment which
enables mechanization (Karwat-Wożniak, 2006).
7. EU funds (direct and indirect) allocated to rural areas increased the income of agricultural
families which in turn created (mainly) local demand for new services and goods and encouraged
local supply. According to IERiGŻ almost 76% of those self-employed outside agriculture lived
in the same village where their company was situated, 11% of company owners lived in another
27
village, and the remaining 13% are inhabitants of towns and cities, who have chosen a village to
locate their company. The companies located in villages serve mainly local needs and compete
amongst each other (Otłowska, 2006).
8. Polish farmers are a traditional group with strong fears about changes and about the future. The
―good neighbour example‖ is very important. The increasing diversity of farms has given rise to
multiplier effects.
9. International migrations, mainly to the EU countries, created a new phenomenon, namely
investing foreign savings in off farm or outside agriculture activities in home village or on local
market. According to IERiGŻ survey the above mentioned trend was observed in 10% of
examined villages (Otłowska, 2006). According to the PENTOR survey during last 12 months
6% of farmers and 9% of rural dwellers went abroad for work (Polska, 2007).
10. Increase of local government activities: a) encouraging entrepreneurs and rural inhabitants to
invest (exemption from taxes, offering possibilities of preferential credits); b) Direct engagement
of government in economic activities; c) area promotion and information of possible activities,
investments; d) advisory, training and retraining courses, e) promotion of research and expertise
that support economic activities (Wiatrak, 2004). Moreover, between some communes there is
competition on gaining funds from the EU and attracting capital.
11. The EU accession required the development of advisory centres and changes in the structure of
advising from technology to diversification and entrepreneurship.
Tourism
Farm tourism and tourism in rural areas are becoming an increasingly important form of activity and
the source of additional income for farmers and the remaining rural inhabitants (Błąd, 2006).
The dynamics of changes in number of individual accommodation resources in farm tourism bases
and guest rooms for 2005-07 (recorded by community offices) were disclosed as a result of research
commissioned by the Tourist Department at the Ministry of Economy:
farm tourism accommodation and guest rooms were present in 60% of communities in 2005 and
69% in 2007 (they increased from 1 486 to 1 704),
the number of gminas with farm tourism accommodation increased by about 11% for individual
accommodation and by 1% for guest rooms (Table 16).
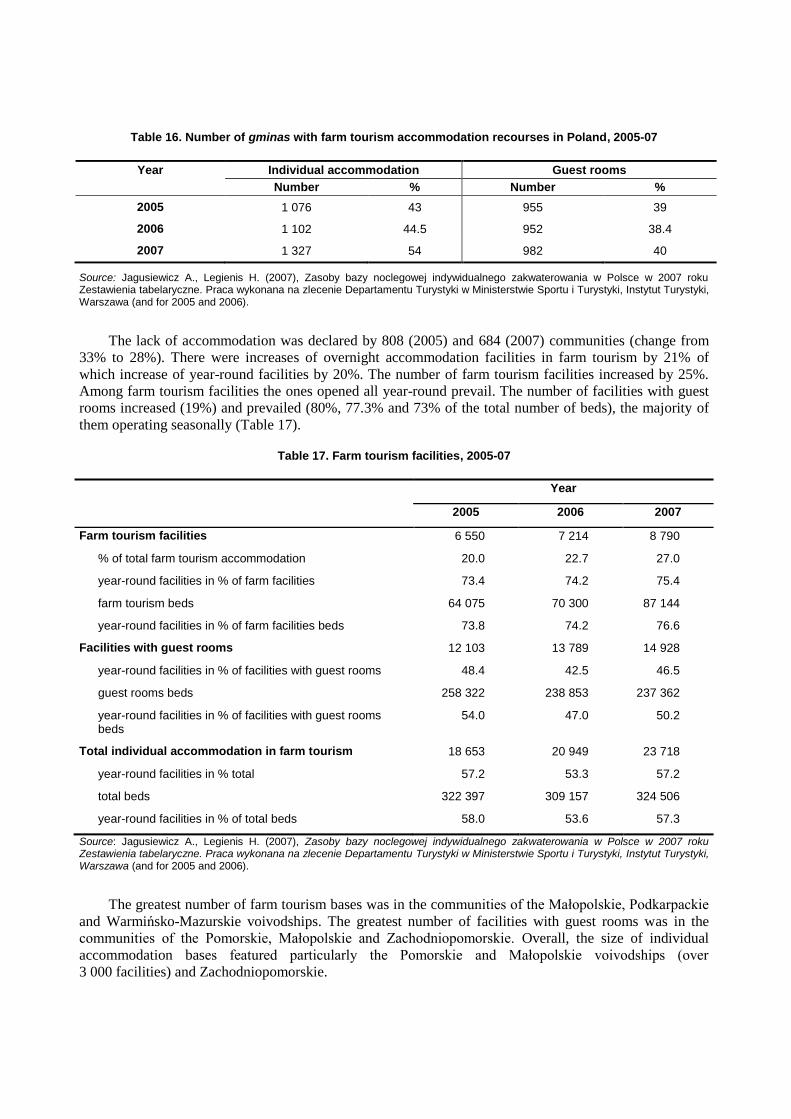
Table 16. Number of gminas with farm tourism accommodation recourses in Poland, 2005-07
Year Individual accommodation Guest rooms
Number % Number %
2005 1 076 43 955 39
2006 1 102 44.5 952 38.4
2007 1 327 54 982 40
Source: Jagusiewicz A., Legienis H. (2007), Zasoby bazy noclegowej indywidualnego zakwaterowania w Polsce w 2007 roku Zestawienia tabelaryczne. Praca wykonana na zlecenie Departamentu Turystyki w Ministerstwie Sportu i Turystyki, Instytut Turystyki, Warszawa (and for 2005 and 2006).
The lack of accommodation was declared by 808 (2005) and 684 (2007) communities (change from
33% to 28%). There were increases of overnight accommodation facilities in farm tourism by 21% of
which increase of year-round facilities by 20%. The number of farm tourism facilities increased by 25%.
Among farm tourism facilities the ones opened all year-round prevail. The number of facilities with guest
rooms increased (19%) and prevailed (80%, 77.3% and 73% of the total number of beds), the majority of
them operating seasonally (Table 17).
Table 17. Farm tourism facilities, 2005-07
Year
2005 2006 2007
Farm tourism facilities 6 550 7 214 8 790
% of total farm tourism accommodation 20.0 22.7 27.0
year-round facilities in % of farm facilities 73.4 74.2 75.4
farm tourism beds 64 075 70 300 87 144
year-round facilities in % of farm facilities beds 73.8 74.2 76.6
Facilities with guest rooms 12 103 13 789 14 928
year-round facilities in % of facilities with guest rooms 48.4 42.5 46.5
guest rooms beds 258 322 238 853 237 362
year-round facilities in % of facilities with guest rooms beds
54.0 47.0 50.2
Total individual accommodation in farm tourism 18 653 20 949 23 718
year-round facilities in % total 57.2 53.3 57.2
total beds 322 397 309 157 324 506
year-round facilities in % of total beds 58.0 53.6 57.3
Source: Jagusiewicz A., Legienis H. (2007), Zasoby bazy noclegowej indywidualnego zakwaterowania w Polsce w 2007 roku Zestawienia tabelaryczne. Praca wykonana na zlecenie Departamentu Turystyki w Ministerstwie Sportu i Turystyki, Instytut Turystyki, Warszawa (and for 2005 and 2006).
The greatest number of farm tourism bases was in the communities of the Małopolskie, Podkarpackie
and Warmińsko-Mazurskie voivodships. The greatest number of facilities with guest rooms was in the
communities of the Pomorskie, Małopolskie and Zachodniopomorskie. Overall, the size of individual
accommodation bases featured particularly the Pomorskie and Małopolskie voivodships (over
3 000 facilities) and Zachodniopomorskie.
29
There are separate data by CSO for collective tourist accommodation establishment in rural areas that
do not include rooms for rent and agro-tourism lodgings. It includes hotels, motels, boarding houses,
excursion hostels, shelters, youth hostels, camping sites, tent camp sites, holiday centres, training –
recreational centres, creative art centres, public tourist cottages, weekend and holiday accommodation
establishments, and other facilities.
As of 31 July 2005, there were 2 900 collective tourist accommodation establishments registered in
rural areas, with 232 700 beds, which accounted for 42.6% of total facilities of that kind in Poland
(Charakterystyka, 2006).
From 2000 to 2005, the number of collective tourist accommodation establishments in rural areas
decreased by 26.5%. Simultaneously, in almost all voivodships the tourist accommodation base decreased,
except in Łódzkie and Mazowieckie voivodship, where there was an increase in 2005 by 3.6% and 0.8%
respectively. Together with the decrease in the number of collective tourist accommodation establishments,
the number of beds decreased by almost 24%. This trend was evident in all voivodships where the decrease
in the number of beds increased between 5.3% in Lubuskie voivodship to 50.1% in Śląskie
(Charakterystyka, 2006).
In 2005, 3.7 million tourists were using beds in collective tourist accommodation establishments in
rural areas, of which 9.6% were foreign tourists. In total in 2005 the establishments in rural areas were
used for 13.7 million nights, which accounted for 28.2% of total nights spent by foreign tourists in Poland,
1.1 million nights (10.6% for total Poland).
Compared to 2000, the number of persons using tourist accommodation beds was higher by 3.0% in
2005, while the number of nights booked in collective tourist accommodation in rural areas decreased by
15.1%. However, there was a considerable increase in the nights/beds in the tourist accommodation
required by foreign tourists (Charakterystyka, 2006).
In Poland, there are 121 farm tourism associations operating, of which 45 (37.9%) are registered in
the Polish Federation of Country Tourism as "Hospitable Farms".
New requirements towards non-agricultural activity and saturation with standard types of activity
result in a growing need for innovation, for original and attractive activities. In the case of tourism it is
therefore insufficient to provide rooms and board. The entrepreneur must find something that will
distinguish his offer (e.g. sale of his own products, possibility of hiring horses, sale of craft pieces, etc.).
Tourist activities undertaken by individuals launch the multiplier effect affecting the local economic
conditions (through growing demand for products and other services) (Błąd, 2006).
Factors explaining the development of farm tourism in Poland
The reason for enhancing rural tourism is strongly connected to the increase of diversification. It is
because farm tourism is one of the activities diversifying farm sources of income. Since 1990, interest in
rural tourism has been growing for several reasons (Wiatrak, 2005):
1. Giving up mass tourism for alternative types. In the early 1950s, almost all Polish families had
relatives in rural areas. Rural areas and ―agricultural relatives‖ were valued because they were a source
of foodstuffs (while there were state food control), but were underestimated by society in relation with
other values. Rural areas were not associated with leisure and free time, a place for holidays. Since
World War II there has been a continual decrease in the number of farmers. This trend results in less
accessibility to rural areas through family links. Therefore, rural areas are becoming increasingly
popular and fashionable amongst Poles wanting to spend holidays with nature and amongst families
that cannot afford other types of leisure.
2. Access to the EU preaccession and post accession funds (see: chapter Factors enhancing farm
households diversification into non-agricultural activities point 1).
3. Local institutions are more aware of their functions in attracting tourists and its influence on job
creation. Local governments have a possibility to take a part in programmes revitalizing rural areas and
small towns. Funds are directed to the promotion of communities, infrastructure, and increasing of
tourist attractions (Wiatrak, 2004).
4. Farm tourism is one of the easiest non-agricultural activity, which does not require high investment
costs, prescribed formalities and skills to start up. It is created on the basis of unused
resources/potential of the farm.
5. The living standard of Polish society increases every year thereby resulting in more savings for
leisure and tourism. Farm tourism is relatively cheap and affordable to a large share of society as
compared to other forms of tourism.
6. EU funds allowed rural settlements, environment, landscape, hygiene in rural farms to be cared for
so as increase their attractiveness. Moreover, farmers have higher accessibility to media, internet and
they travel more themselves, which influences the quality of farm tourism facilities. Rural areas are not
associated with the poor, alcoholism, ugliness but rather with fresh air and nature.
7. For several years before EU accession, there had been preferential loans for farm tourism which
were regarded as an effective state tool for the development of rural tourism.
Multipliers effects of agriculture and other rural activities
Quantitative research studies on the multiplier effects of agriculture and rural areas do not exist in
Poland. However, descriptive/qualitative analysis is possible.
In Poland until beginning of the 20th century agriculture was considered as a basis of economic
development at the national and regional levels. Farmers were seen as the poorest part of society, the least
educated, traditional and backward. Since the preparations of Poland to EU accession there has been
increasing publicity around agriculture and rural areas. Funds for pre-accession SAPARD programme and
Structural Funds revealed the importance of this sector and of rural areas for the EU.
The pre-accession and post-accession activities towards rural areas resulted in changes at several
levels:
Co-funding of investment in agriculture increased demand for goods (machinery, constructions
materials, devices etc.) and services (dealers of machinery, advisory, constructing, transport);
supply in rural areas was assured by new small enterprises comprised of farmers and rural
dwellers. It influences not only rural areas but the entire economy.
Due to EU programmes for farm investment, a consolidation of land is observed. The owners of
large farms are interested in enlarging their farms in order to optimise farm production potential.
This improves the farms structure, necessary in Poland, where 55.6% (for 2006) of farms have
between 1.01and 10 ha. The share of the largest farms of more than 30 ha increased throughout the
period 2000-2006 by 0.7%, and in 2006 made up for 2.2% of all farms. Farmers using EU funds
have an obligation to fulfil the programmes requirements concerning, for example, environment,
animal welfare and scenery.
31
Agriculture and rural areas have become more attractive for the younger generation. Beyond
farmers’ heirs staying on farms there is migration from urban areas. Since World War II up until
year 2000, rural areas were a place of negative net migration. The year 2000 was the first year of
positive net migration from urban to rural areas - about 3 000 persons in 2006. It is a very positive
trend in rural areas. First, because young farmers are less afraid of changes. Second, they are more
motivated and innovative and, third, they are better educated, travel which offers them different
perspectives, and use foreign and urban samples more easily. Fourth, they have better contact with
the urban culture and lifestyle that enables better co-operation with town dwellers and creates
services for them.
The way of thinking of local government representatives is changing. They are more assessed by
local society - more confident and conscious of its needs and expectations from authorities. Local
authorities have broader range of instruments influencing the changes in their gminas like:
infrastructure and environmental investments, soft ones like expertise, trainings, researches,
attracting investments/ new jobs. Moreover, the EU programmes transparency limits the briberies
and corruption amongst local authorities.
To sum up the EU funds have the most important influence on agriculture and rural areas at following
levels:
1. Economic – direct and indirect funds for farmers and rural dwellers farm investments
additional farm activities new job creation
2. Environmental – the EU requirements force farmers and other users of the EU programmes for
environment protecting actions fresh air, nice landscape, clean waters attracting
tourists, new rural inhabitants, entrepreneurs
3. Social – better publicity of rural areas and farming younger farmers and rural dwellers,
less briberies and corruption amongst authorities more consciousness of influence of a good
governance for local societies, change of farmers attitude: more self-confidence and feelings
of being an important part of society
REFERENCES
Agriculture And Food Economy in Poland (2007), Ministry Of Agriculture And Rural Development,
Warsaw
Błąd M. (2006) Economic diversification in rural areas [in:] Rural Poland. Report on the condition of
rural areas, FDPA, Warsaw
Charakterystyka obszarów wiejskich w 2005 r. (2006), Główny Urząd Statystyczny, Urząd Statystyczny w
Olsztynie, Olsztyn
Frenkel I. (2006 ), Demographic trends in rural area [in:] Rural Poland. Report on the condition of rural
areas (2006), FDPA, Warsaw
Jagusiewicz A., Legienis H. (2007), Zasoby bazy noclegowej indywidualnego zakwaterowania w Polsce w
2007 roku Zestawienia tabelaryczne. Praca wykonana na zlecenie Departamentu Turystyki w
Ministerstwie Sportu i Turystyki, Instytut Turystyki, Warszawa
Jagusiewicz A., Legienis H. (2006), Zasoby bazy noclegowej indywidualnego zakwaterowania w Polsce w
2006 roku Zestawienia tabelaryczne. Praca wykonana na zlecenie Departamentu Turystyki w
Ministerstwie Sportu i Turystyki, Instytut Turystyki, Warszawa
Jagusiewicz A., Legienis H. (2005), Zasoby bazy noclegowej indywidualnego zakwaterowania w Polsce w
2005 roku będące w ewidencji gmin. Praca wykonana na zlecenie Departamentu Turystyki w
Ministerstwie Sportu i Turystyki, Instytut Turystyki, Warszawa
Karwat-Wozniak B., Chmielinski P. (2006), Praca w indywidualnych gospodarstwach. Seria:
Ekonomiczne i społeczne uwarunkowania rozwoju gospodarki żywnościowej po wstąpieniu Polski
do Unii Europejskiej. Numer 28, Instytut Ekonomiki Rolnictwa i Gospodarki Żywnościowej,
Warszawa
Labour force survey in Poland III quarter 2007 (2007), Główny Urząd Statystyczny, Warszawa
Leśnictwo (Forestry) (2007), Główny Urząd Statystyczny, Warszawa
Mały Rocznik Statystyczny Polski 2007(Concise Yearbook of Poland 2007) (2007), Główny Urząd
Statystyczny, Warszawa
Ministerstwo Rolnictwa i Rozwoju Wsi (2006), Program Rozwoju Obszarów Wiejskich 2007-2013,
Otłowska A., Buks J., Chmielinski P. (2006), Przedsiębiorczość na obszarach wiejskich – stan i
perspektywy rozwoju, Seria: Ekonomiczne i społeczne uwarunkowania rozwoju gospodarki
żywnościowej po wstąpieniu Polski do Unii Europejskiej. Number 40, Instytut Ekonomiki Rolnictwa
i Gospodarki Żywnościowej, Warszawa
33
Polska wieś i rolnictwo 2007. Raport z badań (2007), Research International PENTOR, Warszawa
Program wieloletni. Synteza badań 2006 roku. (2006), Seria: Ekonomiczne i społeczne uwarunkowania
rozwoju gospodarki żywnościowej po wstąpieniu Polski do Unii Europejskiej. Numer 56, Instytut
Ekonomiki Rolnictwa i Gospodarki Żywnościowej, Warszawa
Rocznik Statystyczny Rolnictwa i Obszarów Wiejskich (2006), Główny Urząd Statystyczny, Warszawa
Rosner A., Selekcja gmin na terenie których mogą występować potencjalni beneficjenci Programu
Integracji Społecznej realizowanego w ramach Poakcesyjnego Programu Wsparcia Obszarów
Wiejskich (PPWOW), maszynopis, typescript, www.mpips.gov.pl, February 2008
Rural Poland after the integration with the European Union (2004), FDPA, Warszawa
Statistical Yearbook of the Republic of Poland (2006), Central Statistical office Year LXVI Warsaw
Statistical Yearbook of the Republic of Poland (2007), Central Statistical office Year LXVI Warsaw
Użytkowanie gruntów, powierzchnia zasiewów i pogłowie zwierząt gospodarskich w roku 2007 (2007),
(Land use, sawn area and livestock units 2007), Główny Urząd Statystyczny, Warszawa
Wiatrak A.P (2004), Zagadnienia kształtowania produktu turystycznego obszarów wiejskich [w:]
"Turystyka w rozwoju lokalnym". Wyd. SGGW, Warszawa
Wiatrak A.P (2005), Turystyka wiejska w strategiach rozwoju regionalnego i lokalnego. [w:]
"Turystyka wiejska a rozwój i współpraca regionów". Prace Naukowo-Dydaktyczne Państwowej
Wyższej Szkoły Zawodowej w Krośnie, Krosno
Zegar J. (2006), Źródła utrzymania rodzin związanych z rolnictwem, IERiGŻ, Warszawa
www.intur.com.pl/baza.htm
www.arimr.gov.pl
www.minrol.gov.pl
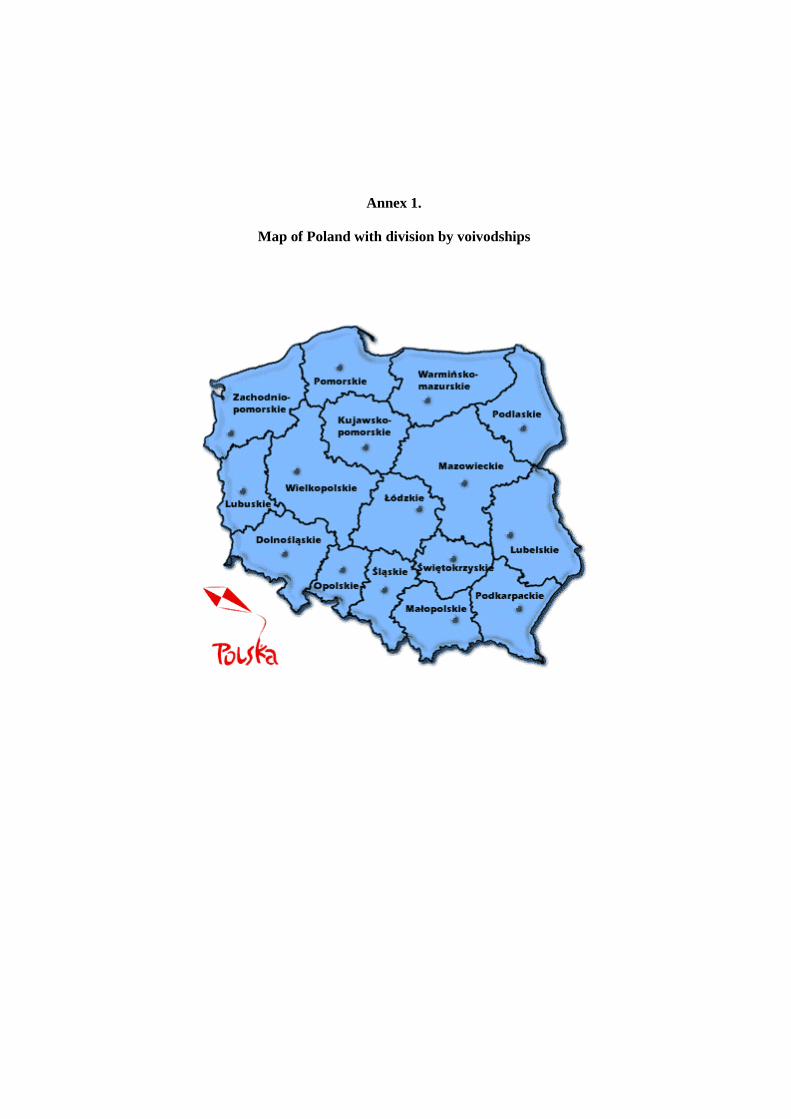
Annex 1.
Map of Poland with division by voivodships
35
Annex 2.
The specification of territorial districts division
(1 January 2008)
Voivodship
Territorial districts division Towns Additional units
poviats Town on the
rights of poviat
gminas /communities
total including urban -
rural gminas districts others
total urban rural urban-rural
POLSKA 314 65 2478 306 1586 586 892 586 18 19
Dolnośląskie 26 3 169 36 78 55 91 55 - 5
Kujawsko-pomorskie 19 4 144 17 92 35 52 35 - -
Lubelskie 20 4 213 20 172 21 41 21 - -
Lubuskie 12 2 83 9 41 33 42 33 - -
Łódzkie 21 3 177 18 134 25 43 25 - 5
Małopolskie 19 3 182 14 125 43 57 43 - 4
Mazowieckie 37 5 314 35 229 50 85 50 18 -
Opolskie 11 1 71 3 36 32 35 32 - -
Podkarpackie 21 4 159 16 113 30 46 30 - -
Podlaskie 14 3 118 13 82 23 36 23 - -
Pomorskie 16 4 123 25 81 17 42 17 - -
Śląskie 17 19 167 49 96 22 71 22 - -
Świętokrzyskie 13 1 102 5 71 26 31 26 - -
Warmińsko-mazurskie 19 2 116 16 67 33 49 33 - -
Wielkopolskie 31 4 226 19 117 90 109 90 - 5
Zachodniopomorskie 18 3 114 11 52 51 62 51 - -
Source: www.stat.gov.pl
Annex 3.
TERYT Register
This annex summarises the characteristics of the National Official Register of Territorial Division of
the Country (TERYT).11
TERYT register identifiers:
are a binding territorial identification standard for agencies running official registers and
information systems of public administration,
are used in other records, registers and systems regarding territorial units and enable integration
of data gathered in these systems,
can be applied on full or partial range, depending on needs of a given register or system,
allow generalisation and presentation of social and economical phenomena in cross-sections
with a different level of detail, i.e. voivodships, powiats, gminas, city quarters and
representations in urban gminas, statistical regions and census enumeration areas, geodetic
units used in land and building records, localities and streets, and also in division for towns
and villages.
The geographic and cartography documentation (maps and situation sketches) is used for running of
the territorial division register. It includes:
course of unit borders:
o of administrative division — of voivodships, powiats, gminas, towns, quarters,
representations,
o of statistical division — statistical regions and census enumeration areas,
o of division used in evidence of land and buildings - geodetic units;
names of localities and streets;
buildings and their ordinal numbers.
11. Functions on ground of The Law of June 29th, 1995 on official statistics (Journal of Laws No 88, position
439 with amendments) and the Regulation of the Council of Ministers of December 15th
, 1998 on detailed principles
of running, using and making available the territorial register and related to it obligations of the state administration
agencies and units of local authorities (Journal of Laws from year 1998 No 157, position 1031 with
amendments).[www.stat.gov.pl]
37
Systems of TERYT register
1. System of identifiers and names of administrative division units TERC99
The system contains identifiers and names of units in the basic three-level territorial division of the
country and is built on hierarchical numeration:
o voivodships,
o powiats,
o gminas.
The system distinguishes with separate identifiers:
o cities with powiat status,
o urban, rural and urban-rural gminas,
o towns and rural areas in urban-rural gminas,
o quarters and representations in urban gminas.
2. System of statistical regions and census enumeration areas BREC99
The system contains identifiers of a division that was created for the purpose of population and
housing censuses and conduct of sample surveys.
o census enumeration area is a spatial unit distinguished for the purpose of population and
housing censuses and other statistical surveys on base of the number of dwellings and
population
o statistical region is a spatial unit of statistical data aggregation composed of few, not more
than nine census enumeration areas.
3. System for identification of street addresses, real estate, buildings and dwellings NOBC99
Source: www.stat.gov.pl Central Statistic Office, March 2008.