Transfers, Diversification and Household Risk Strategies - American
1
TRADE AND AGRICULTURE DIRECTORATE
THE ROLE OF AGRICULTURE AND
FARM HOUSEHOLD DIVERSIFICATION
IN THE RURAL ECONOMY OF
MEXICO

2
Foreword
This report reviews information on the role of agriculture and farm household diversification in the
rural economy of Mexico. It was prepared by Dalila Cervantes-Godoy of the OECD Secretariat.
It is one of 13 country reviews prepared under Output area 3.2.1: Agricultural policy reform
(Item 3.2) of the programme of work and budget of the Committee for Agriculture for 2007-08.
Based on material compiled from the available literature, these country reviews address all or most of
the topics listed below:
Definitions and underlying concepts of “rural” as they exist at the national level.
The availability of data pertaining to the share of agriculture and the agro-food sector in the
economies of OECD countries at the national level and in rural areas and trends therein.
The availability of data relating to the income situation of farm households and in particular the
availability of information related to non-farming activities.
The extent to which non-farming income-earning activities of farm households are farm based
(i.e using farm resources as in the case of farm tourism) or rural based (located in rural areas).
The extent to which the industries upstream and downstream from primary agriculture are located
in rural areas.
The strength of multiplier effects between farm/farm based and up/downstream industries and
rural economies.
The information in these country reviews was used as background to the report "The role of
agriculture and farm household diversification in the rural economy: evidence and initial policy
implications" [TAD/CA/APM/WP(2009)1/FINAL], which was declassified by the Working Party on
Agricultural Policies and Markets in February 2009.
3
TABLE OF CONTENTS
Definition of Mexican rural areas .................................................................................................................... 4
Share of rural areas in national economy ........................................................................................................ 4
Role of agriculture in rural areas ..................................................................................................................... 9
Role of processed food industries in rural areas ............................................................................................ 15
Diversification of activities in rural and farm households............................................................................. 16
Rural tourism ................................................................................................................................................. 20
Multiplier effects of agriculture and other rural activities. ............................................................................ 21
Bibliography .................................................................................................................................................. 22
Annex ............................................................................................................................................................ 23
4
THE ROLE OF AGRICULTURE AND FARM HOUSEHOLD DIVERSIFICATION
IN THE RURAL ECONOMY OF MEXICO
Rural areas in Mexico are highly linked to agricultural activities, although in the Past two decades
economic diversification has played an increasingly important role. The importance of rural areas is
considerable: it accounts for more than 90% of the national territory, comprises 23.5% of the population
which represents 24.3 million of people, and 21% of the national employment. However, rural areas are
most often associated with poverty and marginalisation. Approximately 57% of rural population live in
conditions of poverty and rural areas (localities with less than 2 500 inhabitants) contribute to only 2% of
the national GDP, which even when rural extended areas (localities with 2 501 and 15 000) are included
increases the share to only 10%. It cannot be generalised, however, that rural areas are poor: there exists in
fact a duality which is reflected in the agriculture sector, where a part of rural economy is well developed
and strongly linked to the market.
The source for the information presented in this document is the National Institute of Statistics,
Geography and Informatics (INEGI). It is important to recognise that statistical data at the rural areas level
related to the agricultural sector is occasionally limited, and therefore some of the information presented
here had to be extrapolated.
Definition of Mexican rural areas
The National Institute of Statistics, Geography and Informatics (INEGI) takes a demographic
approach to define “rural” in Mexico. As such, rural areas are those human settlements where the
population is less than 2 500 inhabitants. This report will consider INEGI’s definition of rural areas.
Share of rural areas in national economy
Population
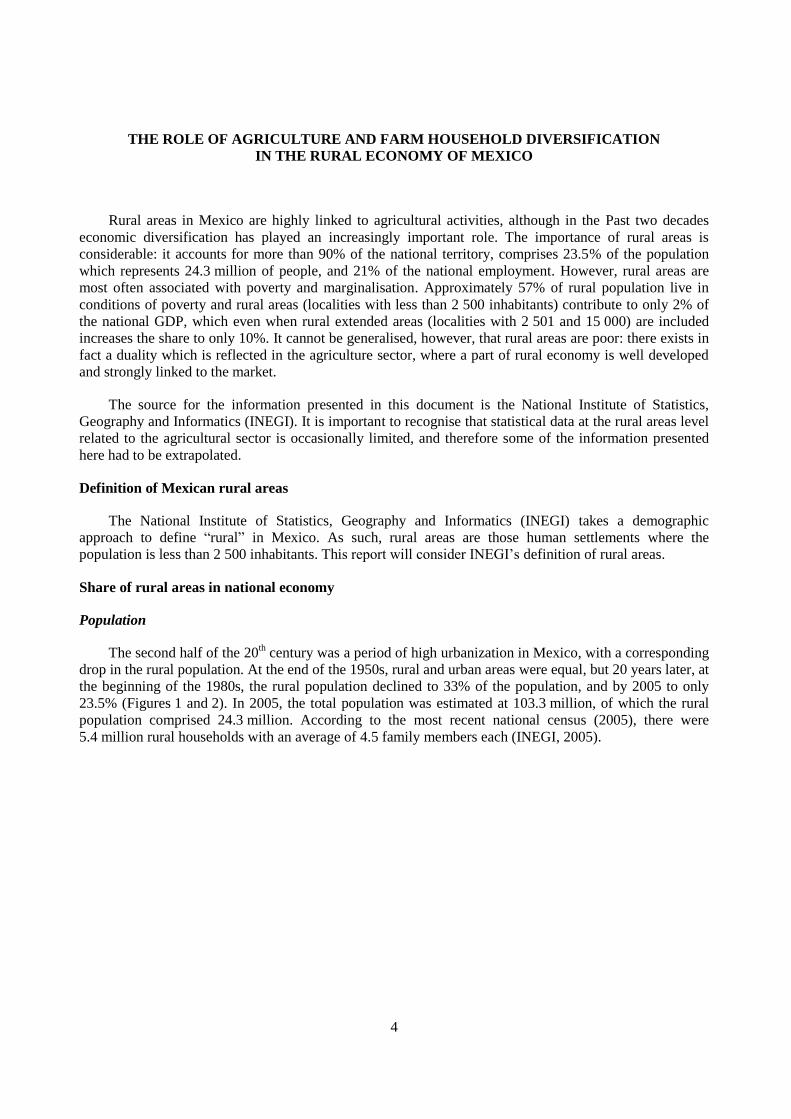
The second half of the 20th century was a period of high urbanization in Mexico, with a corresponding
drop in the rural population. At the end of the 1950s, rural and urban areas were equal, but 20 years later, at
the beginning of the 1980s, the rural population declined to 33% of the population, and by 2005 to only
23.5% (Figures 1 and 2). In 2005, the total population was estimated at 103.3 million, of which the rural
population comprised 24.3 million. According to the most recent national census (2005), there were
5.4 million rural households with an average of 4.5 family members each (INEGI, 2005).
5
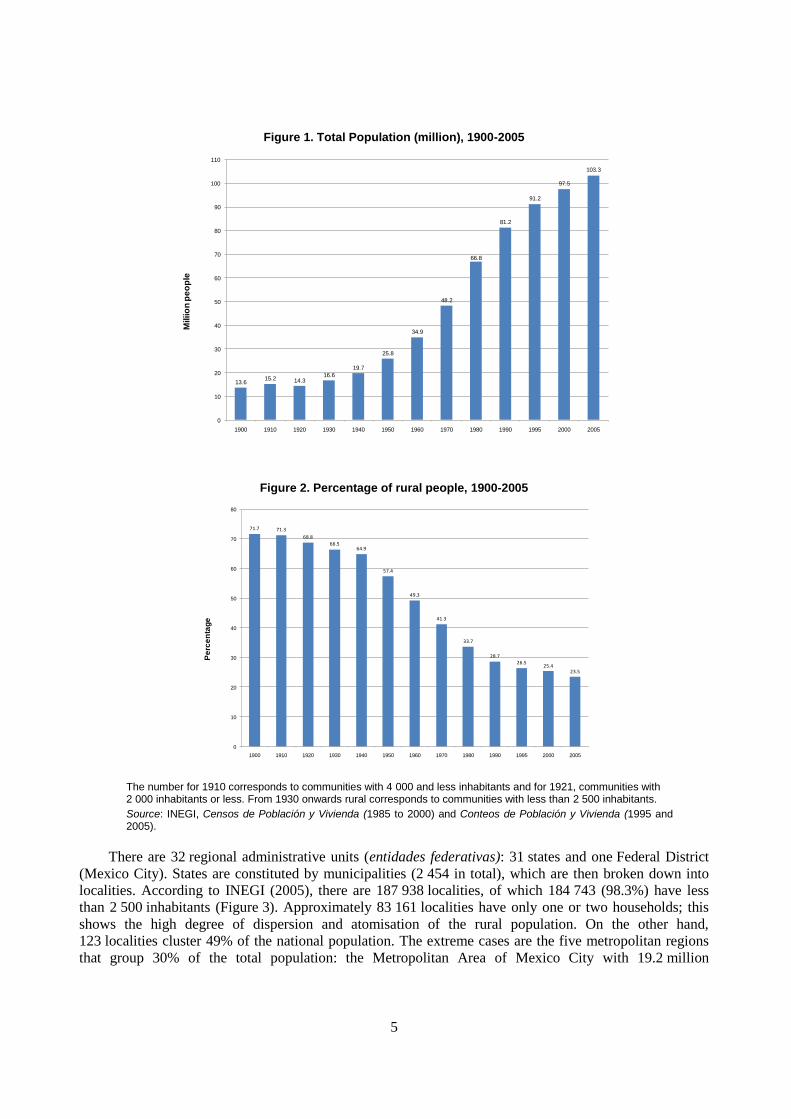
Figure 1. Total Population (million), 1900-2005
13.615.2 14.3
16.6
19.7
25.8
34.9
48.2
66.8
81.2
91.2
97.5
103.3
0
10
20
30
40
50
60
70
80
90
100
110
1900 1910 1920 1930 1940 1950 1960 1970 1980 1990 1995 2000 2005
Miliio
n p
eo
ple
Figure 2. Percentage of rural people, 1900-2005
71.7 71.3
68.8
66.564.9
57.4
49.3
41.3
33.7
28.726.5
25.423.5
0
10
20
30
40
50
60
70
80
1900 1910 1920 1930 1940 1950 1960 1970 1980 1990 1995 2000 2005
Pe
rce
nta
ge
The number for 1910 corresponds to communities with 4 000 and less inhabitants and for 1921, communities with 2 000 inhabitants or less. From 1930 onwards rural corresponds to communities with less than 2 500 inhabitants.
Source: INEGI, Censos de Población y Vivienda (1985 to 2000) and Conteos de Población y Vivienda (1995 and 2005).
There are 32 regional administrative units (entidades federativas): 31 states and one Federal District
(Mexico City). States are constituted by municipalities (2 454 in total), which are then broken down into
localities. According to INEGI (2005), there are 187 938 localities, of which 184 743 (98.3%) have less
than 2 500 inhabitants (Figure 3). Approximately 83 161 localities have only one or two households; this
shows the high degree of dispersion and atomisation of the rural population. On the other hand,
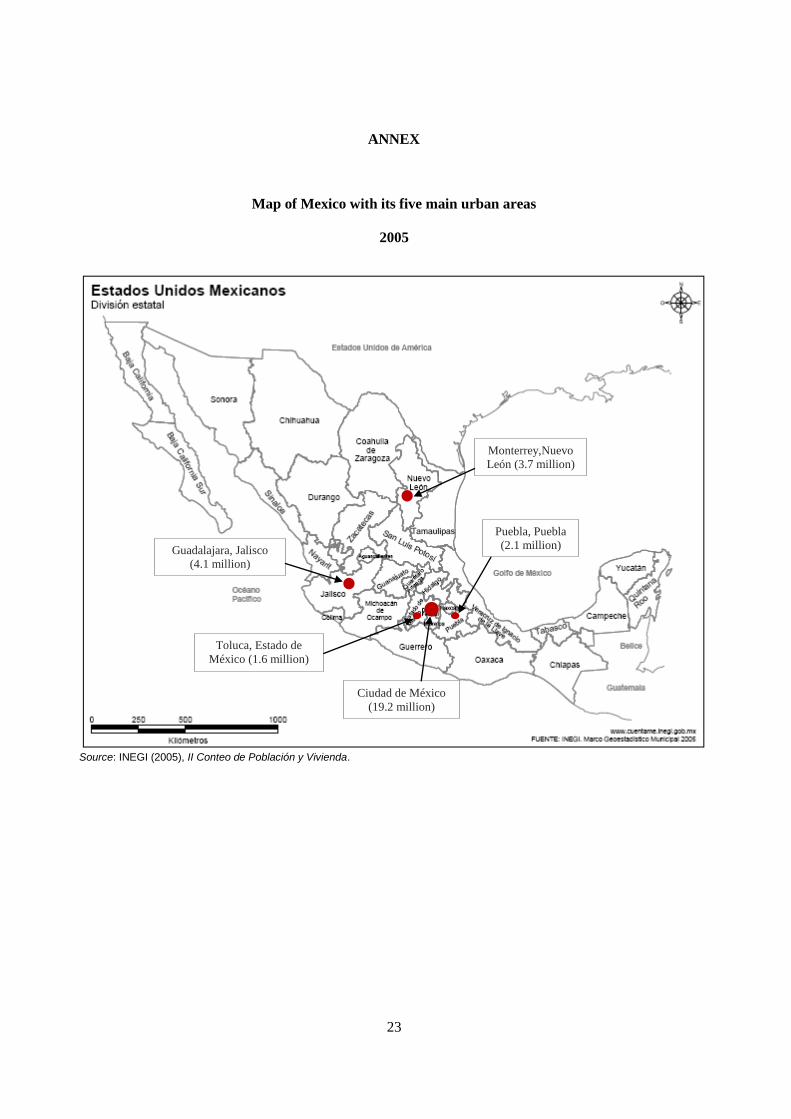
123 localities cluster 49% of the national population. The extreme cases are the five metropolitan regions
that group 30% of the total population: the Metropolitan Area of Mexico City with 19.2 million
6
inhabitants; Metropolitan Area of Guadalajara with 4.1 million; Metropolitan Area of Monterrey with
3.7 million; and Metropolitan Areas of Puebla and Toluca with 2.1 and 1.6 million respectively (Annex 1).
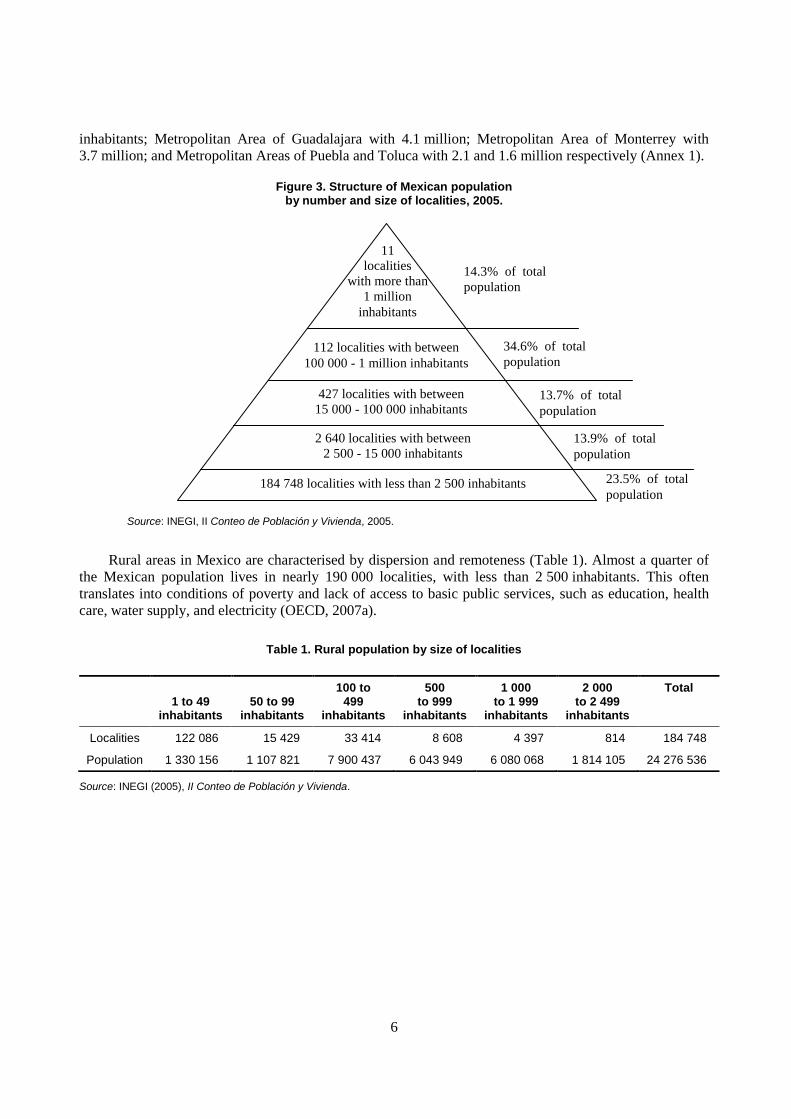
Figure 3. Structure of Mexican population by number and size of localities, 2005.
Source: INEGI, II Conteo de Población y Vivienda, 2005.
Rural areas in Mexico are characterised by dispersion and remoteness (Table 1). Almost a quarter of
the Mexican population lives in nearly 190 000 localities, with less than 2 500 inhabitants. This often
translates into conditions of poverty and lack of access to basic public services, such as education, health
care, water supply, and electricity (OECD, 2007a).
Table 1. Rural population by size of localities
Source: INEGI (2005), II Conteo de Población y Vivienda.
1 to 49
inhabitants 50 to 99
inhabitants
100 to 499
inhabitants
500 to 999
inhabitants
1 000 to 1 999
inhabitants
2 000 to 2 499
inhabitants
Total
Localities 122 086 15 429 33 414 8 608 4 397 814 184 748
Population 1 330 156 1 107 821 7 900 437 6 043 949 6 080 068 1 814 105 24 276 536
23.5% of total
population
13.9% of total
population
14.3% of total
population
34.6% of total
population
13.7% of total
population
11
localities
with more than
1 million
inhabitants
112 localities with between
100 000 - 1 million inhabitants
427 localities with between
15 000 - 100 000 inhabitants
2 640 localities with between
2 500 - 15 000 inhabitants
184 748 localities with less than 2 500 inhabitants
7
Employment
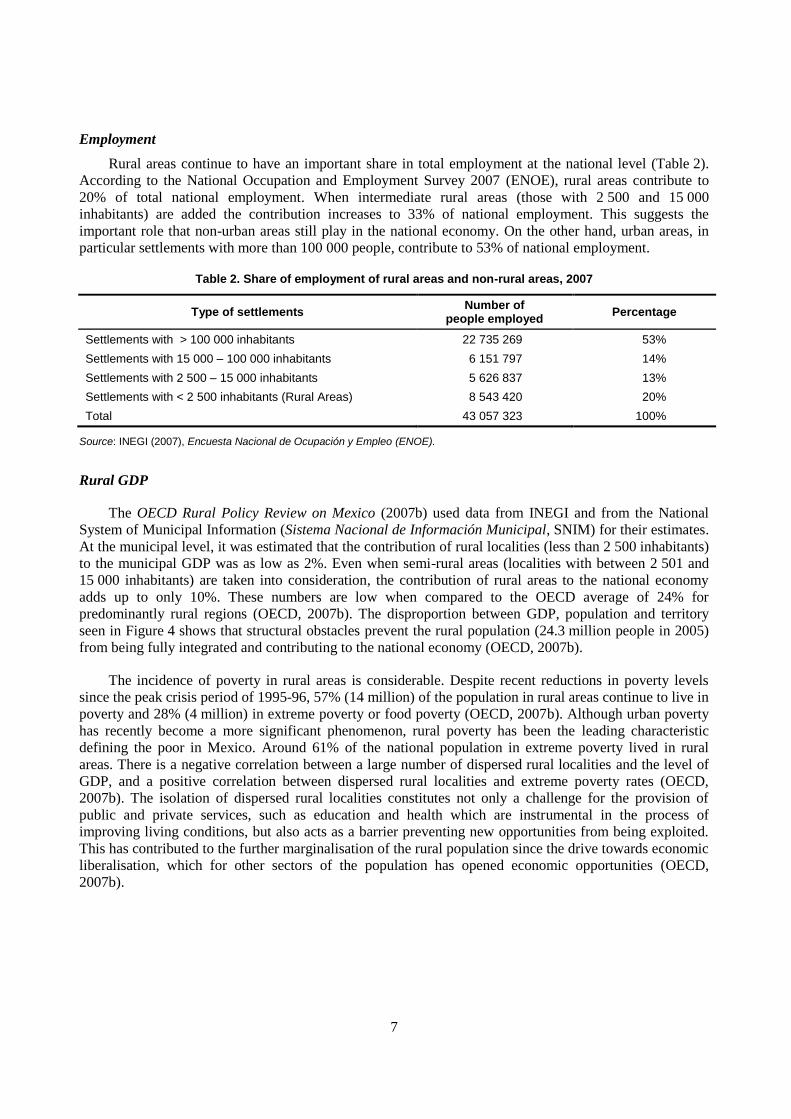
Rural areas continue to have an important share in total employment at the national level (Table 2).
According to the National Occupation and Employment Survey 2007 (ENOE), rural areas contribute to
20% of total national employment. When intermediate rural areas (those with 2 500 and 15 000
inhabitants) are added the contribution increases to 33% of national employment. This suggests the
important role that non-urban areas still play in the national economy. On the other hand, urban areas, in
particular settlements with more than 100 000 people, contribute to 53% of national employment.
Table 2. Share of employment of rural areas and non-rural areas, 2007
Type of settlements Number of
people employed Percentage
Settlements with > 100 000 inhabitants 22 735 269 53%
Settlements with 15 000 – 100 000 inhabitants 6 151 797 14%
Settlements with 2 500 – 15 000 inhabitants 5 626 837 13%
Settlements with < 2 500 inhabitants (Rural Areas) 8 543 420 20%
Total 43 057 323 100%
Source: INEGI (2007), Encuesta Nacional de Ocupación y Empleo (ENOE).
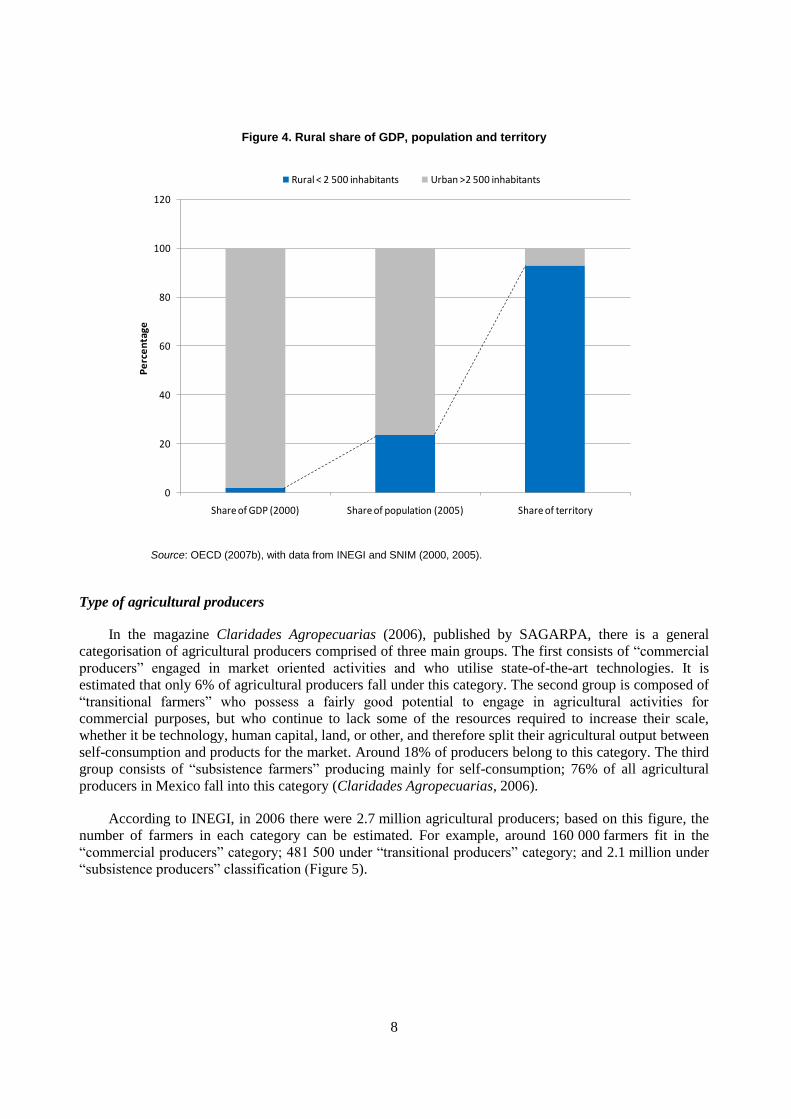
Rural GDP
The OECD Rural Policy Review on Mexico (2007b) used data from INEGI and from the National
System of Municipal Information (Sistema Nacional de Información Municipal, SNIM) for their estimates.
At the municipal level, it was estimated that the contribution of rural localities (less than 2 500 inhabitants)
to the municipal GDP was as low as 2%. Even when semi-rural areas (localities with between 2 501 and
15 000 inhabitants) are taken into consideration, the contribution of rural areas to the national economy
adds up to only 10%. These numbers are low when compared to the OECD average of 24% for
predominantly rural regions (OECD, 2007b). The disproportion between GDP, population and territory
seen in Figure 4 shows that structural obstacles prevent the rural population (24.3 million people in 2005)
from being fully integrated and contributing to the national economy (OECD, 2007b).
The incidence of poverty in rural areas is considerable. Despite recent reductions in poverty levels
since the peak crisis period of 1995-96, 57% (14 million) of the population in rural areas continue to live in
poverty and 28% (4 million) in extreme poverty or food poverty (OECD, 2007b). Although urban poverty
has recently become a more significant phenomenon, rural poverty has been the leading characteristic
defining the poor in Mexico. Around 61% of the national population in extreme poverty lived in rural
areas. There is a negative correlation between a large number of dispersed rural localities and the level of
GDP, and a positive correlation between dispersed rural localities and extreme poverty rates (OECD,
2007b). The isolation of dispersed rural localities constitutes not only a challenge for the provision of
public and private services, such as education and health which are instrumental in the process of
improving living conditions, but also acts as a barrier preventing new opportunities from being exploited.
This has contributed to the further marginalisation of the rural population since the drive towards economic
liberalisation, which for other sectors of the population has opened economic opportunities (OECD,
2007b).
8
Figure 4. Rural share of GDP, population and territory
0
20
40
60
80
100
120
Share of GDP (2000) Share of population (2005) Share of territory
Percentage
Rural < 2 500 inhabitants Urban >2 500 inhabitants
Source: OECD (2007b), with data from INEGI and SNIM (2000, 2005).
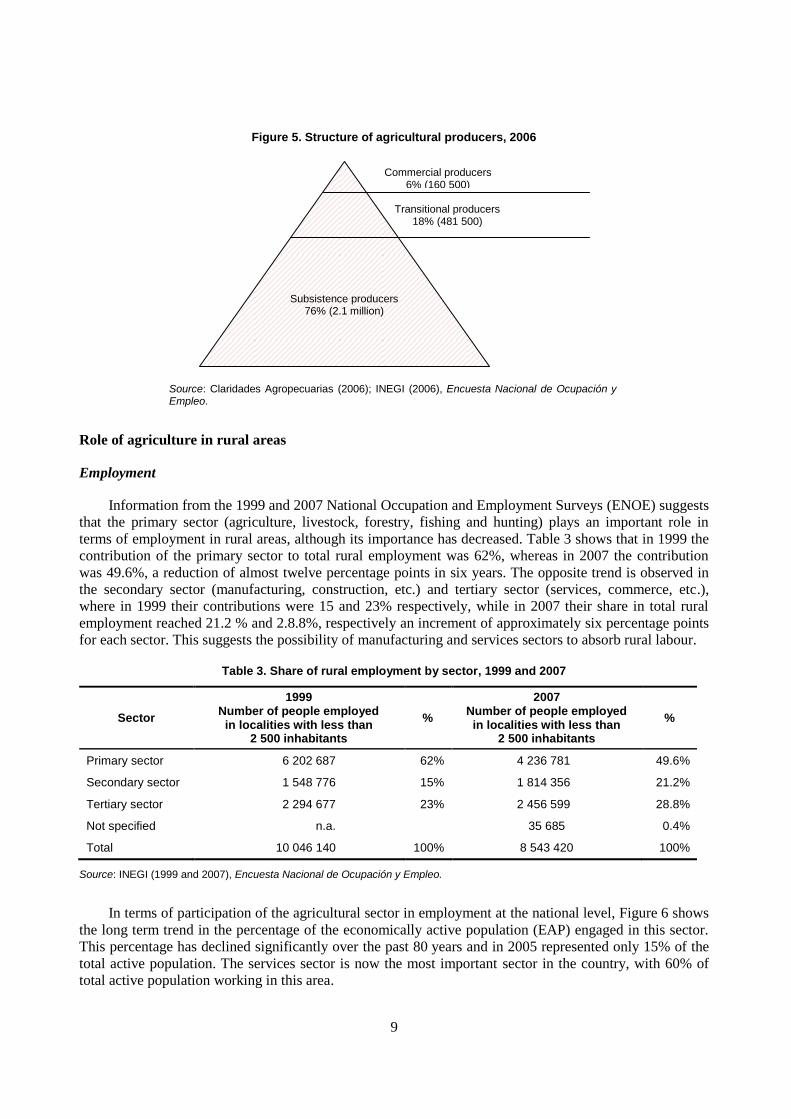
Type of agricultural producers
In the magazine Claridades Agropecuarias (2006), published by SAGARPA, there is a general
categorisation of agricultural producers comprised of three main groups. The first consists of “commercial
producers” engaged in market oriented activities and who utilise state-of-the-art technologies. It is
estimated that only 6% of agricultural producers fall under this category. The second group is composed of
“transitional farmers” who possess a fairly good potential to engage in agricultural activities for
commercial purposes, but who continue to lack some of the resources required to increase their scale,
whether it be technology, human capital, land, or other, and therefore split their agricultural output between
self-consumption and products for the market. Around 18% of producers belong to this category. The third
group consists of “subsistence farmers” producing mainly for self-consumption; 76% of all agricultural
producers in Mexico fall into this category (Claridades Agropecuarias, 2006).
According to INEGI, in 2006 there were 2.7 million agricultural producers; based on this figure, the
number of farmers in each category can be estimated. For example, around 160 000 farmers fit in the
“commercial producers” category; 481 500 under “transitional producers” category; and 2.1 million under
“subsistence producers” classification (Figure 5).
9
Figure 5. Structure of agricultural producers, 2006
Source: Claridades Agropecuarias (2006); INEGI (2006), Encuesta Nacional de Ocupación y Empleo.
Role of agriculture in rural areas
Employment
Information from the 1999 and 2007 National Occupation and Employment Surveys (ENOE) suggests
that the primary sector (agriculture, livestock, forestry, fishing and hunting) plays an important role in
terms of employment in rural areas, although its importance has decreased. Table 3 shows that in 1999 the
contribution of the primary sector to total rural employment was 62%, whereas in 2007 the contribution
was 49.6%, a reduction of almost twelve percentage points in six years. The opposite trend is observed in
the secondary sector (manufacturing, construction, etc.) and tertiary sector (services, commerce, etc.),
where in 1999 their contributions were 15 and 23% respectively, while in 2007 their share in total rural
employment reached 21.2 % and 2.8.8%, respectively an increment of approximately six percentage points
for each sector. This suggests the possibility of manufacturing and services sectors to absorb rural labour.
Table 3. Share of rural employment by sector, 1999 and 2007
Sector
1999 Number of people employed
in localities with less than 2 500 inhabitants
%
2007 Number of people employed in localities with less than
2 500 inhabitants
%
Primary sector 6 202 687 62% 4 236 781 49.6%
Secondary sector 1 548 776 15% 1 814 356 21.2%
Tertiary sector 2 294 677 23% 2 456 599 28.8%
Not specified n.a. 35 685 0.4%
Total 10 046 140 100% 8 543 420 100%
Source: INEGI (1999 and 2007), Encuesta Nacional de Ocupación y Empleo.
In terms of participation of the agricultural sector in employment at the national level, Figure 6 shows
the long term trend in the percentage of the economically active population (EAP) engaged in this sector.
This percentage has declined significantly over the past 80 years and in 2005 represented only 15% of the
total active population. The services sector is now the most important sector in the country, with 60% of
total active population working in this area.
Commercial producers 6% (160 500)
Transitional producers 18% (481 500)
Subsistence producers 76% (2.1 million)

10
Figure 6. Percentage of the economically active population by sector, 1920-2005.
77.4
73.2
67.3
60.9
54.6
41.8
36.5
23.5 22.6
16.315
12.515
13.1
16.719.1
24.4
29.2 28.8
24.5
28.7
25.5
10.111.8
19.6
22.4
26.3
33.8 34.3
47.7
52.955
59.5
0
10
20
30
40
50
60
70
80
90
1920 1930 1940 1950 1960 1970 1980 1990 1995 2000 2005
Primary (a) Secondary (b) Tertiary (c)
From 1920 to 1930, there is no reference to an age threshold to determine the EAP. From 1940 onwards, with the exception of 1960, the EAP corresponds to the population 8 years and older. For 1950, in addition to the occupied EAP, the census included persons who had been unoccupied in the period of 12 weeks before the census. For 1990, 1995, 2000 and 2005, the data refer to the occupied EAP only (population 14 years and older).
(a) Includes activities relative to agriculture, livestock, forestry and fisheries.
(b) Includes activities relative to mining, oil and gas extraction, manufacturing industry and electricity.
(c) Activities related to commerce, transportation, government and other services.
Source: INEGI (2005), Encuesta Nacional de Ocupación y Empleo.
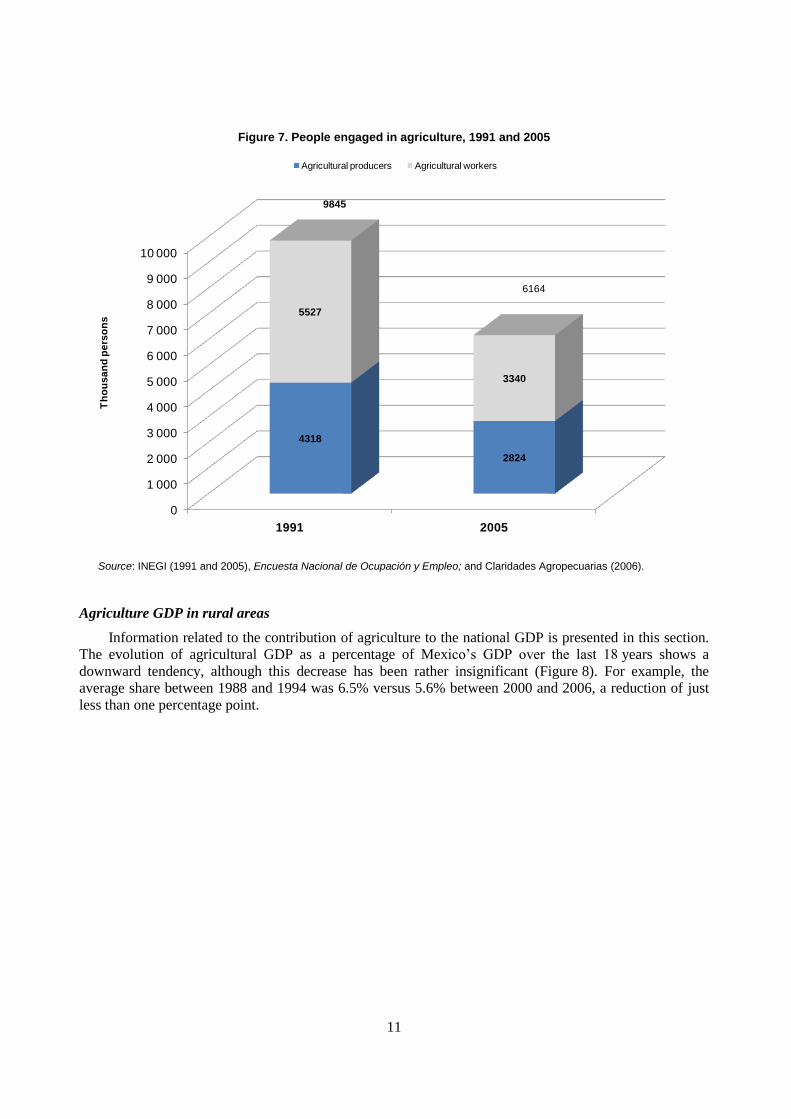
The total number of people (producers and workers) engaged in agricultural activities has
progressively declined in the last 17 years (Figure 7), from 9.8 million in 1991 to 6.1 million in 2005.
According to Taylor et al. (2004) displaced workers from the primary sector have migrated either to work
in informal services in urban areas or to the United States if they had networks that facilitated such a move.
11
Figure 7. People engaged in agriculture, 1991 and 2005
0
1 000
2 000
3 000
4 000
5 000
6 000
7 000
8 000
9 000
10 000
1991 2005
4318
2824
5527
3340
Th
ou
sa
nd
pe
rso
ns
Agricultural producers Agricultural workers
9845
6164
Source: INEGI (1991 and 2005), Encuesta Nacional de Ocupación y Empleo; and Claridades Agropecuarias (2006).
Agriculture GDP in rural areas
Information related to the contribution of agriculture to the national GDP is presented in this section.
The evolution of agricultural GDP as a percentage of Mexico’s GDP over the last 18 years shows a
downward tendency, although this decrease has been rather insignificant (Figure 8). For example, the
average share between 1988 and 1994 was 6.5% versus 5.6% between 2000 and 2006, a reduction of just
less than one percentage point.

12
Figure 8. Share of agricultural sector in the country’s GDP
0%
1%
2%
3%
4%
5%
6%
7%
8%1
98
8
19
89
19
90
19
91
19
92
19
93
19
94
19
95
19
96
19
97
19
98
19
99
20
00
20
01
20
02
20
03
20
04
20
05
20
06
Agricultural GDP includes crops, livestock, forestry, fishing and hunting;
Source: INEGI (2007), Sistema de Cuentas Nacionales de México.
In terms of the contribution of agricultural GDP by sub-sector, crop cultivation is considered the most
important sub-sector since it accounts for 70% of the total agricultural GDP. The next sub-sector in
importance is livestock with a share of 22% of the national agricultural GDP. Forestry and fishing are a bit
less important with a contribution of 5% and 3% respectively (Figure 9).
Figure 9. Contribution to the agricultural GDP by sub-sector, 2006
Crops70%
Livestock22%
Forestry5%
Fishing3%
Source: INEGI (2007), Sistema de Cuentas Nacionales de México.

13
Land use
Information related to the share of agriculture land use at the national level is analysed. Table 4 shows
the general use of land in Mexico. The total land area in Mexico is 193.4 million hectares, of which 36% or
69 million hectares is covered with forest and tropical forest; however, more than 40% of this type of land
have been degraded or altered (OECD, 2007a). Around 30% of the land has little productive use as it is
comprised of arid areas.
Table 4. Land use area and type of vegetation in Mexico, 2002
Land use and type of vegetation Area (ha) Percentage
With trees (forest and tropical forest) 69 018 549 35.7%
Vegetation in arid areas 57 634 353 29.8%
Croplanda 30 201 602 15.6%
Grasslands 27 785 815 14.4%
Other types of vegetationb 7 658 923 4.0%
Human settlements 1 120 127 0.6%
Totalc 193 419 369 100%
a. Includes irrigation and seasonal areas, crop areas not cultivated, forest cultivation, and nomadic crop land use.
b. Includes: Areas without apparent vegetation, forests that grow next to rivers and streams (bosques de galería), mangroves, palms, aquatic vegetation, coastal dune vegetation, vegetation that grows next to rivers and streams (vegetación de galería), gypsophile and halophile vegetations.
c. With regards to the total national area, without taking into account water bodies.
Source: SEMARNAT (2002), Compendio de Estadísticas Ambientales.
It is estimated that there are approximately 30 million hectares of cropland in Mexico, although the
actual number of hectares cultivated every year is much less. For instance, in 2006, 21.4 million hectares
were cultivated, of which 5.4 million or 24.5% were irrigated and the remaining 16 million were seasonal.
Table 5 shows the evolution of cropland area. Only between 1980 and 1985 is an important growth in crop
land observed, when approximately two million hectares were added. Nevertheless, in the last two decades
(1985 to 2005) the area allocated to crops has levelled off to around 21 million hectares.
Table 5. Cropland area in Mexico
Cropland (ha) Irrigated
1980 17 990 577 5 203 416 (29%)
1985 20 168 859 5 640 951 (28%)
1990 19 729 859 5 221 030 (26%)
1995 20 940 620 5 178 586 (25%)
2000 21 780 047 4 804 127 (22%)
2005 21 640 071 5 387 348 (25%)
2006 21 436 172 5 367 918 (25%)
Source: SIAP-SIACON (1980-2006), Anuario Estadístico de la Producción Agrícola.
Although 27.7 million hectares are allocated to grassland, the actual number of land used for livestock
purposes is around 112 million hectares according to SAGARPA (2006). This represents 56% of the
country’s total area. Land devoted to livestock could include all types of land use and type of vegetation. If
the land allocated to livestock and cropland are added up, a total of 133 million hectares are actually used
in agriculture. Figure 10 shows the share of land allocated to livestock and cropland, and within the later
14
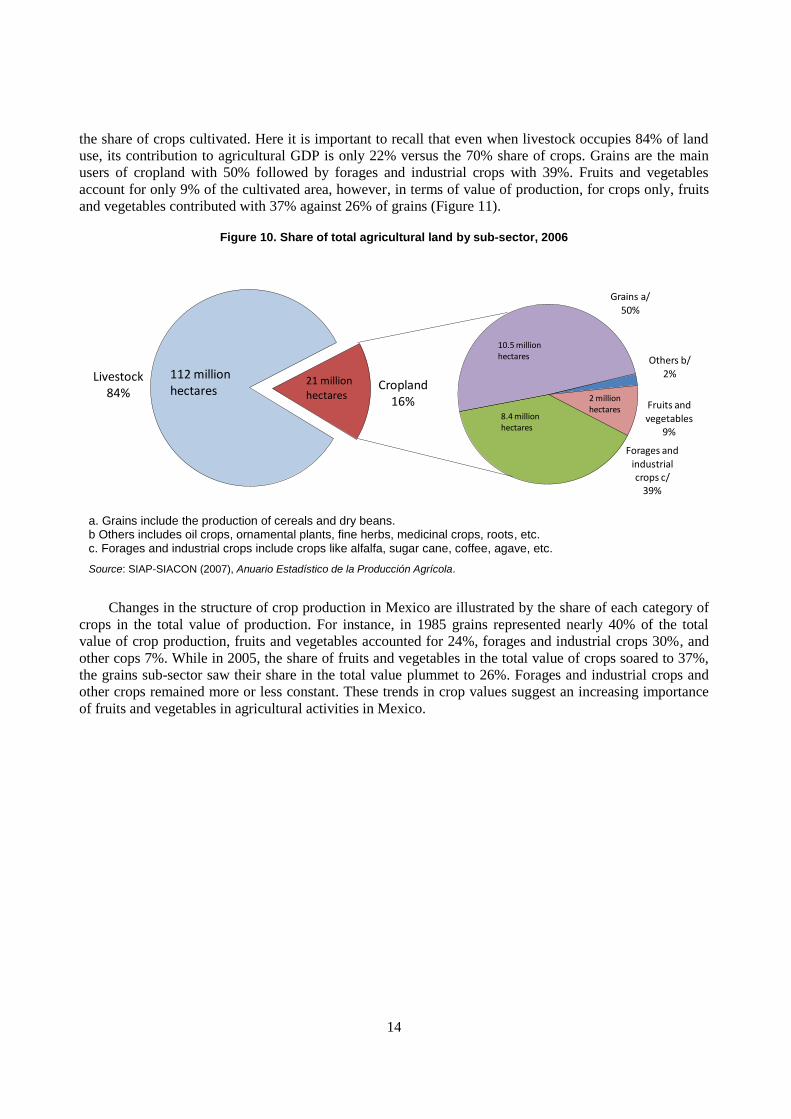
the share of crops cultivated. Here it is important to recall that even when livestock occupies 84% of land
use, its contribution to agricultural GDP is only 22% versus the 70% share of crops. Grains are the main
users of cropland with 50% followed by forages and industrial crops with 39%. Fruits and vegetables
account for only 9% of the cultivated area, however, in terms of value of production, for crops only, fruits
and vegetables contributed with 37% against 26% of grains (Figure 11).
Figure 10. Share of total agricultural land by sub-sector, 2006
Others b/2%
Fruits and
vegetables9%
Forages and industrial crops c/
39%
Grains a/50%
10.5 million hectares
8.4 million hectares
2 million hectares
Livestock84%
Cropland16%
112 million hectares
21 million hectares
a. Grains include the production of cereals and dry beans. b Others includes oil crops, ornamental plants, fine herbs, medicinal crops, roots, etc. c. Forages and industrial crops include crops like alfalfa, sugar cane, coffee, agave, etc.
Source: SIAP-SIACON (2007), Anuario Estadístico de la Producción Agrícola.
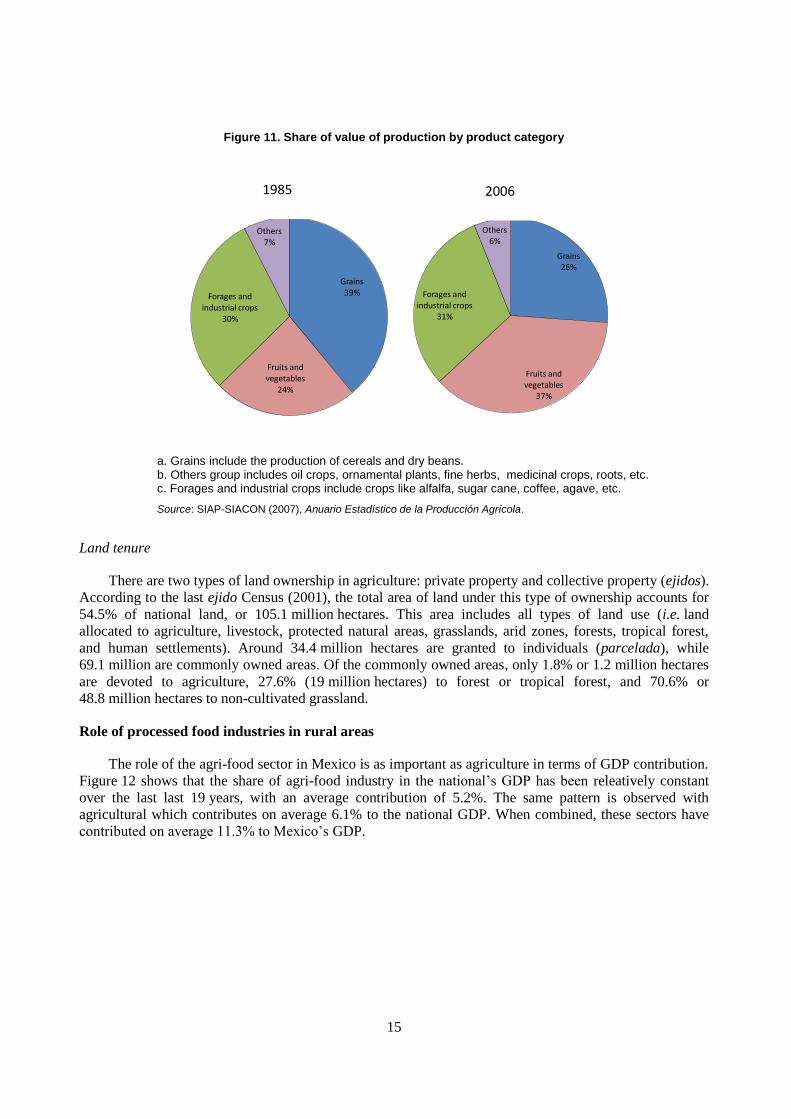
Changes in the structure of crop production in Mexico are illustrated by the share of each category of
crops in the total value of production. For instance, in 1985 grains represented nearly 40% of the total
value of crop production, fruits and vegetables accounted for 24%, forages and industrial crops 30%, and
other cops 7%. While in 2005, the share of fruits and vegetables in the total value of crops soared to 37%,
the grains sub-sector saw their share in the total value plummet to 26%. Forages and industrial crops and
other crops remained more or less constant. These trends in crop values suggest an increasing importance
of fruits and vegetables in agricultural activities in Mexico.
15
Figure 11. Share of value of production by product category
Grains26%
Fruits and vegetables
37%
Forages and industrial crops
31%
Others6%
Grains39%
Fruits and vegetables
24%
Forages and industrial crops
30%
Others7%
1985 2006
a. Grains include the production of cereals and dry beans. b. Others group includes oil crops, ornamental plants, fine herbs, medicinal crops, roots, etc. c. Forages and industrial crops include crops like alfalfa, sugar cane, coffee, agave, etc.
Source: SIAP-SIACON (2007), Anuario Estadístico de la Producción Agrícola.
Land tenure
There are two types of land ownership in agriculture: private property and collective property (ejidos).
According to the last ejido Census (2001), the total area of land under this type of ownership accounts for
54.5% of national land, or 105.1 million hectares. This area includes all types of land use (i.e. land
allocated to agriculture, livestock, protected natural areas, grasslands, arid zones, forests, tropical forest,
and human settlements). Around 34.4 million hectares are granted to individuals (parcelada), while
69.1 million are commonly owned areas. Of the commonly owned areas, only 1.8% or 1.2 million hectares
are devoted to agriculture, 27.6% (19 million hectares) to forest or tropical forest, and 70.6% or
48.8 million hectares to non-cultivated grassland.
Role of processed food industries in rural areas
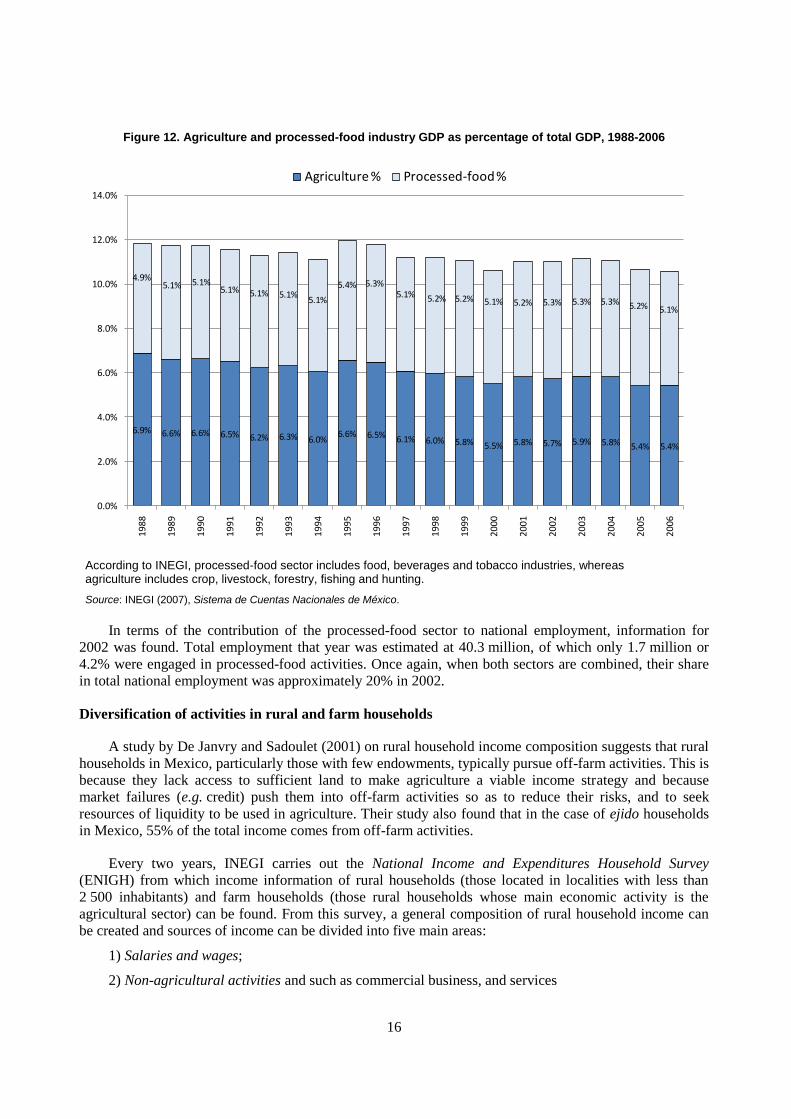
The role of the agri-food sector in Mexico is as important as agriculture in terms of GDP contribution.
Figure 12 shows that the share of agri-food industry in the national’s GDP has been releatively constant
over the last last 19 years, with an average contribution of 5.2%. The same pattern is observed with
agricultural which contributes on average 6.1% to the national GDP. When combined, these sectors have
contributed on average 11.3% to Mexico’s GDP.
16
Figure 12. Agriculture and processed-food industry GDP as percentage of total GDP, 1988-2006
6.9% 6.6% 6.6% 6.5% 6.2% 6.3% 6.0%6.6% 6.5% 6.1% 6.0% 5.8% 5.5% 5.8% 5.7% 5.9% 5.8% 5.4% 5.4%
4.9%5.1% 5.1%
5.1% 5.1% 5.1%5.1%
5.4% 5.3%5.1% 5.2% 5.2% 5.1% 5.2% 5.3% 5.3% 5.3% 5.2% 5.1%
0.0%
2.0%
4.0%
6.0%
8.0%
10.0%
12.0%
14.0%
19
88
19
89
19
90
19
91
19
92
19
93
19
94
19
95
19
96
19
97
19
98
19
99
20
00
20
01
20
02
20
03
20
04
20
05
20
06
Agriculture % Processed-food %
According to INEGI, processed-food sector includes food, beverages and tobacco industries, whereas agriculture includes crop, livestock, forestry, fishing and hunting.
Source: INEGI (2007), Sistema de Cuentas Nacionales de México.
In terms of the contribution of the processed-food sector to national employment, information for
2002 was found. Total employment that year was estimated at 40.3 million, of which only 1.7 million or
4.2% were engaged in processed-food activities. Once again, when both sectors are combined, their share
in total national employment was approximately 20% in 2002.
Diversification of activities in rural and farm households
A study by De Janvry and Sadoulet (2001) on rural household income composition suggests that rural
households in Mexico, particularly those with few endowments, typically pursue off-farm activities. This is
because they lack access to sufficient land to make agriculture a viable income strategy and because
market failures (e.g. credit) push them into off-farm activities so as to reduce their risks, and to seek
resources of liquidity to be used in agriculture. Their study also found that in the case of ejido households
in Mexico, 55% of the total income comes from off-farm activities.
Every two years, INEGI carries out the National Income and Expenditures Household Survey
(ENIGH) from which income information of rural households (those located in localities with less than
2 500 inhabitants) and farm households (those rural households whose main economic activity is the
agricultural sector) can be found. From this survey, a general composition of rural household income can
be created and sources of income can be divided into five main areas:
1) Salaries and wages;
2) Non-agricultural activities and such as commercial business, and services
17
3) Agricultural activities.
4) Financial income, deriving from equities, sale of stocks and bonds, loans, savings, patents, etc.
5) Gifts, donations and others, that comprise remittances, retirement payments, social subventions
(e.g. PROCAMPO and OPORTUNIDADES), government donations, interest on investments,
properties loans, grants, etc.
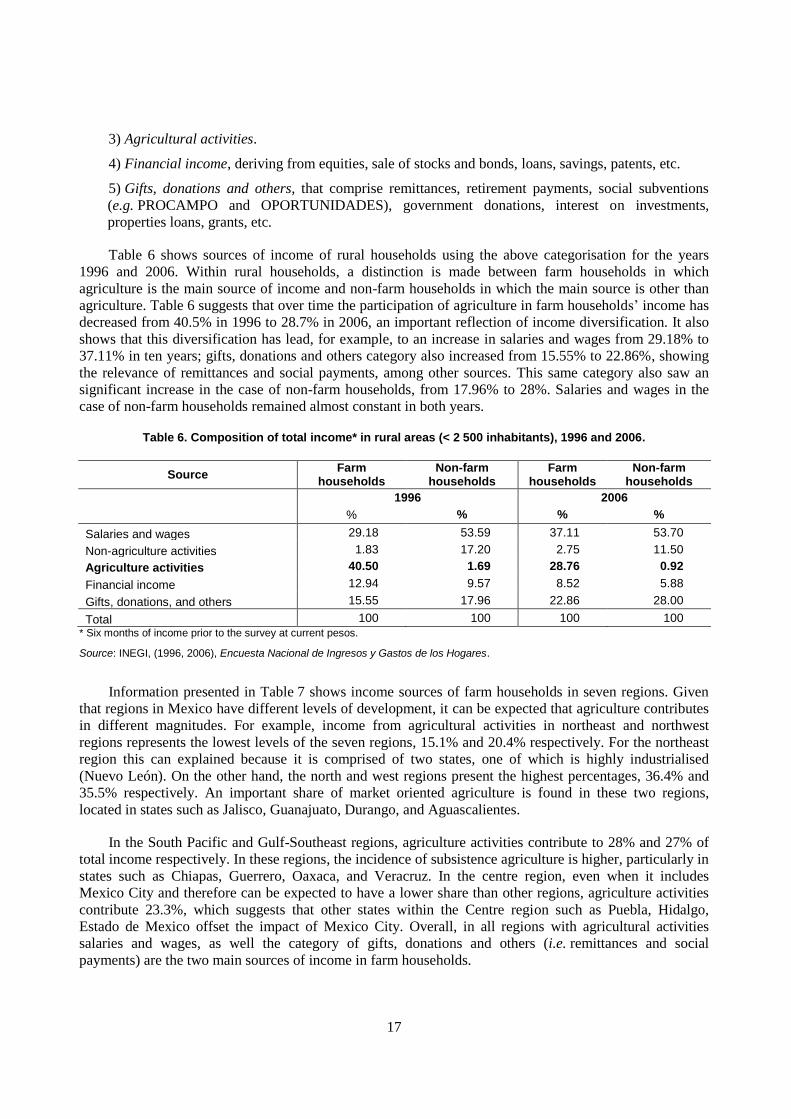
Table 6 shows sources of income of rural households using the above categorisation for the years
1996 and 2006. Within rural households, a distinction is made between farm households in which
agriculture is the main source of income and non-farm households in which the main source is other than
agriculture. Table 6 suggests that over time the participation of agriculture in farm households’ income has
decreased from 40.5% in 1996 to 28.7% in 2006, an important reflection of income diversification. It also
shows that this diversification has lead, for example, to an increase in salaries and wages from 29.18% to
37.11% in ten years; gifts, donations and others category also increased from 15.55% to 22.86%, showing
the relevance of remittances and social payments, among other sources. This same category also saw an
significant increase in the case of non-farm households, from 17.96% to 28%. Salaries and wages in the
case of non-farm households remained almost constant in both years.
Table 6. Composition of total income* in rural areas (< 2 500 inhabitants), 1996 and 2006.
Source Farm
households Non-farm
households Farm
households Non-farm
households
1996 2006
% % % %
Salaries and wages 29.18 53.59 37.11 53.70
Non-agriculture activities 1.83 17.20 2.75 11.50
Agriculture activities 40.50 1.69 28.76 0.92
Financial income 12.94 9.57 8.52 5.88
Gifts, donations, and others 15.55 17.96 22.86 28.00
Total 100 100 100 100
* Six months of income prior to the survey at current pesos.
Source: INEGI, (1996, 2006), Encuesta Nacional de Ingresos y Gastos de los Hogares.
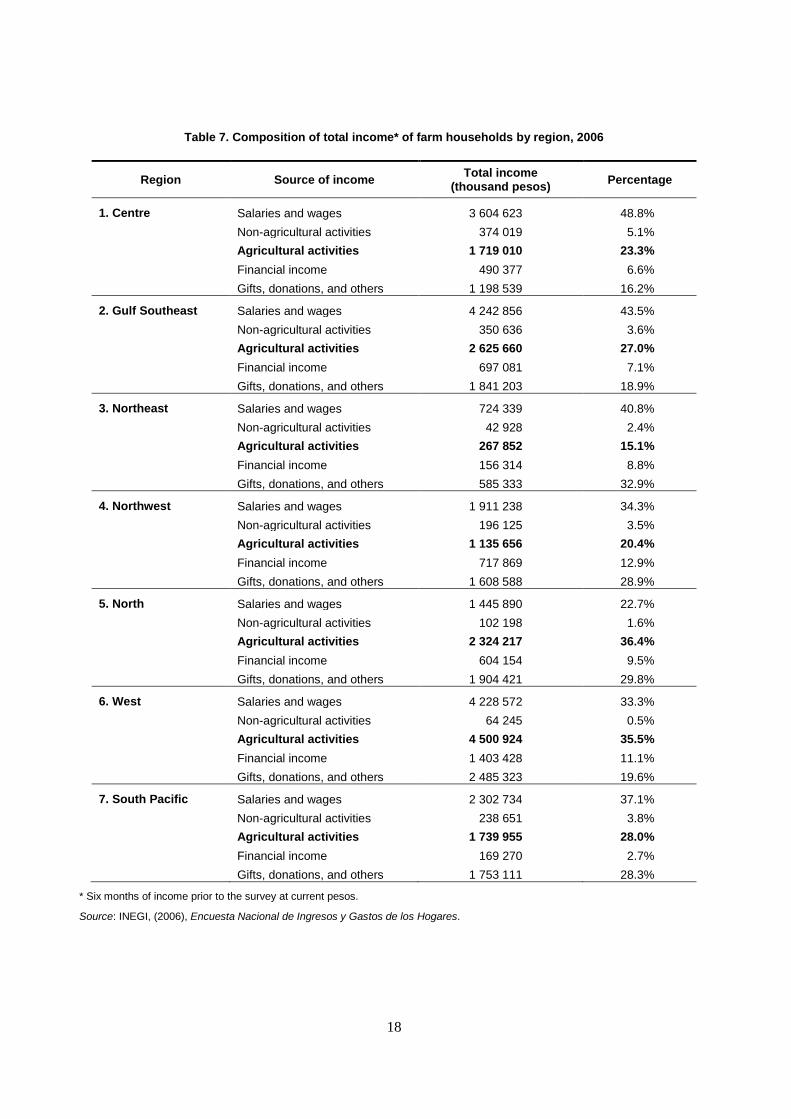
Information presented in Table 7 shows income sources of farm households in seven regions. Given
that regions in Mexico have different levels of development, it can be expected that agriculture contributes
in different magnitudes. For example, income from agricultural activities in northeast and northwest
regions represents the lowest levels of the seven regions, 15.1% and 20.4% respectively. For the northeast
region this can explained because it is comprised of two states, one of which is highly industrialised
(Nuevo León). On the other hand, the north and west regions present the highest percentages, 36.4% and
35.5% respectively. An important share of market oriented agriculture is found in these two regions,
located in states such as Jalisco, Guanajuato, Durango, and Aguascalientes.
In the South Pacific and Gulf-Southeast regions, agriculture activities contribute to 28% and 27% of
total income respectively. In these regions, the incidence of subsistence agriculture is higher, particularly in
states such as Chiapas, Guerrero, Oaxaca, and Veracruz. In the centre region, even when it includes
Mexico City and therefore can be expected to have a lower share than other regions, agriculture activities
contribute 23.3%, which suggests that other states within the Centre region such as Puebla, Hidalgo,
Estado de Mexico offset the impact of Mexico City. Overall, in all regions with agricultural activities
salaries and wages, as well the category of gifts, donations and others (i.e. remittances and social
payments) are the two main sources of income in farm households.
18
Table 7. Composition of total income* of farm households by region, 2006
Region Source of income Total income
(thousand pesos) Percentage
1. Centre Salaries and wages 3 604 623 48.8%
Non-agricultural activities 374 019 5.1%
Agricultural activities 1 719 010 23.3%
Financial income 490 377 6.6%
Gifts, donations, and others 1 198 539 16.2%
2. Gulf Southeast Salaries and wages 4 242 856 43.5%
Non-agricultural activities 350 636 3.6%
Agricultural activities 2 625 660 27.0%
Financial income 697 081 7.1% Gifts, donations, and others 1 841 203 18.9%
3. Northeast Salaries and wages 724 339 40.8% Non-agricultural activities 42 928 2.4% Agricultural activities 267 852 15.1%
Financial income 156 314 8.8% Gifts, donations, and others 585 333 32.9%
4. Northwest Salaries and wages 1 911 238 34.3% Non-agricultural activities 196 125 3.5% Agricultural activities 1 135 656 20.4%
Financial income 717 869 12.9% Gifts, donations, and others 1 608 588 28.9%
5. North Salaries and wages 1 445 890 22.7% Non-agricultural activities 102 198 1.6% Agricultural activities 2 324 217 36.4%
Financial income 604 154 9.5% Gifts, donations, and others 1 904 421 29.8%
6. West Salaries and wages 4 228 572 33.3% Non-agricultural activities 64 245 0.5% Agricultural activities 4 500 924 35.5%
Financial income 1 403 428 11.1% Gifts, donations, and others 2 485 323 19.6%
7. South Pacific Salaries and wages 2 302 734 37.1% Non-agricultural activities 238 651 3.8% Agricultural activities 1 739 955 28.0%
Financial income 169 270 2.7% Gifts, donations, and others 1 753 111 28.3%
* Six months of income prior to the survey at current pesos.
Source: INEGI, (2006), Encuesta Nacional de Ingresos y Gastos de los Hogares.
19
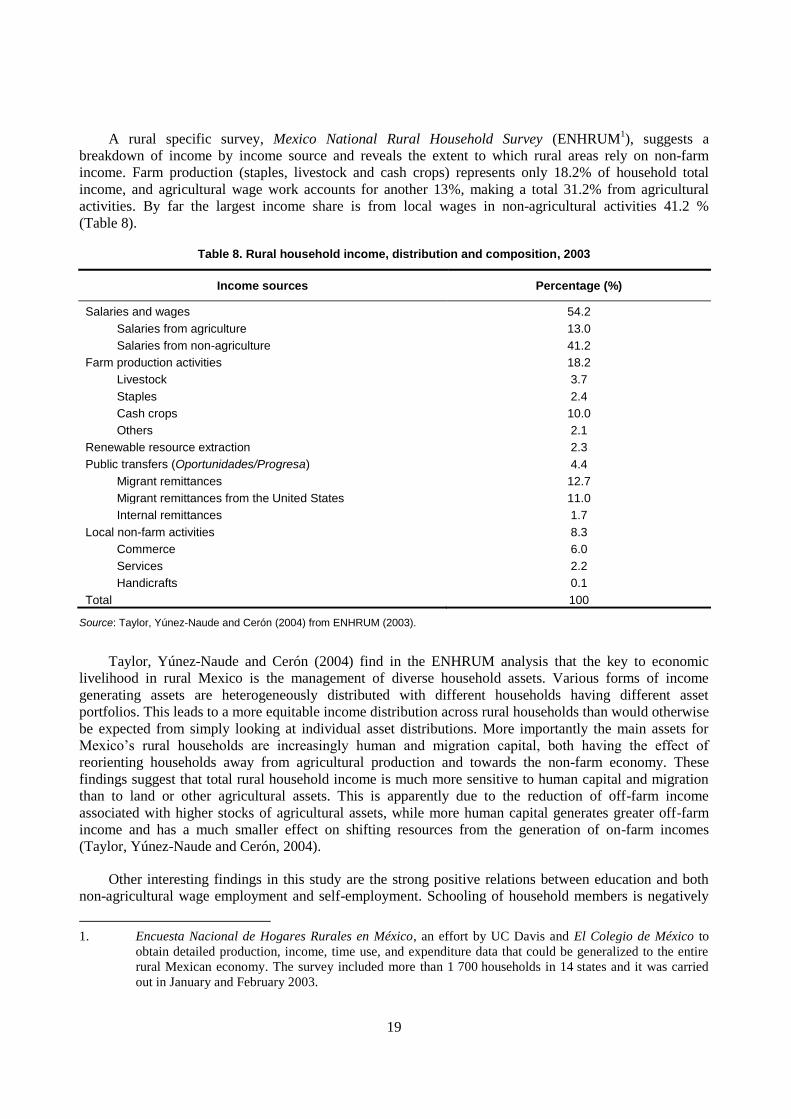
A rural specific survey, Mexico National Rural Household Survey (ENHRUM1), suggests a
breakdown of income by income source and reveals the extent to which rural areas rely on non-farm
income. Farm production (staples, livestock and cash crops) represents only 18.2% of household total
income, and agricultural wage work accounts for another 13%, making a total 31.2% from agricultural
activities. By far the largest income share is from local wages in non-agricultural activities 41.2 %
(Table 8).
Table 8. Rural household income, distribution and composition, 2003
Income sources Percentage (%)
Salaries and wages 54.2
Salaries from agriculture 13.0
Salaries from non-agriculture 41.2
Farm production activities 18.2
Livestock 3.7
Staples 2.4
Cash crops 10.0
Others 2.1
Renewable resource extraction 2.3
Public transfers (Oportunidades/Progresa) 4.4
Migrant remittances 12.7
Migrant remittances from the United States 11.0
Internal remittances 1.7
Local non-farm activities 8.3
Commerce 6.0
Services 2.2
Handicrafts 0.1
Total 100
Source: Taylor, Yúnez-Naude and Cerón (2004) from ENHRUM (2003).
Taylor, Yúnez-Naude and Cerón (2004) find in the ENHRUM analysis that the key to economic
livelihood in rural Mexico is the management of diverse household assets. Various forms of income
generating assets are heterogeneously distributed with different households having different asset
portfolios. This leads to a more equitable income distribution across rural households than would otherwise
be expected from simply looking at individual asset distributions. More importantly the main assets for
Mexico’s rural households are increasingly human and migration capital, both having the effect of
reorienting households away from agricultural production and towards the non-farm economy. These
findings suggest that total rural household income is much more sensitive to human capital and migration
than to land or other agricultural assets. This is apparently due to the reduction of off-farm income
associated with higher stocks of agricultural assets, while more human capital generates greater off-farm
income and has a much smaller effect on shifting resources from the generation of on-farm incomes
(Taylor, Yúnez-Naude and Cerón, 2004).
Other interesting findings in this study are the strong positive relations between education and both
non-agricultural wage employment and self-employment. Schooling of household members is negatively
1. Encuesta Nacional de Hogares Rurales en México, an effort by UC Davis and El Colegio de México to
obtain detailed production, income, time use, and expenditure data that could be generalized to the entire
rural Mexican economy. The survey included more than 1 700 households in 14 states and it was carried
out in January and February 2003.
20
correlated with rural households’ participation in agriculture, but positively correlated in non-farm
activities (Taylor, Yúnez-Naude and Cerón, 2004). A major policy implication for rural development in
this analysis was that policies should not only be oriented to a single activity or a single asset, but rather
that policies should be sensitive to the diversity of households’ activities.
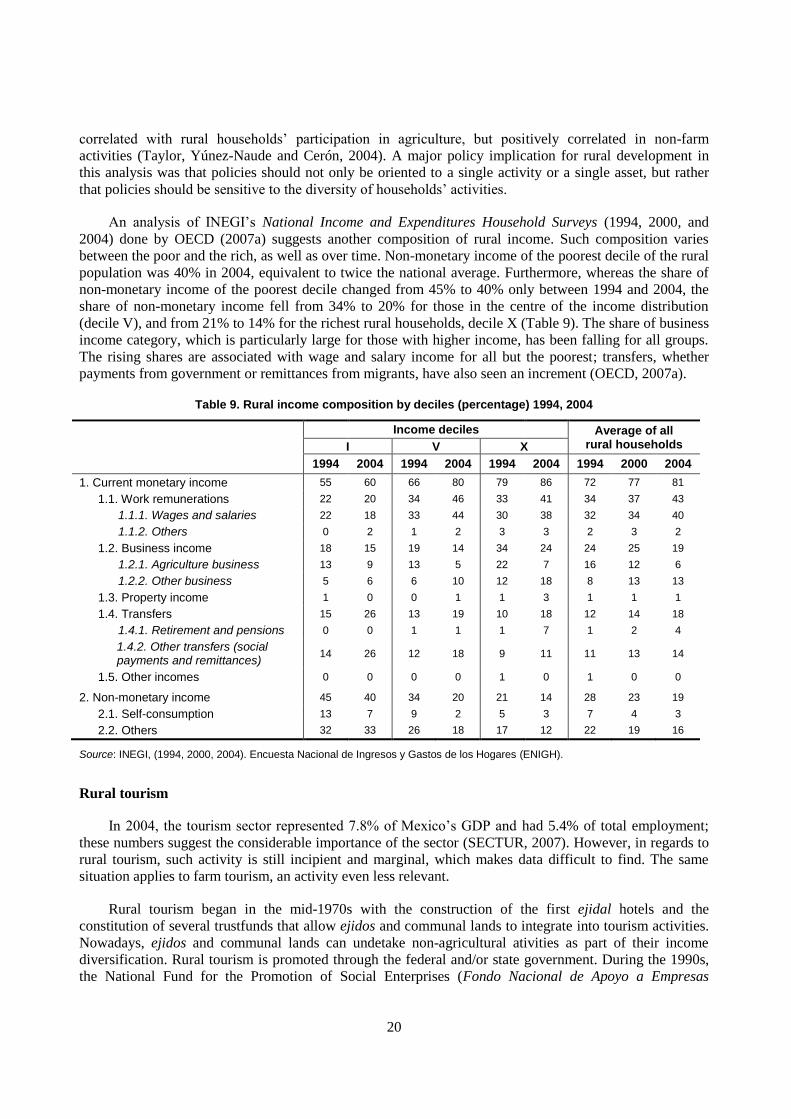
An analysis of INEGI’s National Income and Expenditures Household Surveys (1994, 2000, and
2004) done by OECD (2007a) suggests another composition of rural income. Such composition varies
between the poor and the rich, as well as over time. Non-monetary income of the poorest decile of the rural
population was 40% in 2004, equivalent to twice the national average. Furthermore, whereas the share of
non-monetary income of the poorest decile changed from 45% to 40% only between 1994 and 2004, the
share of non-monetary income fell from 34% to 20% for those in the centre of the income distribution
(decile V), and from 21% to 14% for the richest rural households, decile X (Table 9). The share of business
income category, which is particularly large for those with higher income, has been falling for all groups.
The rising shares are associated with wage and salary income for all but the poorest; transfers, whether
payments from government or remittances from migrants, have also seen an increment (OECD, 2007a).
Table 9. Rural income composition by deciles (percentage) 1994, 2004
Income deciles Average of all rural households I V X
1994 2004 1994 2004 1994 2004 1994 2000 2004
1. Current monetary income 55 60 66 80 79 86 72 77 81
1.1. Work remunerations 22 20 34 46 33 41 34 37 43
1.1.1. Wages and salaries 22 18 33 44 30 38 32 34 40
1.1.2. Others 0 2 1 2 3 3 2 3 2
1.2. Business income 18 15 19 14 34 24 24 25 19
1.2.1. Agriculture business 13 9 13 5 22 7 16 12 6
1.2.2. Other business 5 6 6 10 12 18 8 13 13
1.3. Property income 1 0 0 1 1 3 1 1 1
1.4. Transfers 15 26 13 19 10 18 12 14 18
1.4.1. Retirement and pensions 0 0 1 1 1 7 1 2 4
1.4.2. Other transfers (social payments and remittances)
14 26 12 18 9 11 11 13 14
1.5. Other incomes 0 0 0 0 1 0 1 0 0
2. Non-monetary income 45 40 34 20 21 14 28 23 19
2.1. Self-consumption 13 7 9 2 5 3 7 4 3
2.2. Others 32 33 26 18 17 12 22 19 16
Source: INEGI, (1994, 2000, 2004). Encuesta Nacional de Ingresos y Gastos de los Hogares (ENIGH).
Rural tourism
In 2004, the tourism sector represented 7.8% of Mexico’s GDP and had 5.4% of total employment;
these numbers suggest the considerable importance of the sector (SECTUR, 2007). However, in regards to
rural tourism, such activity is still incipient and marginal, which makes data difficult to find. The same
situation applies to farm tourism, an activity even less relevant.
Rural tourism began in the mid-1970s with the construction of the first ejidal hotels and the
constitution of several trustfunds that allow ejidos and communal lands to integrate into tourism activities.
Nowadays, ejidos and communal lands can undetake non-agricultural ativities as part of their income
diversification. Rural tourism is promoted through the federal and/or state government. During the 1990s,
the National Fund for the Promotion of Social Enterprises (Fondo Nacional de Apoyo a Empresas

21
Sociales, FONAES) provided direct support to various regions, most of them with high rates of
indigeneous inhabitants and rural poverty, with the idea of promoting tourism activities (Juárez Sánchez &
Ramírez Valverde, 2007). Several programmes have been created and implemented by the Ministry of
Tourism (SECTUR) in recent years, such as the renovation and rescue of old haciendas, the promotion of
ecotourism in natural protected areas, the improvement of infraestructure, etc. Despite these efforts, rural
tourism still presents a low level of development and little research can be found that measures its impacts
on rural and/or farm households.
Multiplier effects of agriculture and other rural activities
The last input-output tables produced by INEGI as a part of the national account information were
generated in 1980. Information related to the multiplier effects of agriculture at the national level and/or
rural areas is limited. However, some studies related to local income and consumption multipliers have
been undertaken. For instance, a study carried out by Taylor and Yúñez-Naude in 2003 examines farm and
non-farm linkages in Mexico using two methodologies: a village/town social accounting matrix (SAM) and
a village/town computable general equilibrium (CGE). The SAM and CGE analysis of multipliers resulting
from changes in rural incomes suggests that farm/non-farm demand linkages are important. The great
majority of these linkages, however, are with markets outside rather than within villages. For instance, an
increase of USD 100 in exogenous household income stimulated an increase in village non-farm
production between USD 0.3 and USD 12, while village demand for manufactures from outside markets
increased between USD 88 and USD 103. In the village/town micro-region, an increase of USD 100 in
exogenous income stimulated an increase of USD 18 in village non-agricultural production; while an
increase of USD 74 in commerce demand (almost entirely goods bought outside the village) was observed.
Results also showed a USD 38 increase in village demand for goods sold in the town, and a USD 22
increase in village demand for goods from outside the village/town economy.
These findings suggest that in rural Mexico, a large share of rural household demand for purchased
inputs, consumption and investment goods is supplied by regional towns which have proliferated in the last
decade and which now account for most of the country’s urban growth. Most of the farm and non-farm
diversification in rural Mexico is between villages, where agriculture is still the main economic activity.
Nevertheless, village household incomes have diversified away from agriculture, largely as a result of
families’ participation in labour markets outside the village and through wage work in distant towns or
abroad. Increasing the income of village households and loosening agricultural supply constraints is
important for the growth of the rural non-farm economy (RNFE) in towns and small cities. Estimated
farm/non-farm linkages resulting from rural income changes appear to depend critically on the supply
response of agriculture and on model specification, especially the role of prices (Taylor and Yúnez-Naude,
2003).
22
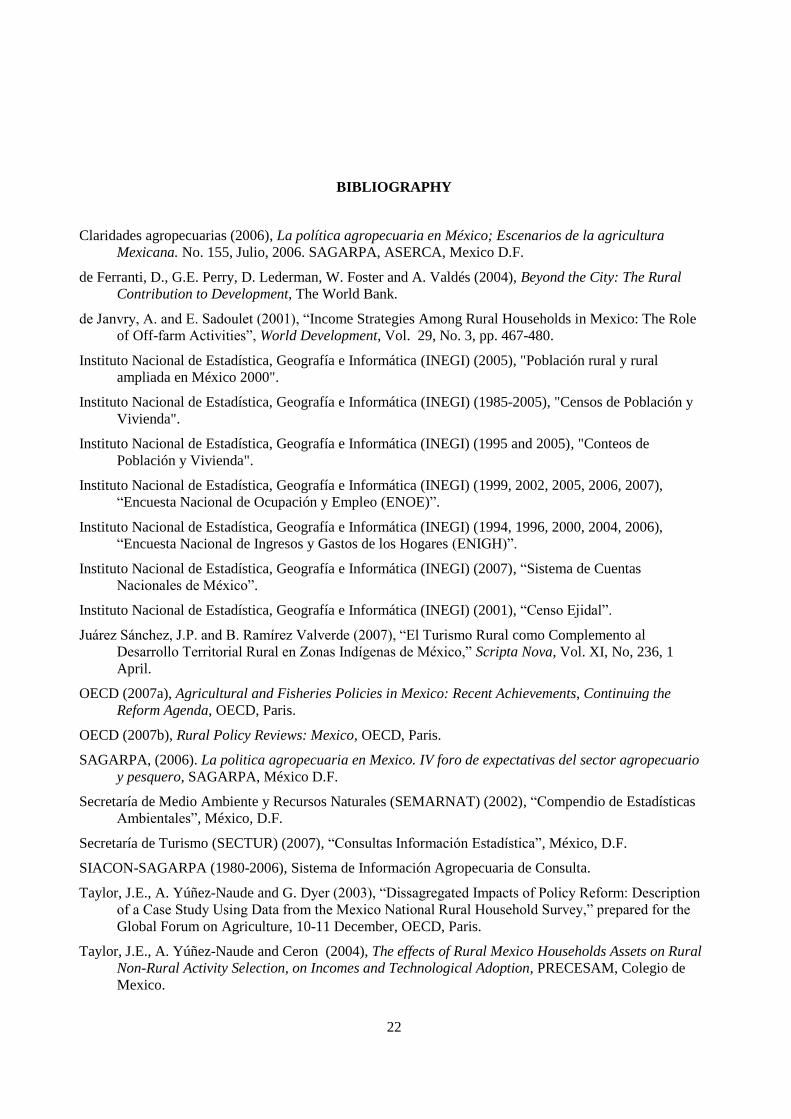
BIBLIOGRAPHY
Claridades agropecuarias (2006), La política agropecuaria en México; Escenarios de la agricultura
Mexicana. No. 155, Julio, 2006. SAGARPA, ASERCA, Mexico D.F.
de Ferranti, D., G.E. Perry, D. Lederman, W. Foster and A. Valdés (2004), Beyond the City: The Rural
Contribution to Development, The World Bank.
de Janvry, A. and E. Sadoulet (2001), “Income Strategies Among Rural Households in Mexico: The Role
of Off-farm Activities”, World Development, Vol. 29, No. 3, pp. 467-480.
Instituto Nacional de Estadística, Geografía e Informática (INEGI) (2005), "Población rural y rural
ampliada en México 2000".
Instituto Nacional de Estadística, Geografía e Informática (INEGI) (1985-2005), "Censos de Población y
Vivienda".
Instituto Nacional de Estadística, Geografía e Informática (INEGI) (1995 and 2005), "Conteos de
Población y Vivienda".
Instituto Nacional de Estadística, Geografía e Informática (INEGI) (1999, 2002, 2005, 2006, 2007),
“Encuesta Nacional de Ocupación y Empleo (ENOE)”.
Instituto Nacional de Estadística, Geografía e Informática (INEGI) (1994, 1996, 2000, 2004, 2006),
“Encuesta Nacional de Ingresos y Gastos de los Hogares (ENIGH)”.
Instituto Nacional de Estadística, Geografía e Informática (INEGI) (2007), “Sistema de Cuentas
Nacionales de México”.
Instituto Nacional de Estadística, Geografía e Informática (INEGI) (2001), “Censo Ejidal”.
Juárez Sánchez, J.P. and B. Ramírez Valverde (2007), “El Turismo Rural como Complemento al
Desarrollo Territorial Rural en Zonas Indígenas de México,” Scripta Nova, Vol. XI, No, 236, 1
April.
OECD (2007a), Agricultural and Fisheries Policies in Mexico: Recent Achievements, Continuing the
Reform Agenda, OECD, Paris.
OECD (2007b), Rural Policy Reviews: Mexico, OECD, Paris.
SAGARPA, (2006). La politica agropecuaria en Mexico. IV foro de expectativas del sector agropecuario
y pesquero, SAGARPA, México D.F.
Secretaría de Medio Ambiente y Recursos Naturales (SEMARNAT) (2002), “Compendio de Estadísticas
Ambientales”, México, D.F.
Secretaría de Turismo (SECTUR) (2007), “Consultas Información Estadística”, México, D.F.
SIACON-SAGARPA (1980-2006), Sistema de Información Agropecuaria de Consulta.
Taylor, J.E., A. Yúñez-Naude and G. Dyer (2003), “Dissagregated Impacts of Policy Reform: Description
of a Case Study Using Data from the Mexico National Rural Household Survey,” prepared for the
Global Forum on Agriculture, 10-11 December, OECD, Paris.
Taylor, J.E., A. Yúñez-Naude and Ceron (2004), The effects of Rural Mexico Households Assets on Rural
Non-Rural Activity Selection, on Incomes and Technological Adoption, PRECESAM, Colegio de
Mexico.
23
ANNEX
Map of Mexico with its five main urban areas
2005
Source: INEGI (2005), II Conteo de Población y Vivienda.
Guadalajara, Jalisco
(4.1 million)
Monterrey,Nuevo
León (3.7 million)
Puebla, Puebla
(2.1 million)
Toluca, Estado de
México (1.6 million)
Ciudad de México
(19.2 million)

24
Annex Table 1. Total population of Mexican states, 2005
State Capital State
population State Capital
State population
1. Aguascalientes Aguascalientes 1 065 416 17. Nayarit Tepic 949 684
2. Baja California Mexicali 2 844 469 18. Nuevo León Monterrey 4 199 292
3. Baja California Sur La Paz 512 170 19. Oaxaca Oaxaca 3 506 821
4. Campeche Campeche 754 730 20. Puebla Puebla 5 383 133
5. Coahuila Saltillo 2 495 200 21. Querétaro Querétaro 1 598 139
6. Colima Colima 567 996 22. Quintana Roo Chetumal 1 135 309
7. Chiapas Tuxtla
Gutiérrez 4 293 459 23. San Luis Potosí
San Luis Potosí 2 410 414
8. Chihuahua Chihuahua 3 241 444 24. Sinaloa Culiacán 2 608 442
9. Durango Durango 1 509 117 25. Sonora Hermosillo 2 394 861
10. Guanajuato Guanajuato 4 893 812 26. Tabasco Villa Hermosa 1 989 969
11. Guerrero Chilpancingo 3 115 202 27. Tamaulipas Ciudad Victoria 3 024 238
12. Hidalgo Pachuca 2 345 514 28. Tlaxcala Tlaxcala 1 068 207
13. Jalisco Guadalajara 6 752 113 29. Veracruz Xalapa 7 110 214
14. Estado de México Toluca 14 007 495 30. Yucatán Mérida 1 818 948
15. Michoacán Morelia 3 966 073 31. Zacatecas Zacatecas 1 367 692
16. Morelos Cuernavaca 1 612 899
32. Federal District
Ciudad de México 8 720 916
Total = 103 263 388
Source: INEGI (2005), II Conteo de Población y Vivienda.
25
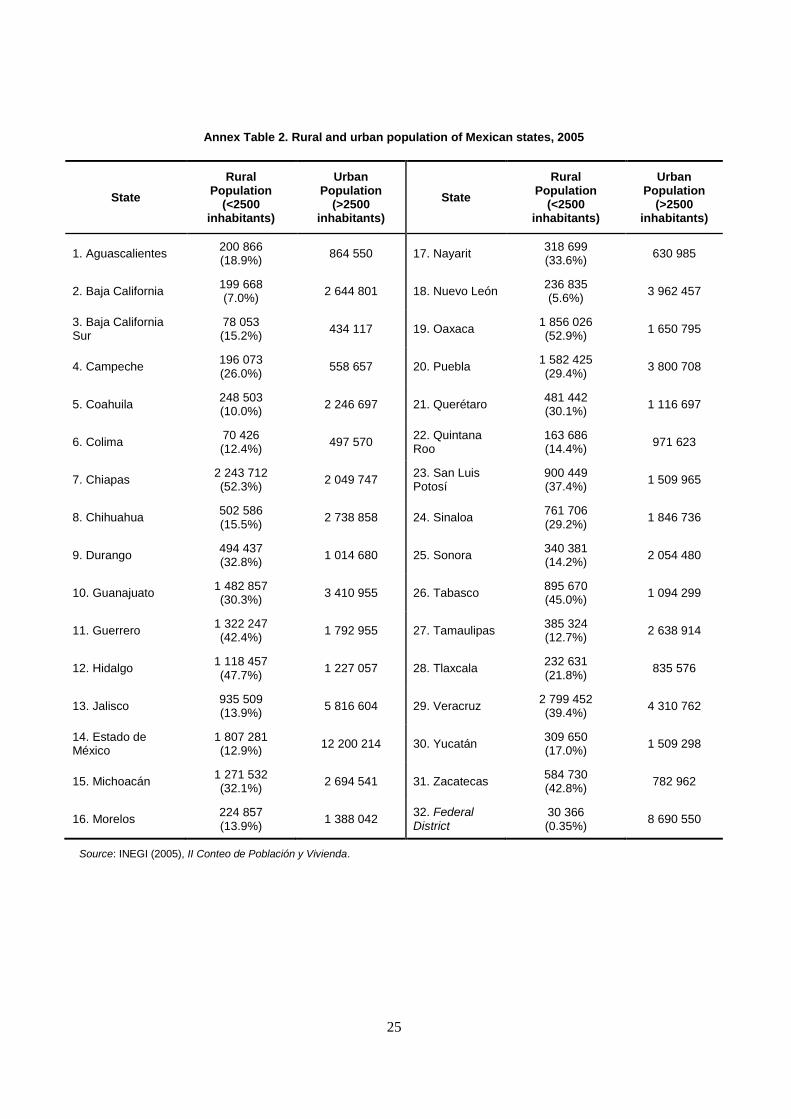
Annex Table 2. Rural and urban population of Mexican states, 2005
State
Rural Population
(<2500 inhabitants)
Urban Population
(>2500 inhabitants)
State
Rural Population
(<2500 inhabitants)
Urban Population
(>2500 inhabitants)
1. Aguascalientes 200 866 (18.9%)
864 550 17. Nayarit 318 699 (33.6%)
630 985
2. Baja California 199 668 (7.0%)
2 644 801 18. Nuevo León 236 835 (5.6%)
3 962 457
3. Baja California Sur
78 053 (15.2%)
434 117 19. Oaxaca 1 856 026 (52.9%)
1 650 795
4. Campeche 196 073 (26.0%)
558 657 20. Puebla 1 582 425 (29.4%)
3 800 708
5. Coahuila 248 503 (10.0%)
2 246 697 21. Querétaro 481 442 (30.1%)
1 116 697
6. Colima 70 426 (12.4%)
497 570 22. Quintana Roo
163 686 (14.4%)
971 623
7. Chiapas 2 243 712 (52.3%)
2 049 747 23. San Luis Potosí
900 449 (37.4%)
1 509 965
8. Chihuahua 502 586 (15.5%)
2 738 858 24. Sinaloa 761 706 (29.2%)
1 846 736
9. Durango 494 437 (32.8%)
1 014 680 25. Sonora 340 381 (14.2%)
2 054 480
10. Guanajuato 1 482 857 (30.3%)
3 410 955 26. Tabasco 895 670 (45.0%)
1 094 299
11. Guerrero 1 322 247 (42.4%)
1 792 955 27. Tamaulipas 385 324 (12.7%)
2 638 914
12. Hidalgo 1 118 457 (47.7%)
1 227 057 28. Tlaxcala 232 631 (21.8%)
835 576
13. Jalisco 935 509 (13.9%)
5 816 604 29. Veracruz 2 799 452 (39.4%)
4 310 762
14. Estado de México
1 807 281 (12.9%)
12 200 214 30. Yucatán 309 650 (17.0%)
1 509 298
15. Michoacán 1 271 532 (32.1%)
2 694 541 31. Zacatecas 584 730 (42.8%)
782 962
16. Morelos 224 857 (13.9%)
1 388 042 32. Federal District
30 366 (0.35%)
8 690 550
Source: INEGI (2005), II Conteo de Población y Vivienda.