The Risk Matrix as a tool for risk analysis Hanna Landell944825/FULLTEXT01.pdf · The Risk Matrix...
32
FACULTY OF ENGINEERING AND SUSTAINABLE DEVELOPMENT Department of Industrial Development, IT and Land Management The Risk Matrix as a tool for risk analysis - How to apply existing theories in practice in order to overcome its limitations Hanna Landell Year 2016 Student thesis, Master degree (one year), 15 HE Decision, Risk and Policy Analysis Master Programme in Decision, Risk and Policy Analysis Supervisor: Fredrik Bökman Examiner: Magnus Hjelmblom
Transcript of The Risk Matrix as a tool for risk analysis Hanna Landell944825/FULLTEXT01.pdf · The Risk Matrix...
FACULTY OF ENGINEERING AND SUSTAINABLE DEVELOPMENT
Department of Industrial Development, IT and Land M anagement
The Risk Matrix as a tool for risk analysis
- How to apply existing theories in practice in order to overcome its limitations
Hanna Landell
Year 2016
Student thesis, Master degree (one year), 15 HE Decision, Risk and Policy Analysis
Master Programme in Decision, Risk and Policy Analysis
Supervisor: Fredrik Bökman Examiner: Magnus Hjelmblom
The Risk Matrix as a tool for risk analysis - How to apply existing theories in practice in order to overcome
its limitations
by
Hanna Landell
Faculty of Engineering and Sustainable Development University of Gävle
S-801 76 Gävle, Sweden
Email:
Abstract Risk assessments which are part of the risk management process implies a systematic identification of risks and judgments of risk levels and are often used to create a foundation for decisions how to handle risks. Risk matrices are widely used as a tool within risk assessments. A number of articles have lately pointed out some weaknesses with the risk matrix, but also how it could be improved and how the weaknesses could be avoided. This paper describes how accepted theories have been applied in practical action in order to overcome the limitations of the risk matrix and improve the way of working with risk analyses within the studied organization. Despite the limitations the study finds the risk matrix to be a useful tool, but it should not be used in isolation and complementary techniques and tools are required.
Contents 1 Introduction .............................................................................................................. 1
1.1 Purpose ............................................................................................................................ 1 1.2 Demarcation .................................................................................................................... 1 1.3 Background ..................................................................................................................... 1 1.4 Approach ......................................................................................................................... 2
2 Method ...................................................................................................................... 2
3 Theoretical background .......................................................................................... 3
3.1 What is a risk? ................................................................................................................. 4 3.2 The risk management process.......................................................................................... 4 3.3 The quality of the risk analysis ........................................................................................ 5 3.4 Difficulties in analyzing the risks .................................................................................... 6 3.5 Debiasing ......................................................................................................................... 9 3.6 Methods for risk analysis and assessments .................................................................... 10 3.7 Risk matrices ................................................................................................................. 10
4 Empirics .................................................................................................................. 12
4.1 The company´s risk policy and risk matrix ................................................................... 12 4.2 Approach and execution of the risk assessment ............................................................ 16
5 Analysis ................................................................................................................... 18
5.1 Analyzing risks .............................................................................................................. 18 5.2 Using the risk matrix ..................................................................................................... 19 5.3 The quality of the risk analysis ...................................................................................... 20 5.4 Summary and discussion ............................................................................................... 20
6 Conclusion and proposed improvements ............................................................. 21
References ................................................................................................................... 22
Appendix A. Biases in decision and risk analysis .................................................... 24
Appendix B Questionnaire ..................................................................................... 28
1
1 Introduction Risks are often connected to some kind of a decision. A risk assessment, which is part of the risk management process, implies a systematic identification of risks and judgments of risk levels are often used as a tool to create a foundation for decisions how to handle risks (Davidsson et.al 2003 p 15-17, ISO 31000). There are a number of methods to support the risk assessment and they all have different strengths and weaknesses. What type of method to use is dependent on the type of operation and risks that is being investigated (Davidsson et.al 2003 p 15). Nevertheless it is not unusual within organizations to use standardized methods, guidelines and acceptance criteria for all types of risks within the company (Duijm 2015, Talbot 2011). Thus there are a number of uncertainties and complications when it comes to some of the methods and the use of them, which could have an impact on the quality of the analysis. A commonly used method for analyzing risks is the risk matrix, which also has its advantages and disadvantages. A number of articles have lately pointed out some weaknesses with the risk matrix, but also how it could be improved and how the weaknesses could be avoided (Duijm 2015, p 26 Cox 2008, Levine 2012, Ni et.al 2010).
This paper describes how the risk matrix is used as a tool for a risk analysis within Company X (see chapter 1.2) and how the author has used complementary tools and techniques based on earlier studies in order to overcome the limitations of the risk matrix and increase the quality of the risk analysis within the organization. The introduction describes the background, evocation and aim with the paper. The next chapter describes the method for collecting empirical material, discuss scientific requirements such as objectivity and validity etc. as well as the general concept of the risk analysis. Chapter 3 and 4 describes the risk matrix as a method with its pros and cons and theories for how to overcome its limitations. Furthermore it is described how the risk matrix has been used and adjusted within this study, based on theories and proposed best practices for how to overcome the weaknesses. The last chapter concludes the study and evaluates if the adjusted way of working with, and the changes to, the risk matrix have had any effect on the quality of the performed risk analysis.
1.1 Purpose
The aim with the paper is to describe how accepted theories could be applied in practical action in order to improve tools like the risk matrix and the way of working with risk analyses within the studied organization. In addition, the aim is also to evaluate if the applied way of working and the modifications made have improved the quality of how to perform risk analysis within the organization.
1.2 Demarcation
This study will not evaluate and discuss other tools that could be used instead of the risk matrix. The studied organization is using the risk matrix as a part of its risk management process and this study does not aim to challenge this.
1.3 Background
The background to this paper is the assignment given to the author of this paper by the organization she is working within. The company is a high-tech and global engineering group, divided into five different business areas with about 46000 employees. In this paper the company will be referred to as Company X or the studied organization. The author of this paper is working as a Program Office Manager within a large program that consists of a number of projects. The program mission is to
2
replace a number of different IT solutions to a common IT platform for the different brands and functions within this global organization. To implement an ERP system (Enterprise Resource Planning) is quite often a huge and complex assignment which includes a number of risks. In addition to the ordinary project risk assessments that the projects within the program is performing, in order to manage and reduce the project risks, it was decided that a risk analysis of the business risks linked to a go-live with the new system should be performed. The purpose with the risk analysis was to define the risks and mitigations to those risks related to a go-live with the new IT solution for the Supply Chain function (distribution centers, DCs) and the different Product Areas (PA) within the organization. The output from the analysis should be used to prepare the project and the organization in the best possible way. It should also be used as input to create the go-live criteria. When starting the assignment it became clear that the existing guide lines, standards and tools for risk analysis within the organization did not fit the purpose for this type of risk analysis.
1.4 Approach
Before starting the risk analysis a number of articles and literature about risk analysis including tools and best practices were studied. With that as background a strategy was set, workshops planned and the organization´s risk matrix was modified. Four workshops were held, one for each PA and one for the distribution centers. Also a fifth workshop was carried out with project members with the main objective to focus on mitigations for the identified risks. The PA representatives were only part of the risk workshop related to their PA, while some key project resources were part of several or all workshops. Between the different workshops some modifications and improvements were made, based on lessons learned. This interaction between the “researcher” and participants creates learning in the collective work. This could be compared with what according to Svensson et al. (2002, p 11-12) is called interactive research. To research with the concerned creates common knowledge and aims to both create theoretical insight and practical, useful knowledge (ibid).
2 Method Methods are tools that should ease the work when something is being investigated and according to Denscombe (2009, p184) it is important to choose the right tool in relation to the aim, objectives and questions at issue. It is a matter of having everything on it´s appropriate place (ibid). The aim of this study is not to generate new theories. It is focused on applied research to develop useful approaches within the studied organization. This type of research is called action research and could be seen as more of a strategy than a method. This study also includes a case study and could therefore be seen as an action research case study. There are, according to Denscombe (2009 p 170), four general characteristics that define the action research:
• Practical orientation; it´s aim is to tackle “real” problems, mainly at workplaces and organizational environments.
• Change; is seen as an integrated part of the research, both as a way to handle practical problems and as a mean to get better knowledge about appearances.
• Cyclic process; the research includes a mechanism for feedback, where the initial results gives possibilities to changes that are being applied and evaluated as a starting point for continuous investigations.
• Involvement; the participants are central in the research process and they are actively contributing.
The characteristic for a case study is its focus on only one (or a few) research unit (s). It emphasizes the depth of a study instead of width, the special more than the general,
3
a natural environment instead of artificial and several sources rather than one research method (Denscombe 2009 p 59-62).
Verifying the data is a central part of qualitative research and is about showing that the results are proper and reasonable. According to Denscombe (2009, 378-379) there are four cornerstones to judge research quality; validity, reliability, generalizability and objectivity. Validity is about to what extent the research data and methods to collect the data is regarded to be exact, proper and accurate. This could be hard in qualitative research, but there are measures to demonstrate that the data with reasonable probability are accurate and exact (ibid.). A case study should have its starting point in specific attributes that could be found in the case and these attributes should be significant for the practical problem or question the researcher would like to investigate (Denscombe 2009 p 64). The reliability is describing the accuracy of the measurement. The reliability is high if repeating measures gives the same results (Lisper & Lisper 2005, p 60). Generalizability is about if it is possible to apply the result of the research to similar situations and phenomenon (Denscombe 2009, p 379). Objectivity means that the research should be neutral, independent and the result should not be biased by influence from the researcher (ibid). In action research it could be hard to meet these requirements, yet this does not mean that the scientific requirements are allowed to be compromised. Action research could use existing theories, apply and try out research suggestions and use appropriate methods. Action research could offer evaluation of existing knowledge and instead of speaking about generalizability it could be described as transferability, how possible it is to transfer the result of the research to other situations (Denscombe 2009, p 179-181). Transferability can be reached if the pattern in the study is recognized in other cases and if different situations, processes or phenomenon can be understood with the help of the interpretations made in the study (ibid). Action researchers cannot be seen as objective and impartial to the research, therefore it is important to be transparent and reflect the procedures and results in order for other researchers to follow and judge whether respected procedures has been followed and if the results are reasonable (Denscombe 2009, p 381). In order to be as objective as possible and meet the scientific quality requirements for validity and reliability, the foundation for this risk analysis, the tools and techniques used and tried out are based on best practice from literature and recent research within this area. Although the researcher in this case is employed by the organization and working within the specific program this project belongs to she could be seen as objective from the perspective that she has no personal interest in the result, except that it should be as accurate as possible.
The concept of risk analysis in itself does also require the process to be relevant and transparent (Davidsson et.al 2003, p157), which is the same as the scientific requirements. When it comes to analyze the quality of this particular risk assessment, the result is based on questionnaires answered by the participants in the workshops and statements from the client ordering the risk assessment. The questionnaire was constructed to give qualitative data with open questions in order to make sure that the responses was not controlled or influenced by the questions. The questions were tested on a few people before in order to make sure they were relevant and easy to understand. How possible it is to transfer the result into other situations or organizations will be discussed in the end of the paper.
3 Theoretical background This chapter begins with a short description of risks and the risk management process, followed by complications connected to performing risk assessments. Furthermore the risk matrix as a tool for analyzing risks and methods/techniques to assure the quality in risk assessments are discussed. There is a lot of research in this area including a number of different perspectives and theories. This report does not cover all or
4
summarize them, it describes the perspectives that have been the foundation for how to perform the risk analysis and improve the way of working with risks within the studied organization.
3.1 What is a risk?
To be able to identify risks it is required that we have a common understanding of what a risk is. There is no unanimous definition of a risk, but it is common to define a risk as a combination of a chance event with negative consequences and the probability for that event (Sjöberg & Thedéen in Grimvall et. al 2012, p 17). In general, the risk definition is built on two aspects; the value aspect (the consequences type and seriousness) and the chance aspect (the chance that they occur) (Persson in Boholm et. al 2005, p 17). A problem with the definition is that it does not cover all aspects of risks. There are a number of factors that are not incorporated, such as free will, perceived control, knowledge and potential of catastrophic consequences. Yet, the definition has characterized many approaches within field of risks (Persson in Boholm et. al 2005, p 18-19). Also in the ISO 31000 the definition of risk is discussed and the conclusion is that it is about effect of uncertainty on objectives (ISO 2010 IEC/ISO 31010:2009, p 6). In the introduction to the standard, risks are explained as the consequence of an organization setting objectives against an uncertain environment. The uncertainty comes from both internal and external factors that the organization does not completely control and which may impact the organizations ability to achieve its objectives or cause delay in doing so (ibid). The most important thing is how useful the definition is for our understanding of risks and the ability to solve the risk problems we are interested in (Persson in Boholm et. al 2005, p 18-19). Therefore we need to understand that how we see risks differ between different people. This is called risk perception and is about how we perceive, evaluate and understand risks (Davidsson et.al 2003, p 25). Even if the risk definition is built on the value and chance aspects there are a number of other factors that should be considered. The level of free will and knowledge about the origin of the risk affects how we perceive risks. In general we have a higher acceptance for risks that we have good knowledge about, control of and a high degree of free will for, than for risks with converse circumstances. Risks that have a potential to produce large consequences are often seen as more risky than risks where the consequences are realized in several accidents, but with smaller consequences (ibid). Risks are assessed different by different people and there is also a difference between how women and men perceives risks, where women perceive general risks as bigger, but it is more equal when it comes to personal risks (Sjöberg & Thedéen in Grimvall et. al 2012, p 18-25). Studies have also shown that people in projects deliberately overestimate the benefits of the project, and at the same time they underestimate risks and uncertainties (de Bakker, 2009). Other aspects that have an impact on how we perceive risks have to do with how obvious the risks are, but also feelings have an impact (Persson in Boholm et. al 2005, p 27). If we like an activity we tend to judge the risk connected to that activity as low and the utility as high, and the higher utility we perceive, the lower we consider the risk to be (ibid). This is called heuristics and explains how different feelings and impressions affects our judgments and decisions, the result can be biased (Persson in Boholm et. al 2005, p 27, Clemen & Reilly 2014, s 330). Heuristics and biases will prove to be important in the practical part of this analysis.
3.2 The risk management process
There are many different definitions of risk and of the risk management process, many times using the same words but have different meanings (Purdy 2010). By creating a standard that would be applicable to all forms of risk, the ISO 31000 aims to achieve consistency and reliability in risk management. It includes one vocabulary, a set of performance criteria, one common overarching process for identifying, analyzing,
5
evaluating and treating risks. In addition it also includes guidance on how that process should be integrated into the decision-making processes of any organization (ibid). The risk management process starts with establishing the context. That means definition of objectives and scope, defining what the organization would like to achieve including factors that may influence success in achieving those objectives (Davidsson et.al 2003, p 53, ISO 2010 IEC/ISO 31010:2009). In addition it includes setting the risk criteria, which involves deciding:
• the nature and types of consequences to be included and how they will be measured
• the way in which probabilities are to be expressed • how a level of risk will be determined • the criteria by which it will be decided when a risk needs treatment • the criteria for deciding when a risk is acceptable and/or tolerable • whether and how combinations of risks will be taken into account
(ISO 2010 IEC/ISO 31010:2009, p 10)
This is a preparation for the risk assessment that according to the standard includes three steps; risk identification, risk analysis, and risk evaluation. Risk identification implies a systematic identification of risks to understand what could happen, how, when, and why. Risk analysis is about creating an understanding of each risk, its consequences and the likelihood of those consequences (ibid). Risk evaluation is about making a decision about the level of risk and the priority for attention to the risks. Risk treatment comes after the assessment and involves evaluation of and selection from options on if/how to manage the risk. This includes analysis of costs and benefits, but also assessment of new risks that might be generated by each option (ISO 2010 IEC/ISO 31010:2009).
An important purpose with the risk assessment is that it should work as a tool to identify risk sources and risky situations that could lead to an unwanted situation (Davidsson et.al 2003, Montibeller & von Winterfeldt 2015). It should also be possible to use it as a base for information and discussions with representatives for groups that are affected by the decisions that can be taken, as well as being a tool to anchor decisions in the organization (Davidsson et.al 2003 p 17). According to Purdy (2015) risk assessments can be qualitative, quantitative or semi quantitative and ISO 31000 does not express a preference for neither of them as all have a role. Risk assessment is a complex area and is substantially about to interweave knowledge from different areas of expertise (Holmgren & Thedéen in Grimvall et al. 2012, p 271).
Although there are standards to assure that accepted methods, check lists, definitions etc. are being used, it does not replace the knowledge that is required about what should be analyzed. Different expertise is required and examples of competences that might have to be represented are statistics and probability theory, behavioral science, economy and expertise within the area that is about to be analyzed (ibid).
3.3 The quality of the risk analysis
The quality of the risk analysis could according Davidsson et.al 2003 be reflected by its usability. By this they mean how well the risk analysis fulfills defined objectives and demands. There are a number of factors that could impact the quality and mistakes that are made in the early phases often have a big impact on the continuous development of the analysis and could have a big impact on the end result. These mistakes are often hard to rectify (Davidsson et.al 2003, p 156). There are a number of methods to support the risk analysis and they all have different strengths and weaknesses. What type of method to use is dependent on the type of operation and risks that is being investigated (Davidsson et.al 2003, p 53-54).
A risk assessment should according to the ISO 31010 standard answer the following questions:
• What can happen and why?
6
• What are the consequences? • What is the probability that they will occur? • Is there a way to minimize the consequences and/or reduce the probability
that it occurs? • Is the risk level acceptable or are further actions required?
(ISO 2010 IEC/ISO 31010:2009, p 6)
Another quality aspect is to ensure that the analysis and decision process is transparent, based on best knowledge and that it reflects a common understanding of the stakeholders (Duijm 2015, p 22). The ISO 31010 standard points out that there should be a clear explanation of the terms employed and the basis for all criteria should be recorded in a qualitative risk analysis.
3.4 Difficulties in analyzing the risks
As earlier stated the risk analysis involves consideration of the sources and causes of risks (triggers), their consequences and the probability that those consequences occur. It is therefore also important to identify factors that could affect the consequences and probabilities (ISO 2010 IEC/ISO 31010:2009, p 12). A consequence analysis is important for defining the type of impact a particular event could have if it occurs. One risk could have impact of different magnitudes and affect a range of different objectives or stakeholders. The analysis can vary from a simple description of outcomes to detailed quantitative modeling (ibid). Probabilities are often harder to assess than the consequences (Holmgren & Thedéen in Grimvall et. al 2012, p 258) and studies have shown that decision makers in general often make irrational judgments of risks:
• A mitigating action is valued more if it totally eliminates a small risk, than if it reduces a bigger risk in a corresponding way
• Risks that are visualized in a dramatic way and are discussed in media appear as more worrying.
• Risks that occur with small probability and have a big negative consequence (e.g. nuclear accidents or flight crashes) are more worrying than risks that have a high probability of occurrence with comparatively smaller consequences (e.g. drinking, smoking).
• Risks created by humans are more worrying than natural risks.
(Löfstedt in Boholm et al 2005, p 169).
Despite the existing methods it is according to Clemen & Reilly (2014) hard to think in terms of probability and we quite often make use of primitive techniques when we judge probabilities (Clemen & Reilly 2014, s 330). These techniques are called heuristics and can be seen as mental shortcuts or cognitive traps. Some examples are rule of thumb, a sophisticated or intuitive guess or common sense (ibid). These are intuitive and simple techniques to handle uncertainty and are quite useful, but they could also result in probability judgments that are biased in different ways depending on the technique used (Tversky & Kahneman 1974, p 1124). When people make probability judgments, they are doing it based on the knowledge and information that they have, but because of the heuristics it is easy to make false judgments (ibid). When the assessments are altered by heuristics they reduce the quality of the model and analysis, as the result is biased. Tversky & Kahneman (1974) describe three heuristics that are used to predict values and assess probabilities; representativeness, availability, adjustment and anchoring. These heuristics can lead to a number of biases. This does also apply when we are using input from experts to the risk assessments (ibid). Most biases are individual and can be reduced or increased on group level (Montibeller & von Winterfeldt 2015, p 1230). Some biases are easier to
7
correct than others and those that are harder to correct seem to be resistant towards logic, decomposing, tools and education (ibid).
There are a number of biases that commonly occur and that could be reduced or avoided with training, methods and techniques (Montibeller & von Winterfeldt 2015, Clemen & Reilly 2014, Duijm 2015). There are also a number of biases that can be corrected by decomposing the task or using logic (ibid). The below (Table 1 and 2) identified biases are examples of biases that according to Montibeller & von Winterfeldt (2015) and Clemen & Reilly (2014) are relevant for decision and risk analysis because they can distort the inputs to the analysis (full table available in appendix A). Montibeller & von Winterfeldt (2015) see some of the biases as less relevant as they can be corrected by what they consider to be usual tasks of eliciting inputs (Montibeller & von Winterfeldt 2015 p 1231). However some of them are included in this paper as they are relevant to the study at hand. The participants in the workshops did not possess that kind of knowledge and to be able to correct and avoid them, you have to know that they exist.
There are different types of biases, cognitive and motivational biases:
A cognitive bias is a systematic discrepancy between the “correct” answer in a judgmental task, given by a formal normative rule, and the decision maker’s or expert´s actual answer to such a task.
We define motivational biases as those in which judgments are influenced by the desirability or undesirability of events, consequences, outcomes, or choices.
(Montibeller & von Winterfeldt 2015 p 1231)
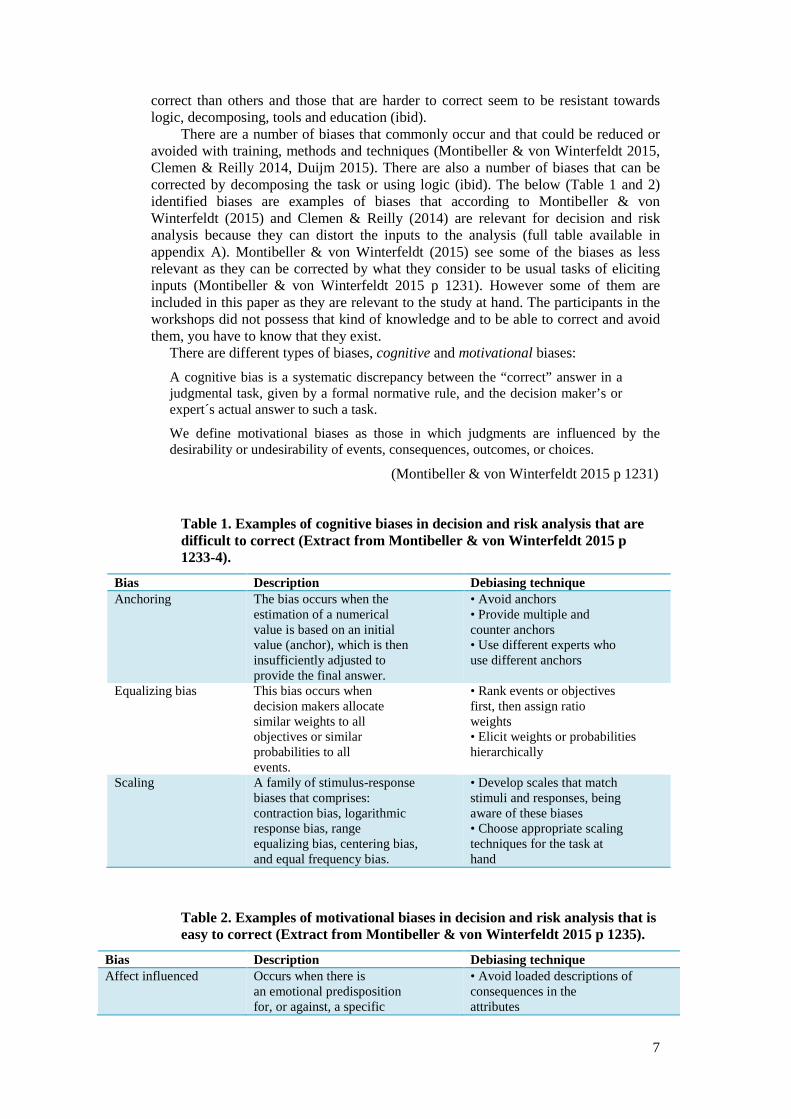
Table 1. Examples of cognitive biases in decision and risk analysis that are difficult to correct (Extract from Montibeller & von Winterfeldt 2015 p 1233-4).
Bias Description Debiasing technique Anchoring
The bias occurs when the estimation of a numerical value is based on an initial value (anchor), which is then insufficiently adjusted to provide the final answer.
• Avoid anchors • Provide multiple and counter anchors • Use different experts who use different anchors
Equalizing bias
This bias occurs when decision makers allocate similar weights to all objectives or similar probabilities to all events.
• Rank events or objectives first, then assign ratio weights • Elicit weights or probabilities hierarchically
Scaling A family of stimulus-response biases that comprises: contraction bias, logarithmic response bias, range equalizing bias, centering bias, and equal frequency bias.
• Develop scales that match stimuli and responses, being aware of these biases • Choose appropriate scaling techniques for the task at hand
Table 2. Examples of motivational biases in decision and risk analysis that is easy to correct (Extract from Montibeller & von Winterfeldt 2015 p 1235).
Bias Description Debiasing technique Affect influenced
Occurs when there is an emotional predisposition for, or against, a specific
• Avoid loaded descriptions of consequences in the attributes
8
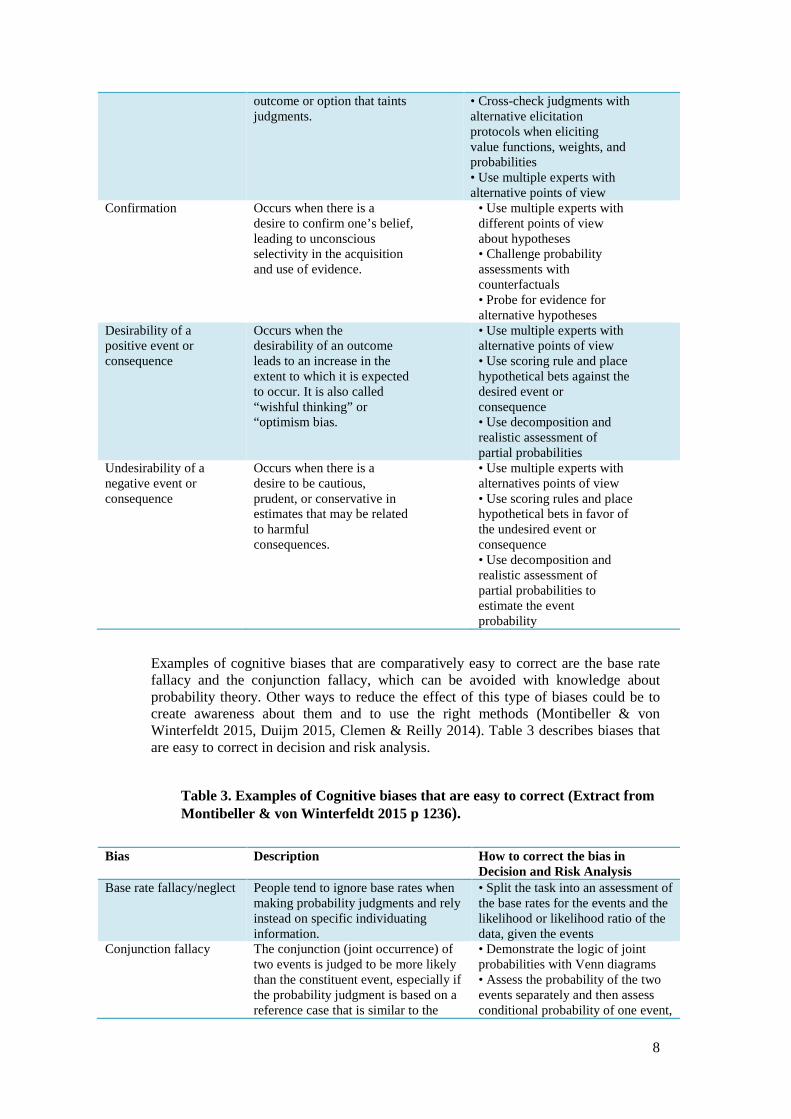
outcome or option that taints judgments.
• Cross-check judgments with alternative elicitation protocols when eliciting value functions, weights, and probabilities • Use multiple experts with alternative points of view
Confirmation
Occurs when there is a desire to confirm one’s belief, leading to unconscious selectivity in the acquisition and use of evidence.
• Use multiple experts with different points of view about hypotheses • Challenge probability assessments with counterfactuals • Probe for evidence for alternative hypotheses
Desirability of a positive event or consequence
Occurs when the desirability of an outcome leads to an increase in the extent to which it is expected to occur. It is also called “wishful thinking” or “optimism bias.
• Use multiple experts with alternative points of view • Use scoring rule and place hypothetical bets against the desired event or consequence • Use decomposition and realistic assessment of partial probabilities
Undesirability of a negative event or consequence
Occurs when there is a desire to be cautious, prudent, or conservative in estimates that may be related to harmful consequences.
• Use multiple experts with alternatives points of view • Use scoring rules and place hypothetical bets in favor of the undesired event or consequence • Use decomposition and realistic assessment of partial probabilities to estimate the event probability
Examples of cognitive biases that are comparatively easy to correct are the base rate fallacy and the conjunction fallacy, which can be avoided with knowledge about probability theory. Other ways to reduce the effect of this type of biases could be to create awareness about them and to use the right methods (Montibeller & von Winterfeldt 2015, Duijm 2015, Clemen & Reilly 2014). Table 3 describes biases that are easy to correct in decision and risk analysis.
Table 3. Examples of Cognitive biases that are easy to correct (Extract from Montibeller & von Winterfeldt 2015 p 1236).
Bias Description How to correct the bias in
Decision and Risk Analysis Base rate fallacy/neglect
People tend to ignore base rates when making probability judgments and rely instead on specific individuating information.
• Split the task into an assessment of the base rates for the events and the likelihood or likelihood ratio of the data, given the events
Conjunction fallacy The conjunction (joint occurrence) of two events is judged to be more likely than the constituent event, especially if the probability judgment is based on a reference case that is similar to the
• Demonstrate the logic of joint probabilities with Venn diagrams • Assess the probability of the two events separately and then assess conditional probability of one event,

9
conjunction given the other event Conservatism In some Bayesian estimation tasks,
people do not sufficiently revise their probabilities after receiving information about the events under consideration
• Decompose the task into an estimation of prior probabilities (odds) and likelihood (ratios)
Sub additivity/super additivity of probability
When judging individual sub events, the sum of the probabilities is often systematically smaller or larger than the directly estimated probability of the total event. This is true even for mutually exclusive events
• Explain the logic of additivity of mutually exclusive events • Also, one can begin by obtaining ratios of the probabilities of sub events and applying the ratios to the probability of the total event
3.5 Debiasing
As stated in the above tables there are a number of activities, techniques and tools for debiasing such as providing probability training, using multiple experts, counterfactuals, hypothetical gambles, and fixed value techniques etc. Also Duijm (2015) points out that it is not that easy to overcome some of these biases, but he suggests training and to use the right methods and if possible make use of quantitative data (Duijm 2015, p 25). According to Clemen & Reilly (2014, p 319) there are three fundamental ways to make subjective probability judgments. One way is simply to ask the decision maker/expert of his/her belief regarding the probability of that a specific event will occur. The person might or might not be able to answer and may place little confidence in the given answer. Another method is to ask the decision maker/expert about the bets he/she is willing to place. The idea is to find a level of winning or losing that makes the person indifferent about which side of the bet to choose. From this it is possible to get the persons subjective probability (ibid). Although this method is quite straight forward it has some limitations. Some people do not like the idea of placing bets and neither the risk of losing money, even when it comes to small amounts (Clemen & Reilly 2014, p 321). In order to get around the problem there is a third method. The decision maker/expert gets to compare two lottery-like games. As an example we can ask the person about the probability that Sweden wins the ice-hockey world championship next year. Let the person compare the lottery:
Win prize A if Sweden win Win prize B if Sweden loose
with the lottery: Win prize A with known probability p Win prize B with probability 1 – p
The lottery is set up so that A is preferred before B. In this case a trip to Hawaii (A) or a free beer (B). Lottery two is the reference lottery where the probability p for winning in the reference lottery is adjusted until the person is indifferent between the two lotteries. To find p that makes the person indifferent you start with p1 and ask which lottery that is preferred. If the person prefers the reference lottery, then p1 is too high. He/she believes that the chance of winning in the reference lottery is higher. If that is the case you should choose a p2 that is lower and ask again. When the person is indifferent between the lotteries, then p is the same as his/her subjective belief that Sweden will win the world championships. It is important to start wide and slowly adjust p in order to give the person plenty of time to consider his/her probability assessments (Clemen & Reilly 2014 p 321-322).
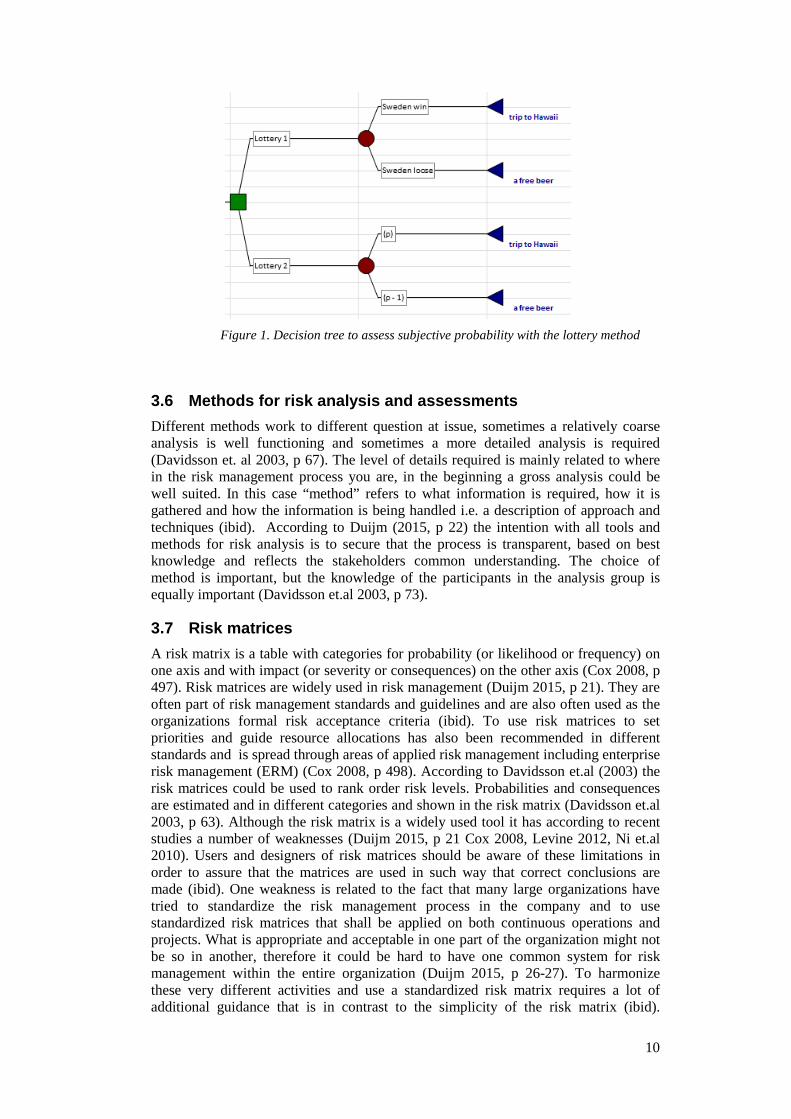
10
Figure 1. Decision tree to assess subjective probability with the lottery method
3.6 Methods for risk analysis and assessments
Different methods work to different question at issue, sometimes a relatively coarse analysis is well functioning and sometimes a more detailed analysis is required (Davidsson et. al 2003, p 67). The level of details required is mainly related to where in the risk management process you are, in the beginning a gross analysis could be well suited. In this case “method” refers to what information is required, how it is gathered and how the information is being handled i.e. a description of approach and techniques (ibid). According to Duijm (2015, p 22) the intention with all tools and methods for risk analysis is to secure that the process is transparent, based on best knowledge and reflects the stakeholders common understanding. The choice of method is important, but the knowledge of the participants in the analysis group is equally important (Davidsson et.al 2003, p 73).
3.7 Risk matrices
A risk matrix is a table with categories for probability (or likelihood or frequency) on one axis and with impact (or severity or consequences) on the other axis (Cox 2008, p 497). Risk matrices are widely used in risk management (Duijm 2015, p 21). They are often part of risk management standards and guidelines and are also often used as the organizations formal risk acceptance criteria (ibid). To use risk matrices to set priorities and guide resource allocations has also been recommended in different standards and is spread through areas of applied risk management including enterprise risk management (ERM) (Cox 2008, p 498). According to Davidsson et.al (2003) the risk matrices could be used to rank order risk levels. Probabilities and consequences are estimated and in different categories and shown in the risk matrix (Davidsson et.al 2003, p 63). Although the risk matrix is a widely used tool it has according to recent studies a number of weaknesses (Duijm 2015, p 21 Cox 2008, Levine 2012, Ni et.al 2010). Users and designers of risk matrices should be aware of these limitations in order to assure that the matrices are used in such way that correct conclusions are made (ibid). One weakness is related to the fact that many large organizations have tried to standardize the risk management process in the company and to use standardized risk matrices that shall be applied on both continuous operations and projects. What is appropriate and acceptable in one part of the organization might not be so in another, therefore it could be hard to have one common system for risk management within the entire organization (Duijm 2015, p 26-27). To harmonize these very different activities and use a standardized risk matrix requires a lot of additional guidance that is in contrast to the simplicity of the risk matrix (ibid).

11
Although the ISO 31000 aims to harmonize and standardize risk management it also advises that; the way in which consequences and likelihood are expressed and the way in which they are combined to determine a level of risk should reflect the type of risk, the information available, and the purpose for which the risk assessment output is to be used. These should all be consistent with the risk criteria (ISO 2010 IEC/ISO 31010:2009, p 17, Purdy 2015).
According to Talbot (2011) risk matrices also often have inadequate probability and consequence definitions and in addition to that, users often try to use them to assess poorly defined risks. In the risk matrices the combination of probability and consequences are often compiled in a limited number of categories visualized with different colors. The colors are usually green, yellow and red representing low, medium and high risks. These derive from the risk scores given from the combination of probability and consequence (Duijm 2015, p 22, Cox 2008, p 497). A problem with this is that different combinations of probability and consequence can give the same risk score and color and makes different risks to end up in the same cell. A risk with low probability and high impact could get the same score as a risk with high probability and low impact (ibid). If there are two risks with the same rating it is not possible to choose among them based on the risk matrix. According to Cox (2008) we can then assume that there is a 50-50 chance to make the right decision, this also mean that there is a 50% error probability (Cox 2008, p 499). In many cases it might not be necessary to obtain a single ranking of the risks, but the designer of the risk matrix should be aware of the consequences of the resolution and scaling (Duijm 2015, p 26). The ISO 31010 standard observes with respect to the resolution:
• The consequence scale should cover the range of different types of consequence to be considered (…) and should extend from the maximum credible consequence to the lowest consequence of concern.
• The probability scale needs to span the range relevant to the study in hand, remembering that the lowest probability must be acceptable for the highest defined consequence, otherwise all activities with the highest consequence are defined as intolerable.
(ISO 2010 IEC/ISO 31010:2009, p 83)
Talbot (2011) consider that the most critical aspects for a successful usage of risk matrices are exactly clear defined risks and robust definitions of likelihood and consequences. If those circumstances are at place there is a good possibility to get the same or equal judgments from experts in independent assessments (ibid). It should be mentioned that all risk analyses, except those based on statistical analysis and mathematical consequence assessments require that some kind of subjective assessment is made (Duijm 2015, p 25). Subjective assessments can as earlier stated be subject to a number of cognitive biases, which could be individual, unpredictable or partly unpredictable (ibid). This could lead to incorrect judgments and then to worse than random decisions (Talbot 2011). Despite its limitations, Talbot considers the risk matrices to be practical and useful tools that rightly used promote a robust discussion around risks, contribute to consistency when prioritizing risks and help to keep the participants in a facilitated workshop on the right track. The risk matrix could, with experienced practitioners leading the way, be effective for getting appropriate results in a facilitated workshop (ibid). We are often forced to make decisions under substantial uncertainty and it is important to remember the intention with the risk matrix (Talbot 2011). We are usually not aiming to generate precise estimates of the risks or judge their potential consequence in great detail. When using a risk matrix we are often interested in judging and prioritizing a list of risks. When there are too many risks there is a need to categorize them and identify the most important ones in order to first focuses on those that are most urgent. Risk matrices are tools that support decisions and not a tool for decision making (ibid). Furthermore Talbot considers risk matrices to be invaluable tools for organizations that aim for a prompt, effective and practical risk assessment, but they cannot be used in isolation. Much of the critics
12
against risk matrices are related to the attempts to use them without adapting them to the operation and risks that are being investigated (Talbot 2011). Despite its limitations also Duijm (2015) reluctantly consider the risk matrix to be a tool that could be useful, but mainly when it is not possible to use a quantitative method (Duijm 2015, p 30). He considers the risk matrix to be a quite simple method, but as they are extensively applied he highlight some of the difficulties with the method to make users, designers and decision makers aware of these difficulties (ibid).
4 Empirics This chapter starts with describing the studied organization´s risk policy and risk matrix. Furthermore it describes how this particular risk assessment was planned, performed and the tools/techniques used. In addition it also describes the modifications made to these tools.
4.1 The company´s risk policy and risk matrix
The studied organization has an Enterprise Risk Management Policy (ERM) with the aim to establish a systematical and integrated approach for ERM within the whole organization. According to the policy an effective ERM supports the managements approach to identify measure, respond to, monitor and report risks that affects the possibility to reach strategic, operative and financial objectives (the organization´s ERM Policy 2016). The policy includes business risks such as market and industrial risks, commercial risks related to how the organization performs its business activities and operative risks related to how business area responsible and management organizes their business. It also includes risks related to observance to laws, agreements and policies as well as financial risks and one time risks related to change initiatives, mergers and acquisitions. According to the policy, the organization´s ERM is not intended to replace other analyses that are required according to law or established practice, the most adequate method should always be used. Although, the organization´s ERM method should always be used if a risk analysis is clearly linked to the area for ERM. A method that is compatible with the organization´s ERM could be used if it enables reporting in line with the ERM principles (the organization´s ERM Policy 2016). A standardized risk matrix that should be used for the risks that are within the frame of ERM is provided as a tool for risk assessments. For IT risks it is called ERM IT Risk Assessment Tool. The matrix in itself is the same for all kind of risks, what differs between the IT risk matrix and other areas is one page specifying standard IT risks that could occur. In addition to the ERM policy and risk assessment tool there is a guideline and a power point presentation to be used to support when facilitating risk assessment workshops. The guideline contains instructions for how to define the scope, plan the workshop, develop risk improvement actions, implementation and follow up, but none of these supporting documents includes a definition of risk. Instead it describes the concept of risk scenario. Vulnerability (how, what), triggers and consequences together form a risk scenario. The guideline is a good help for a facilitator of a risk workshop, but it does not discuss or describe any of the difficulties when performing risk assessments e.g. different aspects of risks, biases and how to avoid them etc. It only emphasizes that the facilitator should have knowledge in the ERM process.
This particular risk assessment concerned business risks related to changing a core IT system and included all PA´s and the Supply Chain function within a Business Area, therefore the aim was to use the ERM risk matrix. The matrix was therefore tried out with a few people before starting to use it. It was found out that the risk matrix would not fit the type of risks that was going to be considered in this risk assessment. For example; the scale for consequences was limited to four categories and they did not suite the type of risks that was to be considered. Even though
13
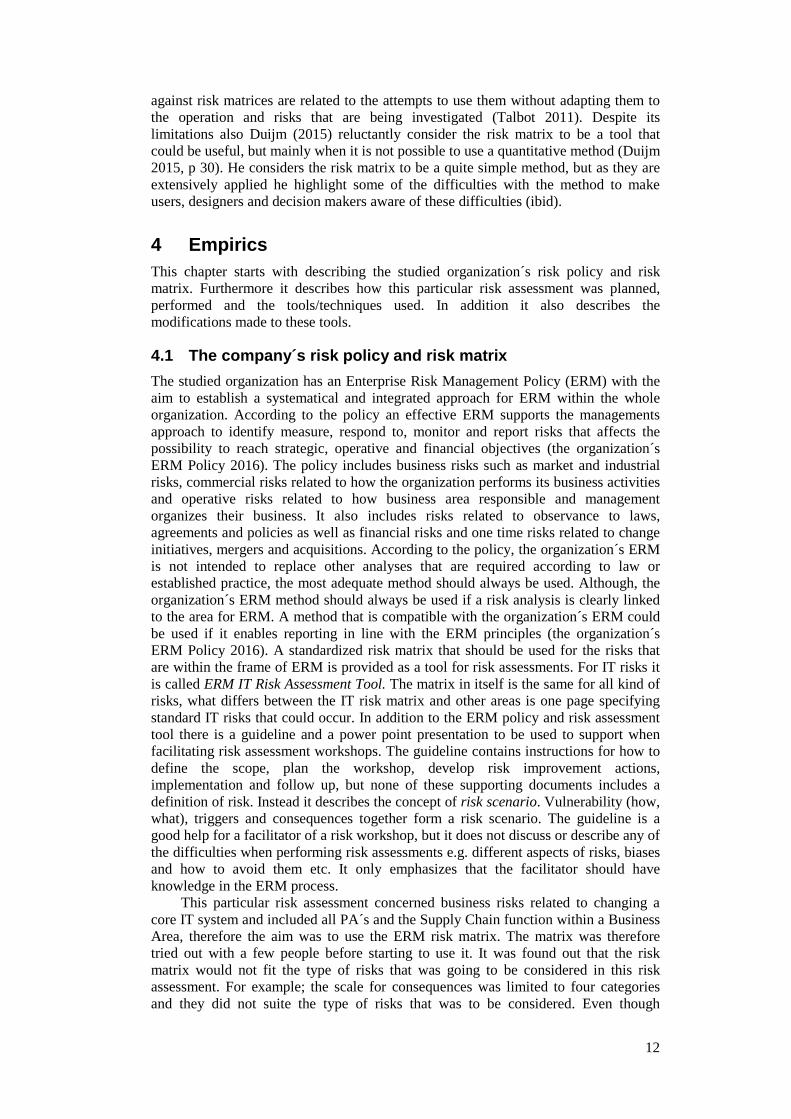
implementing a new ERP system is a high risk activity, it is not probable that very many of the risks would have a big impact of the whole organization´s EBIT (Earnings before interest and taxes). Of course if there would be severe issues with the new system it could have a significant impact on EBIT in the end, but that is a too high level risk to assess. It would not give any value. To use the proposed scale for consequences/impacts when assessing the risks would mean that the main part of the identified risks would be classified as level 1 (minor). In addition it would be very cumbersome to assess the financial impact of the risks. There is also an ordinal description of the scale, General Impact, which might have been possible to use (see Figure 2).
Figure 2. ERM IT Risk Assessment Tool
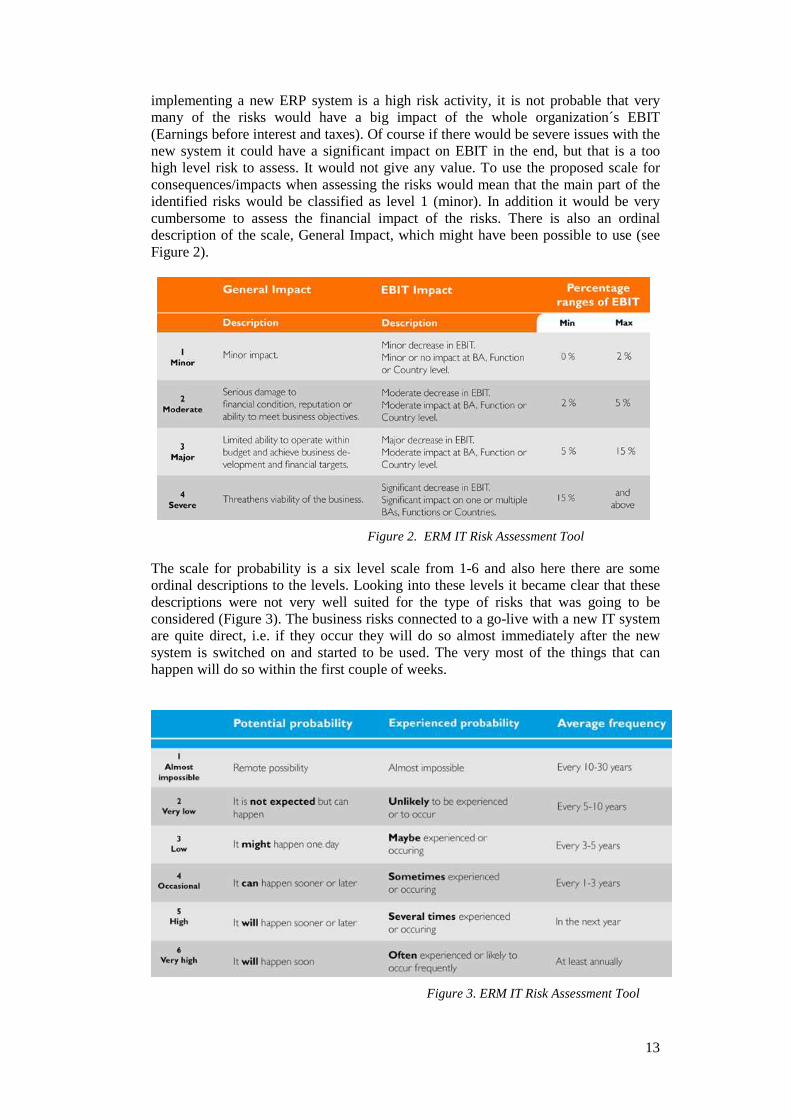
The scale for probability is a six level scale from 1-6 and also here there are some ordinal descriptions to the levels. Looking into these levels it became clear that these descriptions were not very well suited for the type of risks that was going to be considered (Figure 3). The business risks connected to a go-live with a new IT system are quite direct, i.e. if they occur they will do so almost immediately after the new system is switched on and started to be used. The very most of the things that can happen will do so within the first couple of weeks.
Figure 3. ERM IT Risk Assessment Tool
14
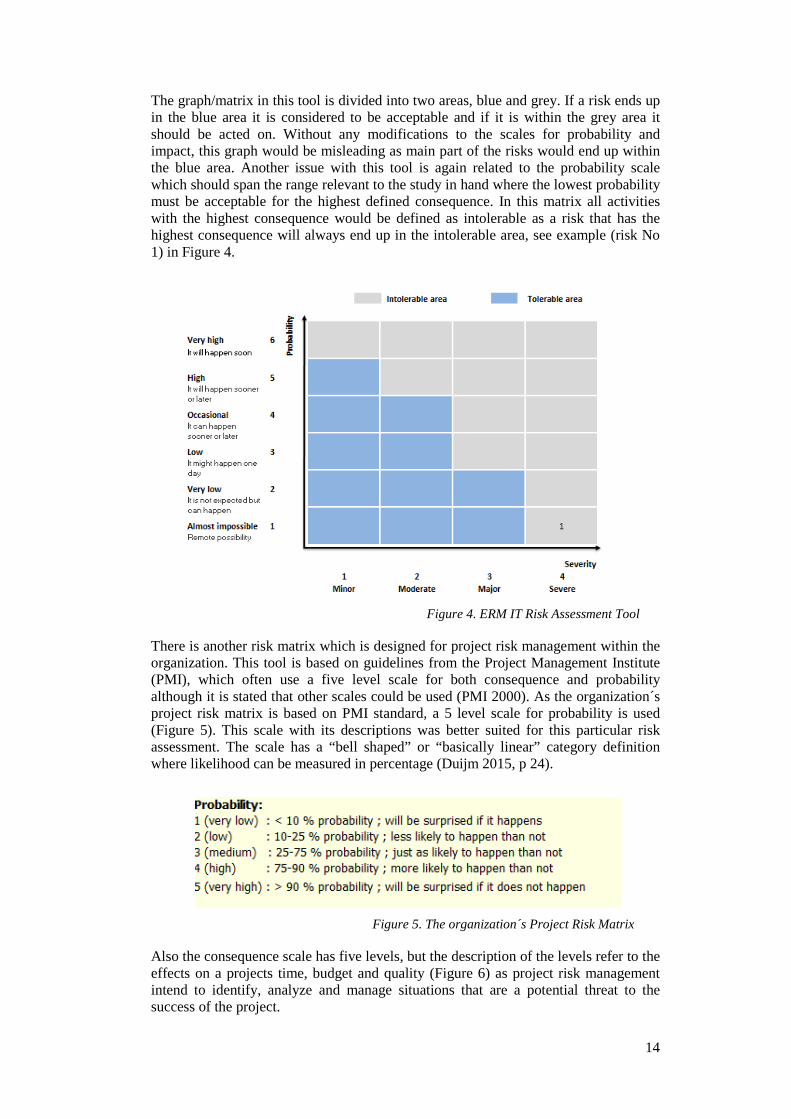
The graph/matrix in this tool is divided into two areas, blue and grey. If a risk ends up in the blue area it is considered to be acceptable and if it is within the grey area it should be acted on. Without any modifications to the scales for probability and impact, this graph would be misleading as main part of the risks would end up within the blue area. Another issue with this tool is again related to the probability scale which should span the range relevant to the study in hand where the lowest probability must be acceptable for the highest defined consequence. In this matrix all activities with the highest consequence would be defined as intolerable as a risk that has the highest consequence will always end up in the intolerable area, see example (risk No 1) in Figure 4.
Figure 4. ERM IT Risk Assessment Tool
There is another risk matrix which is designed for project risk management within the organization. This tool is based on guidelines from the Project Management Institute (PMI), which often use a five level scale for both consequence and probability although it is stated that other scales could be used (PMI 2000). As the organization´s project risk matrix is based on PMI standard, a 5 level scale for probability is used (Figure 5). This scale with its descriptions was better suited for this particular risk assessment. The scale has a “bell shaped” or “basically linear” category definition where likelihood can be measured in percentage (Duijm 2015, p 24).
Figure 5. The organization´s Project Risk Matrix
Also the consequence scale has five levels, but the description of the levels refer to the effects on a projects time, budget and quality (Figure 6) as project risk management intend to identify, analyze and manage situations that are a potential threat to the success of the project.
15
Figure 6. The organization´s Project Risk Matrix
The descriptions of the different levels of impact were not relevant for this risk assessment as the intention was to assess the business risks related to the change of the IT system and not the project risks themselves. The five level scales could be used, but in order to make sure the people judging the impacts had the same view of the meaning of each level, there was a need for clarification. What do we mean with for example level 3, medium impact? Medium impact on what? More or less all risks will give an economic impact, but it is hard to calculate how much. Therefore it was, after some discussions with stakeholders, chosen to define the categories from efficiency loss and customer impact (Figure 7). These definitions helped the participants in the workshop to get a more common view of the levels of impact, although there were a number of discussions before accepting the descriptions.
Figure 7. Modified Project Risk Matrix
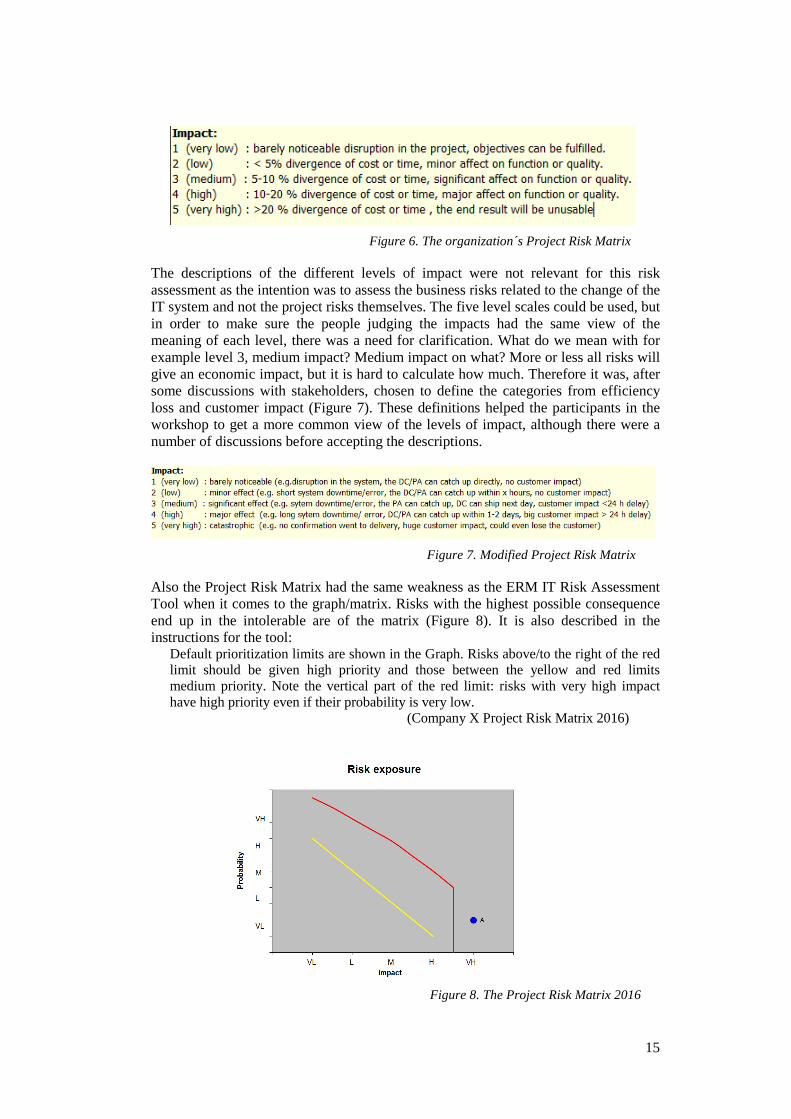
Also the Project Risk Matrix had the same weakness as the ERM IT Risk Assessment Tool when it comes to the graph/matrix. Risks with the highest possible consequence end up in the intolerable are of the matrix (Figure 8). It is also described in the instructions for the tool:
Default prioritization limits are shown in the Graph. Risks above/to the right of the red limit should be given high priority and those between the yellow and red limits medium priority. Note the vertical part of the red limit: risks with very high impact have high priority even if their probability is very low. (Company X Project Risk Matrix 2016)
Figure 8. The Project Risk Matrix 2016
16
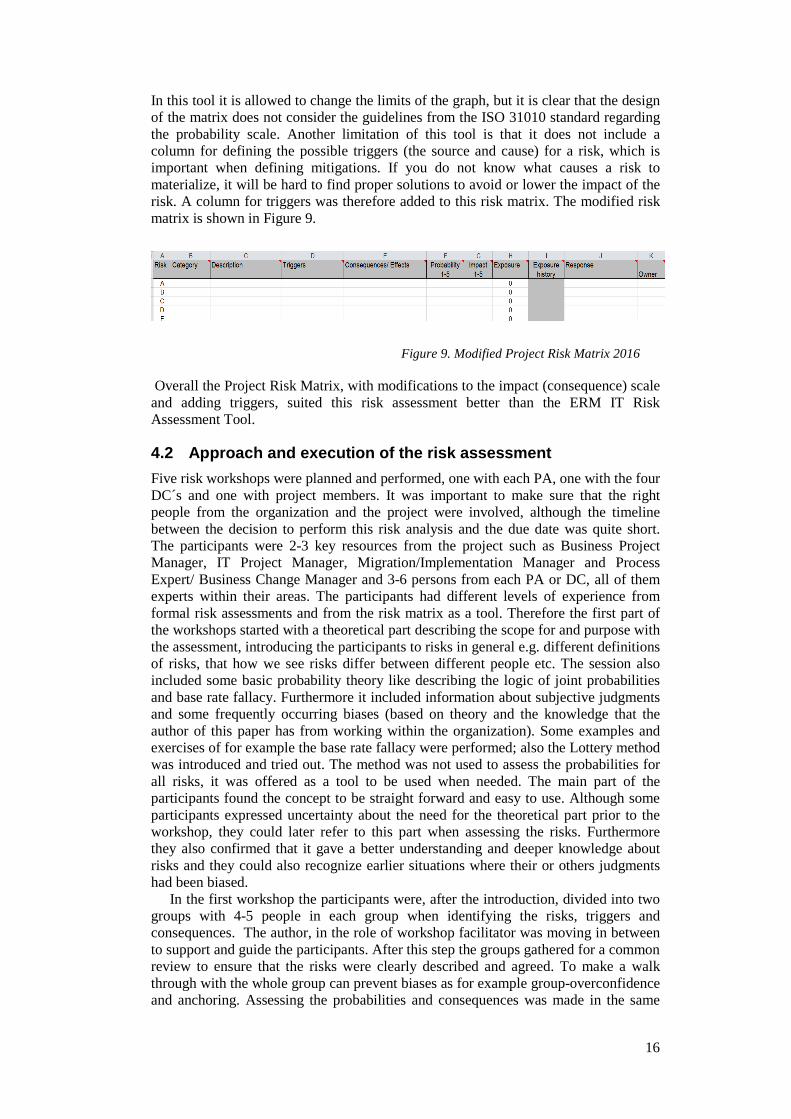
In this tool it is allowed to change the limits of the graph, but it is clear that the design of the matrix does not consider the guidelines from the ISO 31010 standard regarding the probability scale. Another limitation of this tool is that it does not include a column for defining the possible triggers (the source and cause) for a risk, which is important when defining mitigations. If you do not know what causes a risk to materialize, it will be hard to find proper solutions to avoid or lower the impact of the risk. A column for triggers was therefore added to this risk matrix. The modified risk matrix is shown in Figure 9.
Figure 9. Modified Project Risk Matrix 2016
Overall the Project Risk Matrix, with modifications to the impact (consequence) scale and adding triggers, suited this risk assessment better than the ERM IT Risk Assessment Tool.
4.2 Approach and execution of the risk assessment
Five risk workshops were planned and performed, one with each PA, one with the four DC´s and one with project members. It was important to make sure that the right people from the organization and the project were involved, although the timeline between the decision to perform this risk analysis and the due date was quite short. The participants were 2-3 key resources from the project such as Business Project Manager, IT Project Manager, Migration/Implementation Manager and Process Expert/ Business Change Manager and 3-6 persons from each PA or DC, all of them experts within their areas. The participants had different levels of experience from formal risk assessments and from the risk matrix as a tool. Therefore the first part of the workshops started with a theoretical part describing the scope for and purpose with the assessment, introducing the participants to risks in general e.g. different definitions of risks, that how we see risks differ between different people etc. The session also included some basic probability theory like describing the logic of joint probabilities and base rate fallacy. Furthermore it included information about subjective judgments and some frequently occurring biases (based on theory and the knowledge that the author of this paper has from working within the organization). Some examples and exercises of for example the base rate fallacy were performed; also the Lottery method was introduced and tried out. The method was not used to assess the probabilities for all risks, it was offered as a tool to be used when needed. The main part of the participants found the concept to be straight forward and easy to use. Although some participants expressed uncertainty about the need for the theoretical part prior to the workshop, they could later refer to this part when assessing the risks. Furthermore they also confirmed that it gave a better understanding and deeper knowledge about risks and they could also recognize earlier situations where their or others judgments had been biased.
In the first workshop the participants were, after the introduction, divided into two groups with 4-5 people in each group when identifying the risks, triggers and consequences. The author, in the role of workshop facilitator was moving in between to support and guide the participants. After this step the groups gathered for a common review to ensure that the risks were clearly described and agreed. To make a walk through with the whole group can prevent biases as for example group-overconfidence and anchoring. Assessing the probabilities and consequences was made in the same

17
manner, first in the smaller teams and then a common walkthrough. The risk matrix used has, as earlier mentioned a 5 level probability scale where level 3 has a large span 25-75%. This could reflect the uncertainty of a risk, but it could also easily trigger biases like the centering bias and equalizing bias. Through the introduction to risks in the beginning of the workshop, the participants were making careful judgments before choosing level 3. In some cases level 3 was chosen due to uncertainty, but in the cases where the participants felt surer of the judgment they made a comment on the side indicating the probability considered to be more accurate.
For the facilitator and the project resources attending the workshop it was quite clear that for many risks the probability was judged to be very high due to the fact that the business representatives did not had very much knowledge about the new solution and felt that they were not in control of the situation. After the first workshop when reviewing the material it was also clear that some of the risks were not defined clearly enough so that people outside the workshop could understand them. Sometimes the description of the risk was really the trigger and vice versa. This was corrected after the workshop and to avoid this in the next workshop the participants was kept in one group and the facilitator was leading the work and doing the typing throughout the whole workshop. This was an improvement as the facilitator did not have the same knowledge about the business and therefore focused on getting clear descriptions from the participants. Another change made to the second workshop was to have a high level walkthrough for the business representatives of the major changes that the new system would bring the day before the risk assessment workshop. This raised the business resource´s knowledge about the project and the changes it would bring. It also made the business resources more comfortable that the project had covered the main functionality needed. This was clearly visible when discussing the defined risks and assessing the probabilities of those risks in the second workshop. In general the probability for the risks were rated much lower almost entirely depending on that the business resources felt more comfortable after getting more insight in the changes to come and the project work performed so far. Unfortunately it was not possible to have this walkthrough before the third and fourth workshop due to time constraints. As the concept itself with how the workshops were structured, the content and time management worked out well there were no other changes made to the third workshop. The fourth workshop had to be performed via video conference as the participants needed were spread out in three different locations; Europe, Asia and USA. The structure and content was the same as for the previous workshops and it worked out well, although it is preferable to have all attendees gathered at the same place. The workshop participants were used to have video conferences and that is a prerequisite when having long sessions like this.
The fifth workshop was performed with only project members with the main focus to define mitigations to the defined risks. In order to give these people the same background and knowledge about risks we started with the same introduction as in the previous workshops. This proved to be even more important in this particular workshop. After the introduction there was a walkthrough of all defined risks and probability judgments. The project resources did not at all agree with the earlier probability judgments for the risks. As they had good knowledge of the new solution and of what had been done in the project so far, they thought that the probabilities for the main part of the risks were much lower. Through the introduction they could anyhow understand and relate to the different aspects that have an impact on how different people see and evaluate risks. Without this introduction it would have been harder for them to accept the probability judgments made by the business representatives. No figures were changed and mitigating actions were defined for all risks that the project could be responsible for. The actions that needed to be managed within the business side were already defined in the previous workshops. Some risks do not need to be managed, which means that no mitigations are defined, but they will continuously be monitored to make sure they do not increase. The compiled list of

18
risks and the defined mitigations with appointed responsible persons is being followed up and reassessed (this study is finalized before the project closure) in reoccurring meetings with the different stakeholders (PAs, DCs, Program Management and the Project Steering Group). The list is also easily accessible and visible for all stakeholders and all identified risks have been walked through with the participants in the different workshops.
5 Analysis In the analysis the theoretical and empirical parts will be connected and reflected with the purpose of the study as a base. Furthermore the learning and conclusions from this particular risk analysis and the way it was performed are discussed.
5.1 Analyzing risks
The risk management process starts with establishing the context e.g. definition of objectives and scope, defining what the organization would like to achieve including factors that may influence success in achieving those objectives. The scope of and objectives with this particular risk analysis were clearly defined from the start, although the time frame for preparing and performing it was quite limited. The decision was taken in early December 2015 and the analysis had to be finalized during April 2016. The Christmas holiday during this period and the fact that this is a global organization which required some traveling for the facilitator and some participants limited the time available. This could have an impact on the quality of the analysis and impact the possibility to reach the objectives. Fortunately some preparations were already made and the required participants could re-organize their schedules on short notice to participate in the workshops.
There are as earlier mentioned many different definitions of risk and of the risk management process, many times the same words are used but with different meaning. The organization´s ERM policy is a standard that aim to achieve consistency and reliability in risk management. It includes one vocabulary and a common overarching process for identifying, analyzing, evaluating and treating risks. In this sense it is compliant with the ISO standards and best practice, but it has some weaknesses when it comes to the design of the Risk Matrix. Furthermore it is lacking guidance in how to avoid biases when assessing risks. Even though the ERM Guideline emphasizes that the facilitator should have knowledge in the ERM process that does not secure that the facilitator has general knowledge about risks, biases or probability theory.
In order to be able to identify risks it is required that we have a common understanding of what a risk is. Furthermore it is important to understand that risks are assessed differently by different people and there are a number of factors that affect how we see risks. In this particular case the business representatives have not been part of the project, they had quite limited knowledge about this new IT solution, did not feel in control of the situation and on top of that, they will receive a new system whether they want it or not, which if it fails could have more or less catastrophic consequences. In other words it was likely that these factors would impact the result of the assessment. In order to counteract this and increase the participants’ knowledge about these factors, the workshops were started with a general introduction to risks. It was an eye opener to many of the participants. That these different factors really have an impact on how we interpret risks was also clear when comparing the identified risks and the probability judgments made by the business representatives with the project members´ view on the same risks. From a business perspective the probabilities for the identified risks were judged to be much higher than from a project perspective. The business resources made the judgments from what they knew, which were very little while the project resources knew very much. The business
19
representatives were in general more worried and sometimes a bit suspicious about the capability of the project to capture and implement the requirements and functionality needed for running the business. The participants from the second workshop, who had a walkthrough of the major changes the new system would bring including the most affected processes, judged the probabilities lower for functionality related risks than the other business representatives did. They also expressed that they felt more comfortable after getting an overview of the affected processes. With that said it is still important to catch the two different dimensions (business and project), as studies have shown that people in projects deliberately overestimate the benefits of the project, and at the same time they underestimate risks and uncertainties.
5.2 Using the risk matrix
When looking into the ERM tool and the project management risk matrix it was clear that neither one of them would fit the type of risks that were going to be considered in this risk assessment without modifications. The ERM IT Risk Assessment Tool seems to be more useful when assessing general IT risks on corporate level or when assessing risks related to strategic directions for IT. Even then it should be highlighted that it has some weaknesses that has to be considered when using it. The consequence and likelihood scales in the ERM IT Risk Assessment Tool would not give appropriate ratings of the type of risks assessed in this risk analysis, although if following the ERM guideline this risk matrix should be used. Also the project risk matrix had a consequence scale that was not suitable, or at least not the descriptions of the scale. In order to make sure that the participants in the workshops had the same view of the meaning of each level, there was a need for clarification. The original probability scale was used as there was no time to look into and evaluate other scales. This scale is also a quite commonly used scale in project risk assessments and therefore considered to be good enough.
Both risk matrices also had other limitations and neither of them is compliant with the ISO 31000 and 31010 standards when it comes to the design of the risk matrices. The 31000 standard advises that the way the consequences and likelihood are expressed and combined to determine a level of risk should reflect the type of risk, the information available, and the purpose for which the risk assessment output is to be used. Although the project risk matrix is possible to modify, there is no explanation or indication in the instructions that this might be necessary before using the tool. Another problem with these matrices is the graph derived from the risk scores given from the combination of probability and consequence. Different combinations of probability and consequence can give the same risk score and color and make different risks to end up in the same cell. A risk with low probability and high impact could get the same score as a risk with high probability and low impact. This could affect the priority of risks and the treatment of them. In some cases it is appropriate to focus on the risks with very high impacts, but in other cases it might be important to analyze all the risks separately. A frequent problem with low impact could for example have large cumulative or long term effect. This is also observed in the ISO 31010 standard, which states that: the probability scale needs to span the range relevant to the study in hand, remembering that the lowest probability must be acceptable for the highest defined consequence (ISO 2010 IEC/ISO 31010:2009, p 83). In both matrices all risks with the highest consequence end up in the area defined as intolerable. This was not changed in the risk matrix before using it, but the problem has been highlighted to the stakeholders and the client of this risk analysis. The author of this paper has also addressed to the Steering Group and the Project Manager that the whole list of risks should be monitored or managed. The graph should not be used in isolation to prioritize the risks.
20
5.3 The quality of the risk analysis
The quality of the risk analysis could be reflected by its usability; how well the risk analysis fulfills defined objectives and demands. It should work as a tool to identify risk sources and risky situations that could lead to an unwanted situation. A risk analysis should according to the ISO 31010 standard answer a number of questions (see chapter 3.3). It should also be possible to use it as a base for information and discussions with representatives for groups that are affected by the decisions that can be taken, as well as being a tool to anchor decisions in the organization. How well this particular analysis meets those demands can only be answered by the client and the people involved. Yet, statements from some steering group members and the answers in the questionnaire indicate that it does. Quite some effort and time has been spent on preparing the analysis when it comes to study best practices, which then has been used as the foundation for how to perform the risk analysis, what tools to use and how to overcome their limitations.
Much of the criticism against risk matrices are related to the attempts to use them without adapting them to the operation and risks that are being investigated including attempts to use standardized risk matrices that shall be applied on both continuous operations and projects (Duijm 2015, Talbot 2011). The study finds also this statement to be relevant. It becomes very clear when trying to use a standardized risk matrix that is not adapted to the risks that are being investigated. As mentioned in chapter two, methods are tools that should ease the work when something is being investigated and it is important to choose the right tool in relation to the aim, objectives and questions at issue. The risk matrix clearly has some limitations both when it comes to the design and resolution. In addition to that the input is based on experts’ subjective judgments. There are other tools or methods that can be used, but in this particular case it would still have to be based on input from experts. The short time frame and the fact that the risk matrix is already used as a tool for risk assessments within the organization was the base for deciding which method to use. It should also be mentioned that all risk analyses, except those based on statistical analysis and mathematical consequence assessments requires that some kind of subjective assessment is made. One very important criterion for a successful usage of risk matrices is clearly defined risks and robust definitions of likelihood and consequences. If those circumstances are at place there is according to Talbot (2011) a good possibility to get the same or equal judgments from experts in independent assessments, which means that the reliability is high. This is very hard in qualitative analyses, but with the modifications done to this particular risk matrix, walkthrough of results, together with techniques/tools used to avoid biases the result could be considered as reasonable.
5.4 Summary and discussion
Despite its limitations the author of this paper considers the risk matrix to be a quite useful and good tool for risk assessments. Although it should not be used in isolation and techniques/tools such as probability training, using multiple experts, counterfactuals, hypothetical gambles, and fixed value techniques etc. are important complements. Whether the way this risk assessment was performed and structured have helped to improve the quality of the result is hard to prove. Considering the fact that the existing risk matrices within the organization have some weaknesses and that no one of the workshop participants, who many of them have been part of risk assessments before, had any greater knowledge about the different aspects that impact how we evaluate and interpret risks we can assume that the quality is improved. Furthermore the answers to the questionnaire are supporting that statement, although it should be mentioned that there were only five participants that actually responded the questionnaire. Some participants have given spontaneous comments verbally, but that is hard to refer to in this paper.
21
Transferability is about if it is possible to apply the result of the research to similar situations. One purpose with this paper was to apply existing theories in practice to increase the quality of the risk assessment in the studied organization. This paper will hopefully also contribute with more practical knowledge that can be applied for all types of risk assessments within the studied organization, but also outside. Even if the study is based on one case and every case is unique, it is also an example that is included in a wider category. The studied organization could be seen as an organization among other global engineering companies. Furthermore existing general theories were applied and tried out. Transferability can be reached if the reader can recognize the pattern in this study in other cases and if different situations, processes or phenomenon can be understood with the help of the interpretations made in this study.
6 Conclusion and proposed improvements People within the particular organization do not in general possess the kind of knowledge to question the quality of the risk matrices or how use it in such way that correct conclusions are made. They will most likely try using the provided tools and following the guideline even when the tools do not fit the purpose. Neither one of the risk matrices is designed properly and is not compliant with the ISO standards when it comes to the design and resolution. In worst case this could according to Cox (2008) lead to a 50-50 chance to make the right decision. Therefore the following improvements are recommended for the organization:
• Re-design the risk matrices with respect to the resolution to be compliant with the ISO 30100 standard (see chapter 3.7, p 11 in this paper)
• Do not emphasize a standardized tool for all types of risks within the organization. Extend the ERM guideline or provide complimentary instructions regarding how use the risk matrices i.e. that some modifications could be allowed and how to avoid the result to be biased.
One of the goals with this risk analysis is that the output should be input for
creating the go-live criteria. For projects of this type there are a number of more or less universal check points and criteria that should be met and those are not included here. The result of the risk assessments has generated some general recommendations to the project and to the steering group:
• There should be a defined and agreed tolerable level for each risk that shall be met before a go-live. Do not only follow up high risks, although they should have more focus. This is to make sure risks with high impact and low probability stay low. Furthermore a frequent problem with low impact could have large cumulative or long term effect.
• All risks with the highest impact (5) should be classified in probability category 1 (lowest) before a go-live. Although when risks are mitigated and re-assessed people might have different views of the current status. The business representatives can have one view, the project members another and steering group members a third. It should then be clear how to handle this, where to escalate and who to decide if the risk is low enough. Therefore a governance structure should be set up.
Another recommendation to the project, program and steering group is to make sure to continue working with the follow up and mitigating actions for the risks, not only for avoiding or reducing the risks, but also for managing people’s expectations. There are many people that have spent time and effort to contribute to this risk assessment.
22
References
Boholm Å., Hansson S-O., Persson J., Peterson M. (2005) Osäkerhetens horisonter – kulturella och etiska perspektiv på samhällets riskfrågor. Nya Doxa, Nora
Clemen R., Reilly T. (2014). Making hard decisions – with decision tools 3rd edition. South Western, Cengage Learning
Cox LA. (2008) What´s wrong with risk matrices? Risk Analysis, Vol. 28, No. 2, 2008 pp. 497-512. http://onlinelibrary.wiley.com.webproxy.student.hig.se:2048/doi/10.1111/j.1539-6924.2008.01030.x/pdf
Davidsson G., Haeffler L., Ljundman B., Frantzish H. (2003) Handbok för riskanalys. Räddningsverket https://www.msb.se/ribdata/filer/pdf/18458.pdf
Denscombe M. (2009) Forskningshandboken- för småskaliga forskningsprojekt inom samhällsvetenskaperna. Studentlitteratur, Lund
Denscombe M. (2010) Forskningens grundregler- samhällsforskarens handbok i tio punkter. Studentlitteratur, Lund
Duijm N. (2015) Recommendations on the use and design of risk matrices. Safety Science 76 (2015) pp. 21-31. http://www.sciencedirect.com.webproxy.student.hig.se:2048/science/article/pii/S0925753515000429
Grimvall G., Jacobsson P., Thedén T. (2012) Risker i tekniska system. Upplaga 1:5 Poland: Elanders
ISO 2010 IEC/ISO 31010:2009. Risk management - Risk assessment techniques. 2010E ed. CENELEC. Brussels https://enav-sis-se.webproxy.student.hig.se/sv/Standard/?std=STD-3334336
Lisper, H-O., Lisper, S. (2005). Statistik för samhällsvetare. Liber, Malmö
Montibeller G., von Winterfeldt D. (2015) Cognitive and Motivational Biases in Decision and Risk Analysis. Risk Analysis Volume 35 pp. 1230–1251 http://onlinelibrary.wiley.com/wol1/doi/10.1111/risa.12360/full
Project Management Institute (PMI). Qualitative risk assessment. October 2000 PM Network http://www.pmi.org/learning/qualitative-risk-assessment-cheaper-faster-3188 [2015-12-15].
Purdy G. (2010) ISO 31000:2009—Setting a New Standard for Risk Management. Risk Analysis Vol. 30, pp 881-886. Published online in Wiley Online Library (wileyonlinelibrary.com).
Svensson L., Brulin G., Ellström P-E., Widegren Ö. Interaktiv forskning – för utveckling av teori och praktik (2002). Arbetslivsinstitutet, Stockholm http://nile.lub.lu.se/arbarch/aio/2002/aio2002_07.pdf
Talbot J. (2011) What´s right about risk matrices? https://31000risk.wordpress.com/article/what-s-right-with-risk-matrices-3dksezemjiq54-4/ [2015-12-10].

23
Tversky A., Kahneman D. (1974) Judgment under Uncertainty: Heuristics and Biases. Science, New Series, Vol. 185, No. 4157. (Sep. 27, 1974), pp. 1124-1131. http://links.jstor.org/sici?sici=0036-8075%2819740927%293%3A185%3A4157%3C1124%3AJUUHAB%3E2.0.CO%3B2-M
SS-ISO 31000:2009 (Sv) Riskhantering - Principer och riktlinjer. (2010) SIS Förlag AB https://enav-sis-se.webproxy.student.hig.se/sv/Standard/?std=STD-73413
Company X internal documentation [2016-01-13].
ERM, project risk matrix
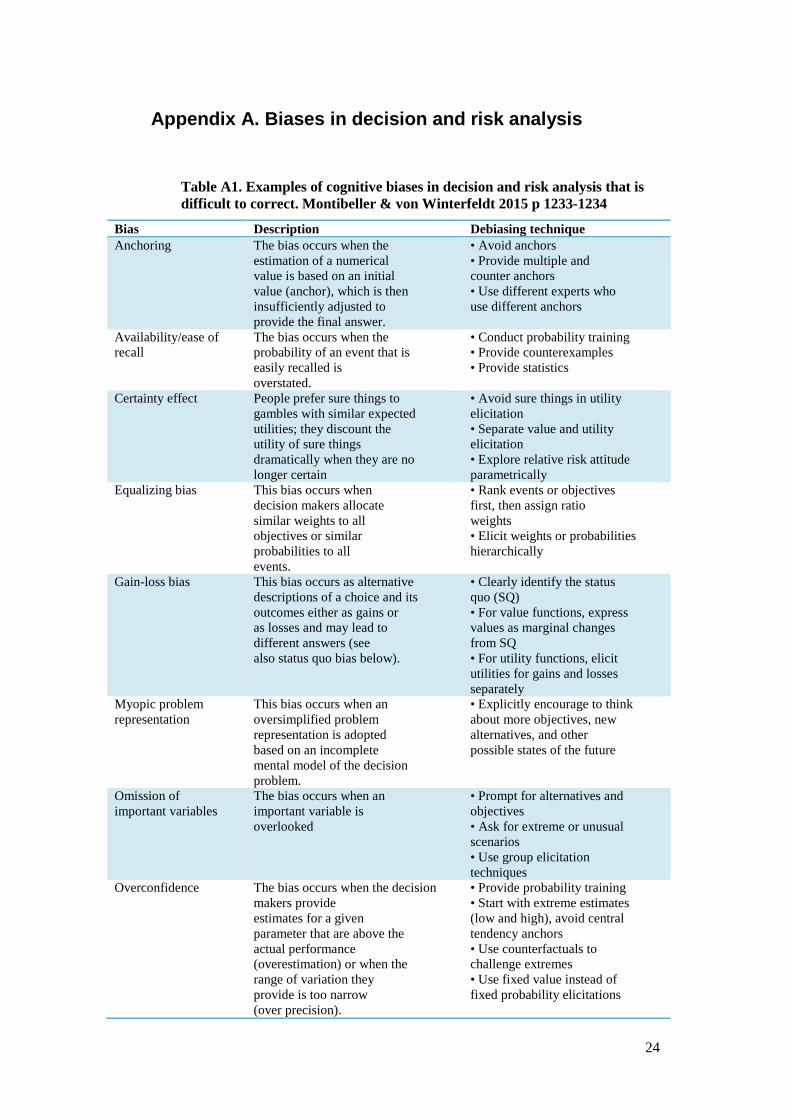
24
Appendix A. Biases in decision and risk analysis
Table A1. Examples of cognitive biases in decision and risk analysis that is difficult to correct. Montibeller & von Winterfeldt 2015 p 1233-1234
Bias Description Debiasing technique Anchoring
The bias occurs when the estimation of a numerical value is based on an initial value (anchor), which is then insufficiently adjusted to provide the final answer.
• Avoid anchors • Provide multiple and counter anchors • Use different experts who use different anchors
Availability/ease of recall
The bias occurs when the probability of an event that is easily recalled is overstated.
• Conduct probability training • Provide counterexamples • Provide statistics
Certainty effect
People prefer sure things to gambles with similar expected utilities; they discount the utility of sure things dramatically when they are no longer certain
• Avoid sure things in utility elicitation • Separate value and utility elicitation • Explore relative risk attitude parametrically
Equalizing bias
This bias occurs when decision makers allocate similar weights to all objectives or similar probabilities to all events.
• Rank events or objectives first, then assign ratio weights • Elicit weights or probabilities hierarchically
Gain-loss bias
This bias occurs as alternative descriptions of a choice and its outcomes either as gains or as losses and may lead to different answers (see also status quo bias below).
• Clearly identify the status quo (SQ) • For value functions, express values as marginal changes from SQ • For utility functions, elicit utilities for gains and losses separately
Myopic problem representation
This bias occurs when an oversimplified problem representation is adopted based on an incomplete mental model of the decision problem.
• Explicitly encourage to think about more objectives, new alternatives, and other possible states of the future
Omission of important variables
The bias occurs when an important variable is overlooked
• Prompt for alternatives and objectives • Ask for extreme or unusual scenarios • Use group elicitation techniques
Overconfidence
The bias occurs when the decision makers provide estimates for a given parameter that are above the actual performance (overestimation) or when the range of variation they provide is too narrow (over precision).
• Provide probability training • Start with extreme estimates (low and high), avoid central tendency anchors • Use counterfactuals to challenge extremes • Use fixed value instead of fixed probability elicitations

25
Proxy bias
Proxy attributes receive larger weights than the respective fundamental objectives
• Avoid proxy attributes • Build models relating proxies and fundamental objectives and provide weights for fundamental objectives
Range insensitivity bias
Weights of objectives are not properly adjusted to changes in the range of attributes.
• Make attribute ranges explicit and use swing weighting procedures • Use trade-off or pricing-out procedures • Use multiple elicitation procedures and cross-checks
Scaling A family of stimulus-response biases that comprises: contraction bias, logarithmic response bias, range equalizing bias, centering bias, and equal frequency bias.
• Develop scales that match stimuli and responses, being aware of these biases • Choose appropriate scaling techniques for the task at hand
Splitting biases
This bias occurs when the way the objectives are grouped in a value tree affects their weights; or the way a fault tree is pruned affects the probabilities placed on the remaining branches.
• Avoid splits with large probability or weight ratios • Use hierarchical estimation of weights or probabilities • Use ratio judgments instead of direct estimation or distribution of points
Table A2. Motivational biases in decision and risk analysis that are easy to correct. Montibeller & von Winterfeldt 2015 p 1235
Bias Description Debiasing technique Affect influenced
Occurs when there is an emotional predisposition for, or against, a specific outcome or option that taints judgments.
• Avoid loaded descriptions of consequences in the attributes • Cross-check judgments with alternative elicitation protocols when eliciting value functions, weights, and probabilities • Use multiple experts with alternative points of view
Confirmation
Occurs when there is a desire to confirm one’s belief, leading to unconscious selectivity in the acquisition and use of evidence.
• Use multiple experts with different points of view about hypotheses • Challenge probability assessments with counterfactuals • Probe for evidence for alternative hypotheses
Desirability of a positive event or consequence
Occurs when the desirability of an outcome leads to an increase in the extent to which it is expected to occur. It is also called “wishful thinking” or “optimism bias.
• Use multiple experts with alternative points of view • Use scoring rule and place hypothetical bets against the desired event or consequence • Use decomposition and realistic assessment of
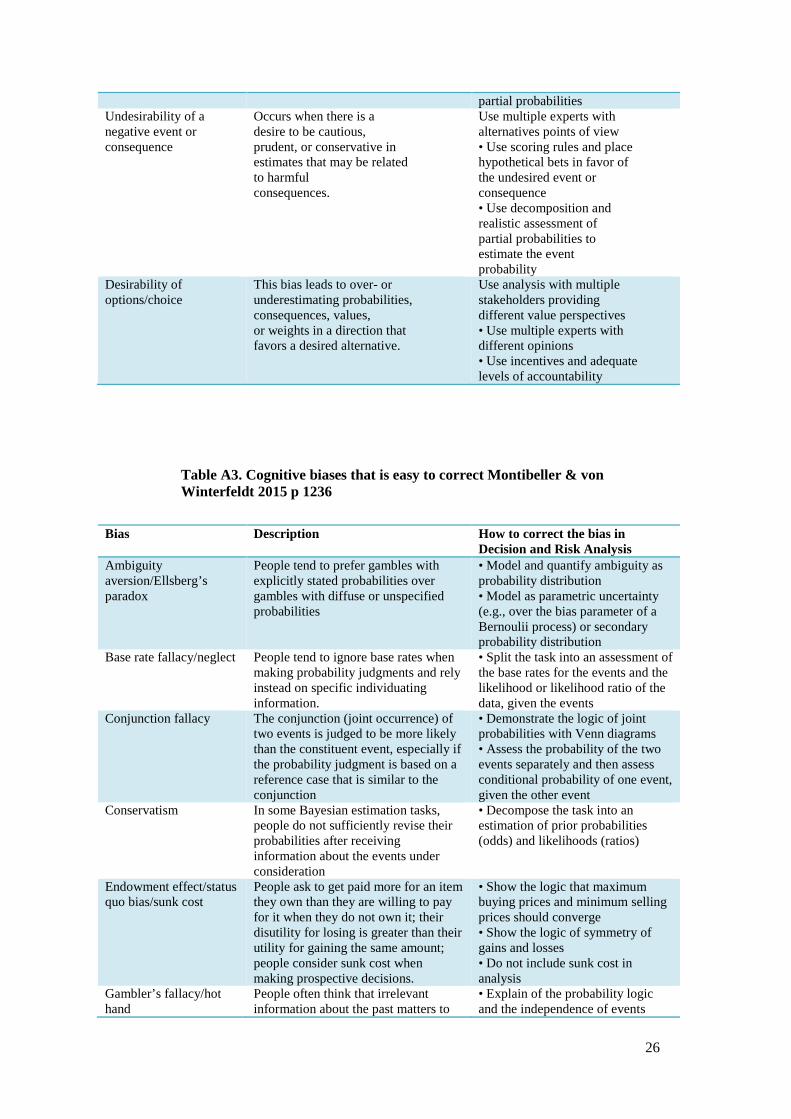
26
partial probabilities Undesirability of a negative event or consequence
Occurs when there is a desire to be cautious, prudent, or conservative in estimates that may be related to harmful consequences.
Use multiple experts with alternatives points of view • Use scoring rules and place hypothetical bets in favor of the undesired event or consequence • Use decomposition and realistic assessment of partial probabilities to estimate the event probability
Desirability of options/choice
This bias leads to over- or underestimating probabilities, consequences, values, or weights in a direction that favors a desired alternative.
Use analysis with multiple stakeholders providing different value perspectives • Use multiple experts with different opinions • Use incentives and adequate levels of accountability
Table A3. Cognitive biases that is easy to correct Montibeller & von Winterfeldt 2015 p 1236
Bias Description How to correct the bias in
Decision and Risk Analysis Ambiguity aversion/Ellsberg’s paradox
People tend to prefer gambles with explicitly stated probabilities over gambles with diffuse or unspecified probabilities
• Model and quantify ambiguity as probability distribution • Model as parametric uncertainty (e.g., over the bias parameter of a Bernoulii process) or secondary probability distribution
Base rate fallacy/neglect
People tend to ignore base rates when making probability judgments and rely instead on specific individuating information.
• Split the task into an assessment of the base rates for the events and the likelihood or likelihood ratio of the data, given the events
Conjunction fallacy The conjunction (joint occurrence) of two events is judged to be more likely than the constituent event, especially if the probability judgment is based on a reference case that is similar to the conjunction
• Demonstrate the logic of joint probabilities with Venn diagrams • Assess the probability of the two events separately and then assess conditional probability of one event, given the other event
Conservatism In some Bayesian estimation tasks, people do not sufficiently revise their probabilities after receiving information about the events under consideration
• Decompose the task into an estimation of prior probabilities (odds) and likelihoods (ratios)
Endowment effect/status quo bias/sunk cost
People ask to get paid more for an item they own than they are willing to pay for it when they do not own it; their disutility for losing is greater than their utility for gaining the same amount; people consider sunk cost when making prospective decisions.
• Show the logic that maximum buying prices and minimum selling prices should converge • Show the logic of symmetry of gains and losses • Do not include sunk cost in analysis
Gambler’s fallacy/hot hand
People often think that irrelevant information about the past matters to
• Explain of the probability logic and the independence of events
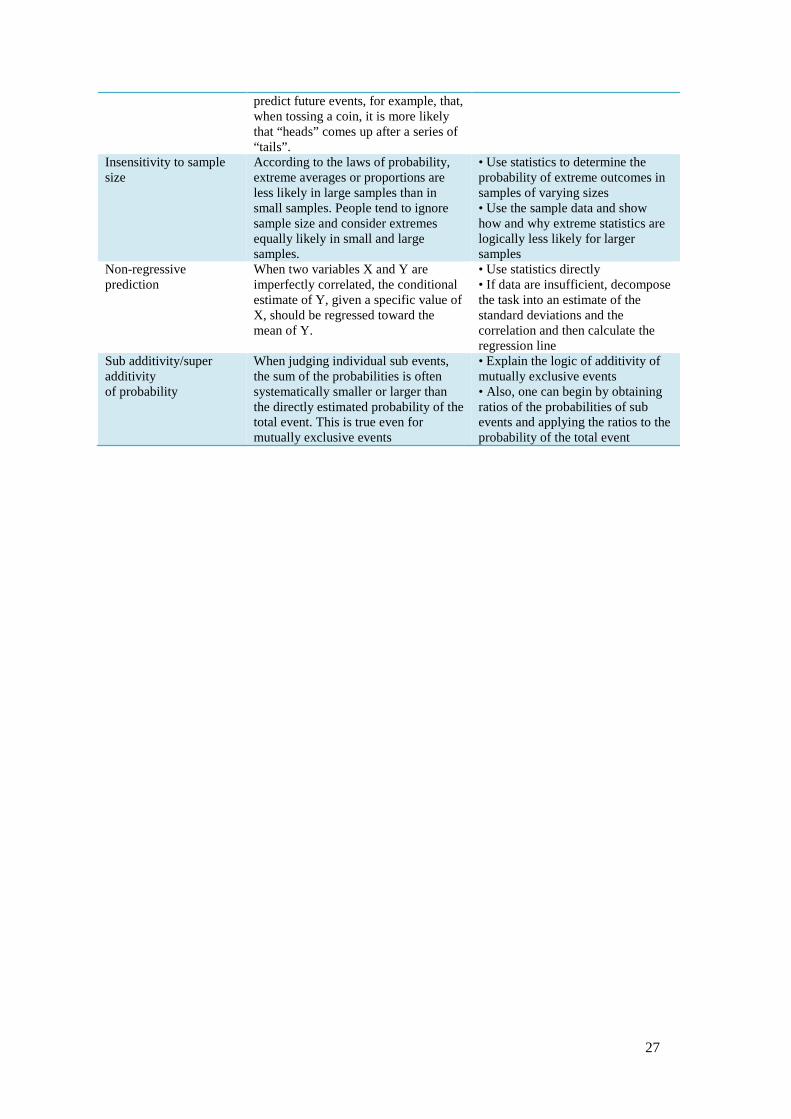
27
predict future events, for example, that, when tossing a coin, it is more likely that “heads” comes up after a series of “tails”.
Insensitivity to sample size
According to the laws of probability, extreme averages or proportions are less likely in large samples than in small samples. People tend to ignore sample size and consider extremes equally likely in small and large samples.
• Use statistics to determine the probability of extreme outcomes in samples of varying sizes • Use the sample data and show how and why extreme statistics are logically less likely for larger samples
Non-regressive prediction
When two variables X and Y are imperfectly correlated, the conditional estimate of Y, given a specific value of X, should be regressed toward the mean of Y.
• Use statistics directly • If data are insufficient, decompose the task into an estimate of the standard deviations and the correlation and then calculate the regression line
Sub additivity/super additivity of probability
When judging individual sub events, the sum of the probabilities is often systematically smaller or larger than the directly estimated probability of the total event. This is true even for mutually exclusive events
• Explain the logic of additivity of mutually exclusive events • Also, one can begin by obtaining ratios of the probabilities of sub events and applying the ratios to the probability of the total event
28
Appendix B Questionnaire
1. Was the content of the introduction to the risk assessment relevant and useful for you?
• Yes, very much so and it was very clear that it made sense for what we were doing and I believe it made the enthusiasm and energy high during the workshop. A clear purpose does that to people.
• Yes, it absolutely was. Hanna pointed out quite clearly why we are doing this and what the goal of the workshop was.
• Yes, both relevant and useful • Yes, it was and it gave good background to the rest of the workshop • Yes, I have been part of risk assessments before, but we have never done it
this thoroughly
2. What do you think of the structure of the workshop?
• Really logic order and with the introduction the focus was there from the beginning and the way it was built up into the full picture made a lot of sense. I think the ability to have same or similar reference when the risks (in this case for one project) is set at different occasions by different groups is very important.
• It was a very good mixture between presentation, working in groups and discussions. It never got boring, so I really liked it.
• Good! Theoretical parts could perhaps be less emphasized and the reason for doing the assessment and how it will be used a little bit more emphasized, if something..
• Very good and logic • Very good
3. What is your opinion about the facilitator, performance and knowledge?
• I was impressed both by the knowledge level and the structured approach. It really made a difference and it made it easier for the groups to focus on the different steps. The allocation and use of time made a lot of sense in the workshop I was in.
• She seemed to be very skilled. She answered all the questions in a very good way which actually motivated the group. She was acting very professional.
• Very well done over all! • She had very good knowledge and was a good facilitator • It was a good approach and she had very good knowledge
4. Did the risk assessment meet your expectations?
• It exceeded my expectations since it was the first time I joined a risk workshop where I felt a really strong connection and value with what we were doing.
• No, it exceeded my expectations by far.

29
• Yes, it would have been good to address both project risks and go live risks though.
• We should have a review and follow up sessions planned to verify that actions are taken and that this is followed.
• It was above my expectations and very different from other risk assessments that I have been part of.
5. General comments (if any)
• No doubt very useful also in other types of challenges and wisely used it could help any company to improve their performance. It will be quite a challenge to get the attention by top management necessary of course…..Very well done Hanna!
• This was a very good experience. It was very structured and we had quite some output. IF next actions will follow, I think the risk assessment is really good for such a big project. It was not overdone.
• This was very good, now we have to make sure to follow up the actions from the assessment
• Very good!