THE RELATIONSHIP BETWEEN AUTHENTIC LEADERSHIP, …
145
THE RELATIONSHIP BETWEEN AUTHENTIC LEADERSHIP, OPTIMISM, SELF-EFFICACY AND WORK ENGAGEMENT: AN EXPLORATORY STUDY By SHAYNE ROUX Thesis presented in partial fulfilment of the requirements for the degree Master of Commerce (Industrial Psychology) at Stellenbosch University Supervisor: Dr Z Dannhauser March 2010
Transcript of THE RELATIONSHIP BETWEEN AUTHENTIC LEADERSHIP, …
THE RELATIONSHIP BETWEEN AUTHENTIC LEADERSHIP, OPTIMISM, SELF-EFFICACY AND WORK ENGAGEMENT: AN EXPLORATORY STUDY
By
SHAYNE ROUX
Thesis presented in partial fulfilment of the requirements for the degree Master of Commerce (Industrial Psychology) at Stellenbosch University
Supervisor: Dr Z Dannhauser
March 2010

ii
DECLARATION By submitting this dissertation electronically, I declare that the entirety of the work contained therein is my own, original work, that I am the owner of the copyright thereof (unless to the extent explicitly otherwise stated) and that I have not previously in its entirety or in part submitted it for obtaining any qualification. March 2010
Copyright © 2010 Stellenbosch University All rights reserved

iii DEDICATION
Dearest Mom,
I dedicate this thesis to you,
Thank you for your sincerely appreciated love,
Your optimism, bravery, courage and kindness are such an inspiration.
I love you!
iv ABSTRACT
This study was rooted in the emerging positive psychology paradigm of a positive approach
to organisational behaviour. The assumption of this study was that certain variables
influence work engagement, and it was therefore important to gain an understanding of
these antecedents of work engagement. The aim of the study was to investigate the
respective relationships that exist between the positive organisational psychological
constructs, namely authentic leadership, optimism, self-efficacy and the influence of these
variables on work engagement. A study to obtain more clarity about these aspects was
therefore planned and executed. Based on the literature, a model depicting a sequential
process of interrelationships amongst the constructs was proposed in the study. Both
survey and statistical modeling methodologies were employed to guide the investigation.
In order to conduct this survey research, an electronic web-based questionnaire was used
as the method of data gathering. The questionnaire was programmed and posted for a
period of three weeks on the portal of the company where the survey was conducted. A
total of 781 e-questionnaires were sent out to the employees working in the particular
organisation (a large liquor producing company). A total of 407 (n=407) respondents who
work in this company and participated in the study completed four questionnaires –
comprising of one composite questionnaire they had to respond to electronically. The four
questionnaires constituting the composite questionnaire to obtain the responses from the
407 employees, were the Authentic Leadership Questionnaire (ALQ), Life Orientation Test
Revised (LOT-R), General Self-Efficacy Scale (GSES) and the Utrecht Work Engagement
Scale (UWES). Confirmatory factor analysis was conducted to evaluate the proposed
theoretical structure of each of the constructs. Exploratory factor analysis was only
conducted to investigate the reasons where a poor fit was obtained from the confirmatory
factor analysis. The results of a Pearson correlation analysis, stepwise multiple regression
analysis, and the soft approach to structural equation modeling (SEM), indicated significant
relationships between authentic leadership and work engagement, authentic leadership
and optimism, optimism and self-efficacy, and self-efficacy and work engagement.
Relationships between the constructs authentic leadership and self-efficacy, and optimism
and work engagement, were found to be not significant.
v With the unique combined positive psychology variables included in this study, the study
can be seen as making a contribution to the existing theory and literature by explicating the
findings with regard to the interrelationships between authentic leadership, optimism, self-
efficacy and work engagement. However, referring back to the literature this study was an
attempt to help further some of the emerging positive psychology constructs. It should
therefore be seen as investigative in nature and much more follow-up research in this
domain is deemed necessary. This study made recommendations for future research, as
well as interventions regarding the development of authentic leadership and positive
psychological capacities.
vi OPSOMMING
Die huidige studie is gebaseer op die nuwe positiewe sielkunde paradigma, meer spesifiek
positiewe organisasiegedrag. Die aanname van die studie was dat sekere veranderlikes
werkstoewyding beϊnvloed. Dit was dus belangrik om insig te verwerf rakende die invloed
van sekere voorspellers van werkstoewyding. Die huidige studie het ten doel gehad om die
verwantskappe tussen veranderlikes binne positiewe organisasiegedrag, naamlik
outentieke leierskap, optimisme, selfbekwaamheid, en die invloed van hierdie veranderlikes
op werkstoewyding te ondersoek. ‘n Studie om meer duidelikheid oor hierdie aspekte te
verkry is dus beplan en uitgevoer. Op grond van die literatuur is ‘n model voorgestel wat ‘n
logiese en opeenvolgende volgorde daarstel van hoe die verskillende konstrukte aan
mekaar verwant is. Sowel opname- asook statistiese modelleringsmetodiek is in hierdie
studie gebruik.
Data vir hierdie opnamenavorsing is versamel deur middel van ‘n elektroniese
webgebaseerde-vraelys. Die vraelys is geprogrammeer en vir ‘n tydperk van drie weke op
die portaal van die organisasie geplaas waar die opname gedoen is. ‘n Totaal van 781 e-
vraelyste is uitgestuur na die werknemers wat in hierdie spesifieke organisasie werk (‘n
groot drankvervaardigingsmaatskappy). ‘n Totaal van 407 (n=407) respondente wat in die
betrokke organisasie werk en aan hierdie studie deelgeneem het, moes vier vraelyste – wat
deel uitgemaak het van een saamgestelde vraelys – elektronies voltooi. Die vier vraelyste
wat deel uitgemaak het van die saamgestelde vraelys en gedien het om die 407
werknemers se menings mee te verkry, het bestaan uit die Authentic Leadership
Questionnaire (ALQ), Life Orientation Test Revised (LOT-R), General Self-Efficacy Scale
(GSES), en die Utrecht Work Engagement Scale (UWES). Bevestigende faktorontleding
was gebruik om die onderliggende teoretiese struktuur van al die konstrukte te evalueer.
Waar ‘n swak passing verkry was gedurende bevestigende faktorontleding, is
verkennende faktorontleding gebruik om die oorsaak te identifiseer. Die resultate van die
Pearson-korrelasie analise, stapsgewyse meervoudige regressie analise, en die sagte
benadering tot struktuurvergelykings-modellering (SVM), het aangedui dat daar
beduidende verwantskappe tussen outentieke leierskap en werkstoewyding, outentieke
leierkap en optimisme, optimisme en selfbekwaamheid, en selfbekwaamheid en
werkstoewyding bestaan. Daar is egter geen beduidende verwantskappe tussen die

vii konstrukte outentieke leierskap en selfbekwaamheid, en optimisme en selfbekwaamheid
gevind nie.
Gegewe die unieke kombinasie van positiewe sielkunde konstrukte wat in hierdie studie
ingesluit is, kan daar gesê word dat hierdie studie ‘n bydrae maak ten opsigte van die
bestaande teorie deur lig te werp op die verwantskappe tussen outentieke leierskap,
optimisme, selfbekwaamheid en werkstoewyding. Dog, deur weer na die literatuur te
verwys is dit belangrik om te benadruk dat hierdie studie beskou behoort te word as ‘n
poging om die “nuwe” ontluikende positiewe sielkunde konstrukte verder te help uitbou.
Juis om hierdie rede behoort die studie as ondersoekend van aard geïnterpreteer te word
en is veel verdere en opvolg-navorsing in hierdie gebied van onskatbare belang. Die studie
maak aanbevelings vir verdere navorsing asook intervensies rakende die ontwikkeling van
outentieke leierskap en positiewe sielkundige bevoegdhede.

viiiACKNOWLEDGEMENTS
I would like to express my sincerest gratitude to the following for their commitment,
guidance and support.
Almighty God, for all my blessings.
My family, my mother Dawn Roux, and my brother Phildon Roux, for your unwavering love,
support and always believing in me.
Dr Zani Dannhauser, my study leader, for your sincerely appreciated guidance and
assistance during the course of my research.
Professor Martin Kidd, for your invaluable statistical guidance and assistance in my study.
Dr Rene Nel, my internship supervising psychologist, for your ongoing support, passion and
interest in my academic endeavours.
Dr Petrus Nel, for your sincerely appreciated voluntary guidance, assistance and
continuous support.
Marcelle de Vries, for all your sincerely appreciated support and assistance.
Joanne Torrance, for your much appreciated assistance and support.
The Corporate Development Director and employees of the organisation, for allowing me
the privilege of conducting my research in a world-class company.
My friends and work colleagues, for your support during the completion of my thesis.
ix TABLE OF CONTENTS
Page
Declaration
Dedication
Abstract
Opsomming
Acknowledgements
Table of contents
List of tables
List of figures
List of appendices
CHAPTER 1: THE PROBLEM AND ITS SETTING
1.1 Introduction
1.2 Setting the context for the study
1.3 Theoretical framework of the research
1.4 Defining the constructs
1.4.1 Definitions of authentic leadership
1.4.1.1 Operational definition of authentic leadership
1.5 Definitions of optimism
1.5.1 Operational definition of optimism
1.5.1.1 The importance of optimism in examining authentic leadership
1.6 Definitions of self-efficacy
1.6.1 Operational definition of self-efficacy
1.6.1.1 The importance of self-efficacy in examining authentic leadership
1.7 Definitions of work engagement
1.7.1 Operational definition of work engagement
1.7.1.1 The importance of work engagement in examining authentic
leadership
1.8 Research objectives
1.8.1 The reason for, and contribution of, investigating the relationship
between authentic leadership behaviour, optimism, self-efficacy,
and work engagement
(ii)
(iii)
(iv)
(vi)
(viii)
(ix)
(xiii)
(xiv)
(xv)
1
1
1
3
3
3
4
4
5
6
9
11
11
13
16
16
18
18
x 1.8.2 Conceptual aim of the study
1.8.3 Operational aim of the study
1.9 Study outline
1.10 Summary
CHAPTER 2: LITERATURE REVIEW
2.1 Introduction
2.2 The history and notion of authentic leadership
2.2.1 Previous research and models of authentic leadership
2.3 The variable of optimism
2.3.1 Antecedents of optimism
2.4 The variable of self-efficacy
2.4.1 Antecedents of self-efficacy
2.5 The variable of work engagement
2.5.1 Antecedents of work engagement
2.6 Conclusions and theoretical support based on the literature
review
2.7 The research problem
2.8 Research propositions
2.9 Summary
CHAPTER 3: METHODOLOGY
3.1 Introduction
3.2 Overview and research design
3.2.1 Reason for choosing research design and methodology
3.2.1.1 Survey research
3.2.1.2 Statistical modeling studies
3.3 Sample design and participants
3.3.1 Research participants
3.3.2 Defining the sample
3.3.3 Sample of participants
3.3.4 General sample comments
3.4 Measuring instruments
19
19
20
20
21
21
21
22
27
27
29
29
31
31
32
33
34
35
37
37
37
37
38
39
40
40
41
41
42
42
xi 3.4.1 Authentic Leadership
3.4.2 Optimism
3.4.3 Self-efficacy
3.4.4 Work engagement
3.5 Data collection procedure
3.6 Data analysis
3.6.1 Determining the underlying structures of the constructs
3.6.1.1 Confirmatory factor analysis
3.6.1.2 Variables in CFA
3.6.1.3 Evaluating the measurement models through confirmatory factor
analysis
3.6.1.3.1 Goodness-of-fit statistics
3.6.1.3.2 Comparison of groups
3.6.2 Exploratory factor analysis
3.6.2.1 Determining the number of factors to be extracted
3.6.2.2 Parallel Analysis
3.6.3 Determining the degree of relationship between variables
3.6.3.1 Correlation (Bivariate r)
3.6.3.1.1 Magnitude of r (Guilford’s informal interpretations)
3.6.3.1.2 General guidelines for interpreting reliability coefficients
3.6.4 Multiple regression analysis
3.6.5 Structural equation modeling (SEM)
3.6.5.1 Evaluating the structural component of SEM through partial least
squares modeling (PLS)
3.6.5.1.1 Motivation for using PLS modeling
3.6.5.1.2 Methodological characteristics
3.6.5.1.3 Bootstrapping
3.6.5.1.4 Evaluation of PLS path model results
3.7 Summary
CHAPTER 4: PRESENTATION OF RESEARCH RESULTS
4.1 Introduction
4.2 Results of the confirmatory factor analysis performed on each of
42
45
46
48
50
51
52
52
54
55
55
56
57
58
60
60
60
61
61
62
63
63
64
65
66
66
67
69
69
69
xii the identified constructs
4.3 Correlations between the latent variables of the various constructs
4.4 Item analysis
4.5 EFA of the construct optimism as measured by the LOT-R
4.6 Results of Pearson correlation analysis
4.7 Results of multiple regression analysis
4.8 Results of the measurement and structural models
4.9 Summary
CHAPTER 5: DISCUSSION OF RESEARCH RESULTS AND
RECOMMENDATIONS FOR FUTURE RESEARCH
5.1 Introduction
5.2 Conclusions regarding the factor structure results on the data
5.2.1 Authentic leadership
5.2.2 Optimism
5.2.3 Self-efficacy
5.2.4 Work engagement
5.3 Conclusions regarding predicting work engagement through PLS
modeling
5.4 Summary
5.5 Limitations and recommendations
5.5.1 Limitations of the present research study
5.5.2 Recommendations for future research
5.6 Intervention: Implications for practice
5.7 Conclusion
REFERENCES
70
71
75
77
78
79
82
83
83
83
83
84
87
88
89
96
97
97
98
101
102
104
xiii
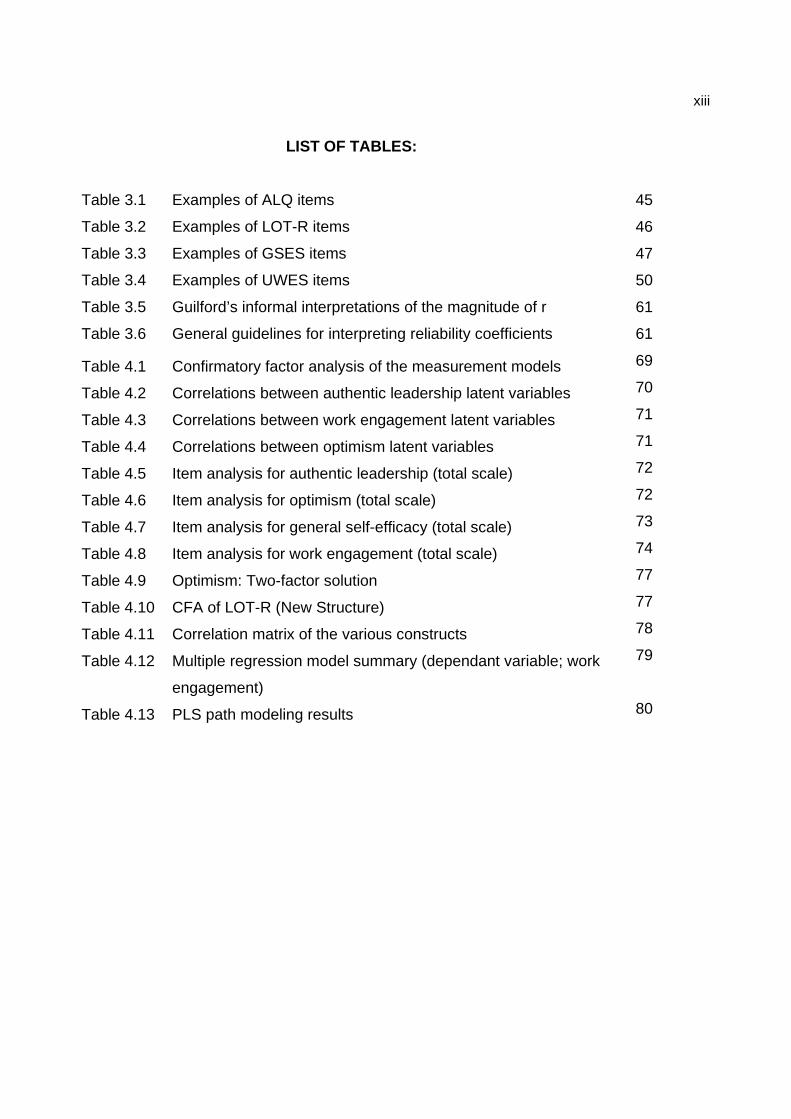
LIST OF TABLES:
Table 3.1 Examples of ALQ items
Table 3.2 Examples of LOT-R items
Table 3.3 Examples of GSES items
Table 3.4 Examples of UWES items
Table 3.5 Guilford’s informal interpretations of the magnitude of r
Table 3.6 General guidelines for interpreting reliability coefficients Table 4.1 Confirmatory factor analysis of the measurement models
Table 4.2 Correlations between authentic leadership latent variables
Table 4.3 Correlations between work engagement latent variables
Table 4.4 Correlations between optimism latent variables
Table 4.5 Item analysis for authentic leadership (total scale)
Table 4.6 Item analysis for optimism (total scale)
Table 4.7 Item analysis for general self-efficacy (total scale)
Table 4.8 Item analysis for work engagement (total scale)
Table 4.9 Optimism: Two-factor solution
Table 4.10 CFA of LOT-R (New Structure)
Table 4.11 Correlation matrix of the various constructs
Table 4.12 Multiple regression model summary (dependant variable; work
engagement)
Table 4.13 PLS path modeling results
45
46
47
50
61
61
69
70
71
71
72
72
73
74
77
77
78
79
80
xiv
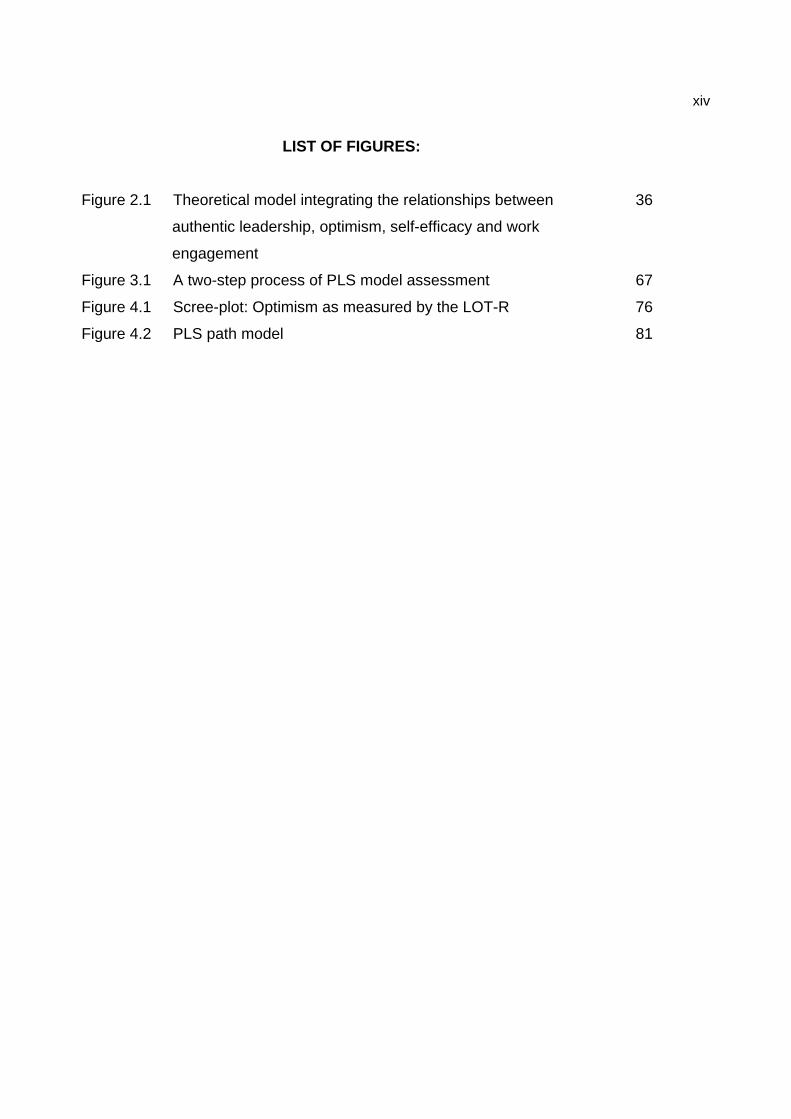
LIST OF FIGURES:
Figure 2.1 Theoretical model integrating the relationships between
authentic leadership, optimism, self-efficacy and work
engagement
Figure 3.1 A two-step process of PLS model assessment
Figure 4.1 Scree-plot: Optimism as measured by the LOT-R
Figure 4.2 PLS path model
36
67
76
81

xv
LIST OF APPENDICES:
Appendix A: Participant consent form
Appendix B: Composite questionnaire
1 CHAPTER 1: THE PROBLEM AND ITS SETTING
1.1 Introduction
This chapter provides a general introduction to the context of the study, exploring the
postulated relationship between authentic leadership, optimism, self-efficacy and work
engagement. The chapter begins by setting the context for the study through an exploration
of the field of positive organisational scholarship in which the study is set. This is followed
by the objectives and aims of the study. Finally the benefits of the study are identified and
an outline of the remainder of the thesis is presented.
1.2 Setting the context for the study
The practice of leadership has existed for thousands of years and research efforts have
been undertaken to better understand leadership in organisations for well over 50 years
(Bass, 1990). Leaders and leadership matter. Effective leaders are associated with
successful work teams, high morale, and peak levels of performance; ineffective leaders
are associated with dissatisfaction, low commitment, and failing performance (Avolio &
Bass, 2002; Bass, 1998; 1999; Collins, 2001a, 2001b; Day, Zaccaro, & Halpin, 2004).
Authenticity, or more precisely the lack thereof, – lies near the heart of the crisis of
confidence in contemporary corporate leadership. The kind of leadership that can restore
confidence comes from individuals who are true to themselves, and whose transparency
“positively transforms or develops associates into leaders themselves” (Luthans & Avolio,
2003, p. 243). The core of authenticity is “to know, accept, and remain true to oneself”
(Avolio, Gardner, Walumbwa, Luthans, & May, 2004, p. 402). Thus according to Avolio et
al. (2004, pp. 403-404), authentic leaders are:
Those individuals who are deeply aware of how they think and behave and perceived by others as being aware of their own and others’ values/moral perspective, knowledge, and strengths; aware of the context in which they operate; and who are confident, hopeful, optimistic, resilient, and high on moral character.
This above-mentioned view on leadership constitutes the foundation of the authentic leadership notion.
2 Positive Organisational Scholarship (POS) is a new development in the Organisational
Behaviour domain. According to Cameron, Dutton, and Quinn (2003), POS is largely
concerned with the investigation of positive outcomes, processes and attributes of
organisations and their employees. Contrary to traditional organisational studies, POS
studies focus on employees’ strengths and psychological capabilities, instead of their
weaknesses and/or inhibiting factors. Within the emerging positive psychology movement,
and concomitant with the positive organisational behaviour/scholarship field, (Luthans,
2001; 2002a, b; Luthans & Jensen, 2001) the notion of authentic leadership fits with the
positive approach to leadership or PAL, as advocated by Luthans, Luthans, Hodgetts, and
Luthans (2002) and Peterson and Luthans (2003).
According to Friedman (2005), traditional approaches are no longer sufficient in today’s
paradigm, the “flat-world” competitive environment. Work in today’s organisations is
becoming more fluid and less bound by space and time due to information technology and
globalization. In this new environment, the rules and boundaries of the playing field for
organisational leaders and employees alike are undergoing paradigmic change. Meeting
the challenge of effectively managing human resources requires new thinking and new
approaches. Simply concentrating and accumulating more of the traditional resources once
considered vital for organisational success have proven insufficient for attaining sustainable
sources of competitive advantage. Examples of such traditional resources include
economic and financial capital, advanced technology, and proprietary information.
Competitive strategies that rely on raising entry barriers are also no longer effective in
creating sources of distinct advantage that can be sustained over the long run (Luthans,
Youssef, & Avolio, 2007).
Luthans and Youssef (2004) argue that now, sustainable competitive advantage can best
be accomplished through context-specific, cumulative, renewable, thus hard-to-imitate
factors, even given the continued presence of traditional material resources. Avolio and
Luthans (2006) suggest that the need to develop authentic leadership has never been
greater, nor have the opportunities ever been available to do so.
The assumption for this study is that certain variables influence work engagement, and, it is
therefore important to gain an understanding of these antecedents of work engagement.
3 The study aims to investigate the respective relationships that exist between the positive
organisational psychological constructs, namely authentic leadership, optimism, self-
efficacy and the influence of these variables on work engagement.
1.3 Theoretical framework of this research
Authentic leadership, optimism, self-efficacy and work engagement have been identified as
constructs that can be included in the positive organisational behaviour approach. Although
these constructs still warrant further research and validation, it is important to determine the
possible relationship between the constructs in order to understand how to effectively
develop and implement possible interventions that will enhance the levels of employee
work engagement in organisations.
1.4 Defining the constructs
1.4.1 Definitions of authentic leadership
As is the case with all leadership studies and leadership definitions, despite the vast
amount of work done on it, a precise and specifically pin-pointed definition of leadership still
seems to be evasive in nature, let alone attempting this with authentic leadership. Authentic
leadership in organisations is defined in general as a process that draws from both positive
psychological capacities and a highly developed organisational context, which results in
both greater self-awareness and self-regulated positive behaviours on the part of leaders
and associates, fostering positive self-development. The authentic leader does not try to
coerce or even rationally persuade associates, but rather the leader’s authentic values,
beliefs, and behaviours serve to model the development of associates (Luthans & Avolio,
2003). According to Terez (2007), this leadership ethic of the authentic leader refers to
striving towards “power with them” (shared power) versus “power over them” (individualised
and ulterior motive driven power).
Consistent with Avolio and colleagues (e.g., Avolio, Luthans, & Walumba, 2004; Luthans &
Avolio, 2003; May, Chan, Hodges, & Avolio, 2003), authentic leadership is considered as a
root construct which can incorporate transformational and ethical leadership. As noted with
transformational leadership (Avolio,1999), authentic leaders can be directive or
participative, and could even be authoritarian. The behavioural style per sé is not what
4 necessarily differentiates the authentic from the inauthentic leader. Authentic leaders act in
accordance with deep personal values and convictions, to build the credibility, respect and
trust of followers by encouraging diverse view points and building networks of collaborative
relationships with followers, thereby leading in such a way that followers recognise as
authentic. As this process cascades to followers, they may also start operating in a similar
manner, portraying to leaders, colleagues, customers, and other interested stakeholders
their true/real authenticity, which over time may become a basis for the organisation’s
culture (Avolio et al.,2004).
George (2003) posits that authentic leaders genuinely desire to serve others through their
leadership, are more interested in empowering the people they lead to make a difference,
and are as guided by qualities of the heart, passion and compassion, as they are by
qualities of the mind. Accordingly, Luthans and Avolio (2003) note that authentic leaders
recognise and value individual differences and have the ability and motivation to identify
people’s talents and help them build those talents into strengths. This in turn ties to the
notion of building and expanding positive organisational behaviour, as referred to earlier.
1.4.1.1 Operational definition of authentic leaders hip
Walumbwa, Avolio, Gardner, Wernsing and Peterson (2008, p. 4) modified Luthans and
Avolio’s (2003) initial definition of authentic leadership to advance a refined definition that
more fully reflects the underlying dimensions of the construct posited by Gardner, Avolio,
Luthans, May and Walumbwa (2005) and Ilies et al. (2005). Specifically, authentic
leadership is defined as “a pattern of leader behaviour that draws upon and promotes both
positive psychological capacities and a positive ethical climate, to foster greater self-
awareness, an internalised moral perspective, balanced processing of information, and
relational transparency on the part of leaders working with followers, fostering positive self-
development”. For the purposes of this study, this modified definition of authentic
leadership will be utilised.
1.5 Definitions of optimism
Seligman (1990) defines optimism as making an internal, relatively stable, and global
attribution regarding positive events, such as goal achievement, and an external relatively
unstable, and specific cause for negative events like a failed attempt of reaching a goal. To
5 avoid the criticism of false optimism, positive organisational behaviour (POB) tends to
emphasize realistic optimism (Luthans, 2002b, Luthans, Youssef, & Avolio, 2007;
Schneider, 2001). In other words, optimism is not based on an unchecked process that has
no realistic assessment. This realistic optimism as a state (as opposed to a dispositional
trait), includes an objective assessment of what one can accomplish in a specific situation,
given the available resources at the time. Seligman (2002) found that optimism was
significantly and positively related to the performance of insurance agents. In addition, in a
study of Chinese factory workers (Luthans, Avolio, Walumbwa, & Li, 2005), found optimism
to have a significant relationship with rated performance. Youssef and Luthans’ (2007)
study found employees’ optimism to be related to their performance, satisfaction and
happiness.
According to Gabris, Maclin, and Ihrke (1998), optimism introduces one to the belief, or at
least the hope, that through the responsible use of knowledge and reason, mankind can
improve existing conditions. Rather than accept the status quo as the best of all possible
worlds, the optimistic approach asks how can things be improved or made better? More
fundamentally, the optimistic approach allows, if not encourages, one to take control of
one’s social and material destiny. Conversely to this approach, is organisational scepticism.
It seems within reason that most organisations fall somewhere between these two
extremes of organisational scepticism and optimism.
Moreover, Wrosch, and Scheier (2003) indicate that as opposed to the attributional
approach to optimism, dispositional optimism does not differentiate the basis of
expectation, i.e. not establishing whether a person would for example hold positive
expectations about the future because s/he is efficatious or because s/he is lucky.
1.5.1 Operational definition of optimism
Scheier and Carver (1985) define dispositional optimism as a general expectation of
experiences throughout one’s life. Dispositional optimism can be defined as a person’s
positive outlook towards life events (Ebert, Tucker, & Roth, 2002; Scheier, Carver, &
Bridges, 1994). Optimists believe that good outcomes will occur in life and can therefore
appraise stressful events more positively and mobilise their resources to take direct action
6 in response to a stressor. For the purposes of this study, Scheier et al.’s (1994) definition
of optimism will be utilised.
1.5.1.1 The importance of optimism in examining aut hentic leadership
According to Kouzes and Posner (1998) leaders are change agents who challenge the
status quo, rock the boat, and are intrigued by adaptive puzzles posed by organisational
environments (or internal processes within organisations). Importantly, optimistic leaders
feel they can frame solutions to puzzles and subsequently influence the success of the
organisation in moving toward preferred outcomes. Obstacles, instead of becoming a
source of despondency, are often seen as opportunities for doing something new. To be
successful, leaders need to become skilled in several competencies. Kouzes and Posner
(1998) succinctly summarise these as follows:
• Challenging the process: searching for opportunities, taking risks;
• Inspiring a shared vision: envisioning the future, enlisting others;
• Enabling others to act: fostering collaboration, strengthening others;
• Modeling the way: setting examples, planning small wins; and
• Encouraging the heart: recognising individual contributions, celebrating
accomplishments.
According to Gardner and Schermerhorn (2004), one of the important tasks of the authentic
leader is to raise optimism. In his wide-spread and influential books, Learned Optimism
(1990) and Authentic Happiness (2002), psychologist Martin Seligman describes the
powerful effects that an optimistic versus pessimistic explanatory style can exert on one’s
life. Optimists tend to attribute their successes to internal, stable and global causes, such
as their own abilities: they identify external, unstable, and specific causes for failure.
Optimists expect to encounter continuous success in the future. They also tend to
experience positive emotional states such as pride, happiness, satisfaction and
enthusiasm, while their more pessimistic counterparts report higher levels of passivity and
depression. Finally they enjoy a host of positive outcomes, including higher levels of
motivation, perseverance, and achievement resulting in academic, political, athletic, and/or
occupational success, physical and mental health.
7 Research supports that leaders who are positive are also more authentic and effective
(Avolio & Luthans, 2006; Luthans, Norman, & Hughes, 2006). Staw and Barsade (1993)
report on research evidence that leaders who think positively are not only more effective
interpersonally but also have higher quality of decision making skills, including the superior
ability to collect and use more information and act on situational contingencies. On the
contrary, negativity has been shown to be related with various performance-inhibiting
mechanisms, such as memory decay (Judge & Ilies, 2004).
Law, Wong and Mobley (1998) provided a conceptual framework for determining how multi-
dimensional constructs can relate to a core factor. The “latent model” that Law et al. (1998)
describe refers to what Luthans et al. (2007) refer to as psychological capital (PsyCap) in
having specified a higher-level core construct that underlies the four dimensions of hope,
resilience, optimism and efficacy. The higher order core construct of PsyCap represents the
commonality among the four component dimensions, and has both conceptual (Luthans &
Youssef, 2004; Luthans et al., 2007) and empirical (Luthans, Avolio, Avey, & Norman,
2006) support. PsyCap can be viewed as “who you are” and “what you can become in
terms of positive development” (Avolio & Luthans, 2006) and is differentiated from human
capital (“what you know”), social capital (“who you know”), and financial capital (“what you
have”) (Luthans & Youssef , 2004).
PsyCap has been specifically defined by Luthans et al. (2007, p. 3) as:
an individual’s positive psychological state of development that is characterised by (1) having confidence (self-efficacy) to take on and put in the necessary effort to succeed at challenging tasks; (2) making a positive attribution (optimism) about succeeding now and in the future; (3) persevering toward goals and, when necessary, redirecting paths to goals (hope) in order to succeed; and (4) when beset by problems and adversity, sustaining and bouncing back and even beyond (resiliency) to attain success.
With regard to authentic leadership, PsyCap optimism contributes to, and is the result of,
the strong foundation of self-awareness (Avolio & Luthans, 2006; Luthans & Avolio, 2003;
Luthans, Norman, & Hughes, 2006). The self-awareness of authentic leaders draws its
accuracy and objectivity from multi-source feedback, which is motivated by the authentic
leader’s genuine desire for sustainable improvement and transparent trust-building.
8 Moreover, authentic leaders’ capacity for self-regulation is conducive to adaptation,
responsiveness, and continuous self-development, which are highly consistent with
PsyCap optimism (Avolio & Luthans, 2006; Luthans & Avolio, 2003; Luthans et al., 2006).
Organisational leaders with a high level of PsyCap optimism are risk-takers, but since they
are realistic and flexible, they tend to take only calculated and necessary risks. They know
that their role is to be agents of change (Luthans et al., 2007). They dare to dream for
themselves, their associates and their organisations. They then enthusiastically pursue
their dreams as they inspire, motivate and involve their associates. Additionally, leaders
with high PsyCap optimism would have a good handle on their capacities and
vulnerabilities, as well as those of their followers and are self-aware and have greater locus
of control levels. Their PsyCap optimism motivates them to develop and improve
themselves and their followers. According to Luthans et al. (2007) leaders with high
PsyCap optimism do not resort to blame-shifting and shallow impression-management
techniques in order to take credit for more than what their efforts have warranted or to
avoid responsibility or accountability. They are secure in their positive outlook and have
realistic, accurate knowledge of their own and their followers’ accomplishments.
Leaders with high PysCap optimism emphasize the development of their followers. They
take prize in the success of their followers rather than envying them and trying to take
credit for their accomplishments, as if they were their own. Most importantly, as these
effective leaders develop their associates, they help them build their own realistic, flexible
optimism. Rather than doing everything and making all of the decisions for them, high
PsyCap optimistic leaders enable, empower, delegate and trust their followers to achieve
the desired outcomes. They equip their people with the necessary knowledge, skills,
abilities, and motivation not only to succeed but also to make personal, permanent, and
pervasive attributions of their own (Luthans et al., 2007). Schneider (2001) suggests three
perspectives that leaders can adopt that are particularly applicable in developing realistic
optimism in the workplace: (1) leniency for the past (2) appreciation for the present; and (3)
opportunity seeking for the future.
Moreover, Likert (1967) provides even further support for the optimistic leadership
approach by documenting how employees clearly prefer the more consultative, participative
9 management systems. Perrow (1986) criticizes the validity of Likert’s research questions,
but even if some of these are “loaded” as Perrow suspects, the research still supports the
basic contention that more optimistic managerial models increase performance (Hackman
& Oldham, 1990; Likert, 1967).
1.6 Definitions of self-efficacy
Self-efficacy is best understood in the context of social cognitive theory – an approach to
understanding human cognition, action motivation, and emotion that assumes we are active
shapers, rather than simply passive reactors to our environments (Bandura, 1986, 1997).
Bandura (1997) referred to the probability that people estimate that they can take on a
particular task as an estimate of their self-efficacy. According to theory and research by
Bandura (1989), self-efficacy makes a difference to how people think, feel, and act.
Although originally described as applying to a very specific domain of activity, there is
increasing recognition that individuals can also have a “generalised” level of self-efficacy
across a common domain of challenges and tasks, such as the workplace (Parker, 1998).
Bandura (1997, p. 3) defines self-efficacy as “beliefs in one’s capabilities to organise and
execute the courses of action required to produce given attainments.” Self-efficacy can be
viewed as a concept of perceived competence (Bandura, 1997). However, Bosscher and
Smit (1998) argue that numerous experiences of failure and success in various domains of
an individual’s life may also be important to understand how an individual may generate
general beliefs about self-efficacy. Generalised self-efficacy is defined by Judge, Erez,
Bono, and Thoreson (2002, p. 96) as a “judgement of how well one can perform across a
variety of situations.” General self-efficacy is therefore a motivational state because it
involves the individual’s beliefs regarding his/her abilities to perform and succeed at tasks
across different situations (Kanfer & Heggestad, 1997).
It is therefore possible to distinguish between specific self-efficacy (SSE) (which is task
specific) and general self-efficacy (GSE) (which is global in nature). However, both have
self-confidence as the basis of self-evaluation. “The importance of the GSE construct to
organisational research lies in its ability to (a) predict SSE across situations and tasks, (b)
predict general and comprehensive performance criteria, and (c) buffer against the
debilitating effects of adverse experiences on subsequent SSE” (Chen, Gully, & Eden,
10 2001, p. 67). Based on Chen and colleagues’ opinion (2001), it is thus possible to state that
general self-efficacy is able to predict performance on specific situations. Therefore, an
individual’s general perception of confidence spills over to specific situations and the
associated levels of confidence (Chen et al., 2001). The latter provides support for the
inclusion of general self-efficacy in their study and its ability to predict specific performance
related confidence (Chen et al., 2001).
Moreover, according to Luthans et al. (2007) PsyCap efficacy is deeply based on
Bandura’s (1986, 1997, 2001) social cognitive theory, which includes his five identified
cognitive processes that are vital constituents of the efficacy equation; symbolizing,
forethought, observation, self-regulation, and self-reflection. Drawing from Bandura’s (1986,
1997) extensive theory and research, PsyCap efficacy (or, simply, confidence) can be
defined as “one’s conviction (or confidence) about his or her abilities to mobilize the
motivation, cognitive resources, and courses of action needed to successfully execute a
specific task within a given context” (Stajkovic & Luthans, 1998b, p. 66). Although Bandura
(1997) sparingly uses the term confidence and most efficacy theorists tend to treat
confidence as conceptually subordinate to efficacy, especially in positive psychology, the
terms are used interchangeably (Maddux, 2002).
However, when used in the more applied domain of sports or business performance,
confidence is the commonly used term (e.g., Kanter, 2004). For the purposes of this study,
the author has chosen to use the two terms interchangeably to reflect the rich theoretical
and research bases of self-efficacy (e.g., Bandura, 1997) and the more applied orientation
associated with confidence (e.g., Kanter, 2004). Whether one uses efficacy or confidence
in the definition above, it is important to emphasize the link to one’s belief. Self-efficacious
people are distinguished by five important characteristics. They:
(1) set high goals for themselves and self-select into difficult tasks;
(2) welcome and thrive on challenge(s);
(3) are highly self-motivated;
(4) invest the necessary effort to accomplish their goals;
(5) persevere when faced with obstacles.
11 These five characteristics equip high efficacy individuals with the capacity to develop
independently and perform effectively, even with little external input for extended periods of
time. People with high PsyCap efficacy do not wait for challenging goals to be set for them,
which is often referred to as “discrepancy reduction” (Luthans et al., 2007). On the contrary,
they create their own discrepancies by continuously challenging themselves with higher
self-set goals and by seeking and voluntarily opting for difficult tasks (Luthans et al., 2007).
Self-doubt, scepticism, negative feedback, social criticism, obstacles and setbacks, and
even repeated failure, which can be devastating for people with low efficacy, have little
impact on efficacious individuals (Bandura & Locke, 2003).
As posited by Eden and Sulimani (2002), the means efficacy construct was introduced to
refer to the belief one has in the utility of the equipment, techniques, and procedures
available for performing a task. All other things being equal, if employees believe they
have the best equipment and techniques to do their work, they will perform at higher levels.
Although relatively new, recent experimental studies by Eden and colleagues (e.g., Eden &
Granat-Flowmin, 2000; Eden & Sulimani, 2002) provide support for means efficacy as a
way of producing significant performance improvements independent of the effects of
raising levels of self-efficacy.
1.6.1 Operational definition of self-efficacy
Self-efficacy theory has proposed that all forms of psychotherapy and behavioral change
operate through a common mechanism: the alteration of the individual’s expectations of
personal mastery and success (Bandura, 1977, 1982). According to this theory, two types
of expectancies exert powerful influences on behaviour: outcome expectancies, the belief
that certain behaviours will lead to certain outcomes; and self-efficacy expectancy, the
belief that one can successfully perform the behaviour in question (Sherer, Maddux, &
Rogers, 1982). For the purposes of this study Sherer et al.’s (1982) definition will be
utilised.
1.6.1.1 The importance of self-efficacy in examinin g authentic leadership
There have been a number of attempts to conceptually (Luthans, Luthans, Hodgetts, &
Luthans, 2002, McCormick, 2001) and through research (Chemers, Watson, & May, 2000;
Chen & Bliese, 2002, Walumbwa, Lawler, Avolio, Wang, & Shi, 2005) link self-efficacy and
12 leadership. Since self-efficacy is supported by theory and research to be a psychological
state (as apposed to a fixed trait) and thus open to development (Bandura, 1997, 2000;
Luthans, 2002a, 2002b; Maddux, 2002; Karl, O’Leary-Kelly, & Martocchio, 1993;
Martocchio, 1994; Martoccchio & Judge, 1997; Strajkovic & Luthans, 1998a, 1998b), Avolio
and Walumbwa (2006), propose that authentic leader behaviour can play a significant role
in developing self-efficacy and subsequently performance over time.
In line with Eagly and Chaiken’s (1993); Snyder and Lopez’s (2002) view on verbal
persuasion, Maddux (2002) also supports the notion that efficacy beliefs are influenced by
what others say to us about what they believe one can or cannot do. He identifies two
interacting factors that can contribute to self-efficacy with leadership implications: (1) the
development of the capacity for symbolic thought and the responsiveness and, (2)
supportiveness of the social context in which leaders and followers are embedded over
time. In this regard, the capacity for unencumbered symbolic thought would certainly relate
to what may be termed deep self-awareness. Such a positive ethical and engaged climate
is parallel to what could be considered a supportive social context.
Avolio and Luthans (2006); Luthans and Avolio (2003); Luthans et al. (2006) propose that
PsyCap efficacy can lead to an upward spiral of confidence and veritable performance. The
potential for upward spirals and contagion effects of PsyCap self-efficacy provides
considerable development implications for both leaders and followers. Avolio and Luthans
(2006) posit that if PsyCap self-efficacy can cascade down to their followers, then
investments in authentic leadership development (ALD), which incorporates the
development of leader’s PsyCap self-efficacy as well as the leader’s development of their
own followers, are likely to yield exponential returns that far exceed conservative estimates.
The unwarranted assumptions of bottom-line-oriented decision-makers that human
resource investments are not worth their while, are being consistently challenged in today’s
business environment (Pfeffer, 1998), and PsyCap self-efficacy presents researchers and
practitioners with yet another contribution to the increasing evidence supporting the vital
role of human resources in creating sustainable competitive advantage.
13 Moreover, as confidence is likely to enhance employees’ ability to perform independently,
various leadership-style contingencies are likely to surface. For example, it is possible that
PsyCap self-efficacy may act as a leadership substitute (e.g., Kerr & Jermier, 1978), which
may threaten inauthentic, power-focused leaders from developing their followers’ PsyCap
self-efficacy. Mediating and moderating factors (e.g., task complexity, degree of diversity) in
organisational structure and culture should therefore also be considered in order to account
more fully for the salient role of organisational leaders in nurturing versus inhibiting the
development of PsyCap self-efficacy in their followers.
Recent psychology and organisational behaviour research related to training and
performance suggests that both optimism (Schulman, 1999) and self-efficacy (Karl,
O’Leary-Kelly, & Martocchio, 1993) can be enhanced, increased, and nurtured with
appropriate coaching.
1.7 Definitions of work engagement
The concept of work engagement is relevant for organisations for various reasons. Firstly,
work engagement is related to job satisfaction, organisational commitment and low turnover
intention (May, Gilson, & Harter, 2004; Schaufeli & Bakker, 2004). Secondly, work
engagement is related to personal initiative and learning (Sonnetag, 2003). Therefore
research regarding the psychological foundations of work engagement could enable
researchers and practioners to understand and predict why some employees
psychologically identify with their jobs while others do not.
Macey and Schneider (2008) postulate that numerous definitions of work engagement can
be derived from practice – and research driven literature. Common to these definitions is
the notion that work engagement is a desirable condition, has an organisational purpose,
and connotes involvement, commitment, passion, enthusiasm, focused effort, and energy,
so it has both attitudinal and behavioural components. To this end, Erickson (2005)
explains that the antecedents of such attitudes and behaviours are located in conditions
under which people work, and consequences are thought to be of value to organisational
effectiveness.
14 Although seemingly compelling on the surface, the meaning of work engagement is rather
unclear. In large part, this can be attributed to the “bottom-up” manner in which the
engagement notion has quickly evolved within the practitioner community. This is not an
unfamiliar stage in the incremental evolution of an applied psychological construct. Macey
and Schneider (2008) posit that engagement is a concept with a sparse and diverse
theoretical and empirically demonstrated nomological network – and that the relationships
among potential antecedents and consequences of engagement, as well as the
components of engagement have not been rigorously conceptualised and even less
studied. The question remains as to whether engagement is a unique concept or merely a
repackaging of other constructs. Kelly (1927) refers to this as the “Jangle Fallacy.”
Confusion around engagement exists because engagement is used by some to refer to a
specific construct (e.g., involvement, initiative, sportsmanship, altruism) with unique
attributes and by others as a performance construct defined as exceeding some typical
level of performance (Macey & Schneider, 2008). For example, Wellins and Concelman
(2005a, p. 1) suggest that engagement is “the illusive force that motivates employees to
higher (or lower) levels of performance.” Colbert, Mount, Harter, Witt, and Barrick (2004, p.
603) define engagement in terms of a “high internal motivational state.” Similarly, Dvir,
Eden, Avolio and Shamir (2002, p. 737) define active engagement in terms of “high levels
of activity, initiative, and responsibility.” One can therefore see engagement being defined
both attitudinally and behaviourally. Harter, Schmidt and Keyes (2003, p. 269) definition of
employee engagement “refers to the individual’s involvement and satifaction with as well as
enthusiasm for work’’.
According to Maslach and Leiter (1997), engagement is characterised by energy,
involvement and efficacy. Engaged individuals are assumed to have a sense of energetic
and effective connection with their work activities, and they see themselves as able to deal
completely with the demands of work. Work engagement is not a momentary specific state,
but a more persistent and pervasive affective-cognitive state that is not focused on a
particular object, event, individual or behaviour (Schaufeli, Salanova, Gonzáles-Romá, &
Bakker, 2002a).
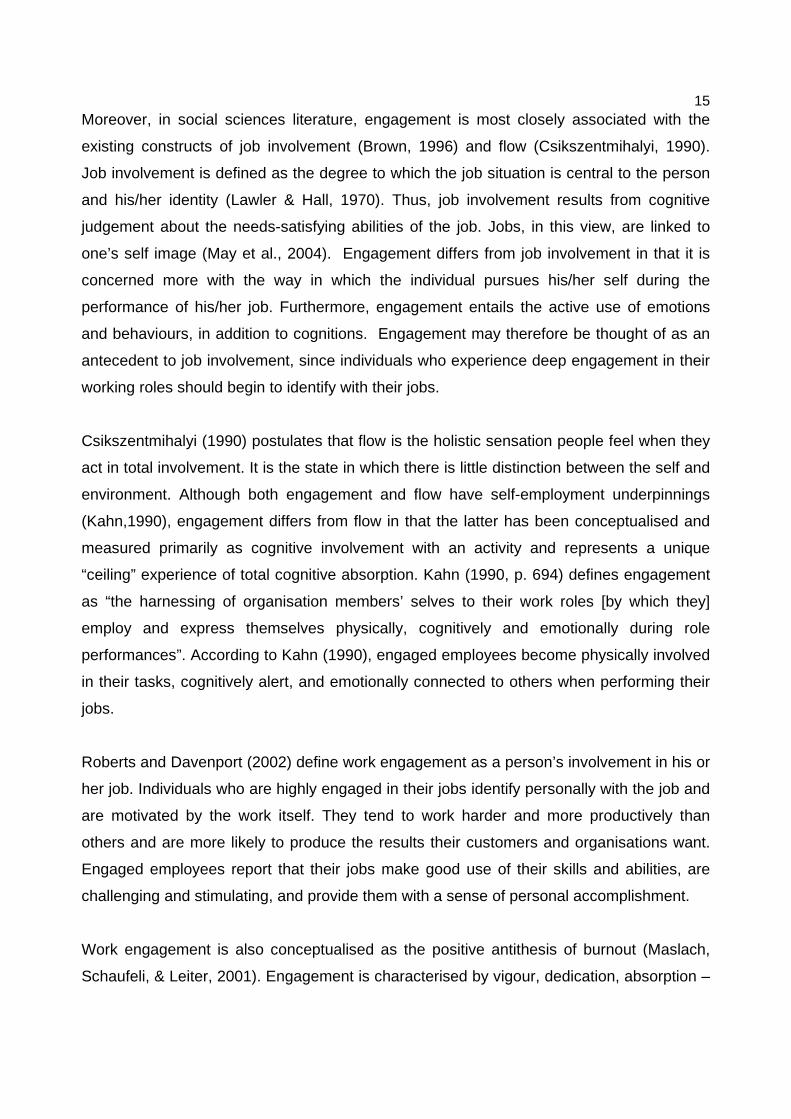
15 Moreover, in social sciences literature, engagement is most closely associated with the
existing constructs of job involvement (Brown, 1996) and flow (Csikszentmihalyi, 1990).
Job involvement is defined as the degree to which the job situation is central to the person
and his/her identity (Lawler & Hall, 1970). Thus, job involvement results from cognitive
judgement about the needs-satisfying abilities of the job. Jobs, in this view, are linked to
one’s self image (May et al., 2004). Engagement differs from job involvement in that it is
concerned more with the way in which the individual pursues his/her self during the
performance of his/her job. Furthermore, engagement entails the active use of emotions
and behaviours, in addition to cognitions. Engagement may therefore be thought of as an
antecedent to job involvement, since individuals who experience deep engagement in their
working roles should begin to identify with their jobs.
Csikszentmihalyi (1990) postulates that flow is the holistic sensation people feel when they
act in total involvement. It is the state in which there is little distinction between the self and
environment. Although both engagement and flow have self-employment underpinnings
(Kahn,1990), engagement differs from flow in that the latter has been conceptualised and
measured primarily as cognitive involvement with an activity and represents a unique
“ceiling” experience of total cognitive absorption. Kahn (1990, p. 694) defines engagement
as “the harnessing of organisation members’ selves to their work roles [by which they]
employ and express themselves physically, cognitively and emotionally during role
performances”. According to Kahn (1990), engaged employees become physically involved
in their tasks, cognitively alert, and emotionally connected to others when performing their
jobs.
Roberts and Davenport (2002) define work engagement as a person’s involvement in his or
her job. Individuals who are highly engaged in their jobs identify personally with the job and
are motivated by the work itself. They tend to work harder and more productively than
others and are more likely to produce the results their customers and organisations want.
Engaged employees report that their jobs make good use of their skills and abilities, are
challenging and stimulating, and provide them with a sense of personal accomplishment.
Work engagement is also conceptualised as the positive antithesis of burnout (Maslach,
Schaufeli, & Leiter, 2001). Engagement is characterised by vigour, dedication, absorption –
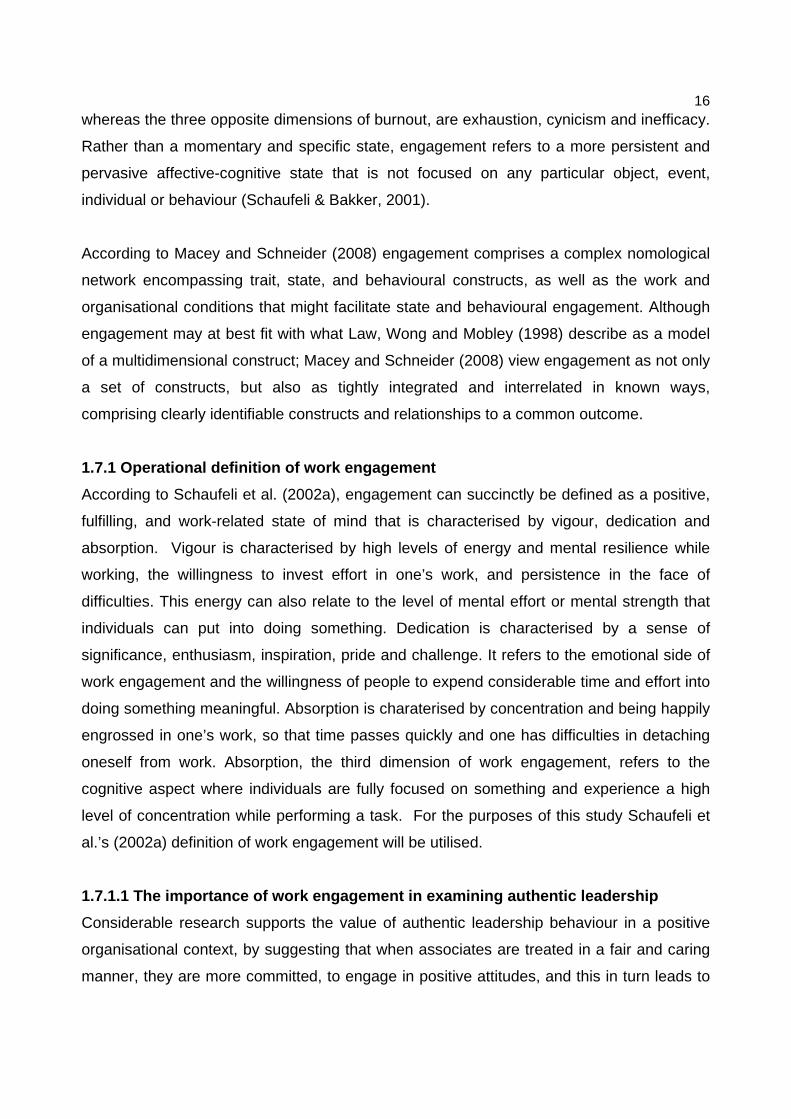
16 whereas the three opposite dimensions of burnout, are exhaustion, cynicism and inefficacy.
Rather than a momentary and specific state, engagement refers to a more persistent and
pervasive affective-cognitive state that is not focused on any particular object, event,
individual or behaviour (Schaufeli & Bakker, 2001).
According to Macey and Schneider (2008) engagement comprises a complex nomological
network encompassing trait, state, and behavioural constructs, as well as the work and
organisational conditions that might facilitate state and behavioural engagement. Although
engagement may at best fit with what Law, Wong and Mobley (1998) describe as a model
of a multidimensional construct; Macey and Schneider (2008) view engagement as not only
a set of constructs, but also as tightly integrated and interrelated in known ways,
comprising clearly identifiable constructs and relationships to a common outcome.
1.7.1 Operational definition of work engagement
According to Schaufeli et al. (2002a), engagement can succinctly be defined as a positive,
fulfilling, and work-related state of mind that is characterised by vigour, dedication and
absorption. Vigour is characterised by high levels of energy and mental resilience while
working, the willingness to invest effort in one’s work, and persistence in the face of
difficulties. This energy can also relate to the level of mental effort or mental strength that
individuals can put into doing something. Dedication is characterised by a sense of
significance, enthusiasm, inspiration, pride and challenge. It refers to the emotional side of
work engagement and the willingness of people to expend considerable time and effort into
doing something meaningful. Absorption is charaterised by concentration and being happily
engrossed in one’s work, so that time passes quickly and one has difficulties in detaching
oneself from work. Absorption, the third dimension of work engagement, refers to the
cognitive aspect where individuals are fully focused on something and experience a high
level of concentration while performing a task. For the purposes of this study Schaufeli et
al.’s (2002a) definition of work engagement will be utilised.
1.7.1.1 The importance of work engagement in examin ing authentic leadership
Considerable research supports the value of authentic leadership behaviour in a positive
organisational context, by suggesting that when associates are treated in a fair and caring
manner, they are more committed, to engage in positive attitudes, and this in turn leads to

17 trust in the leader and the system as a whole (Cropanzano & Greenberg, 1997; Dirks &
Ferrin, 2001, 2002; Rhoades, Eisenberg, & Arneli, 2001; Zaheer, McEvily, & Perrone,
1998).
Avolio and Walumbwa (2006) argue that the role of an engaged organisational
culture/climate is one of the most relevant positive contextual factors for the authentic
leadership process. Specifically, these authors propose environments that provide open
access to information, resources, support, and equal opportunity for everyone to learn and
develop, and empower and also enable leaders and their associates to accomplish their
work. This suggests that for the self and followers to be effective, organisational leaders
must provide an inclusive organisational climate that enables themselves and followers to
continually learn and grow.
Luthans and Avolio (2003) posit that authentic leaders, through processes of personal and
social identification, enhance positive emotions in followers (hope, trust, optimism), which
impact follower work attitudes (commitment, engagement) resulting in follower behaviours
that increase performance (more effort, fewer withdrawal behaviours).
Work engagement has been recognised as providing positive outcomes in terms of work
wellness for several reasons. Firstly, work engagement is a positive experience in itself
(Schaufeli, Martinez, Marques Pinto, Salanova, & Bakker, 2002b). Secondly, it is related to
good health and positive work effect (Demerouti, Bakker, De Jonge, Janssen, & Schaufeli,
2001; Rothbard, 2001). Thirdly, work engagement helps individuals derive benefits from
stressful work (Britt, Adler, & Bartone, 2001). Fourthly, work engagement is positively
related to work commitment (Demerouti, Bakker, Nachreiner, & Schaufeli, 2001). It is also
proposed to affect employee performance (Kahn, 1990).
It is thus important for authentic leaders to cultivate work engagement, given that
disengagement, or alienation, is central to the problem of employees’ lack of commitment
and motivation. Meaningless work is often associated with apathy and detachment from
one’s work (Thomas & Velthouse, 1990). Under such conditions, individuals are thought to
become estranged from their “selves” (Seeman, 1972) and restoration of meaning in work
is regarded as fostering an employee’s motivation and attachment to work. Thus, there are
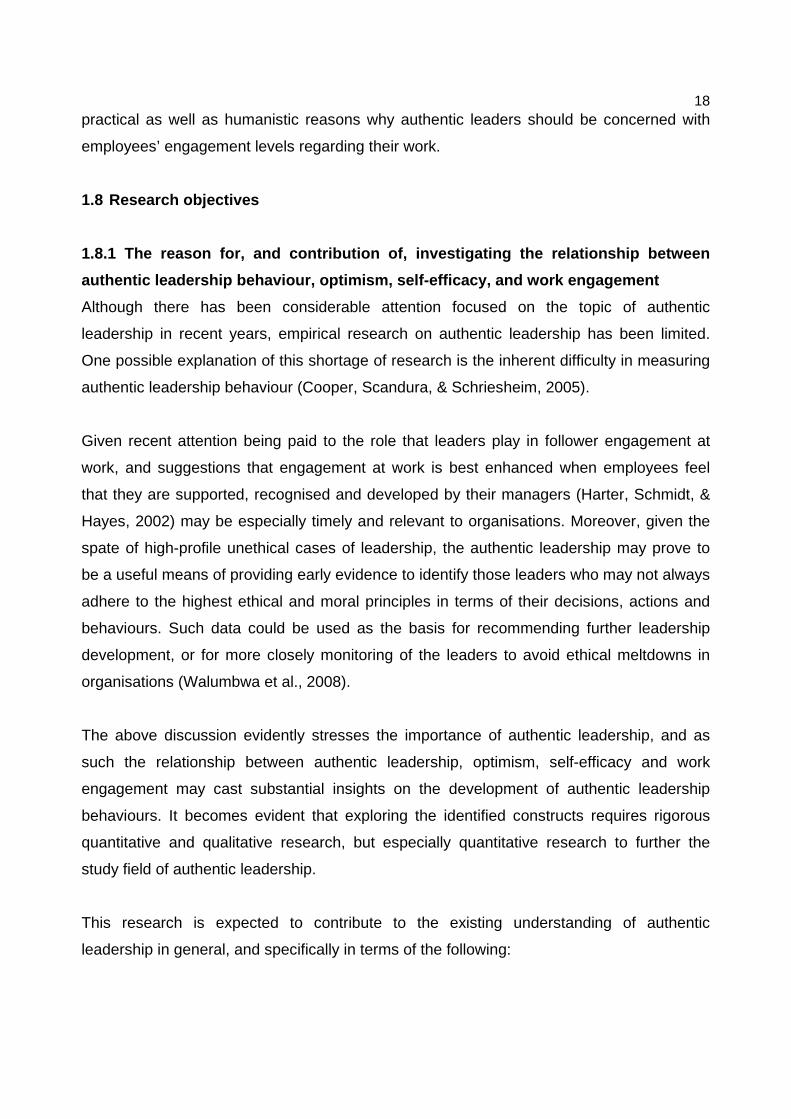
18 practical as well as humanistic reasons why authentic leaders should be concerned with
employees’ engagement levels regarding their work.
1.8 Research objectives
1.8.1 The reason for, and contribution of, investig ating the relationship between
authentic leadership behaviour, optimism, self-effi cacy, and work engagement
Although there has been considerable attention focused on the topic of authentic
leadership in recent years, empirical research on authentic leadership has been limited.
One possible explanation of this shortage of research is the inherent difficulty in measuring
authentic leadership behaviour (Cooper, Scandura, & Schriesheim, 2005).
Given recent attention being paid to the role that leaders play in follower engagement at
work, and suggestions that engagement at work is best enhanced when employees feel
that they are supported, recognised and developed by their managers (Harter, Schmidt, &
Hayes, 2002) may be especially timely and relevant to organisations. Moreover, given the
spate of high-profile unethical cases of leadership, the authentic leadership may prove to
be a useful means of providing early evidence to identify those leaders who may not always
adhere to the highest ethical and moral principles in terms of their decisions, actions and
behaviours. Such data could be used as the basis for recommending further leadership
development, or for more closely monitoring of the leaders to avoid ethical meltdowns in
organisations (Walumbwa et al., 2008).
The above discussion evidently stresses the importance of authentic leadership, and as
such the relationship between authentic leadership, optimism, self-efficacy and work
engagement may cast substantial insights on the development of authentic leadership
behaviours. It becomes evident that exploring the identified constructs requires rigorous
quantitative and qualitative research, but especially quantitative research to further the
study field of authentic leadership.
This research is expected to contribute to the existing understanding of authentic
leadership in general, and specifically in terms of the following:
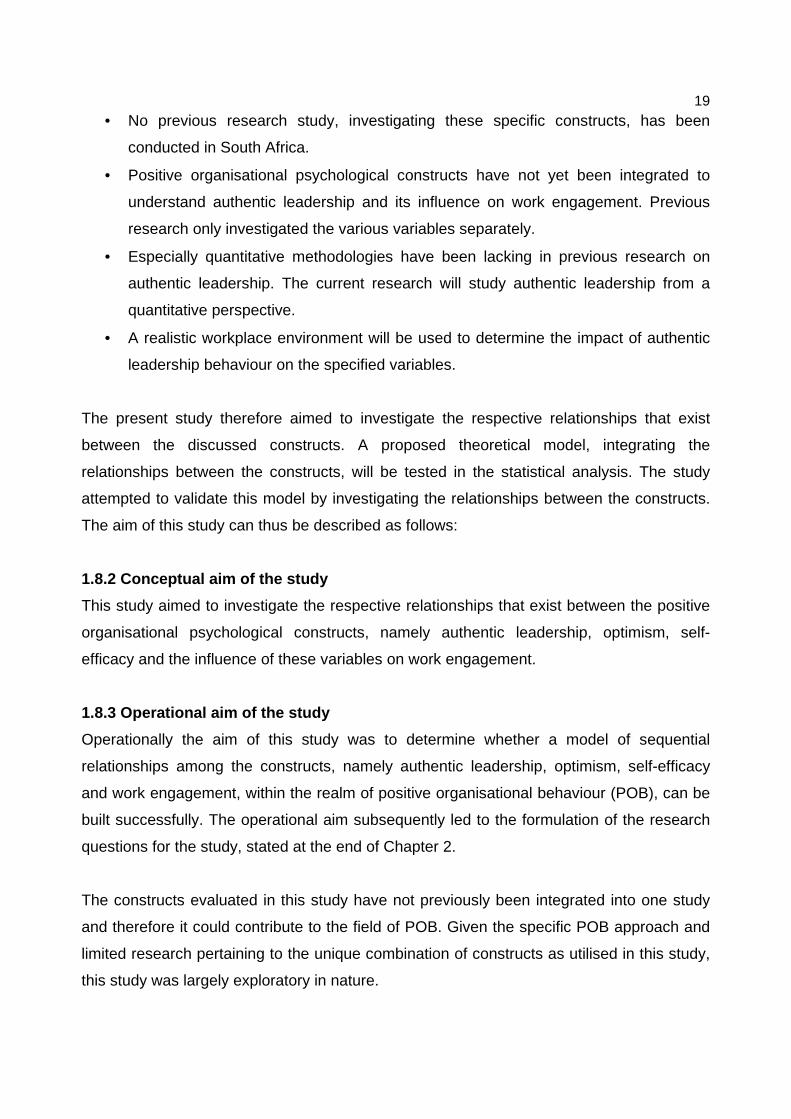
19 • No previous research study, investigating these specific constructs, has been
conducted in South Africa.
• Positive organisational psychological constructs have not yet been integrated to
understand authentic leadership and its influence on work engagement. Previous
research only investigated the various variables separately.
• Especially quantitative methodologies have been lacking in previous research on
authentic leadership. The current research will study authentic leadership from a
quantitative perspective.
• A realistic workplace environment will be used to determine the impact of authentic
leadership behaviour on the specified variables.
The present study therefore aimed to investigate the respective relationships that exist
between the discussed constructs. A proposed theoretical model, integrating the
relationships between the constructs, will be tested in the statistical analysis. The study
attempted to validate this model by investigating the relationships between the constructs.
The aim of this study can thus be described as follows:
1.8.2 Conceptual aim of the study
This study aimed to investigate the respective relationships that exist between the positive
organisational psychological constructs, namely authentic leadership, optimism, self-
efficacy and the influence of these variables on work engagement.
1.8.3 Operational aim of the study
Operationally the aim of this study was to determine whether a model of sequential
relationships among the constructs, namely authentic leadership, optimism, self-efficacy
and work engagement, within the realm of positive organisational behaviour (POB), can be
built successfully. The operational aim subsequently led to the formulation of the research
questions for the study, stated at the end of Chapter 2.
The constructs evaluated in this study have not previously been integrated into one study
and therefore it could contribute to the field of POB. Given the specific POB approach and
limited research pertaining to the unique combination of constructs as utilised in this study,
this study was largely exploratory in nature.
20 1.9 Study outline
Chapter 2 focuses on a review of the current literature on each of the respective constructs
used in the study, namely authentic leadership, optimism, self-efficacy and work
engagement. The chapter also includes cited research on the inclusion of each of these
constructs in the study of authentic leadership. Previous research conducted on these
constructs and possible relationships between the respective constructs are also
discussed. Finally, the research propositions are stated and the theoretical model of the
study is outlined.
Chapter 3 describes the methodology employed in this study, which includes confirmatory
and exploratory factor analysis, correlation analysis, multiple regression analysis and
structural equation modeling through the use of partial least squares path modeling. The
results of the quantitative data analyses, including the obtained factor structures for each of
respective constructs, are presented in Chapter 4.
The interpretation and discussion of the research findings and their link to the research
propositions are presented in Chapter 5. Finally, limitations of the study and suggestions for
intervention and future research are discussed.
1.10 Summary
The positive organisational scholarship movement is largely concerned with the
investigation of positive outcomes, processes and attributes of organisations and their
employees. Contrary to traditional organisational studies, POS studies focus on employees’
strengths and psychological capabilities, instead of their weaknesses and/or inhibiting
factors. POS represents an expanded perspective that includes instrumental concerns of
“goodness” and positive human potential. POS is distinguished from traditional
organisational studies in that it seeks to understand what represents and approaches the
best of the human condition. Authentic leadership, optimism, self-efficacy and work
engagement have been identified as constructs that can be included in the positive
organisational scholarship approach. This study aims to first and foremost explore and
investigate the relationship between these respective constructs and as a result offer
possible suggestions for the development of successful authentic leadership interventions
for implementation in organisations.
21 CHAPTER 2: LITERATURE REVIEW
2.1 Introduction
This chapter provides a review of the current literature on each of the respective constructs
used in this study, namely authentic leadership, optimism, self-efficacy and work
engagement. The history and notion of the constructs are elucidated. Relationships
between the constructs that have been found in previous research are also highlighted. The
chapter concludes with the research propositions and the theoretical model for this study.
2.2 The history and notion of authentic leadership
According to Cameron et al. (2003), the history of the concept of personal authenticity can
be traced back to ancient Greek philosophy as revealed in expressions such as (“Know
thyself” and “To thine own self be true”), through twentieth century modernism (with its
ideals of self-direction, trustworthiness, and consistency), and then on to post-modernistic
questioning of whether authenticity can even exist in the current era of multiplicity. Similar
to other psychological constructs, most attention has been devoted to the lack of authentic
self-behaviour (e.g., being deceitful, dishonest, manipulative, phony, and conniving).
Descriptive words for authentic leadership as a positive construct, include genuine, reliable,
trustworthy, real, hopeful, resilient and veritable. According to Harter (2002) many positive
psychologists regard this authenticity as both owning one’s personal experiences
(thoughts, emotions, or beliefs, “the real me inside”) and acting in accord with the true self
(behaving and expressing what you really think and believe).
Cameron et al. (2003) are of the opinion that the above meaning of authenticity best
depicts the type of positive leadership needed in contemporary times, where the
environment is dramatically changing, where the rules that have guided how organisations
operate no longer work, and where the best leaders will be transparent with their intentions,
having a seamless link between their espoused values, actions and behaviours.
Theoretically Mischel (1973) referred to such dynamic situations as representing a “weak
context”, since there are no clear set of guidelines, rules, or direction for action. In such
contexts, new rules are created to address the ambiguities and lack of clarity confronting a
work unit, organisation, community, or entire society. In weak contexts, people are more
vulnerable and as such, they are unsure what direction to pursue. It is in these situations,
22 that the most profoundly positive and unfortunately negative (Conger, 1990; Luthans,
Peterson, & Ibrayeva, 1998) leadership takes root.
According to Howell (1992), without authentic leadership, the dynamics that are created by
charismatic leaders in weak situations run the risk of being self-centered, and destructive to
one group to benefit another. Indeed, throughout history and up to present times (e.g.,
Hitler, Stalin, Pol Pot, Papa Doc Duvalier, Milosevic, or Saddam Hussein), such inauthentic
leaders, have taken advantage of crises for their own self-gain (Howell & Avolio, 1992).
Luthans and Avolio (2003) suggest that authentic leadership best represents the
confluence of positive organisational behaviour (POB) (Luthans, 2002a, 2002b),
transformational/full-range leadership (FRL), or high-end of FRL (Avolio, 1999), and work
on ethical and moral perspective-taking capacity and development (Schulman, 2002),
which is at the core of what drives transformational leadership (Avolio & Gibbons, 1988;
Kegan, 1982; Kuhnert & Lewis, 1987).
2.2.1 Previous research and models of authentic lea dership
Previous research has identified various variables influencing authentic leadership. Their
importance in understanding authentic leadership is discussed in the following section.
Avolio, Gardner, Walumbwa and May (2004) were the first to make a formal statement of
authentic leadership by proposing a theoretical model that draws from positive
organisational behaviour, trust, recent work on leadership and emotions, and identity
theories to describe the processes by which authentic leaders exert their influence on
follower attitudes such as job satisfaction and commitment and behaviours such as job
performance. Follower outcomes in their model are performance, extra effort and
withdrawal behaviours (i.e. turnover, absenteeism, and tardiness). This model draws on the
theories of identification (e.g. Pratt, 1998), emotions (e.g. Ashforth & Humphrey, 1995;
Dasborough & Ashkanasy, 2000), social identity and self-categorization (e.g. Ashforth &
Mael, 1989; Hogg & Terry, 2000), transformational/charismatic leadership (e.g. Bass &
Avolio, 1994) and positive psychology and positive organisational behaviour (e.g. Cameron
et al., 2003).
23 According to Shamir and Eilam (2005), authentic leadership is viewed as being based on
the leader’s self-concept: Thus his or her self-knowledge, self-concept clarity, self-
accordance and person-role-merger, and on the extent to which the leader’s self-concept is
ultimately expressed in his or her behaviour. These authors offer a life-story approach to
the development of leaders and argue that authentic leadership rests heavily on the self-
relevant meanings the leader attaches to his or her life experiences, and those meanings
are captured in the leader’s life-story. Therefore the construction of a life-story is a major
element in the development of authentic leaders. Shamir and Eilam (2005) emphasize that
the life-story provides followers with a major source of information on which to base their
judgements about their leader’s authenticity.
Contemporary leadership theory and practice describes authenticity in relation to self-
awareness of one’s fundamental values and purpose, and attributes the motivational
effects of leadership to the consistency of leader’s values and behaviours and the
concordance of their values with those of followers. Drawing from the hermeneutic
philosophy, Sparrowe (2005) offers a different perspective on authenticity in leadership that
is based on the framework of the narrative self. This framework suggests that authenticity is
neither achieved by self-awareness, nor by one’s inner values or purpose, but instead is
emergent from the narrative process in which others play a constructive role in the self.
Michie and Gooty (2005) developed an alternative approach to the role of emotions in
leadership which incorporates current theory from both the emotion and positive
psychology literatures. Rather than focusing on the detrimental effects of affective
responses, this approach suggests that frequent experiences of positive other-directed
emotions motivate leaders to act on their other-directed values (Oakley, 1992). For this
reason Michie and Gooty (2005) argue that self-transcendent values and positive other-
directed emotions are important determinants of authentic leadership.
In line with Michie and Gooty (2005), Dasborough and Ashkanasy (2000) proposed a
model of authentic leadership based on follower attributions and emotional reactions,
where authentic leadership is manifested in the perception that the leader’s influence is
grounded in moral behaviour and intentions. The model is defined in terms of followers’
positive and negative emotional reactions following attributions of the leader’s intentions.
24 The resulting 2x2 model has four cells. The “unpleasantness” condition (high negative
effect, low positive effect) or “refusal” in the leadership context, is associated with
inauthentic leadership, while the “pleasantness” condition (high positive effect, low negative
effect) or “zealous” in the leadership context, is associated with authentic leadership.
Eagly (2005) argues that much more is required of leaders than merely transparently
conveying and acting on their values. Achieving relational and visible authenticity requires
that followers accord leaders the legitimacy to promote a set of values on behalf of the
community. Only under such conditions can leaders elicit the personal and social
identification of followers that can enhance the success of a group, organisation or society.
This author (Eagly, 2005) provides evidence that obtaining this identification is more
challenging for female than male leaders and more generally for members of outsider
groups that have traditionally not had access to particular leadership roles.
Klenke (2004; 2005) proposed a model of authentic leadership that integrated contextual,
cognitive, affective, conative, and spiritual elements. Similar to the previously discussed
models, her model treats the self as a critical aspect of authentic leadership; however, in
addition to including self-esteem and self-efficacy (Ilies, Morgeson, & Nahrgang, 2005),
self-awareness and self regulation, i.e. motivation (Avolio & Gardner, 2005). Klenke’s
model (2005) explicitly incorporates a spiritual motivation component as a determinant of
authentic leadership.
Research conducted by Eigel and Kuhnert (2005) with 21 top executives, identified a
measurable characteristic that highly effective leaders have in common, namely:
Leadership Development Level (or LDL). LDL’s are developmental levels of maturity that
shape the mental and moral capacities of the leader. While the highest LDL’s are
associated with authentic leadership, the theory behind LDL’s focuses on the leader’s
developmental understanding of his or her world, and how that understanding differs at
each LDL. In this way, LDL describes the process by which leaders become authentic
leaders.
Avolio and Walumbwa (2006) proposed a multifaceted model that redefines the role of
strategic HR leadership and to understand the connections between authentic HR
25 leadership and sustainable organisational performance. These authors argue that to build
enduring organisations and motivate employees to provide superior customer service and
create sustainable value for their organisations, HR leaders are required to know
themselves, to lead with integrity and demand conformance to higher ethical values.
Yammarino, Dione, Schriesheim and Dansereau (2008) explicated and integrated authentic
leadership and positive organisational behaviour using a meso, multi-level perspective.
Essentially viewed in terms of multi-levels of analysis, authentic leadership promotes
various “primary” multi-level criteria and outcomes of positive organisational behaviour (e.g.
optimism, self-efficacy of individual leaders and followers, group and team efficacy
(shared), and collective efficacy (organisation culture) that, in turn, enhances various multi-
level “secondary” criteria and outcomes of performance. (e.g. individual, group/team and
organisation outcomes). Direct effects of authentic leadership on performance at multi-
levels of analysis also are plausible.
Authenticity can and should therefore best be understood in context, and context implies
action (Payne, 1996). In a study by Peunte, Crous, and Venter (2007) authentic leadership
in particular was explored in terms of the actions of former mayor of New York City,
Rudolph Giuliani, who displayed authentic leadership in action during the aftermath of the
World Trade Centre attacks. Authentic leadership development tends to be triggered by a
negative event (as in the case of 9/11 for Giuliani, for example). The aim of their study was
to explore the potential of Appreciative Inquiry (AI) - as affirmative mode of action research
- as a positive trigger event for authentic leadership development.
In line with Peunte et al. (2007), Kolditz and Brazil (2005) argue that in dangerous settings,
leaders’ optimism, hope, and resilience are especially valued, and therefore authentic
leaders will assert a particularly powerful influence in such settings. This view links to
Mischel’s (1973) theory referred to as situations representing a “weak context”, where there
are no clear guidelines for leadership action.
Moreover, Douglas, Ferris, and Perrewé (2005), examined the important role of leader
political skill in authentic leadership. These authors see leader political skill as an essential
component in the study of authentic leadership, because politically skilled leaders inspire
26 trust, confidence, and authenticity as mechanisms to incur follower motivation,
commitment, and productive work behaviour. Similarly, it is apparent that Douglas et al.’s
(2005) view further supports the contextual notion of leadership posited by Mischel’s (1973)
theory.
From a social cognitive lens, Chan, Hannah, and Gardner (2005), propose that authenticity
is an emergent property of key processes and components of the self-system. These
authors examined how leader’s authenticity positively affects intra- and interpersonal
leadership processes. Therefore Chan et al. (2005) argue that authenticity in leaders is an
important leadership multiplier, and is foundational in producing a virtuous cycle of
performance and learning for leaders, followers and organisations.
According to Hannah, Lester, and Vogelgesang (2005), authentic leadership is defined in
large part by evidence of morality in the leadership influence process. A highly developed
moral leader is expected to act in concert with his/her self concept, to achieve higher levels
of agency (exercise of control over a leader’s moral environment) to make the “right” and
“ethical” decisions. Moral leadership is developed through a highly developed self-concept,
and supported by heightened abilities of meta-cognitive and emotional regulation. These
cognitive structures and abilities help leaders to activate moral solutions cross-situationally
during leadership episodes. These authors posit that a leader who is perceived by followers
as morally authentic, and imbued by altruism and virtuousness, will be afforded greater
influence and have increased positive effects on followers and organisations.
Yalokwu (2008) presented a model of the development process of authentic leadership and
spiritual capital. Rather than viewing authentic leadership and spiritual capital as fixed
points of reference or destinations, they are regarded as dynamic concepts which in
themselves constitute a systematic journey. So authentic leadership and spiritual capital
are organic dynamic constructs. The model consists of nine sequential steps, i.e.
divine/birth gifts, self awareness, internal restlessness and motivation, hunger for service
and contribution, formulation of strategy, emergence of spiritually minded leader,
development of quality management and leadership, successful and effective organisation.
27 Gardner, Avolio, Luthans et al. (2005) proposed a self-based model of the development
process for authentic leadership and followership. The model proposes that a key factor
contributing towards the development of authentic leadership is the self-awareness of the
leader, which includes his/her values, emotions, identity, and goals. Increased self
awareness is a critical development factor for the authentic leaders (Avolio & Gardner,
2005; Luthans & Avolio, 2003).
In line with the above-mentioned authors, Ilies, Morgeson and Nahrgang (2005) proposed a
model of authentic leader and follower development that focuses on the elements of
authenticity and the processes whereby authentic leadership contributes to the eudaemonic
well-being of leaders and followers. These authors argue that authenticity as an
introspective yet relational concept has substantial implications for leadership processes
influencing not only leaders’ well-being, but also impacting the follower’s well-being and
self-concept.
Gardner and Schermerhorn (2004) suggest that true authenticity in leadership requires the
maturity to give up self-centred preoccupations with the efforts and failure of others. It
means freeing oneself of the presumption that a leader’s primary task is to somehow
motivate others. It means accepting that the leader’s primary role is to value and support
human talent in a high performance context.
2.3 The variable of optimism
2.3.1 Antecedents of optimism
Specifically, research on twins suggests that optimism is subject to genetic influence
(Plowmin, Scheier, Bergemen, Pedersen, Nesselroade, & McClearn, 1992). The question
remains whether optimism is itself heritable, or whether it displays heritability because of its
relation to other aspects of temperament. Optimism relates both to neuroticism and to
extraversion, and both are known to be genetically influenced. Although optimism is
distinguishable from these temperaments (Scheier et al., 1994), it may be that the observed
heritability of optimism reflects these associations.
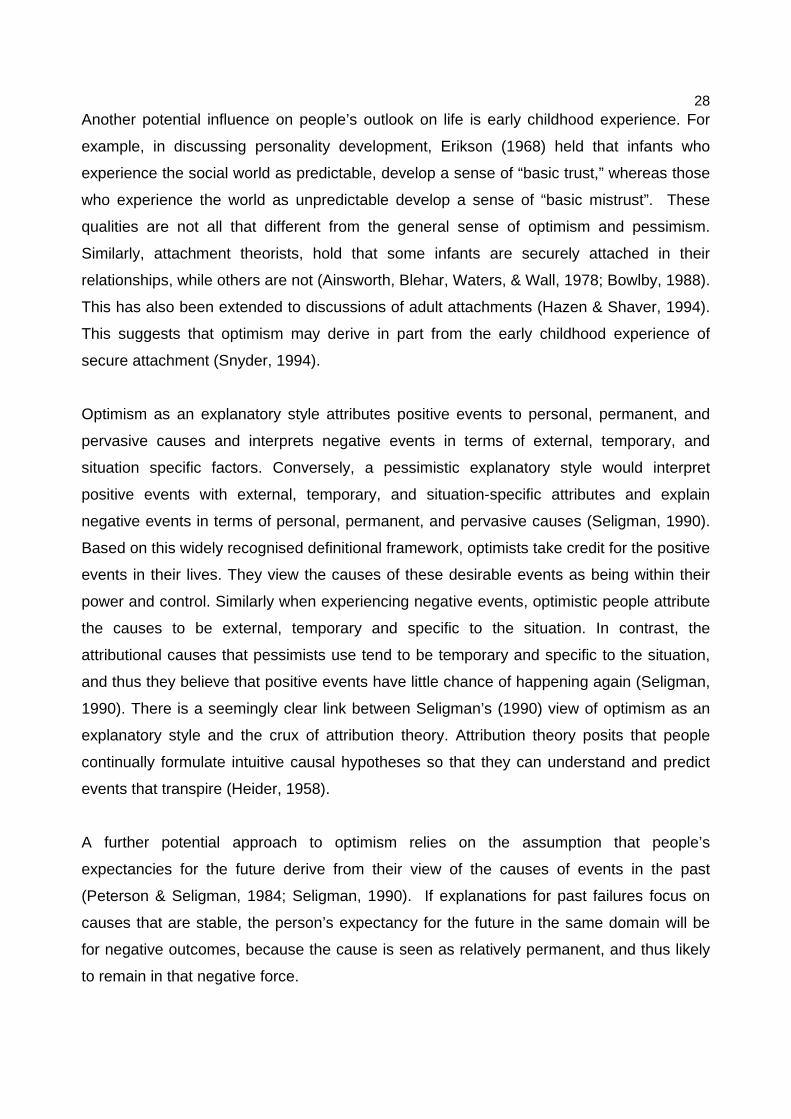
28 Another potential influence on people’s outlook on life is early childhood experience. For
example, in discussing personality development, Erikson (1968) held that infants who
experience the social world as predictable, develop a sense of “basic trust,” whereas those
who experience the world as unpredictable develop a sense of “basic mistrust”. These
qualities are not all that different from the general sense of optimism and pessimism.
Similarly, attachment theorists, hold that some infants are securely attached in their
relationships, while others are not (Ainsworth, Blehar, Waters, & Wall, 1978; Bowlby, 1988).
This has also been extended to discussions of adult attachments (Hazen & Shaver, 1994).
This suggests that optimism may derive in part from the early childhood experience of
secure attachment (Snyder, 1994).
Optimism as an explanatory style attributes positive events to personal, permanent, and
pervasive causes and interprets negative events in terms of external, temporary, and
situation specific factors. Conversely, a pessimistic explanatory style would interpret
positive events with external, temporary, and situation-specific attributes and explain
negative events in terms of personal, permanent, and pervasive causes (Seligman, 1990).
Based on this widely recognised definitional framework, optimists take credit for the positive
events in their lives. They view the causes of these desirable events as being within their
power and control. Similarly when experiencing negative events, optimistic people attribute
the causes to be external, temporary and specific to the situation. In contrast, the
attributional causes that pessimists use tend to be temporary and specific to the situation,
and thus they believe that positive events have little chance of happening again (Seligman,
1990). There is a seemingly clear link between Seligman’s (1990) view of optimism as an
explanatory style and the crux of attribution theory. Attribution theory posits that people
continually formulate intuitive causal hypotheses so that they can understand and predict
events that transpire (Heider, 1958).
A further potential approach to optimism relies on the assumption that people’s
expectancies for the future derive from their view of the causes of events in the past
(Peterson & Seligman, 1984; Seligman, 1990). If explanations for past failures focus on
causes that are stable, the person’s expectancy for the future in the same domain will be
for negative outcomes, because the cause is seen as relatively permanent, and thus likely
to remain in that negative force.
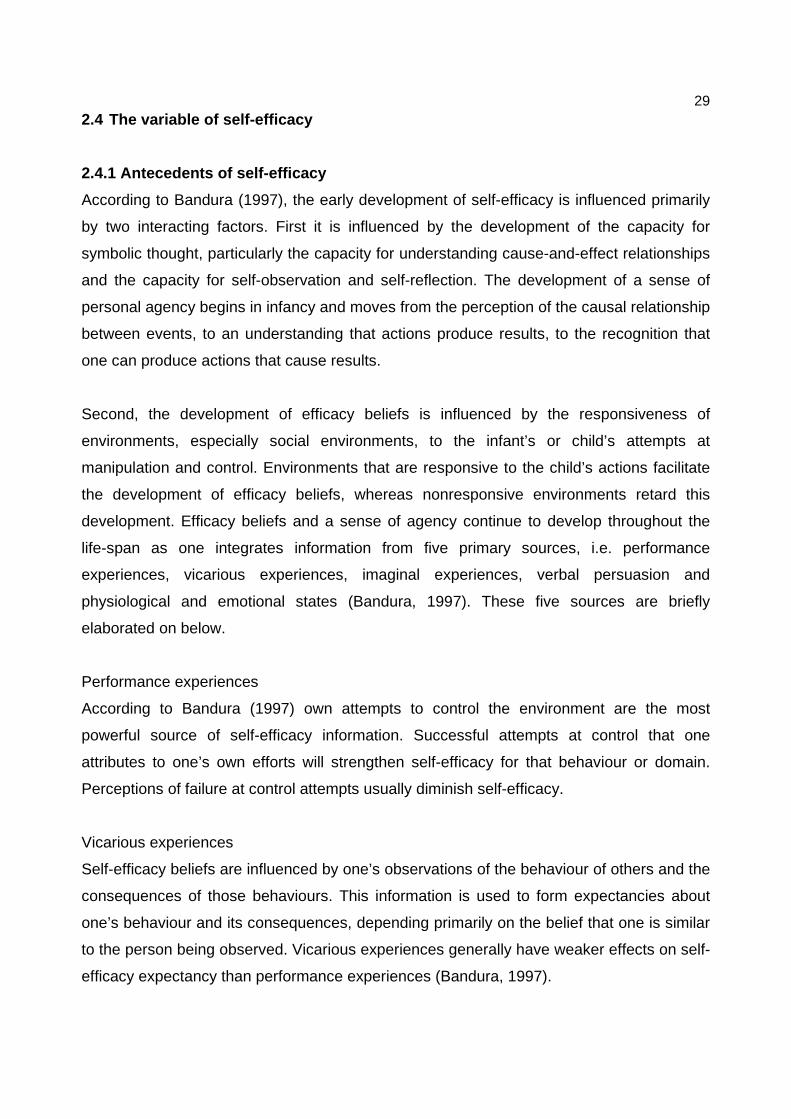
29 2.4 The variable of self-efficacy
2.4.1 Antecedents of self-efficacy
According to Bandura (1997), the early development of self-efficacy is influenced primarily
by two interacting factors. First it is influenced by the development of the capacity for
symbolic thought, particularly the capacity for understanding cause-and-effect relationships
and the capacity for self-observation and self-reflection. The development of a sense of
personal agency begins in infancy and moves from the perception of the causal relationship
between events, to an understanding that actions produce results, to the recognition that
one can produce actions that cause results.
Second, the development of efficacy beliefs is influenced by the responsiveness of
environments, especially social environments, to the infant’s or child’s attempts at
manipulation and control. Environments that are responsive to the child’s actions facilitate
the development of efficacy beliefs, whereas nonresponsive environments retard this
development. Efficacy beliefs and a sense of agency continue to develop throughout the
life-span as one integrates information from five primary sources, i.e. performance
experiences, vicarious experiences, imaginal experiences, verbal persuasion and
physiological and emotional states (Bandura, 1997). These five sources are briefly
elaborated on below.
Performance experiences
According to Bandura (1997) own attempts to control the environment are the most
powerful source of self-efficacy information. Successful attempts at control that one
attributes to one’s own efforts will strengthen self-efficacy for that behaviour or domain.
Perceptions of failure at control attempts usually diminish self-efficacy.
Vicarious experiences
Self-efficacy beliefs are influenced by one’s observations of the behaviour of others and the
consequences of those behaviours. This information is used to form expectancies about
one’s behaviour and its consequences, depending primarily on the belief that one is similar
to the person being observed. Vicarious experiences generally have weaker effects on self-
efficacy expectancy than performance experiences (Bandura, 1997).
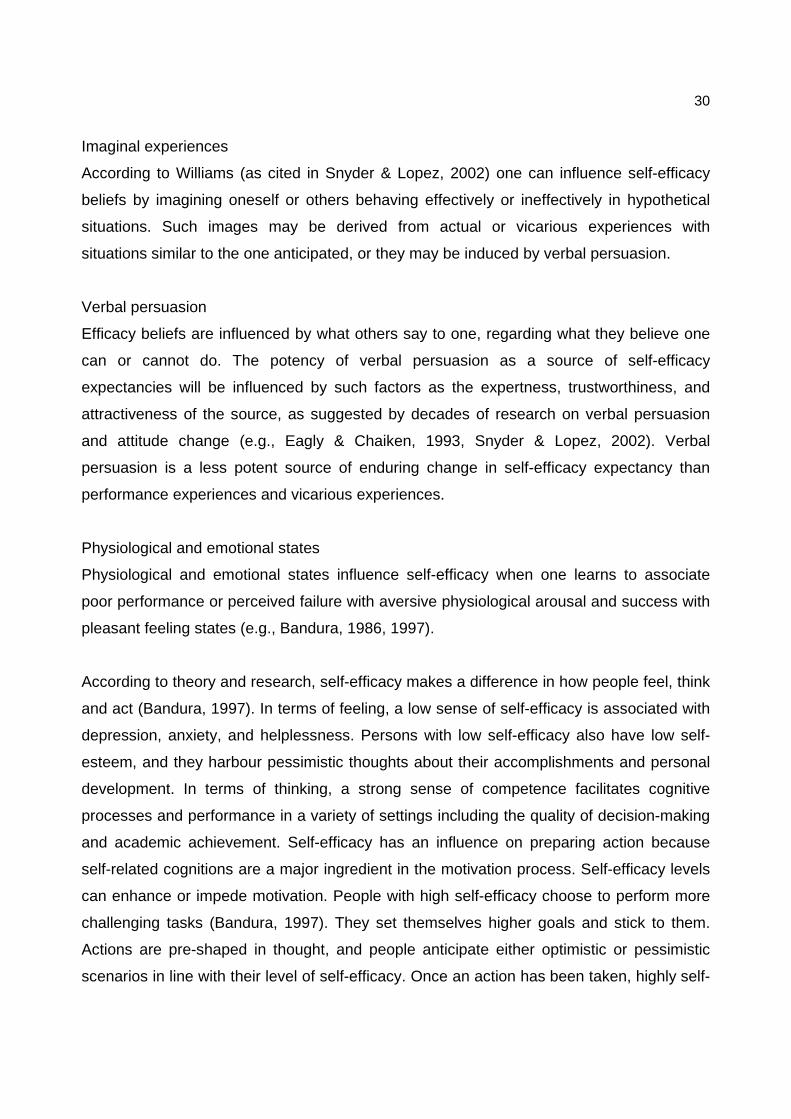
30
Imaginal experiences
According to Williams (as cited in Snyder & Lopez, 2002) one can influence self-efficacy
beliefs by imagining oneself or others behaving effectively or ineffectively in hypothetical
situations. Such images may be derived from actual or vicarious experiences with
situations similar to the one anticipated, or they may be induced by verbal persuasion.
Verbal persuasion
Efficacy beliefs are influenced by what others say to one, regarding what they believe one
can or cannot do. The potency of verbal persuasion as a source of self-efficacy
expectancies will be influenced by such factors as the expertness, trustworthiness, and
attractiveness of the source, as suggested by decades of research on verbal persuasion
and attitude change (e.g., Eagly & Chaiken, 1993, Snyder & Lopez, 2002). Verbal
persuasion is a less potent source of enduring change in self-efficacy expectancy than
performance experiences and vicarious experiences.
Physiological and emotional states
Physiological and emotional states influence self-efficacy when one learns to associate
poor performance or perceived failure with aversive physiological arousal and success with
pleasant feeling states (e.g., Bandura, 1986, 1997).
According to theory and research, self-efficacy makes a difference in how people feel, think
and act (Bandura, 1997). In terms of feeling, a low sense of self-efficacy is associated with
depression, anxiety, and helplessness. Persons with low self-efficacy also have low self-
esteem, and they harbour pessimistic thoughts about their accomplishments and personal
development. In terms of thinking, a strong sense of competence facilitates cognitive
processes and performance in a variety of settings including the quality of decision-making
and academic achievement. Self-efficacy has an influence on preparing action because
self-related cognitions are a major ingredient in the motivation process. Self-efficacy levels
can enhance or impede motivation. People with high self-efficacy choose to perform more
challenging tasks (Bandura, 1997). They set themselves higher goals and stick to them.
Actions are pre-shaped in thought, and people anticipate either optimistic or pessimistic
scenarios in line with their level of self-efficacy. Once an action has been taken, highly self-
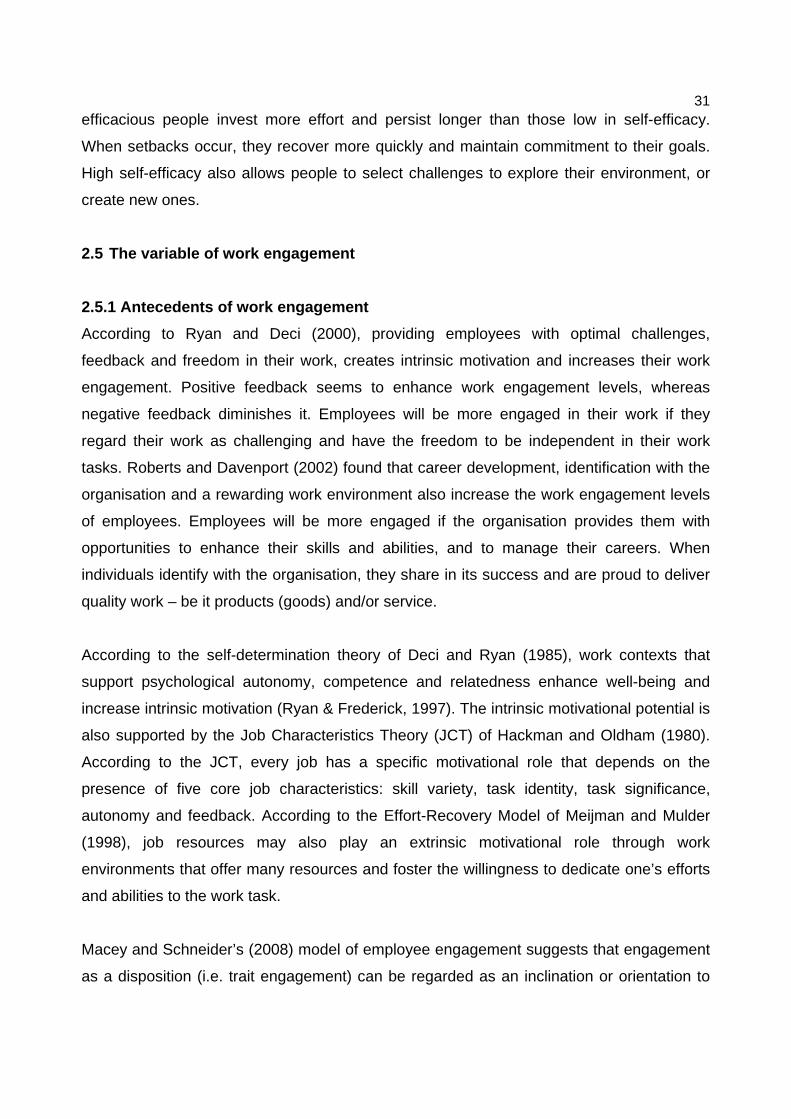
31 efficacious people invest more effort and persist longer than those low in self-efficacy.
When setbacks occur, they recover more quickly and maintain commitment to their goals.
High self-efficacy also allows people to select challenges to explore their environment, or
create new ones.
2.5 The variable of work engagement
2.5.1 Antecedents of work engagement
According to Ryan and Deci (2000), providing employees with optimal challenges,
feedback and freedom in their work, creates intrinsic motivation and increases their work
engagement. Positive feedback seems to enhance work engagement levels, whereas
negative feedback diminishes it. Employees will be more engaged in their work if they
regard their work as challenging and have the freedom to be independent in their work
tasks. Roberts and Davenport (2002) found that career development, identification with the
organisation and a rewarding work environment also increase the work engagement levels
of employees. Employees will be more engaged if the organisation provides them with
opportunities to enhance their skills and abilities, and to manage their careers. When
individuals identify with the organisation, they share in its success and are proud to deliver
quality work – be it products (goods) and/or service.
According to the self-determination theory of Deci and Ryan (1985), work contexts that
support psychological autonomy, competence and relatedness enhance well-being and
increase intrinsic motivation (Ryan & Frederick, 1997). The intrinsic motivational potential is
also supported by the Job Characteristics Theory (JCT) of Hackman and Oldham (1980).
According to the JCT, every job has a specific motivational role that depends on the
presence of five core job characteristics: skill variety, task identity, task significance,
autonomy and feedback. According to the Effort-Recovery Model of Meijman and Mulder
(1998), job resources may also play an extrinsic motivational role through work
environments that offer many resources and foster the willingness to dedicate one’s efforts
and abilities to the work task.
Macey and Schneider’s (2008) model of employee engagement suggests that engagement
as a disposition (i.e. trait engagement) can be regarded as an inclination or orientation to
32 experience the world from a particular vantage point (e.g. positive affectivity characterised
by feelings of enthusiasm) and that this trait engagement, gets reflected in psychological
state engagement. Macey and Schneider (2008) conceptualise psychological state
engagement as an antecedent of behavioural engagement, which they define in terms of
discretionary effort (e.g. Erickson, 2005; Towers-Perrin, 2003) or a specific form of in-role
or extra-role effort behaviour.
In line with Deci and Ryan (1985); Ryan and Frederick (1997); Hackman and Oldham
(1980); Meijman and Mulder (1998), Macey and Schneider’s (2008) model show that
conditions of the workplace have both direct and indirect effects on state and behavioural
engagement such as the nature of the work (e.g., challenge, variety) and the nature of
leadership (especially transformational leadership). For example, that work has direct
effects on state engagement (e.g., Hackman & Oldham, 1980) and indirect effects as a
boundary condition (moderator) of the relationship between trait and state engagement.
With regard to leadership, Macey and Schneider’s (2008) model, it shows this to have a
direct effect on trust and an indirect effect through the creation of trust on behavioural
engagement (e.g., Kahn, 1990; McGregor, 1960). Behavioural engagement, has numerous
facets to it and is simultaneously organisational citizenship behaviour (OCB), role
expansion, proactive behaviour, and demonstrating personal initiative, all strategically
focussed in the service of organisational objects.
2.6 Conclusions and theoretical support based on t he literature review
From the preceding discussion on the respective constructs, it is apparent that authenticity
in leadership is an increasingly common topic of discussion in both the academic (Luthans
& Avolio, 2003) and applied literatures (e.g. George, 2003). Avolio and colleagues (Avolio &
Gardner, 2005; Avolio, Gardner, Walumbwa, Luthans, & May, 2004; Gardner et al., 2005;
Luthans & Avolio, 2003) have recognised the emergence of authentic leadership as a root
construct of leadership. This means that nearly any style of leadership may operate on this
construct. Therefore, an authentic leader can be transformational, transactional, directive or
participative, and be defined as an authentic leader.
33 Kernis (2003, p. 13) defined authenticity as “unobstructed operation of one’s true, or core,
self in one’s daily enterprise.” Four underlying components comprise authenticity in the
Kernis’s model. These have been recast by Gardner et al. (2005) as (1) self awareness (2)
balanced information processing, (3) authentic behaviour, and (4) relational transparency.
All four are essential to the study of authentic leadership.
In gaining a better understanding of authentic leadership and the nature of the construct, it
is also imperative to examine the correlates of authentic leadership within the positive
organisational behaviour framework. Understanding the relationship between authentic
leadership and different possible correlates will contribute to understanding how authentic
leadership is developed and implemented within an organisation and whether there are
factors that need to precede the authentic leadership development intervention. A
substantial amount of practical guidance for companies and individuals, supported by solid
theoretical research, is needed to develop authentic leadership competencies in
organisations.
Based on the discussed theoretical foundation, instrumentation and conclusions regarding
the literature review, specific research questions were used to guide the study. These are
discussed in the following section.
2.7 The research problem
Kerlinger (1992) posits the importance of defining propositions as speculative statements
about the relation between two or more variables, arguing that propositions (a) are the
working instruments of theory, (b) can be tested and shown to be probably true or probably
false, and (c) are powerful tools for the advancement of knowledge. Kerlinger and Lee
(2000) argue that there are two primary criteria for good propositions: (a)
propositions/hypotheses are statements about the relationships between variables, and (b)
propositions/hypotheses carry clear implications for testing the stated relations. In order to
provide the theoretical basis for the proposed research questions and propositions, a
discussion of the theoretical support found in the literature was presented in the preceding
section.
34 The following research problem was identified:
If a manager is perceived to have a high level of authentic leadership, then it could possibly
contribute to increased levels of optimism, self-efficacy and work engagement. This
argument led to the formulation of the research questions and propositions for the present
study outlined below:
Research question 1:
What is the relationship between the variables authentic leadership, optimism, self-efficacy
and work engagement? (Propositions 1-7).
Research question 2:
Can a valid model of the sequential relationships among the combinations of variables,
namely authentic leadership, optimism, self-efficacy and work engagement, within the
realm of positive organisational psychology, be built? (Proposition 8).
2.8 Research propositions
In order to answer the research questions developed for this study, eight propositions were
formulated that had to be tested. A correlational research design was used so that
sequential relationships in the identified constructs could be determined. In addition to
identifying the relationships, it becomes possible to understand the dynamic relationships
between the constructs. In accordance with the aim of the study and the findings of
previous research, the proposed relationships were believed to exist between the
constructs.
As discussed in the previous sections, the following research propositions were formulated
and used to empirically investigate the research questions.
Proposition 1: A significant positive relationship exists between authentic leadership
behaviours and optimism.
Proposition 2: A significant positive relationship exists between authentic leadership
behaviours and self-efficacy.
35
Proposition 3: A significant positive relationship exists between the authentic leadership
behaviours measured by the Authentic Leadership Questionnaire (ALQ) and the
characteristics of work engagement measured by the Utrecht Work Engagement Scale
(UWES).
Proposition 4: A significant positive relationship exists between optimism and self-efficacy.
Proposition 5: A significant positive relationship exists between optimism and the level of
work engagement.
Proposition 6. A significant positive relationship exists between self-efficacy and the level of
work engagement.
Proposition 7: Each of the identified variables will contribute separately to a significant
proportion of variance in work engagement.
Proposition 8: The proposed conceptual model describing the relationships between
authentic leadership, optimism, self-efficacy, and work engagement, will produce a good fit
with the data, outlined in Figure 1.
In addition to guiding the research methodology in the current study, the eight propositions
also determined the data analysis techniques used. Appropriate data analysis methods to
evaluate each of these propositions are discussed in Chapter 3.
2.9 Summary
The history, notion and models of the authentic leadership construct, including the
antecedents of the optimism, self-efficacy and work engagement constructs were
discussed in this chapter. Emphasis was placed on research postulating that relationships
will be found between the respective variables in the positive organisation behaviour field.
The variables that were researched and explored in this study are authentic leadership,
optimism, self-efficacy and work engagement. The conceptual argument states that
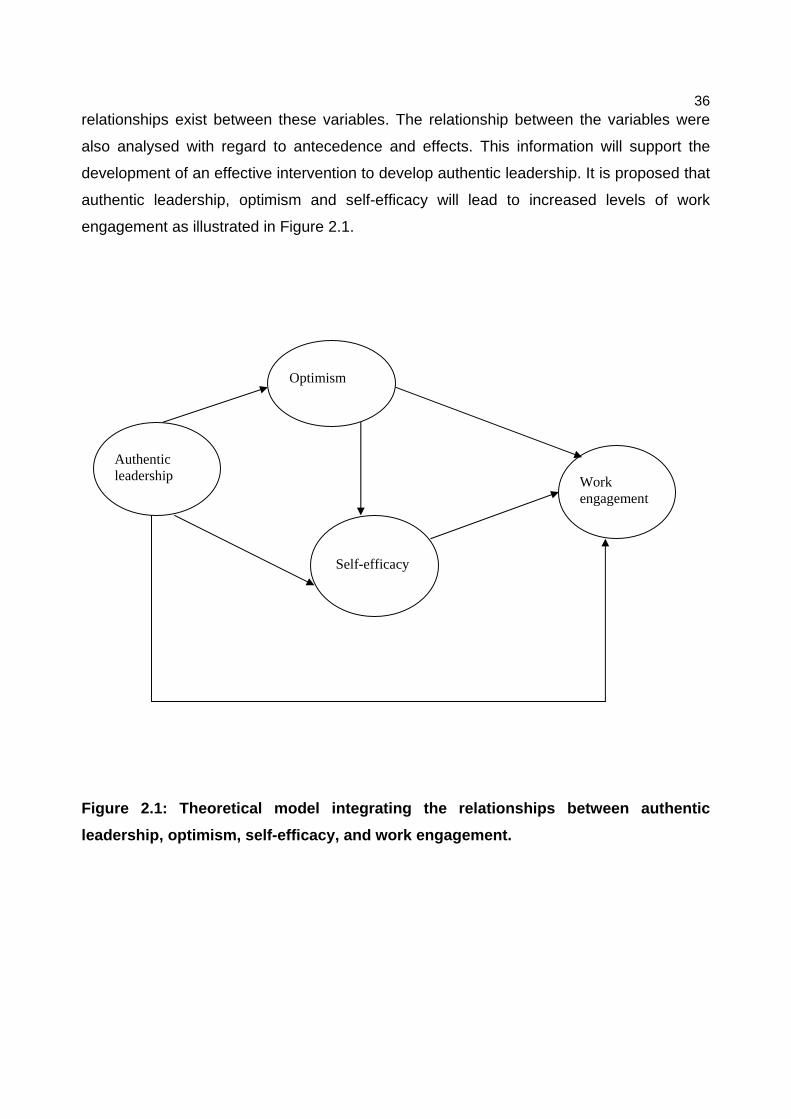
36 relationships exist between these variables. The relationship between the variables were
also analysed with regard to antecedence and effects. This information will support the
development of an effective intervention to develop authentic leadership. It is proposed that
authentic leadership, optimism and self-efficacy will lead to increased levels of work
engagement as illustrated in Figure 2.1.
Figure 2.1: Theoretical model integrating the relat ionships between authentic
leadership, optimism, self-efficacy, and work engag ement.
Authentic leadership
Op
Work engagement
Optimism
Self-efficacy
37 CHAPTER 3: METHODOLOGY
3.1 Introduction
This study is guided by the research aim of investigating whether relationships exist
between the following positive organisational psychological constructs: authentic
leadership, optimism, self-efficacy and work engagement experienced by respondents. To
provide an answer to this research problem, the research questions were developed to
guide the study (see 2.7). To systematically provide answers to the research questions, an
appropriate research design is required. In this chapter, the research design, research
methodology, and statistical techniques used to evaluate the research propositions stated
in 2.8 are discussed. The sample design as well as the data collection procedures and
different measuring instruments are also discussed. The sample characteristics are also
reported on in this chapter.
3.2 Overview and research design
The choice of a research design is governed by the research problem and research
questions of a given study. The research questions are derived from the literature review
and suggest the most appropriate methodology to answer the research problem.
3.2.1 Reason for choosing research design and metho dology
The purpose of the chosen research design is to ensure that accurate empirical evidence is
obtained that can be interpreted to determine if the eight research propositions set for this
study can be confidently accepted or rejected. In order to evaluate the propositions, a
mainly quantitative research approach was employed, making use of multiple measures. In
order to investigate the correlations between the various variables, the research method
took the form of a correlative ex post facto design. According to Babbie and Mouton (2001),
this type of study involves the observance of the independent and dependent variables
across individuals to establish the extent to which they co-vary. This approach offers strong
support to the structural equations model theory that is used to (a) test the validity of
theories about sequential relationships between two or more variables that have been
studied in a correlational research design and (b) determine the combination of variables
that predict a particular variable (Kerlinger, 1992).
38 This research design enables the empirical collection of the data from a large sample of
respondents. One approach to collect empirical information is through the use of a survey
from a large enough sample. In addition to empirical evidence obtained, the research
design must also enable the statistical evaluation and statistical modeling of these identified
constructs. This is primarily done by using statistical modeling studies. The research
design must also make possible the evaluation of a theoretical model’s ability to predict the
dependent variable.
It can be suggested that a combination of a survey and a statistical modeling study
(Babbie, 1998; Kerlinger & Lee, 2000; Mouton, 2001; Newman, 1997) is the most
appropriate research design to evaluate the propositions discussed in 2.8. The
characteristics of these two types of studies are briefly discussed below.
3.2.1.1 Survey research
In order to provide an answer to the research questions and the resultant propositions, a
survey methodology, making use of standardised measuring instruments, was followed.
Primary data was collected through standardised questionnaires that allows for numerical
manipulation. Survey research entails the administration of questionnaires to a sample of
respondents that form part of a larger population in order to discover the relative incidence,
distribution, and interrelations of sociological and psychological variables (Kerlinger & Lee,
2000). Surveys take various forms, including mail, self-administered, face-to-face and
telephone surveys and can be utilised for descriptive, exploratory and explanatory
research.
The self-administered survey form (in which respondents independently complete
questionnaires) was the method employed in this study. This method is only appropriate
when the population under study is adequately literate, a requirement that was set to all
respondents. The newest innovations in self-administered questionnaires make use of the
computer. The respondent receives the computerised self-administered questionnaire
(CSAQ) via email and runs the software which asks questions and accepts the
respondent’s answers. Following this, the respondent returns the data file (Babbie &
Mouton, 2001). Nicholls, Baker and Martin (1997) report that such techniques are more
39 efficient than conventional techniques, and do not appear to result in a reduction of data
quality.
This method holds certain advantages: (a) it makes the analysis of large datasets possible
through the use of computer technology, (b) it is relatively inexpensive and concise,
enabling quick completion, (c) it minimises interviewer bias and is largely accurate, (d) it
allows for anonymous and honest responses from respondents, and (e) minimises or even
eliminates the problem of missing values in a data set. Some disadvantages of survey
research include: (a) the possible low response rate to the survey and a chance for
significant response bias, (b) the researcher’s lack of control over the conditions
accompanying questionnaire completion, (c) receiving incomplete questionnaires, and (d)
the researcher’s lack of observation with regard to how respondents react towards
questions and the research setting (Babbie & Mouton, 2001; Newman, 1997; Kerlinger &
Lee, 2000). Due to the assumption that survey studies employ statistical techniques, it is
appropriate to elaborate on statistical modeling studies in the following section.
3.2.1.2 Statistical modeling studies
Although survey studies provide a broad overview of the phenomenon being studied, it
lacks the ability to evaluate the theoretical models developed through a literature review. To
overcome this limitation, statistical modeling studies must also be combined with survey
studies. The theoretical model is developed through a process of theorising about the
process as observed in previous research studies. Data collected through the use of survey
studies is used to quantitatively validate the theoretical model. Most often multivariate
statistical analyses are used to evaluate and validate theoretical models. These analyses
include multiple regression analysis and structural equation modeling (Kerlinger & Lee,
2000; Mouton, 2001). Multiple regression and structural equation modeling are discussed
later in this section.
Both survey and statistical modeling studies have in common the use of survey data based
on a sample. This highlights the importance of choosing a sample that is appropriate for the
study with regard to sample size, level of education and other prerequisites of the specific
study. The importance of sampling and the sampling design used for this study is
elaborated on in the next section.
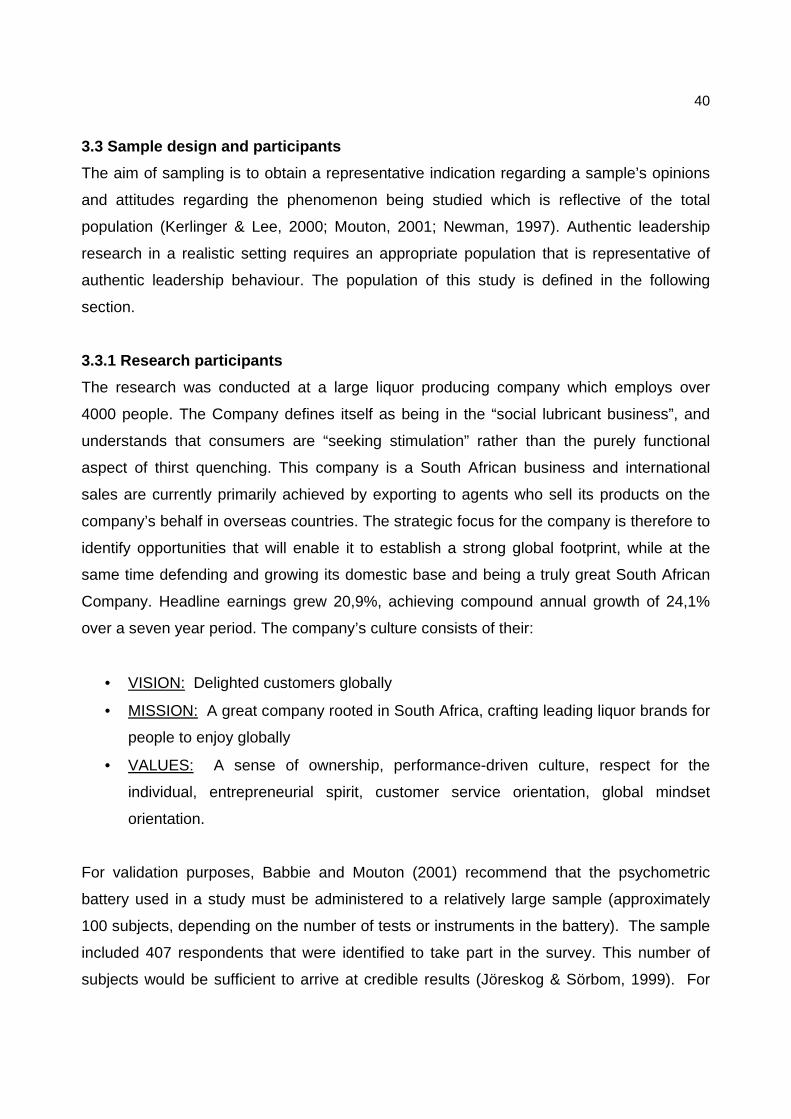
40
3.3 Sample design and participants
The aim of sampling is to obtain a representative indication regarding a sample’s opinions
and attitudes regarding the phenomenon being studied which is reflective of the total
population (Kerlinger & Lee, 2000; Mouton, 2001; Newman, 1997). Authentic leadership
research in a realistic setting requires an appropriate population that is representative of
authentic leadership behaviour. The population of this study is defined in the following
section.
3.3.1 Research participants
The research was conducted at a large liquor producing company which employs over
4000 people. The Company defines itself as being in the “social lubricant business”, and
understands that consumers are “seeking stimulation” rather than the purely functional
aspect of thirst quenching. This company is a South African business and international
sales are currently primarily achieved by exporting to agents who sell its products on the
company’s behalf in overseas countries. The strategic focus for the company is therefore to
identify opportunities that will enable it to establish a strong global footprint, while at the
same time defending and growing its domestic base and being a truly great South African
Company. Headline earnings grew 20,9%, achieving compound annual growth of 24,1%
over a seven year period. The company’s culture consists of their:
• VISION: Delighted customers globally
• MISSION: A great company rooted in South Africa, crafting leading liquor brands for
people to enjoy globally
• VALUES: A sense of ownership, performance-driven culture, respect for the
individual, entrepreneurial spirit, customer service orientation, global mindset
orientation.
For validation purposes, Babbie and Mouton (2001) recommend that the psychometric
battery used in a study must be administered to a relatively large sample (approximately
100 subjects, depending on the number of tests or instruments in the battery). The sample
included 407 respondents that were identified to take part in the survey. This number of
subjects would be sufficient to arrive at credible results (Jöreskog & Sörbom, 1999). For
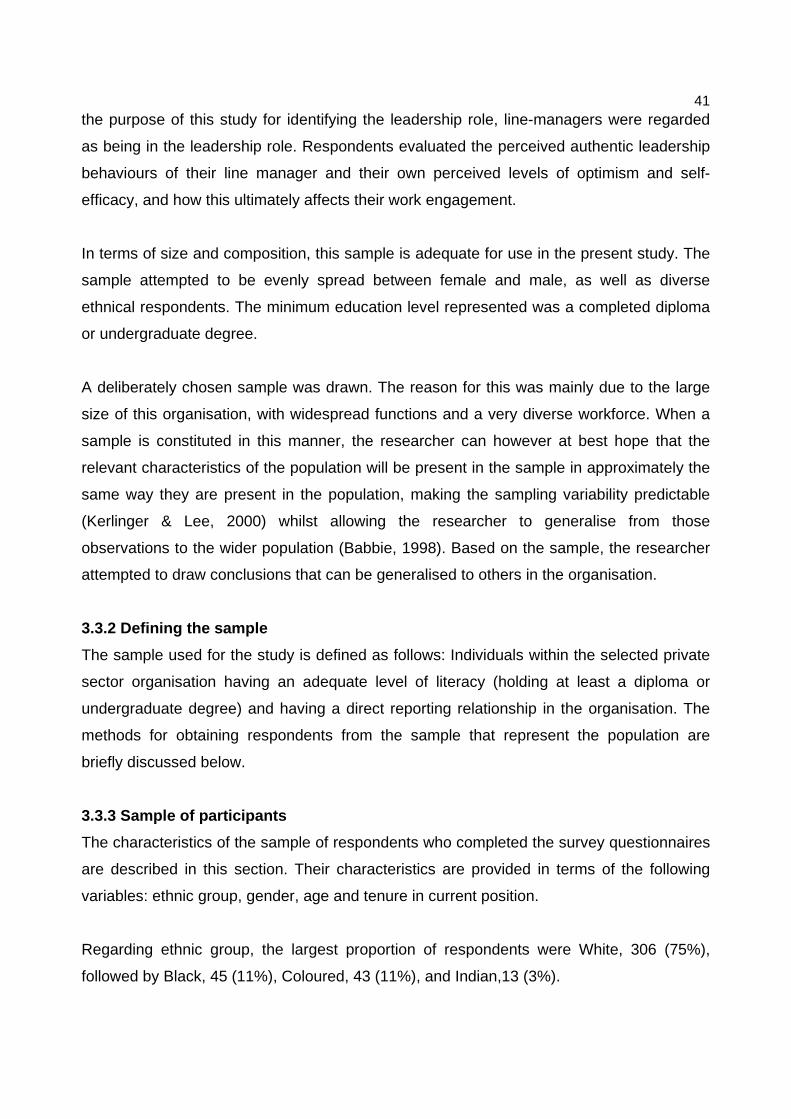
41 the purpose of this study for identifying the leadership role, line-managers were regarded
as being in the leadership role. Respondents evaluated the perceived authentic leadership
behaviours of their line manager and their own perceived levels of optimism and self-
efficacy, and how this ultimately affects their work engagement.
In terms of size and composition, this sample is adequate for use in the present study. The
sample attempted to be evenly spread between female and male, as well as diverse
ethnical respondents. The minimum education level represented was a completed diploma
or undergraduate degree.
A deliberately chosen sample was drawn. The reason for this was mainly due to the large
size of this organisation, with widespread functions and a very diverse workforce. When a
sample is constituted in this manner, the researcher can however at best hope that the
relevant characteristics of the population will be present in the sample in approximately the
same way they are present in the population, making the sampling variability predictable
(Kerlinger & Lee, 2000) whilst allowing the researcher to generalise from those
observations to the wider population (Babbie, 1998). Based on the sample, the researcher
attempted to draw conclusions that can be generalised to others in the organisation.
3.3.2 Defining the sample
The sample used for the study is defined as follows: Individuals within the selected private
sector organisation having an adequate level of literacy (holding at least a diploma or
undergraduate degree) and having a direct reporting relationship in the organisation. The
methods for obtaining respondents from the sample that represent the population are
briefly discussed below.
3.3.3 Sample of participants
The characteristics of the sample of respondents who completed the survey questionnaires
are described in this section. Their characteristics are provided in terms of the following
variables: ethnic group, gender, age and tenure in current position.
Regarding ethnic group, the largest proportion of respondents were White, 306 (75%),
followed by Black, 45 (11%), Coloured, 43 (11%), and Indian,13 (3%).
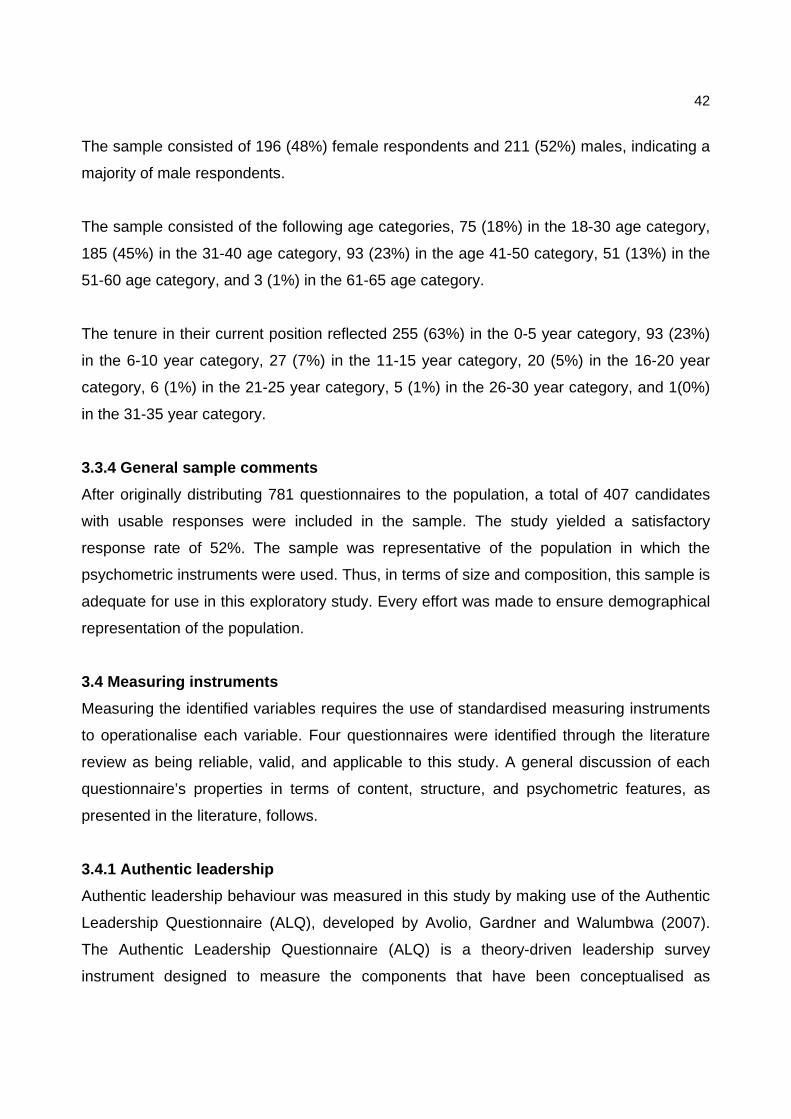
42
The sample consisted of 196 (48%) female respondents and 211 (52%) males, indicating a
majority of male respondents.
The sample consisted of the following age categories, 75 (18%) in the 18-30 age category,
185 (45%) in the 31-40 age category, 93 (23%) in the age 41-50 category, 51 (13%) in the
51-60 age category, and 3 (1%) in the 61-65 age category.
The tenure in their current position reflected 255 (63%) in the 0-5 year category, 93 (23%)
in the 6-10 year category, 27 (7%) in the 11-15 year category, 20 (5%) in the 16-20 year
category, 6 (1%) in the 21-25 year category, 5 (1%) in the 26-30 year category, and 1(0%)
in the 31-35 year category.
3.3.4 General sample comments
After originally distributing 781 questionnaires to the population, a total of 407 candidates
with usable responses were included in the sample. The study yielded a satisfactory
response rate of 52%. The sample was representative of the population in which the
psychometric instruments were used. Thus, in terms of size and composition, this sample is
adequate for use in this exploratory study. Every effort was made to ensure demographical
representation of the population.
3.4 Measuring instruments
Measuring the identified variables requires the use of standardised measuring instruments
to operationalise each variable. Four questionnaires were identified through the literature
review as being reliable, valid, and applicable to this study. A general discussion of each
questionnaire’s properties in terms of content, structure, and psychometric features, as
presented in the literature, follows.
3.4.1 Authentic leadership
Authentic leadership behaviour was measured in this study by making use of the Authentic
Leadership Questionnaire (ALQ), developed by Avolio, Gardner and Walumbwa (2007).
The Authentic Leadership Questionnaire (ALQ) is a theory-driven leadership survey
instrument designed to measure the components that have been conceptualised as
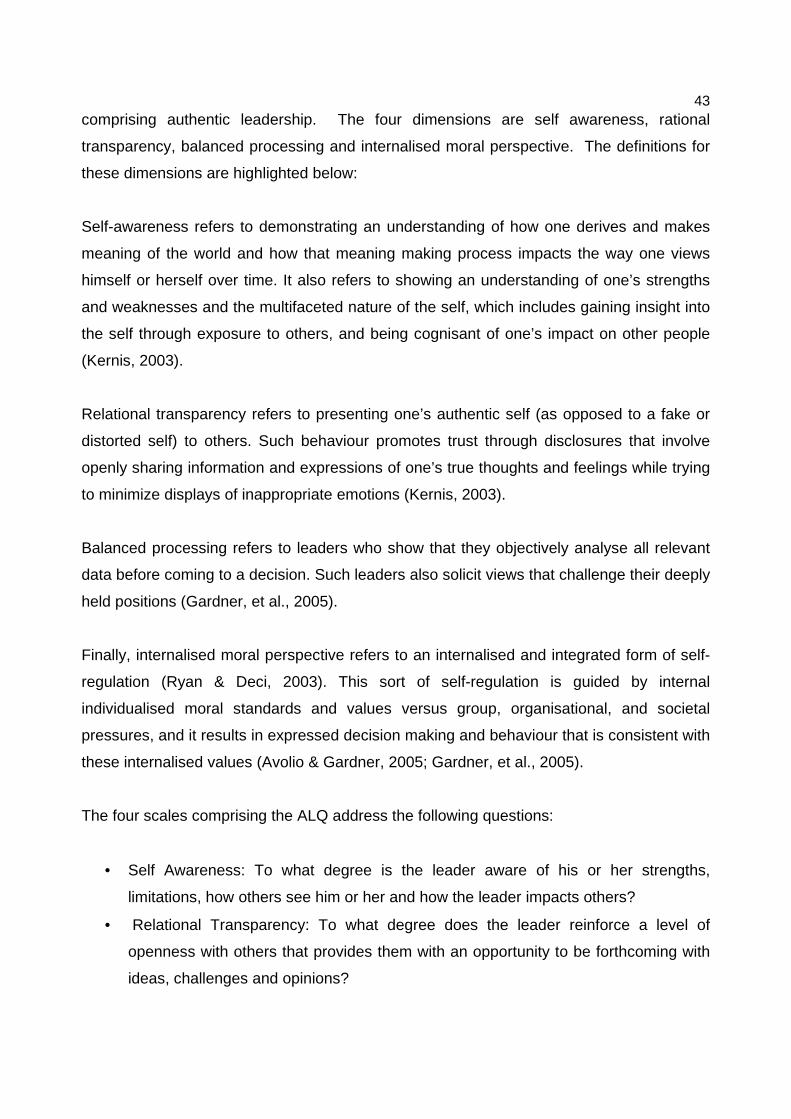
43 comprising authentic leadership. The four dimensions are self awareness, rational
transparency, balanced processing and internalised moral perspective. The definitions for
these dimensions are highlighted below:
Self-awareness refers to demonstrating an understanding of how one derives and makes
meaning of the world and how that meaning making process impacts the way one views
himself or herself over time. It also refers to showing an understanding of one’s strengths
and weaknesses and the multifaceted nature of the self, which includes gaining insight into
the self through exposure to others, and being cognisant of one’s impact on other people
(Kernis, 2003).
Relational transparency refers to presenting one’s authentic self (as opposed to a fake or
distorted self) to others. Such behaviour promotes trust through disclosures that involve
openly sharing information and expressions of one’s true thoughts and feelings while trying
to minimize displays of inappropriate emotions (Kernis, 2003).
Balanced processing refers to leaders who show that they objectively analyse all relevant
data before coming to a decision. Such leaders also solicit views that challenge their deeply
held positions (Gardner, et al., 2005).
Finally, internalised moral perspective refers to an internalised and integrated form of self-
regulation (Ryan & Deci, 2003). This sort of self-regulation is guided by internal
individualised moral standards and values versus group, organisational, and societal
pressures, and it results in expressed decision making and behaviour that is consistent with
these internalised values (Avolio & Gardner, 2005; Gardner, et al., 2005).
The four scales comprising the ALQ address the following questions:
• Self Awareness: To what degree is the leader aware of his or her strengths,
limitations, how others see him or her and how the leader impacts others?
• Relational Transparency: To what degree does the leader reinforce a level of
openness with others that provides them with an opportunity to be forthcoming with
ideas, challenges and opinions?
44 • Ethical/Moral: To what degree does the leader set a high standard for moral and
ethical conduct?
• Balanced processing: To what degree does the leader solicit sufficient opinions and
viewpoints prior to making important decisions?
Self-awareness consists of 4 items, relational transparency of 5 items, internalised moral
perspective of 4 items, and balanced processing of 3 items. Each of the dimensions were
measured using a 5-point Likert scale ranging from 0 (not at all) to 4 (frequently).
Walumbwa et al. (2008) conducted a confirmatory factor analysis of the ALQ using two
independent samples from the United States and the People’s Republic of China. The US
sample consisted of 224 full-time employees from a large high-tech manufacturer who
rated their immediate supervisors on authentic leadership behaviours. The Chinese sample
consisted of 212 full-time employees from a large state-owned company located in Beijing.
Using the 224 employees from the United States, the fit of the three different factor
structures were compared. The first was a one-factor model, in which all 16 items were
indicative of one larger authentic leadership factor. The second was a first-order factor
model in which items were allowed to load onto their respective factors (i.e., self-
awareness, relational transparency, internalised moral perspective, and balanced
processing) and the factors allowed to correlate with each other. The third was a second-
order factor model in which items were loaded onto their respective factors and the four
factors loading on a second-order latent authentic leadership factor. The third (i.e. second-
order) model is mathematically equivalent to the second (first-order) model (Bollen, 1989).
However if tenable, the second order factor model is preferable because it allows for the
covariation among first-order factors by accounting for corrected errors that are very
common in first order confirmatory factor analysis (Gerbing & Anderson, 1984).
For the US sample, a one-factor model (all 16 items), with the following fit statistics were
found: χ2= 356.78; df= 102; CFI= 0.91 and RMSEA= 0.11. For the first-order factor model,
χ2= 272.65; df= 96; CFI= 0.94 and RMSEA= 0.09. For the second-order factor model, χ2=
234.70; df= 98; CFI= 0.97 and RMSEA= 0.05.
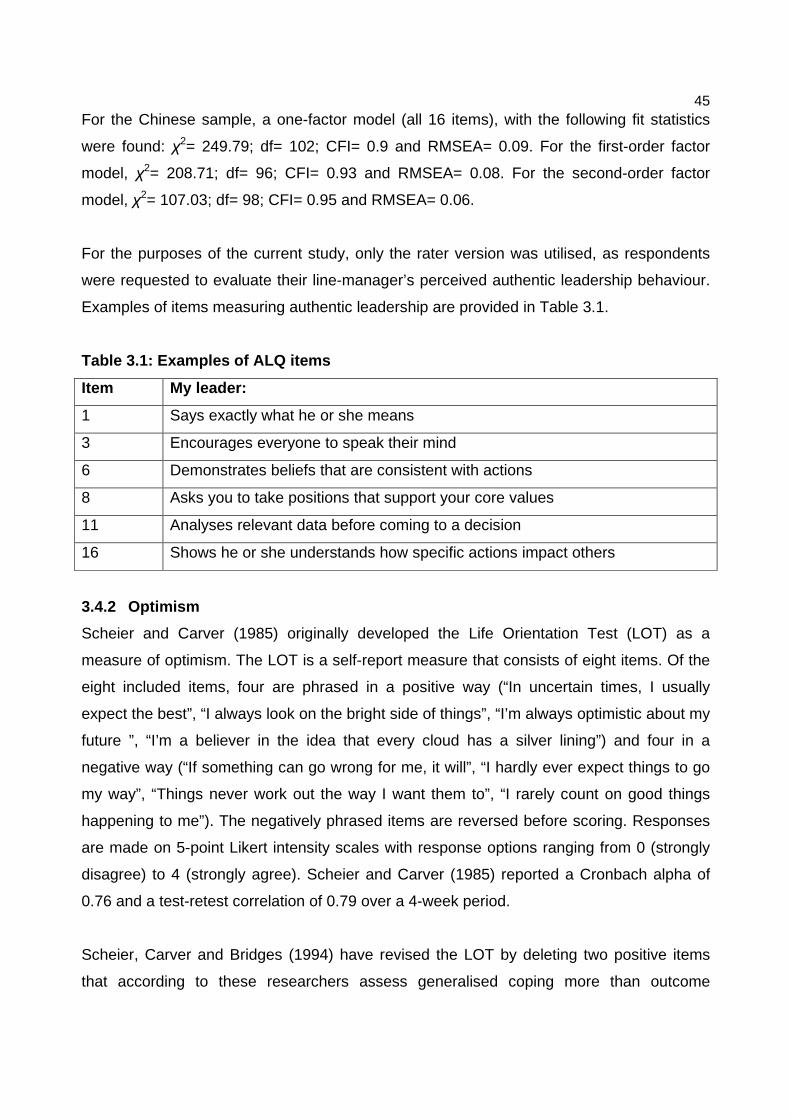
45 For the Chinese sample, a one-factor model (all 16 items), with the following fit statistics
were found: χ2= 249.79; df= 102; CFI= 0.9 and RMSEA= 0.09. For the first-order factor
model, χ2= 208.71; df= 96; CFI= 0.93 and RMSEA= 0.08. For the second-order factor
model, χ2= 107.03; df= 98; CFI= 0.95 and RMSEA= 0.06.
For the purposes of the current study, only the rater version was utilised, as respondents
were requested to evaluate their line-manager’s perceived authentic leadership behaviour.
Examples of items measuring authentic leadership are provided in Table 3.1.
Table 3.1: Examples of ALQ items
Item My leader:
1 Says exactly what he or she means
3 Encourages everyone to speak their mind
6 Demonstrates beliefs that are consistent with actions
8 Asks you to take positions that support your core values
11 Analyses relevant data before coming to a decision
16 Shows he or she understands how specific actions impact others
3.4.2 Optimism
Scheier and Carver (1985) originally developed the Life Orientation Test (LOT) as a
measure of optimism. The LOT is a self-report measure that consists of eight items. Of the
eight included items, four are phrased in a positive way (“In uncertain times, I usually
expect the best”, “I always look on the bright side of things”, “I’m always optimistic about my
future ”, “I’m a believer in the idea that every cloud has a silver lining”) and four in a
negative way (“If something can go wrong for me, it will”, “I hardly ever expect things to go
my way”, “Things never work out the way I want them to”, “I rarely count on good things
happening to me”). The negatively phrased items are reversed before scoring. Responses
are made on 5-point Likert intensity scales with response options ranging from 0 (strongly
disagree) to 4 (strongly agree). Scheier and Carver (1985) reported a Cronbach alpha of
0.76 and a test-retest correlation of 0.79 over a 4-week period.
Scheier, Carver and Bridges (1994) have revised the LOT by deleting two positive items
that according to these researchers assess generalised coping more than outcome
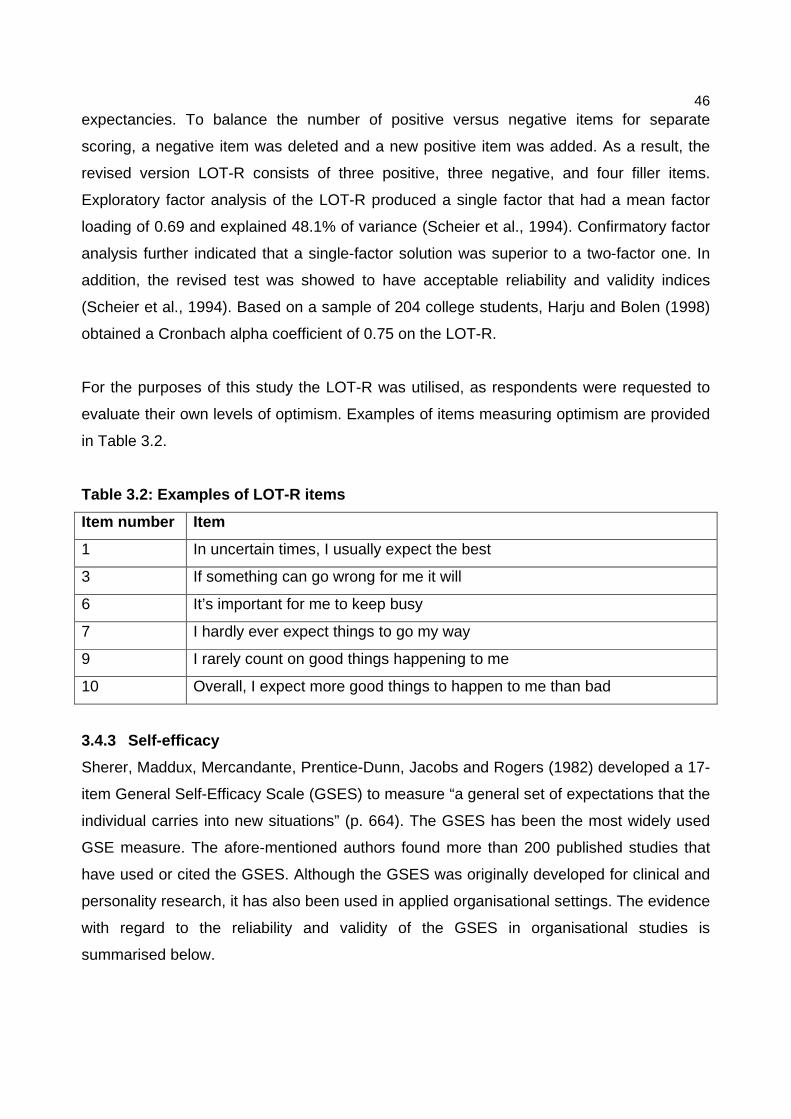
46 expectancies. To balance the number of positive versus negative items for separate
scoring, a negative item was deleted and a new positive item was added. As a result, the
revised version LOT-R consists of three positive, three negative, and four filler items.
Exploratory factor analysis of the LOT-R produced a single factor that had a mean factor
loading of 0.69 and explained 48.1% of variance (Scheier et al., 1994). Confirmatory factor
analysis further indicated that a single-factor solution was superior to a two-factor one. In
addition, the revised test was showed to have acceptable reliability and validity indices
(Scheier et al., 1994). Based on a sample of 204 college students, Harju and Bolen (1998)
obtained a Cronbach alpha coefficient of 0.75 on the LOT-R.
For the purposes of this study the LOT-R was utilised, as respondents were requested to
evaluate their own levels of optimism. Examples of items measuring optimism are provided
in Table 3.2.
Table 3.2: Examples of LOT-R items
Item number Item
1 In uncertain times, I usually expect the best
3 If something can go wrong for me it will
6 It’s important for me to keep busy
7 I hardly ever expect things to go my way
9 I rarely count on good things happening to me
10 Overall, I expect more good things to happen to me than bad
3.4.3 Self-efficacy
Sherer, Maddux, Mercandante, Prentice-Dunn, Jacobs and Rogers (1982) developed a 17-
item General Self-Efficacy Scale (GSES) to measure “a general set of expectations that the
individual carries into new situations” (p. 664). The GSES has been the most widely used
GSE measure. The afore-mentioned authors found more than 200 published studies that
have used or cited the GSES. Although the GSES was originally developed for clinical and
personality research, it has also been used in applied organisational settings. The evidence
with regard to the reliability and validity of the GSES in organisational studies is
summarised below.
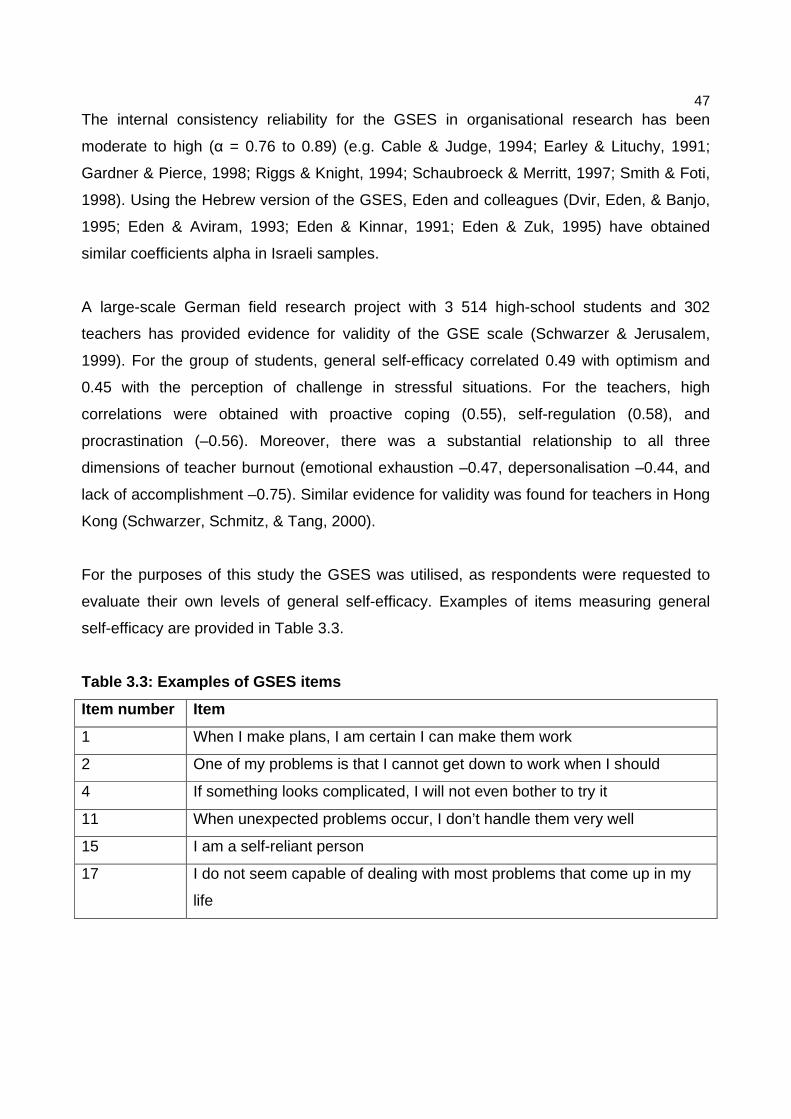
47 The internal consistency reliability for the GSES in organisational research has been
moderate to high (α = 0.76 to 0.89) (e.g. Cable & Judge, 1994; Earley & Lituchy, 1991;
Gardner & Pierce, 1998; Riggs & Knight, 1994; Schaubroeck & Merritt, 1997; Smith & Foti,
1998). Using the Hebrew version of the GSES, Eden and colleagues (Dvir, Eden, & Banjo,
1995; Eden & Aviram, 1993; Eden & Kinnar, 1991; Eden & Zuk, 1995) have obtained
similar coefficients alpha in Israeli samples.
A large-scale German field research project with 3 514 high-school students and 302
teachers has provided evidence for validity of the GSE scale (Schwarzer & Jerusalem,
1999). For the group of students, general self-efficacy correlated 0.49 with optimism and
0.45 with the perception of challenge in stressful situations. For the teachers, high
correlations were obtained with proactive coping (0.55), self-regulation (0.58), and
procrastination (–0.56). Moreover, there was a substantial relationship to all three
dimensions of teacher burnout (emotional exhaustion –0.47, depersonalisation –0.44, and
lack of accomplishment –0.75). Similar evidence for validity was found for teachers in Hong
Kong (Schwarzer, Schmitz, & Tang, 2000).
For the purposes of this study the GSES was utilised, as respondents were requested to
evaluate their own levels of general self-efficacy. Examples of items measuring general
self-efficacy are provided in Table 3.3.
Table 3.3: Examples of GSES items
Item number Item
1 When I make plans, I am certain I can make them work
2 One of my problems is that I cannot get down to work when I should
4 If something looks complicated, I will not even bother to try it
11 When unexpected problems occur, I don’t handle them very well
15 I am a self-reliant person
17 I do not seem capable of dealing with most problems that come up in my
life
48 The general self-efficacy measure (GSES) utilised a 5-point Likert intensity scale. The
scale had the following anchors: (0) strongly disagree, (1) disagree, (2) neutral, (3) agree,
(4) strongly agree.
3.4.4 Work engagement
The Utrecht Work Engagement Scale (UWES) was developed by Schaufeli and Bakker
(2003). This 17-item questionnaire is arranged along a seven-point Likert frequency scale
ranging from 0 (never) to 6 (daily). The UWES has three sub-scales, namely vigour (6
items) dedication (5 items), and absorption (6 items). Vigour is assessed by six items that
refer to high levels of energy and resilience, the willingness to invest effort, not being easily
fatigued, and persistence in the face of difficulties. Dedication is assessed by five items that
refer to deriving a sense of significance from one’s work, feeling enthusiastic and proud
about one’s job, and feeling inspired and challenged by it. Absorption is measured by six
items that refer to being totally and happily immersed in one’s work and having difficulties
detaching oneself from it so that time passes quickly and one forgets everything else that is
around.
Examples relating to the three dimensions are the following: “I am bursting with energy in
my work” (vigour); “I find my work full of meaning and purpose” (dedication); and “When I
am working, I forget everything around me” (absorption). High levels of vigour, dedication
and absorption point to an individual who experiences a high level of work engagement.
Regarding internal consistency, Cronbach coefficients have been determined between 0.68
and 0.91 (Schaufeli et al., 2002a).
The results of psychometric analyses from the UWES can be summarised as follows:
Factorial validity - Confirmatory factor analyses show that the hypothesised three-factor
structure of the UWES is superior to the one-factor model and fits well to the data of
various samples from The Netherlands, Spain and Portugal (Salanova, Schaufeli, Llorens,
Pieró & Grau, 2001; Schaufeli et al., 2002a; Schaufeli et al., 2002b ; Schaufeli, Taris, & Van
Rhenen, 2003). However, there is one exception, using exploratory factor analysis,
Sonnentag (2003) did not find a clear three-factor structure and consequently decided to
49 use the total-score on the UWES as a measure for work engagement, i.e. a uni-
dimensional factor structure.
Inter-correlations - Although, according to confirmatory factor analyses the UWES seems
to have a three-dimensional structure, these three dimensions are closely related.
Correlations between the three scales usually exceed 0.65 (e.g., Demerouti et al., 2001;
Salanova et al., 2001; Schaufeli et al., 2002a), whereas correlations between the latent
variables range from about 0.80 to about 0.90 (Salanova et al., 2001; Schaufeli et al.,
2002a).
Cross-national invariance - The factor structure of the slightly adapted student version of
the UWES is largely invariant across samples from Spain, The Netherlands and Portugal
(Schaufeli et al., 2002b). Detailed analyses showed that the loadings of maximum three
items differed significantly between the samples of the three countries.
Internal consistency - The internal consistency of the three scales of the UWES is
considered generally as good. That is, in all cases values of Cronbach's alpha are equal to
or exceed the critical value of 0.70 (Nunnaly & Bernstein, 1984). Usually values of
Cronbach’s alpha for the scales range between 0.80 and 0.90 (Salanova et al., 2001;
Salanova, Grau, Llorens, & Schaufeli, 2001; Demerouti et al., 2001; Montgomery, Peeters,
Schaufeli, & Den Ouden, 2003; Salanova, Bresó, & Schaufeli, 2003; Schaufeli, Taris, &
Van Rhenen, 2003; Salanova, Carrero, Pinazo, & Schaufeli, 2003; Schaufeli & Bakker,
2004).
Stability - Scores on the UWES are relatively stable across time. Two-year stability
coefficients for vigour, dedication and absorption are 0.30, 0.36, and 0.46, respectively
(Bakker, Euwema, & Van Dierendonck, 2003).
For the purposes of this study the UWES was utilised, as respondents were requested to
evaluate their own levels of work engagement. Examples of items measuring work
engagement are provided in Table 3.4.
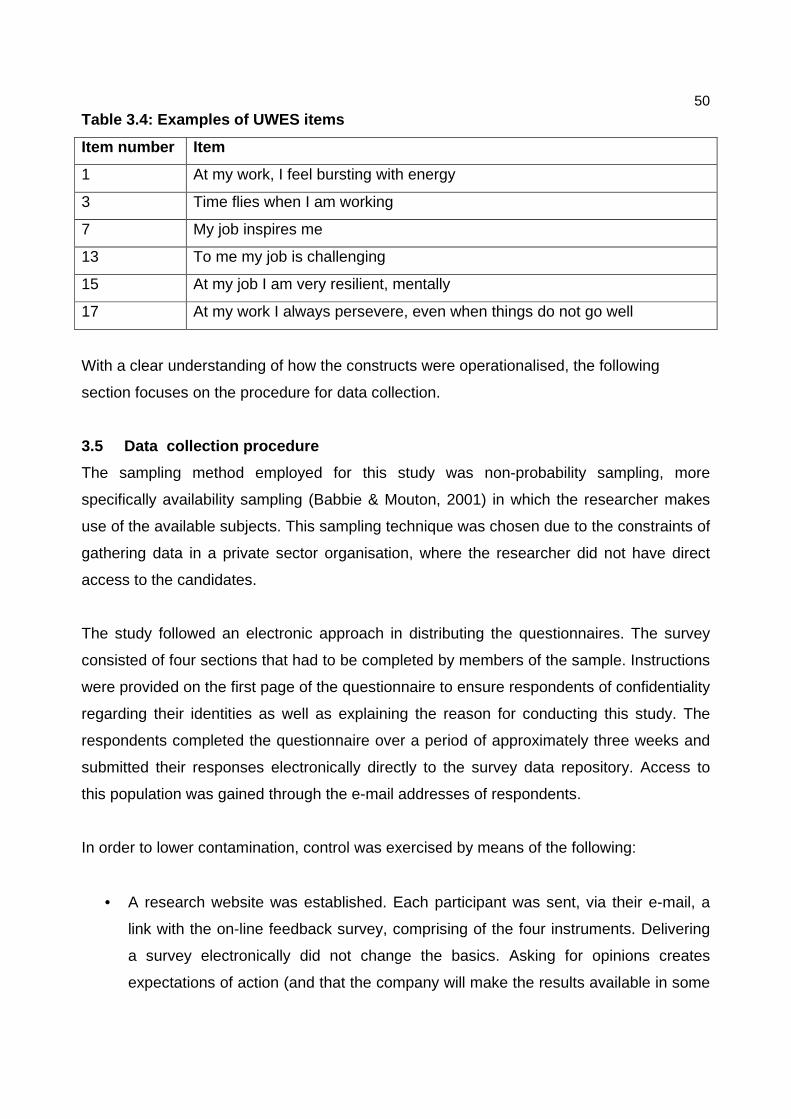
50 Table 3.4: Examples of UWES items
Item number Item
1 At my work, I feel bursting with energy
3 Time flies when I am working
7 My job inspires me
13 To me my job is challenging
15 At my job I am very resilient, mentally
17 At my work I always persevere, even when things do not go well
With a clear understanding of how the constructs were operationalised, the following
section focuses on the procedure for data collection.
3.5 Data collection procedure
The sampling method employed for this study was non-probability sampling, more
specifically availability sampling (Babbie & Mouton, 2001) in which the researcher makes
use of the available subjects. This sampling technique was chosen due to the constraints of
gathering data in a private sector organisation, where the researcher did not have direct
access to the candidates.
The study followed an electronic approach in distributing the questionnaires. The survey
consisted of four sections that had to be completed by members of the sample. Instructions
were provided on the first page of the questionnaire to ensure respondents of confidentiality
regarding their identities as well as explaining the reason for conducting this study. The
respondents completed the questionnaire over a period of approximately three weeks and
submitted their responses electronically directly to the survey data repository. Access to
this population was gained through the e-mail addresses of respondents.
In order to lower contamination, control was exercised by means of the following:
• A research website was established. Each participant was sent, via their e-mail, a
link with the on-line feedback survey, comprising of the four instruments. Delivering
a survey electronically did not change the basics. Asking for opinions creates
expectations of action (and that the company will make the results available in some
51 form). There were many advantages to conducting the survey electronically. Since
the data can be analysed with great speed, the respondents and organisation will
receive a summary of the findings in electronic format. There is no cost for printing
or postage, and no waste of paper. Electronic surveys do pose some problems,
however. First, respondents must have access to e-mail. Less obvious is the non-
anonymous nature of e-mail.
• Surveys were announced in advance by the researcher within the company, partly
because many people delete messages from people they do not recognise. For this
study, the Corporate Development Director agreed to the sending out of such an
email message to participants. This announcement addressed anonymity, the goals
of the questionnaire and the importance of the response and the researcher’s e-mail
address from which the questionnaires were sent. A follow-up message increases
the response rate (Zatz, 2000). However, such a message was short and stressed
the importance of responding.
• Respondents had to complete the entire questionnaire on their own. Respondents
were given the opportunity to complete the questionnaires during working hours,
whenever they had the time to work on it.
• Participants were guaranteed complete confidentiality and anonymity.
Thus, the methodological approach to the research study was essentially quantitative in
nature, making use of electronic survey data collection.
3.6 Data analysis
The choice of data analysis technique is dependent on the type of research questions the
study is aiming to answer. As previously stated, this study’s research questions are guided
by several propositions, each focussing on a specific purpose associated with scientific
research. In general, data analysis techniques focus on relationships, significance of group
membership, and structure (Field, 2005; Hair, Black, Babin, Anderson, & Tatham, 2006).
52 The data in this study was analysed by means of quantitative techniques. The following
sections elaborate on the various data analysis techniques that were employed to test the
various propositions. These include factor analysis, Pearson product-moment correlation
analysis, multiple regression analysis, and structural equation modeling (e.g. partial least
squares path modeling).
3.6.1 Determining the underlying structures of the constructs
One of the aims of this study was to determine the underlying structure associated with
each of the measured constructs. Data obtained from the respondents were used to
confirm factor structures and evaluate internal consistency.
Confirmatory factor analysis (CFA) was utilised to confirm the observed structure of the
constructs and where necessary, exploratory factor analysis was utilised to explore the
data and gain information on how many factors were needed to best represent the data.
With exploratory factor analysis (EFA), all measured variables are related to every other
factor by a factor loading estimate (Hair et al., 2006).
The following sections focus on the two major approaches to factor analysis, namely
confirmatory factor analysis (CFA) and exploratory factor analysis (EFA).
3.6.1.1 Confirmatory factor analysis
To evaluate the quality of the measurements in terms of the data obtained (i.e.
measurement models), confirmatory factor analysis must be conducted. The latter
procedure is discussed in the following section.
Confirmatory factor analysis is a way of testing how well measured variables represent a
smaller number of constructs (Hair et al., 2006). CFA is similar to EFA in many respects,
but according to Hair et al. (2006), philosophically it is quite different. In CFA, the
researcher must specify the number of factors that exist within a set of variables and also
which factor each variable will load highly on before results can be computed. This
information is obtained from the EFA or theory, and therefore the CFA serves to confirm the
observed structure of the constructs. Structural equation modeling is then used to test how
53 well the researcher’s a priori pattern of factor loadings fits the actual data. Therefore, CFA
assists researchers to either reject or accept their preconceived theory.
Confirmatory factor analysis is particularly useful in a deductive reasoning process. Specific
hypothesis testing is possible when using CFA. With CFA, it is possible to test the
hypothesis that two factors versus only one factor (or any other numeric combination)
underlie a set of data. Another use of CFA is to assess the equivalence of parts of the basic
factor model within a given data set. It is also important to determine whether the results of
a factor analysis are similar across demographic groups. Confirmatory factor analysis
permits tests of invariance – that is, the equivalence of factor structure, loadings,
uniqueness- across different groups (e.g., ethnic, gender, cultural) of individuals (Salkind,
2007, p. 245). However, in this study, this was not the emphasis.
Confirmatory factor analysis has greater flexibility in control than exploratory factor
analysis. With CFA, some factors may be specified as oblique (correlated with one another)
whereas others are specified to be orthogonal (uncorrelated with one another). Within a
single EFA, the factors are interpreted as either oblique or orthogonal but not a combination
of the two. In addition, CFA allows the researcher to flexibly impose additional constraints
subject to theory (e.g., allowing correlated uniqueness). However, a benefit of EFA is that
no such theoretical constraints or specifications are needed. Therefore if none exist, then
EFA may be a better choice (Salkind, 2007).
The purpose of carrying out confirmatory factor analysis (CFA) was to provide statistical
evidence on whether each of the identified variables is adequately defined in terms of the
common variance among the indicators (i.e. items) in a measurement model (MacKenzie,
Podsakoff, & Jarvis, 2005).
In this study, CFA was used to confirm the factor structure of each of the variables and to
provide a confirmatory test of the measurement theory (authentic leadership, optimism,
self-efficacy and work engagement). This involved constructing a model of relationships
that are tested by the measurement theory. The measurement theory specifies a series of
relationships that suggest how measured variables represent a latent construct that is not
measured directly. Once the researcher uses measurement theory to specify a priori the
54 number of factors as well as which variables load on these factors, a measurement model
will be operationalised (Hair et al., 2006). Only once this is done and the factor structure is
accepted with confidence, can the researcher continue to evaluate the research questions.
Once the measurement models have been specified, the next step is to determine how the
measurement model will be estimated. In the present study, the method of estimation used
in CFA and structural equation modeling was robust diagonally weighted least squares,
also called generalised least squares. The least squares method is widely used to find or
estimate the numerical values of parameters to fit a function to a set of data and to
characterise the statistical properties of estimates. Its simpler version is called ordinary
least squares (OLS), and a more sophisticated version is called weighted least squares
(WLS), which often performs better than OLS because it can modulate the importance of
each observation in the final solution (Harper, 1974-1976). Robust WLS approach allows
for a combination of binary ordered polytomous and continuous outcome variables and
allows for multi-group analysis (Muthén, 1984).
After the measurement model has been specified and the parameters have been
estimated, the following step is the assessment of the validity of each of the measurement
models using a number of goodness-of-fit statistics, including Satorra-Bentler chi-square
(S-B χ2), goodness-of-fit index (GFI), standardised root mean square residual (SRMR), root
mean square error of approximation (RMSEA), normed fit index (NFI), and comparative fit
index (CFI).
The following section explores the variables used in conducting confirmatory factor analysis
of each of the measurement models for the constructs.
3.6.1.2 Variables in CFA
There are several identified constructs used in this study. However, these constructs are
measured through several indicators (i.e. items in a questionnaire). Thus, latent variables
are equivalent to the identified variables used in the study. The indicator variables (also
known as manifest/observed variables) are equivalent to the items or parcels that are used
to measure these constructs (Tabachnick & Fidell, 2001).
55 3.6.1.3 Evaluating the measurement models through c onfirmatory factor analysis
In evaluating the goodness-of-fit for the constructs used in the current study, several
approximate fit indices may be consulted. Hence, the degree to which the observed matrix
fits the sample matrix is determined through goodness-of-fit tests, discussed in the
following section.
3.6.1.3.1 Goodness-of-fit statistics
Goodness-of-fit indices are numerical indices that evaluate how well the model accounts for
the data. These indices can be compared for a series of models with increasing number of
common factors. The appropriate number of factors is determined by fitting a model in
which a model with one less factor demonstrates substantially poorer fit and a model with
one more factor provides little improvement in fit (Fletcher, 2007).
Several goodness-of-fit statistics were used to determine the validity of the measurement
models in the current study. For the purposes of this study, only the following goodness-of-
fit statistics are discussed, as they are the most widely reported and used fit statistics
(Byrne, 1998; Hair et al., 2006): Satorra-Bentler chi-square (S-B χ2), goodness-of-fit index
(GFI), standardised root mean square residual (SRMR), root mean square error of
approximation (RMSEA), normed fit index (NFI), and comparative fit index (CFI). Each of
these fit statistics are discussed briefly below.
a) Satorra-Bentler scaled chi-square (S-B X2)
A family of scaling corrections aimed to improve the chi-square approximation of goodness-
of-fit test statistics in small samples, large models and nonnormal data was proposed by
Satorra and Bentler (1994). The Satorra-Bentler scaled chi-square is used when robust
estimation techniques are employed. The reason why robust estimation techniques are
used is when data deviates from the normal distribution. If the data departs markedly from
multivariate normality, the Satorra-Bentler scaled chi square statistic (S-B X2) should be
used to provide an improved estimate of the fit of a model (Satorra & Bentler, 2001).
b) Goodness-of-fit index (GFI)
The goodness-of-fit index was an early attempt to produce a fit statistic that is less sensitive
to sample size. The possible range of GFI values are 0 to 1, with higher values indicating
56 better fit (Hair et al., 2006). It is suggested that values higher than 0.9 are indicative of
acceptable model fit (Bentler & Bonett, 1980).
c) Standardised root mean residual (SRMR)
The SRMR is the standardised square root of the mean of the squared residuals, in other
words, an average of the residuals between individual observed and estimated covariance
and variance terms. Lower SRMR values represent better fit and higher values represent
worse fit. The average SRMR value is 0, meaning that both positive and negative residuals
can occur (Hair et al., 2006). An arbitrary cut-off of between 0.05 and 0.08 can be
suggested for SRMR (Hair et al., 2006).
d) The root mean square error of approximation (RMSEA)
The RMSEA is a good representation of how well the model fits the population, not just the
sample used for estimation. Lower RMSEA values indicate a better fit (Hair et al., 2006). In
general, as with SRMR, values below 0.10 for the RMSEA are indicative of acceptable fit,
with values below 0.05 suggesting a very good fit (Hair et al., 2006).
e) Comparative fit index (CFI) and normed fit index (NFI)
A general guideline for the interpretation of the CFI and NFI is that values of 0.90 and
higher indicate satisfactory fit between the postulated model and empirical data (Hair et al.,
2006).
3.6.1.3.2 Comparison of groups In order to increase the robustness of the CFA, a comparison of groups and cross-
validation was done for the optimism construct (reason to be discussed later). This
indicates the degree to which one sample produces the same results as another sample
(Hair et al., 2006). In other words, cross-validation of a structural equation model refers to
the ability of the model to be equivalent across two or more random samples from the same
population.
In the current study, the sample (n=407) was randomly divided into two groups in order to
determine the cross-validation within the sample. Loose cross-validation was employed to
determine the fit of the revised optimism construct.
57
In loose cross-validation, the same CFA model used with the original sample is imposed on
the validation sample. A CFA is then conducted using only the validation sample. If the
CFA fits the original sample well, there is evidence of cross-validation. It is important to
note that for this method both samples will have the same number of degrees of freedom
because the same factor structure is used. In this method, no comparison of fit is made
(Hair et al., 2006).
The following section focuses on the second major approach to factor analysis, namely
exploratory factor analysis.
3.6.2 Exploratory factor analysis
In those instances where confirmatory factor analysis results suggest a poor fit between the
observed data and the theoretical model, exploratory factor analysis was used to identify
the reasons for the poor fitting results.
Typically, the goal of exploratory factor analysis (EFA) is to let the data determine the
interrelationships among a set of variables. Although a researcher using EFA may have a
theory relating the variables to one another, there are relatively few restrictions on the basic
factor model in an EFA. First, the EFA is useful in data reduction when interrelationships
among variables are not specified beforehand. A second benefit of EFA is the ability to
detect a general factor. Thirdly, EFA is particularly useful in scale or test development
because it allows the researcher to determine the dimensionality of the test and detect
cross-loadings (correlations of variables with more than one factor (Fletcher, 2007).
Item analysis consists of exploratory factor analysis as well as reliability analysis. An item
analysis was conducted on the scales that were used for data gathering. The purpose of
item analysis was twofold, namely to determine acceptable factor loadings, and to
investigate reliability and inter-item correlations. In determining acceptable factor loadings
the general rule used is that factors have to have a loading of >0.3 to be accepted (Hair et
al., 2006). In the event of a two-factor (or more) structure, items are also analysed for
possible cross-loadings. In the case of the latter, items may be removed to provide a simple
structure.
58
The purpose of investigating reliability and inter-item correlations is to ascertain which of
the items in a scale, if any, have a negative effect on the overall reliability of the scale due
to their inclusion in the particular scale. If a significant improvement in overall scale
reliability occurs as a result of excluding a particular item, such item is also excluded from
the subsequent factor analysis. Exploratory factor analysis is conducted when there are no
explicit expectations regarding the number and nature of the underlying factors in each of
the constructs (Hair et al., 2006).
In order to conduct exploratory factor analysis on the identified variables in question, the
following steps are proposed (Field, 2005; Grimm & Yarnold, 1995; Hair et al., 2006;
Kerlinger & Lee, 2000): (a) deciding which method of extraction should be used to extract
the factors, (b) identifying the most appropriate method of rotating the factors, (c)
determining how many factors can be extracted, and (d) determining how factor scores
must be computed if factor scores are of interest.
3.6.2.1 Determining the number of factors to be ext racted
Before determining how many factors can be extracted, it is important to first determine if
the identified construct can be factor analysed. This was done by calculating both the
Kaiser-Meyer-Olkin (KMO) measure of sampling adequacy and the Bartlett’s test of
sphericity.
The KMO can be calculated for individual and multiple variables and represents the ratio of
the squared correlation between variables to the squared partial correlation between
variables. The KMO statistic varies between 0 and 1. A value of 0 indicates that the sum of
partial correlations is large relative to the sum of correlations, indicating diffusion in the
pattern of correlations, thereby deeming factor analysis inappropriate. A value close to 1
indicates that patterns of correlations are relatively compact and therefore factor analysis
should present distinct and reliable factors. The cut-off value that will be utilised in this
study is 0.3 (Hair et al., 2006).
Another method of determining the appropriateness of factor analysis examines the entire
correlation matrix. The Bartlett test of sphericity is one such measure as it is a test for the
59 presence of correlations among the variables. It examines the correlations among all
variables and assesses whether, collectively, significant intercorrelations exists (Hair et al.,
2006). Significance is measured at the 0.05 level.
The factor analysis method employed to extract factors in the present research study was
principal components analysis. Principle components analysis considers the total variance
and derives factors that contain small proportions of unique variance and, in some
instances, error variance. However, the first few factors do not contain enough unique or
error variance to distort the overall factor structure. Specifically, with component analysis,
unities are inserted in the diagonal of the correlation matrix, so that the full variance is
brought into the factor matrix (Hair et al., 2006).
Rather than arbitrarily constraining the factor rotation to an orthogonal solution, the oblique
rotation identifies the extent to which each of the factors are correlated. The oblique
rotation assumes that the extracted factors are correlated (Hair et al., 2006). This method is
deemed suitable “if the ultimate goal of the factor analysis is to obtain several theoretically
meaningful factors or constructs” (Hair et al., 2006, p.110). Conclusions drawn from this
method are restricted to the sample collected and generalisation of the results can be
achieved only if analysis using different samples reveals the same factor structure (Field,
2005).
In deciding whether a factor in the factor analysis is statistically important enough to extract
from the data for interpretation purposes, the decision is made on the eigenvalue
associated with the factor. The eigenvalue (or Kaiser’s criterion) is based on the idea of
retaining factors with associated eigenvalues greater than 1. The scree plot is consulted in
the decision of extraction by looking at the point of inflection of the curve. However,
previous research has identified parallel analysis as a more accurate method of estimating
the number of factors to be extracted (Fletcher, 2007).
The following section focuses on the parallel analysis method of estimating the number of
factors to be extracted that was utilised in this study.
60 3.6.2.2 Parallel analysis
Parallel analysis involves comparing eigenvalues obtained from the data with eigenvalues
that would be expected from random data with an equivalent number of variables and
equivalent sample size. The number of factors retained is equivalent to the number of
eigenvalues expected from the random data (Fletcher, 2007).
For example, when focussing on the Life Orientation Test Revised, if the original data set
consists of 407 observations, then a series of random data matrices of this size (407 x 6)
would be generated, and eigenvalues would be computed for the correlation matrices for
the original data and for each of the original data sets. The reason for the 6 items is that
The LOT-R consist of 6 items. The eigenvalues derived from the actual data are then
compared to the eigenvalues derived from the random data. In Horn’s (1965) original
description of this procedure, the mean eigenvalues from the random data served as the
comparison baseline, whereas a currently recommended practice is to use eigenvalues that
correspond to the desired percentile (typically the 95th) of the distribution of random data
eigen values (Cota, Longman, Holden, Fekken, & Xinaris, 1993; and Glorfeld, 1995.
Factors or components are retained as long as the ith eigenvalue from the actual data is
greater than the ith eigenvalue from the random data.
3.6.3 Determining the degree of relationship betwee n variables
In Chapter 2, eight research propositions (1-8) were identified suggesting statistical
analysis techniques that can determine the relationships among the measured constructs.
These propositions focus on both the descriptive and predictive purpose of research, and
they all focus on the question of relationships between variables.
Two of the most appropriate data analysis techniques that can be employed in evaluating
these propositions are bivariate r and multiple R (Bless & Higson-Smith, 2000; Field, 2005;
Hair et al., 2006; Kerlinger & Lee, 2000). Both of these techniques are discussed below.
3.6.3.1 Correlation (Bivariate r)
The Pearson product-moment correlation coefficient is a standardised measure of the
strength of the relationship between variables. It can take any value from -1 (as one
variable changes, the other changes in the opposite direction by the same amount),
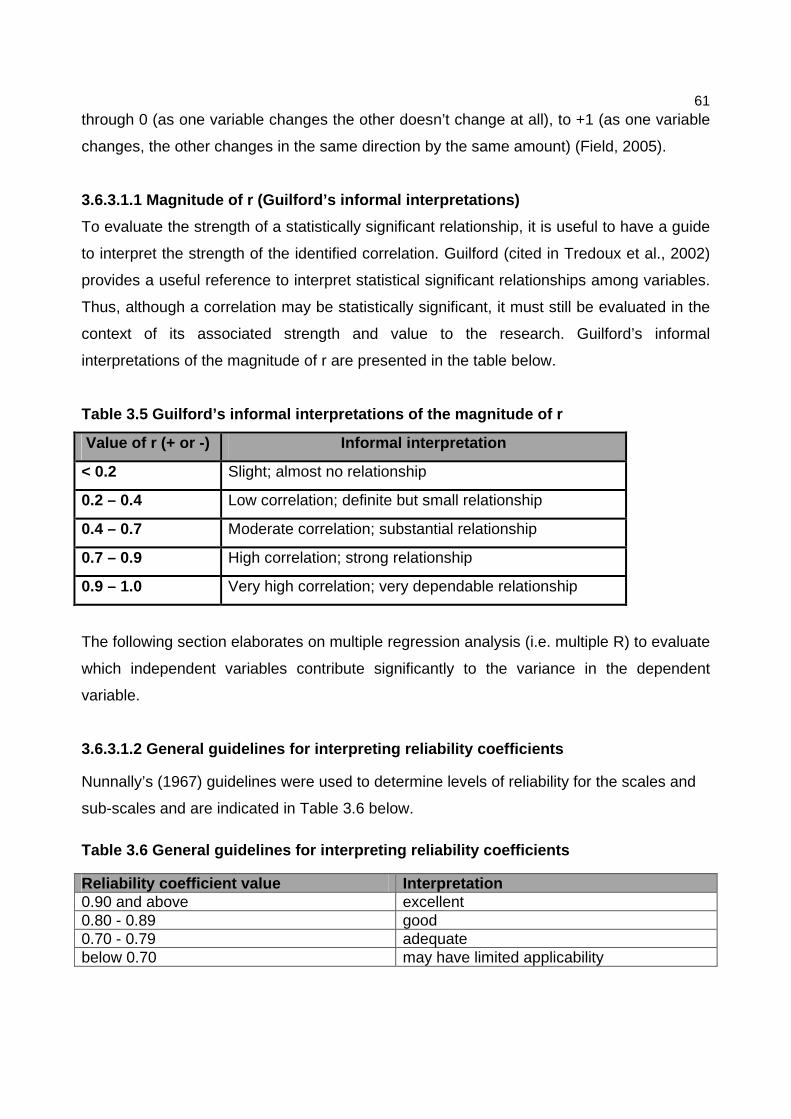
61 through 0 (as one variable changes the other doesn’t change at all), to +1 (as one variable
changes, the other changes in the same direction by the same amount) (Field, 2005).
3.6.3.1.1 Magnitude of r (Guilford’s informal interpretations)
To evaluate the strength of a statistically significant relationship, it is useful to have a guide
to interpret the strength of the identified correlation. Guilford (cited in Tredoux et al., 2002)
provides a useful reference to interpret statistical significant relationships among variables.
Thus, although a correlation may be statistically significant, it must still be evaluated in the
context of its associated strength and value to the research. Guilford’s informal
interpretations of the magnitude of r are presented in the table below.
Table 3.5 Guilford’s informal interpretations of th e magnitude of r
Value of r (+ or -) Informal interpretation
< 0.2 Slight; almost no relationship
0.2 – 0.4 Low correlation; definite but small relationship
0.4 – 0.7 Moderate correlation; substantial relationship
0.7 – 0.9 High correlation; strong relationship
0.9 – 1.0 Very high correlation; very dependable relationship
The following section elaborates on multiple regression analysis (i.e. multiple R) to evaluate
which independent variables contribute significantly to the variance in the dependent
variable.
3.6.3.1.2 General guidelines for interpreting relia bility coefficients Nunnally’s (1967) guidelines were used to determine levels of reliability for the scales and
sub-scales and are indicated in Table 3.6 below.
Table 3.6 General guidelines for interpreting relia bility coefficients Reliability coefficient value Interpretation 0.90 and above excellent 0.80 - 0.89 good 0.70 - 0.79 adequate below 0.70 may have limited applicability
62 3.6.4 Multiple regression analysis
Regression analysis is the name for a family of techniques that attempts to predict one
variable (an outcome or dependent variable) from another variable, or set of variables (the
predictor or independent variables). Each of the parameters in the regression analysis can
have a standard error associated with it, and hence a confidence interval can be calculated
for each parameter with a p-value. Regression generalizes to a case with multiple predictor
variables, referred to as multiple regression. The advantage and power of multiple
regression is that it enables the researcher to estimate the effect of each variable,
controlling for the other variables. That is, it estimates what the slope would be if all other
variables were controlled (Salkind, 2007).
Multiple regression analysis, a form of general linear modeling, is a multivariate statistical
technique that is used in this study to examine the relationship between a single dependent
variable (work engagement) and set of independent variables (authentic leadership,
optimism, self-efficacy). With its broad applicability, multiple regression has been used for
many purposes. This application falls broadly within two groups, namely prediction and
explanation. Prediction involves the extent to which the regression variate (one or more
independent variables) can predict the dependent variable. Explanation examines the
magnitude, sign and statistical significance of the regression coefficients (the amount of
change in the dependent variable for a one unit change in the independent variable) for
each independent variable and attempts to develop a substantive or theoretical reason for
the effects of the independent variables (Hair et al., 2006).
The result of the multiple regression analysis for this study will be discussed in Chapter 4.
The results of the multiple regression will assist in predicting the impact of the independent
variables on the dependent variable.
The following sections elaborate on structural equation modeling (SEM) and in particular
the partial least squares path modeling approach specifically utilised in the present study.
63 3.6.5 Structural equation modeling (SEM)
Structural equation modeling (SEM) is a general term that describes a large number of
statistical models used to evaluate the consistency of substantive theories with empirical
data. It represents an extension of general linear modeling procedures such as analysis of
variance and multiple regression. SEM can be used to study the relationship between latent
constructs that are indicated by multiple measures and is applicable to experimental or
non-experimental data and to cross-sectional or longitudinal data (Salkind, 2007).
There are two approaches to SEM. The first approach emphasises the testing of a theory
and is known as covariance based SEM (hard-based modeling). In contrast, the second
approach to SEM is known as soft modeling which is a variance-based approach to SEM
(e.g. partial least squares modeling). The purpose of this soft modeling approach is
prediction (Henseler et al., 2009).
Structural equation modeling is used to test a theory or for prediction. SEM can examine a
series of dependence relationships simultaneously and is therefore particularly useful in
testing theories that contain multiple equations involving dependence relationships. SEM
estimates a series of separate, but interdependent, multiple regression equations
simultaneously by specifying the structural model used by the statistical programme. SEM
therefore combines both multiple regression and CFA (MacCallum & Austin, 2000).
3.6.5.1 Evaluating the structural component of SEM through Partial Least Squares
Modeling (PLS)
Confirmatory factor analysis was utilised to evaluate the measurement component of the
proposed structural model. In order to evaluate the structural model, it was decided to use
the soft modeling approach to SEM. The soft modeling approach involves the use of Partial
Least Squares (PLS) in contrast to the hard modeling approach to SEM, which makes use
of maximum likelihood. The rationale for choosing the PLS approach to SEM is highlighted
below.
PLS models are formally defined by two sets of linear equations: the inner model and the
outer model. The inner model specifies the relationships between unobserved or latent
variables, whereas the outer model specifies the relationships between a latent variable
64 and its observed or manifest variables (Henseler et al., 2009). The inner model in PLS is
similar to the measurement model used in the hard-based modeling approach and the
outer model is similar to the structural model used in the hard-based modeling approach.
Partial least squares (PLS), is a family of alternating least squares algorithms, or
“prescriptions” which extend principal component and canonical correlation analysis. The
method was designed by Wold (1974,1982,1985) for the analysis of high dimensional data
in a low-structure environment and has undergone various extensions and modifications.
PLS, a variance-based technique has been used by a growing number of researchers from
various disciplines such as strategic management (e.g., Hulland, 1999), management
information systems (e.g., Dibbern, Goles, Hircschheim, & Jayatilaka, 2004), e-business
(e.g., Pavlou & Chai, 2002), organisational behaviour (e.g., Higgins, Duxbury, & Irving,
1992), marketing (e.g., Reinartz, Krafft, & Hoyer, 2004), and consumer behaviour (e.g.,
Fornell & Robinson, 1983).
3.6.5.1.1 Motivation for using PLS modeling
• The most important motivations for using PLS modeling are exploration and
prediction, as PLS path modeling is recommended in an early stage of theoretical
development in order to test and validate exploratory models. Another powerful
feature of PLS path modeling is that it is suitable for prediction-oriented research.
Thereby, this methodology assists researchers who focus on the explanation of
endogenous constructs (Henseler et al., 2009).
The characteristics researchers regard as relevant for the above-mentioned prediction-
oriented research can be summarised as follows.
• PLS delivers latent variable scores, i.e. proxies of the constructs, which are
measured by one or several indicators (manifest variables).
• PLS path modeling avoids small sample size problems and can therefore be applied
in some situations when other methods cannot.
• PLS path modeling can estimate very complex models with many latent and
manifest variables (i.e. saturation problem of covariance based SEM).
65 • PLS path modeling has less stringent assumptions about the distribution of variables
and error terms.
• PLS can handle both reflective and formative models (Henseler et al., 2009).
It is noteworthy that PLS path modeling does not have less stringent assumptions about
the representativeness of the sample than does covariance based structural equation
modeling (Henseler et al., 2009). A rule of thumb for robust PLS path modeling
estimations suggests that sample size be equal to the larger of the following (Barclay,
Higgins, & Thompson, 1995): (1) ten times the number of indicators, or (2) ten times the
largest structural paths directed at a particular construct in the inner path model. Chin
and Newsted (1999) presented a Monte Carlo simulation study on PLS with small
samples. They found that the PLS path modeling approach can provide information
about the appropriateness of indicators at sample size as low as 20. This study confirms
the consistency at large on loading estimates with increased number of observations
and numbers of manifest variables per measurement model.
3.6.5.1.2 Methodological characteristics
PLS modeling is rooted in four genuine characteristics:
(1) Instead of solely drawing on the common reflective mode, the PLS path modeling
algorithm allows the unrestricted computation of cause-effect relationship models
that employ both reflective and formative measurement models (Diamantopoulos &
Winklhofer, 2001).
(2) PLS can be used to estimate path models when sample sizes are small (Chin &
Newsted, 1999).
(3) PLS path models can be very complex (i.e. consist of many latent and manifest
variables) without leading to estimation problems (Wold, 1985). PLS modeling is
methodologically advantageous to covariance-based structural equation modeling
(SBSEM) whenever improper or non-convergent results are likely to occur (i.e.
Krijnen, Dijkstra, & Gill, 1998). Furthermore, with more complex models, the number
of latent and manifest variables may be high in relation to the number of
observations.
66 (4) PLS path modeling can be used when distributions are highly skewed (Bagozzi,
1994), or the independence of observations is not assured, because, as Fornell
(1982, p. 443) has argued, “there are no distributional requirements.”
3.6.5.1.3 Bootstrapping
The nonparametric bootstrap (Davison & Hinkley, 2003; Efron & Tibshirani, 1993)
procedure was used in PLS path modeling to provide confidence intervals for all parameter
estimates, building the basis for statistical inference. In general, the bootstrap technique
provides an estimate of the shape, spread, and bias of the sampling distribution of a
specific statistic. Bootstrapping treats the observed sample as if it represents the
population. The PLS results for all bootstrap samples provide the mean value and
standard error for each path model coefficient. This information permits a student’s t-test to
be performed for the significance of the path model relationships. Chin (1998) proposes
using the following test statistic for PLS:
temp = w
se(w)
whereby temp represents the empirical t-value, w the original PLS estimate of a certain
path coefficient, and se (w) its bootstrapping standard error. If a confidence interval for an
estimated path coefficient w does not include zero, the hypothesis that w equals zero is
rejected.
3.6.5.1.4 Evaluation of PLS path model results
PLS path modeling does not provide for any global goodness-of-fit criterion. As a
consequence, Chin (1998) has put forward a catalogue of criteria to assess partial model
structures. A systematic application of these criteria is a two-step process, encompassing
(1) the assessment of the outer model and (2) the assessment of the inner model. Figure
3.1 depicts the two-step process. At the beginning of the two-step process, model
assessment focuses on the measurement models. A systematic evaluation of PLS
estimates reveals the measurement model reliability and validity according to certain
criteria that are associated with formative and reflective outer models. It only makes sense
to evaluate the inner path model estimates when the calculated latent variable scores show
evidence of sufficient reliability and validity.
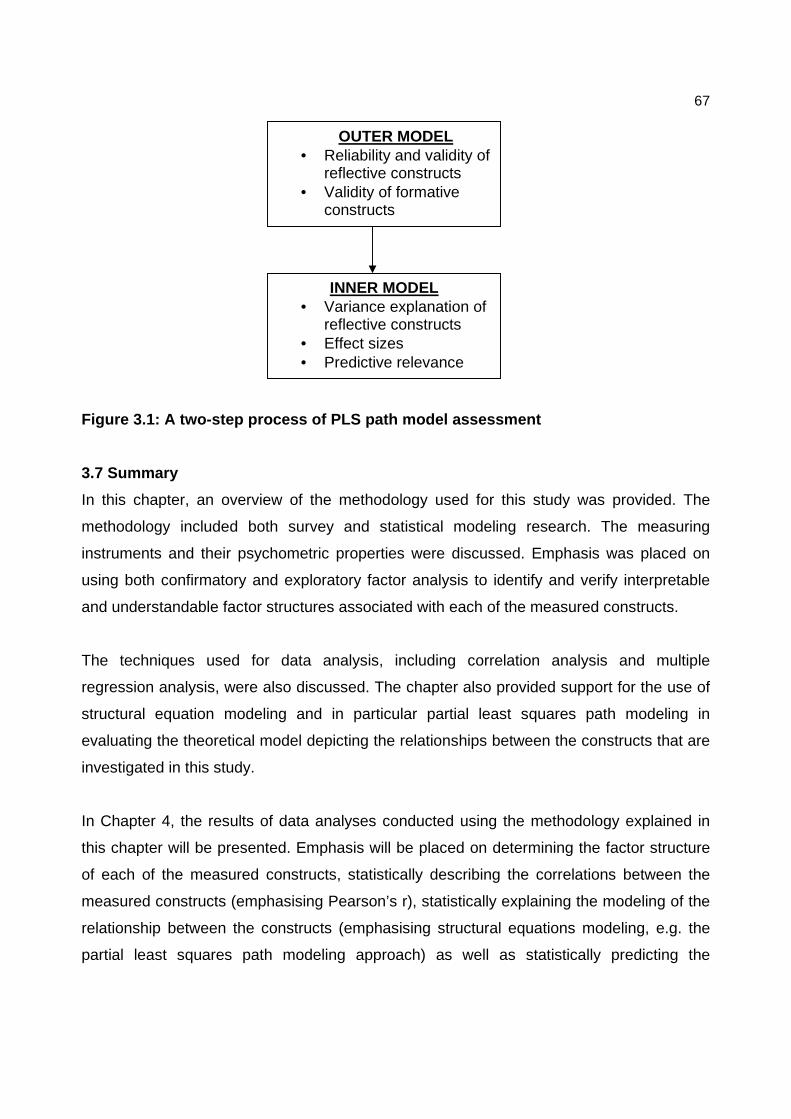
67
Figure 3.1: A two-step process of PLS path model as sessment
3.7 Summary
In this chapter, an overview of the methodology used for this study was provided. The
methodology included both survey and statistical modeling research. The measuring
instruments and their psychometric properties were discussed. Emphasis was placed on
using both confirmatory and exploratory factor analysis to identify and verify interpretable
and understandable factor structures associated with each of the measured constructs.
The techniques used for data analysis, including correlation analysis and multiple
regression analysis, were also discussed. The chapter also provided support for the use of
structural equation modeling and in particular partial least squares path modeling in
evaluating the theoretical model depicting the relationships between the constructs that are
investigated in this study.
In Chapter 4, the results of data analyses conducted using the methodology explained in
this chapter will be presented. Emphasis will be placed on determining the factor structure
of each of the measured constructs, statistically describing the correlations between the
measured constructs (emphasising Pearson’s r), statistically explaining the modeling of the
relationship between the constructs (emphasising structural equations modeling, e.g. the
partial least squares path modeling approach) as well as statistically predicting the
OUTER MODEL • Reliability and validity of
reflective constructs • Validity of formative
constructs
INNER MODEL • Variance explanation of
reflective constructs • Effect sizes • Predictive relevance

68 sequential relationship between the constructs (emphasising both multiple regression
analysis and PLS path modeling).
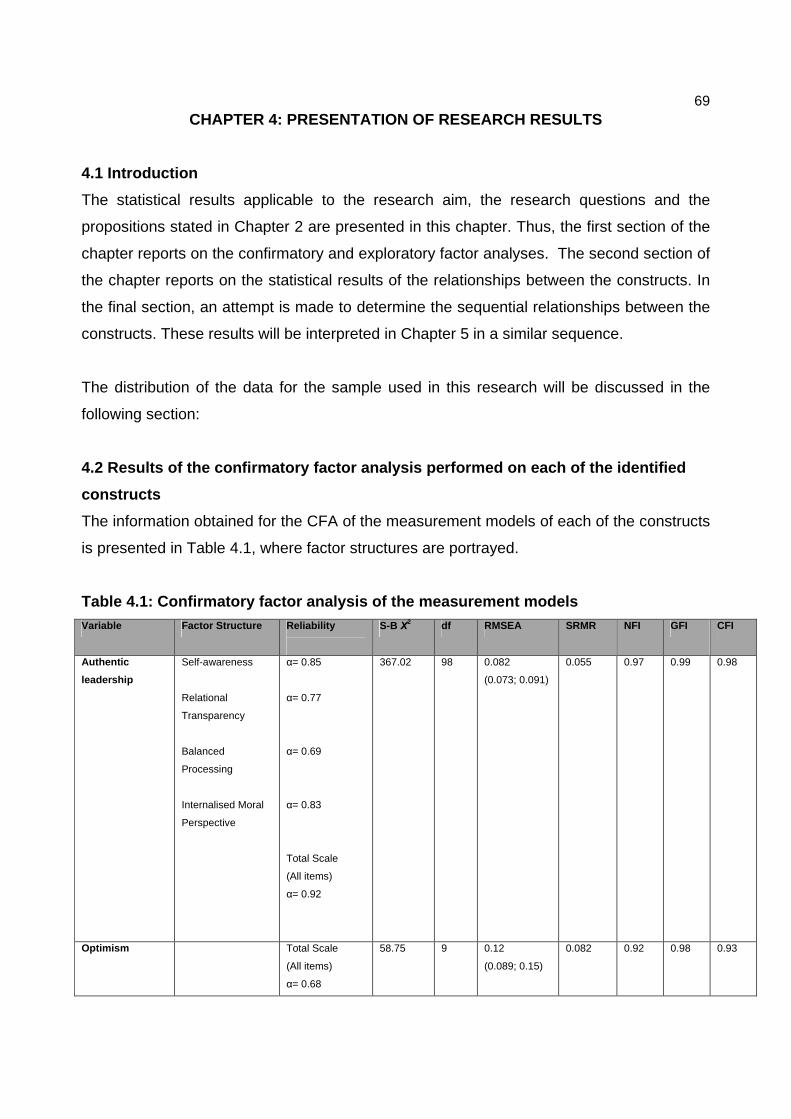
69 CHAPTER 4: PRESENTATION OF RESEARCH RESULTS
4.1 Introduction
The statistical results applicable to the research aim, the research questions and the
propositions stated in Chapter 2 are presented in this chapter. Thus, the first section of the
chapter reports on the confirmatory and exploratory factor analyses. The second section of
the chapter reports on the statistical results of the relationships between the constructs. In
the final section, an attempt is made to determine the sequential relationships between the
constructs. These results will be interpreted in Chapter 5 in a similar sequence.
The distribution of the data for the sample used in this research will be discussed in the
following section:
4.2 Results of the confirmatory factor analysis per formed on each of the identified
constructs
The information obtained for the CFA of the measurement models of each of the constructs
is presented in Table 4.1, where factor structures are portrayed.
Table 4.1: Confirmatory factor analysis of the meas urement models Variable Factor Structure Reliability
S-B Χ2 df RMSEA SRMR NFI GFI CFI
Authentic
leadership
Self-awareness
Relational
Transparency
Balanced
Processing
Internalised Moral
Perspective
α= 0.85
α= 0.77
α= 0.69
α= 0.83
Total Scale
(All items)
α= 0.92
367.02 98 0.082
(0.073; 0.091)
0.055 0.97 0.99 0.98
Optimism Total Scale
(All items)
α= 0.68
58.75 9 0.12
(0.089; 0.15)
0.082 0.92 0.98 0.93
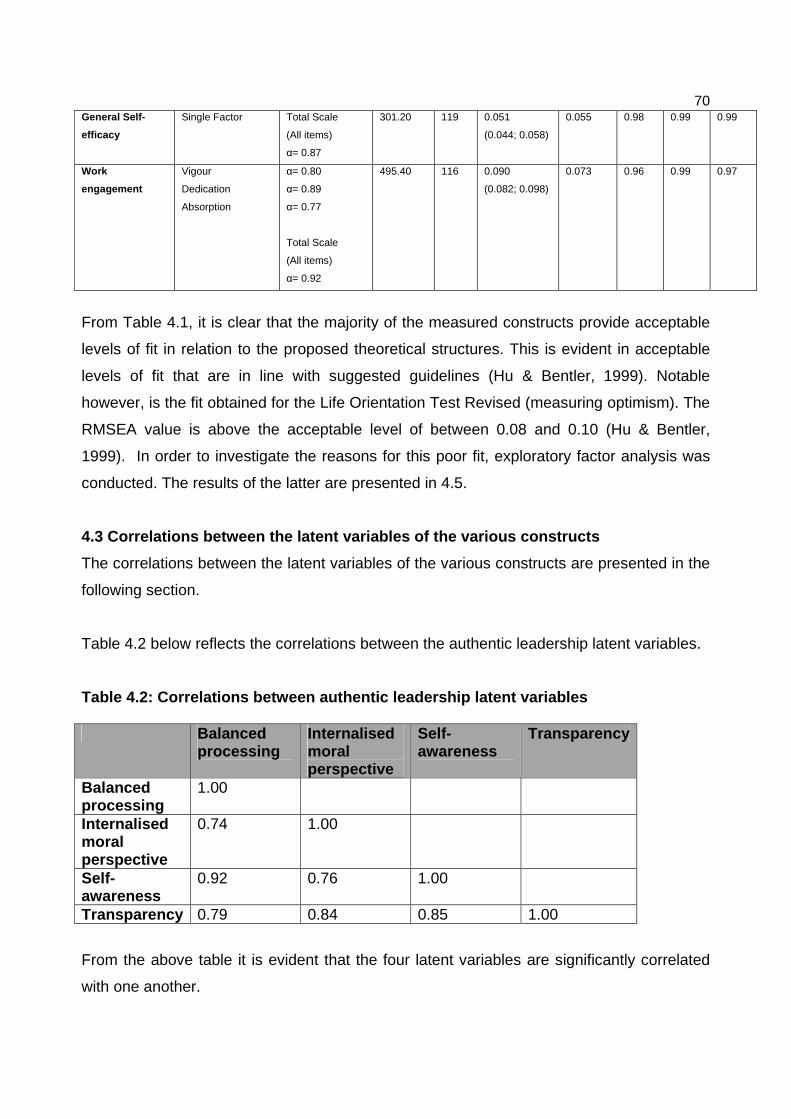
70 General Self-
efficacy
Single Factor Total Scale
(All items)
α= 0.87
301.20 119 0.051
(0.044; 0.058)
0.055 0.98 0.99 0.99
Work
engagement
Vigour
Dedication
Absorption
α= 0.80
α= 0.89
α= 0.77
Total Scale
(All items)
α= 0.92
495.40 116 0.090
(0.082; 0.098)
0.073 0.96 0.99 0.97
From Table 4.1, it is clear that the majority of the measured constructs provide acceptable
levels of fit in relation to the proposed theoretical structures. This is evident in acceptable
levels of fit that are in line with suggested guidelines (Hu & Bentler, 1999). Notable
however, is the fit obtained for the Life Orientation Test Revised (measuring optimism). The
RMSEA value is above the acceptable level of between 0.08 and 0.10 (Hu & Bentler,
1999). In order to investigate the reasons for this poor fit, exploratory factor analysis was
conducted. The results of the latter are presented in 4.5.
4.3 Correlations between the latent variables of th e various constructs
The correlations between the latent variables of the various constructs are presented in the
following section.
Table 4.2 below reflects the correlations between the authentic leadership latent variables.
Table 4.2: Correlations between authentic leadershi p latent variables Balanced
processing Internalised moral perspective
Self-awareness
Transparency
Balanced processing
1.00
Internalised moral perspective
0.74 1.00
Self-awareness
0.92 0.76 1.00
Transparency 0.79 0.84 0.85 1.00
From the above table it is evident that the four latent variables are significantly correlated
with one another.
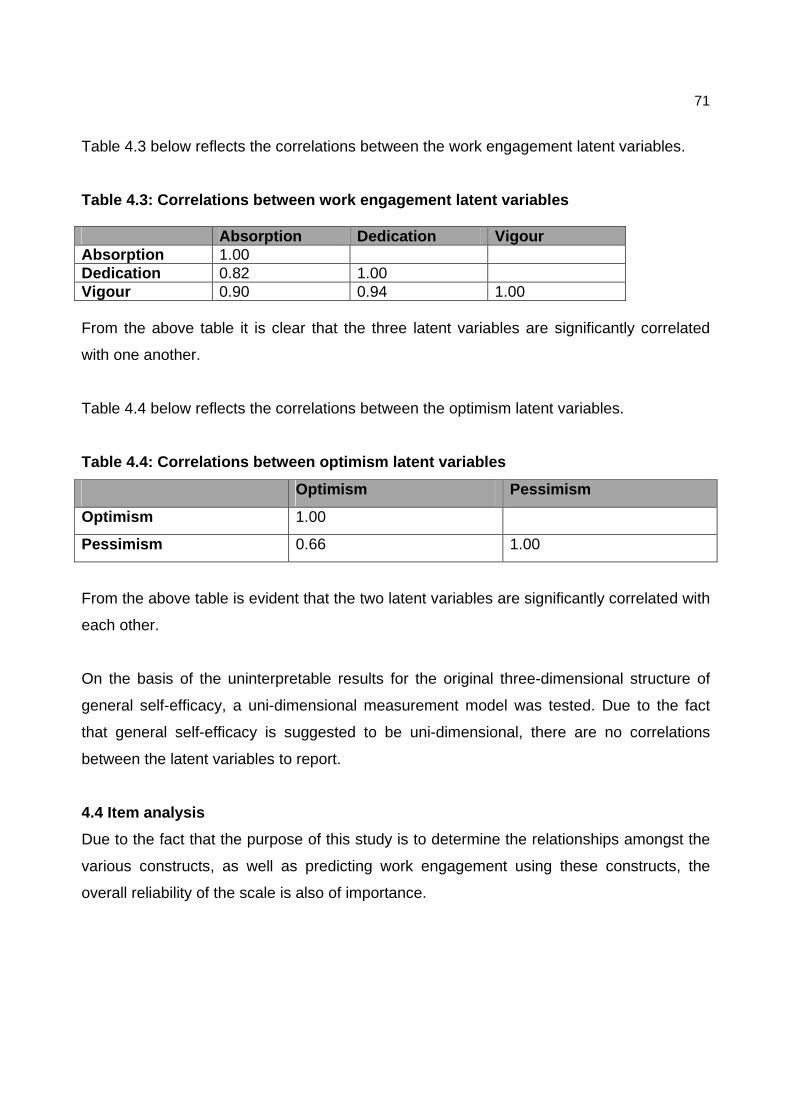
71
Table 4.3 below reflects the correlations between the work engagement latent variables.
Table 4.3: Correlations between work engagement lat ent variables Absorption Dedication Vigour Absorption 1.00 Dedication 0.82 1.00 Vigour 0.90 0.94 1.00 From the above table it is clear that the three latent variables are significantly correlated
with one another.
Table 4.4 below reflects the correlations between the optimism latent variables.
Table 4.4: Correlations between optimism latent var iables
Optimism Pessimism
Optimism 1.00
Pessimism 0.66 1.00
From the above table is evident that the two latent variables are significantly correlated with
each other.
On the basis of the uninterpretable results for the original three-dimensional structure of
general self-efficacy, a uni-dimensional measurement model was tested. Due to the fact
that general self-efficacy is suggested to be uni-dimensional, there are no correlations
between the latent variables to report.
4.4 Item analysis
Due to the fact that the purpose of this study is to determine the relationships amongst the
various constructs, as well as predicting work engagement using these constructs, the
overall reliability of the scale is also of importance.
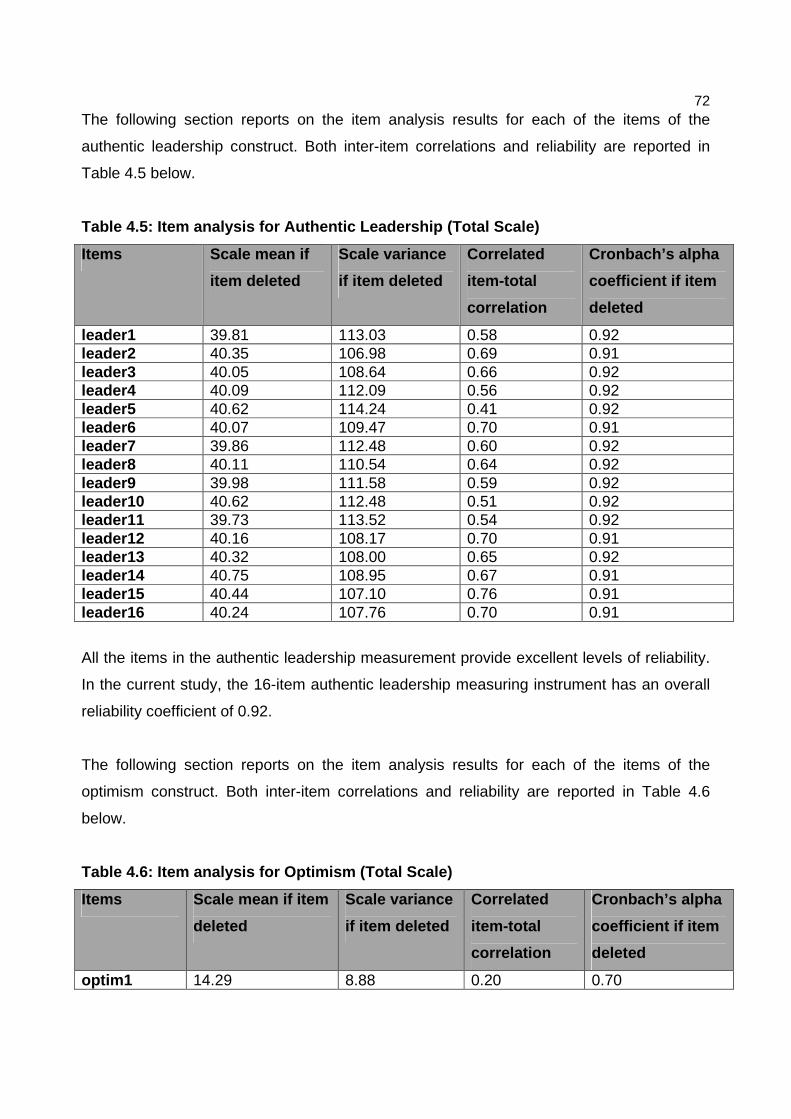
72 The following section reports on the item analysis results for each of the items of the
authentic leadership construct. Both inter-item correlations and reliability are reported in
Table 4.5 below.
Table 4.5: Item analysis for Authentic Leadership ( Total Scale)
Items Scale mean if
item deleted
Scale variance
if item deleted
Correlated
item-total
correlation
Cronbach’s alpha
coefficient if item
deleted
leader1 39.81 113.03 0.58 0.92 leader2 40.35 106.98 0.69 0.91 leader3 40.05 108.64 0.66 0.92 leader4 40.09 112.09 0.56 0.92 leader5 40.62 114.24 0.41 0.92 leader6 40.07 109.47 0.70 0.91 leader7 39.86 112.48 0.60 0.92 leader8 40.11 110.54 0.64 0.92 leader9 39.98 111.58 0.59 0.92 leader10 40.62 112.48 0.51 0.92 leader11 39.73 113.52 0.54 0.92 leader12 40.16 108.17 0.70 0.91 leader13 40.32 108.00 0.65 0.92 leader14 40.75 108.95 0.67 0.91 leader15 40.44 107.10 0.76 0.91 leader16 40.24 107.76 0.70 0.91
All the items in the authentic leadership measurement provide excellent levels of reliability.
In the current study, the 16-item authentic leadership measuring instrument has an overall
reliability coefficient of 0.92.
The following section reports on the item analysis results for each of the items of the
optimism construct. Both inter-item correlations and reliability are reported in Table 4.6
below.
Table 4.6: Item analysis for Optimism (Total Scale)
Items Scale mean if item
deleted
Scale variance
if item deleted
Correlated
item-total
correlation
Cronbach’s alpha
coefficient if item
deleted
optim1 14.29 8.88 0.20 0.70
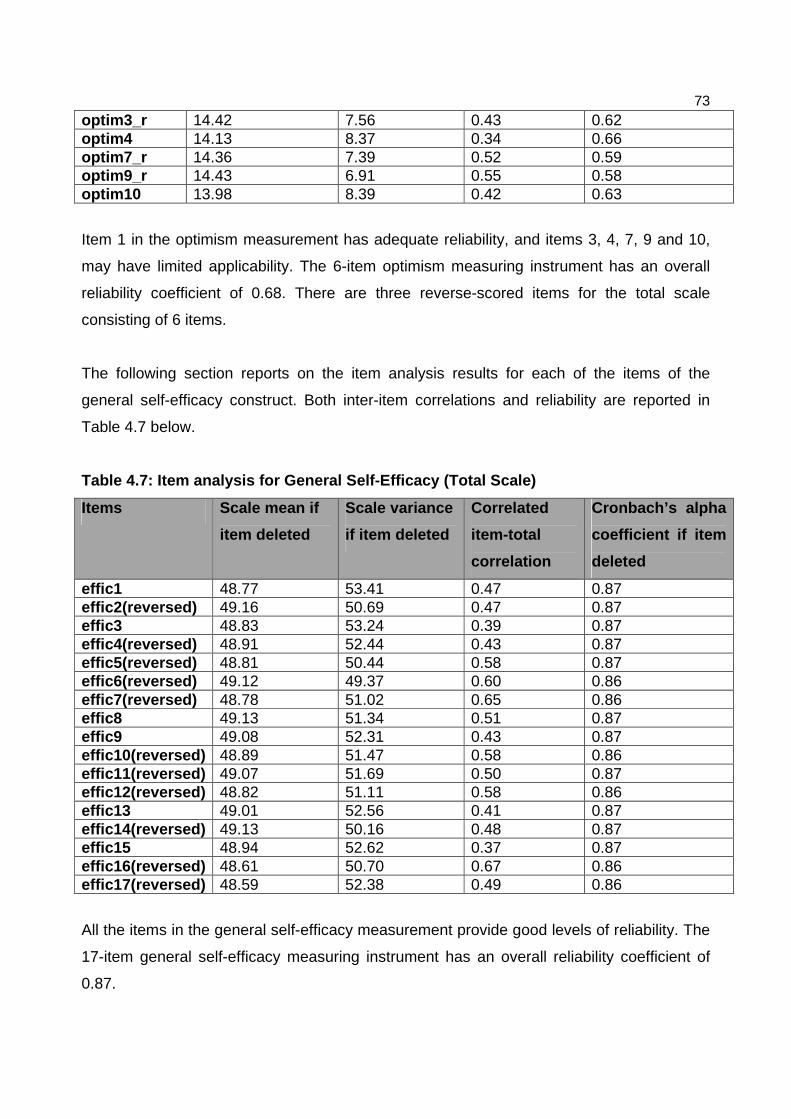
73 optim3_r 14.42 7.56 0.43 0.62 optim4 14.13 8.37 0.34 0.66 optim7_r 14.36 7.39 0.52 0.59 optim9_r 14.43 6.91 0.55 0.58 optim10 13.98 8.39 0.42 0.63
Item 1 in the optimism measurement has adequate reliability, and items 3, 4, 7, 9 and 10,
may have limited applicability. The 6-item optimism measuring instrument has an overall
reliability coefficient of 0.68. There are three reverse-scored items for the total scale
consisting of 6 items.
The following section reports on the item analysis results for each of the items of the
general self-efficacy construct. Both inter-item correlations and reliability are reported in
Table 4.7 below.
Table 4.7: Item analysis for General Self-Efficacy (Total Scale)
Items Scale mean if
item deleted
Scale variance
if item deleted
Correlated
item-total
correlation
Cronbach’s alpha
coefficient if item
deleted
effic1 48.77 53.41 0.47 0.87 effic2(reversed) 49.16 50.69 0.47 0.87 effic3 48.83 53.24 0.39 0.87 effic4(reversed) 48.91 52.44 0.43 0.87 effic5(reversed) 48.81 50.44 0.58 0.87 effic6(reversed) 49.12 49.37 0.60 0.86 effic7(reversed) 48.78 51.02 0.65 0.86 effic8 49.13 51.34 0.51 0.87 effic9 49.08 52.31 0.43 0.87 effic10(reversed) 48.89 51.47 0.58 0.86 effic11(reversed) 49.07 51.69 0.50 0.87 effic12(reversed) 48.82 51.11 0.58 0.86 effic13 49.01 52.56 0.41 0.87 effic14(reversed) 49.13 50.16 0.48 0.87 effic15 48.94 52.62 0.37 0.87 effic16(reversed) 48.61 50.70 0.67 0.86 effic17(reversed) 48.59 52.38 0.49 0.86
All the items in the general self-efficacy measurement provide good levels of reliability. The
17-item general self-efficacy measuring instrument has an overall reliability coefficient of
0.87.
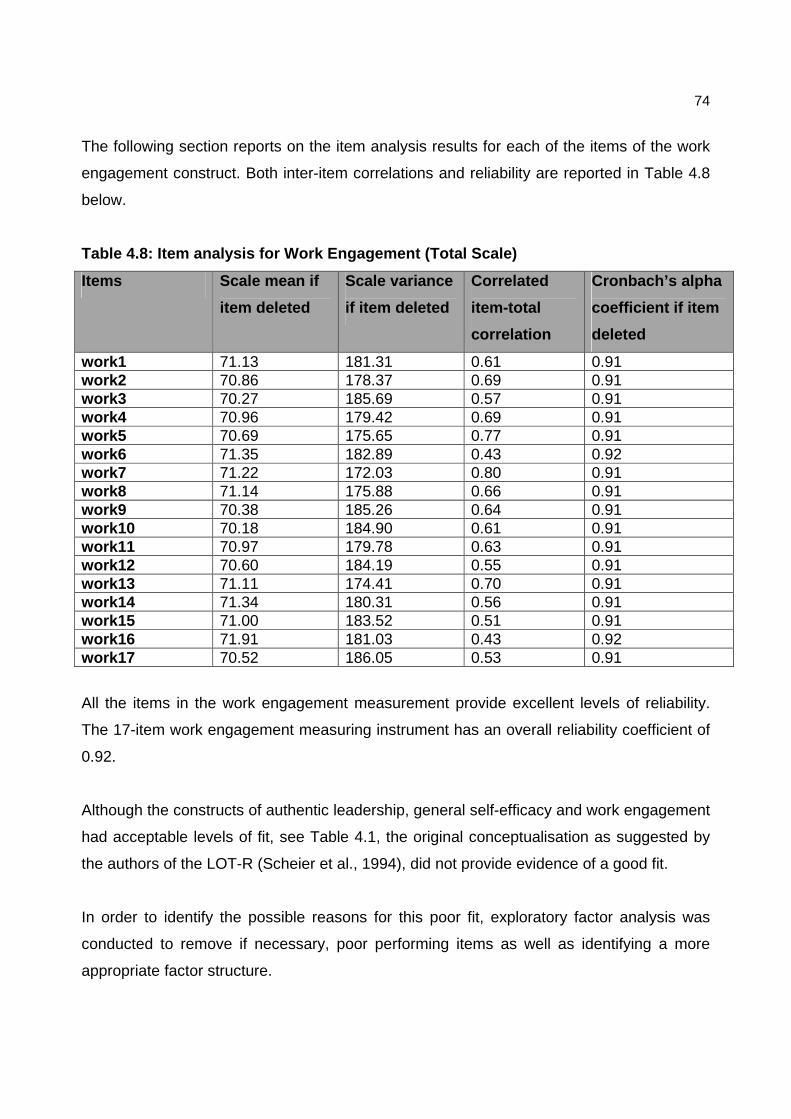
74
The following section reports on the item analysis results for each of the items of the work
engagement construct. Both inter-item correlations and reliability are reported in Table 4.8
below.
Table 4.8: Item analysis for Work Engagement (Total Scale)
Items Scale mean if
item deleted
Scale variance
if item deleted
Correlated
item-total
correlation
Cronbach’s alpha
coefficient if item
deleted
work1 71.13 181.31 0.61 0.91 work2 70.86 178.37 0.69 0.91 work3 70.27 185.69 0.57 0.91 work4 70.96 179.42 0.69 0.91 work5 70.69 175.65 0.77 0.91 work6 71.35 182.89 0.43 0.92 work7 71.22 172.03 0.80 0.91 work8 71.14 175.88 0.66 0.91 work9 70.38 185.26 0.64 0.91 work10 70.18 184.90 0.61 0.91 work11 70.97 179.78 0.63 0.91 work12 70.60 184.19 0.55 0.91 work13 71.11 174.41 0.70 0.91 work14 71.34 180.31 0.56 0.91 work15 71.00 183.52 0.51 0.91 work16 71.91 181.03 0.43 0.92 work17 70.52 186.05 0.53 0.91
All the items in the work engagement measurement provide excellent levels of reliability.
The 17-item work engagement measuring instrument has an overall reliability coefficient of
0.92.
Although the constructs of authentic leadership, general self-efficacy and work engagement
had acceptable levels of fit, see Table 4.1, the original conceptualisation as suggested by
the authors of the LOT-R (Scheier et al., 1994), did not provide evidence of a good fit.
In order to identify the possible reasons for this poor fit, exploratory factor analysis was
conducted to remove if necessary, poor performing items as well as identifying a more
appropriate factor structure.
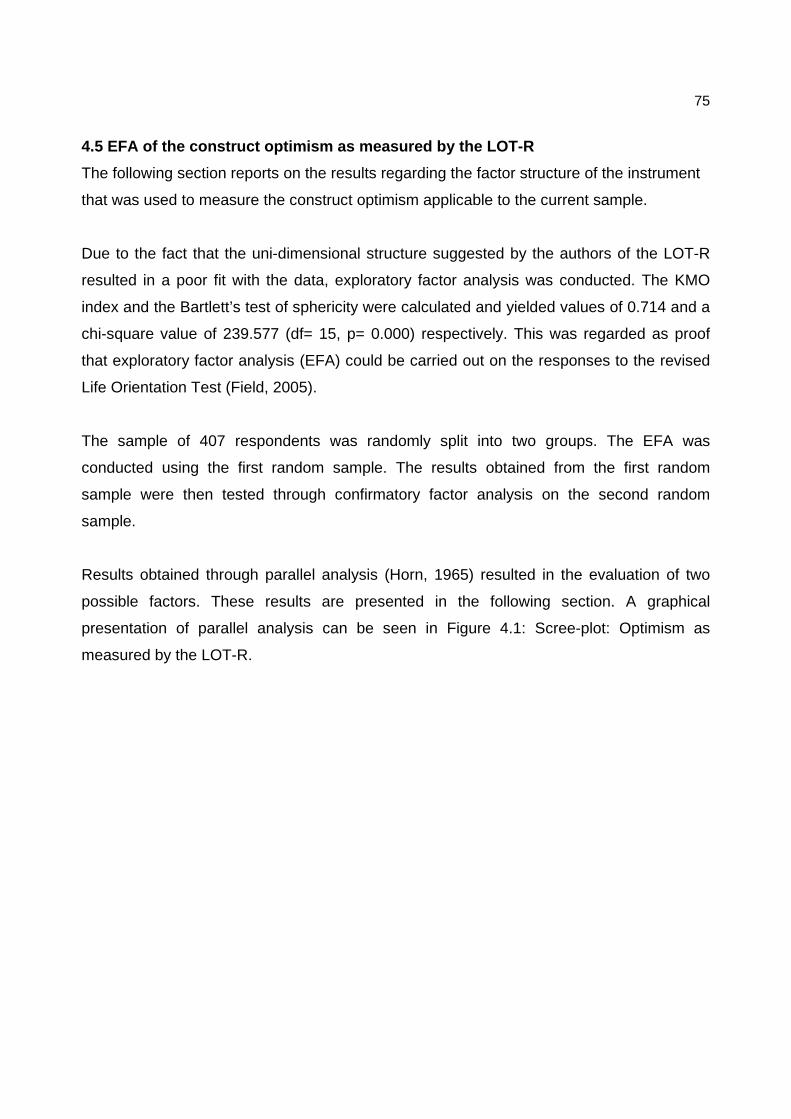
75
4.5 EFA of the construct optimism as measured by th e LOT-R
The following section reports on the results regarding the factor structure of the instrument
that was used to measure the construct optimism applicable to the current sample.
Due to the fact that the uni-dimensional structure suggested by the authors of the LOT-R
resulted in a poor fit with the data, exploratory factor analysis was conducted. The KMO
index and the Bartlett’s test of sphericity were calculated and yielded values of 0.714 and a
chi-square value of 239.577 (df= 15, p= 0.000) respectively. This was regarded as proof
that exploratory factor analysis (EFA) could be carried out on the responses to the revised
Life Orientation Test (Field, 2005).
The sample of 407 respondents was randomly split into two groups. The EFA was
conducted using the first random sample. The results obtained from the first random
sample were then tested through confirmatory factor analysis on the second random
sample.
Results obtained through parallel analysis (Horn, 1965) resulted in the evaluation of two
possible factors. These results are presented in the following section. A graphical
presentation of parallel analysis can be seen in Figure 4.1: Scree-plot: Optimism as
measured by the LOT-R.
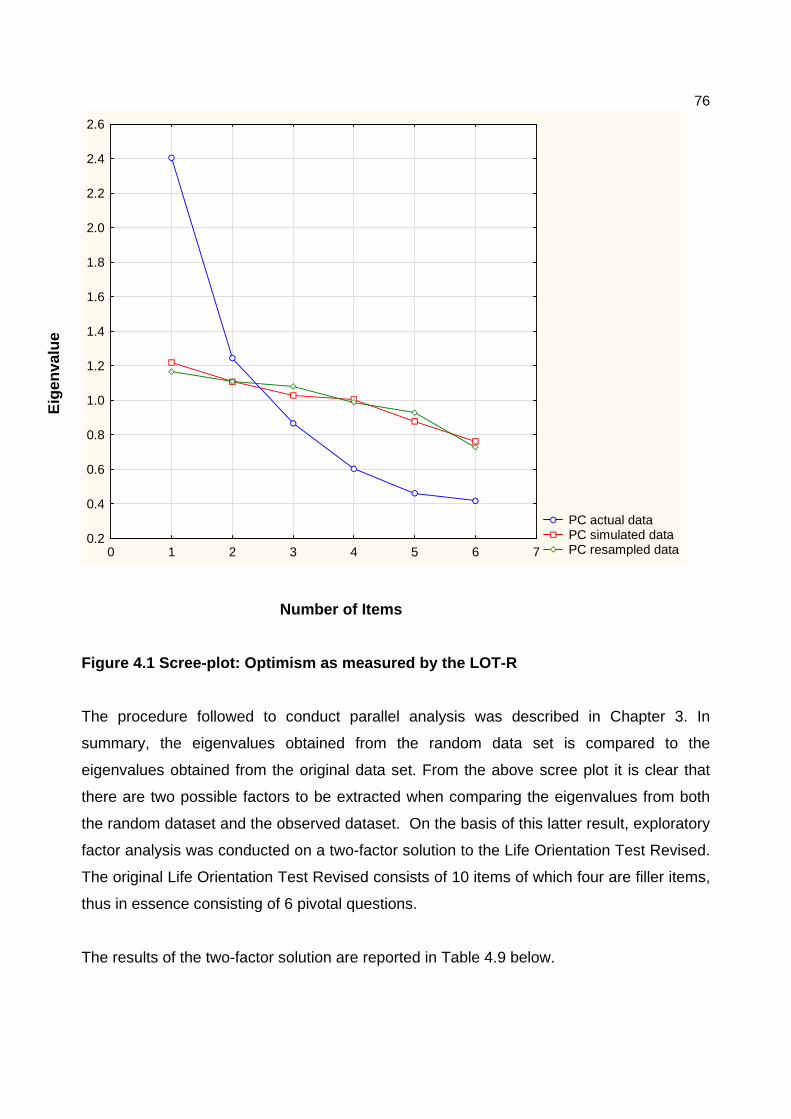
76
PC actual data PC simulated data PC resampled data0 1 2 3 4 5 6 7
0.2
0.4
0.6
0.8
1.0
1.2
1.4
1.6
1.8
2.0
2.2
2.4
2.6
Number of Items
Figure 4.1 Scree-plot: Optimism as measured by the LOT-R
The procedure followed to conduct parallel analysis was described in Chapter 3. In
summary, the eigenvalues obtained from the random data set is compared to the
eigenvalues obtained from the original data set. From the above scree plot it is clear that
there are two possible factors to be extracted when comparing the eigenvalues from both
the random dataset and the observed dataset. On the basis of this latter result, exploratory
factor analysis was conducted on a two-factor solution to the Life Orientation Test Revised.
The original Life Orientation Test Revised consists of 10 items of which four are filler items,
thus in essence consisting of 6 pivotal questions.
The results of the two-factor solution are reported in Table 4.9 below.
Eig
enva
lue
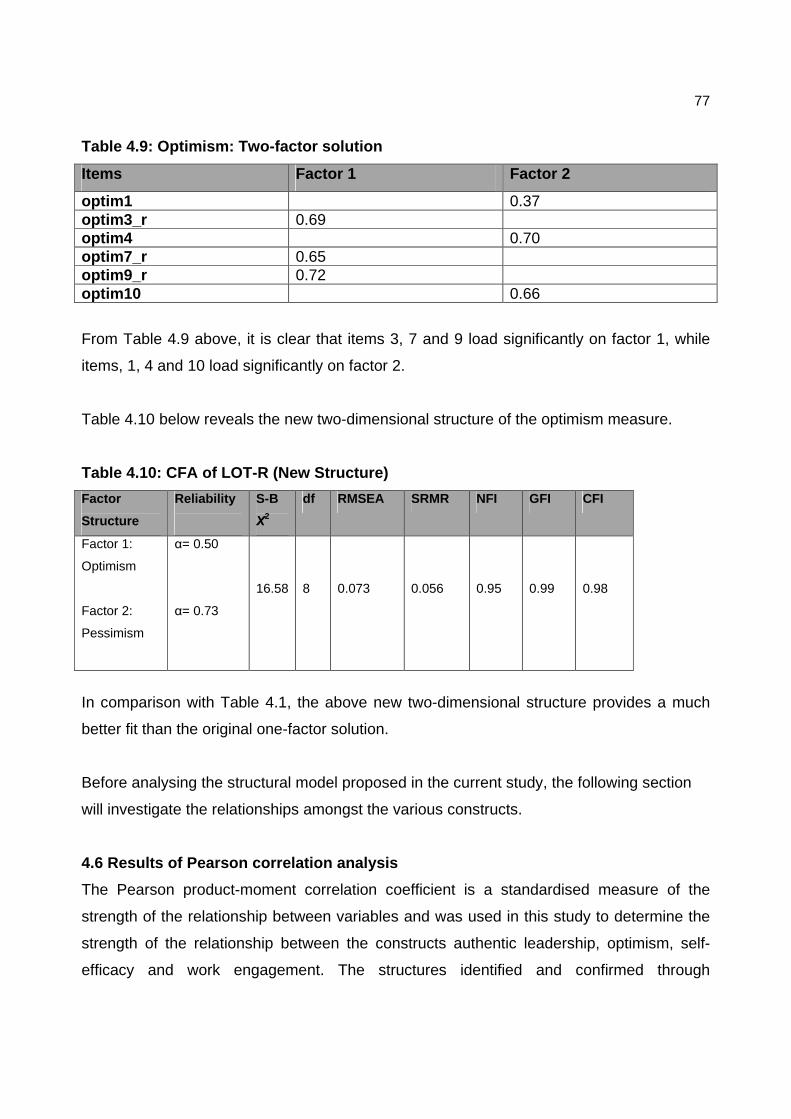
77
Table 4.9: Optimism: Two-factor solution
Items Factor 1 Factor 2
optim1 0.37 optim3_r 0.69 optim4 0.70 optim7_r 0.65 optim9_r 0.72 optim10 0.66
From Table 4.9 above, it is clear that items 3, 7 and 9 load significantly on factor 1, while
items, 1, 4 and 10 load significantly on factor 2.
Table 4.10 below reveals the new two-dimensional structure of the optimism measure.
Table 4.10: CFA of LOT-R (New Structure)
Factor
Structure
Reliability
S-B
Χ2
df RMSEA SRMR NFI GFI CFI
Factor 1:
Optimism
Factor 2:
Pessimism
α= 0.50
α= 0.73
16.58
8
0.073
0.056
0.95
0.99
0.98
In comparison with Table 4.1, the above new two-dimensional structure provides a much
better fit than the original one-factor solution.
Before analysing the structural model proposed in the current study, the following section
will investigate the relationships amongst the various constructs.
4.6 Results of Pearson correlation analysis
The Pearson product-moment correlation coefficient is a standardised measure of the
strength of the relationship between variables and was used in this study to determine the
strength of the relationship between the constructs authentic leadership, optimism, self-
efficacy and work engagement. The structures identified and confirmed through
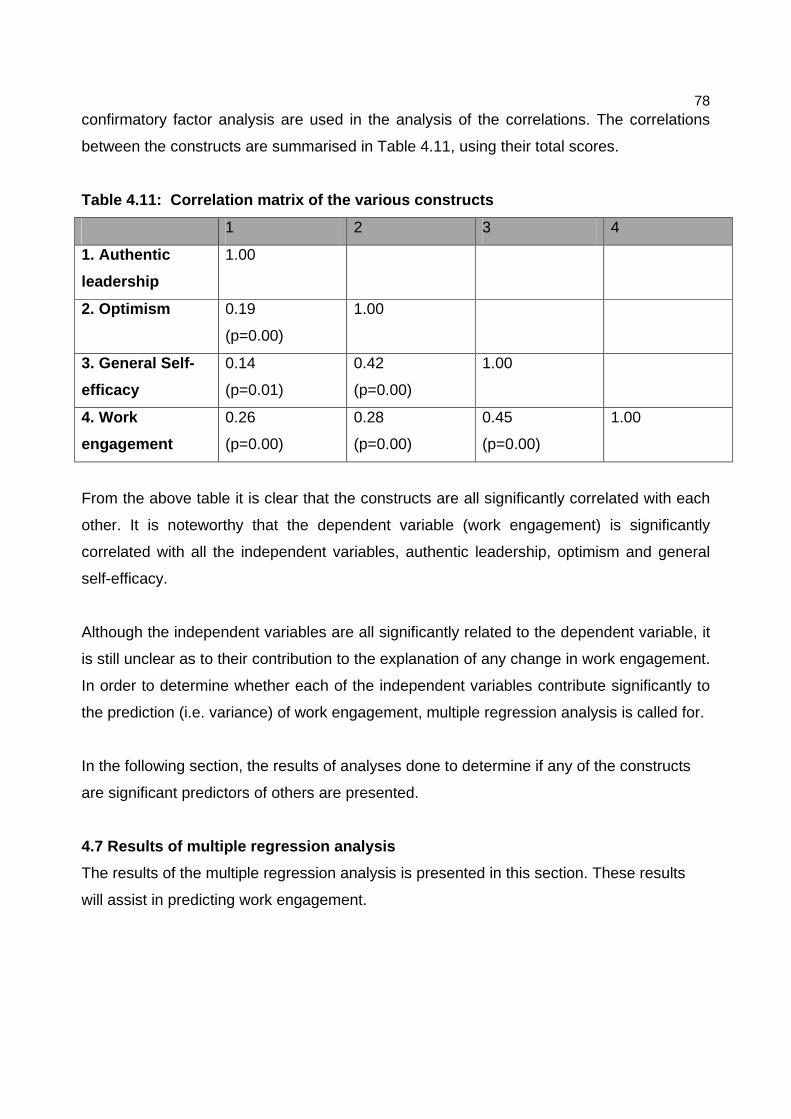
78 confirmatory factor analysis are used in the analysis of the correlations. The correlations
between the constructs are summarised in Table 4.11, using their total scores.
Table 4.11: Correlation matrix of the various cons tructs
1 2 3 4
1. Authentic
leadership
1.00
2. Optimism 0.19
(p=0.00)
1.00
3. General Self-
efficacy
0.14
(p=0.01)
0.42
(p=0.00)
1.00
4. Work
engagement
0.26
(p=0.00)
0.28
(p=0.00)
0.45
(p=0.00)
1.00
From the above table it is clear that the constructs are all significantly correlated with each
other. It is noteworthy that the dependent variable (work engagement) is significantly
correlated with all the independent variables, authentic leadership, optimism and general
self-efficacy.
Although the independent variables are all significantly related to the dependent variable, it
is still unclear as to their contribution to the explanation of any change in work engagement.
In order to determine whether each of the independent variables contribute significantly to
the prediction (i.e. variance) of work engagement, multiple regression analysis is called for.
In the following section, the results of analyses done to determine if any of the constructs
are significant predictors of others are presented.
4.7 Results of multiple regression analysis
The results of the multiple regression analysis is presented in this section. These results
will assist in predicting work engagement.
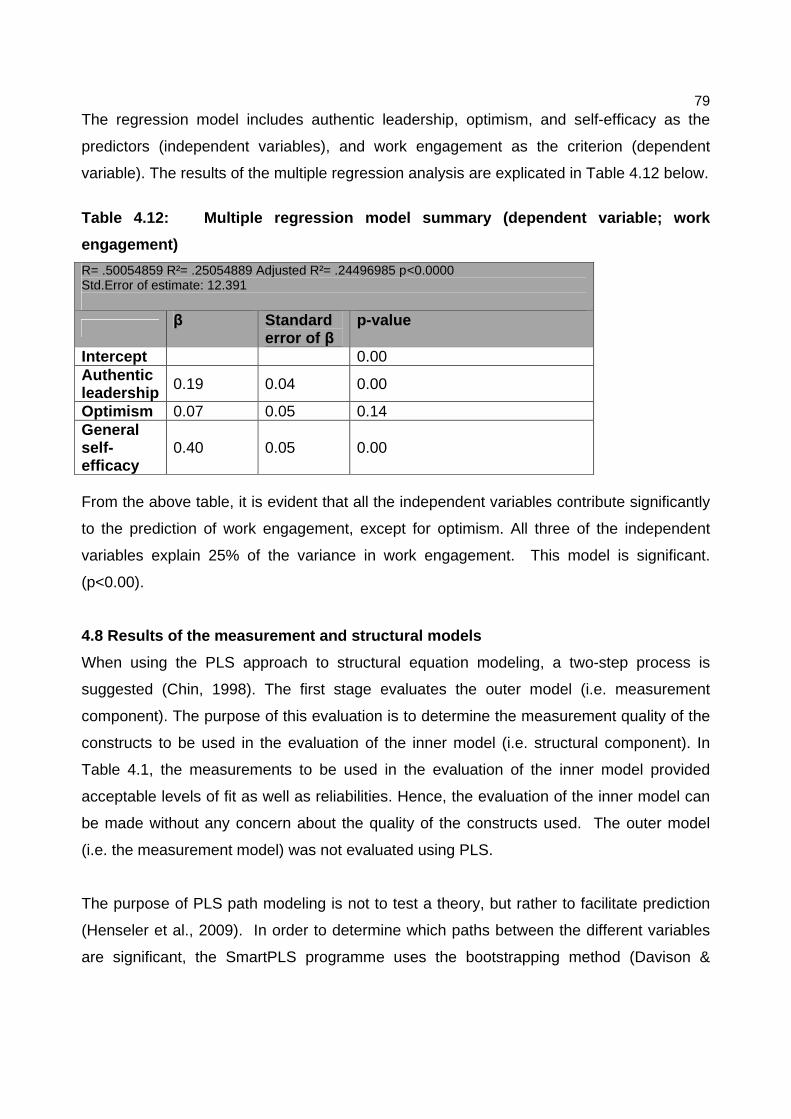
79 The regression model includes authentic leadership, optimism, and self-efficacy as the
predictors (independent variables), and work engagement as the criterion (dependent
variable). The results of the multiple regression analysis are explicated in Table 4.12 below.
Table 4.12: Multiple regression model summary (de pendent variable; work
engagement)
R= .50054859 R²= .25054889 Adjusted R²= .24496985 p<0.0000 Std.Error of estimate: 12.391
β Standard error of β
p-value
Intercept 0.00 Authentic leadership 0.19 0.04 0.00
Optimism 0.07 0.05 0.14 General self-efficacy
0.40 0.05 0.00
From the above table, it is evident that all the independent variables contribute significantly
to the prediction of work engagement, except for optimism. All three of the independent
variables explain 25% of the variance in work engagement. This model is significant.
(p<0.00).
4.8 Results of the measurement and structural model s
When using the PLS approach to structural equation modeling, a two-step process is
suggested (Chin, 1998). The first stage evaluates the outer model (i.e. measurement
component). The purpose of this evaluation is to determine the measurement quality of the
constructs to be used in the evaluation of the inner model (i.e. structural component). In
Table 4.1, the measurements to be used in the evaluation of the inner model provided
acceptable levels of fit as well as reliabilities. Hence, the evaluation of the inner model can
be made without any concern about the quality of the constructs used. The outer model
(i.e. the measurement model) was not evaluated using PLS.
The purpose of PLS path modeling is not to test a theory, but rather to facilitate prediction
(Henseler et al., 2009). In order to determine which paths between the different variables
are significant, the SmartPLS programme uses the bootstrapping method (Davison &
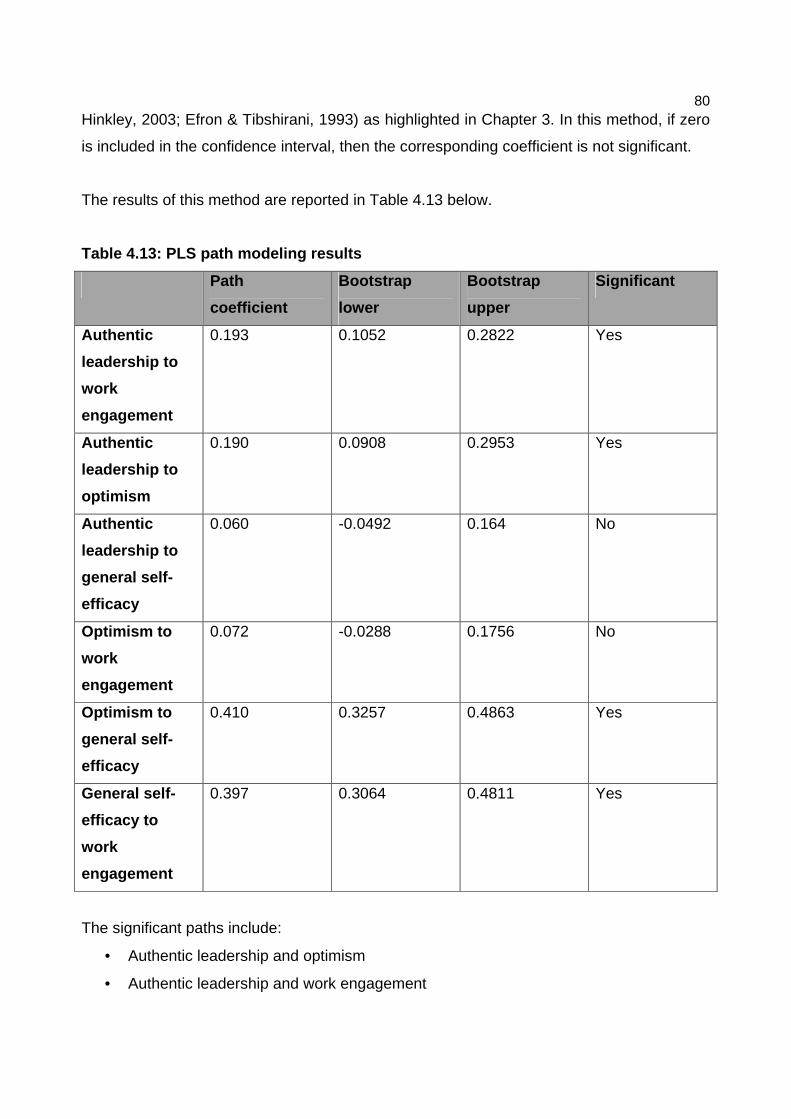
80 Hinkley, 2003; Efron & Tibshirani, 1993) as highlighted in Chapter 3. In this method, if zero
is included in the confidence interval, then the corresponding coefficient is not significant.
The results of this method are reported in Table 4.13 below.
Table 4.13: PLS path modeling results
Path
coefficient
Bootstrap
lower
Bootstrap
upper
Significant
Authentic
leadership to
work
engagement
0.193 0.1052 0.2822 Yes
Authentic
leadership to
optimism
0.190 0.0908 0.2953 Yes
Authentic
leadership to
general self-
efficacy
0.060 -0.0492 0.164 No
Optimism to
work
engagement
0.072 -0.0288 0.1756 No
Optimism to
general self-
efficacy
0.410 0.3257 0.4863 Yes
General self-
efficacy to
work
engagement
0.397 0.3064 0.4811 Yes
The significant paths include:
• Authentic leadership and optimism
• Authentic leadership and work engagement
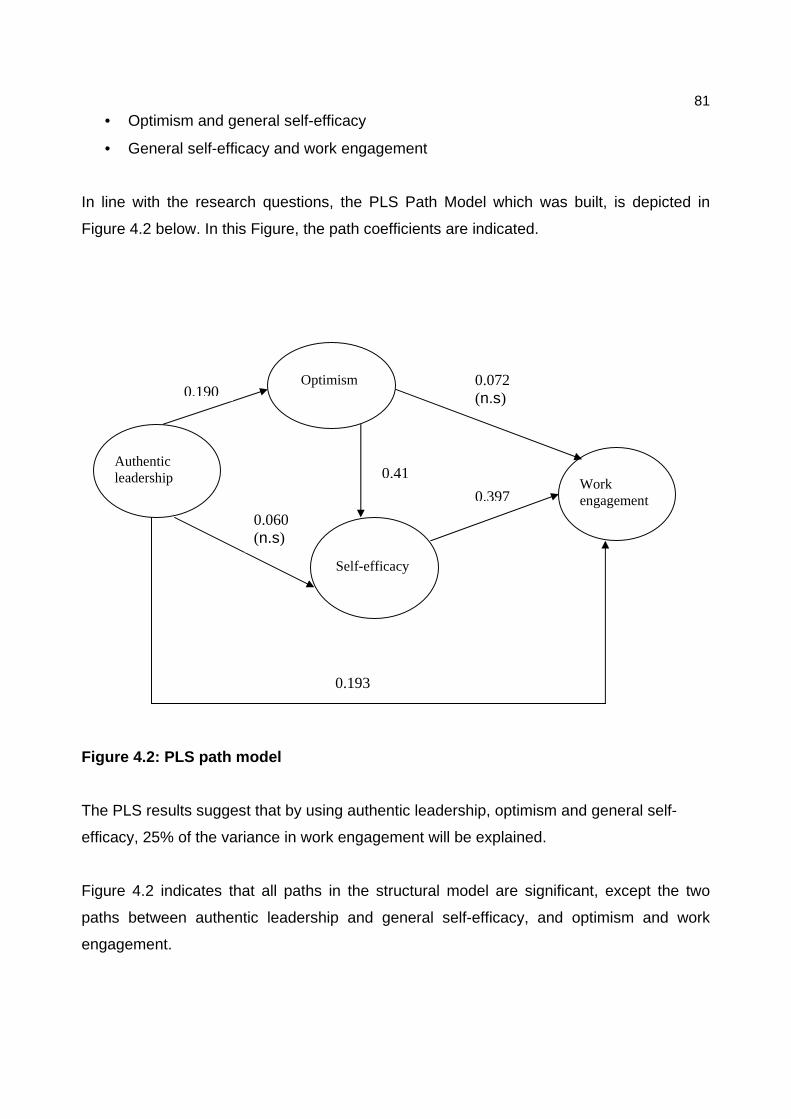
81 • Optimism and general self-efficacy
• General self-efficacy and work engagement
In line with the research questions, the PLS Path Model which was built, is depicted in
Figure 4.2 below. In this Figure, the path coefficients are indicated.
Figure 4.2: PLS path model
The PLS results suggest that by using authentic leadership, optimism and general self-
efficacy, 25% of the variance in work engagement will be explained.
Figure 4.2 indicates that all paths in the structural model are significant, except the two
paths between authentic leadership and general self-efficacy, and optimism and work
engagement.
Authentic leadership
Op
Work engagement
Optimism
Self-efficacy
0.190 0.072 (n.s)
0.397
0.060 (n.s)
0.41
0.193
82 In light of this model of the present study, the following two observations can be made:
(a) authentic leadership behaviours demonstrated by leaders as perceived by their
immediate subordinates’ seem to directly impact the levels of work engagement in the
organisation.
(b) authentic leadership behaviours demonstrated by leaders as perceived by their
immediate subordinates’ seem to impact their subordinates’ levels of optimism, which
in turn impacts their self-efficacy, hence resulting in increased levels of work
engagement.
It seems apparent that the optimal approach to predict work engagement is either directly
through authentic leadership, or through an alternative path consisting of the following
sequence i.e. authentic leadership through optimism; through general self-efficacy to
impact work engagement.
4.9 Summary
All the results obtained from the sample described in the previous Chapter 3 were
presented in this chapter. The results reported, focussed on different analyses, namely: (a)
confirmatory factor analysis, (b) exploratory factor analysis, (c) correlation analysis, (d)
multiple regression analysis, and (e) structural equation modeling (e.g. partial least squares
modeling). Of importance is that an interpretable factor structure was found for each of the
four constructs. Each construct’s factor structure showed acceptable levels of fit. In
addition, significant relationships between the constructs were found. Significant path
coefficients between all the constructs in the sequential model were found, except for the
relationship between optimism and work engagement and between authentic leadership
and general self-efficacy. The predictive value of the constructs to predict work
engagement was addressed and will be further discussed in Chapter 5. Of importance was
that authentic leadership and general self-efficacy were significant predictors of work
engagement as based on the multiple regression results.
The implications of these findings will be interpreted and discussed in Chapter 5, together
with recommendations for intervention and to improve future research in the field of positive
organisational behaviour.
83 CHAPTER 5: DISCUSSION OF RESEARCH RESULTS AND RECOM MENDATIONS
FOR FUTURE RESEARCH
5.1 Introduction
In this final chapter, the research results as presented in Chapter 4, are discussed and
interpreted. The chapter commences with a discussion of the factor structures of the
constructs in light of the existing literature, followed by a discussion of the correlation
analysis and an interpretation of the measurement models. This is followed by a discussion
of the multiple regression and PLS modeling results. The chapter concludes with a
discussion of the limitations of this study and recommendations for intervention and further
research.
5.2 Conclusions regarding the factor structure resu lts on the data
For each of the constructs, confirmatory factor analysis was conducted and utilised to
confirm the observed structure of the constructs. In those instances where confirmatory
factor analysis results suggested a poor fit between the observed data and the theoretical
model, exploratory factor analysis was used to identify the reasons for the poor-fitting
results. After EFA, a further CFA was conducted to re-evaluate this revised structure. A
discussion of the results of the factor analysis results for each construct follows.
5.2.1 Authentic leadership
Confirmatory factor analysis was carried out on the 16-item Authentic Leadership
Questionnaire (ALQ) developed by Avolio, Gardner and Walumbwa (2007) to determine
how well this proposed structure fitted the data.
The authors suggested a four-factor structure and therefore the confirmatory factor analysis
allowed for this possibility. In the present study, the indices seem to indicate an acceptable
fit with the data. The SRMR had a value of 0.055 and the RMSEA a value of 0.082. The
incremental fit indices were CFI= 0.98 and NFI= 0.97, while the goodness-of-fit index was
measured at 0.99. The reliability for this construct was 0.92. The sub-components had the
following reliabilities: self-awareness (α= 0.85); relational transparency (α= 0.77); balanced
processing (α= 0.69); and internalised moral perspective (α= 0.83).
84 As referred to in section 3.4.1, Walumbwa et al. (2008) conducted a confirmatory factor
analysis using an independent sample from the United States which consisted of 224 full-
time employees from a large high-tech manufacturer who rated their immediate supervisors
on authentic leadership behaviours. When the values of the indices of the present study are
compared with the four-factor model alluded to in section 3.4.1, the structure in the present
study seems to represent a somewhat better fit with the data than the data obtained from
the U.S. sample.
It can thus be concluded that authentic leadership, as measured by the Authentic
Leadership Questionnaire, is a valid and reliable instrument based on the above mentioned
results. The Authentic leadership measure is thus an accurate representation of the
construct in the current study.
5.2.2 Optimism
Confirmatory factor analysis was carried out on the 10-item version of the Life Orientation
Test Revised (LOT-R) developed by Scheier et al. (1994) in order to determine how well
this proposed factor structure fitted the data.
In the present study, the indices seem to indicate an acceptable fit with the data except for
the RMSEA value. The SRMR of the original factor structure revealed a value of 0.082 and
the RMSEA a value of 0.12. The incremental fit indices were CFI= 0.93 and NFI= 0.92,
while the goodness-of-fit index was measured at 0.98. The reliability for the total scale was
0.68.
Three previous studies provided conflicting evidence (Scheier & Carver, 1992; Scheier et
al., 1994; Lai, Cheung, Lee, & Yu, 1998). In the study by Scheier & Carver (1992) a
principle components factor analysis, using a Varimax final rotation technique, was
conducted on a combined sample of 2 055 undergraduate women and men. The number of
factors retained for the final solution was determined by setting the eigenvalue criterion at
1.0. The six LOT-R items (4 items are filler items), yielded one factor accounting for 48.1 %
of the variance. All items loaded at least 0.58 on this factor. The mean factor loading was
0.69. The same one-factor solution also emerged from a subsequent principle components
85 factor analysis using an oblique rotation technique. The single factor also accounted for
48.1% of the variance.
In addition to exploratory factor analysis, the data was further examined by confirmatory
analytic procedures (Jörgeskog & Sörbom, 1978), using LISREL VI (Jörgeskog & Sörbom,
1986). Confirmatory analyses were limited to the 6 items comprising the LOT-R. Initially,
two simple measurement models were tested, one loading all factors on a single factor and
one loading positively and negatively worded items onto separate factors. The models were
evaluated using criteria described by Bentler and Bonett (1980), Jörgeskog and Sörbom
(1986), and Bollen (1989). The single-factor solution yielded a reasonably good fit to the
data, X2 (9, N= 2055) = 159.22, p= 0.001; ∆1= 0.95, ∆2= 0.95, root mean square residual
(RMR) = 0.048, as did the two-factor model, X2 (8, N= 2055) = 43.59, p= 0.001, ∆1= 0.99,
∆2= 0.99, RMR= 0.024. Evaluation of the difference in fit between the two models by a
hierarchical or nested test (Bentler & Bonett, 1980) suggested that the two-factor solution
was superior, X2 (1, N= 2055)= 115.63, p <.0001.
In contrast to analyses involving the original scale, factor analyses of the revised LOT seem
to point in the direction of a one-factor model, but not strongly so. Exploratory factor
analyses using both orthogonal and oblique rotation techniques on the LOT-R in isolation
yielded a one-factor solution. One-factor solutions were also reached when factor analyses
were done on all of the items from all of the related scales simultaneously (Scheier et
al.,1994).
On the basis of these previous studies, the factor structure of the LOT-R deserves special
comment. It is not uncommon for the original LOT to yield two separate factors, one for
positively worded items and one for negatively worded items (e.g., Marshall, Wortman,
Kusulas, & Vickers,1992; Scheier & Carver, 1985). For simplicity, optimism and pessimism
can be viewed as opposite poles of the same dimension, attributing the two-factor structure
to differences in wording rather than more meaningful item content (Scheier & Carver,
1985). Results from the confirmatory factor analysis on the 6 items comprising the LOT-R
were more mixed, however. That is, in absolute terms, both the one-factor and the two-
factor model provided an acceptable fit to the observed data (Scheier & Carver, 1992).
86 Confirmatory factor analysis was performed on the LOT-R data to contrast the applicability
of one- and two-factor models. It was found that the LOT-R better supports a one-factor
than a two-factor model: [one-factor: X2 (38) = 486.48, P < .0001; Bentler-Bonett normed fit
index = 0.69; two-factor: X2 (37) = 526.24, P= < .001; Bentler-Bonett normed fit index =
0.34]. The LOT-R is therefore more likely to represent a uni-dimensional than a
multidimensional construct, as suggested by data reported previously in an English
speaking sample (Scheier et al .,1994).
A study by Lai et al. (1998) to examine the utility of the revised Life Orientation Test to
measure optimism among 248 Hong Kong Chinese undergraduate students, conducted
exploratory factor analysis using principle component analysis and a two-factor solution
was generated for the LOT-R. The first factor was loaded with 3 positive items and
explained 33.3% of the total variance (eigenvalue = 2.01). The negative items were loaded
onto the second factor and accounted for 22.8% of additional variance (eigenvalue = 1.37).
However the one-factor solution reported by Scheier et al. (1994) was not replicated in the
present sample.
In the current study, to investigate the possibility whether a two-dimensional structure of the
LOT-R would fit the data better, exploratory factor analysis was conducted based on
parallel analysis. This study by Lai et al. (1998) provides support to the present study which
also found a two-factor solution.
The rationale for investigating the two-factor solution is underpinned by the promising
results provided by Lai et al. (1998). In addition, the reason for conducting exploratory
factor analysis on the structure of the LOT-R was due to the fact that the original uni-
dimensional structure did not provide adequate fit, especially in terms of the high RMSEA
value = 0.12. This provided the motive for the researcher’s decision to extract a two-
dimensional structure, by means of principle components factoring (with oblique rotation).
In computing a revised two-factor solution, the current study found improved fit statistics, as
opposed to the original one-factor structure found by the developers of the LOT and LOT-
R, with a RMSEA= 0.073, SRMR= 0.056, CFI= 0.98, NFI= 0.95 and GFI= 0.99. The
reliability for the total scale was (α= 0.68). The sub-components had the following
87 reliabilities; optimism (α= 0.50); pessimism (α= 0.73). It is highly likely that that the low
reliability associated with the optimism scale was due to the small number of items
comprising this complex dimension (six in total - 3 measuring optimism, and 3 measuring
pessimism).
It is clear that the two-dimensional structure of the LOT-R as suggested by the study of Lai
et al. (1998) and the current study’s CFA, indicate an improved fit with the data.
5.2.3 Self-efficacy
Confirmatory factor analysis was carried out on a single-factor solution of the General Self-
Efficacy Scale by Sherer and colleagues (1982) in order to determine how well this factor
structure fitted the data. The original three-factor solution did not provide an interpretable
result. The latter was based on the phi-matrix that was not positive definite.
In the present study, the indices seem to indicate an acceptable fit with the data. The
SRMR had a value of 0.055 and the RMSEA a value of 0.051. The incremental fit indices
were CFI= 0.99 and NFI= 0.98, while the goodness-of-fit index was measured at 0.99. The
reliability for the total scale was 0.87.
A study by Nel and Boshoff (2008) with a sample of 295 participants that wrote part one of
their accounting qualifying exam (QE1), completed the 17-item General Self-efficacy Scale
of Sherer and colleagues (1982). Confirmatory factor analysis was carried out, in order to
determine how well a one-factor structure fitted their data. The following goodness-of-fit
statistics were obtained for the three-factor structure (original) versus the one-dimensional
structure. Regarding the three-factor structure, the SRMR had a value of 0.055 and the
RMSEA a value of 0.049. The incremental fit indices were CFI= 0.97, and NFI= 0.93, while
the goodness-of-fit index was measured at 0.91. Whereas for the one-dimensional
structure, the SRMR had a value of 0.055 and the RMSEA a value of 0.050. The
incremental fit indices were CFI= 0.97, and NFI= 0.93, while the goodness-of-fit index was
measured at 0.91.
The one-dimensional structure as evaluated by Nel and Boshoff (2008) provides a better fit
based on their study, than the original three-factor structure developed by the authors of
88 the GSE scale. Nel and Boshoff’s (2008) results seem to support the results of the present
study.
It can thus be concluded that self-efficacy, as measured by the General Self-Efficacy Scale
(GSES), is a valid and reliable instrument based on the above mentioned results. The
results of the general self-efficacy measure is thus an accurate representation of the
construct in the current study.
5.2.4 Work engagement
Confirmatory factor analysis was carried out on the original structure in order to determine
how well this factor structure fitted the data.
In the present study, the indices seem to indicate an acceptable fit with the data. The
SRMR had a value of 0.073 and the RMSEA a value of 0.090. The incremental fit indices
were CFI= 0.97 and NFI= 0. 96, while the goodness-of-fit index was measured at 0.99. The
reliability of the total scale was 0.92. The sub-components had the following reliabilities;
vigour (α= 0.80); dedication (α= 0.89); and absorption (α= 0.77).
A study by Shimazu, Schaufeli, Kosugi, Suzuki, Nashiwa, Kato, Sakamoto, Irimajiri,
Amano, Hirohata and Goto (2008) was conducted to validate the Japanese version of the
Utrecht Work Engagement Scale (UWES-J). Confirmatory factor analyses using the
multiple-group method revealed that instead of the original three-factor model, a one-factor
model that assumes that all engagement items load on one single factor, fitted the data.
Moreover, the one-factor structure was invariant across all three samples. Internal
consistency of the scale was sufficiently high (α= 0.92) and test-retest reliability with an
interval of two months was 0.66.
The results of the confirmatory factor analysis of the UWES-J (N= 2324) goodness-of-fit
statistics for the one-factor model, are as follows: RMSEA= 0.11, CFI= 0.85 and GFI= 0.81.
The results of the three-dimensional structure of the present study seem to be far superior
to the results evidenced by the Shimazu et al.’s (2008) one-factor solution.
89 It can thus be concluded that work engagement as measured by the Utrecht Work
Engagement Scale is a valid and reliable instrument based on the above mentioned
results. The UWES measure is thus an accurate representation of the construct in the
current study.
In the following section, the research questions of the current study will be answered.
5.3 Conclusions regarding predicting work engagemen t through PLS modeling
In this section, the results of the Pearson product-moment correlation analysis as well as
the path coefficients will be discussed against the backdrop of existing literature, where it
exists for the respective constructs. The correlation analysis was performed on the
constructs and not their sub-components. Structural equation modeling was done through
PLS modeling. In this study, PLS modeling focused on the prediction of work engagement
through path analysis.
The paths between the latent variables, authentic leadership and optimism (proposition 1);
authentic leadership and work engagement (proposition 3); optimism and self efficacy
(proposition 4); self-efficacy and work engagement (proposition 6) of the structural model
are significant. However, the paths between the latent variables, authentic leadership and
self-efficacy; and optimism and work engagement are not significant.
Only proposition 2 and 5 were not supported by non-significant path coefficients.
Significance of path coefficients were determined through the bootstrapping method
(Davison & Hinkley, 2003; Efron & Tibshirani, 1993) as referred to in Chapter 3.
The relationship between authentic leadership and optimism
A significant positive correlation was found between authentic leadership and optimism. (r=
0.1896; p= 0.0001). More specifically, it was established that authentic leadership is
sequentially related to optimism (proposition 1). The size of the path coefficient (0.190) is
noteworthy.
This confirms the conceptual relationship between authentic leadership and optimism as
referred to in section 1.5.1.1, which alludes to a plethora of literature which emphasizes the
90 significant link between authentic leadership and optimism (Gardner & Schermerhorn,
2005; Luthans et al., 2007, Schneider, 2001; Avolio & Luthans, 2006; Luthans & Avolio,
2003; Luthans, Norman, & Hughes, 2006).
Specifically, Avolio, et al., (2007) provide a conceptual explanation of the link between
authentic leadership and optimism, where most importantly as authentic leaders develop
their associates, they help them build their own realistic optimism. Rather than doing
everything and making all the decisions for them, high PsyCap optimistic leaders enable,
empower, delegate, and trust their followers to achieve the desired outcomes. They equip
their people with the necessary knowledge and skills, abilities and motivation, not only to
succeed, but also to be able to make personal, permanent, and pervasive attributions of
their own.
Thus an optimistic explanatory style would help employees taking charge and being in
control of their own destiny. Importantly, this optimistic processing of events is likely to
cause their positive outlook to actually come true. In other words, PsyCap optimism can
lead to a self-fulfilling prophecy (Peterson & Chang, 2002) and can be both motivated and
motivating (Peterson, 2000) to achieving long-term success.
Thus it is possible that leaders who are optimistic may therefore influence their followers in
a positive way.
The relationship between authentic leadership and work engagement
A significant positive correlation exists between authentic leadership and work engagement
(r= 0.2617; p= 0.00). In addition, it was established that authentic leadership is sequentially
related to work engagement (proposition 3). The latter was evident through both a
significant path coefficient (0.193) from PLS modeling as well as multiple regression
analysis. The magnitude of the path coefficient (0.193) is fairly substantial, indicating a
relatively strong influence of authentic leadership on work engagement. This seems to
confirm the conceptual link between authentic leadership and work engagement as alluded
to below.
91 Although, relatively little attention has been devoted to the relationship between leadership
and work engagement, Avolio et al. (2004) believe this relationship merits increased
attention, especially in the light of the results from Harter and colleagues (e.g., Harter,
Schmidt, & Hayes, 2002; Harter, Schmidt, & Keyes, 2003) recent meta-analyses that
indicate engagement is positively and strongly related to a variety of key performance
outcomes, including productivity, customer satisfaction, profit, accidents and employee
turnover. As defined by Harter et al. (2003, p. 269), employee engagement “refers to the
individual’s involvement and satisfaction with as well as enthusiasm for work.
Avolio et al. (2004) view engagement in their model as an important consequence of
authentic leadership that mediates its effects on follower outcomes commonly seen as
influenced by leadership processes (Bass, 1990; Yukl, 2002), including transformational
leadership (Avolio, 1999; Bass & Avolio, 1994; Lowe, Kroeck, & Sivasubramaniam, 1996;
Walumbwa & Lawler, 2003). While Avolio et al. (2004) recognise that other forms of
leadership can be effective in achieving these outcomes, they believe that the intervening
states of follower identification, trust, hope, and positive emotions in their model posits to
arrive from authentic leadership, provide an especially solid foundation for veritable and
sustainable organisational performance (Luthans & Avolio, 2003).
Hence it seems apparent that authentic leadership behaviours have a strong influence on
levels of follower work engagement.
The relationship between optimism and self-efficacy
A significant positive correlation exists between optimism and self-efficacy (r= 0.4217; p=
0.00). It was also found that optimism is sequentially related to self-efficacy. The size of the
path coefficient (0.410) is substantial, indicating that the influence of optimism on self-
efficacy is rather strong. It also provides confirmation of proposition 4, namely that a
significant relationship exists between optimism and self-efficacy.
This confirms the conceptual relationship between optimism and self-efficacy as suggested
in the literature. Between optimism and self-efficacy, there are noteworthy similarities, as
well as significant differences. Both are evaluations about the future, although self-efficacy
seems to be antecedent to optimistic appraisal (a strong sense of self-efficacy facilitates
92 optimistic appraisals; Bandura, 1997). On the other hand optimism may reflect a more
benign assessment of the environment rather than of the personal capabilities (Carver &
Scheier, 1998).
Research has shown that both are strongly associated with behaviours, thoughts and
emotions. High self-efficacy, for example, has been related to more positive thinking, higher
self-esteem, higher goals and more positive emotions (Bandura, 1997; Locke & Latham,
1990; Schwarzer,1992). Optimists seem to employ more problem-focused coping
strategies and more effective ways of emotional regulation (Taylor & Armor, 1996).
Moreover, optimism mediates the relationship between perceptions about the world, and
the self and well-being (Karademas, 2006), whereas there is evidence that self-efficacy
functions as a mediator between personality characteristics and adaption (Major, Richards,
Cooper, Cozzarelli, & Zubek, 1998). Thus self-efficacy and optimism may be related to
enhanced outcomes through regulating behaviour and emotions or through mediating other
underlying cognitive structures and processes.
Related support for the existence for distinct contributions from the various positive
capacities, such as optimism and general self-efficacy, can also be drawn from
psychological resources theories (Hobfall, 2002). For example, integrated resource models
treat individual capacities as cumulative sets or “resource caravans.” These individual
capacities or resources coexist. They are developed, manifested, and utilised as a
collective rather than in isolation. The richness and reliability of one’s “resource reservoirs:”
rather than possessing one specific resource, become critical in successfully performing in
a specific domain, event, or challenge and for general health and well being (Youssef &
Luthans, 2007).
In other words, it seems possible that the positive psychological capacities of optimism and
self-efficacy may be important for work engagement beyond what may be accounted for by
any one of them.
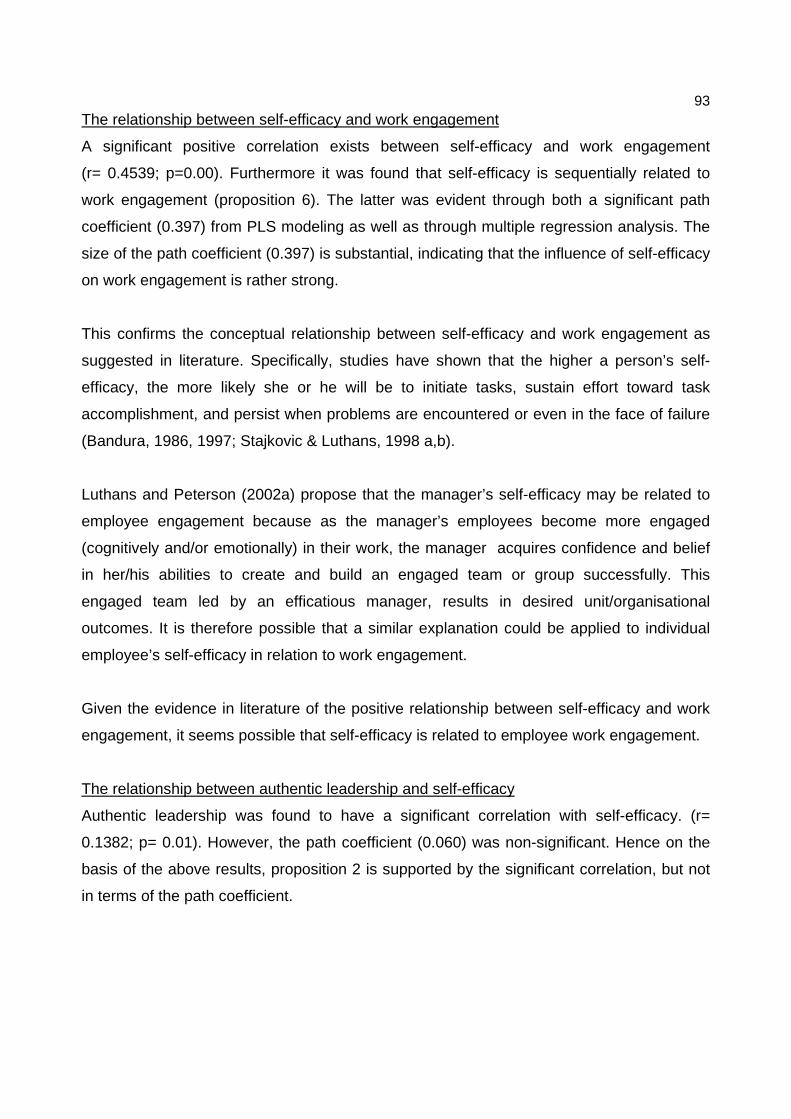
93 The relationship between self-efficacy and work engagement
A significant positive correlation exists between self-efficacy and work engagement
(r= 0.4539; p=0.00). Furthermore it was found that self-efficacy is sequentially related to
work engagement (proposition 6). The latter was evident through both a significant path
coefficient (0.397) from PLS modeling as well as through multiple regression analysis. The
size of the path coefficient (0.397) is substantial, indicating that the influence of self-efficacy
on work engagement is rather strong.
This confirms the conceptual relationship between self-efficacy and work engagement as
suggested in literature. Specifically, studies have shown that the higher a person’s self-
efficacy, the more likely she or he will be to initiate tasks, sustain effort toward task
accomplishment, and persist when problems are encountered or even in the face of failure
(Bandura, 1986, 1997; Stajkovic & Luthans, 1998 a,b).
Luthans and Peterson (2002a) propose that the manager’s self-efficacy may be related to
employee engagement because as the manager’s employees become more engaged
(cognitively and/or emotionally) in their work, the manager acquires confidence and belief
in her/his abilities to create and build an engaged team or group successfully. This
engaged team led by an efficatious manager, results in desired unit/organisational
outcomes. It is therefore possible that a similar explanation could be applied to individual
employee’s self-efficacy in relation to work engagement.
Given the evidence in literature of the positive relationship between self-efficacy and work
engagement, it seems possible that self-efficacy is related to employee work engagement.
The relationship between authentic leadership and self-efficacy
Authentic leadership was found to have a significant correlation with self-efficacy. (r=
0.1382; p= 0.01). However, the path coefficient (0.060) was non-significant. Hence on the
basis of the above results, proposition 2 is supported by the significant correlation, but not
in terms of the path coefficient.
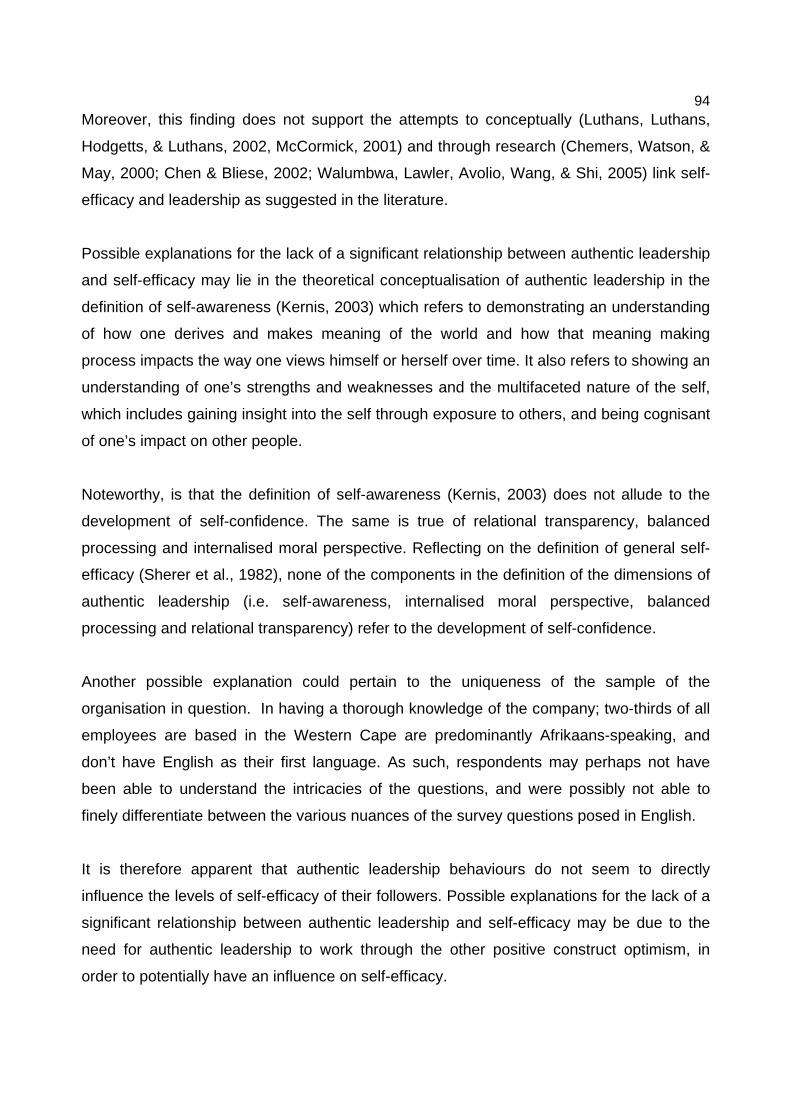
94 Moreover, this finding does not support the attempts to conceptually (Luthans, Luthans,
Hodgetts, & Luthans, 2002, McCormick, 2001) and through research (Chemers, Watson, &
May, 2000; Chen & Bliese, 2002; Walumbwa, Lawler, Avolio, Wang, & Shi, 2005) link self-
efficacy and leadership as suggested in the literature.
Possible explanations for the lack of a significant relationship between authentic leadership
and self-efficacy may lie in the theoretical conceptualisation of authentic leadership in the
definition of self-awareness (Kernis, 2003) which refers to demonstrating an understanding
of how one derives and makes meaning of the world and how that meaning making
process impacts the way one views himself or herself over time. It also refers to showing an
understanding of one’s strengths and weaknesses and the multifaceted nature of the self,
which includes gaining insight into the self through exposure to others, and being cognisant
of one’s impact on other people.
Noteworthy, is that the definition of self-awareness (Kernis, 2003) does not allude to the
development of self-confidence. The same is true of relational transparency, balanced
processing and internalised moral perspective. Reflecting on the definition of general self-
efficacy (Sherer et al., 1982), none of the components in the definition of the dimensions of
authentic leadership (i.e. self-awareness, internalised moral perspective, balanced
processing and relational transparency) refer to the development of self-confidence.
Another possible explanation could pertain to the uniqueness of the sample of the
organisation in question. In having a thorough knowledge of the company; two-thirds of all
employees are based in the Western Cape are predominantly Afrikaans-speaking, and
don’t have English as their first language. As such, respondents may perhaps not have
been able to understand the intricacies of the questions, and were possibly not able to
finely differentiate between the various nuances of the survey questions posed in English.
It is therefore apparent that authentic leadership behaviours do not seem to directly
influence the levels of self-efficacy of their followers. Possible explanations for the lack of a
significant relationship between authentic leadership and self-efficacy may be due to the
need for authentic leadership to work through the other positive construct optimism, in
order to potentially have an influence on self-efficacy.
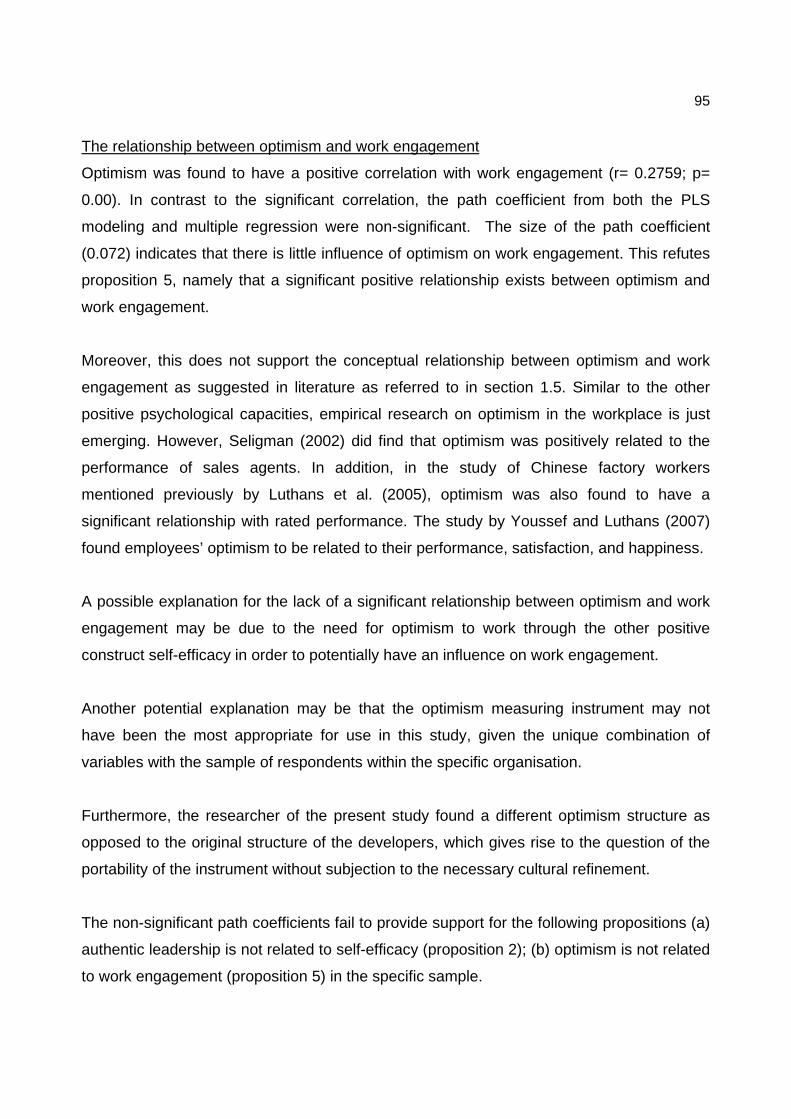
95
The relationship between optimism and work engagement
Optimism was found to have a positive correlation with work engagement (r= 0.2759; p=
0.00). In contrast to the significant correlation, the path coefficient from both the PLS
modeling and multiple regression were non-significant. The size of the path coefficient
(0.072) indicates that there is little influence of optimism on work engagement. This refutes
proposition 5, namely that a significant positive relationship exists between optimism and
work engagement.
Moreover, this does not support the conceptual relationship between optimism and work
engagement as suggested in literature as referred to in section 1.5. Similar to the other
positive psychological capacities, empirical research on optimism in the workplace is just
emerging. However, Seligman (2002) did find that optimism was positively related to the
performance of sales agents. In addition, in the study of Chinese factory workers
mentioned previously by Luthans et al. (2005), optimism was also found to have a
significant relationship with rated performance. The study by Youssef and Luthans (2007)
found employees’ optimism to be related to their performance, satisfaction, and happiness.
A possible explanation for the lack of a significant relationship between optimism and work
engagement may be due to the need for optimism to work through the other positive
construct self-efficacy in order to potentially have an influence on work engagement.
Another potential explanation may be that the optimism measuring instrument may not
have been the most appropriate for use in this study, given the unique combination of
variables with the sample of respondents within the specific organisation.
Furthermore, the researcher of the present study found a different optimism structure as
opposed to the original structure of the developers, which gives rise to the question of the
portability of the instrument without subjection to the necessary cultural refinement.
The non-significant path coefficients fail to provide support for the following propositions (a)
authentic leadership is not related to self-efficacy (proposition 2); (b) optimism is not related
to work engagement (proposition 5) in the specific sample.
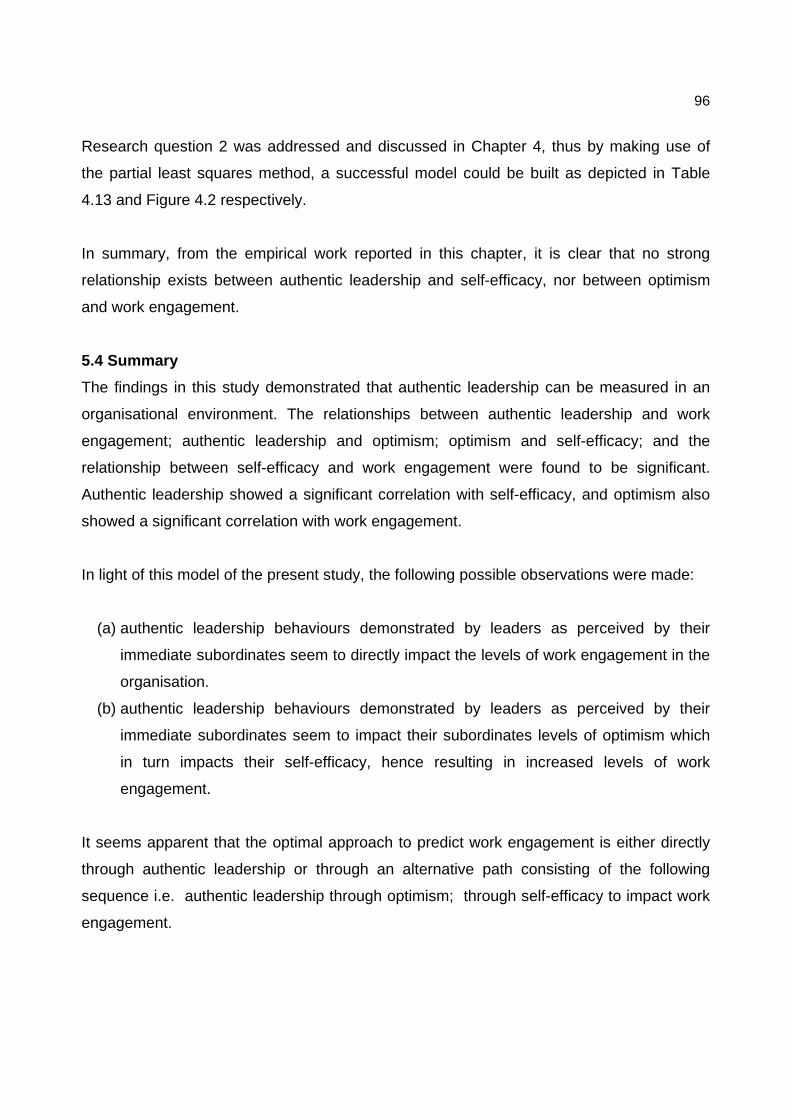
96
Research question 2 was addressed and discussed in Chapter 4, thus by making use of
the partial least squares method, a successful model could be built as depicted in Table
4.13 and Figure 4.2 respectively.
In summary, from the empirical work reported in this chapter, it is clear that no strong
relationship exists between authentic leadership and self-efficacy, nor between optimism
and work engagement.
5.4 Summary
The findings in this study demonstrated that authentic leadership can be measured in an
organisational environment. The relationships between authentic leadership and work
engagement; authentic leadership and optimism; optimism and self-efficacy; and the
relationship between self-efficacy and work engagement were found to be significant.
Authentic leadership showed a significant correlation with self-efficacy, and optimism also
showed a significant correlation with work engagement.
In light of this model of the present study, the following possible observations were made:
(a) authentic leadership behaviours demonstrated by leaders as perceived by their
immediate subordinates seem to directly impact the levels of work engagement in the
organisation.
(b) authentic leadership behaviours demonstrated by leaders as perceived by their
immediate subordinates seem to impact their subordinates levels of optimism which
in turn impacts their self-efficacy, hence resulting in increased levels of work
engagement.
It seems apparent that the optimal approach to predict work engagement is either directly
through authentic leadership or through an alternative path consisting of the following
sequence i.e. authentic leadership through optimism; through self-efficacy to impact work
engagement.
97 It therefore follows that it seems possible that authentic leaders with an optimistic style
could positively influence employees to have an optimistic view, which in turn could
influence their levels of self-efficacy. It is apparent however, that there seems to be a need
for authentic leadership to work through the positive construct optimism, in order to
potentially have an influence on self-efficacy, thus ultimately leading to increased levels of
work engagement.
Hence, the present study served as a baseline/first-level study that provides a foundation
for future research and provides additional data-based research on authentic leadership
and its relationship to other variables.
5.5 Limitations and recommendations
This section of this research study aims to provide guidance for future researchers
interested in the study of the relationship between positive organisational scholarship
variables, with specific focus on the constructs of authentic leadership, optimism, self-
efficacy and work engagement. Firstly, some limitations of this study are discussed. This is
followed by recommendations for future research and suggestions on how interventions
could be approached.
5.5.1 Limitations of the present research study
The influence of context cannot be overlooked in the present study of authentic leadership.
A more thorough understanding is needed of contextual factors, including those that can be
shaped by the leader and those that are not within the leader’s control, foster different
identities and moderate the authentic leader’s effects (Kark & Shamir, 2002). By integrating
context into one’s understanding of the authentic leadership process, there will be greater
opportunity to control for any contextual nuances and thus enhance the predictability of any
leadership model (Avolio et al., 2004).
With regard to the measurement of optimism, the Life Orientation Test Revised instrument
should be subjected to refinement in order to increase its applicability to an organisational
setting as highlighted previously. Seligman’s Attributional Style Questionnaire (ASQ)
(Peterson, Semmel, van Bayer, Abrahamson, Metalsky, & Seligman, 1982) is suggested as
an option. Alternatively, another instrument should be designed or sourced.
98
Respondents from this present study were elicited from a single sample used from just one
organisation, which may limit the generalisability of the findings to other organisational
settings.
Future research studies utilising the survey method should aim to implement measures to
prevent mono-method and possible response bias. Since the data in this study was
gathered at a single point in time, and not as continued measurement over a period of time,
it may have aggravated common method biases resulting in inflated correlations.
A more ethnically diverse sample would be useful to explore whether authentic leadership,
optimism, self-efficacy and work engagement are seen and evaluated differently by
different cultural groups.
It is clear that many possibilities exist for future studies to further explore the relationships
between authentic leadership, optimism, self-efficacy and work engagement.
5.5.2 Recommendations for future research
Several recommendations for future research are offered in the following section. First, as
Seligman and Csikszentmihalyi (2000) point out, there are several levels of analysis that
require attention resulting from the inclusion of positive psychology. They include: (1) the
subjective level that comprises positive subjective experiences such as well-being,
contentment and satisfaction (focussed on past hope and optimism anchored in the future).
Along with flow and happiness in the present; (2) the micro, individual level with positive
traits and qualities such as the capacity for love, courage, aesthetic sensibility, forgiveness
and wisdom; and (3) the group or macro level encompassing positive civic virtues such as
civility, tolerance and work ethic (Luthans, 2001).
As illustrated in the literature overview, several emergent themes found in theory and
research on authentic leadership development reflects areas of convergence and
divergence. Emerging areas of convergence include: a focus on the role of authentic leader
and follower emotions and followers’ emotional reactions to leader authenticity and
inauthenticity; growing recognition of the importance of relational transparency to authentic
99 leadership and explication of specific contextual influences on authenticity. According to
Avolio et al. (2004) areas of divergence involve differences of opinion regarding inclusion of
moral component and positive psychological capital as essential elements in models of
authentic leadership.
The various authors alluded to in this research study, all highlight a plethora of directions
for future theory development and research. For example, the authors proposing
conceptual models (Chan et al., 2005; Klenke, 2005; Youssef & Luthans, 2005) either
provide propositions for testing their models and/or recommendations for further theory
building and research while others pose preliminary findings and consider their implications
for this emerging area of research (e.g. Eigel & Kuhnert, 2005; Kolditz & Brazil, 2005). Still
others focus primarily on authentic leader development and advanced recommendations
for making intervention strategies effective (e.g. Eigel & Kuhnert, 2005; Youssef & Luthans,
2005). Chan et al. (2005) describe the measurement challenges confronting researchers
interested in studying authentic leadership and provide recommendations for addressing
these challenges.
Gardner et al. (2005) claim that regardless of the methodology, it is essential that the
predictions advanced by authentic leadership development theory, as is the case for any
model of leadership development, be empirically tested and validated. The afore-mentioned
authors propose that researchers use a wider array of dependent variables to assess the
effects of authentic leadership and the efforts to develop it.
Gardner et al. (2005) further suggest that the most important current area to measure are
those constructs and corresponding variables that gauge changes that one intends to
create via some “genuine” and/or authentic leadership development intervention. The range
of constructs and variables that need to be included can involve variables that assess
intrapersonal change, interpersonal change, group-level change, and ultimately
organisational-level change.
Starting at the individual level, future research therefore ought to explore how the moral
self-concept of leaders and followers is configured when associated with high moral
character. On the interpersonal level, future research thus can examine how the leader
100 shapes the follower’s self-concept and the way they choose to think and act across the full
range of moral dilemmas. Simply put, what are authentic leadership behaviours, and how
do they distinctly differ from charismatic and transformational leadership behaviours?
At the group and organisational level, further research seems clearly required on how
authentic leaders and followers impact subsequent exchanges within groups in terms of
positivity, trust, respect, self-sacrifice, citizenship, extra effort, willingness to tell the truth,
and the social networks that form as a consequence of this type of leadership. In line with
the group and organisational levels, careful exploration at the more macro levels is required
of how operational definitions at all levels, measures and interventions, apply across
different individuals, groups and especially cultural contexts (Gardner et al., 2005).
Finally, when considering directions for future research, it is important to reiterate that
authentic leadership and authentic leadership development are related but separate
phenomena. Authentic leadership involves the processes whereby leaders form genuine
transparent and trusting relationships of influence with followers/associates. In contrast,
authentic leadership development involves the planned and unplanned processes whereby
individuals come to identify the leader role as part of their core self-concept (Chan et al.,
2005; Gardner, 1993) and achieve self-awareness, balanced processing, relational
transparency, and authentic behaviour when enacting that role with followers (Gardner,
Avolio, & Walumbwa, 2005; Ilies et al., 2005). It may also involve genuine, transparent and
veritable planned efforts to develop authentic leaders (Avolio & Gardner, 2005). Given
these differences, it is important for researchers to clearly identify which of these
phenomena are of interest and design their studies accordingly. Through this study the
researcher hopes to contribute to the field of authentic leadership and in the process help
build and develop the field.
The above discussion evidently stresses the need for continued research in this domain.
From the literature review it becomes evident that, exploring the identified constructs
requires rigorous quantitative and qualitative research, but especially quantitative research,
to further the study field of authentic leadership.
Further confirmatory studies on the factor structures of the instruments used in this study,
101 namely the Authentic Leadership Questionnaire (ALQ), Life Orientation Test Revised (LOT-
R), General Self-Efficacy Scale (GSES) and Utrecht Work Engagement Scale (UWES) are
needed.
In contrast to the non-significant path coefficients, authentic leadership and self-efficacy;
optimism and work engagement, the correlation coefficients were significant. It is therefore
possible that those relationships may hold true for future studies using either a larger
sample or different measuring instruments for these constructs.
More importantly, further work is needed on differentiating authentic leadership from
existing theories of leadership such as transformational, charismatic, inspirational and
servant. Future research also needs to explore how some other leadership theories might
be connected to authentic leadership.
5.6 Intervention: Implications for practice
The importance of the present study is encapsulated in the knowledge that there are
necessary antecedents to the development of authentic leadership, optimism and self-
efficacy in order to increase levels of work engagement. Hence, it is suggested that
organisations consider the following two broad intervention categories (1) development of
authentic leadership behaviours of their leaders in order to increase levels of employee
work engagement, and (2) development of positive psychological capacities such as
optimism and self-efficacy of both leaders and followers in order to increase levels of leader
and follower work engagement.
In line with the latter suggested interventions, the core processes in Avolio and Luthans’
(2006) proposed authentic leadership development include (1) positive psychological
antecedents; (2) organisational context antecedents; and (3) self-development; but also, (4)
the positive psychological capabilities need to be examined with the larger than life context
of leaders; (5) the organisational context needs to be framed through vision, strategy, and
culture; and finally (6) how both planned and unplanned trigger events moderate and
shape the authentic leader’s development.
102 As alluded to earlier, Luthans and Youssef (2004) argue that now, sustainable competitive
advantage can best be accomplished through context-specific, cumulative, renewable, thus
hard-to-imitate factors and propose that such advantage can be gained through investing,
leveraging, developing, and managing psychological capital (PsyCap).
It is therefore concluded that drawing from the emerging repertoire of positive
psychologically-based interventions, the development of authentic leadership behaviours,
and the development of the positive psychological capacities of both leaders and followers
in order to facilitate heightened levels of work engagement, may yield substantial returns
for organisations.
5.7 Conclusion
The results obtained from the sample presented in the previous Chapter 4, were presented
with interpretations and possible explanations in this chapter. The interpretations focussed
on the factor structures and reliability of the constructs. In addition, the attempt to predict
the correlations with work engagement, the interpretations of the multiple regression
analysis and the PLS model were presented. Suggestions were made regarding how
organisations can develop authentic leadership, optimism and self-efficacy in order to
increase levels of work engagement. In order to address the limitations of the current study,
several directions for future research were provided.
In conclusion, global organisations are beginning to recognise that positive psychology
concepts can help organisational leaders meet the challenges in today’s turbulent,
unprecedented environment. Although traditional approaches are still necessary for
effective management, they are no longer sufficient in today’s paradigm, the “flat world”
(Friedman, 2005) competitive environment. Organisations should take full advantage of
developing authentic leadership and growing the optimism and self-efficacy of their
employees in order to capitalize on these context-specific, cumulative, renewable factors.
The advantage of organisations developing authentic leadership, optimism and self-efficacy
in order to increase levels of work engagement is that it is difficult to replicate by
competitors, without considerable effort and discipline on the part of managers and leaders,
making it an enduring competitive advantage (Luthans & Youssef, 2004).

103 Similar to the other psychological capacities, it is evident that empirical research on these
positive constructs is only just emerging. Future research needs to explore further ways
that organisations can intervene to develop authentic leadership, boost realistic optimism,
and self-efficacy, thus positively impacting levels of work engagement for continued
sustainable growth and performance.
104 REFERENCES
Ainsworth, M. D. S., Blehar, M. C., Waters, E., & Wall, T. (1978). Patterns of attachment.
Hillsdale, NJ: Erlbaum.
Ashforth, B., & Humphrey, R. (1995). Emotion in the workplace: A reappraisal. Human
Relations, 48 (2), 97-125.
Ashforth, B., & Mael, F. (1989). Social identity theory and the organisation. Academy of
Management Review, 14, 20-39.
Avolio, B. J. (1999). Full leadership development: Building the vital forces in organisations.
Newbury Park, CA: Sage.
Avolio, B. J., & Bass, B. M. (2002). Developmental potential across a full range of
leadership. Mahwah, NJ: Lawrence Erlbaum.
Avolio, B. J., & Gardner, W. L. (2005). Authentic leadership development: getting to the
root of positive forms of leadership. The Leadership Quarterly, 16 (3), 315-338.
Avolio, B. J., Gardner, W. L., Walumbwa, F. O., & May, D. (2004). Unlocking the mask: a
look at the process by which authentic leaders impact follower attitudes and
behaviours. The Leadership Quarterly, 15 (6), 801-823.
Avolio, B. J., Gardner, W. L., & Walumbwa, F. O. (2007). Authentic Leadership
Questionnaire. Retrieved February, 2, 2009, from http://www.mindgarden.com
Avolio, B. J., & Gibbons, T. C. (1988). Developing transformational leaders: A life span
approach. In Conger, J. A. & Kanungo, R. N. (Eds.). Charismatic leadership: The
elusive factor in organisational effectiveness (pp. 213-236). San Francisco: Jossey-
Bass.
Avolio, B. J., & Luthans, F. (2006). The high impact leader. New York: McGraw-Hill.
105
Avolio, B. J., Luthans, F., & Walumbwa, F. O. (2004). Authentic leadership: Theory-
building for veritable sustained performance. Working paper, Gallup Leadership
Institute. University of Nebraska, Lincoln.
Avolio, B. J., & Walumbwa, F. O. (2006). Authentic Leadership: Moving HR Leaders to a
higher level. Research in Personnel and Human Resources Management, 25, 273-
304.
Babbie, E. R. (1998). The practice of social research (8th ed.). Belmont: Wadsworth
Publishing Company.
Babbie, E. R., & Mouton, J. (2001). The practice of social research. Cape Town: Oxford.
Bagozzi, R. P. (1994). In: Principles of marketing research (pp.317-385). Oxford: Blackwell.
Bakker, B., Euwema, C. F., & van Dierendonck, A. (2003). Job resources foster
engagement and motivation to change. Manuscript in preparation.
Bandura, A. (1986). Social foundations of thought and action: A social cognitive theory.
Engelwood Cliffs, NJ: Prentice-Hall.
Bandura, A. (1989). Human Agency in Social Cognitive Theory. American Psychologist,
44, 1175-1184.
Bandura, A. (1997). Self-efficacy: The exercise of control: New York: Freeman.
Bandura, A. (2000). Exercise of human agency through collective efficacy. Current
Directions in Psychological Science, 9, 75-78.
Bandura, A., & Locke, E. (2003). Negative self-efficacy and goal effects revisited. Journal
of Applied Psychology, 88, 87-99.
106 Barclay, D. W., Higgins, C., & Thompson, R. (1995). The partial least squares approach to
causal modeling: Personal computer adoption and use as illustration. Technology
Studies, 2(2), 285-309.
Bass, B. (1990). Bass and Stogdill’s handbook of leadership. New York: The Free Press.
Bass, B. (1998). Transformational leadership: Industrial, military and educational impact.
Mahwah, NJ: Lawrence Erlbaum.
Bass, B. (1999). Two decades of research and development in transformational
leadership. European Journal of Work and Organisational Psychology, 12, 47-59.
Bass, B., & Avolio, B. J. (1994). Improving organisational effectiveness through
transformational leadership. Thousand Oaks, CA: Sage.
Bentler, P. M., & Bonett, D. G. (1980). Significance tests and goodness of fit in the analysis
of covariance structures. Psychological Bulletin, 88, 588-806.
Bless, C., & Higson-Smith, C. (2000). Fundamentals of social research methods: An
African perspective (3rd ed.). Cape Town: Juta.
Bollen, K. A. (1989). Structural equations with latent variables. New York: Wiley.
Bosscher, R. J., & Smit, J. H. (1998). Confirmatory factor analysis of the general self-
efficacy scale. Behavior Research & Therapy, 36, 339-343.
Bowlby, J. (1988). A secure base: Parent-child attachment and healthy human
development. New York: Basic Books.
Britt, T. W., Adler, A. B., & Bartone, P. T. (2001). Deriving benefits from stressful events:
the role of engagement in meaningful work and hardiness. Journal of Occupational
Health Psychology, 6, 53-63.
107 Brown, S. P. (1996). A meta-analysis and review of organisational research on job
involvement. Psychological Bulletin, 120, 235-255.
Byrne, B. M. (1998). Structural equation modeling with LISREL, PRELIS, and SIMPLIS:
Basic concepts, applications, and programming. Mahwah: Lawrence Erlbaum.
Cable, D. M., & Judge, T. A. (1994). Pay preferences and job search decisions: A person-
organisation fit perspective. Personnel Psychology, 47, 317-348.
Cameron, K. S., Dutton, J. E., & Quinn, R. E. (2003). Positive Organisational Scholarship.
San-Francisco: Berrett-Koehler, Inc.
Carver, C. S., & Scheier, M. F. (1998). On self-regulation of behaviour. New York:
Cambridge University Press.
Chan, A., Hannah, S. T., & Gardner, W. L. (2005). Veritable authentic leadership:
emergence, functioning, and impacts. Leadership and Management, 3, 3-41.
Chemers, M. M., Watson, C. B., & May, S. T. (2000). Dispositional affect and leadership
effectiveness: A comparison of self-esteem, optimism, and efficacy. Personality and
Social Psychology Bulletin, 26, 267-277.
Chen, G., & Bliese, P. D. (2002). The role of different levels of leadership in predicting
self- and collective efficacy: Evidence for discontinuity. Journal of Applied
Psychology, 87, 549-556.
Chen, G., Gully, S. M., & Eden, D. (2001). Validation of a New General Self-Efficacy Scale,
Organisational Research Methods, 4, 62-83.
Chin, W. W. (1998). The partial least squares approach to structural equation modeling. In:
G. A. Marcoulides (ed.), Modern Methods of Business Research (pp. 295-358).
Mahwah, NJ: Lawrence Erlbaum Associates.
108 Chin, W. W., & Newsted, P. R. (1999). Structural equation modeling analysis with small
samples using partial least squares. In R.H.Hoyle (E), Statistical strategies for small
sample research, pp.307-342). Thousand Oaks, CA: Sage.
Colbert, A. E., Mount, M. K., Harter, J. K., Witt, L., & Barrick, M. R. (2004). Interactive
effects of personality and perceptions of the work situation on workplace deviance.
Journal of Applied Psychology, 89, 599-609.
Collins, J. I. (2001a). Level 5 leadership: The triumph of humility and fierce resolve.
Harvard Business Review, January, 66-76.
Collins, J. I. (2001b). Good to great. New York: Harper Business.
Conger, J. A. (1990). The dark side of leadership. Organisational Dynamics, 19, 44-55.
Cooper, C., Scandura, T. A., & Schriesheim, C. A. (2005). Looking forward but learning
from our past: Potential challenges to developing authentic leadership theory and
authentic leaders. Leadership Quarterly, 16, 474-493.
Cota, A. A., Longman, R. S., Holden, R. R., & Fekken, G. C., & Xinaris, S. (1993).
Interpolating 95th percentile eigenvalues from random data: An empirical example.
Educational & Psychological Measurement, 53, 585-596.
Cropanzano, R., & Greenberg, J. (1997). Progress in organisational justice: Tunnelling
through the maze. In: L. T. Robertson & C. L. Cooper (Eds). International review of
industrial and organisational psychology (pp.317-372). New York: Wiley.
Csikszentmihalyi, M. (1990). Flow: the psychology of optimal experience. New York:
Harper.
Dasborough, M., & Ashkanasy, N. (2000). Emotion and attribution of intentionality in
leader-member relationships. The Leadership Quarterly, 13, 615-634.
109 Davison, A. C., & Hinkley, D. V. (2003). Bootstrap methods and their application (2nd ed.).
New York, NY: Cambridge University Press.
Day, D. V., Zaccaro, S. J., & Halpin, S. M. (2004). Leadership development for
transforming organisations. Growing leaders for tomorrow. Mahwah, NJ: Lawrence
Erlbaum.
Deci, W. L., & Ryan, R. M. (1985). Intrinsic motivation and self-determination in human
behaviour. New York: Plenum.
Demerouti, E., Bakker, A. B., De Jonge, J., Janssen, P. P. M., & Schaufeli, W. B. (2001).
Burnout and engagement at work as a function of demands and control.
Scandinavian Journal of Work Environment and Health, 27, 279-286.
Demerouti, E., Bakker, A. B., Nachreiner, F., & Schaufeli, W. B. (2001). The job demands-
resources model of burnout. Journal of Applied Psychology, 86, 499-512.
Diamantopoulos, A., & Winklhofer, H. (2001). Index construction with formative indicators:
An alternative to scale development. Journal of Marketing Research, 38(2), 269-
277.
Dibbern, J., Goles, T., Hirschheim, R. A., & Jayatilaka, B. (2004). Information systems
outsourcing: A survey and analysis of literature. The Data Base for Advances in
Information Systems, 35(4), 6-102.
Dirks, K. T., & Ferrin, D. L. (2001). The role of trust in organisational setting. Organisation
Science, 12, 450-467.
Dirks, K. T., & Ferrin, D. L. (2002). Trust in Leadership: Meta-analytic findings and
implications for research and practice. Journal of Applied Psychology, 87, 611-628.
Douglas, C., Ferris, G. R., & Perrewé, P. L. (2005). Leader political skill and authentic
leadership. Leadership and Management, 3, 139-154.
110
Dvir, T., Eden, D., Avolio, B. J., & Shamir, B. (2002). Impact of transformational leadership
on follower development and performance: A field experiment. Academy of
Management Journal, 45, 735-744.
Dvir, T., Eden, D., & Banjo, M. L. (1995). Self-fulfilling prophecy and gender: Can women
be Pygmalion and Galatea? Journal of Applied Psychology, 80, 253-270.
Eagly, A. H. (2005). Achieving relational authenticity in leadership: Does gender matter?
The Leadership Quarterly, 16, 459-474.
Eagly, A. H., & Chaiken, S. (1993). The psychology of attitudes. New York: Harcourt,
Brace, Javanovich.
Earley, P. C., & Lituchy, T. R. (1991). Delineating goal and efficacy effects: A test of three
models. Journal of Applied Psychology, 76, 81-98.
Ebert, S. A., Tucker, D. C., & Roth, D. L. (2002). Psychological resistance factors as
predictors of general health status and physical symptoms reporting. Psychology,
Health & Medicine, 7, 363-375.
Eden, D., & Aviram, A. (1993). Self-efficacy training and speed of re-employment: Helping
people to help themselves. Journal of Applied Psychology, 78, 352-360.
Eden, D., & Granat-Flowmin, R. (2000). Augmenting means efficacy to improve service
performance among computer users: A field experiment in the public sector. Paper
presented at the Fifteenth Annual Conference for the Society for Industrial and
Organisational Psychology. New Orleans, LA.
Eden, D., & Kinnar, J. (1991). Modeling Galatea: Boosting self-efficacy to increase
volunteering. Journal of Applied Psychology, 76, 770-780.
111 Eden, D., & Sulimani, R. (2002). Pygmalion training made effective: Greater mastery
through augmentation of self-efficacy and means-efficacy. In B. J. Avolio & F. J.
Yammarino (Eds), Transformational and charismatic leadership: The road ahead
(pp.67-91). Oxford, UK: Elsevier Science.
Eden, D., & Zuk, Y. (1995). Sea-sickness as a self-fulfilling prophecy: Raising self-efficacy
to boost performance at sea. Journal of Applied Psychology, 80, 628-635.
Efron, B., & Tibshrirani, R. J. (1993). An introduction to bootstrap. New York, NY.
Chapman Hall.
Eigel, K. M., & Kuhnert, K. W. (2005). Authentic development: leadership development
level and executive effectiveness. Leadership and Management, 3, 357-385.
Erickson, T. J. (2005). Testimony submitted before the U.S. Senate Committee on Health,
Education. Labor and pensions, May 26.
Field, A. (2005). Discovering statistics using SPSS (2nd ed.). Thousand Oaks, CA: Sage.
Fletcher, T. D. (2007). Encyclopedia of Industrial and Organisational Psychology.
Thousand Oaks, CA: Sage.
Fornell, C. (1982). A second generation of multivariate analysis: An overview. In C. Fornell
(Ed), A second generation of multivariate analysis (Vol. 1, pp. 1-21). New York, NY:
Praeger.
Fornell, C., & Robinson, W.T. (1983). Industrial Organisation and consumer
satisfaction/dissatisfaction. Journal of Consumer Research, 9(4), 403-412.
Friedman, T. L. (2005). The World is Flat: The Globalized World in the 21st century.
London: Penguin Group.
112 Gabris, G. T., Maclin, S. S., & Ihrke, D. M. (1998). The leadership enigma: toward a model
of organisational optimism. Journal of Management History, 4, (4), 334-349.
Gardner, J. W. (1993). On leadership. New York: The Free Press.
Gardner, W. L., Avolio, B. J., Luthans, F., May, D., & Walumbwa, F. O. (2005). “Can you
see the real me?” A self-based model of authentic leadership and follower
development. The Leadership Quarterly, 16 (3), 343-372.
Gardner, W. L., Avolio, B. J., & Walumbwa, F. O. (2005). Authentic leadership
development: emergent themes and future directions. Leadership and Management,
3, 387-406.
Gardner, D. G., & Pierce, J. L. (1998). Self-esteem and self-efficacy within the
organisational context. Group and Organisation Management, 23, 48-70.
Gardner, W. L., & Schermerhorn, J. R. (2004). Organisational Dynamics, 33 (3), 270-281.
George, B. (2003). Authentic leadership: Rediscovering the secrets of creating lasting
value. San Francisco, CA: Jossey-Bass.
Gerbing, D. W., & Anderson, J. C. (1984). On the meaning of within-factor correlated
measurement errors. Journal of Consumer Research,11, 572-580.
Glorfeld, L. W. (1995). An improvement on Horn’s parallel analysis methodology for
selection the correct number of factors to retain. Educational and Psychological
Measurement, 55, 377-393.
Grimm, L. G., & Yarnold, P. R. (1995). Reading and Understanding Multivariate Statistics.
Washington, DC: American Psychological Association.
Hackman, J. R., & Oldham, G. (1980). Work Redesign. Reading, MA: Addison-Wesley.
113 Hair, J. F., Black, B., Balbin, B., Anderson, R. E., & Tatham, R. L. (2006). Multivariate Data
Analysis (6th ed.). Tatham: Prentice Hall.
Hannah, S. T., Lester, P. B., & Vogelgesang, G. R. (2005). Moral leadership: explicating
the moral component of authentic leadership. Leadership and Management, 3, 43-
81.
Harju, B., & Bolen, L. M. (1998). The effects of optimism on coping and perceived quality of
life of college students. Journal of Social Behaviour & Personality, 13, 185-200.
Harper, H. L. (1974-1976). The method of least squares and some alternatives. Part I,II,III,
IV,V. International Statistical Review, 42, 147-174; 42, 235-264; 43, 1-44; 43, 125-
190; 43, 269-272; 44,113-159.
Harter, S. (2002). Authenticity. In Snyder, C. R., & Lopez, S. J. (Eds), Handbook of positive
psychology (pp. 382-394). Oxford, UK: Oxford University Press.
Harter, J. K., Schmidt, F. L., & Hayes, T. L. (2002). Business-unit-level relationship
between employee satisfaction, employee engagement, and business outcomes: A
Meta-analysis. Journal of Applied Psychology, 87, 268-279.
Harter, J. K., Schmidt, F. L., & Keyes, C. L. M. (2003). Well-being in the workplace and its
relationship to business outcomes: A review of the Gallup Studies. In C. L. M.
Keyes, & J. Haidt (Eds.), Flourishing: Positive psychology and the life well-lived (pp.
205-224). Washington, DC: American Psychological Association.
Hazen, C., & Shaver, P. R. (1994). Attachment as an organisational framework for
research on close relationships. Psychological Inquiry, 5, 1022.
Heider, F. (1958). The psychology of interpersonal relations. New York: Wiley.
114 Henseler, J., Ringle, C. M., & Sinkovics, R. R. (2009). The use of partial least squares path
modeling in international marketing. Advances in International Marketing, 20, 277-
319.
Higgins, C. A., Duxbury, L. E., & Irving, R. H. (1992). Work-family conflict in dual-career
family. Organisational Behaviour and Human Decision Processes, 51(1), 51-75.
Hobfoll, S. (2002). Social and psychological resources and adaption. Review of General
Psychology, 6, 307-324.
Hogg, A., & Terry, D. (2000). Social identity and self categorization processes in
organisational contexts. Academy of Management Review, 25, 121-141.
Horn, J. L. (1965). A rationale and test for the number of factors in factor analysis.
Psychometrika, 30, 179-185.
Howell, J. P. (1992). Two faces of charisma: Socialised and personalized leadership in
organisations. In Conger, J. A., & Kanungo, R. N. (Eds.). Charismatic leadership:
The elusive factor in organisational effectiveness (pp.213-236). San Francisco:
Jossey-Bass.
Howell, J. M., & Avolio, B. J. (1992). The ethics of charismatic leadership: Submission or
Liberation? Academy of Management Executive, 6, 43-53.
Hu, L., & Bentler, P. M. (1999). Cut-off criteria for fit indexes in covariance structure
analysis: Conventional criteria versus new alternatives. Structural Equation
Modeling, 6, 1-55.
Hulland, J. S. (1999). Use of partial least squares (PLS) in strategic management
research: A review of four recent studies. Strategic Management Journal, 20 (4),
195-204.
115 Ilies, R., Morgeson, F., & Nahrgang, J. (2005). Authentic leadership and eudaemonic well-
being: Understanding leader-follower outcomes. The Leadership Quarterly, 16 (3).
373-394.
Jöreskog, K. G., & Sörbom, D. (1978). LISREL: Analysis of linear structural relationships
by the method maximum likelihood. Chicago: National Educational Resources.
Jöreskog, K. G., & Sörbom, D. (1986). LISREL VI: Analysis of linear structural relationships
by maximum likelihood and least square methods. Mooresville, IN: Scientific
Software International.
Jöreskog, K. G., & Sörbom, D. (1999). LISREL 8 User’s reference guide. Chicago:
Scientific Software International.
Judge, T. A., Erez, A., Bono, J. E., & Thoreson, C. J. (2002). Are measures of self-esteem,
neuroticism, locus of control, and generalized self-efficacy indicators of a common
core construct? Journal of Personality and Social Psychology, 83, 693-710).
Judge, T. A., & Ilies, R. (2004). Is positiveness in organisations always desirable?
Academy of Management Executive, 18, 151-155.
Kahn, W. A. (1990). Psychological conditions of personal engagement and disengagement
at work. Academy of Management Journal, 33, 692-724.
Kanfer, R., & Heggestad, E.D. (1997). Motivational traits and skills: A person-centered
approach to work motivation. Research in Organisational Behavior, 19, 1-56.
Kanter, R. M. (2004). Confidence. New York: Crown Business.
Kaplan, R. M., & Saccuzo, D. P. (2001). Psychological testing: principles, applications and
issues (5th ed.). Sidney: Wadsworth.
116 Karademas, E. C. (2006). Self-efficacy, social support and well-being: The mediating role
of optimism. Personality and Individual Differences, 40,1281-1290.
Kark, R., & Shamir, B. (2002). The dual effect of transformational leadership: Primary
relational and collective selves and further effects on followers. In B. J. Avolio, & F.
J. Yammarino (Eds.), Transformational and charismatic leadership: The road ahead
(pp. 7-91). Oxford, UK: Elsevier.
Karl, K. A., O’Leary-Kelly, A. M., & Martocchio, J. J. (1993). The impact of feedback and
self-efficacy on performance in training. Journal of Organisational Behaviour, 14,
379-394.
Kegan, J. (1982). The evolving self: Problem and process in human development.
Cambridge: Harvard University Press.
Kelloway, E. K. (1998). Using LISREL for Structural Equation Modeling: A Researcher’s
Guide. Thousand Oaks: Sage.
Kelly, T. L. (1927). Interpretation of educational instruments. New York: World Book.
Kerlinger, F. N. (1992). Foundations of behavioral research (3rd ed.). Orlando: Harcourt
Brace.
Kerlinger, F. N., & Lee, H. B. (2000). Foundations of Behavioral Research (4th ed.). USA:
Fort Worth.
Kerr, S., & Jermier, J. (1978). Substitutes for leadership: The meaning and measurement.
Organisational Behaviour and Human Performance, 22, 375-403.
Kernis, M. H. (2003). Toward a conceptualization of optimal self-esteem. Psychological
Inquiry, 14, 1-26.
117 Klenke, K. (2004). The internal theatre of the authentic leader: Toward an integrated model
of authentic leadership. Paper presented at the Inaugural Gallup Leadership
Summit, The Gallup Institute, University of Nebraska-Lincoln, June 6-8.
Klenke, K. (2005). Authentic leadership: A self, leader, and spiritual identity perspective.
Paper presented at the 1st International Conference on Value-based Leadership,
University of Stellenbosch Business School, Bellville, Cape Town, South Africa, 14-
16 March 2006.
Kolditz, T. A., & Brazil, D. M. (2005). Authentic leadership in in extremis settings: a
concept for extraordinary leaders in exceptional situations. Leadership and
Management, 3, 345-356.
Kouzes, J., & Postner, B. (1998). The Leadership Challenge. Jossey-Bass: San Francisco,
CA.
Krijnen, W. P., Dijkstra, T. K., & Gill, R. D. (1998). Conditions for factor (in) determinancy in
factor analysis. Psychometrika, 63 (4), 359-367.
Kuhnert, K. W., & Lewis, P. (1987). Transactional and transformational leadership: A
constructive/developmental analysis. Academy of Management Review, 12, 648-
657.
Lai, J. C. L., Cheung, H., Lee, W., & Yu, H. (1998). The utility of the revised Life
Orientation Test to measure optimism among Hong Kong Chinese. International
Journal of Psychology, 33 (1) 45-56.
Law, K. S., Wong, C. S., & Mobley, W. H. (1998). Toward a taxonomy of multidimensional
constructs. Academy of Management Review, 23, 741-755.
Lawler, E. E., & Hall, D. T. (1970). Relationship of job characteristics to job involvement,
satisfaction, and intrinsic motivation. Journal of Applied Psychology, 54, 305-312.
118 Likert, R. (1967). The Human Organisation. New York: McGraw-Hill.
Locke, E. A., & Latham, G. P. (1990). A theory of goal setting and task performance.
Englewood, NJ: Prentice-Hall.
Lowe, K. B., Kroeck, K. G., & Sivasubramaniam, N. (1996). Effectiveness correlates of
transformational and transactional leadership: A meta-analytic review of MLQ
literature. The Leadership Quarterly, 7, 385-425.
Luthans, F. (2001). The case for positive organisational behavior (POB). Current Issues in
Management, 1 (1), 10-21.
Luthans, F. (2002a). Positive approach to OB. In Luthans, F. (Ed.), Organisational
Behavior (9th ed.) (pp. 286-322). New York, NY: McGraw-Hill/Irwin.
Luthans, F. (2002b). Positive organisational behavior (POB): Developing and managing
psychological strengths. Academy of Management Executive, 16(1), 57-72.
Luthans, F., & Avolio, B. J. (2003). Authentic leadership: A positive development approach.
In K. S. Cameron, J. E. Dutton, & R. E. Quinn (eds.), Positive organisational
scholarship (pp.241-258). San Francisco, CA: Berrett-Koehler.
Luthans, F., Avolio, B. J., Avey, J., & Norman, S. (2006). Psychological capital:
Measurement and relationship with performance and satisfaction (Working paper
No. 2006 – 1). Gallup Leadership Institute, University of Nebraska-Lincoln.
Luthans, F., Avolio, B. J., Walumbwa, F. O., & Li, W. (2005). The psychological capital of
Chinese workers: Exploring the relationship with performance. Management and
Organisation Review,1, 247-269.
Luthans, F., Luthans, K. W., Hodgetts, R. M., & Luthans, B. C. (2002). Positive approach to
leadership (PAL): Implications for today’s organisations. Journal of Leadership
Studies, 8 (2), 3-20.
119
Luthans, F., & Jensen, S. M. (2001). Positive organisational behaviour: a new approach to
global management. Nanyang (Singapore) Business Review, 1 (1), 18-30.
Luthans, F., Norman, S. M., & Hughes, L. (2006). Authentic leadership. In R. Burke & C.
Cooper (Eds.), Inspiring leaders (pp. 84-104). London: Routledge, Taylor & Francis.
Luthans, F., & Peterson, S. J. (2002). Employee engagement and manager self-efficacy:
Implications for managerial effectiveness and development. Journal of Management
Development, 21(5), 376-371.
Luthans, F., Peterson, S. J., & Ibrayeva, E. (1998). The potential for the “dark side” of
leadership in post-communist countries. Journal of World Business, 33, 185-201.
Luthans, F. & Youssef, C. M. (2004). Human, social and now positive psychological capital
management: Investing in people for competitive advantage. Organisational
Dynamics, 33, 143-160.
Luthans, F., Youssef, C. M., & Avolio, B. J. (2007). Psychological Capital: Developing the
Human Competitive Edge. New York: Oxford University Press.
MacCallum, R. C., & Austin, J. T. (2000). Applications of structural equation modeling in
psychological research. Annual Review of Psychology, 51, 201-226.
Macey, W. H., & Schneider, B. (2008). The meaning of work engagement. Industrial and
Organisational Psychology, 1, 3-30.
MacKenzie, S. B., Podsakoff, P. M., & Jarvis, C. B. (2005). The problem of measurement
model misspecification in behavioural and organisational research and some
recommended solutions. Journal of Applied Psychology, 90, 710-730.
120 Maddux, J. E. (2002). Self-efficacy: The power of believing you can. In C. R. Snyder & S.
Lopez (Eds.), Handbook of positive psychology (pp.257-276). Oxford, UK: Oxford
University Press.
Major, B., Richards, C., Cooper, M. L., Cozzarelli, C., & Zubek, J. (1998). Personal
resilience, cognitive appraisals, and coping: An integrative model of adjustment to
abortion. Journal of Personality and Social Psychology, 74, 735-752.
Marshall, G. N., Woortman, C. B., Kusulas, J. W., Hervig, L. K., & Vickers, R. R., Jr.
(1992). Distinguishing optimism from pessimism: Relations to fundamental
dimensions of mood and personality. Journal and Social Psychology, 62, 1067-
1074.
Martocchio, J. J. (1994). Effects of conceptions of ability on anxiety, self-efficacy, and
learning in training. Journal of Applied Psychology, 79, 819-825.
Martocchio, J. J., & Judge, T. A. (1997). Relationship between conscientiousness and
learning in employee training: Mediating influences of self-deception and self-
efficacy. Journal of Applied Psychology, 82, 764-773.
Maslach, C., & Leiter, M. P. (1997). The Truth about Burnout. San Francisco, CA: Jossey-
Bass.
Maslach, C., Schaufeli, W. B., & Leiter, M. P. (2001). Job Burnout. Annual Review of
Psychology, 52, 397-422.
May, D. R., Chan, A., Hodges, T., & Avolio, B. J. (2003). Developing the moral component
of authentic leadership. Organisational Dynamics, 32, 247-260.
May, D. R., Gilson, R. L., & Harter, L. M. (2004). The psychological conditions of
meaningfulness, safely, availability and the engagement of the human spirit at work.
Journal of Occupational and Organisational Psychology, 77, 11-37.
121 McCormick, M. J. (2001). Self-efficacy and leadership effectiveness: Applying social
cognitive theory to leadership. The Journal of Leadership Studies, 8, 22-23.
McGregor, D. M. (1960). The human side of enterprise. New York: McGraw-Hill.
Meijman, T. F., & Mulder, G. (1998). Psychological aspects of workload, In Drenth, P. J. D.
& Thierry, H. (eds), Handbook of Work and Organisational Psychology: Work
Psychology, 2, 55-33. Hove: Psychology Press.
Michie, S., & Gooty, J. (2005). Values, emotions, and authenticity: Will the real leaders
please stand up? The Leadership Quarterly, 16 (5), 441-457.
Mischel, W. (1973). Toward a cognitive social learning reconceptualisation of personality.
Psychological Review, 80, 252-283.
Montgomery, A., Peeters, M. C. W., Schaufeli, W. B., & Den Ouden, M. (2003). Work-home
interference among newspaper managers: Its relationship with burnout and
engagement. Anxiety, Stress & Coping, 16, 195-211.
Mouton, J. (2001). How to succeed in your master’s and doctoral studies: A South African
guide and resource book. Hatfield, Pretoria: Van Schaik.
Muthén, B. (1984). A General structural equation model with dichotomous, ordered,
categorical, and continuous latent indicators. Psychometrika, 49, 115-132.
Nel, P., & Boshoff, A. B. (2008). Investigating the Invariance of the Factor Structure of the
General Self-efficacy Scale. Paper presented at the 11th conference of the Society
for Industrial and Organisational Psychology if South Africa (SIOPSA), CSIR
Conference Centre, Pretoria.
Newman, W. L. (1997). Social Research Methods: Quantitative and Qualitative Approaches
(3rd ed.). Needham Heights, MA: Allyn & Bacon.
122
Nicholls, W. L., Baker, R. P., & Martin, J. (1997). The Effect of New Data Collection
Technology on Survey Data Quality. In: L. Lyberg., P. Biemer., M. Collins., E. De
Leeuw., C. Dippo., N. Schwarz., & D. Trewin, D. (eds.),Survey Measurement and
Process Quality (pp. 221-248). New York: Wiley.
Nunnaly, J. C. (1967). Psychometric theory. New York: McGraw-Hill Inc.
Nunnaly, J. C., & Bernstein, I. H. (1994). Psychometric Theory (3rd ed.), New York:
McGraw-Hill.
Oakley, J. (1992). Morality and the emotions. London: Routledge.
Parker, S. (1998). Enhancing role-breadth self-efficacy. Journal of Applied Psychology, 83,
835-852.
Pavlou, P. A., & Chai, L. (2002). What drives electronic commerce across cultures? A
cross-cultural empirical investigation of the theory of planned behaviour. Journal of
Electronic Commerce research, 3(4), 240-253.
Payne, R. L. (1996). Contextualism in context. In Cooper, C. L. & Robertson, I. T. (Eds).
International review of industrial and organisational psychology. New York: John
Wiley.
Perrow, C. (1986). Complex Organisations: A Critical Essay. New York: Random House.
Peterson, C. (2000). The future of optimism. American Psychologist, 55, 44-55.
Peterson, C., & Chang, E. (2002). Optimism is flourishing. In C. Keyes & J. Haidt (Eds.),
Flourishing: Positive psychology and the life well-lived (pp.55-79). Washington DC:
American Psychological Association.
123 Peterson, S. J., & Luthans, F. (2003). The positive impact and development of hopeful
leaders. Leadership & Organisation Development Journal, 24 (1), 26-31.
Peterson, C., & Seligman, M. E. P. (1984). Causal explanations as a risk factor for
depression: Theory and evidence. Psychological Review, 91, 347-374.
Peterson, C. C., Semmel, C., Von Bayer, L. Y., Abramson, G. G., Metalsky, G. I., &
Seligman, M. E. P. (1982). Attributional Style Questionnaire. New York: Plenum
Press.
Peunte, S., Crous, F., & Venter, A. (2007). The role of a positive trigger event in actioning
authentic leadership development. SA Journal of Human Resource Management, 5
(1), 11-18.
Pfeffer, J. (1998). The human equation. Boston: Harvard Business School Press.
Plowmin, R., Scheier, M. F., Bergeman, C. S., Pedersen, N. L., Nesselroade, J. R., &
McClearn, G. E. (1992). Optimism, pessimism, and mental health: A twin/adoption
analysis. Personality and Individual Differences, 13, 921-930.
Pratt, M. (1998). To be or not to be: Central questions in organisational identification. In D.
Whetten & P. Godfrey (Eds.). Identity in organisations: Building theory through
conversations, 107-142. Thousand Oaks, CA: Sage.
Reinartz, W., Krafft, M., & Hoyer, W. D. (2004). The customer relationship management
process: Its measurement and impact on performance. Journal of Marketing
Research, 41(3), 293-305.
Rhoades, L., Eiesenberg, R., & Armeli, S. (2001). Affective commitment to the
organisation: The contribution of perceived organisational support. Journal of
Applied Psychology, 86, 825-826.
124 Riggs, M. L., & Knight, P. A. (1994). The impact of perceived group success-failure on
motivational beliefs and attitudes: A causal model. Journal of Applied Psychology,
79, 755-766.
Roberts, D. R., & Davenport, T. O. (2002). Job engagement: Why it’s important to improve
it. Employment Relations Today, 21-29.
Rothbard, N. P. (2001). Enriching or depleting? The dynamics of engagement in work and
family roles. Administrative Science Quarterly, 46, 655-684.
Ryan, R. M., & Deci, E. L. (2000). Self-determination theory and the facilitation of intrinsic
motivation, social development, and well-being. American Psychologist, 55, 68-78.
Ryan, R. M., & Deci, E. L. (2003). On assimilating identities to the self: A self-determination
theory perspective on internalization and integrity within cultures. In M. R. Leary & J.
P. Tangney (Eds.), Handbook of self and identity, 253-272. New York: Guilford.
Ryan, R. M., & Frederick, C. (1997). On energy, personality, and health: subjective vitality
as a dynamic reflection of well-being. Journal of Personality, 65, 529-565.
Salanova, M., Brescó, E., & Schaufeli, W. B. (2003). Towards a spiral model of self-efficacy
in the study of burnout and engagement. Submitted for publication.
Salanova, M., Carrero, V., Pinanzo, D., & Schaufeli, W. B. (2003). Job characteristics and
proactive behaviour: The mediating role of job engagement. Submitted for
publication.
Salanova, M., Grau, R., Llorens, S., & Schaufeli, W. B. (2001). Exposure to information
technology, burnout and engagement: about the role of professional self-efficacy.
Psicología Social Aplicada, 11, 69-89.
125 Salanova, M., Schaufeli, W. B., Llorens, S., Pieró, J. M., & Grau, R. (2001). From burnout
to engagement: A new perspective. Revista de Psicología del Trabajo y de las
Organizaciones, 16, 117-134.
Salkind, N.J. (2007). Encyclopedia of Measurement and Statistics. Thousand Oaks, CA:
Sage.
Satorra, A., & Bentler, P. M. (2001). A scaled difference chi-square test statistic for moment
structure analysis. Psychometrika, 66, 507-514.
Schaubroeck, J., & Merritt, D. E. (1997). Divergent effects of job control on coping with
work stressors: The key role of self-efficacy. Academy of Management Journal, 40,
738-754.
Schaufeli, W. B., & Bakker, A. B. (2001). Work and wellbeing: Towards a positive
occupational health psychology, Gedrag en Organizatie, 14, 229-253.
Schaufeli, W. B., & Bakker, A. B. (2003). The Utrecht Work Engagement Scale. Preliminary
Manual – Version1: Occupational Health Psychology Unit, Utrecht University.
Schaufeli, W. B., & Bakker, A. B. (2004). Job demands, job resources and their relationship
with burnout and engagement: A multi-sample study. Journal of Organisational
Behaviour, 25, 293-315.
Schaufeli, W. B., Martinez, I., Marques Pinto, A., Salanova, M., & Bakker, A. B. (2002b).
Burnout and engagement in university students: Across national study. Journal of
Cross-Cultural Psychology, 33, 464-481.
Schaufeli, W. B., Salanova, M., Gonzalez-Roma, V., & Bakker, A. B. (2002a). The
measurement of engagement and burnout and: A confirmative analytic approach.
Journal of Happiness Studies, 3, 71-92.
126 Schaufeli, W. B., Taris, T. W., & Van Rhenen, W. (2003). Workaholism, burnout and
engagement: Three of a kind or three different kinds of employee well-being?
Submitted for publication.
Scheier, M. F., & Carver, C. S. (1985). Optimism, coping and health: Assessment and
implications of generalised outcome expectancies. Health Psychology, 4, 219-247.
Scheier, M. F., & Carver, C. S. (1992). Effects of optimism on psychological and physical
well-being: Theoretical overview and empirical update. Cognitive Therapy and
Research, 16, 210-228.
Scheier, M. F., Carver, C. S., & Bridges, M. W. (1994). Distinguishing optimism from
neuroticism (and Trait anxiety, self-mastery, and self-esteem): A re-evaluation of the
Life Orientation Test. Journal of Personality and Social Psychology, 67, 1063-1078.
Schneider, S. L. (2001). In search of realistic optimism. Meaning, knowledge, and warm
fuzziness. American Psychologist, 56, 250-263.
Schulman, M. (1999). Applying learned optimism to increase sales productivity. Journal of
Personal Selling & Sales Management, 19, 1, 31-37.
Schulman, M. (2002). How we become moral. In Snyder, C. R., & Lopez, S. J. (Eds.),
Handbook of positive psychology (pp 499-512). Oxford, UK: Oxford University
Press.
Schwarzer, R. (1992). Self-efficacy in the adoption and maintenance of health behaviours:
Theoretical approaches and a new model. In R Schwarzer (Ed.), Self-efficacy:
Thought control on action (pp 217-243). Washington, DC: Hemisphere.
Schwarzer, R., & Jerusalem, M. (Eds.). (1999). Scales for the assessment of teacher and
student characteristics. Berlin, Germany: Freie Universität Berlin.
127 Schwarzer, R., Schmitz, G. S., & Tang, C. (2000). Teacher burnout in Hong Kong and
Germany: A cross-cultural validation of the Maslach Burnout Inventory. Anxiety,
Stress, and Coping, 13, 309-326.
Seeman, M. (1972). Alienation and engagement. In Campbell, A., & Converce, P. E. (eds).
The Human Meaning of Social Change, 467-527. New York: Russell Sage
Foundation.
Seligman, M. E. P. (1990). Learned optimism. New York: Pocket Books.
Seligman, M. E. P., & Csikentmihalyi, M. (2000). Positive psychology. American
Psychologist, 55, 5-14.
Seligman, M. E. P. (2002). Authentic happiness. New York: Free Press.
Shamir, B., & Eilam, G. (2005). “What’s your story?” A life-stories approach to authentic
leadership development. The Leadership Quarterly, 16, 395-417.
Sherer, M., Maddux, J. E., Mercandante, B., Prentice-Dunn, S., Jacobs, B., & Rogers, R.
W. (1982). The Self-efficacy Scale: Construction and validation. Psychological
Reports, 51, 663-671.
Shimazu, A., Schaufeli, W. W., Kosugi, S., Suzuki, A., Nashiwa, H., Kato, A., Sakamoto,
M., Irimajiri, H., Amano., Hirohata, K., & Goto, R. (2008). Work engagement in
Japan: Validation of the Japanese version of the Utrecht Work Engagement Scale.
Applied Psychology: An International Review, 57(3), 510-523.
Smith, J. A., & Foti, R. J. (1998). A pattern approach to the study of leader emergence.
Leadership Quarterly, 9, 147-160.
Snyder, C. R. (1994). The psychology of hope: You can get there from here. New York:
Free Press.
128 Snyder, C. R., & Lopez, S. J. (2002). Handbook of positive psychology. New York: Oxford
University Press, Inc.
Sonnetag, S. (2003). Recovery, work engagement, and proactive behaviour; a new look at
the interface between non-work and work. Journal of Applied Psychology, 88, 518-
528.
Sparrowe, R. (2005). Authentic leadership and the narrative self. The Leadership
Quarterly, 16 (3), 419-439.
Stajkovic, A. D., & Luthans, F. (1998a). Self-efficacy and work-related performance: A
meta-analysis. Psychological Bulletin, 124, 240-261.
Stajkovic, A. D., & Luthans, F. (1998b). Social cognitive theory and self-efficacy: Going
beyond traditional motivational and behavioural approaches. Organisational
dynamics, 26, 62-74.
Staw, B., & Barsade, S. (1993). Affect and managerial performance: A test of sadder-but-
wiser vs happier-and-smarter hypotheses. Administrative Science Quarterly, 38,
304-331.
Tabachnick, B. G., & Fidell, L. S. (2001). Using multivariate statistics (4th ed.). Needham
Heights, MA: Allyn & Bacon.
Taylor, S. E., & Armor, D. A. (1996). Positive illusions and coping with adversity. Journal of
Personality , 64, 873-898.
Terez, T. (2007). Facilitating humanity one workplace at a time. A working paper from
Tom Terez Solutions, Inc. Retrieved July, 13, 2007, from
http://www.betterworkplacenow.com
129 Thomas, K., & Velthouse, B. A. (1990). Cognitive elements of empowerment: an
interpretive model of intrinsic task motivation. Academy of Management Review, 16,
666-681.
Towers-Perrin, T. (2003). Working today: Understanding what drives employee
engagement. Stamford. CT: Author.
Tredoux, C., & Durrheim, K. (2002). Numbers, Hypotheses and Conclusions: A Course in
Statistics for the Social Sciences. Lansdowne: UCT Press.
Walumbwa, F. O., Avolio, B. J., Gardner, W. L., Wernsing, T. S., & Peterson, S. J. (2008).
Authentic Leadership: Development and validation of a theory-based measure.
Journal of Management, 34(1), 89-126.
Walumbwa, F. O., & Lawler, J. J. (2003). Building effective organisations:
Transformational leadership, collectivist orientation, work-related attitudes, and
withdrawal behaviours in three emerging economies. International Journal of
Human Resources Management, 14, 1083-1101.
Walumbwa, F. O., Lawler, J. J., Avolio, B. J., Wang, P., & Shi, K. (2005). Transformational
leadership and work related attitudes. The moderating effects of collective and self-
efficacy across cultures. Journal of Leadership and Organisational Studies, 11, 2-
16.
Wellins, R., & Concelman, J. (2005a). Creating a culture for engagement. Workforce
performance solutions. Retrieved July 19, 2005, from
http://www.ddiworld.com/pdf/wps_engagement
Wold, H. O. (1974). Causal flows with latent variables: Partings of the ways in the light of
NIPALS modeling. European Economic Review, 5 (1), 67-86.
130 Wold, H. O. (1982). Soft modeling: the basic design and some extensions. In: K. G.
Jörgeskog & H. O. Wold (Eds), Systems under indirect observations, Part 11 (pp.1-
54). Amsterdam: North-Holland.
Wold, H. O. (1985). Partial least squares. In S. Kotz & N. L. Johnson (Eds), Encyclopedia
of Statistical Sciences (Vol.6, pp.581-591). New York, NY: Wiley.
Wrosch, C., & Scheier, M. F. (2003). Personality and quality of life: The importance of
optimism and goal adjustment. Quality of Life Research, 12 (1), 59-72.
Yalokwu, P. (2008). Authentic leadership and spiritual capital development: Agenda for
building quality management and successful organisations. Management Today,
42-46.
Yammarino, F. J., Dione, S. D., Schriesheim, C. A., & Dansereau, F. (2008). Authentic
leadership and positive organisational behaviour: A meso, multi-level perspective.
The Leadership Quarterly, 19, 693-707.
Youssef, C. M., & Luthans, F. (2005). Resiliency development of organisations, leaders
and employees: Multi-level theory building for sustained performance. In W. L.
Gardner, B. J. Avolio & F. O. Walumbwa (Eds.), Authentic leadership theory and
practice: Origins, effects and development. Oxford, UK: Elsevier Science.
Youssef, C.M., & Luthans, F. (2007). Positive organisational behaviour in the workplace:
The impact of hope, optimism, and resiliency. Journal of Management, 33, 774-800.
Yukl, G. (2002). Leadership in organisations. Upper Saddle River, NJ: Prentice Hall.
Zaheer, A., McEvily, B., & Perrone, V. (1998). Does trust matter? Exploring the effects of
inter-organisational and interpersonal trust on performance. Organisation Science,
9, 141-159.
Zatz, D. (2000). Create Effective E-mail Surveys. HR Magazine, 45, 97.