The Phoenix Summary Budget 2011-12 draft Budget Book... · Finance Director Kim Dorney Housing...
218
The Phoenix Summary Budget 2011-12
Transcript of The Phoenix Summary Budget 2011-12 draft Budget Book... · Finance Director Kim Dorney Housing...
The Phoenix Summary Budget
2011-12

ii
P r i n t e d o n R e c y c l e d P a p e r
300
J u n e 2 0 1 1

Mayor Phil Gordon602-262-7111
Thelda Williams602-262-7444
Bryan Jeffries602-262-7445
Claude Mattox602-262-7446
Tom Simplot602-262-7447
Michael Nowakowski602-262-7492
Michael Johnson602-262-7493
Sal DiCiccio602-262-7491
May 2011
Bill Gates602-262-7441
City of PhoenixCouncil Members
and District Boundaries
iii

iv
Mayor and City Council
Phil GordonMayor
Thelda WilliamsVice MayorDistrict 1
Bryan JeffriesDistrict 2
Bill GatesDistrict 3
Tom SimplotDistrict 4
Claude MattoxDistrict 5
Sal DiCiccioDistrict 6
Michael NowakowskiDistrict 7
Michael JohnsonDistrict 8
Mayor’s Office
Bill ScheelMayor Co-Chief of Staff
Marchelle FranklinMayor Co-Chief of Staff
City Council Office
Penny ParrellaCouncil Chief of Staff
Management Staff
David CavazosCity Manager
Ed ZuercherAssistant City Manager
David KrietorDeputy City Manager
Jerome MillerDeputy City Manager
Rick NaimarkDeputy City Manager
Jane MorrisExecutive Assistant to the City Manager
Lisa TakataExecutive Assistant to theCity Manager
Karen PetersGovernment Relations Director
Department Heads
Wylie BearupStreet Transportation Director
Paul BlueCommunity and Economic DevelopmentDirector
Carolyn BristoActing Public Works Director
James BurkeActing Parks and Recreation Director
John ChanPhoenix Convention Center Director
Debbie CottonPublic Transit Director
Jeff DeWittFinance Director
Kim DorneyHousing Director
Moises GallegosActing Human Services Director
Toni GarveyCity Librarian
Bill GreeneActing City Auditor
Chris HallettActing Neighborhood Services Director
Robert KhanFire Chief
Lionel LyonsEqual Opportunity Director
Toni MaccaronePublic Information Director
Neil MannActing Water Services Director
Cris MeyerActing City Clerk
Danny MurphyAviation Director
Mario PaniaguaBudget and Research Director
Janet SmithHuman Resources Director
Debra StarkPlanning and Development Director
Charles T. Thompson, Sr.Chief Information Officer
Gary VerburgCity Attorney
Joe YahnerActing Police Chief
Chief Presiding Judge
Roxanne K. Song Ong
City of Phoenix
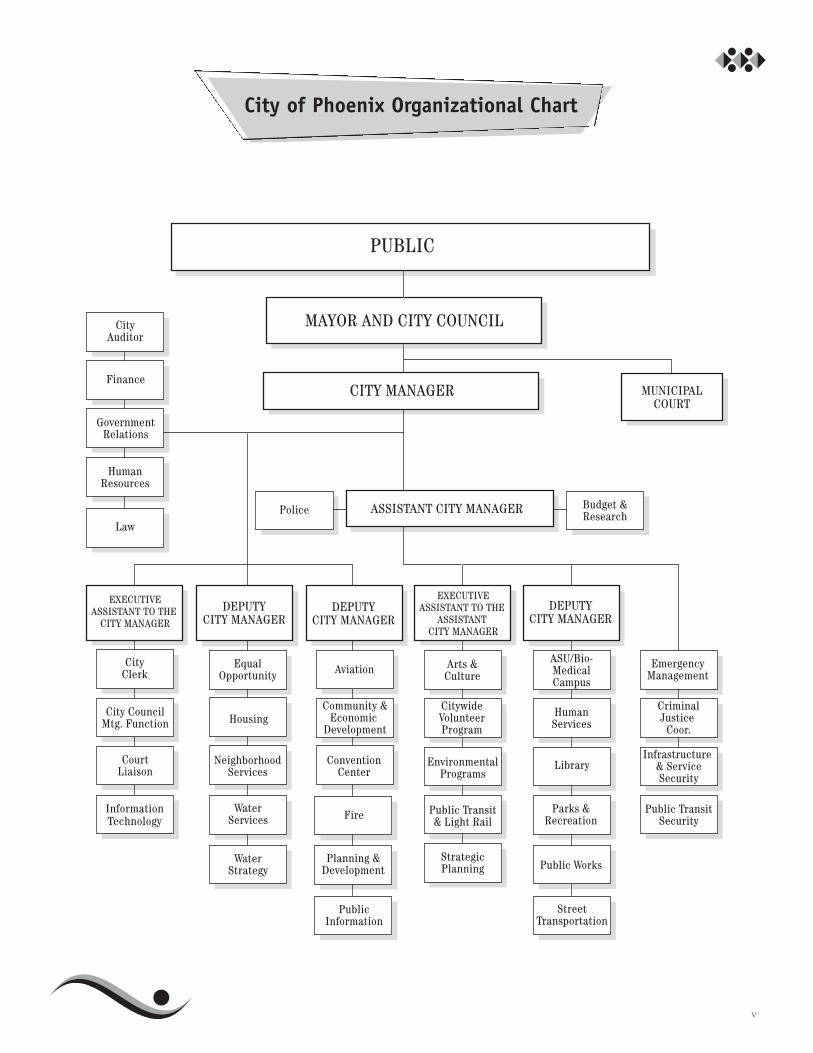
City of Phoenix Organizational Chart
v
PUBLIC
CITY MANAGER
MAYOR AND CITY COUNCIL
DEPUTYCITY MANAGER
Parks &Recreation
Public Works
StreetTransportation
HumanServices
ASU/Bio-MedicalCampus
DEPUTYCITY MANAGER
DEPUTYCITY MANAGER
CityClerk Aviation
InformationTechnology
Infrastructure & ServiceSecurity
Public TransitSecurity
LibraryCourtLiaison
EmergencyManagement
CriminalJustice
Coor.
MUNICIPALCOURT
EXECUTIVEASSISTANT TO THE
CITY MANAGER
Arts &Culture
Budget &ResearchPolice
CitywideVolunteerProgram
EnvironmentalPrograms
Public Transit& Light Rail
StrategicPlanning
WaterServices
WaterStrategy
NeighborhoodServices
EqualOpportunity
Housing
Planning &Development
Community &Economic
Development
ConventionCenter
Fire
PublicInformation
City CouncilMtg. Function
CityAuditor
HumanResources
Law
GovernmentRelations
Finance
ASSISTANT CITY MANAGER
EXECUTIVEASSISTANT TO THE
ASSISTANTCITY MANAGER

vi

2011-12 Summary Budget Table of Contents
vii
BUDGET DOCUMENT OVERVIEW ..................................................1
DISTINGUISHED BUDGET PRESENTATION AWARD .................3
CITY MANAGER’S BUDGET MESSAGE...........................................5
STRATEGIC PLANNING AND COMMUNITY INVOLVEMENT.....................................................9
PHOENIX STRATEGIC PLAN ...........................................................11
OUR COMMITMENT TO EXCELLENCE ........................................25
COMMUNITY PROFILE AND TRENDS .........................................33
BUDGET OVERVIEW
Resource and Expenditure Summary.................................................37
Financial Organization Chart – Operating Budget...........................42
Services to the Community..................................................................45
Budget Process, Council Review and Input, Public Hearings
and Budget Adoption .........................................................................61
General Budget and Financial Policies..............................................65
REVENUE OVERVIEW
Revenue Estimates ...............................................................................73
General Funds.......................................................................................75
Special Revenue Funds........................................................................85
Enterprise Funds ..................................................................................89
DEPARTMENT PROGRAM SUMMARIES
General Government
Mayor......................................................................................................93
City Council ...........................................................................................94
City Manager .........................................................................................95
Regional Wireless Cooperative (RWC) ..............................................95
Government Relations..........................................................................96
Public Information................................................................................96
City Auditor ...........................................................................................97
Equal Opportunity ................................................................................98
Human Resources.................................................................................99
Phoenix Employment Relations Board.............................................100
Retirement Systems............................................................................100
Law .......................................................................................................101
Information Technology .....................................................................102
City Clerk and Elections ....................................................................103
Finance ................................................................................................104
Budget and Research .........................................................................105
Public Safety
Police....................................................................................................107
Fire .......................................................................................................110
Emergency Management....................................................................112
Criminal Justice
Municipal Court ..................................................................................115
Public Defender ..................................................................................117
Transportation
Street Transportation.........................................................................119
Aviation ................................................................................................121
Public Transit ......................................................................................123
Community Development
Planning and Development ...............................................................127
Housing ................................................................................................129
Community and Economic Development.........................................130
Neighborhood Services.......................................................................131
Community Enrichment
Parks and Recreation .........................................................................135
Library..................................................................................................137
Golf .......................................................................................................139
Phoenix Convention Center...............................................................140
Human Services ..................................................................................142
Phoenix Office of Arts and Culture...................................................144
Environmental Services
Water Services.....................................................................................147
Solid Waste Management...................................................................150
Public Works........................................................................................152
Environmental Programs ...................................................................154

viii
Contingencies .....................................................................................155
Debt Service........................................................................................157
CAPITAL IMPROVEMENT PROGRAM
Overview of Capital Improvement Program Process ......................161
2011-16 Capital Improvement Program Highlights ........................167
Financial Organization Chart –
2011-12 Capital Improvement Program .....................................179
Operating Costs for New Capital Facilities......................................181
SUMMARY SCHEDULES
1. Resources and Expenditures by Fund
2009-10 Actual...........................................................................187
2010-11 Estimate ......................................................................188
2011-12 Budget .........................................................................189
2. Revenues by Major Source .....................................................190
3. Expenditures by Department .................................................192
4. Expenditures by Department by Source of Funds
including Budget Changes......................................................194
5. Debt Service Expenditures by Program, Source of Funds
and Type of Expenditure ........................................................196
6. Capital Improvement Program Financed From
Operating Funds ......................................................................198
7. Net Interfund Transfers to the General Fund......................200
8. Positions by Department ........................................................202
GLOSSARY..........................................................................................205

ix

x
This overview outlines the 2011-12 AnnualBudget. Copies of the document areavailable by contacting the city of PhoenixBudget and Research Department at 602-262-4800. Also, this document can be madeavailable in alternate formats (large print,Braille, audio cassette or compact disc)upon request. For information, contact theBudget and Research Department or cityTTY relay at 602-534-5500.
The Summary Budget contains anarrative description of Phoenix programsand services planned for the upcomingfiscal year. Also included is a narrativedescription of all revenue sources and adescription of major financial policies.
The Detail Budget presents extensivestatistical data (including multiyearcomparisons) for each city departmentand fund. The statistical data includesstaffing allocations and a detailedreporting of planned expenditures.
Finally, the 2011-16 CapitalImprovement Program provides Phoenix’splanned construction program by projectand detailed sources of funds.
A more detailed description of the2011-12 Phoenix Summary Budget follows.
CITY MANAGER’S BUDGET MESSAGE
The City Manager’s Budget Messageprovides an in-depth look at the citymanager’s priorities and outlook for theupcoming fiscal year. These prioritiesreflect many months of working with theMayor and City Council, the communityand city staff.
STRATEGIC PLANNING ANDCOMMUNITY INVOLVEMENT
This section describes the city’s process toupdate its Strategic Plan, an essentialelement to guiding the future of Phoenixand in making important budget decisionsto allocate limited resources. The planincorporates community input and coversten priority areas for Phoenix.
PHOENIX STRATEGIC PLAN
This section provides the updated PhoenixStrategic Plan.
OUR COMMITMENT TO EXCELLENCE
This section provides an overview of thecity’s various programs that contribute toour overall pursuit of excellence. Includedis a description of a few of the awards andrecognitions received by employees thisyear, results of the employee suggestionprogram and winners of EmployeeExcellence Awards.
COMMUNITY PROFILE AND TRENDS
This section includes key demographic,financial and infrastructure profilemeasures. Estimates or projections areprovided for 2010-11 and 2011-12 as well asactual results for recent and historicalperiods.
2011-12 BUDGET OVERVIEW
The Budget Overview provides adescription of the city’s budget process aswell as the major assumptions included inthe preparation of the 2011-12 CityManager’s budget. This section includes abroad overview of the resources andexpenditures included in the budget. Alsoincluded is a historical look at Phoenix’scommunity services, anoverview of significant budgetary andfinancial policies including general legalrequirements and basis of accounting, anddescriptions of city funds.
2011-12 REVENUE OVERVIEW
This section provides an extensivenarrative describing the city’s revenueestimates and is divided into threecategories: general funds, special revenuefunds and enterprise funds.
DEPARTMENT PROGRAM SUMMARIES
The Department Program Summariessection provides total funding andpositions, program goals, majorperformance measures and service trends,and any changes in service for each citydepartment. Also included in this sectionis a discussion of the city’s debtmanagement policies and the contingencyfund.
CAPITAL IMPROVEMENT PROGRAM
This section provides a description of thecapital improvement program process andan overview of the 2011-16 CapitalImprovement Program.
SCHEDULES
The schedules provide a generalbreakdown of the budget. Schedule 1provides estimated beginning and endingbalances for each major fund group. Theremaining schedules summarize staffingcomplements and estimated resources andexpenditures.
GLOSSARY
Definitions of the terms used throughoutthe budget document are presented in theglossary.
If you have questions, need furtherclarification of a concept or term, or desiremore detailed information about thisdocument, please contact the Budget andResearch Department at 602-262-4800.
Budget Document Overview
1

2
Distinguished Budget Presentation Award
3
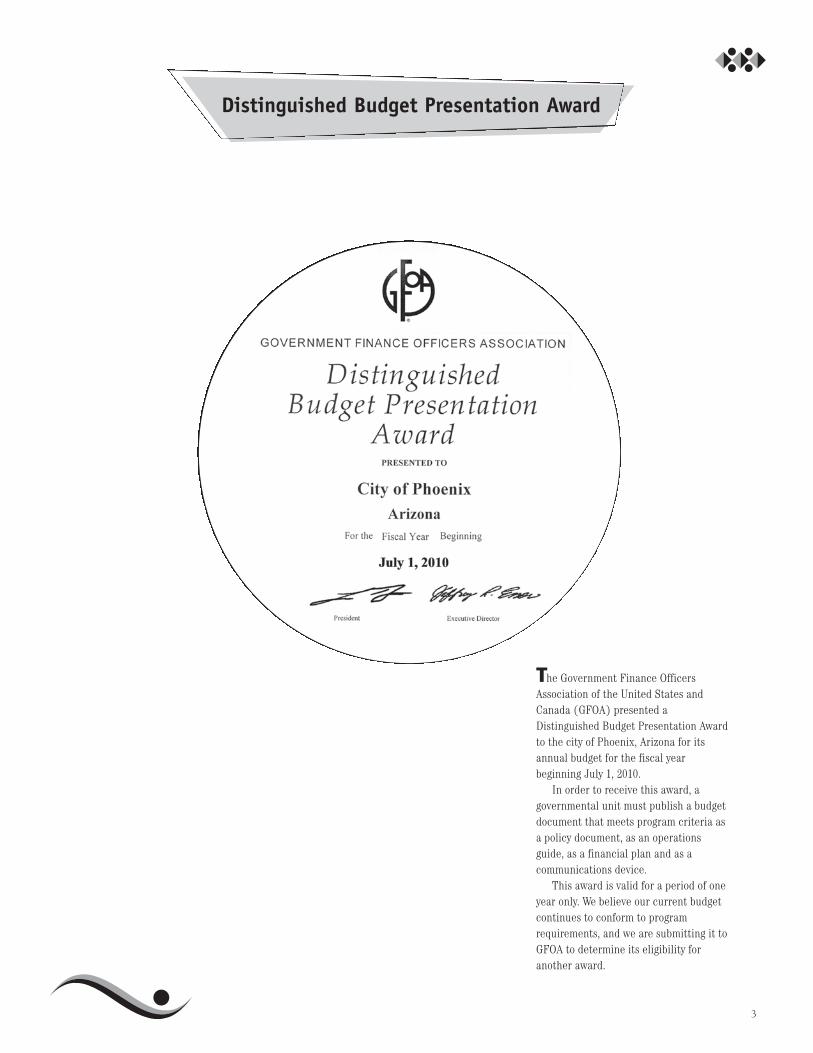
The Government Finance OfficersAssociation of the United States andCanada (GFOA) presented aDistinguished Budget Presentation Awardto the city of Phoenix, Arizona for itsannual budget for the fiscal yearbeginning July 1, 2010.
In order to receive this award, agovernmental unit must publish a budgetdocument that meets program criteria asa policy document, as an operationsguide, as a financial plan and as acommunications device.
This award is valid for a period of oneyear only. We believe our current budgetcontinues to conform to programrequirements, and we are submitting it toGFOA to determine its eligibility foranother award.

4
TO THE HONORABLE MAYOR ANDCITY COUNCIL:
This letter transmits the fiscal year 2011-12 balanced city of Phoenix budgetrequired by City Charter.
Early projections for the 2011-12budget indicated a deficit between $50-80million, based primarily on expecteddeclines in state-shared revenues. Theexpected declines were due to ananticipated decrease in Phoenix’spopulation share following Census 2010,and a known decrease in state-sharedincome tax collections, which lag for thecity by two years. The 2011-12 budgetdeficit ended up at $59 million, which wasat the lower end of the projected rangeand demonstrates a significant turnaroundfrom last year’s $277 million deficit.Addressing last year’s General Fund deficitrequired reliance on financial transactions,a renewed commitment to innovation andefficiency, elimination of the city’sexemption on the taxing of food for homeconsumption, employee pay reductions,significant cuts to services, and othertemporary measures. This year, however,due to an improving economy and, moreimportantly, the effective and responsibleactions taken by the Mayor and CityCouncil, city management, and city staff,costs have been managed successfully. For
the first time in three years, the city wasable to follow its regular budget schedule.And along with the input and prioritiesexpressed by the community at 15 budgethearings, by phone and through e-mail,this much improved budget situation canbe attributed to seven important pillars offiscal strength:
1. Strong employee relations andemployee sacrifices
2. Doing more with less3. Accurate estimates and enhanced
compliance4. Focus on innovation and efficiency5. Responsible financial management6. Keeping Public Safety our number
one priority7. Reduced tax collections in adverse
times
These seven factors, described in moredetail below, are the reasons why theGeneral Fund deficit was kept to amanageable $59 million. They also providethe foundation and framework from whichthe shortfall was directly eliminated.
ADDRESSING THE GENERAL FUNDBUDGET SHORTFALL
The city is slowly and modestly pulling outof the severe economic recession thatbegan in December 2007. However, the$59 million General Fund revenue shortfallillustrates that some revenue challengesstill impact the city’s budget. One categorythat will decline as expected in 2011-12 isstate-shared income tax. Because it iscollected two years in arrears, this portionof revenue reflects taxes collected whilethe recession was at its worst for the state.Also, all state-shared revenues arenegatively impacted by the results ofCensus 2010, showing Phoenix again grewat a slower rate than other Arizona cities.However, annual sales tax revenue growthwas positive in 2010-11 for the first time infour years and remained on track with cityestimates throughout the year. Positivesales tax growth is forecasted to continueat a moderate pace throughout 2011-12.
In 2010-11 budget review processes, the$59 million shortfall was reduced by $20million in departmental cost-cuttingmeasures and efficiencies through thecontinued use of innovation. Staffthroughout the city worked very hard toidentify and implement ways to reduceexpenses beyond what had already beencut out of the budget.
The shortfall was further reduced bytaking advantage of the city’s AAA bondrating and low market interest rates; atleast $30 million in savings results fromprudent debt restructuring. Additionally,the use of $5 million in previouslyauthorized lease-purchase financing alsodirectly reduces the shortfall.
The remaining $4 million comes fromGeneral Fund budget reductions. Thesereductions result in no direct impact toservices delivered to the community.
SEVEN PILLARS OF FISCALSTRENGTH
1) Strong Employee Relations andEmployee Sacrifices
The city of Phoenix’s success is basedchiefly on its dedicated employees;illustrated daily as staff dependably,professionally and efficiently provides highquality services resulting in outstandingresident ratings. In the 2010 CommunityAttitude Survey of Phoenix residents, 95percent of residents indicated they weretreated professionally and courteously bycity employees, the highest the rating hasever been. Our employees are animportant piece of the city’s ability to keepoperating costs manageable and optimizethe use of limited resources. Executivesand middle managers led the way byvoluntarily reducing their totalcompensation by 6.9 percent in 2010-11and 2011-12. All other city employees alsoagreed to compensation concessions,taking several furlough days and othersacrifices totaling 3.2 percent during 2010-11 and 2011-12. The concessions result ina total savings of $104.4 million for allfunds over the two years, with savings of$52.2 million reflected in the fiscal year2011-12 budget.
City Manager’s Budget Message
5
2) Doing More With LessThis year, the city manager initiatedorganizational reviews in all departments,resulting in streamlined structures andincreased spans of control. Also, theelimination of vacant positions resultingfrom a hiring freeze in place since January2008 contributed heavily to the reductionof authorized full-time equivalent (FTE)positions. More than 600 vacant positionswere eliminated in 2010-11. As a result ofboth lower compensation costs andreduced positions, the 2011-12 deficit wasmuch less than it otherwise would havebeen.
The 2011-12 budget eliminates 35.2FTE in the General Fund. It also includesthe addition of 23.8 new FTE to operatenew capital facilities, including the SouthMountain Community Library, Helen DrakeSenior Center and other new capitalfacilities. The Library Department isadding 0.3 FTE for part-time staffing in theBurton Barr Library Accessibility Center.The Aviation Department is adding 11.0FTE which will save approximately$385,000 by replacing existing contractedservices. Water Services is eliminating oneposition as a result of the consolidation ofdowntown Phoenix cashiering services.With these changes, the city remains at10.4 employees per 1,000 residents for2011-12, the lowest it has been in nearly 40years.
Because the city returned to a normalbudget schedule this year, Budget andResearch was able to partner withdepartments in conducting two rounds ofdetailed operating budget reviews. As aresult, staff identified valuable savings ofover $15 million. Similarly, technicalreviews were performed duringpreparation of the Preliminary 5-YearCapital Improvement Program, resulting inan additional $5 million in savings. Thesecombined actions directly reduced the $59million deficit by $20 million.
3) Enhanced Compliance and AccurateEstimates
Another important feature of the city’sbudget strength has been the accuracy ofrevenue projections. The 2010-11 GeneralFund budget was based on an estimated1.1 percent total revenue growth, andactual growth level was right on target.That same forecasting accuracy wasillustrated in projections of how Census2010 would impact Phoenix. Despitehighly unusual population dynamics, staffprojected the census would result in areduction of Phoenix’s state populationshare of incorporated cities from 30.3percent to 28.7 percent. The actual resultwas 28.78 percent.
Additionally, the city’s revenue outlookis reaping the benefits of an enhancedemphasis on compliance regardingpayment of taxes, fines and fees, ensuringthe General Fund receives what is owed.An Enhanced Compliance Initiative Teamwas assembled to optimize the use oftechnology in tax enforcement andimprove long-term compliance withcollections owed to the city.
4) Focus on Innovation and EfficiencyBased on the leadership of the Mayor andCity Council, city management and theInnovation and Efficiency Task Force, amindset of innovation and efficiency isstrongly reinforced within the city’sorganizational culture. The Task Forceincludes several private-sector members,and within its first year spurred manyimprovements resulting in a total savingsof over $25 million dollars, with $10.6million to the General Fund. Much ofthese savings are recurring and will resultin over $125 million saved over five years.The Task Force has begun Phase II and isexploring innovations in the followingseven areas: Communications,Compensation and Benefits, CustomerService, Fines and Fees, Right-Sourcing,Regulatory Review and Technology andContinuous Improvement.
5) Responsible Financial ManagementThe fifth pillar of maintaining a balancedbudget is the Finance Department’sexcellent management of debt,investments, revenue collection and othervital aspects of financial administration.This fiscal performance is widelyrecognized and reflected in uncommonlyhigh municipal bond ratings. Asmentioned previously, measures takingadvantage of lower than anticipatedinterest rates and the city’s top AAA bondrating to refinance bonds are an importantcomponent of this budget. Through therestructuring of existing debt approved bythe City Council on April 6, 2011, the citywill realize $30-$45 million dollars insavings in 2010-11 and 2011-12. The otherfinancial component is the use ofapproximately $5 million in lease-purchasefinancing of replacement vehiclespreviously authorized by the Council.These actions directly contribute to theelimination of the 2011-12 deficit by $35million.
In the 2009-10 budget cycle, financialtransactions totaled $114 million, and inthe 2010-11 budget cycle, usage wasdecreased to $92 million. For 2011-12, thecombined amount of debt refinancing andlease-purchase financing is a conservative$35 million, only 37 percent of the amountapproved by Council the previous year.Further, the planned increase to theContingency Fund continues in 2011-12with an additional $3 million programmedabove last year’s 3.1 percent level. Thisprogresses the city along the pathway ofbringing the Contingency Fund to 5percent over time.
6
6) Keeping Public Safety Our NumberOne Priority
The city of Phoenix’s top priority is toprotect the community’s public safety. Theproportion of the 2011-12 General Fundbudget allocated to Police, Fire, MunicipalCourt, City Prosecutor and PublicDefender remains high at 70 percent. Aspart of this commitment, the 2011-12budget includes $6 million in ongoingfunding of 60 Police and Fire positions andcosts associated with the loss of schooldistrict funding for School ResourceOfficers that were only temporarilyauthorized through June 30, 2011.Additionally, $2 million in 2010-11 FireDepartment budget savings was set-asideto convert expiring grant-fundedfirefighter positions to General Fundpositions in 2011-12.
7) Reduced Tax Collections in AdverseTimes
Taxes that support the 2011-12 GeneralFund are down about $102 million since2007-08, an 11 percent decrease. In 2011-12, the average Phoenix homeowner’sproperty tax bill will drop 26 percent from2010-11, and will have dropped 42 percentcompared to 2008-09. For 2011-12, thetotal Phoenix property tax levy will be $98million less than the total levy in 2009-10.Additionally, the 2011-12 budget includesno new or increased user fees for existingGeneral Fund services.
OVERVIEW OF 2011-12 BUDGET
The city’s 2011-12 General Fund budget is$1,062,848,000. This is a 4.8 percentincrease from the adopted 2010-11 GeneralFund budget, and a 4.4 percent decreasefrom the adopted 2009-10 General Fundbudget.
The 2011-12 budget for all funds, whichincludes General, Enterprise and SpecialRevenue Funds such as grants, is$3,474,413,000. This is a 1.5 percentdecrease from the adopted 2010-11 budgetfor all funds, and an 5.4 percent decreasefrom the adopted 2009-10 budget for allfunds.
NON-GENERAL FUNDS
The 2011-12 budget includes changes tonon-General Funds. The AviationDepartment expects to net approximately$385,000 in savings by replacing contractedservices with city staff for capital projectmanagement, communications operationsand airfield maintenance. Also, the WaterServices Department’s implementation ofan Innovation and Efficiency Task Forcerecommendation to consolidate theirdowntown payment counter with theFinance Department’s Cashiering Services,results in the elimination of one position.Savings from the position elimination willpay for charges assessed by the FinanceCashiering Services operation.
STATE- SHARED REVENUES
It is important to acknowledge that theArizona Legislature did not negativelyimpact General Fund state-shared revenueformulas in addressing the state’s revenueshortfall for 2011-12. The adopted statebudget will impact Arizona Highway UserRevenue (AHUR) received by the city andwill assess a water resources fee to thecity. Phoenix will lose nearly $12 million ofits portion of AHUR in 2011-12, negativelyimpacting local street maintenance. Thewater resources fee will cost city watercustomers about $2 million per yearbeginning in 2011-12.
CONCLUSION
The 2011-12 budget process represents avery positive step forward for the city ofPhoenix, which is slowly recovering fromthe difficult recession of recent years. In2011-12, the budget outlook remainspositive, and the city persists in makingneeded improvements and advancingtoward an outstanding future.
I want to thank the Mayor and CityCouncil for their leadership and guidancein balancing the city budget. I also want tothank city departments for diligentlymonitoring expenses and findinginnovative ways to operate more efficiently.Finally, I want to thank all city employeesfor their continued dedication todelivering high quality services to thecommunity.
7
David CavazosCity Manager
May 10, 2011

8

In late November 2010, the city of Phoenixbegan the process of updating the 1990Phoenix Strategic Plan and missionstatement for the city. The new PhoenixStrategic Plan will guide decision-makingwithin the organization and focus the city’sefforts on delivering core services thatmeet the city’s new mission statement: “Toimprove the quality of life in Phoenixthrough efficient delivery of outstandingpublic services.” The plan will be updatedannually and also serve as an importantrole in communicating and setting thecity’s budget priorities.
The draft plan and mission statementwere developed by a team of 50 peopleworking in 10 study-area committees. Theteam consisted of city staff and membersof the private sector. Each committeeconsisted of two “city champions,” two“champions” from the public, and one staffassistant. The 10 study areas are:Economic Development and Education;Financial Excellence; Infrastructure;Innovation and Efficiency; Neighborhoodsand Livability; Phoenix Team; PublicSafety; Social Services Delivery;Sustainability; and Technology.
During the planning process, teammembers met with other city staff,researched existing public documents, andsought input from external partners. Eachteam’s draft study-area goals werereviewed and revised through two WorkStudy sessions of the Phoenix City Councilin late January and early February of thisyear.
During the month of April 2011, theCity Manager’s Office held 15 StrategicPlan outreach meetings as a part of thecommunity budget hearing process.During these sessions, staff presented anoverview of the draft plan and receivedpublic comment that will be incorporatedinto the final plan.
At least as important as thedevelopment of the Phoenix Strategic Planare the necessary organizational systemschanges that ensure the plan's integrationinto all aspects of the city's resourceallocation processes. It is critical that theplan be the guiding framework withinwhich the city progresses toward acommon vision that reflects the prioritiesof the community, Mayor, City Council andcity staff. Clearly, this begins withadapting the city's budget processes,however, it also will involve integrationinto the practices of Human Resources,Finance, Information Technology andother core central functions. Research isunderway to analyze best practices for longand short term incorporation of the planwithin the organization, and the city willsolidify the changes needed to ensuresuccessful implementation of the StrategicPlan.
Strategic Planning and Community Involvement
9

10
About the Strategic Plan
To help guide decision-making at all levelsof the organization, and to focus the city’sefforts on its core businesses, it isimportant that the city of Phoenix developa strategic plan for the city. Throughoutthe budget cycle, a strategic plan provesbeneficial in communicating and settingbudget priorities. The priorities in thePhoenix Strategic Plan will assist inallocating limited resources. The plan willbe updated annually as part of the budgetcycle. The Phoenix Strategic Plan wascoordinated by a team in the CityManager’s Office. For more informationabout the Strategic Plan, please visitphoenix.gov/strategicplan or send an emailto [email protected].
Economic Development andEducation
A diverse, vibrant economy that provideseconomic opportunity for residents isessential to achieving the city’s aspirationsfor a high quality of life. Creating andpreserving jobs and enhancing our revenuebase are key objectives. Businesses,neighborhoods and individual residentsbenefit from the improved quality of lifethat the city’s economic developmentefforts create. The most important buildingblock of a strong economy is an educatedand productive workforce.
Priorities1. Create and retain high-quality jobs
focusing on key domestic andinternational business sectors. To agreat extent, the quality of life forPhoenix residents will be dependent onthe number and quality of jobs createdand retained that are convenient andappropriate for residents of the city ofPhoenix.
Strategiesa. Support the attraction of wealth-
generating, emerging technology,manufacturing, producer service,renewable energy and bio-scienceemployers to the city of Phoenix.
b. Support the retention and expansion ofkey wealth-generating employers.
c. Attract foreign direct investment fromaround the world.
d. Further develop the creation of a filmproduction industry as a key businesssector.
2. Foster an environment forentrepreneurial growth.Entrepreneurs make criticalcontributions to the economy, includingthe generation of new jobs. Energized,educated entrepreneurs createeconomic opportunity for others andenhance a culture of innovation.
Strategiesa. Facilitate the retention and expansion
of small- and medium-sized wealth-generating businesses, particularlybusinesses focused on innovation,technology, finance/business services,and bio-sciences.
b. Participate in regional collaboration toenhance entrepreneurial opportunities.
c. Support and grow diversity in Phoenixbusiness ownership.
d. Support initiatives that create andexpand venture capital funds.
3. Revitalize the urban areas ofPhoenix. Thriving urban cores arecritical to the economic health and wellbeing of the entire metropolitan area.Strong urban centers enhancePhoenix’s image and should bereflective of the city’s collective socialand economic aspirations as a region.
Strategiesa. Support development of the downtown
research and educational campuses.b. Promote residential and commercial
infill compatible with neighborhoods.c. Promote adaptive reuse of existing
structures.d. Enhance the city by redeveloping
brownfields.e. Comprehensively revitalize targeted
neighborhoods.f. Engage and collaborate in Discovery
Triangle.
4. Expand the city’s revenue base. Salestaxes provide the largest source of localgovernment funding. Phoenix needs toattract and retain a fair share of retailactivity to sustain quality publicservices for residents.
Strategiesa. Continue efforts to preserve and expand
the city’s retail sales tax revenue base.b. Attract new auto and other vehicle
dealerships and retain existing autocenters/corridors.
c. Market the Phoenix Convention Center.d. Promote and market the region to the
business and leisure traveler.e. Support professional/amateur/youth
sports, film, entertainment and specialevents, which generate tourismrevenue.
f. Encourage the revitalization of existingretail centers and neighborhood retailbusinesses.
Phoenix Strategic Plan
11
Mission Statement“To improve the quality of life in Phoenix through efficient delivery of outstanding public service”
5. Develop and retain qualified talentto meet the needs of business andthe community. A skilled workforce isessential for an economy to sustain andenhance its competitiveness. Aworkforce development strategy thatallows employers to grow and residentsto enhance their income is critical tomaintaining a high quality of life forPhoenix residents.
Strategiesa. Provide assistance to job seekers and
employers by focusing on high skill,technology and other key occupationareas.
b. Collaborate regionally with communitycolleges, universities and otherproviders to develop school and trainingcurriculum to develop skill sets fortargeted key business sectors.
c. Strengthen the relationship betweenthe public-sector workforce programsand the business community.
d. Coordinate and enhance economicdevelopment efforts with the educationcommunity by promoting quality STEMmodels within the K-12 system,including math and science careerpathway programs that provide realworld context.
e. Focus resources on enrichment andeducation programs through communitycenters and libraries.
f. Promote access to informationtechnology and provide Phoenixresidents with instruction and access toavailable resources.
6. Promote early literacy and prepareyoung children for academicsuccess. Early childhood developmentis critical in preparing youth forsuccess in school and developing afoundation of knowledge, skills and life-long learning in families and thecommunity.
Strategiesa. Promote the increased funding of early
childhood development, health andsocial service programs.
b. Collaborate with community resourcesto ensure all children have access topreventative and continuous healthcare, including physical, oral, mentaland nutritional health.
c. Support families with the informationand services they need to help theirchildren achieve academic success.
d. Partner with institutions of highereducation to train well-qualified earlychildhood teachers and care providers.
7. Commit to achieving educationalexcellence for all Phoenix residentsthrough sponsored facilities andprograms. The future success of theregion depends on ensuring thatresidents are prepared to meet thechallenges of the 21st Century aseducated, productive and engagedresidents.
Strategiesa. Partner with schools, after-school
providers, neighborhood organizations,businesses and other stakeholders tomaximize educational opportunities forPhoenix residents.
b. Leverage educational resources atPhoenix public libraries, includingaccess to information technology.
c. Promote sports, experiential learning,arts and other recreation programmingknown to improve learning outcomes.
d. Focus resources on quality youthengagement, enrichment and educationprograms through community centers,libraries and school-based, after-schoolprograms during out-of-school hours,when children are most at risk.
e. Increase access to, and success in,higher education through the CollegeDepot.
Financial Excellence
Financial excellence ensures the effectiveand efficient allocation of city resourcesfor the delivery of quality services toresidents. It creates trust and confidencethat city resources are used appropriately.At the core of financial excellence isintegrity and innovation. The PhoenixFinancial Excellence strategic plan strivesto maintain fiscally sound and sustainablefinancial plans and budgets that reflectcommunity values and residents’ priorities.
Priorities1. Maintain high bond ratings. A bond
rating is a measure of the credit qualityof the city. Factors considered in arating are the health of the localeconomy, stability and volatility ofrevenues, level of reserves for liquidityduring unexpected financial conditions,as well as sound financial practices,polices and structures or systems thatallow flexibility to address challenges.An entity that looks long term and hasplans to address unexpected changes ispositively considered. In essence a bondrating reflects an independent view offinancial excellence. In addition, ahigher bond rating will usually result ina lower borrowing cost.
Strategiesa. Implement a plan to achieve a general
fund budgetary fund balance of at least5 percent of total expenditures withinthe next five years to provide thenecessary liquidity to address revenuevolatility and unexpected expenses.
b. Develop a multi-year financial plan forthe general fund that maintains long-term bond ratings.
c. Develop and maintain financial policiesthat achieve high bond ratings.
d. Maximize current revenues by takingsteps to ensure collection of establishedtaxes, rates, fees and fines.
12

2. Develop capital and funding plansfor critical infrastructure. With thesignificant downturn in the state, localand national economy and theassociated impact on revenues, thefinancial capacity to fund and financeadditional capital projects has beensignificantly reduced. As a result, afocus on maintaining existinginfrastructure must be balanced withthe need for new infrastructure. Thisincludes prioritizing the use of theremaining 2006 general obligation (GO)bond capacity and other resources andinvestigating alternative methods tofinance priority capital needs.
Strategiesa. Establish a five-year capital planning
process that prioritizes the evaluationof existing facilities and infrastructure,for use of available funds and considersrepair and/or replacement.
b. Identify and evaluate alternativeapproaches to finance capitalinvestments as part of the capitaldecision-making process.
c. Prioritize the use of existing resources,for example remaining GO bond fundsand pay-as-you-go (cash) funding, toaddress the highest priority needs.
3. Provide accurate and reliablerevenue and expenditure forecasting.To ensure available resources areallocated to the highest priority needs,accurate and reliable forecasts of bothrevenues and expenditures are needed.This requires access to the necessaryresources and expertise to ensure allcritical factors are considered inrevenue forecasts and all factors thatimpact expenditures are consideredand modeled. Accuracy of expenditureforecasts also requires discipline of allcity departments to ensureexpenditures are monitored andmanaged. Without accurate forecastsand management of expenditures,reserve levels may be tapped belowcritical levels and services may beunnecessarily reduced.
Strategiesa. Establish a fiscally responsible revenue
forecast based on external and internalinputs and consistent with bestpractices to efficiently allocateresources.
b. Establish an expenditure forecast thataligns with the city’s strategic priorities.
c. Develop multi-year performancemeasures and benchmarks to monitorthe effectiveness of financial operations.
d. Develop multi-year forecasts thatcontemplate various economicscenarios that assist in the developmentof alternative planning strategies.
e. Develop structures and incentives toencourage and reward managers andemployees for maintaining discipline inmanaging expenditures.
4. Maintain a transparent financialenvironment, free of fraud, wasteand abuse. One of the most importantaspects of financial excellence is theability to assure the public, businesscommunity, investors and the ratingagencies that systems and processesare in place to prevent fraud, waste andabuse of public funds. An importantelement of preventing fraud, waste andabuse, is regular financial reports thatare easy to access, accurate andunderstandable. Financial excellencerequires the implementation of qualityfinancial systems, staff training,internal controls and regular internaland external audits to prevent fraud,waste and abuse.
Strategiesa. Maintain comprehensive and
continuous auditing of high-risk areas.b. Implement strong citywide policies and
practices that promote ethical behavior.c. Provide accurate financial information
on at least a quarterly basis that iseasily accessible and understandable tointernal and external audiences.
d. Continue to ensure all steps are takento receive financial excellence awardsfor budgeting and financial reportingfrom the Governmental and FinancialOfficers Association (GFOA) each year.
e. Highlight financial successes andeducate residents on the importance ofhigh-quality credit ratings, e.g. AAAbond ratings.
Infrastructure
Infrastructure is the basic physical andorganizational structure needed for theoperation of a society or enterprise and theservices and facilities necessary tofunction, such as roads, pedestrian andbicycle systems, water supply, sanitary andstorm sewers, public transit, airports,railroads, public buildings and facilities,solid waste collection, power supply, andtelecommunications.
Priorities1. Create and maintain intra-city
transportation. Provide safe, clean,efficient, sustainable, multi-modalsurface transportation systems tosupport mobility needs of present andfuture residents, businesses, andvisitors within the city of Phoenix.
Strategiesa. Plan, design, construct, and operate
new streets, pedestrian friendlysidewalks, bicycle lanes, hiking trails,bridges and drainage ways for newresidential and commercialdevelopment to reduce congestion,improve air quality, reuse materials,leverage new technology, encourageinfill development, create livableneighborhoods, and promote growth.Consider using modern street car andlight rail as surface transportationmodes to support and encourage newdevelopment.
b. Maintain existing streets and associatedassets in a state of good repair so theyare clean, safe, and aestheticallypleasing for all users. Invest resourcesand technology to extend the servicelife of existing infrastructure, protectthe city’s investment, and support ahigh quality-of-life standard.
c. Develop and maintain passenger andoperating facilities for a multi-modalregional transit system. Utilize soundmethodology and principles to locatefacilities to meet ridership demands andbus operations. Implement amaintenance and improvement planthat adequately addresses the needs offederally funded assets. Continue todesign and construct facilities that usesustainable design standards, areattractive, and provide an enhancedsense of security to encourage increaseduse of public transit.
13

d. Procure and maintain assets required tooperate the transit system. Coordinatewith local agencies to ensure transitinfrastructure will support transitoperations. Analyze routes to ensurethey will support ridership needs.
e. Coordinate, permit, and documentprivate utilities within city right-of-wayand easement areas to minimize initialroadway disruptions, reduce futureroadway cuts, maintain reasonableutility corridors for future growth,encourage future development, andminimize visual impact for residentsand businesses. Improve reliability andaccuracy of as-built documentationthrough new technology to increasesafety and reduce utility locating andrelocation costs.
f. Plan, design, develop, and maintain agreen infrastructure, such asinterconnected trail systems thatincrease shade canopy coverage andpromote pedestrian mobility, parks,preserves, tree and shade master plansand habitat restoration.
2. Establish and enhance inter-citytransportation. Provide safe, efficient,sustainable, cost-effective multi-modaltransportation systems to supporteconomic growth, population growth,and competitiveness throughconnectivity to regional, national, andglobal destinations.
Strategiesa. Participate in, or lead, planning efforts
to maximize the effectiveness of futurefreeway construction alignments orexpansions to the existing freewaysystem. Coordinate with partners onsustainable funding mechanisms tosupport present and futureinfrastructure improvements to thefreeway system.
b. Maintain local access to city owned andoperated aviation facilities and expandthe national and internationaldestinations its airlines serve. Continueto improve and enhance or expandinternal airport transportation systems.
c. Coordinate with the appropriateagencies on expansion plans forincreased freight corridors andparticipate in planning efforts toexpand the heavy rail system to provideadditional links to out-of-statedestinations.
d. Plan, design, develop, and maintain aregional multi-use trail system toconnect Phoenix with adjacent cities orpreserve areas to accommodatewalkers, hikers, joggers, bicyclists andequestrians. Consider jointly-fundedregional projects to enhance existingconnections and to evaluate inter-cityconnections and future infrastructureneeds.
3. Develop and operate public utilities.Protect the public health andenvironment by providing reliable,efficient and affordable water,wastewater, storm water, and garbageand diversion (recycling, reducing,reusing) services.
Strategiesa. Manage, develop, operate, and maintain
infrastructure that is integrated, well-maintained, reliable, aestheticallypleasing and continuously improves thehigh-quality service delivery standards.
b. Develop a financing plan for long-termsustainable infrastructure growth andreplacement that implements anequitable fee structure and incentivesfor conservation.
c. Use public/private partnerships forgrowth and economic development.Optimize regional partnerships tocooperatively utilize new and existinginfrastructure to maximize collectionefficiencies, implement new diversionand resource recovery technologies,minimize the need for future capitalinvestment, reduce transportationdemands and provide sustainable landreuse.
d. Develop an asset management plan thatidentifies improvements needed toensure reliability, regulatorycompliance, operational efficienciesand resource recovery, while creating anintegrated system that improvesinformation access by sharing citywideand across departments.
4. Construct and manage publicfacilities. Provide safe, efficient,sustainable, cost-effective, well-maintained and aesthetically pleasingpublic facilities for delivery ofmunicipal services to residents andvisitors; build, maintain and managecapital assets to preserve long-terminvestment and ensure uninterruptedsupport services.
Strategiesa. Apply benchmarking and other industry
comparison techniques in order tomanage costs and maintain industry-leading service levels.
b. Communicate the value of Capital AssetManagement and establish a dedicatedfunding source for city infrastructurerepair and capital improvements.
c. Plan, construct, and maintain parkbuildings, trails systems, open spaces,picnic areas and ramadas, pools,playgrounds, lighted basketball,volleyball, soccer and softball facilities,restrooms, and golf courses that meetthe diverse recreational and culturalneeds of the city’s residents and visitors.Continue investment to maintainappearance and safety of existingfacilities which could result in greateruse.
14

Innovation and Efficiency
The city of Phoenix must further enhanceits commitment to developing new andcreative service delivery methods toprovide services to residents. The recenteconomic climate challenges the city to domore with less, while maintaining high-quality public services. The city must alsoremain dedicated to developing andseeking continuous improvements inbusiness processes, and maintaining aculture of innovation and efficiency. Therecent efforts of the city manager increating the Innovation and EfficiencyTask Force have helped set the stage asthe city formalizes its approach.
Priorities1. Infuse a mindset focused on
innovation and efficiency into thecity of Phoenix organizationalculture. An “innovation and efficiency”way of thinking must become a muchmore prevalent part of theorganization’s core value system and beintegrated into the way every daybusiness is conducted. Executives,managers, supervisors and frontlinestaff must embrace an attitude thatquestions existing business processesand practices throughout theorganization, with the goal of fosteringinnovation through the creation andimplementation of new ideas.
Strategiesa. Develop a communication plan for
executive and middle managers tocreate an innovation and efficiencymovement through all levels of staff.
b. Empower supervisory staff to encourageand reward the creation of innovativeideas as a dominant model within theorganization.
c. Build innovation and efficiency corevalues and skills sets into staffmanagement practices, includingrecruitment, selection, orientation,development, mentorship, performancemeasurement and compensationsystems.
d. Cultivate and reward a philosophy ofinnovation through exploratory thinkingamong all employees.
2. Establish and support city programsand mechanisms focused ondeveloping and implementingtangible innovations throughout theorganization. The city’s innovationand efficiency efforts must be drivenfrom the top to all levels, be resultsoriented, and demonstrate investmentof available means. A proven approachinvolves assignment of resourcesdedicated to producing substantialinnovative changes that enhancecustomer service, increase productivity,reduce costs, and engage employees.
Strategiesa. Assign an executive sponsor from the
City Manager’s Office with the authority,responsibility and resources to providestrategic direction, guidance andsupport for innovation and efficiencyobjectives.
b. Recruit, select and assign a creative anddiverse Innovation Team of multi-departmental staff with wide-rangingskills and experience representing thecity’s business units, which explorescreative solutions, evaluates businessprocesses, identifies improvements andinvestigates right sourcingopportunities.
c. Utilize technology and a standardbusiness process evaluation approach toachieve optimal efficiency andstreamlined systems in providing topquality services.
d. Invest resources necessary to carry outinnovation and efficiency strategies andobjectives.
3. Work continually toward eliminationof barriers to innovation andefficiency. Several obstacles can standin the way of creating an environmentof innovation and pathways toefficiency. The organization must seekto identify these real or perceivedhindrances and when appropriate,actively remove or facilitate workingthrough them.
Strategiesa. To lessen the “business silo” effect,
provide incentives for departmentdirectors, managers and staff tocollaborate, consolidate, streamline andadapt processes or functions thatoverlap or cross formal organizationalstructures.
b. Identify unneeded requirements orobsolete expectations thatunnecessarily slow down businessprocesses and work to eliminate them.
4. Engage the Phoenix community inthe city’s innovation and efficiencymethodologies to facilitate citizeninvolvement, input, and awareness.Involvement by Phoenix residents inthe accomplishment of the city’sinnovation and efficiency goals willboost the meaningfulness andconnectedness of the achievements tothe community. It is important for thecity to enhance public awareness aboutinnovation and efficiency achievementsand make strong efforts to requestrelevant input.
Strategiesa. Celebrate innovation and efficiency
efforts and accomplishments on acitywide scale.
b. Actively inform customers of innovationand efficiency efforts through availablepublic communication methods andmedia.
c. Continue to reach out to the communitythrough the Mayor and City Council,Boards and Commissions, neighborhoodassociations and other stakeholders toengage the community and inviteparticipation and input.
d. Create an environment that activelycelebrates and informs employees ofinnovation and efficiency effortsthroughout the organization.
15

Neighborhoods and Livability
To preserve healthy, vibrant, diverse andsafe neighborhoods that enhance thequality of life for all Phoenix residentsthrough neighborhood vitality, by providinga range of housing opportunities andchoices, supporting quality parks and openspace, and enriching its populace with astrong art and culture infrastructure, andan accessible and quality library system.
Priorities1. Support neighborhood vitality
through strong partnerships,collaborations and by leveragingresources. In order to preserve healthy,vibrant, diverse and safeneighborhoods, the city must supportneighborhood self-reliance and enhancethe quality of life for all residentsthrough community-based problemsolving, neighborhood-oriented servicesand public/private cooperation.
Strategiesa. Encourage and continue to enforce
compliance with city ordinances toprevent blight, address graffiti, illegalactivities (dumping, signage andbusinesses) and deterioration in orderto ensure a quality community.
b. Strengthen the capacity ofneighborhood organizations, volunteers,businesses, nonprofit and faith basedorganizations to assist in addressingneighborhood issues effectively inpartnership with the city to makePhoenix an attractive place to live andwork.
c. Focus revitalization efforts in a mannerthat maximizes private and publicresources to the greatest extentpossible.
d. Enhance the physical and economicenvironment of principally low- tomoderate-income neighborhoodscitywide, including continued strategicrevitalization through the variousprograms and services supported andfunded through federal, local andprivate resources.
e. Ensure that new development in oradjacent to neighborhoods is compatibleand promotes adaptive reuse of vacantand underutilized buildings andstructures.
f. Promote aggressive and appropriateneighborhood infill development toimprove Phoenix neighborhoods, reducedecay and take advantage ofopportunities to maintain healthycommunities.
2. Provide a diverse range of housingopportunities and choices to Phoenixresidents. Promoting diversifiedhousing opportunities enriches thequality of life for all Phoenix residents,including low- to moderate-incomefamilies, seniors, persons withdisabilities and the homeless. Providinga range of housing opportunities allowsthe city to continue to preserve healthy,vibrant, diverse and safeneighborhoods.
Strategiesa. Support strong housing development by
designing all housing units, subdivisionsand site plans in a quality manner topromote health, safety, functionality,attractiveness and sustainability.
b. Increase homeownership opportunitiesto help stabilize neighborhoods.
c. Promote and increase the availability ofdecent, safe and affordable housing andexpand the supply of assisted housingchoices.
d. Encourage the development of specialneeds housing and supportive servicesfor persons with disabilities, seniors,homeless and those with special needs.Work with for-profit and nonprofitorganizations to promote andparticipate in a regional continuum ofcare system that will effectivelytransition persons who are homeless toappropriate permanent housing.
e. Provide quality, affordable rentalhousing opportunities through theacquisition and rehabilitation ofexisting properties and construction ofnew rental units that focus onundergoing revitalization, receivingrehabilitation (federal and/or grantfunding) benefiting low- and moderate-income households in collaborationwith external partners.
f. Support and ensure equal opportunityand fair housing by prohibiting unlawfuldiscrimination in housing by addressingand reducing impediments.
3. Ensure Phoenix residents havequality parks and open space.Partner with the community to providea parks and recreation system thatmeets the needs of Phoenix residentsand visitors that is convenient,accessible, and diverse in programs,locations and facilities.
Strategiesa. Support healthy communities by
providing clean, safe and accessibleparks and recreational facilities thatmeet the needs of Phoenixneighborhoods and incorporatesustainable design standards withavailable resources.
b. Support diverse and accessibleeducational and life enrichmentactivities that embrace art, dance,music, culture, fitness, nutrition, sportsand out-of-school time as a foundationfor recreational activities offered atparks and park facilities.
c. Create a network of shared-use trailsand pathways that are safe, convenientand connected within and betweenpreserves and parks.
d. Protect natural and open spaces, suchas mountain and desert preserves, inorder to preserve the environment andprovide recreational opportunities forPhoenix residents and visitors.
4. Promote a strong arts and cultureinfrastructure. Continue to partnerwith the community to provide strongarts and culture facilities and programsto create a more beautiful and vibrantcity which contributes to a betterquality of life.
Strategiesa. Enrich and infuse arts and culture into
all aspects of Phoenix’s life byintegrating arts and culture intoneighborhoods citywide and public artinto planning and development ofPhoenix’s infrastructure.
b. Generate public and private supportand resources to strengthen, expandand stabilize funding for the arts.
5. Provide accessible and qualitylibrary systems to Phoenix residents.Partner with the community to providea Library system that meets the needsof residents and visitors and isaccessible, convenient, and diverse inlocations, programs and facilities.
16

Strategiesa. Develop and maintain a system of
public libraries with sufficienttechnology, materials, hours and staff tomeet each community’s needs.
b. Design, build and maintain signaturefacilities that are accessible to allresidents.
c. Continue an aggressive plan of librarydevelopment, expanding and/orrenovating existing facilities andbuilding new ones to meet residents’needs.
d. Enhance library technology to providegreater access to the internet andelectronic resources for library users.
Phoenix Team
As the organization becomes leaner andcontinues to face increasing pressures forimproved results, it becomes even morecritical for a heightened connectionbetween employees and their work, theirorganization, and the people they work forand with. Methods for motivatingemployees must be updated to keepemployees engaged and retained withinthe organization. Additionally, traditionalmeans of communication may no longer beadequate to convey critical information toboth employees and the public.
Priorities1. Establish pay and benefits and a
workplace culture that attracts,retains and motivates a highlyqualified workforce. Given the currentstate of the economy, the communityhas expressed interest in the currentsalary, benefits and overallcompensation packages for governmentemployees.
Strategiesa. Conduct a study of current industry and
professional pay levels andcompensation practices bybenchmarking other organizations.
b. Analyze and evaluate merit pay and pay-for-performance options.
c. Develop updated compensation policiesand guiding principles.
d. Explore alternate pay and benefitoptions for part-time or for anontraditional workforce.
e. Actively seek out a diverse and talentedpool of candidates who possess thevalues and skills consistent withorganizational goals.
2. Provide a workplace culture thatsupports the health, productivityand efficiency of employees. The cityof Phoenix understands thatorganizational success depends on ahealthy, productive and efficientworkplace and workforce. Employeesalso recognize that they can improvetheir lives by taking charge of their ownhealth and making greater use oftechnology to ease ever increasing workdemands.
Strategiesa. Analyze and evaluate employee and
retiree health care benefit options.b. Create citywide programs focusing on
increasing employees’ capacity tomanage their own wellness and healthcare.
c. Explore technology uses for greateraccess to current credible data to makeinformed decisions and improve workresponsiveness.
d. Evaluate civil service system provisionsand explore options.
3. Establish communications plans toengage and inform employees andthe community. The city’s recentbudget challenges have made evidentthe necessity of providing clear, timelyand accurate information to employeesand the public to garner continuedsupport for and achievement oforganizational goals and continuedquality services.
Strategiesa. Develop and implement comprehensive
internal communications to increaseunderstanding and connection to city ofPhoenix goals and values amongemployees at all levels of theorganization.
b. Promote more interdepartmentalcommunication to increase consistencyof messages, ensure faster decisionmaking, empowerment, effectivenessand accountability.
c. Create an alliance of understandingbetween employees and the public,through a variety of media formats, toaccurately demonstrate andcommunicate the city’s efforts inrunning a world-class operation.
d. Use new technologies, such asFacebook, Twitter and other socialmedia, to reach employees and thepublic.
e. Develop opportunities to “showcase”improvements, accomplishments andquality programs provided by employeesthat benefit the community.
17
4. Create development opportunitiesthat enhance the city’s standing as ahigh-performing organization. Thecity continues to reduce unnecessaryhierarchy to improve efficiencies andspeed communication and decisionmaking. This has resulted in a flatterorganization, increases in span ofcontrol, and consequently fewerpromotional opportunities. Further, anincreasing number of employees areleaving the city as they reachretirement eligibility. As a result, itbecomes even more critical to manageand coordinate the available humanresources effectively to provideleadership and ongoing quality servicesto the community.
Strategiesa. Analyze and develop a reward and
recognition program that supports theorganization’s goal to attract and retaintop talent.
b. Coordinate efforts on the departmentlevel to cultivate skilled employees andleaders within the organization.
c. Establish methods for capturingorganizational knowledge and expertisethrough workforce planning efforts.
d. Increase professional development andtraining opportunities that reflect thekey values of the organization.
5. Mobilize and leverage communitypartnerships and volunteerprograms to enhance programs andservices. The city continues to makedifficult choices regarding programsand services to our customers in lightof revenue stream uncertainty.Additionally, the community hasexpressed interest in assisting the cityin continuing to provide qualityservices to residents in a variety ofareas.
Strategiesa. Coordinate a citywide program that
increases exposure to volunteeropportunities throughout the city ofPhoenix.
b. Use technology to reach, match andrecord volunteers to city needs.
c. Identify and engage with communityand corporate partners to developquality programs and services.
d. Explore and capitalize on opportunitiesto work with other governmentalentities to pool resources and shareinformation.
Public Safety
The city of Phoenix is committed to a highlevel of public safety and working inpartnership with the community tomaintain a safe and secure city. The PublicSafety Study Area includes members ofand services provided by the PoliceDepartment, Fire Department, MunicipalCourt, Prosecutor’s Office and Office ofEmergency Management. Workingtogether, these departments strive toprovide Phoenix with an environment ofsafety and security.
Priorities1. Prevent crimes and accidents by
enhancing community awareness ofpublic safety systems andpartnering with other crimeprevention programs. The cityprovides the community withinformation about a variety of publicsafety issues including crime andaccident prevention, information on theoperation of the judicial system, andeducation on police and firedepartment services.
Strategiesa. Provide information and education to
all Phoenix residents and visitors aboutactions that can be taken to keepthemselves and their families safe.
b. Provide residents and visitors withinformation about how public safetyagencies deliver service to thecommunity, and how the judicial systemoperates.
c. Educate communities in traffic safetyand the prevention of crime andaccidents in the home and workplace.
d. Partner with other city departments,such as Parks and Recreation, Library,and Human Services, and otheragencies, to proactively address crimeprevention.
2. Provide public safety workers withthe tools necessary to professionallymeet city and regional public safetyneeds. Ensure that public safetyworkers have the training, education,equipment, facilities and otherresources needed to provide a highlevel of service to the community.
18
Strategiesa. Provide appropriate training, continuing
education and professional developmentto emergency and non-emergency publicsafety service providers to be able tobetter serve their customers.
b. Provide appropriate management andplanning support for public safetyservice providers.
c. Support public safety responders withprograms and procedures that promoteand support their safety and well-being.
d. Provide necessary resources includingpersonnel, equipment, vehicles andfacilities for public safety serviceproviders.
e. Provide volunteer opportunities forcommunity members.
3. Ensure timely and appropriateresponse. The city of Phoenix deployspublic safety workers in a manner thatprovides a timely and appropriateresponse to emergencies. Responseresources include those needed forroutine incidents as well as thecapacity to respond to and managenatural and human-caused incidents ofregional significance.
Strategiesa. Deploy resources to respond to
emergencies within acceptabletimeframes.
b. Support emergency response withappropriate investigation andprosecution activities.
c. Provide equal access to justice,professional and impartial treatment,and the fair and timely resolution of allcourt matters.
d. Provide sufficient resources to manageincidents of regional significance.
e. Work in concert with other publicsafety, governmental and non-governmental agencies to eliminateduplication and provide quality serviceand seek opportunities to workcooperatively to improve customerservice and efficiency.
f. Ensure that after an incident, recoveryof public and private resources occurs inthe affected area(s).
4. Provide strong customer serviceinternally and externally. Everymember of the community and everyorganization working in Phoenix is apublic safety customer. Firefighters,police officers and officers of the courtswear an oath to protect the peoplethey serve. Every public safety workershould serve their customers withdignity and honor to develop mutualtrust and respect.
Strategiesa. Embrace diversity and treat every
customer with respect, compassion,equality, and fairness and work in a waythat engenders community trust andsupport.
b. Build relationships with communitiesthat encourage collaboration,communication, trust andunderstanding.
c. Provide customers with a venue toopenly discuss issues of concern.
d. Seek opportunities to workcooperatively with other jurisdictionsand groups to improve the efficiencyand effectiveness of customer service.
e. Maintain relationships with other city ofPhoenix departments to ensure thatpublic safety is incorporated into theplans and goals of non public safetydepartments.
5. Ensure fiscal responsibility in allpublic safety efforts. Public safetymanagers and public safety workersmust be responsible stewards of thefunds provided by the customers tosupport public safety efforts.
Strategiesa. Encourage, support, and value
innovation, efficiency, and continuousimprovement.
b. Be open to discuss and implementchange in service provision methodsand change in the needs of thecommunities that we serve.
c. Constantly seek ways to reduce the costof public safety services whilepreserving or improving the quality ofthe service provided.
d. Utilize resources and technologycarefully and effectively.
e. Pursue grant funding from all sources,as appropriate, to provide public safetyservices.
Social Services Delivery
The city of Phoenix has a long history ofresponding to community needs andproviding services to those most in need.Building upon this foundation, the city iscommitted to continue seeking innovativeand effective methods for delivering socialservices. The city will serve as a catalyst tosupport a full continuum of high qualityservices for Phoenix residents.
Though the city of Phoenix has, andwill continue to respond to specific socialservices needs directly where appropriate,the framework of this plan defines andcoordinates the greater scope of needs andservices required by Phoenix residents. Byproviding a clear vision and continuedleadership, city services will be provided intandem with other resources provided bycommunity and faith-based organizations,as well as, other levels of government.
Priorities1. Strengthen the safety net of social
services available to protect thosewho are most vulnerable or in crisis.The city of Phoenix will assure thosemost in need have access to basicneeds such as shelter and food. The citywill connect the homeless, workingpoor, elderly, disabled and victims ofviolent crimes to core services neededto stabilize their lives.
Strategiesa. Enhance the support and delivery
systems of core services includingshelter, utility assistance, housing andfood to vulnerable populations.
b. Expand access to city and non-profitprograms providing essential services.
c. Enhance the coordination of emergencyprograms to streamline client access toservices.
d. Increase the effectiveness of existingand new programs through theimplementation of innovative servicedelivery models with increasedemphasis on accountability andperformance-based assessments.
e. Continue advocacy for the city’s “fairshare” of national and state resourcesfor programs serving emergency and at-risk populations.
19

2. Enhance the quality of life for low-income or at-risk individuals andfamilies. The city of Phoenix willempower all residents to live in safe,affordable housing and achieveeconomic self-sufficiency throughaccess to social, employment and othereconomic resources needed tomaximize their quality of life.
Strategiesa. Promote linkages to job training and
other employment and educationalresources empowering low-incomehouseholds to realize a livable wage.
b. Enhance the community’s capacity toprovide at-risk populations, includingthe disabled, elderly and chronicallyhomeless, with access to supportiveservices leading to greater self-sufficiency.
c. Develop performance-based measures,such as a “Return on Investment” (ROI)to promote effective programmanagement and responsible fiduciarystewardship of fiscal resources.
d. Create safe and affordable housingopportunities for all Phoenix residentsby strengthening programs and servicesthat enhance opportunities forhouseholds to gain and/or retainhousing meeting their economic, socialand cultural needs.
3. Build healthy, caring communities.The city of Phoenix will promote rich,diverse and innovative networks ofpublic, community, and faith-basedprograms, services, and facilities tomaximize the potential of everycommunity. The city will serve as aresource and a catalyst instrengthening neighborhoods andbuilding community capacity.
Strategiesa. Engage the faith community by
promoting awareness of social servicesissues and developing their ability toactively respond to these needs.
b. Maximize the impact of the faithcommunity’s participation on the healthand capacity of social services networksby leveraging their increased supportthrough coordinated planning andstrategic partnerships.
c. Enhance and expand the formal andinformal networks connecting the socialservices sector (non-profits, faithcommunity, etc.) to individuals andfamilies in high need neighborhoods.
d. Develop new and innovativemechanisms to improve the alignmentand efficiency of local and citywidesocial services resources to meetneighborhood needs.
e. Strengthen communities by promoting abroad and diverse continuum ofprograms and services.
Sustainability
The city of Phoenix is committed tosecuring environmental and economiclivability for future generations in theregion, with an emphasis on solar energyproduction. Phoenix has long usedsustainability as a guiding principle,believing that sustainable living is criticalto ensuring that the actions we take todaydo not compromise the ability of futuregenerations to meet their needs. Phoenix’ssustainability motto, “Living Like itMatters!” reaffirms the sustainability creedthat guides its current programs andfuture plans.
Priorities1. Accelerate renewable energy
development. The city has a long-standing commitment to resourceconservation and continues to be anactive participant in energyconservation, efficiency andenvironmental preservation. Pursuingrenewable energy development guidesthe city towards energy independence.
Strategiesa. Pursue utility scale solar development
through emerging technology on the SR85 Landfill property.
b. Implement small or distributed scalesolar projects on city-owned buildingsand property.
c. Proceed with gas-to-energy projects atlandfills and treatment plants.
d. Develop effective public-privatepartnerships to secure timely powerpurchase and solar service agreements.
2. Enable opportunities forenvironmental stewardship.Environmental sustainability is bestachieved by encouraging sharedresponsibilities, protecting naturalsystems, and promoting the efficientuse of natural resources. It also isimportant to implement policies,programs and practices that have a far-reaching effect on the environment.
20

Strategiesa. Actively participate with the Maricopa
Association of Governments (MAG) toattain and exceed federal air qualitystandards for the region.
b. Create sound water management policyand ensure choices are available toengage residents in conservation effortsincluding water, solid waste, naturalhabitat and open space.
c. Seek, evaluate and integrate emergingtechnologies and products includinggreen building elements, environmentalpurchasing, energy management,alternative fuels, alternative surfacingmaterials and heat island reduction.
d. Develop new methods to further reducethe tonnage of solid waste being hauledto landfills and increase recyclingparticipation and diversion rates byresidents.
e. Continue attaining federal funds topursue sustainability initiatives.
f. Facilitate the development andexpansion of local green businesses toachieve a stronger economy and jobcreation in the city.
3. Enhance sustainable land use andmobility practices. The success insustainable land use and mobility liesin adopting policies that encourage theuse of green infrastructure andbuildings, brownfield redevelopment,creating connectivity within roadnetworks and ensuring connectivitybetween pedestrian, bike, transit androad facilities.
Strategiesa. Develop and implement voluntary
programs and incentives for residentssuch as the Green Construction Code,Energize Phoenix and rooftop solar.
b. Implement recommendations from theTree and Shade Master Plan anddevelop integrated Pedestrian, Bicycleand Transit plans.
c. Utilize the Capital ImprovementProgram to achieve sustainabilitypriorities.
d. Promote mixed land use to achievecomplete communities and encourageinfill development.
4. Foster collaboration andcommunication. Empoweringemployees at all levels throughcollaborative workgroups will galvanizethem to realize the city’s sustainabilitygoals. They in turn become an exampleof the city’s efforts and progress to thecommunity they serve. Communicatingand celebrating the city’saccomplishments is essential tomotivating employees, customers,stakeholders and the public inachieving sustainability goals.
Strategiesa. Strengthen and support the city’s
Sustainability Task Force effortsthrough a renewed organizationalcommitment and public/privatepartnership networking.
b. Provide a mechanism to formallycoordinate public information andeducation programs offered by the cityand its partners regardingsustainability.
c. Develop media campaigns, utilizingmultiple channels to increase internaland external messaging on organizationsustainability programs andaccomplishments.
d. Engage city of Phoenix employees byfostering a culture of sustainability.
Technology
Information technology is a vital part of avibrant city government. Informationtechnology, utilized appropriately, enablesenhanced services to the community,increases efficiency of operations, deliversuseful information and supportsinnovation. The Phoenix Strategic Plan’sTechnology Area leverages technology todrive key actions that fundamentallyenhance the way Phoenix connects toinformation.
Priorities1. Provide seamless customer service. A
seamless customer experience isachieved when a customer interactswith both internal and external cityservice providers without experiencingservice interruptions during the servicedelivery process.
Strategiesa. Use technology to provide a consistent
customer experience, based onstandardized service processes appliedto all forms of customer interaction.
b. Enhance phoenix.gov as a single “frontdoor” for residents and businesses byoffering web-based governmentservices.
c. Adopt and expand the concept oftechnology service catalogs andhardware/software services that assistinternal and external customers withfinding technical solutions to businessproblems.
d. Support the concept of a single “3-1-1”contact center through which telephoneand web inquiries can be funneled toprovide efficient and timely customersupport and case management tracking.
2. Increase operational efficiencythrough constant innovation.Constant product and serviceinnovation nurtures ideas and focuseson customer satisfaction, combinesprocess and technology to enhanceproductivity and value, drives downoperational costs and supports othercity strategies.
21

Strategiesa. Support and drive innovations that
leverage technology and businesssolutions citywide.
b. Focus on organization-wideapplications, using right-sourcing andmanaged services where appropriate.
c. Partner with city departments toconserve and redeploy resources whileproviding services supporting multiplecity lines of business.
d. Encourage development and use ofcomputer-based business analysisprocesses and tools to more efficientlymanage business data as well as helpidentify trends and innovations thatimpact customer service delivery.
3. Turn data into information througha web-enabled city. When businessdata is stored in easily accessible,organization-wide repositories, the citycan create opportunities to use thisdata to make better decisions. Internet-based information delivery andcollection efforts empower thecommunity to interact with and receivecity services 24 hours a day, giving themthe opportunity to conduct theirbusiness online versus waiting in line.
Strategiesa. Investigate strategies to assist internal
and external customers with access todata and web-based services at outlyingcity facilities.
b. Identify common transactions andcustomer services within departmentalbusiness processes that can reasonablybe developed into web-enabled services.
c. Modify and implement online systemsthat utilize reengineered businessprocesses for departments and thecommunity.
d. Create a technology foundation tosupport web-enabled governmentservices.
4. Create a shared commoninfrastructure. Consolidatingtechnological infrastructure aroundcommon IT components allowsimproved investments on behalf of theentire city. Strategic use of technologywill result in tangible cost savings andresults in the efficient and effectiveallocation of resources.
Strategiesa. Establish citywide business standards
and measurement criteria that supportconsistency in IT project management,project completion and realizedbenefits.
b. Enhance IT standards andrequirements that will governinformation system design, developmentand operation across all citydepartments.
c. Consolidate technologies wherepractical to take advantage of savingsachieved through economies of scale.
d. Secure software and hardware savingsthrough volume purchasing andinstallation, and reduced maintenancecosts.
5. Enhance information security andprivacy. In today’s businessenvironment, information security andprivacy form the foundation oftechnology projects. The city shouldcreate a comprehensive program toprotect data and technologyinfrastructures, secure systems andassets, mitigate threats, and provide amechanism for business continuity inemergencies.
Strategiesa. Establish the organizational framework
to develop and implement acomprehensive security and privacyprogram.
b. Educate employees and residents aboutthe importance of information securityand about safeguards to protectconfidential data.
c. Collaborate with city securityauthorities to ensure a unified securityand privacy framework.
d. Investigate strategies to insulate thecity’s technology infrastructure fromthreats to information security andprivacy by adopting and implementingindustry-standard continuity ofoperations concepts.
22

23
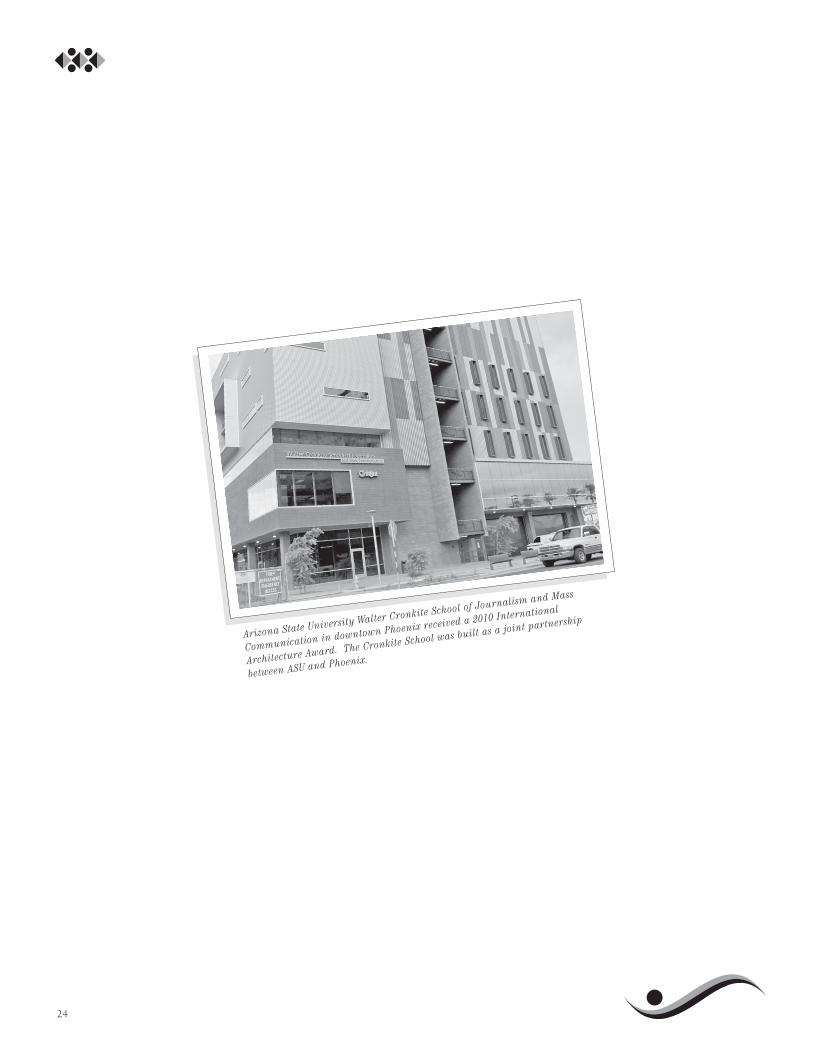
24
Arizona State University Walter Cronkite School of Journalism and Mass
Communication in downtown Phoenix received a 2010 International
Architecture Award. The Cronkite School was built as a joint partnership
between ASU and Phoenix.

25
The city of Phoenix continues its pursuitof excellence throughout the organization.Delivering quality, efficient, and cost-effective services to Phoenix residents isthe cornerstone of the organization’scommitment to public service. Because ofthe lengthy economic recession, cityemployees have worked hard as individualsand on teams to deliver quality customerservice with fewer resources. Nothingillustrates this point better than theinnovative partnerships we have formedwith community members to ensure thatthe city uses its resources wisely. As aresult, we've received positive feedbackfrom the 2010 Community Attitude Survey.
Because the economic recession hascontinued to negatively impact cityrevenue growth, the organization has beenchallenged with spending less and creatinga smaller, more efficient government.Assistance and feedback from thecommunity was encouraged, and as aresult, two committees were established.The city manager created the Innovationand Efficiency Task Force, which consistsof city of Phoenix executive managementand volunteer community leaders. Also,the Mayor created the City CouncilFinance, Efficiency and InnovationSubcommittee. Together thesecommittees helped develop strategies thathave saved the city more than $25 millionin 2010-11, and will save more than $125million over the next five years.
According to the 2010 CommunityAttitude Survey, more than 95 percent ofPhoenix residents indicated they weretreated professionally and courteously bycity employees, the highest ever for thismeasure. This occurred despite having thesmallest workforce in nearly 40 years dueto budget reductions and efficiencies. Cityemployees are proud to be among the verybest and they serve the community withpride.
In addition to the community’srecognition of a job well done, the city andits employees are continually recognizedby a variety of professional organizationsfor its longstanding commitment toexcellence. The following is a list of just afew of the awards and recognitionsreceived by the city during the course ofthis fiscal year:
n The Finance Department received adistinguished Certificate ofAchievement for its 2009Comprehensive Annual FinancialReport (CAFR) from the GovernmentFinance Officers Association of theUnited States and Canada (GFOA). Thecity has earned the award continuouslysince 1976.
n The city of Phoenix received theInternational City/County ManagementAssociation (ICMA) Certificate ofExcellence for PerformanceMeasurement for its commitment tocontinuous learning and improvementbased on a criterion of effective,results-oriented management practices.Phoenix was one of 21 jurisdictionsreceiving such an honor this year. TheICMA is an organization that advancesprofessional local government andsupports nearly 9,000 city, town andcounty organizations and individualsworldwide.
n The Nina Mason Pulliam Rio SaladoAudubon Center, a Parks andRecreation Department facility,received top honors – the President’sAward – in the Annual Valley ForwardEnvironmental Excellence AwardProgram. Other city projects receivedCrescordia awards, including the TresRios Constructed Wetlands, PhoenixSonoran Preserve, Papago RegionalMaster Plan, the Zanjero's Line art
project, Paradise Village SolarDemonstration Project, McCarty onMonroe, Little Canyon Trail, PhoenixTree and the Shade Master Plan. TheValley Forward Excellence Awards areArizona’s oldest and most prestigiousawards competition focusing onenvironmental initiatives.
n The Parks and RecreationDepartment's Bret Tarver LearningCenter received the 2010 OutstandingFacility Award from the Arizona Parksand Recreation Association (APRA).The facility was recognized forexcellence in the field of parks,recreation, cultural and communityservices. The center is named afterPhoenix firefighter Bret Tarver, wholost his life in March 2001 whilefighting a fire at the SouthwestSupermarket that was formerly on thesite.
n The European Centre for ArchitectureArt Design and Urban Studies namedthe Arizona State University WalterCronkite School of Journalism andMass Communication in downtownPhoenix as one of the recipients of the2010 International ArchitectureAwards. The award recognizes themost significant new architecturedesigned and built worldwide. TheCronkite School was built as a jointpartnership with the city of Phoenix.
n The Sunshine Review, a non-profitorganization dedicated to promotingstate and local governmenttransparency, presented the city withthe 2011 Sunny Award. The city wasrecognized for its commitment toexceed transparency standards and forthe information provided to residentson the phoenix.gov website. This is thesecond year in a row the city hasreceived this award.
Our Commitment To Excellence
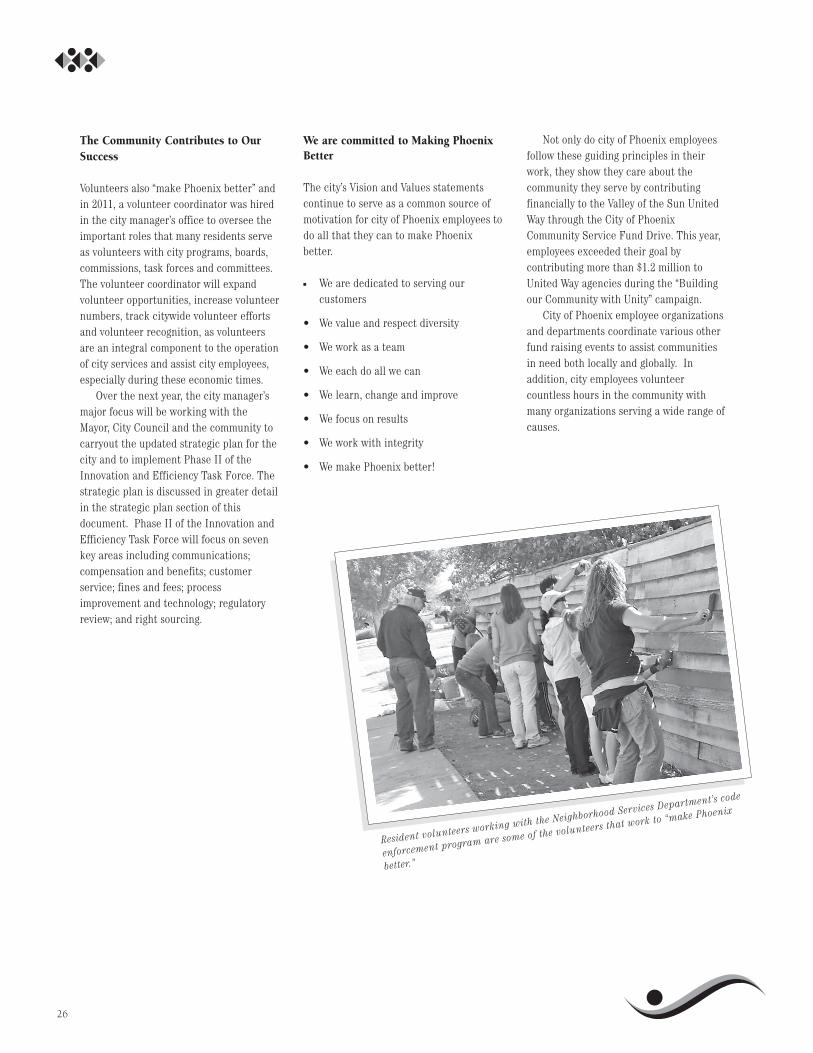
The Community Contributes to OurSuccess
Volunteers also “make Phoenix better” andin 2011, a volunteer coordinator was hiredin the city manager’s office to oversee theimportant roles that many residents serveas volunteers with city programs, boards,commissions, task forces and committees.The volunteer coordinator will expandvolunteer opportunities, increase volunteernumbers, track citywide volunteer effortsand volunteer recognition, as volunteersare an integral component to the operationof city services and assist city employees,especially during these economic times.
Over the next year, the city manager’smajor focus will be working with theMayor, City Council and the community tocarryout the updated strategic plan for thecity and to implement Phase II of theInnovation and Efficiency Task Force. Thestrategic plan is discussed in greater detailin the strategic plan section of thisdocument. Phase II of the Innovation andEfficiency Task Force will focus on sevenkey areas including communications;compensation and benefits; customerservice; fines and fees; processimprovement and technology; regulatoryreview; and right sourcing.
We are committed to Making PhoenixBetter
The city’s Vision and Values statementscontinue to serve as a common source ofmotivation for city of Phoenix employees todo all that they can to make Phoenixbetter.
n We are dedicated to serving ourcustomers
• We value and respect diversity
• We work as a team
• We each do all we can
• We learn, change and improve
• We focus on results
• We work with integrity
• We make Phoenix better!
Not only do city of Phoenix employeesfollow these guiding principles in theirwork, they show they care about thecommunity they serve by contributingfinancially to the Valley of the Sun UnitedWay through the City of PhoenixCommunity Service Fund Drive. This year,employees exceeded their goal bycontributing more than $1.2 million toUnited Way agencies during the “Buildingour Community with Unity” campaign.
City of Phoenix employee organizationsand departments coordinate various otherfund raising events to assist communitiesin need both locally and globally. Inaddition, city employees volunteercountless hours in the community withmany organizations serving a wide range ofcauses.
26
Resident volunteers working with the Neighborhood Services Department’s code
enforcement program are some of the volunteers that work to “make Phoenix
better.”

Following are a few additionalexamples of how city employees havedemonstrated their commitment to thecity’s Vision and Values by going above andbeyond to improve the quality of life forPhoenix residents.
n The National Association of Housingand Redevelopment Officials (NAHRO)selected the Housing Department asthe recipient of the 2010 Award ofExcellence. The award was presentedfor the McCarty on Monroe seniorhousing development. The departmentis one of 23 programs nationwide toreceive the 2010 award, whichrecognizes outstanding innovation andachievement in housing andcommunity development programsthroughout the country.
n The National League of Citiespresented the Library Department withthe 2010 Award for MunicipalExcellence. The award was presentedfor College Depot, a college accesscenter that has served more than 5,000youth and their families, providingworkshops and one-on-one assistancewith college planning, financial aid,career exploration, college applicationsand more.
n The Phoenix Sky Harbor InternationalAirport's Navigator Volunteer Programreceived the State of Arizona Spirit ofService Award at the 30th AnnualGovernor's Conference on Tourism. Theaward is presented to the non-management tourism employee orvolunteer (individual or group) whobest exemplifies the Arizona tourismindustry's commitment to exceptionalcustomer service.
n The Arizona Supreme Court JudicialStaff Education Committee (JSEC)presented Phoenix Municipal CourtJudge Louis Frank Dominguez with aTrainer Excellence Award. JudgeDominguez was recognized by JSEC forhis volunteer work and fordemonstrating dedication andcommitment to excellence inpromoting and continuing judicialeducation in Arizona.
n Lifeguards James Campbell, RachelRodia, Alicia King, Elisa King andCharles Woodruff of the ParksDepartment's Aquatic Division tookhonors at the American Red Cross 30thAnnual Lifeguard Challenge. Staff wonhonors in the Top Overall Team, CoedSubmerged Object Recovery, CoedActive Victim Rescue and Coed RescueTube Relay categories. The eventshowcases the commitment, dedicationand pride staff takes in representingthe city.
.
27
Phoenix Sky Harbor International Airport’s Navigator Volunteer Program was
recognized with a “Spirit of Service” award for their commitment to exceptional
customer service.
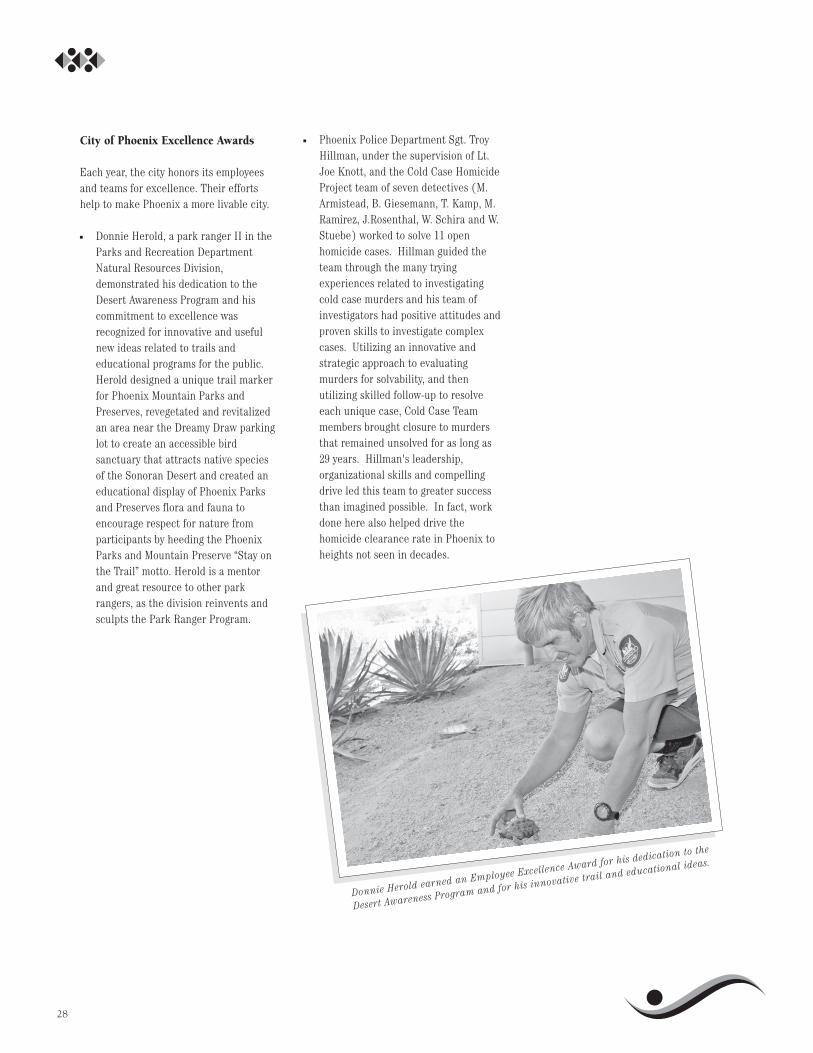
City of Phoenix Excellence Awards
Each year, the city honors its employeesand teams for excellence. Their effortshelp to make Phoenix a more livable city.
n Donnie Herold, a park ranger II in theParks and Recreation DepartmentNatural Resources Division,demonstrated his dedication to theDesert Awareness Program and hiscommitment to excellence wasrecognized for innovative and usefulnew ideas related to trails andeducational programs for the public.Herold designed a unique trail markerfor Phoenix Mountain Parks andPreserves, revegetated and revitalizedan area near the Dreamy Draw parkinglot to create an accessible birdsanctuary that attracts native speciesof the Sonoran Desert and created aneducational display of Phoenix Parksand Preserves flora and fauna toencourage respect for nature fromparticipants by heeding the PhoenixParks and Mountain Preserve “Stay onthe Trail” motto. Herold is a mentorand great resource to other parkrangers, as the division reinvents andsculpts the Park Ranger Program.
n Phoenix Police Department Sgt. TroyHillman, under the supervision of Lt.Joe Knott, and the Cold Case HomicideProject team of seven detectives (M.Armistead, B. Giesemann, T. Kamp, M.Ramirez, J.Rosenthal, W. Schira and W.Stuebe) worked to solve 11 openhomicide cases. Hillman guided theteam through the many tryingexperiences related to investigatingcold case murders and his team ofinvestigators had positive attitudes andproven skills to investigate complexcases. Utilizing an innovative andstrategic approach to evaluatingmurders for solvability, and thenutilizing skilled follow-up to resolveeach unique case, Cold Case Teammembers brought closure to murdersthat remained unsolved for as long as29 years. Hillman's leadership,organizational skills and compellingdrive led this team to greater successthan imagined possible. In fact, workdone here also helped drive thehomicide clearance rate in Phoenix toheights not seen in decades.
28
Donnie Herold earned an Employee Excellence Award for his dedication to the
Desert Awareness Program and for his innovative trail and educational ideas.

Employee Suggestion Awards
The Employee Suggestion Program (ESP),which began in the mid-1950s, has savedmillions of dollars through direct costsavings and other productivity and cost-avoidance improvements. Employees canmake improvement suggestions for any cityoperation, not just for their owndepartment. Some examples of employeesuggestions implemented in the 2010-11fiscal year:
n Many of the city of Phoenix’s parkfacilities have barbecue grills forpatrons to enjoy. Over time, these grillsdeteriorate from rust damage due toexposure to outdoor elements. JosephMendez, a building maintenanceworker with the Parks Department,discovered that in most cases, it wasonly the bottom of the grills that wererusting out. Mendez developed amethod to fabricate steel meshreinforcement and refurbish the grillsat a lower cost than replacing them.Mr. Mendez’s suggestion to refurbishthe grills has been implemented so faron 21 grills, for a cost savings of $6,365,and is expected to be utilized citywidefor even greater savings.
n Kerr Henley, a solid waste equipmentoperator in the Public WorksDepartment, suggested enhancing aheavy-duty semi-truck/trailercombination with a system that liftsrecyclable material barrels, depositsthe contents and packs the materialsinto the trailer. The enhancementenabled additional recyclable materialto be packed into the trailer making itmore cost effective and reduced theamount of material that often fell tothe street. This change also reducedthe likelihood of injury to equipmentoperators who often needed to climbonto the trailer body to unclog thepacking system or remove loose orspilled material.
29
Cristina Wilfong, an environmental quality specialist in the Public Works
Department, suggested recycling propane gas cylinders, saving the city nearly
$2,500 each year.

n The city's 91st Avenue Waste WaterTreatment Plant must analyze threeseparate water samples with differentparameters for quality control. RogerVail, a senior water quality inspector inthe Water Services Department,suggested combining the three samplesinto one sample, with groupparameters, which would yield thesame results. After obtaining thenecessary approvals, this suggestionwas implemented and saved the citynearly $100,000 in the first year ofimplementation.
n The city offers free householdhazardous waste disposal events eachmonth. Residents may drop off itemssuch as antifreeze, car batteries, poolchemicals, and propane gas cylinders.Cristina Wilfong, an environmentalquality specialist in the Public WorksSolid Waste Division, suggestedrecycling propane gas cylindersthrough a local vendor that providestank recycling services at no charge.Her idea will save the city nearly $2,500each year.
As you can see, we work very hard toearn our reputation as a well-run city. Westrive to be leaders in our professions.Each day the core values of ourorganization – what we call our “Visionand Values” – are at the root of everythingwe do.
Joseph Mendez, a building maintenance worker with the Parks Department,
developed a method to reinforce and refurbish damaged barbecue grills at a
lower cost than replacing them.
n Kelly Bucey in the Public WorksDepartment realized that an energysavings could be achieved by turningoff the lighting that illuminatesvending machines in city facilities.Most of the vending machines areilluminated with fluorescent lighting,but many are in plenty of light andcould be disconnected. The estimatedsavings by implementing this idea was$5,200 per year.
n Robert Martinez, a solid waste foremanin the Public Works Departmentrealized that several city landfills werein need of “house-cleaning.” Martinezbegan collecting all the scrap metalmaterial from the various yards andcompiled a “bid” process for the sale ofthe recyclable materials collected to alocal metal recycler. Through hisingenuity, Martinez was able to obtainthe highest cost per ton for thematerials, generating one-time revenueto the city of more than $25,000.
30

31
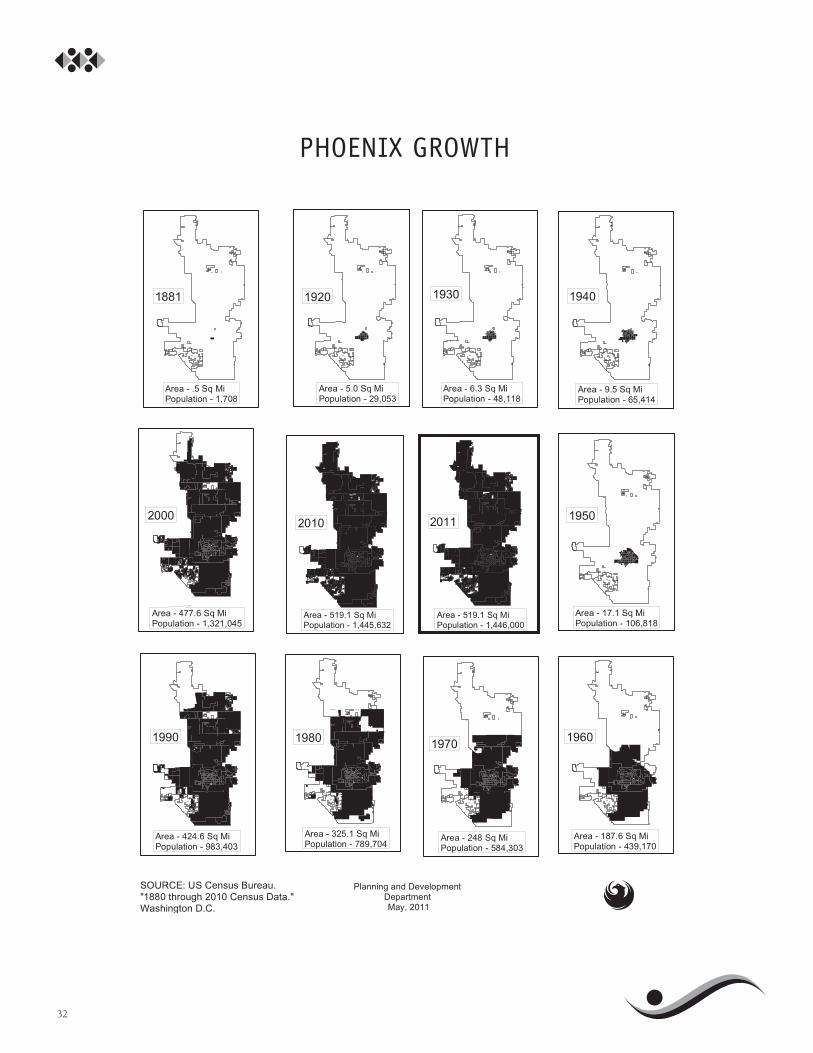
32
PHOENIX GROWTH
Phoenix was founded in 1870 as anagricultural community and wasincorporated as a city in 1881. The CityCharter, under which it is presentlygoverned, was adopted in 1913 and hasbeen amended by Phoenix voters from timeto time since then. The charter allowsPhoenix to determine its governmentalstructure and levy revenue and privilegelicense taxes. A council-manager form ofgovernment was also adopted in 1913.Under this organizational structure, theMayor and Council appoint a city managerto act as the chief operating officer. TheCity Council sets policy direction, and thecity manager is responsible forimplementing those policies in an efficientand effective manner. In 1982, a group ofresidents initiated an effort to move to adistrict system for electing councilmembers. These residents were concernedthat at-large elections resulted in anorganization that was less responsive toneighborhoods. The initiative was passedby the voters of Phoenix, and the numberof Council seats was increased from six toeight. The Mayor continued to be electedat-large.
Economic Diversity
Phoenix has grown steadily, especiallysince 1950. The 1900 Census recordedPhoenix population at 5,544. In 1950, thecity occupied 17 square miles with apopulation of almost 107,000, ranking it99th among American cities. The recent2010 Census recorded Phoenix populationat 1,445,632. The city currentlyencompasses 519.1 square miles.
Today, Phoenix is the sixth mostpopulous city in the United States, statecapital of Arizona and center of themetropolitan area encompassed byMaricopa County. This metropolitan areaalso includes the cities of Mesa, Glendale,Tempe, Scottsdale, Chandler, Peoria,Surprise, Goodyear, Avondale, El Mirage,Tolleson, and the towns of Gilbert andBuckeye. It is situated 1,117 feet above sealevel in the semi-arid Salt River Valley. Thearea is widely known for its mild, sunnywinters and hot summers and receives anaverage rainfall of seven inches a year.
The Phoenix metropolitan areaemployment mix is well diversified andfairly similar to that of the United Statesas a whole. An exception is constructionand financial employment, which comprisemore of Phoenix’s employment mix thanthe United States average due to historicalrapid population and employment growth.Additionally, the Phoenix area’smanufacturing mix is much moreconcentrated in high technology than theUnited States. The high technologymanufacturing sectors are cyclical innature and may be more impacted duringperiods of economic slowing than othermanufacturing sectors. The primaryemployment sectors and their share oftotal employment in the Phoenixmetropolitan area consist of serviceindustry (43%); trade (18%); government(14%); construction (5%); financialactivities (8%); and manufacturing (6%).Major employers of the Phoenixmetropolitan area include the state ofArizona, Wal-Mart Stores, Inc., Banner
Health Systems, city of Phoenix, WellsFargo and Company, Apollo Group, Inc.,Maricopa County, Arizona State University,Bank of America, Intel Corporation, JP Morgan Chase and US Airways Group,Inc. The top 10 property taxpayers, basedon secondary assessed valuation, areArizona Public Service Company, QWestCommunications, Southwest Gas, WestcorCompany LP/Macerich ManagementCompany, Host Kierland LP, AT & TCorporation, LBA Realty Fund,Metropolitan Life Insurance Company,Starwood Hotels and Resorts, and WellsFargo and Company. These taxpayersmake up just over six percent of totalassessed valuation.
Demographics and Economic Statistics
The following statistics are presented toprovide an overview of Phoenix residents,the city’s financial condition andinfrastructure.
Community Profile and Trends
33
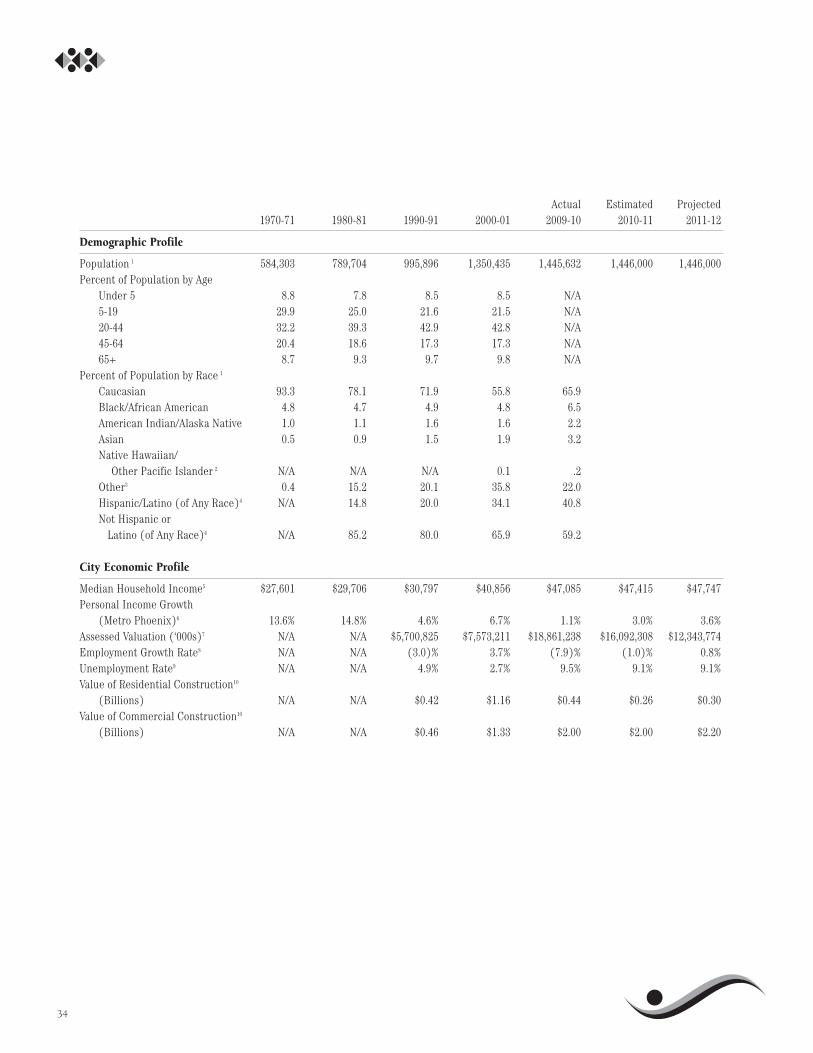
34
Actual Estimated Projected1970-71 1980-81 1990-91 2000-01 2009-10 2010-11 2011-12
Demographic Profile
Population 1 584,303 789,704 995,896 1,350,435 1,445,632 1,446,000 1,446,000Percent of Population by Age
Under 5 8.8 7.8 8.5 8.5 N/A5-19 29.9 25.0 21.6 21.5 N/A20-44 32.2 39.3 42.9 42.8 N/A 45-64 20.4 18.6 17.3 17.3 N/A 65+ 8.7 9.3 9.7 9.8 N/A
Percent of Population by Race 1
Caucasian 93.3 78.1 71.9 55.8 65.9Black/African American 4.8 4.7 4.9 4.8 6.5American Indian/Alaska Native 1.0 1.1 1.6 1.6 2.2Asian 0.5 0.9 1.5 1.9 3.2Native Hawaiian/
Other Pacific Islander 2 N/A N/A N/A 0.1 .2Other3 0.4 15.2 20.1 35.8 22.0Hispanic/Latino (of Any Race)4 N/A 14.8 20.0 34.1 40.8Not Hispanic or
Latino (of Any Race)4 N/A 85.2 80.0 65.9 59.2
City Economic Profile
Median Household Income5 $27,601 $29,706 $30,797 $40,856 $47,085 $47,415 $47,747Personal Income Growth
(Metro Phoenix)6 13.6% 14.8% 4.6% 6.7% 1.1% 3.0% 3.6%Assessed Valuation (‘000s)7 N/A N/A $5,700,825 $7,573,211 $18,861,238 $16,092,308 $12,343,774Employment Growth Rate8 N/A N/A (3.0)% 3.7% (7.9)% (1.0)% 0.8%Unemployment Rate9 N/A N/A 4.9% 2.7% 9.5% 9.1% 9.1%Value of Residential Construction10
(Billions) N/A N/A $0.42 $1.16 $0.44 $0.26 $0.30Value of Commercial Construction10
(Billions) N/A N/A $0.46 $1.33 $2.00 $2.00 $2.20

35
Actual Estimated Projected1970-71 1980-81 1990-91 2000-01 2009-10 2010-11 2011-12
City Financial Profile
Total Budget (‘000s) $95,835 $392,780 $1,026,545 $1,946,013 $2,989,413 $3,094,963 $3,474,413Total GF Budget (‘000s)11 $62,343 $221,106 $591,021 $953,324 $994,322 $966,707 $1,062,848Total Employees 5,670 9,435 11,388 14,352.0 15,620.8 15,002.8 14,999.7Total Employees per
1,000 population12 9.7 11.9 11.4 10.6 10.8 10.4 10.4Non-Enterprise Employees per
1,000 population N/A N/A N/A 8.6 8.5 8.1 8.1Enterprise Employees per
1,000 population13 N/A N/A N/A 2.0 2.3 2.3 2.3Property Tax Rate 1.75 1.75 1.79 1.82 1.82 1.82 1.82G.O. Bond Rating
(Moody’s/Standard and Poor’s) A/A Aa/AA Aa/AA+ Aa1/AA+ Aa1/AAA Aa1/AAA Aa1/AAANumber of PLT Licenses N/A 37,943 43,756 51,000 66,578 66,000 66,000City Retail Sales Tax Rate14 1% 1% 1.2% 1.8% 2.0% 2.0% 2.0%
Infrastructure Profile
Area (Square Miles) 247.9 329.1 427.1 483.5 518.9 519.1 519.1
PoliceMajor Crimes 50,747 86,287 110,961 97,666 71,653 72,500 72,500Dispatched Calls for Service 374,003 452,350 895,117 862,769 592,313 612,000 612,000Authorized Sworn Police Officers 1,054 1,694 2,047 2,810 3,558 3,558 3,284
FireFire Stations 30 35 45 45 57 57 58Fires and All Other Calls15 14,437 25,162 26,281 28,369 18,636 19,000 19,000Emergency Medical Calls15 – 46,122 75,112 101,396 126,968 128,000 128,000Authorized Sworn Firefighters 572 838 1,042 1,315 1,711 1,661 1,661
Building InspectionsTotal Number of Inspections16 236,000 196,356 176,909 261,184 143,300 131,600 138,800
StreetsTotal Miles 2,270 3,084 3,800 4,299 4,815 4,820 4,830Miles Resurfaced and Sealed 378 216 250 220 113 126 213Total Miles of Bikeway17 N/A N/A 250 472 590 595 605
Traffic Control and LightingSignalized Intersections 423 555 761 906 1,080 1,092 1,098Street Lights 23,097 39,097 50,825 70,750 90,805 91,133 91,142Traffic Accidents18 22,765 28,129 28,414 36,500 22,418 23,000 23,000
AviationPassengers Arriving
and Departing 2,925,700 6,500,000 22,175,000 35,900,000 38,300,000 38,900,000 39,000,000
Solid Waste CollectionResidences Served 204,800 281,900 281,392 327,953 392,825 394,000 397,000Tons Disposed at City Landfills 325,300 379,000 513,643 1,051,935 929,700 1,050,000 1,050,000
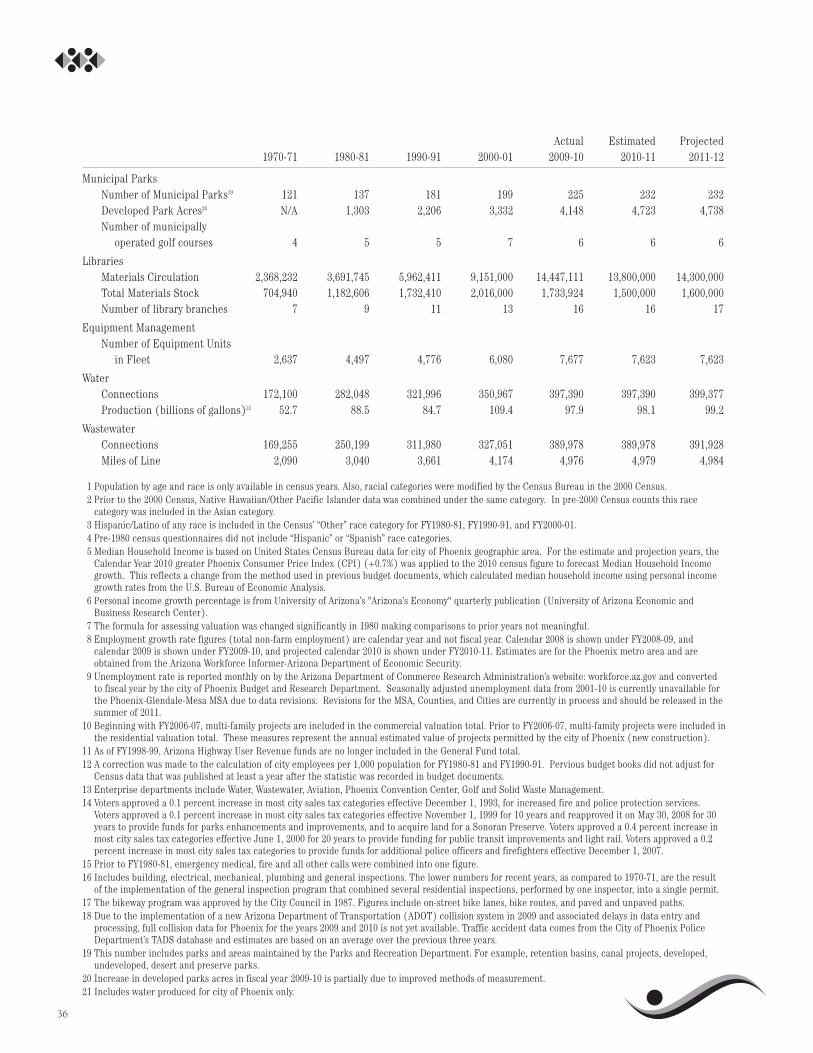
36
Actual Estimated Projected1970-71 1980-81 1990-91 2000-01 2009-10 2010-11 2011-12
Municipal ParksNumber of Municipal Parks19 121 137 181 199 225 232 232Developed Park Acres20 N/A 1,303 2,206 3,332 4,148 4,723 4,738Number of municipally
operated golf courses 4 5 5 7 6 6 6
LibrariesMaterials Circulation 2,368,232 3,691,745 5,962,411 9,151,000 14,447,111 13,800,000 14,300,000Total Materials Stock 704,940 1,182,606 1,732,410 2,016,000 1,733,924 1,500,000 1,600,000Number of library branches 7 9 11 13 16 16 17
Equipment ManagementNumber of Equipment Units
in Fleet 2,637 4,497 4,776 6,080 7,677 7,623 7,623
WaterConnections 172,100 282,048 321,996 350,967 397,390 397,390 399,377Production (billions of gallons)21 52.7 88.5 84.7 109.4 97.9 98.1 99.2
WastewaterConnections 169,255 250,199 311,980 327,051 389,978 389,978 391,928Miles of Line 2,090 3,040 3,661 4,174 4,976 4,979 4,984
1 Population by age and race is only available in census years. Also, racial categories were modified by the Census Bureau in the 2000 Census. 2 Prior to the 2000 Census, Native Hawaiian/Other Pacific Islander data was combined under the same category. In pre-2000 Census counts this race
category was included in the Asian category.3 Hispanic/Latino of any race is included in the Census’ “Other” race category for FY1980-81, FY1990-91, and FY2000-01.4 Pre-1980 census questionnaires did not include “Hispanic” or “Spanish” race categories.5 Median Household Income is based on United States Census Bureau data for city of Phoenix geographic area. For the estimate and projection years, the
Calendar Year 2010 greater Phoenix Consumer Price Index (CPI) (+0.7%) was applied to the 2010 census figure to forecast Median Household Incomegrowth. This reflects a change from the method used in previous budget documents, which calculated median household income using personal incomegrowth rates from the U.S. Bureau of Economic Analysis.
6 Personal income growth percentage is from University of Arizona’s "Arizona’s Economy" quarterly publication (University of Arizona Economic andBusiness Research Center).
7 The formula for assessing valuation was changed significantly in 1980 making comparisons to prior years not meaningful.8 Employment growth rate figures (total non-farm employment) are calendar year and not fiscal year. Calendar 2008 is shown under FY2008-09, and
calendar 2009 is shown under FY2009-10, and projected calendar 2010 is shown under FY2010-11. Estimates are for the Phoenix metro area and areobtained from the Arizona Workforce Informer-Arizona Department of Economic Security.
9 Unemployment rate is reported monthly on by the Arizona Department of Commerce Research Administration’s website: workforce.az.gov and convertedto fiscal year by the city of Phoenix Budget and Research Department. Seasonally adjusted unemployment data from 2001-10 is currently unavailable forthe Phoenix-Glendale-Mesa MSA due to data revisions. Revisions for the MSA, Counties, and Cities are currently in process and should be released in thesummer of 2011.
10 Beginning with FY2006-07, multi-family projects are included in the commercial valuation total. Prior to FY2006-07, multi-family projects were included inthe residential valuation total. These measures represent the annual estimated value of projects permitted by the city of Phoenix (new construction).
11 As of FY1998-99, Arizona Highway User Revenue funds are no longer included in the General Fund total.12 A correction was made to the calculation of city employees per 1,000 population for FY1980-81 and FY1990-91. Pervious budget books did not adjust for
Census data that was published at least a year after the statistic was recorded in budget documents. 13 Enterprise departments include Water, Wastewater, Aviation, Phoenix Convention Center, Golf and Solid Waste Management. 14 Voters approved a 0.1 percent increase in most city sales tax categories effective December 1, 1993, for increased fire and police protection services.
Voters approved a 0.1 percent increase in most city sales tax categories effective November 1, 1999 for 10 years and reapproved it on May 30, 2008 for 30years to provide funds for parks enhancements and improvements, and to acquire land for a Sonoran Preserve. Voters approved a 0.4 percent increase inmost city sales tax categories effective June 1, 2000 for 20 years to provide funding for public transit improvements and light rail. Voters approved a 0.2percent increase in most city sales tax categories to provide funds for additional police officers and firefighters effective December 1, 2007.
15 Prior to FY1980-81, emergency medical, fire and all other calls were combined into one figure.16 Includes building, electrical, mechanical, plumbing and general inspections. The lower numbers for recent years, as compared to 1970-71, are the result
of the implementation of the general inspection program that combined several residential inspections, performed by one inspector, into a single permit.17 The bikeway program was approved by the City Council in 1987. Figures include on-street bike lanes, bike routes, and paved and unpaved paths.18 Due to the implementation of a new Arizona Department of Transportation (ADOT) collision system in 2009 and associated delays in data entry and
processing, full collision data for Phoenix for the years 2009 and 2010 is not yet available. Traffic accident data comes from the City of Phoenix PoliceDepartment’s TADS database and estimates are based on an average over the previous three years.
19 This number includes parks and areas maintained by the Parks and Recreation Department. For example, retention basins, canal projects, developed,undeveloped, desert and preserve parks.
20 Increase in developed parks acres in fiscal year 2009-10 is partially due to improved methods of measurement.21 Includes water produced for city of Phoenix only.

This section provides a broad overview ofthe resources and expenditures includedin the 2011-12 budget. Information ispresented for General, Special Revenueand Enterprise funds. General funds,which receive special attention by thecommunity, are highlighted throughoutthis section. General funds are ofparticular importance to our residents asthey provide for most basic services, suchas police, fire, parks and streets.Enterprise funds are supported by feescharged for the services provided with theexception of the Convention Center whichhas earmarked sales taxes as its primaryfunding source. Special Revenue funds arerestricted to statutory and/or voter-approved uses.
The 2011-12 budget, financed byoperating funds, totals $3,474,413,000. Asshown in the accompanying pie chart, theGeneral Fund portion of $1,062,848,000 isapproximately 31 percent of the total. TheEnterprise funds, which include Aviation,Water, Wastewater, Solid Waste,Convention Center and Golf, make upanother 37 percent of the total. SpecialRevenue funds such as Arizona HighwayUser Revenues, grant funds such asCommunity Development Block Grants,Human Services grants and Housing grants
represent the remaining 32 percent of thetotal budget.
In addition to presenting the budget byfunding source, the budget also is describedin terms of the major types of activities orexpenditures funded. Included in theoperating budget are operating andmaintenance expenses that provide forongoing costs of delivering city services;capital expenditures for pay-as-you-goprojects for major additions, improvementsor renovations to city facilities; and debtservice payments to retire outstanding debt.The pie chart on page 39 shows thedistribution of the total operating budgetinto these three types of expenditures. Notincluded in the operating budget are bondsand other capital funds used for capitalimprovement projects. These are includedin a separate capital improvement program.
The 2011-12 General Fund budgetincludes ongoing operating andmaintenance and pay-as-you-go capitalexpenses. No debt service is paid from theGeneral Fund. Instead, debt serviceassociated with general-funded activities ispaid for with earmarked property taxes orwith the City Improvement Fund. Due tothe restrictions on using these funds bothare appropriately included in the SpecialRevenue funds portion of the budget.
Finally, budgeted expenditures aremost easily understood on a departmentalbasis. Detailed explanations of eachdepartment’s budget are provided in theDepartment Program Summary section ofthis document. The bar chart on page 39presents the General Fund budget on adepartment-by-department basis.
The table below provides a comparisonof the 2011-12 budget to the 2010-11adopted budget. Actual expenditures forthe 2009-10 fiscal year also are included.
Citywide operating and maintenanceexpenditures are expected to increaseprimarily due to the addition of the SkyTrain operations in Aviation, replacementvehicles and the reopening of the MaterialRecovery Facility in Solid Waste. Also, theGeneral Fund increase reflects anorganizational change in how enterpriseinformation technology costs are beingdistributed to city departments; the use ofwork order credits was changed to acentral service cost allocation. Theremoval of the work order credits resultedin an increase to expenditures for theInformation Technology ServicesDepartment, while the central service costallocation resulted in an increase toGeneral Fund resources through increasedtransfers from other funds.
2011-12 Resource and Expenditure Summary
37
2011-12 Budget Compared to 2010-11 Adopted Budget(In Millions of Dollars)
2011-12
2009-10 2010-11Actual Adopted Amount Percent
Expenditures Budget Budget Change Change
Operating and Maintenance Expenditures $2,184.2 $2,410.9 $2,453.9 $43.0 1.8%
Capital Expenditures 199.5 526.0 486.3 (39.7) (7.5)%
Debt Service 605.7 589.1 534.2 (54.9) (9.3)%
Total $2,989.4 $3,526.0 $3,474.4 ($51.6) (1.5)%

Pay-as-you-go capital is expected todecline due to flat and declining revenuegrowth in Water, Wastewater and Aviation.Debt service decreases $54.9 million in2011-12 due to savings from refinancingand lower payments to the earlyredemption fund.
2011-12 GENERAL FUND BUDGETOVERVIEW
The 2011-12 General Fund budget of$1,062,848,000 provides for ongoingoperating and maintenance and a smallamount of pay-as-you-go capitalexpenditures. The table below comparesthe 2011-12 General Fund budget with theadopted 2010-11 budget.
The operating and maintenanceexpenditures for 2011-12 increased 4.6percent compared to the 2010-11 adoptedbudget. This increase is primarily theresult of a budgetary change in howenterprise information technology costsare being distributed to city departments;the continuation of the Public SafetySpecialty Funds balancing plan; therestoration of ongoing funding for 60 swornpolice and fire positions; the change tofunding most vehicle purchases withoperating funds instead of lease purchasefinancing; an increase to the contingencyfund; the operating costs associated withnew capital facilities that will be openingin 2011-12; the cost associated withcompensation and benefits study; andother normal inflationary increases. Thepay-as-you-go capital expenditures
increased compared to the 2010-11adopted budget primarily due to addingfunding for the Information Technologymicrowave radio replacement project.
The pie charts on page 39 show the2011-12 General Fund budget summarizedby major programs and major resources.
RESOURCES
Resources include beginning fundbalances, fund transfers, revenues andrecoveries. In the Enterprise funds, fundbalances provide a financial cushionagainst unanticipated changes. Thecontingency allocation serves this samepurpose for the General Fund. While minorchanges in fund balances occur from yearto year, maintaining proper fund balancesover the long term and providing for acontingency fund in the General Fund areimportant components of sound financialmanagement and a significant factor inbond ratings.
2011-12 Estimated Beginning FundBalances
As explained in a later section, a GeneralFund balance may not be budgeted.However, a contingency fund, also knownas a “rainy day fund,” may be planned toprovide a means to address unexpectedrevenue decreases or expenditureincreases that may occur throughout theyear. Each year, most of the contingencyallocation remains unused and, therefore,falls to the ending fund balance along withany changes in estimated revenues andexpenditures.
The estimated 2011-12 beginning fundbalances of $1,020.1 million include $74.4million in general funds, $386.7 million inspecial revenue funds and $559.0 millionin enterprise funds. The estimatedbeginning fund balance for SpecialRevenue and Enterprise funds include:Transit 2000 - $222.8 million; Aviation -$179.6 million; Wastewater - $165.9 million;Water - $146.2 million; Convention Center -$40.3 million; Solid Waste - $39.6 million;Parks and Preserves - $37.8 million; SportsFacilities - $27.0 million; Grant funds -$33.9 million; Development Services- $12.3million; Arizona Highway User Revenue -$19.3 million and $21.0 million in variousother restricted funds.
2010-11 General Fund EstimatedEnding Balance
As shown in the table on page 41, theestimated 2010-11 ending General Fundbalance is $74.4 million. The balanceresults primarily from a $23.8 millionhigher beginning balance, a $47.1 milliondecrease in operating expenditures, and a$7.9 million increase in transfers andrecoveries, which were offset by a $4.5million decrease in operating revenues.The decrease in estimated 2010-11 GeneralFund expenditures is largely due to unusedcontingency funds and mid-yearefficiencies identified throughout theGeneral Fund departments.
38
2011-12 General Fund Budget Compared to 2010-11 Adopted Budget(In Millions of Dollars)
2011-12
2009-10 2010-11Actual Adopted Amount Percent
Expenditures Budget Budget Change Change
Operating and Maintenance Expenditures $993.6 $1,012.4 $1,059.1 $46.7 4.6%
Capital Expenditures 0.7 1.4 3.7 2.3 164.3%
Total $994.3 $1,013.8 $1,062.8 $49.0 4.8%

39
Millions of Dollars
Pol
ice
Fir
e
Par
ksan
dR
ecre
atio
n
Con
ting
enci
es
Libr
ary
Info
rmat
ion
Tech
nolo
gy
Mun
icip
alC
ourt
Stre
ets
Pub
licTr
ansi
t
Pro
secu
tor
&D
efen
der
Hum
anSe
rvic
es
Fin
ance
Pub
licW
orks
Nei
ghbo
rhoo
dSe
rvic
es
Hum
anR
esou
rces
Cit
yC
lerk
Pla
nnin
gan
dD
evel
opm
ent
Eco
nom
icD
evel
opm
ent
May
or&
Cit
yC
ounc
il
Law
Fun
ctio
ns*
Bud
get
&R
esea
rch
Cit
yA
udit
or
Pub
licIn
form
atio
n
Equ
alO
ppor
tuni
ty
Cit
yM
anag
er
Par
king
Gar
ages
Expenditures by Department2011-12 General Fund Budget
$500
450
400
350
300
250
200
150
100
50
0
Property Tax 12%
Other Resources 11%
State-SharedRevenues 26%
Local Sales Tax39%
User Fees/Other
Revenue 12%
GENERAL FUNDSTotal Resources – $1.06 Billion
Public Safety andCriminal Justice 66%
Community Development
and Enrichment* 16%
Transportation4%
GeneralGovernment
8%
EnvironmentalServices
and Other 6%
GENERAL FUNDSTotal Expenditures – $1.06 Billion
General Funds 31%
Enterprise Funds 37%
Special Revenue Funds 32%
ALL SOURCES OF FUNDSTotal Resources – $3.47 Billion
ALL SOURCES OF FUNDSTotal Expenditures – $3.47 Billion
Operation & Maintenance
71% Debt Service 15%
Capital 14%
*Functions include several small offices such as the Office of Arts and Culture and Environmental Programs.
*Includes Parks, Library, Human Services, Neighborhood Services, Planning and Economic Development
2011-12 Estimated Revenues
Revenues from taxes, fees, interest, grantsand other sources provide resources tofund programs and services delivered bythe city. Total revenues for 2011-12 areestimated at $3,010,928,000. This is$35,411,000, or 1.2 percent less than the2010-11 estimate of $3,046,339,000.General Fund revenues are estimated at$948,636,000, which is $12,315,000 or 1.3percent less than the 2010-11 estimates.The decrease is primarily due to theimpact of the 2010 Census which decreasesthe city’s population percentage from 30.33percent to 28.78 percent for state sharedsales tax and from 30.34 percent to 28.75percent for state shared income tax,effective in 2011-12.
The table on page 41 provides acomparison of the 2011-12 estimatedrevenues to 2010-11 estimates and 2009-10actual collections. Detailed explanationsby category are provided in the 2011-12Revenue Estimates section of thisdocument.
State and local economic growthcontinued to decline in 2009-10 from prioryears due to a variety of factors includingcontinued weakness in the residential andcommercial real estate markets, increasedunemployment, declines in consumerspending and declines in personal incomegrowth. The state and local economy hasstarted to recover, however the samefactors continue to slow economic growthin 2010-11. Local and state sales taxcollections are expected to grow modestlyin 2011-12 after four years of negativegrowth.
Included in 2011-12 estimates for theEnterprise funds are full-year impacts ofrate increases for Water and Wastewaterservices effective April 2011. The 2011-12estimate for Special Revenue fundsincludes a $6.7 million increase in Transit2000 funds and a $2.9 million increase in2007 Public Safety Expansion funds.Special Revenue funds also include a $18.3million decrease for Regional Transitfunds, a $56.3 million decrease forsecondary property taxes and a $44.4million increase in federal funds primarilyfor the Neighborhood StabilizationProgram.
2011-12 Transfers to the General Fund
Transfers are used to allocate resourcesbetween funds for purposes of matchingcosts with benefits received through acentral service cost allocation or to assessin lieu property taxes.
Transfers to the General Fund for 2011-12 total $53.8 million. This amount reflects$51.1 million from Enterprise and otherfunds to recoup central service costsand/or payments for in lieu property taxesfrom the Aviation, Water and Wastewater,Solid Waste, Convention Center andDevelopment Services funds. Centralservice provides a repayment to theGeneral Fund for services provided bydepartments such as Human Resources,Information Technology, Finance, Law andother administrative support areas that areGeneral funded. This transfer is calculatedby the Finance Department in accordancewith generally accepted full-costaccounting principles and is in accordancewith long-established City Council-approved policy.
The Enterprise transfers include$253,000 from the Golf Course Fund torecoup Parks, Recreation and Golfdepartment direct administrative supportcosts. The Golf Fund does not pay citywidecentral service costs or in lieu propertytaxes.
Approximately $2.5 million inmiscellaneous transfers from other fundsalso is included. As a result, total transfersto the General Fund exclusive of excisetax-related items are $53.8 million. Atransfer of $650.9 million from the ExciseTax Fund represents the General Fundshare of local and state-shared sales taxesand fees and state-shared income taxes.However, this amount is reflected inrevenues, rather than a transfer,throughout this section.
2011-12 ESTIMATED ENDINGBALANCES
Arizona budget law requires a balancedGeneral Fund budget. No General Fundbalances may be accumulated in reservefor subsequent fiscal years. Arizona lawdoes, however, provide for a contingency or“rainy day fund” each year. For 2011-12,$37.9 million is included for the GeneralFund contingency, including a $2 millionset aside for Fire and $50,000 forNeighborhood Services, and is discussed inmore detail in the Contingency section ofthis document. As a result, budgetedGeneral Fund resources equalexpenditures. However, any unusedcontingency amounts at year-end fall to aGeneral Fund ending balance. Generally,at least 95 percent of the General Fundcontingency remains unused each year.
Year-end balances are planned in theEnterprise funds and other self-supportingfunds primarily to provide for adequatefunds at the beginning of the followingfiscal year. Such funds are used to stabilizerate increases associated with fluctuationsin service demand, insure bondholders offuture debt service payments and toaccumulate funds for annual pay-as-you-gocapital improvements. In addition,Enterprise Fund balances are intentionallypermitted to grow over time in order tofund large capital projects.
The estimated 2011-12 ending balanceof $563.1 million includes: Transit 2000 -$163.4 million; Aviation - $142.0 million;Wastewater - $122.8 million; Water - $67.2million; Convention Center - $24.0 million;Parks and Preserves - $17.2 million; SolidWaste - $15.6 million; Arizona HighwayUser Revenue - $0.6 million and $10.3million in various other Special Revenueand Enterprise funds. Beginning andending fund balances are provided in moredetail in Schedule 1 located in theSummary Schedules section.
In 2011-12, the Enterprise funds endingbalances in the aggregate are programmedto decline from $559.0 million at thebeginning of 2011-12 to $356.3 million atyear end. The Aviation balance is decliningdue to increased operating expendituresfor the Sky Train operations. Solid Wastefunds are decreasing due to increased
40

vehicle replacement costs and thereopening of the Material RecoveryFacility. Water funds are decreasingprimarily due to increased costs forchemicals and for compliance withfederally mandated water qualityrequirements, which include the operatingcosts associated with the regeneration ofgranular activated carbon. Wastewaterfunds are decreasing primarily due toincreased debt service costs. TheConvention Center Fund balance isdeclining primarily due to decreasedoperating revenues.
Special Revenue Fund balances in theaggregate are expected to decrease from$386.7 million to $206.8 million, primarilydue to the decrease in Secondary PropertyTax revenue and an increase in Transit2000 operating costs for bus servicecontracts, fuel, light rail, and preventivemaintenance. The Arizona Highway UserRevenue Fund balance is decreasing ascosts for street construction continue toincrease while revenue is declining due tothe 2010 Census and cuts made by thestate legislature resulting in a loss ofnearly $12 million in 2011-12. The SportsFacilities Fund is decreasing due toincreased costs for debt service.
2011-12 Estimated Revenues Compared to 2010-11 Estimates(In Thousands of Dollars)
2011-12
2009-10 2010-11 Amount Percent Fund Types Actuals Estimate Estimate Change Change
General $ 946,515 $ 960,951 $ 948,636 ($12,315) (1.3)%
Special Revenue Funds 942,999 966,405 929,639 (36,766) (3.8)%
Enterprise Funds 1,073,618 1,118,983 1,132,653 13,670 1.2%
Total $2,963,132 $3,046,339 $3,010,928 ($35,411) (1.2)%
General Fund Balance Analysis(In Thousands of Dollars)
2009-10 2010-11 Estimate Over (Under) Budget
Actuals Budget Estimate Amount Percent
Resources
Beginning Balances $ 45,580 $ 22,927 $ 46,752 $ 23,825 103.9%
Revenue 946,515 965,408 960,951 (4,457) (0.5)%
Recoveries 1,161 1,500 1,500 0 0.0%
Transfers 47,818 23,998 31,917 7,919 33.0%
Total Resources $1,041,074 $1,013,833 $1,041,120 $ 27,287 2.7%
Expenditures
Operating Expenditures 993,626 1,012,414 965,266 (47,148) (4.7)%
Capital 696 1,419 1,441 22 1.6%
Total Expenditures $ 994,322 $1,013,833 $ 966,707 $ (47,126) (4.6)%
Ending Fund Balance $ 46,752 $ — $ 74,413 $ 74,413 100.0+%
Negative Fund Balance
Golf Fund expenditures have exceededrevenues for several years. The ParksDepartment is exploring various ideas,including alternative operating structures,to correct this issue.
The three dedicated public safetyfunds, Neighborhood Protection, PublicSafety Enhancement, and 2007 PublicSafety Expansion, have been severelyimpacted by declines in sales tax revenues.In November 2010, the Mayor and CityCouncil adopted a Public Safety SpecialtyFunds Balancing plan to balance the Firefunds by June 30, 2014 and the Policefunds by June 30, 2015.
41

2011-12 Operating Budget$3,474,413,000
General$929,929,000
NeighborhoodProtection$28,272,000
Parks & Recreation$89,567,000
Library$35,277,000
Cable$4,342,000
Public SafetyEnhancement
$31,057,000
Transit 2000$160,503,000
DevelopmentServices
$31,227,000
Sports Facilities$1,840,000
Impact FeeProgram Admin.
$378,000
CommunityReinvestment
$333,000
2007 Public SafetyExpansion
$62,798,000
Parks & Preserves$2,002,000
Court Awards$11,434,000
Capital Construction$205,000
Arizona Highway User Revenue$44,528,000
Regional Transit$20,487,000
Grants$255,712,000
Aviation$224,183,000
Water$198,537,000
Wastewater$96,549,000
Solid Waste$130,439,000
Convention Center$49,971,000
Golf$8,391,000
A
Other Restricted$32,298,000
Regional WirelessCooperative$3,630,000
GENERAL FUNDS$1,059,115,000
SPECIAL REVENUEFUNDS
$1,083,304,000
ENTERPRISEFUNDS
$708,070,000
SPECIAL REVENUEFUNDS
$686,704,000
OPERATINGEXPENDITURES$2,453,889,000
D
42
City of Phoenix Financial Organizational Chart

Arizona HighwayUser Revenue$22,001,000
City Improvement$63,873,000
Sports Facilities$23,295,000
Secondary PropertyTax
$99,757,000
Aviation$82,070,000
Wastewater$93,665,000
Convention Center$19,192,000
General Fund$3,733,000
Parks and Preserves$46,534,000
Transit 2000$16,426,000
Capital Construction$26,250,000
Arizona HighwayUser Revenue$44,485,000
CommunityReinvestment
$4,400,000
Other Restricted$16,140,000
Regional Transit$8,766,000
Grants$61,235,000
Aviation$54,721,000
Wastewater$73,558,000
Convention Center$2,167,000
Water$113,158,000
Solid Waste$14,682,000
DevelopmentServices$66,000
O
DEBT SERVICE$534,203,000
PAY-AS-YOU-GOCAPITAL
$486,321,000
Water$115,623,000
Solid Waste$14,726,000
Golf$1,000
43
City of Phoenix Financial Organizational Chart

44
Phoenix is the core of Maricopa Countyand the state’s population and economiccenter. With its attractive climate,recreational opportunities, and affordablecosts of living and doing business, the cityhas experienced sustained growth. ThePhoenix area has been affected by thenational recession and growth has slowedin terms of population, employment andpersonal income growth. The city’s area,just under 520 square miles, increasesperiodically with annexations.
Population in Phoenix has consistentlyoutpaced the United States growth overthe last 18 years, and according to the2010 census, is just over 1.4 millionmaking Phoenix the nation’s sixth-largestcity. The city’s employment base is thefoundation of a deep and diversemetropolitan area economy. The primaryemployment sectors in the Phoenix areaconsist of professional and businessservices, trade, government, education andhealth services, financial activities, leisureand hospitality, and construction. Whilethe unemployment rate in greater Phoenixhas suffered during this economicdownturn, jobs recovery is predicted to bebetter in 2011 than in 2010.
Last year, the city faced a $277.3million shortfall to the General Fundaddressed in part with extensive serviceand program cuts totaling $63.7 million.The city faces a much smaller deficit for2011-12 in the amount of $58.8 million andthe budget will not include any directservice reductions to the community. Thebalanced budget for 2011-12 utilizes sevenimportant factors and responsible actionsto overcome the projected budget deficit.They are: 1) Strong Employee Relationsand Employee Sacrifices; 2) Doing Morewith Less; 3) Enhanced Compliance and
Accurate Estimates; 4) Focus onInnovation and Efficiency; 5) ResponsibleFinancial Management; 6) Keeping PublicSafety Our Number One Priority; 7)Reduced Tax Collection in Adverse Times.
Noteworthy impacts to the GeneralFund in the 2011-12 budget include $30 –$45 million in savings realized fromrestructuring existing excise debt, $23.9million in budget reductions, efficiencysavings and cost-cutting measures bydepartments; an increase of $5.9 million toprovide ongoing funding for the Council-approved Public Safety Restoration Planfrom last year’s budget; $2 million forexpiring firefighter grants; increase in theContingency Fund by $3 million more thanlast year’s 3.1 percent level; $1.6 millionfor new facilities operating costs; up to$1.4 million for compensation/benefit andpension reform studies; and $550,000 forthe city pools restoration plan. Non-General Fund changes in the proposedbudget include $385,000 in savings in theAviation Department by replacingcontracted services with city staff forvarious functions. The Water Departmentwill achieve savings by consolidating theirdowntown payment function with theFinance Department.
Local and national economists arepredicting that the economy will be betterin 2011 than it was in 2010, but the road torecovery will be slow. However, theproposed budget does not reflect a changeto state-shared revenue formulas imposedby the state legislature. Any change in theformula that would decrease state-sharedrevenues would require deeper cuts tobalance the budget.
The chart that follows indicates howmajor services provided to Phoenixresidents have been adjusted in responseto local economic and financial conditions.Because benchmarking is an importantmeasure of the efficiency and effectivenessof services provided, we have also includedmulti-city comparisons of performance inseveral areas. Much of the data for thesecomparisons is taken from the 2009International City/County ManagementAssociation's Center for PerformanceMeasurement report.
Services to the Community
45
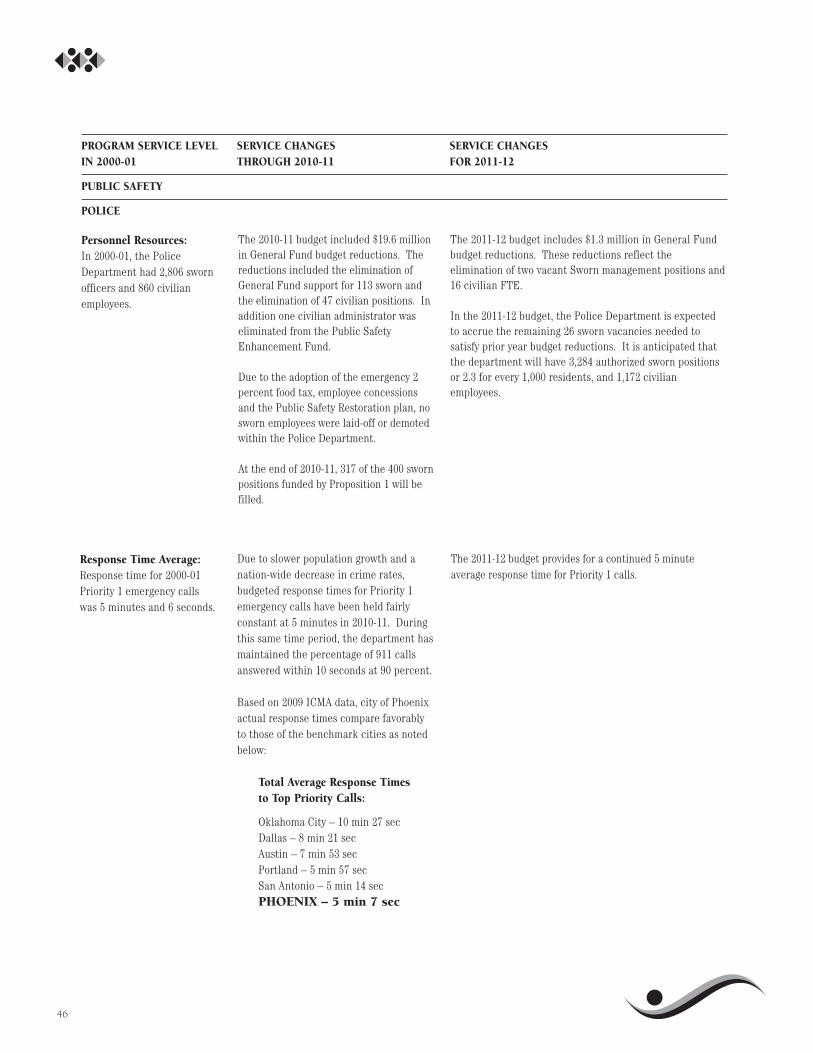
46
PROGRAM SERVICE LEVEL SERVICE CHANGES SERVICE CHANGESIN 2000-01 THROUGH 2010-11 FOR 2011-12
PUBLIC SAFETY
POLICE
Personnel Resources:In 2000-01, the PoliceDepartment had 2,806 swornofficers and 860 civilianemployees.
The 2010-11 budget included $19.6 millionin General Fund budget reductions. Thereductions included the elimination ofGeneral Fund support for 113 sworn andthe elimination of 47 civilian positions. Inaddition one civilian administrator waseliminated from the Public SafetyEnhancement Fund.
Due to the adoption of the emergency 2percent food tax, employee concessionsand the Public Safety Restoration plan, nosworn employees were laid-off or demotedwithin the Police Department.
At the end of 2010-11, 317 of the 400 swornpositions funded by Proposition 1 will befilled.
The 2011-12 budget includes $1.3 million in General Fundbudget reductions. These reductions reflect theelimination of two vacant Sworn management positions and16 civilian FTE.
In the 2011-12 budget, the Police Department is expectedto accrue the remaining 26 sworn vacancies needed tosatisfy prior year budget reductions. It is anticipated thatthe department will have 3,284 authorized sworn positionsor 2.3 for every 1,000 residents, and 1,172 civilianemployees.
Response Time Average:Response time for 2000-01Priority 1 emergency callswas 5 minutes and 6 seconds.
Due to slower population growth and anation-wide decrease in crime rates,budgeted response times for Priority 1emergency calls have been held fairlyconstant at 5 minutes in 2010-11. Duringthis same time period, the department hasmaintained the percentage of 911 callsanswered within 10 seconds at 90 percent.
Based on 2009 ICMA data, city of Phoenixactual response times compare favorablyto those of the benchmark cities as notedbelow:
Total Average Response Times to Top Priority Calls:
Oklahoma City – 10 min 27 secDallas – 8 min 21 secAustin – 7 min 53 secPortland – 5 min 57 secSan Antonio – 5 min 14 secPHOENIX – 5 min 7 sec
The 2011-12 budget provides for a continued 5 minuteaverage response time for Priority 1 calls.
Response Time Average:In 2000-01, the Fire Departmentmaintained an average responsetime of 4 minutes 47 seconds forall fire and medical emergencycalls.
Since 2000-01, response times have decreased 2percent to 4 minutes 42 seconds for all fire andmedical emergency calls. This 5 second decrease is atleast partly attributed to staffing and deploymentchanges for paramedic engine companies andambulances. The overall incident activity levelincreased 16 percent from 2000-01 to 2010-11.
The 2010-11 budget included a $9.0 million reduction.The budget cuts resulted in the elimination of 21.3general funded civilian positions, including the FireMarshal whose duties were reassigned. The budgetreductions also included the elimination of twodeputy chiefs, six battalion chiefs, seven Firecaptains, and 13 firefighters for a total of 28 swornpositions.
The department reorganized operations in response tostaff reductions and significant cuts were made inovertime. In addition, program reductions were madein contractual services, commodities and capitaloutlay.
The department eliminated three positions and re-classed two positions down in pay class as part of theCity Manager’s Reorganization.
In addition, four positions from the New ConstructionSection were eliminated and one position from thissection as well as the Site Planning Section (threepositions) was moved to the Planning andDevelopment Department.
Based on 2009 ICMA data, city of Phoenix responsetimes are consistent with those other benchmarkcities as noted below:
Percentage of All Calls to Which Response Time is Under 8 Minutes:
Austin – 89 percentDallas – 89 percentLong Beach – 89 percentOklahoma City – 87 percentPHOENIX – 81 percentSan Antonio – 82 percent
The 2011-12 budget recommends retainingcurrent emergency response staffing levelsto preserve less than 5 minute averageresponse time for all fire and medicalemergency calls.
The 2011-12 budget includes a $678,000reduction and reflects the elimination of 4.7general funded civilian positions as well asthe reduction of sworn and civilianovertime. In addition, program reductionsare proposed in contractual services,commodities and capital outlay.
47
PROGRAM SERVICE LEVEL SERVICE CHANGES SERVICE CHANGESIN 2000-01 THROUGH 2010-11 FOR 2011-12
PUBLIC SAFETY
FIRE

48
Emergency Transportation:In 2000-01, the city of Phoenix hada total of 20 full-time and nine part-time ambulances in service.
The city initiated the Emergency TransportationSystem in 1985-86 with 10 full-time and six part-time ambulances. In 1987-88, the EmergencyTransportation System was increased to 12 full-time and six part-time ambulances. Theaddition of four ambulances funded withrevenue from Proposition 301 and theconversion of the department’s last medic unitsto ambulances resulted in 19 full-time and ninepart-time ambulances in service during 1997-98.
The 2000-01 budget included funding to add afull-time ambulance at Station 38 in AhwatukeeFoothills. Two part-time ambulances wereadded in mid-fiscal year 2002-03 to improveresponse times in fast growing, outlying areas ofthe city.
The 2004-05 budget included funding for twoadditional full-time ambulances. Theseadditions increased the EmergencyTransportation System to 22 full-time and 11part-time ambulances.
The 2006-07 budget included funding oneadditional ambulance.
The 2008-09 budget added two part-timeambulances funded by Proposition 1.
The 2009-10 budget included the elimination oftwo part-time ambulances.
The 2010-11 budget included the elimination oftwo full-time ambulances and the reduction ofpart-time ambulance operational times. In-service hours for part-time ambulances werereduced from 12 hours to 10.8 hours per day.These changes decrease the EmergencyTransportation System to 21 full-time and 11part-time ambulances.
The 2011-12 budget includes no changes inservice for Emergency Transportation.
PROGRAM SERVICE LEVEL SERVICE CHANGES SERVICE CHANGESIN 2000-01 THROUGH 2010-11 FOR 2011-12
PUBLIC SAFETY
FIRE
49
Service Miles/Hours:In 2000-01, 12,608,638 annualbus service miles were providedon weekdays and weekends inthe city of Phoenix.
Annual 2010-11 bus miles are estimated at 16,853,484 and Dial-a-Rideservice hours are estimated at 324,990.
The 2010-11 budget restored early morning weekday fixed route busservice and federally mandated Americans with Disabilities Act (ADA)Dial-a-Ride to service levels that existed prior to December 2008.
Same-day Dial-a-Ride service was eliminated. Elimination of thisservice discontinued the ability for ADA certified individuals, personswith disabilities and seniors age 65 and over to access Phoenix Dial-a-Ride on the day of the request for service. Federally mandated ADAservice levels were not affected. Savings from the reduced servicelevel funded an additional 464,000 taxi vouchers annually.
RAPID commuter service was reduced by eliminating onemorning/inbound and one afternoon/outbound trip in each RAPIDcorridor (SR51, I-10 East, I-10 West and I-17).
Route 15 was reduced by eliminating the portion of the route fromCentral Station to Phoenix Sky Harbor Airport.
Route 122 was reduced by eliminating the southern segment travelingsouth of Metrocenter along 39th Avenue.
Route 32 was eliminated.
Route 10 was modified by rerouting service from traveling north andsouth on 28th Street between Camelback Road and Oak Street totraveling north and south on 32nd Street between Camelback Roadand Oak Street.
Route 16 was modified by extending current alignment north of theSunnyslope area to cover the northern portion of the eliminated Route 32.
Weekday service frequency was reduced on Route 1 by 15 minutes,from 30 to 45 minutes.
Saturday and Sunday service was reduced on Route 52 by 15 minutes,from 45 to 60 minutes.
The DASH Downtown loop was eliminated. The DASH Governmentloop will continue to operate.
Annual 2011-12 bus miles areestimated at 16,647,230 andDial-a-Ride service hours areestimated at 324,990.
The Public TransitDepartment 2011-12 operatingbudget includes a new taxi-subsidy program, to helpaddress the need for same-daytransportation of Phoenixresidents under the age of 65who are certified forparatransit service under theAmerican’s with DisabilitiesAct (ADA). Programparticipants will be able topurchase up to four $20coupon books monthly.
The following service changeswill be effective Jan. 25, 2012:extend service on Route 77west along Baseline Road from40th to 75th avenues; reducethe frequency of service fromBaseline to Dobbins roads onRoute 0 from 10 to 20minutes; eliminate servicefrom 7th Avenue to 7th Streetalong Baseline Road on Route8; eliminate service on Route19 from 27th to 40th avenuesalong Baseline Road; andchange Route 35 turnoff ontoBaseline Road from headingwest to 40th Avenue toheading east to the 27thAvenue Park-and-Ride.
PROGRAM SERVICE LEVEL SERVICE CHANGES SERVICE CHANGESIN 2000-01 THROUGH 2010-11 FOR 2011-12
TRANSPORTATION
PUBLIC TRANSIT

50
Average Weekday BusRidership:In 2000-01 the average weekdaybus ridership was 124,200.
In the 2010-11 budget, weekday ridership is estimated at 126,800. In the 2011-12 budget,weekday ridership isestimated at 128,702.
Service Miles/Hours:(continued)
Holiday service was implemented for five additional days: MartinLuther King Jr., Presidents Day, Veterans Day, day after Thanksgivingand Christmas Eve. This reduced the frequency of service from aweekday schedule to a Sunday schedule.
Service on the following neighborhood circulators: ALEX, DART, DeerRun, MARY and SMART was reduced by 58 percent.
Route 39–40th St was provided at a reduced level of service.
Route 13 was modified by eliminating the service segment on MohaveStreet from 7th to 16th avenues. In addition, Route 29-Thomas Roadwas modified to include a shorter trip turnaround.
PROGRAM SERVICE LEVEL SERVICE CHANGES SERVICE CHANGESIN 2000-01 THROUGH 2010-11 FOR 2011-12
TRANSPORTATION
PUBLIC TRANSIT
51
Major and Collector StreetSweeping and Maintenance:In 2000-01, sweeping majorand collector streets wasscheduled for every 14 days.
The 2000-01 budget increased frequency of street sweeping service toevery 14 days to improve air quality. The budget also added capital fundingto improve maintenance, pave dirt alleys and install additional sidewalksand curbs.
In 2003 04, budget constraints reduced funding for making quick concreterepairs to infrastructure throughout the city. Funding for paving dirt alleysalso was reduced as was funding for retrofitting sidewalk ramps. Anasphalt crew responsible for repairing asphalt pavement on major,collector and local streets was eliminated.
Continued budget constraints in 2004-05 reduced funding for retrofittingsidewalk ramps and neighborhood concrete repairs.
Dust proofing of dirt alleys continued to see reduced funding in both 2004-05 and 2005-06.
The 2007-08 budget added funding to improve the general maintenance ofstreets.
The 2009-2010 budget reduced funding for coordination of maintenanceprojects, eliminated all heater panel crews responsible for repairing failedstreet cuts and shifted this work to asphalt crews. It reduced by 25percent the downtown hand crews that pick up trash, sweep sidewalks andhand sweep portions of the street that cannot be reached by motor broomequipment within the boundaries of 3rd Avenue to 7th Street and VanBuren to Jefferson streets. In addition, the budget eliminated one of threeequipment operator positions responsible for operating equipment used onlarge paving repairs, resulting in a 33 percent reduction in repairs.
The 2010-11 budget eliminated one of six equipment operators who wereresponsible for supporting the Street Cleaning Section. This reduced thesection’s ability to provide special street sweeping requests and eventsupport. Reductions did not impact routine street sweeping whichcontinued to be scheduled every 14 days. The budget also reduced thenumber of employees responsible for repairs of small maintenanceequipment, eliminated two of four miscellaneous crews responsible forinstallation, and maintenance of 1,000 permanent barricades throughoutthe city, eliminated a position responsible for placing sand on spills in thestreet, and reduced the downtown hand crew by an additional 50 percent.
Reductions to 2011-12Arizona Highway UserRevenue were broughtabout by the impact ofCensus 2010 and cuts ofnearly $12 million made bythe state of Arizona.
Residential Street Sweeping:In 2000-01, the city of Phoenixprovided street sweepingservice four times a year.
No changes were included in the 2010-11 budget. No changes are included inthe 2011-12 budget forresidential street sweeping.
PROGRAM SERVICE LEVEL SERVICE CHANGES SERVICE CHANGESIN 2000-01 THROUGH 2010-11 FOR 2011-12
TRANSPORTATION
STREET TRANSPORTATION

52
PROGRAM SERVICE LEVEL SERVICE CHANGES SERVICE CHANGESIN 2000-01 THROUGH 2010-11 FOR 2011-12
TRANSPORTATION
STREET TRANSPORTATION
Sealcoat:In 2000-01, the city of Phoenixprovided 95 miles of sealcoat.
In 2004-05, due to budget constraints and increased cost of materials,the number of sealcoat miles was reduced to 81 miles annually.
Increased material costs and continued budget reductions in fiscal year2005-06 further reduced the number of annual miles to be sealcoated to49.
In 2006-07, 35 miles of city streets were sealcoated. This decrease wasdue to continued increases in material costs.
In 2009-10, funding was diverted to pilot the Fractured AggregateSurface Treatment (FAST) program. The FAST application was used tosealcoat 12 miles of city streets.
The 2010-11 budget included funding for 41 miles of city streets to besealcoated. The Fractured Aggregate Surface Treatment (FAST) pilotprogram was put on hold in 2010-11.
Based on 2009 International City/County Management Association data,city of Phoenix paved road rehabilitation expenditures per capitacompare favorably to those of other benchmark cities as noted below:
Paved Road Rehabilitation Expenditures per Capita:Oklahoma City – $52.63San Antonio – $36.38Dallas – $25.32Portland – $20.07PHOENIX – $19.37
The 2011-12 budgetincludes funding for 41miles of city streets tobe sealcoated.
Asphalt Overlay:In 2000-01, 140 miles of overlay wereperformed.
In 2004-05, 105 miles were overlaid. This decrease in mileswas due to increased cost of materials and bad weather.
In 2005-06, 89 miles were overlaid and in 2006-07, 76 milesoverlaid. These decreases were primarily due to continuedincreases in cost of materials.
In 2007-08, due to continued increases in cost, 62 miles ofasphalt overlay were completed.
For 2008-09, due to continued cost increases and budgetreductions impacting the installation of ADA sidewalkramps, which also impact street overlay projects, 60 milesof asphalt overlay were completed.
In 2009-10, 97 miles of city streets were overlaid withrubberized asphalt. This increase was due to a diversion of$1 million in Capital Improvement Project (CIP) fundsfrom other CIP projects to the overlay and sidewalk rampcontracts.
The 2010-11 budget provided for 85 miles of overlay,including 65 miles that were funded by the AmericanRecovery and Reinvestment Act (ARRA).
The 2011-12 budget provides for 172miles of overlay. The projectedincrease in the number of miles ofoverlay is due to a portion of fundsprogrammed for 2010-11 beingcarried over to allow necessaryconcrete work to be completed in2010-11.

53
PROGRAM SERVICE LEVEL SERVICE CHANGES SERVICE CHANGESIN 2000-01 THROUGH 2010-11 FOR 2011-12
COMMUNITY DEVELOPMENT
HOUSING
Scattered Sites HousingProgram:In 2000-01, the HousingDepartment had 450 units.
This homeownership program allows eligible tenants theopportunity to purchase their home. Between 1998-99and 2007-08, the program’s total inventory expanded to480 units. The 2010-11 inventory of 427 units reflects thesale of 53 homes to eligible tenants over the past decade.
In the 2011-12 budget, the program isexpected to maintain the current 427Scattered Sites homes.
Affordable Housing Program:In 2000-01, this program had1,034 units for families andindividuals.
By the end of 2010-11, the Affordable Housing Programwas expanded to a total of 2,174 city-owned units forfamilies and individuals with the addition of the 730 unitsfrom the newly acquired Santa Fe Springs, Pine Crest andSummit properties.
In 2011-12, the program is expected tomaintain its current inventory of 2,174affordable housing units for families andindividuals.
Conventional HousingProgram:This program has been in effectsince 1951-52. In 2000-01, therewere 2,176 units.
In 2003-04, the program’s beginning inventory before theMatthew Henson HOPE VI project was initiated was2,176 units. Due to the reconstruction activities fundedby the HOPE VI grant, 280 units became unavailable atthe Matthew Henson housing site. One additional unitwas transferred to the St. Vincent de Paul organization.The conventional housing inventory at the end of 2004-05was 1,895 units.
At the conclusion of the Matthew Henson HOPE VIproject in 2008-09, the department had 2,113 publichousing units. During this period, 14 original units atMatthew Henson were removed from the inventory andare being maintained for historical preservation
Also in 2008-09, the Krohn West HOPE VI project wasawarded and the McCarty on Monroe project wasinitiated which demolished 100 existing units forreconstruction. The removal of 76 units from the KrohnWest HOPE VI project and the 24 units from McCarty onMonroe reduced the total conventional housing inventoryto 2,013 at year end of 2008-09.
The McCarty on Monroe project was completed in 2009-10, adding back 34 units. The 2009-10 year end inventoryof conventional housing units was 2,047.
In 2010-11, the department demolished 138 units locatedwithin in the East AMP to make way for the new FrankLuke addition, bringing the year-end inventory ofconventional housing units to 1,909.
In the 2011-12 budget, the program isexpected to decrease its inventory to1,834 conventional housing units byconverting 125 units at the Marcos deNiza property to project-based Section 8housing vouchers and adding 50 unitsfrom the newly acquired Summitproperty.
PROGRAM SERVICE LEVEL SERVICE CHANGES SERVICE CHANGESIN 2000-01 THROUGH 2010-11 FOR 2011-12
COMMUNITY DEVELOPMENT
NEIGHBORHOOD SERVICES
Neighborhood PreservationCase Cycle Time (Days)In 2000-01, with the addition of eightinspector positions, cases wereresolved in an average of 66 days.
Over time, ongoing process improvements,streamlining and automation resulted in furthercase cycle time improvements despite anincreasing caseload. Overall average case cycletime improved from 83 days in 2001-02 to 53 days in2004-05.
Case cycle times increased to 61 days in 2005-06due to reduced staffing and abatement funding, butimproved to 56 days in 2006-07, and to 51 days atthe close of 2007-08 with the continued applicationof technology, training and quality control.
Significant staffing and resource reductions inMarch 2009 caused case cycle times to increase,but only slightly, to 53 days. The increase wasminimized by the implementation of an enhancedquality control program, supplemented bysupervisory access to more detailed performanceindicator reports.
The overall case cycle time improved to an averageof 51 days during 2009-10. This is attributed toimplementing program efficiencies.
Based on 2009 ICMA data, city of Phoenix codeenforcement expenditures per capita comparesfavorably to those of other benchmark cities asnoted below:
Code Enforcement Expenditures per Capita:Dallas - $9.49Long Beach - $6.86PHOENIX – $5.70San Antonio – $4.73Oklahoma City - $3.88Kansas City – $2.42
In 2011-12, it is anticipated the casecycle time will remain at approximately51 days.
54
55
PROGRAM SERVICE LEVEL SERVICE CHANGES SERVICE CHANGESIN 2000-01 THROUGH 2010-11 FOR 2011-12
COMMUNITY DEVELOPMENT
ECONOMIC DEVELOPMENT
Head Start Program:In 2000-01, the Human ServicesDepartment served 2,886 children.
The program was expected to serve 3,090 childrenduring 2010-11.
The program is expected to serve 3,090children in 2011-12.
Senior Nutrition Program:In 2000-01, the Human ServicesDepartment served 545,000congregate and home-deliveredmeals.
For 2010-11, the program was expected to serve611,000 congregate and home-delivered meals.
In the 2011-12 budget, it is anticipatedthat the number of congregate andhome-delivered meals will be 612,000.
Employment Growth RateCompared to Other CitiesIn 1999, Phoenix’s employmentgrowth rate was strong compared tothe following benchmark cities:
Austin – 4.7%Long Beach – 3.9%San Diego – 3.5%PHOENIX – 3.4%Dallas – 2.9%Fort Worth – 2.8%San Antonio – 2.1%San Jose – 2.0%Kansas City – 1.9%
The current issues inhibiting more robust growth inthe economy are expected to continue through2011. These include high levels of unemployment,large consumer debt loads, reduced income andwealth, weak housing and commercial real estatemarkets, rising health care cost and budgetdeficits.
Based on data from the Bureau of Labor Statistics,Phoenix had an increase in the EmploymentGrowth Rate as compared to all but two benchmarkcities:
Austin – 2.0%PHOENIX – 1.7%Dallas – 1.4%Ft. Worth-Arlington – 1.0%San Jose – 1.0%San Antonio – .8%San Diego – .5%Los Angeles/Long Beach – .3%Kansas City – (1.9)%
It is anticipated employment willcontinue to modestly grow in 2011-12.
COMMUNITY ENRICHMENT
HUMAN SERVICES

56
PROGRAM SERVICE LEVEL SERVICE CHANGES SERVICE CHANGESIN 2000-01 THROUGH 2010-11 FOR 2011-12
COMMUNITY ENRICHMENT
PARKS AND RECREATION
Swimming Pools:In 2000-01, the city of Phoenixhad 28 public swimming pools.
In 2000-01, staffing was added to provide year-round operation for theParadise Valley Diving Well.
In 2003-04, Pecos Pool was opened, increasing the number of pools to 29.
In the 2009-10 budget eight pools were closed for infrastructure repairs ona rotating basis beginning in May 2009.
In the 2010-11 budget, Cortez Pool was closed indefinitely due to the needfor significant structural repairs.
In the 2011-12 budget, 28 of29 pools will provide openswim. Eight poolspreviously closed forinfrastructure repairs willre-open. Beginning May2012, Cortez Pool willcontinue to be closedindefinitely.
Swimming Pool Season:In 2000-01, swimming poolswere open for 12 weeks duringthe summer months.
In 2003-04, budget considerations forced the city to reduce the swim seasonto 10 weeks. All pools closed in mid-August to coincide with the beginning ofthe school year.
The 2005-06 budget reduced the swim season by closing pools one weekearlier, resulting in a nine-week season.
Changes included in the 2007-08 budget added funding to increase the poolseason at all 29 pools. These funds added weekend hours beginning inAugust and continuing through Labor Day.
The 2008-09 budget eliminated weekend pool hours in May and Augustexcept for the Memorial Day weekend.
The 2009-10 budget reduced the swimming season by eliminating open swimhours during the last week in July. The 2009-10 budget also reduced dailyopen swim hours, and closed all city pools on Friday. Pools hours open to thepublic were changed from 1 p.m. to 7 p.m. instead of noon to 8 p.m. Also,fees were increased for general swim lessons and recreational teams.
No changes were included in the 2010-11 budget.
No changes are included inthe 2011-12 budget for theswimming pool season.Swimming pools arescheduled to be open foreight weeks during thesummer months.
Children’s Summer Recreation Programs:In 2000-01, the city ofPhoenix provided recreationprograms at 127 programsites.
In 2007, the Parks and Recreation Department conducted a comprehensiveevaluation of Phoenix After-school Center (PAC) programming. Changeswere implemented including re-defining what constituted an after-schoolprogram versus an after-school site. Based on this new definition, the 2007-08 summer program had 32 sites and 50 program units (some sites havemore than one program).
No changes were included in the 2008-09 budget.
The 2009-10 budget reduced summer PAC to 16 sites and increased fees.
Beginning June 2010, all summer PAC sites were eliminated.
No changes are included inthe 2011-12 budget forchildren’s summerrecreation programs.
57
PROGRAM SERVICE LEVEL SERVICE CHANGES SERVICE CHANGESIN 2000-01 THROUGH 2010-11 FOR 2011-12
COMMUNITY ENRICHMENT
PARKS AND RECREATION
School Recreation ProgramDuring School Year:In 2000-01, funding wasprovided for an additional 32sites, which were added for atotal of 133.
The 2001-02 budget added another 33 sites, raising the total to 166.
In 2007-08, additional funding was provided to improve after-schoolprogramming.
In 2007, the Parks and Recreation Department conducted acomprehensive evaluation of Phoenix Afterschool Center (PAC)programming. Changes were implemented including re-defining whatconstituted an after-school program versus an after-school site. Based onthis new definition, the 2007-08 school year had 83 sites and 166 programunits (some sites have more than one program).
Budget reductions in 2008-09 reduced the number of after-school programunits to 104, which included reducing the number of sites to 81.
The 2009-10 budget reduced the number of after school program sites to42 (the department no longer uses program units in their definition ofprogram sites). After the budget was approved, fees were increased and anadditional 13 sites were added. Total sites operated were 55.
The 2010-11 budget further reduced after-school sites to 25 General Fund-supported sites and five full cost recovery sites effective June 2010.
No changes are included inthe 2011-12 budget forschool recreation programsduring the school year.
PROGRAM SERVICE LEVEL SERVICE CHANGES SERVICE CHANGESIN 2000-01 THROUGH 2010-11 FOR 2011-12
COMMUNITY ENRICHMENT
LIBRARY
Central Library:The new Burton Barr CentralLibrary opened in May 1995. In2000-01, the budget extendedhours to 9 p.m. on schoolnights. As a result, BurtonBarr Central Library provided75 hours of service per week.
In April 2003, Central Library hours were reduced to 66 hours per week as a result ofcitywide budget reductions.
The 2007-08 budget included opening the Central Library at 9 a.m. Monday throughSaturday, increasing hours of service from 66 to 72 hours per week.
In 2008-09, the budget for books and other circulating materials for Central Library wasreduced and the printed version of the calendar of events was eliminated.
In March 2009, the hours of operation were reduced from 72 hours per week to 52 hoursper week at Central Library. Programming for children, teens and adults was alsoreduced; and facilities maintenance projects were delayed.
In April 2010, customer service and Accessibility Center services at the Central Librarywere reduced.
In December 2010, the hours at Central Library were expanded by six hours per week.The library is currently open 58 hours per week.
No changes areincluded in the 2011-12 budget for theCentral Library.
Branch Libraries:The 2000-01 budget extendedall branch hours to 9 p.m. onschool nights. As a result,every branch was open 75hours per week, increasingtotal branch library servicehours to 900 per week.
In April 2003, as a result of budget reductions, branch library hours were reduced to 66hours per week, decreasing total branch library service hours to 792 per week.
The new 15,000-square-foot Desert Broom Library serving the Desert View Village areaopened in February 2005 for 66 hours per week, increasing total branch library servicehours to 858 per week.
The new Palo Verde Library opened in January 2006, replacing the existing 10,000-square-foot library with a new 16,000-square-foot facility.
The new 25,000-square-foot Cesar Chavez Library, serving the western South MountainVillage, opened in January 2007 for 66 hours per week, increasing total branch libraryservice hours to 924 per week.
The 2007-08 budget included opening all branch libraries at 9 a.m. Monday throughSaturday, increasing total branch library service hours to 1,008 per week.
The renovation of Saguaro Library was completed during spring 2008 and opened to thepublic on June 6, 2008.
Due to budget reductions in 2008-09, staffing was reorganized to create regional managersand reduce a supervisory layer at the branches; facilities maintenance projects weredeferred; the opening of the new Agave Library was delayed; the printed calendar ofevents was eliminated, and the budget for books and other circulating material wasreduced by 18.9 percent.
In March 2009, the hours of operation were reduced from 72 hours per week to 52 hoursper week at seven locations and to 48 hours per week at eight locations. The budget forcirculating materials and programming for children, teens and adults was also reduced;facilities maintenance projects were delayed.
The new Agave Library, located at 33rd Avenue and Pinnacle Peak Road, opened in June2009.
The new 12,300-square-foot replacement for Harmon Library opened to the public inSeptember 2009.
In April 2010, the hours of operation per week were reduced from 52 to 44 at sevenbranches and 48 to 40 at the remaining branches.
A new SouthMountainCommunity Library,jointly operated byMaricopa CountyCommunity CollegeDistrict and the cityof Phoenix, isscheduled to openAugust 2011 on thecampus of SouthMountainCommunity College –open 72 hours perweek.
No changes in hoursof existing branchesare included in the2011-12 budget.
58
59
PROGRAM SERVICE LEVEL SERVICE CHANGES SERVICE CHANGESIN 2000-01 THROUGH 2010-11 FOR 2011-12
COMMUNITY ENRICHMENT
LIBRARY
ENVIRONMENTAL SERVICES
WATER SERVICES
Water Bill Comparison forSingle-Family HomesBeginning with 2002-03, this is a newmeasure.
In a March 2011 survey, Phoenix’s average monthlywater bill compared favorably to the followingbenchmark cities:
San Diego - $72.84San Jose –$53.32Kansas City –$52.15Austin –$48.40Dallas –$43.21Tucson –$39.87PHOENIX –$36.12Alburquerque –$29.21San Antonio –$19.96
It is anticipated Phoenix water rates willcontinue to favorably compare tobenchmark cities during 2011-12.
Wastewater Bill Comparison for Single-Family HomesBeginning with 2002-03, this is a newmeasure.
In a March 2011 survey, Phoenix’s average monthlywastewater bill compared favorably to the followingbenchmark cities:
Austin –$51.73San Diego - $45.94San Jose –$32.86Kansas City - $32.19Tucson –$32.52Dallas –$31.40PHOENIX –$22.34San Antonio –$19.32Alburquerque –$14.09
It is anticipated Phoenix wastewaterrates will continue to favorably compareto benchmark cities during 2011-12.
Branch Libraries: (continued) Additionally in April 2010, the staff and library materials at Century, Acacia andOcotillo branch libraries were reduced resulting in decreased direct customerservice and increased time to access library materials. Administrative and supportstaff were also reduced resulting in slower processing and re-shelving of materialssystem-wide and less timely maintenance of facilities.
In December 2010, the hours at Mesquite Library were increased by six hours perweek.
Based on 2009 ICMA data, the Phoenix library system compared very favorably toother benchmark cities as noted below:
Cost per Item Circulated:
Long Beach – $5.87Austin – $4.61San Antonio – $4.54Dallas – $2.40PHOENIX – $2.05

60

Each year, the city of Phoenix budget isdeveloped in conjunction with the Mayorand City Council, residents, cityemployees, the City Manager’s Office andall city departments.
Modified Zero-Base Budgeting Process
The city of Phoenix uses a modified zerobase budgeting process. Each fall,departments submit an estimate (calledthe “base budget”) of the costs associatedwith providing their current levels ofservice for the following year. Budget andResearch Department staff review thesebase budget estimates to ensure that onlythe funding needed to continue currentservice levels is included in thedepartment’s base budget for the followingyear. A department’s base budget fundingmay differ from its current year funding fora variety of reasons. For example, anincrease or decrease in electricity orpostage rates would be reflected in thebase budget.
After these base budget requests arereviewed, departments typically are askedto identify 5 to 10 percent of their budgetfor potential elimination. These proposalsare called base reductions and representthe department’s lowest-priority activities.Departments are also asked to provide anyrequests for new or expanded programs.These are called supplemental budgetrequests. Base reductions andsupplemental requests include alloperating and maintenance costsassociated with a specific program orservice. For example, costs for aswimming pool would include personnelcosts for a lifeguard and other staff,chemicals for the pool, buildingmaintenance and utilities.
When base reductions andsupplemental requests are proposed, theyare ranked together according to the
department’s priorities. The department’sranking indicates whether making a basereduction to add a new program would bepossible, and also indicates whichsupplemental programs and basereductions are most critical to thedepartment. These rankings are used bycity management to assist in the creationof the proposed trial budget.
The City Council then provides input tothe city manager for the preparation of thetrial budget, which is reviewed with theCity Council early each spring. Thepurpose of the trial budget is to enable thecommunity and the City Council tocomment on a balanced budget proposalwell before the city manager is required tosubmit his recommended budget in mid-May. Public hearings are conductedthroughout the community during day andevening hours. The city manager'srecommended budget reflects the inputreceived from the community and CityCouncil during the public hearings. TheCity Council makes final budgetrecommendations after the city manager’srecommended budget is reviewed.
2011-12 BUDGET PROCESS
Initial Budget Status
In September 2010, Budget andResearch staff presented a very earlyreview and discussion of the 2010-11budget to the City Council. At that timestaff focused on the General Fund,providing financial results for the previousfiscal year. Staff reported that the 2009-10fiscal year ended with higher thanestimated resources and less thanexpected expenditures, resulting in astronger starting position for fiscal year2010-2011. The 2009-10 ending balancewas $46.8 million, more than doubling theestimated ending balance. These savingsput the city in a stronger position towithstand revenue shortfalls orunanticipated expenditures in 2010-11.
Budget Status Update
In January 2011, Budget and Researchstaff provided a 2010-11 General Fundbudget status report. It included the latestinformation available on revenue for thecurrent year and the limited informationavailable about the upcoming 2011-12fiscal year. The Mayor and City Councilwere advised that 2010-11 revenuecollections were on target with estimatesand expenditures were slightly belowestimates. As a result, the 2010-11 budgetremained balanced and mid-year cutswould not be necessary.
Initial estimates for 2011-12 revenueranged from +0.1 to -3.0 percent comparedto 2010-11. The biggest drags on revenuewere lower state-shared income tax,representing 2009-10 collections, and theestimated impact on all state-sharedrevenue from the 2010 census. It wasestimated the 2010 census would showthat Phoenix had lost relative statepopulation share, as it had every censussince 1965. Prior to census results andholiday sales tax collections being known,the 2011-12 General Fund deficit wasestimated to be between $50-80 million.Given the 2010-11 budget remainedbalanced, the City Council adopted the2011-12 budget calendar.
On Feb. 15, 2011, Budget and Researchprovided a General Fund budget statusupdate with results of city holiday sales taxthat was collected in January. Staffreported city sales tax growth was positiveand slightly above the projected forecast.Staff explained that a specific deficitwould not be available until the March 29trial budget due to pending Census 2010results.
Budget Process, Council Review and Input,Public Hearings and Budget Adoption
61

Trial Budget
On March 29, 2011, the Mayor and Councilwere presented with the 2011-12 trialbudget. The proposed balanced 2011-12General Fund budget overcame a $58.8million dollar deficit. As discussed in moredetail in the city manager’s budgetmessage, seven important factors werecritical to the city’s success in keepingcosts down and addressing a manageabledeficit.
Noteworthy impacts to planned GeneralFund expenditures in 2011-12 included:
n a total of $23.9 million in decreasedcosts based on a combination of $19.9million in various efficiencies and cost-cutting measures identified bydepartments and another $4 million inproposed budget reductions;
n increase of $5.9 million to continue theCouncil-approved Public SafetyRestoration Plan from the 2010-11budget;
n set-aside of $2.0 million to cover thecost of expiring firefighter grants;
n planned increase of $3.0 million overthe existing 3.1 percent contingencyfund level;
n allocation of $1.6 million to operatenew capital facilities, which includesfunding for Fire Station 59 at 67thAvenue and Buckeye Road, HelenDrake Senior Center replacing theManzanita Senior Center, SouthMountain Community Library,protection of 500 acres and eight milesof trails for new preserve space, facilitymaintenance at Tovrea Castle, andcontracted maintenance for completedstreetscape projects;
n up to $800,000 ($632,000 in theGeneral Fund) for an independentconsultant review of employeecompensation and benefits;
n early budget action to allocate up to$600,000 ($384,000 in the GeneralFund) for pension reform consultants;
n implementation of the Council-adoptedcity pools restoration plan, whichclosed pools on a rotating basisbeginning in 2008-09 and reopens thosepools in the summer of 2012. Becauseof Council's previous approval, the2011-12 budget already includes thecosts of the plan, resulting in a netGeneral Fund impact after revenue ofapproximately $550,000.
Additional recent impacts to GeneralFund revenue included:
n expected census results reducing thecity's relative population share of incorporated cities to 28.7 percent,resulting in a loss of about $14.5million;
n adjustments to revenue reflectingimprovements to the economy andenhanced compliance of existing finesand fees resulting in an increasedprojection of about $2.1 million;
n positive impact of $2.95 million to theGeneral Fund from Arizona Center saleproceeds, which will offset one-timepay-as-you-go costs and also directlycontribute to the elimination of the2011-12 deficit.
The trial budget also included budgetproposals for non-General funds. TheAviation Department proposed replacingcontract services with city staff for certainservices, saving $385,000. The WaterServices Department consolidated theirdowntown payment counter with theFinance Department’s Cashiering Services,eliminating one position. Costs related tothe compensation and benefits consultantwill be charged proportionately to non-General funds. Finally, the 2011-12 WaterServices Department budget includes $7 million for operating costs for theGranular Activated Carbon Facility at ValVista Water Treatment Plant to complywith the disinfectant byproduct mitigationrule, and $188,000 to pay for chemicalsrequired for the new 24th Street WaterTreatment Plant chlorine dioxide facility.
Community Input
The proposed budget was presented at 15budget hearings conducted throughout thecommunity from April 7 – April 20.Following a presentation describing theproposed budget, residents were invited tocomment. In addition to the budgethearings, the budget was shared with thecommunity on the city’s website andthrough a tabloid entitled “Phoenix Budgetfor Community Review” that outlined theproposed service changes as well as acalendar of budget hearing dates. Thisinformation was made availableelectronically in addition to hard copiesprovided at senior centers, libraries,community centers and at budgethearings. The city also published where tofind the electronic version in The ArizonaRepublic, the Arizona Informant, and LaVoz. Residents were also invited to sendcomments and questions through the city’swebsite. The publication of the trialbudget allows the City Council and thecommunity to comment on proposedmeasures for balancing the budget. At the15 community budget hearings, manyresidents expressed their support for theproposed 2011-12 budget and theirappreciation for the city's leadership andstaff in addressing the financialchallenges. Individuals also commentedon service priorities with a focus onmaintaining, and when economicconditions improve, restoring previouslevels of service in libraries, parks, streetmaintenance, arts, youth and humanservices programs. Specific concerns wereraised regarding graffiti, accessibilityservices and proposed changes to thePolice Department callback service. Thefinal budget recommendations provided tothe Mayor and City Council includes, tothe extent possible given limitedresources, the input received fromresidents.
62

The city of Phoenix is in the process ofdeveloping a Strategic Plan to guidedecision-making at all levels of theorganization, focus the city’s efforts oncore businesses and serve an instrumentalrole in setting budget priorities. The draftplan was developed by a team of city staffand private sector representatives, inconjunction with input from the Mayor andCity Council. Extensive communityfeedback was sought through inclusion ofthe Strategic Plan in the communitybudget hearing process and the city’swebsite.
City Manager’s Budget and CouncilAction
On May 10, a revised budget package thatreflected feedback from the communitywas presented to the Mayor and CityCouncil for information and discussiononly. The following changes were proposedin the City Manager's Budget to respond tothe community’s feedback about specificservices: add funding to graduallytransition the Police callback service to anInternet-based service, add two contractpositions and materials to the GraffitiBusters program to address citywidegraffiti areas, restore funding forcontracted closed-captioning services onPhoenix Channel 11, add part-time staff torestore walk-in services at Burton BarrLibrary's Accessibility Center and create avoucher program for same-daytransportation service for American withDisabilities Act certified passengers underthe age of 65. On May 24, 2011 the CityCouncil approved the final budget.
Tentative Budget Adoption
A public hearing and tentative budgetadoption was held on June 8 in compliancewith the City Charter requirement that thebudget be adopted no later than June 30.Upon tentative adoption, the budgetbecomes the City Council’s program ofservices for the ensuing fiscal year. At thatpoint, the City Council may later decreasethe budget, but only in certain instancesmay the budget be increased. Generally,the ability to increase the budget appliesto expenditures exempted from the stateexpenditure limitation. Transfers betweendepartment appropriations are stillpermissible before the final budget isadopted.
Final Budget Adoption
A public hearing and final adoption washeld on June 22. Adoption of the propertytax levy was scheduled no less than 14days later on July 6 in accordance withstate law.
The following chart is an overview ofthe 2011-12 budget calendar.
63
2011-12 Budget Calendar
January 11 2010-11 General Fund Budget Status Update and 2011-12 Budget Process Calendar
March 29 Trial Budget
April 5 2011-16 Preliminary Capital Improvement Program
April 7 – April 20 Community Budget Hearings
April 20 2006 Bond Committee Meeting
May 10 City Manager’s Recommended 2011-12 Budget
May 24 Final Budget Recommendations and City Council Action toBalance the General Fund Budget
June 8 Tentative Adoption of 2011-12 Budget and 2011-16 Capital Improvement Program
June 22 Final Budget Adoption
July 6 Property Tax Adoption

64

2011-12City Charter Arizona State Statute Budget
Action Required Prescribed Deadline Prescribed Deadline Dates
City manager’srecommended five-year CapitalImprovement Programsubmitted to the CityCouncil.
At least three monthsprior to final date forsubmitting the budgetor a date designatedby the City Council.
Capital ImprovementProgram not required.
April 5
City manager’sproposed budget forensuing yearpresented to theMayor and CityCouncil.
On or before the firstTuesday in June or adate designated bythe City Council.
City manager budgetnot required.
May 10
Publish generalsummary of budgetand notice of publichearing that must beheld prior to tentativebudget adoption.
Publish in newspaperof general circulationat least two weeksprior to first publichearing.
No requirement. Publish weekof May 25
Publish notice ofpublic hearing whichmust be held prior toadoption of five-yearCapital ImprovementProgram by resolution.
Publish in newspaperof general circulationat least two weeksprior to first publichearing.
No requirement. Publish weekof May 25
City of Phoenix budget and financial
policies are governed by Arizona state law,the City Charter and generally acceptedaccounting standards. These laws andstandards set budget calendar dates,provide for budget control, describe waysto amend the budget after adoption, andidentify appropriate methods forbudgeting, accounting and reporting. TheArizona Constitution establishes theproperty tax system and sets tax levy andassessed valuation limits. The constitutionalso provides annual expenditure limitsand sets total bonded debt limits.
The city’s budget policies areextensions of these basic laws and followgenerally accepted governmentalbudgeting and accounting practices andstandards.
A BALANCED BUDGET IS REQUIRED
Arizona law (Title 42 Arizona RevisedStatutes) requires the City Council toannually adopt a balanced budget bypurpose of public expense. State lawdefines this balanced budget as “theprimary property tax levy, when addedtogether with all other available resources,must equal these expenditures.” Therefore,
no General Fund balances can be budgetedin reserve for subsequent fiscal years.Instead, an amount for contingencies (alsocommonly referred to as a “rainy dayfund”) can be included in the budget eachyear.
The City Charter also requires anannual balanced budget. The Charterfurther requires that “the total of proposedexpenditures shall not exceed the total ofestimated income and fund balances.”
Annual Budget Adoption Requirements
The City Charter and state statutescontain legal deadlines and actions thatmust be followed in adopting the budget.In cases where the deadlines conflict, thecity meets the earlier of the two dates. Thedeadlines and formal actions prescribed byboth, as well as the actual or planneddates for the 2011-12 budget developmentprocess are as follows:
General Budget and Financial Policies
65

Amendments to the Budget After FinalAdoption
Generally, by Arizona state statute, noexpenditure may be made nor liabilityincurred for a purpose not included in thebudget even if additional funds becomeavailable. Phoenix’s level of legalbudgetary control is by fund except for theGeneral Fund for which control is byprogram.
In certain instances, however, thebudget may be amended after adoption. All
budget amendments require City Councilapproval. These are (1) transfers from anycontingency appropriation, (2) increasesin funds exempt from the Arizona StateConstitution expenditure limit and (3)reallocations of amounts included in theoriginal budget. An amount forcontingencies is included in the GeneralFund and in many other restricted funds.Informal reservations of contingencies aremade throughout the fiscal year asapproved by the City Council. Actual
expenditures are recorded in theappropriate departmental budget. Then, atthe end of the fiscal year, contingencyamounts actually needed are transferredby City Council formal action to theappropriate departmental budget.
If funds are available, appropriationsmay be increased for certain fundsspecifically excluded from the limitationsin the Arizona Constitution. These fundsare bond proceeds, Arizona Highway UserRevenue, debt service and grants. At theend of each fiscal year, the City Counciladopts an amendment to the budgetordinance for any necessary increases inthese funds. These increases are largelycaused by federal grants that becomeavailable throughout the fiscal year and bytiming changes in capital projects fundedby bond proceeds.
Finally, transfers of amounts within anyspecific fund or within General Fundprograms can be made upon approval ofthe city manager.
PROPERTY TAXES AND BONDED DEBTLIMIT
Arizona property tax law provides for twoseparate tax systems. A primary propertytax is levied to pay current operation andmaintenance expenses. Therefore, primaryproperty tax revenue is budgeted andaccounted for in the General Fund. Asecondary property tax levy is restricted tothe payment of debt service on long-termdebt obligations. Therefore, secondaryproperty tax revenue is budgeted andaccounted for as a special revenue fund.
Primary Property Tax Restrictions
Primary property tax levies are restrictedto an annual 2 percent increase plus anallowance for growth attributable topreviously unassessed properties(primarily new construction). Growth inprimary assessed valuation is restrictedannually to the greatest of 10 percent, or25 percent of the difference betweenprimary values in the preceding valuationyear and secondary values in the currentvaluation year, plus an allowance forpreviously unassessed properties. The CityCharter requires that 8 cents of theprimary property tax levy be allocated tothe Parks and Playground Fund.
66
2011-12 City Charter Arizona State Statute Budget
Action Required Prescribed Deadline Prescribed Deadline Dates
Publish truth-in-taxation noticetwice in a newspaper ofgeneral circulation(when required).
No requirement. First, at least 14 butnot more than 20 daysbefore required publichearing; then at leastseven days but notmore than ten daysbefore requiredhearing.
Publishweeks ofJune 3 and June 13
Public hearingimmediately followedby tentative budgetadoption with orwithout amendment.
On or before the lastday of June.
On or before the thirdMonday of July.
June 8
Publish summary oftentatively adoptedbudget and notice ofpublic hearing whichmust precede finaladoption.
No requirement. Once a week for twoconsecutive weeksfollowing tentativeadoption.
Publishweeks ofJune 13 and20
Public hearing plustruth-in-taxationhearing (whenrequired) immediatelyfollowed by final budgetadoption.
No requirement. No later than secondMonday in August.
June 22
Property Tax LevyAdoption.
No later than the lastregularly scheduledCouncil meeting inJuly.
No sooner than 14 daysfollowing final budgetadoption and no laterthan the third Mondayin August.
July 6
Secondary Property Tax Restrictions
Secondary property tax levies arerestricted in their use to the payment ofannual debt service on long-term debtobligations. Any over-collection of thesecondary levy or any interest earned byinvested secondary property tax fundsmust be used to reduce the following year’slevy. No restrictions limit the annualgrowth in secondary assessed valuations.Secondary assessed valuations areintended, therefore, to follow generalmarket conditions.
Generally, Arizona counties assessproperty and collect all property taxes.Proceeds are distributed monthly to theappropriate jurisdictions.
Bonded Debt Limit
Arizona cities can issue general obligationbonds for purposes of water, sewer,lighting, open space preserves, parks,playgrounds, recreational facilities, publicsafety, law enforcement, fire emergency,and street and transportation up to anamount not exceeding 20 percent of thesecondary assessed valuation. Generalobligation bonds can be issued for allpurposes other than those previously listedup to an amount not exceeding 6 percentof the secondary assessed valuation. Ananalysis of bonded debt limits is providedin the Debt Service chapter.
ANNUAL EXPENDITURE LIMITATION
Since fiscal year 1982-83, the city ofPhoenix has been subject to an annualexpenditure limitation imposed by theArizona Constitution. This limitation isbased upon the city’s actual 1979-80expenditures adjusted for interim growthin population and inflation as measured bythe gross domestic product implicit pricedeflator. The constitution exempts certainexpenditures from the limitation. Theprincipal exemptions for the city ofPhoenix are debt-service payments,expenditures of federal funds, certainstate-shared revenues and other long-termdebt obligations. Exemptions associatedwith revenues not expended in the year ofreceipt may be carried forward and used inlater years. The 1979-80 expenditure basemay be adjusted for the transfer offunctions between governmentaljurisdictions.
The constitution provides for fourprocesses to exceed the expenditurelimitation: (1) a local four-year home ruleoption, (2) a permanent adjustment to the1979-80 base, (3) a one-time override forthe following fiscal year, and (4) anaccumulation for pay-as-you-go capital. Allrequire voter approval.
In 1981, the voters approved thepermanent annual exclusion of thefollowing amounts for pay-as-you-gocapital: $5 million for Aviation, $6 millionfor Water, $6 million for Wastewater and $2million for General Fund streetimprovements. Additionally, city ofPhoenix voters have approved seven localhome rule options in 1981, 1985, 1991,1995, 1999, 2003 and 2007. Before 1999,the home rule options generally excludedenterprise operations such as Aviation,Water, Wastewater and Solid Waste fromthe expenditure limitation. Beginning in1999, the voters approved establishing thecity’s annual budget as the spending limit.Due to the current home rule optionexpiring at the end of fiscal year 2011-12,the 2011 Expenditure Limit Task Forcerecommended that the Mayor and CityCouncil refer a local alternativeexpenditure limitation to the August 30,2011 ballot that sets the limit equal to thebudget after the Mayor and Council havepublicly reviewed the budget in hearingsfor each Council district. That limit wouldbe in effect for four fiscal years from 2012-13 through 2015-16 and would allowPhoenix residents to continue to controllocal expenditures.
BUDGET BASIS OF ACCOUNTING
The city’s budget basis of accounting isbased on the modified accrual basis plusencumbrances. This method recognizesrevenues in the period that they becomeavailable and measurable, andexpenditures are recognized in the periodthe associated liability is incurred. Thismethod differs from generally acceptedaccounting principles (GAAP) used forpreparing the city’s comprehensive annualfinancial report. The major differencesbetween the modified accrual basis andthe GAAP basis are listed below. Areconciliation of budgetary and GAAP fundbalances is provided each year in thecomprehensive annual financial report.
1. For budgetary purposes, encumbrances(contractual commitments to beperformed) are considered theequivalent of expenditures rather thanas a reservation of fund balance.
2. Grant revenues are budgeted on amodified cash basis. GAAP recognizesgrant revenues on an accrual basis.
3. Fund balances reserved for inventories,bonded debt and unrealized gains orlosses on investments are notrecognized in the budget.
4. In lieu property taxes and centralservice cost allocations (levied againstcertain Enterprise and Special Revenuefunds) are budgeted as interfundtransfers rather than revenues andexpenses.
5. For budgetary purposes, all fixed assetsare fully expensed in the year acquired.
The differences between modifiedaccrual basis plus encumbrances andGAAP accounting listed above are similarto those of many other local governments.These differences exist largely becausethey provide a more conservative view ofrevenues and expenditures and becausethey provide greater administrativecontrols.
GENERAL FINANCIAL POLICIES
In addition to the legal constraintsoutlined in the previous section, a numberof administrative and City Council-approved policies provide guidance anddirection to the budget developmentprocess.
Form of Budget Adoption
1. Allocation of Appropriations - Fundsappropriated by the City Council areallocated to programs, offices,departments, divisions, sections,projects and type of expenditure by thecity manager or as delegated to theBudget and Research director to providemanagerial control and reporting ofbudgetary operations.
67

2. Budget Controls - At the departmentlevel, control of expenditures isgoverned by Administrative Regulation.City departments prepare revisedexpenditure estimates twice a year. TheBudget and Research Department keepsthe city manager and the City Counciladvised on the status of the budgetthrough periodic budget status reports.Mid-year revenue shortfalls can result inthe adoption of mid-year expenditurereductions.
3. Contingency Amounts - A contingencyallowance (also known as a “rainy dayfund”) is appropriated to provide foremergencies, mid-year communityservice requests, and unanticipatedexpenditures and revenue shortfalls.Expenditures may be made fromcontingencies only upon approval by theCity Council with recommendation bythe city manager. Over the last 10 years,the city’s contingency fund has been aslow as 2.6 percent of General Fundexpenditures, and will be at the highestlevel in 2011-12 at 3.4 percent. Bestpractices recommend a contingencyfund of 5 percent of total expenditures.In order to better withstand futureeconomic downturns the City Councilhas adopted a policy to graduallyincrease the contingency to 5 percentover multiple years. Enterprise andSpecial Revenue funds have varyinglevels of contingency funding consistentwith the variability in revenues andexpenditures associated with theservices provided.
4. Ordinances - Three budget ordinancesare adopted each fiscal year: (1) theoperating funds ordinance, (2) thecapital funds ordinance and (3) the re-appropriated funds ordinance. The lastordinance is required becauseunexpended amounts, including thoseencumbered, lapse at the end of thefiscal year. Since all expended amountsmust be included in the budgetadoption ordinance, the city re-budgetsall encumbrances outstanding at year’send.
Cost Allocation and Expenditure Policies
1. Administrative Cost Recovery - TheFinance Department prepares anindirect cost allocation plan thatconforms to federal guidelines for grantreimbursement of appropriateadministrative costs. The allocated costsare charged to eligible federal grantfunds through a fund transfer to theGeneral Fund.
2. Central Services Cost Allocation - TheFinance Department annually calculatesthe full cost of central services providedto Enterprise funds. Except for the GolfFund, these allocated costs arerecouped from the Enterprise fundsthrough fund transfers to the GeneralFund.
3. Employee Compensation Costs - Costsfor employee compensation including allwages, social security, industrial, health,life, unemployment, dental insuranceand other personal allowances areallocated to each department. Annualamounts for cash conversion ofvacation, compensatory time and sickleave are included in the budget.However, future values of compensatedabsences are not included in the budgetbut are disclosed in the notes to thecomprehensive annual financial reportat year’s end.
4. Enterprise Cost Recovery - Aviation,Water, Wastewater and Solid Waste arefully self-supporting from rates, fees andcharges and, as such, are budgeted andaccounted for as Enterprise funds. Costrecovery includes direct operation andmaintenance expenses, capitalexpenditures, debt service, indirect costallocation, and in-lieu property taxes,where allowable. The ConventionCenter, while accounted for usingenterprise accounting principles, ispartially financed from rental andparking fees with the remainder comingfrom earmarked sales taxes. The GolfFund, also accounted for usingenterprise accounting principles, doesnot reimburse the General Fund forcitywide indirect cost allocations.Finally, federal regulations preclude theAviation Fund from paying in-lieuproperty taxes. By City Council policy,the Convention Center Fund does notpay in-lieu property taxes.
5. Internal Cost Accounting Allocation -Interdepartmental services performedby one department for another arecredited to the performing departmentand charged to the receivingdepartment to reflect the accurate costsof programs. The rates used areintended to reflect full costs includingappropriate overhead.
6. Maintenance and Replacement ofRolling Stock and Major Facilities - Amultiyear plan is used to project theneed for, and costs of, significant streetpavement, facility and equipment repairand replacement. The planning horizonfor each asset category is matched tothe life of the asset. Annually, that plan,combined with periodic physicalinspections of streets, facilities, vehiclesand other equipment, is used to developfunding levels for inclusion in thebudget. During economic downturns,these amounts are debt-financed with arepayment schedule shorter than theexpected life of the asset.
68

7. Pension Funding - In addition to otheremployee compensation amounts,pension amounts are allocated to eachdepartment. The required employercontribution is determined actuariallyto fund full benefits for active membersand to amortize any unfunded actuarialliability as a level percent of projectedmember payroll over a 20-year period.
8. Self-Insurance Costs - With a fewexceptions, the city is fully self-insuredfor general and automotive liabilityexposures. The major exceptions to self-insurance include airport operations,police aircraft operations and excessgeneral and automotive liability forlosses in excess of $7.5 million. Anindependent actuary determines theself-insurance costs, which arecombined with purchased policy costsand allocated to department budgetsbased on the previous five years’ lossexperience of each department.
Revenue Management
All local governments struggle to generatethe funds necessary to provide, maintainand enhance the service demands of theircommunity. Due to the legal limitations onproperty taxes in Arizona, and due to thepre-emption of city-imposed income,luxury and gas taxes, Arizona cities andtowns largely rely on local sales taxes andstate-shared sales, income and vehiclelicense taxes. In Phoenix, 44 percent of theGeneral Fund comes from the local salestax. This reliance on sales tax collectionsresults in a highly cyclical revenue base.Significant decreases in total GeneralFund revenue and sales taxes in particularled to the City Council’s February 2010approval of sales tax on food for homeconsumption effective April 1, 2010.
Given our reliance on sales taxes,developing personal income is animportant step in managing our revenue
base. In recent years, considerable efforthas been devoted to attracting employersthat will provide our residents with qualityjobs and to developing a local workforcethat will support the needs of qualityemployers. We also have worked to developan employment base that is not as heavilyconcentrated in the highly cyclicalconstruction industry. However, the recentunprecedented declines in constructionactivity and unemployment in all sectorshad a significant negative impact onrevenue.
Also important to managing ourrevenue base is the continued growthexpected in catalog and Internet sales. Ouruse tax is an important tool in reducingthe impact of this shift from sales in“bricks and mortar” stores. Thedevelopment of our tourism-related salestax base (hotels, restaurants and short-term car rentals) is another importanthedge against future revenue loss due togrowth in Internet and catalog sales.Tourism is another industry that sufferedsignificant declines in the recentrecession.
Finally, utility taxes levied against thesales of electricity, natural gas,telecommunications, water and sewermake up about 23 percent of our localsales tax base. Generally, utility taxes arenot responsive to economic conditions andprovide us with a fairly significant revenuesource that remains stable during periodsof economic downturn. In addition, severaldetailed revenue policies are listed below.
1. Privilege License and Use Taxes (SalesTax) - The City Council may set the citysales tax rate by ordinance. The citysales tax rate on retail sales and mostother categories is 2.0 percent. TheModel City tax code exemption on foodfor home consumption was removed byCity Council action in February 2010. Itwas last imposed in June 1980. The ratevaries for certain other specializedtaxing categories as outlined in theOperating Fund Revenues section of thisdocument.
2. Property Taxes - By City Council policy,the combined city property tax rate is$1.82 per $100 of assessed valuation.The primary property tax levy isannually set at the previous year’s levyamount plus 2 percent and an amountassociated with new property. Thesecondary levy is then set at an amountnecessary to achieve a total $1.82 taxrate.
3. In Lieu Property Taxes – In-lieuproperty taxes are charged to the Water,Wastewater and Solid Waste funds basedupon acquisition or construction costwith the appropriate assessment ratioand current property tax rate applied.These amounts are calculated annuallyby the Finance Department.
4. Annual User Fee Review - The cityauditor conducts a comprehensive userfee review to project cost recovery rates,and then compares the projections tothe established cost recovery policy. Therates are based upon generally acceptedfull-cost accounting standards. The citymanager recommends expenditurereductions or fee adjustments to theCity Council to maintain the establishedcost recovery policy.
5. Fines and Forfeitures - The MunicipalCourt has jurisdiction over establishingmany of the fine and forfeiture feeschedules.
6. Parks and Recreation Fees andCharges - The Parks and RecreationBoard has jurisdiction over establishingcharges for miscellaneous recreationalfacilities and advising the City Councilon fees to be set for golf courses, tenniscenters and swimming pools.
7. Interest Earnings - Interest earningsfrom the investment of temporarily idlefunds are credited to the fundgenerating the earnings.
69

FUND STRUCTURE
The budget presented here is made up ofthree distinct fund groups: General,Special Revenue and Enterprise funds.
All planned uses of these fund types areincluded in the annual budget. Fiduciaryfunds, which are described later in thissection, are not included in the annualbudget.
General Funds
General – These revenues come from fourmajor sources: local sales (privilegelicense) taxes, local primary propertytaxes, state-shared revenues, and user feesand other revenues. State-shared taxesinclude state-shared sales, vehicle licenseand income taxes. User fees and otherrevenues include cable and ambulancefees as well as interest earnings and fines.General funds are used to provide the mostbasic of city services: police, fire, parks,library, municipal court and neighborhoodservices.
Parks – The City Charter requires that aportion of the primary property tax levy beused to support parks programs. Todemonstrate compliance with thisrequirement, all parks revenues andexpenditures are segregated in a separatefund.
Library – State law requires that fundsreceived for library purposes aresegregated in a separate Library Fund.Revenues include library fines and fees,which are used to help offset libraryexpenditures.
Cable Communications – Included in thisfund are the revenues and expendituresassociated with administering cabletelevision licensing and programming thegovernment and education accesschannels.
Special Revenue Funds
Arizona Highway User Revenue (AHUR) – AHUR funds are made up ofstate-collected gas taxes and a portion ofother state-collected fees and charges suchas registration fees, driver’s licenses andmotor carrier taxes. These funds can onlybe used for street maintenance andconstruction, and street-related debtservice.
Capital Construction – This fund is usedto account for the 2 percent utility taxeson telecommunication services that areused for pay-as-you-go capital projects inthe city’s right-of-way.
City Improvement – This fund is used toaccount for debt payments incurred as aresult of facilities built by the CivicImprovement Corporation.
Community Reinvestment – Revenues andexpenditures associated with economicredevelopment agreements are maintainedin this fund.
Court Awards – This fund includesrevenue resulting from court awards ofconfiscated property under both thefederal and state Organized Crime Acts.Expenditures are restricted to additionallaw enforcement programs in the Policeand Law departments.
Development Services – Fee revenues andexpenditures associated with permittingand inspection services provided by thePlanning and Development Departmentare maintained in this fund.
Excise Tax – The Excise Tax Fund is usedto account for tax revenues ultimatelypledged to pay principal and interest onvarious debt obligations.
Grant Funds – Grant funds includeFederal, State and local agency awards.These are Community Development BlockGrant funds, Public Housing funds, HumanServices funds, and various other smallergrant allocations. Grant funds can beapplied only to grant-eligible expenditures.
Neighborhood Protection – These fundsare used to account for the revenues andexpenditures associated with a voter-approved 0.1 percent increase in the salestax in 1993. Revenue from the tax increaseis earmarked for police and fireneighborhood protection programs, andpolice Block Watch programs. The PoliceDepartment is allocated 70 percent, FireDepartment 25 percent and Block WatchPrograms 5 percent of revenues.
Other Restricted Funds – This is acombination of funds used to segregaterestricted revenues and related expenses.Included are Court TechnologyEnhancement Fees, Parks revenues suchas Heritage Square and Tennis Center, andvarious other receipts and contributionsreceived in small amounts and earmarkedfor restricted purposes.
Parks and Preserves – This fund is usedto account for the funds generated by the0.1 percent increase in the sales taxapproved by voters in 1999 for a 10-yearperiod. In 2008, voters approved a 30-yearextension to July 1, 2038. The funds areused to purchase state trust lands for theSonoran Desert Preserve open space, andthe development and improvement ofregional and neighborhood parks toenhance community recreation.
70

Public Safety Enhancement – These fundsare used to account for the revenues andexpenditures associated with a voter-approved 2.0 percent increment of the 2.7percent sales tax on utilities withfranchise agreements in March 2005. ThePolice Department, including the Office ofEmergency Management, is allocated 62percent and the Fire Department 38percent of revenues.
2007 Public Safety Expansion – Thesefunds are used to account for the 0.2percent increase in the sales tax approvedby voters in 2007. The funds are designatedfor hiring additional police personnel andfirefighters; hiring crime sceneinvestigator teams to improve evidencecollection; improving fire protectionservices, to improve response times; andincreasing paramedic and other emergencymedical services. The Police Department isallocated 80 percent of this fund and theFire Department is allocated 20 percent.
Regional Transit – This fund is used toaccount for transit services that are paidby and provided for other cities or fundedby the Regional Public TransportationAuthority.
Regional Wireless Cooperative (RWC) –This fund accounts for revenues andexpenditures associated with the RegionalWireless Cooperative (RWC), which is anindependent, multi-jurisdictionalorganization that manages and operates aregional radio communications networkbuilt to seamlessly serve the interoperablecommunication needs of first respondersand other municipal radio users in andaround Central Arizona’s Valley of the Sun.Phoenix operates and maintains thenetwork and is also responsible foraccounting, budgeting, procurement andcontracting for the RWC. Costs are sharedamong the RWC member organizations.
Secondary Property Tax – In Arizona,property taxes are divided into twoseparate levies: primary and secondary.The primary levy can be used for generaloperating and maintenance expense. Thesecondary levy can only be used forpayment of general obligation bondinterest and redemption. Because of thisrestriction, secondary property tax fundsare segregated in a Special Revenue Fund.
Sports Facilities – This fund accounts forrevenues generated from a 1.0 percenthotel/motel tax and a 2.0 percent tax onshort-term vehicle rentals. These funds aredesignated for payment of debt service andother expenditures related to thedowntown sports arena.
Transit 2000 – This fund is used toaccount for the 20-year, 0.4 percent salestax dedicated to transit improvementsapproved by voters on March 14, 2000. Farebox collections are also included in thisfund.
Enterprise Funds
Enterprise funds include Water,Wastewater, Aviation, Solid Waste, Golf andConvention Center funds. With theexception of Convention Center funds,these funds come entirely from the feesand rents paid by those who use theservices and facilities provided. Enterprisefunds are “self-contained” and can only beused to pay for the costs associated withEnterprise Fund-related services andprograms. Therefore, fees are set torecover all costs associated with providingthese services. These costs include day-to-day operations and maintenance, in lieuproperty taxes, pay-as-you-go capitalimprovements and debt service.
Convention Center funds come from acombination of rental and parking incomeand earmarked sales taxes. Theseearmarked taxes include a portion of thehotel, restaurant and bar, constructioncontracting and advertising taxes levied bythe city. This tax stream has beenearmarked to repay the debt issued for theConvention Center facility and to providefor operations and maintenance costs.
Fiduciary Funds
Fiduciary funds, including trust andagency funds, represent funds held forothers. As such, these funds are notincluded in the annual budget. Also,reserves and expenditures for fiduciaryfunds are not presented in thecomprehensive annual financial report(CAFR). However, the year-end balancesheld in fiduciary funds are provided in theCAFR.
71

72

Revenue estimates for 2011-12 are basedon assumptions about the local economy,population changes, underlying estimatesfor cost-recovery rates and fees, and on thecontinuation of current state revenuecollection and sharing practices.Adjustments to fees, such as those forwater, sewer and solid waste services, areestablished in separate planning processesand are incorporated in these estimates. Inaddition, other revenue estimates aredeveloped using the most currentinformation from outside entities thatestablish such fees. Examples of revenuesderived from fees set by outside entitiesinclude portions of court fines and fees,and ambulance fees. Finally, consistentwith recommendations of the 2006 BondCommittee, the primary property tax levyremains at the maximum allowableamount, but does not include anadjustment for torts. The currentcombined primary and secondary propertytax rate remains the same at $1.82 in
accordance with Council policy through2011-12.
State and local economic growth beganto stabilize in the latter part of 2009-10and is showing signs of a modest recoveryafter experiencing declines that began in2008-09 due to the national and localrecession. The recession involved a varietyof factors including weakness in theresidential and commercial real estatemarkets, increased unemployment, slowjob growth, declines in consumerconfidence and declines in personalincome growth. The state and localeconomy is expected to continuerecovering, however some of the samefactors from the recession will contributeto slow economic growth in 2011-12.Personal income is one of many indicatorsused for estimating state and local salestaxes, and state-shared income taxes.Consistent with projections by localeconomists, the chart below shows thatpersonal income is expected to grow by 3.6
percent in 2011-12, which is up from the3.0 percent estimated for 2010-11.
Several other economic indicators areused to develop revenue forecastsincluding the consumer price index,unemployment, population, gasoline sales,housing unit data, wage and salary relatedinformation, retail sales and disposableincome. A forecasting software program isused to create several statistical modelsusing data from the University of Arizona’sForecasting Project. These models assistwith the estimation process and serve as areasonableness test for projections. Theestimation process also includesinformation gathered throughout the yearfrom national and local publications, aswell as opinions from professionals ineconomics and finance from stategovernment, universities and the privatesector.
In non-General Fund revenues, the2011-12 estimate for Water systems reflectfull-year impacts of the April 2011 feeincrease.
Revenue Estimates
73
2007-08
Personal Income Growth
12%
10%
8%
6%
4%
2%
0%
(2%)
(4%)
(6%)
2.8%
$3.0%
$3.6%
$
(3.3%)
$
1.1%
$
2002-03 2004-052003-04
4.3%
$
5.8%
$
2008-09 2009-10 2010-11* 2011-12*2006-07
$
2005-06
10.5%
$ 8.2%
$7.9%
$
Fiscal Year *Estimated

FIVE YEAR EXCISE TAX FORECAST
Excise taxes include local sales taxes,state-shared sales and income taxes, andsales tax license fees and permits. Excisetaxes represent a significant portion ofGeneral Fund revenues. In addition toproviding General Fund resources, localsales taxes also provide non-General Fundresources to programs such as Transit,Parks and Preserves, Convention Centerand public safety.
The following table details the five yearexcise tax revenue forecast. Included inthe forecast are several economicassumptions including moderate growthfor city and state sales tax rates; growth inpopulation, but at a smaller rate than prioryears; increases in personal income andjob growth; decreased unemployment;marginal increases in consumer spendingand continued stabilization of the housing
market. Factors which will hinder a robustrecovery include continued distress in thecommercial real estate market, low netmigration, oversupply of housing units andthe state’s budget crisis. The forecast alsoincludes no further periods of recession,no change to state shared revenueformulas and a 2 percent food for homeconsumption tax effective April 1, 2010through March 31, 2015.
74
FIVE YEAR EXCISE TAX REVENUE FORECAST(In Thousands of Dollars)
2009-10 2010-11 2011-12 2012-13 2013-14 2014-15
Actual Estimate %Change Estimate %Change Estimate %Change Estimate %Change Estimate %Change
Privilege License Tax
Privilege License Tax1 252,307 290,881 15.3% 308,309 6.0% 328,999 6.7% 351,893 7.0% 369,518 5.0%
Police Neighborhood Protection1 15,131 17,789 17.6% 18,837 5.9% 20,093 6.7% 21,493 7.0% 22,610 5.2%
Police Block Watch1 1,081 1,278 18.2% 1,345 5.2% 1,435 6.7% 1,536 7.0% 1,615 5.1%
Fire Neighborhood Protection1 5,403 6,390 18.3% 6,726 5.3% 7,176 6.7% 7,676 7.0% 8,075 5.2%
Police - 2007 Public Safety Expansion1 34,505 40,663 17.8% 43,012 5.8% 45,881 6.7% 49,083 7.0% 51,638 5.2%
Fire - 2007 Public Safety Expansion1 8,626 10,165 17.8% 10,754 5.8% 11,470 6.7% 12,271 7.0% 12,910 5.2%
Parks and Preserves1 21,615 25,415 17.6% 26,910 5.9% 28,702 6.7% 30,704 7.0% 32,300 5.2%
Transit 20001 86,465 101,660 17.6% 107,640 5.9% 114,810 6.7% 122,817 7.0% 129,201 5.2%
Convention Center Excise Tax 34,801 37,560 7.9% 39,685 5.7% 41,956 5.7% 44,574 6.2% 47,694 7.0%
Sports Facilities Excise Tax 12,502 13,473 7.8% 14,386 6.8% 15,090 4.9% 15,914 5.5% 16,976 6.7%
Privilege License Fees (Annual) 1,842 2,100 14.0% 2,200 4.8% 2,233 1.5% 2,266 1.5% 2,300 1.5%
PLT Application & Other Fees 236 242 2.5% 265 9.5% 269 1.5% 273 1.5% 277 1.5%
Government Lease Property Excise Tax 377 405 7.4% 425 4.9% 446 4.9% 469 5.2% 492 4.9%
Subtotal (PLT) $474,891 $548,021 15.4% $580,494 5.9% $618,560 6.6% $660,969 6.9% $695,606 5.2%
Utility & Franchise
Utility & Franchise Tax 86,226 87,947 2.0% 89,707 2.0% 93,723 4.5% 98,623 5.2% 104,532 6.0%
Utility Tax (County Jail) 13,269 13,700 3.2% 14,000 2.2% 14,360 2.6% 14,730 2.6% 15,109 2.6%
Storm Water Management2 1,332 4,583 244.1% 4,565 (0.4%) 4,588 0.5% 4,611 0.5% 4,634 0.5%
Capital Construction 17,414 16,751 (3.8%) 17,377 3.7% 17,904 3.0% 18,449 3.0% 19,001 3.0%
Police Public Safety Enhancement 14,867 14,885 0.1% 15,257 2.5% 15,708 3.0% 16,335 4.0% 17,152 5.0%
Fire Public Safety Enhancement 9,111 9,127 0.2% 9,354 2.5% 9,631 3.0% 10,016 4.0% 10,517 5.0%
Subtotal (Utility & Franchise) $142,219 $146,993 3.4% $150,260 2.2% $155,914 3.8% $162,764 4.4% $170,945 5.0%
Licenses & Permits 2,869 3,098 8.0% 3,270 5.6% 3,417 4.5% 3,588 5.0% 3,785 5.5%
State Sales Tax3,4 106,916 110,137 3.0% 110,696 0.5% 117,313 6.0% 125,341 6.8% 134,987 7.7%
State Income Tax3,4 190,546 143,647 (24.6%) 122,065 (15.0%) 127,219 4.2% 135,609 6.6% 145,461 7.3%
TOTAL $917,441 $951,896 3.8% $966,785 1.6% $1,022,423 5.8% $1,088,271 6.4% $1,150,784 5.7%
1Includes a 2.0% food for home consumption tax effective 04/01/10 through 03/31/15. 2Includes stormwater fee increase from $0.20 to $0.70 effective July 2010.3Includes 2010 census impact which reduces the Phoenix population percentage from 30.33% to 28.78% for state shared sales tax and from 30.30% to 28.75% for state shared incometax, effective FY 2011-12.
4Assumes no change to State shared revenue formulas.
Note: This forecast assumes a slow continuation of the economic recovery with no further period of recession for the forecast period.
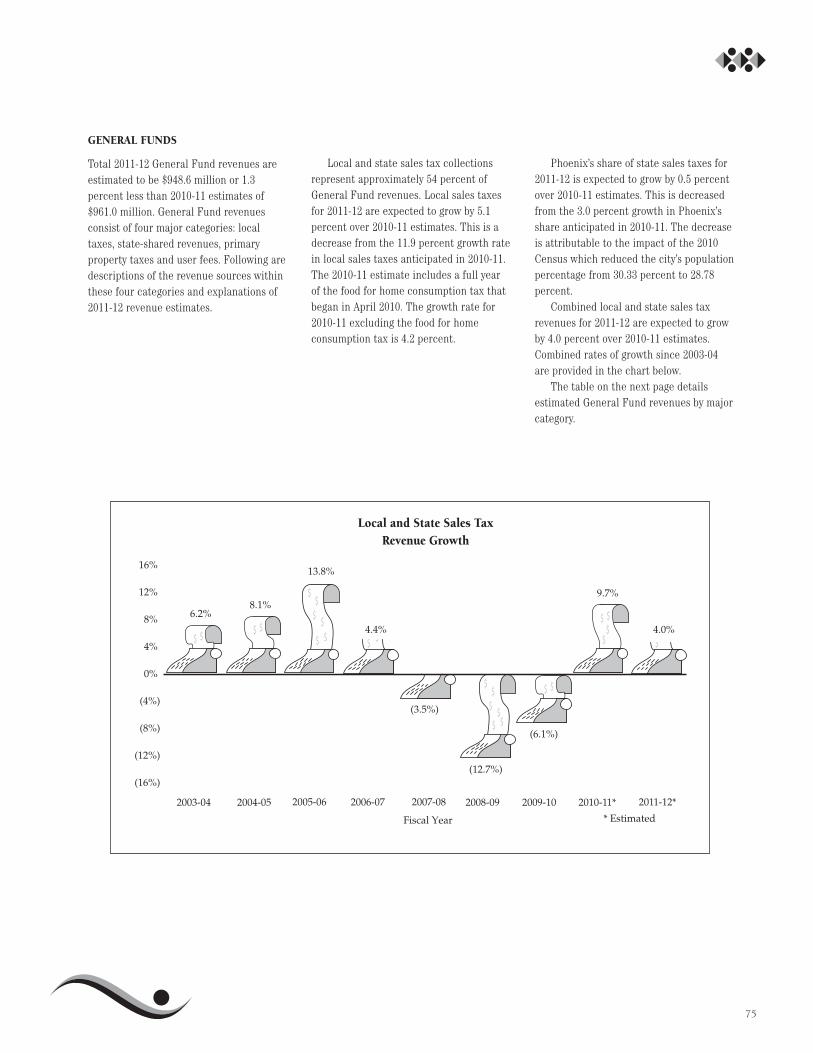
GENERAL FUNDS
Total 2011-12 General Fund revenues areestimated to be $948.6 million or 1.3percent less than 2010-11 estimates of$961.0 million. General Fund revenuesconsist of four major categories: localtaxes, state-shared revenues, primaryproperty taxes and user fees. Following aredescriptions of the revenue sources withinthese four categories and explanations of2011-12 revenue estimates.
Local and state sales tax collectionsrepresent approximately 54 percent ofGeneral Fund revenues. Local sales taxesfor 2011-12 are expected to grow by 5.1percent over 2010-11 estimates. This is adecrease from the 11.9 percent growth ratein local sales taxes anticipated in 2010-11.The 2010-11 estimate includes a full yearof the food for home consumption tax thatbegan in April 2010. The growth rate for2010-11 excluding the food for homeconsumption tax is 4.2 percent.
Phoenix’s share of state sales taxes for2011-12 is expected to grow by 0.5 percentover 2010-11 estimates. This is decreasedfrom the 3.0 percent growth in Phoenix’sshare anticipated in 2010-11. The decreaseis attributable to the impact of the 2010Census which reduced the city’s populationpercentage from 30.33 percent to 28.78percent.
Combined local and state sales taxrevenues for 2011-12 are expected to growby 4.0 percent over 2010-11 estimates.Combined rates of growth since 2003-04are provided in the chart below.
The table on the next page detailsestimated General Fund revenues by majorcategory.
75
Fiscal Year
2008-09
* Estimated
2009-10 2010-11*
Local and State Sales TaxRevenue Growth
2004-052003-04 2005-06 2007-08
6.2%
(6.1%)
8.1%9.7%
4.4%
(3.5%)
13.8%
(12.7%)
2006-07
4.0%
2011-12*
16%
12%
8%
4%
0%
(4%)
(8%)
(12%)
(16%)

76
GENERAL REVENUES BY MAJOR SOURCE(In Thousands of Dollars)
Increase/(Decrease)Revenue Source 2009-10 % of 2010-11 % of 2011-12 % of from 2010-11 Est.
Actuals Total Estimate Total Budget Total Amount Percent
Local TaxesSales Tax $338,533 35.8% $378,828 39.4% $398,016 42.0% $19,188 5.1% Privilege License Fees 2,008 0.2% 2,330 0.2% 2,460 0.3% 130 5.6%Other General Fund Excise Taxes 15,048 1.6% 14,117 1.5% 14,430 1.5% 313 2.2%
Subtotal $355,589 37.6% $395,275 41.1% $414,906 43.7% $19,631 5.0%
State-Shared RevenuesSales Tax1 106,916 11.3% 110,137 11.5% 110,696 11.7% 559 0.5%State Income Tax1 190,546 20.1% 143,647 14.9% 122,065 12.9% (21,582) (15.0%)Vehicle License Tax 49,500 5.2% 48,500 5.0% 48,045 5.1% (455) (0.9%)
Subtotal $346,962 36.7% $302,284 31.5% $280,806 29.6% $(21,478) (7.1%)
Primary Property Tax 121,366 12.8% 131,100 13.6% 126,763 13.4% (4,337) (3.3%)
User Fees/Other Revenues
Licenses & Permits 2,869 0.3% 3,098 0.3% 3,270 0.3% 172 5.6% Cable Communications 9,330 1.0% 9,566 1.0% 9,566 1.0% - 0.0% Fines and Forfeitures 20,215 2.1% 20,761 2.2% 20,759 2.2% (2) 0.0% Court Default Fee 1,110 0.1% 1,100 0.1% 1,100 0.1% - 0.0%Fire 41,538 4.4% 46,163 4.8% 47,911 5.1% 1,748 3.8% Hazardous Materials Inspection Fee 1,297 0.1% 1,300 0.1% 1,300 0.1% - 0.0%
Library Fees 1,349 0.1% 1,238 0.1% 1,256 0.1% 18 1.5% Parks and Recreation 6,813 0.7% 7,177 0.7% 7,103 0.7% (74) (1.0%)Planning 999 0.1% 1,002 0.1% 993 0.1% (9) (0.9%)Police 15,681 1.7% 16,371 1.7% 12,598 1.3% (3,773) (23.0%)Street Transportation 5,159 0.5% 6,360 0.7% 5,124 0.5% (1,236) (19.4%)Other Service Charges 12,481 1.3% 12,780 1.3% 12,813 1.4% 33 0.3%Other 3,757 0.4% 5,376 0.6% 2,368 0.2% (3,008) (56.0%)
Subtotal $122,598 13.0% $132,292 13.8% $126,161 13.3% $(6,131) (4.6%)
TOTAL GENERAL FUND $946,515 100.0% $960,951 100.0% $948,636 100.0% $(12,315) (1.3%)
1Includes the impact of the 2010 Census which decreases the city's population percentage from 30.33% to 28.78% for state shared sales tax and from 30.30% to 28.75% for stateshared income tax, effective 2011-12.
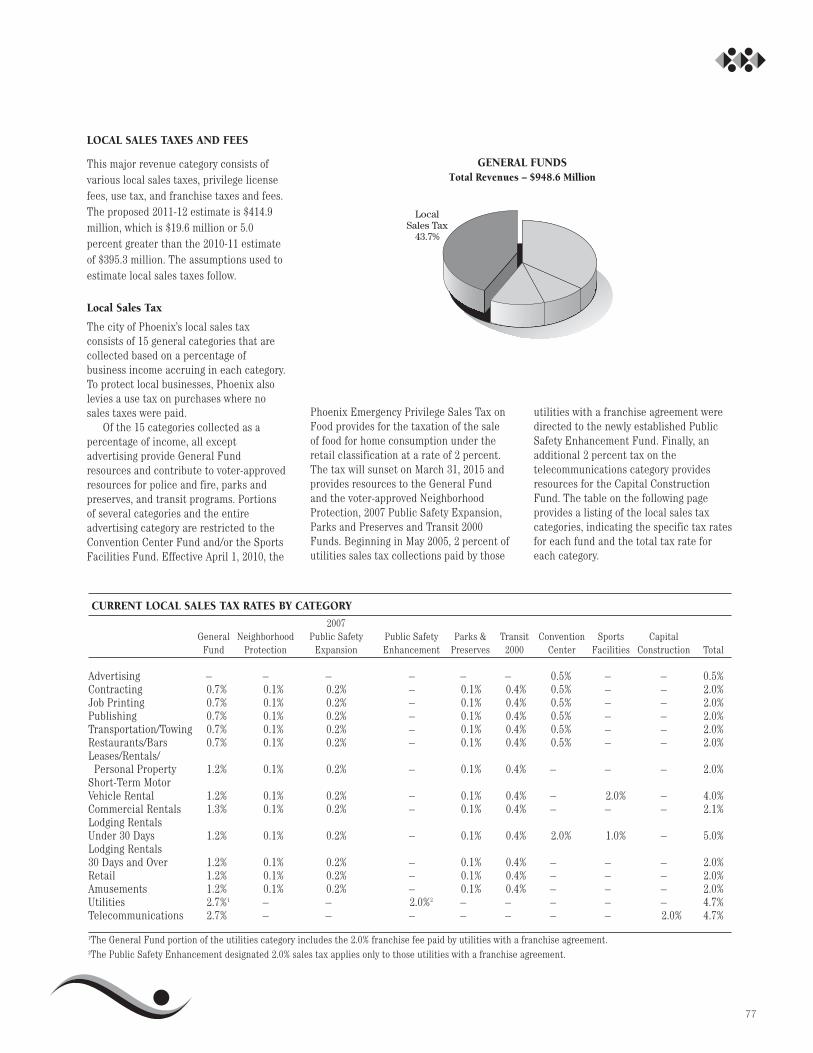
77
LOCAL SALES TAXES AND FEES
This major revenue category consists ofvarious local sales taxes, privilege licensefees, use tax, and franchise taxes and fees.The proposed 2011-12 estimate is $414.9million, which is $19.6 million or 5.0percent greater than the 2010-11 estimateof $395.3 million. The assumptions used toestimate local sales taxes follow.
Local Sales Tax
The city of Phoenix’s local sales taxconsists of 15 general categories that arecollected based on a percentage ofbusiness income accruing in each category.To protect local businesses, Phoenix alsolevies a use tax on purchases where nosales taxes were paid.
Of the 15 categories collected as apercentage of income, all exceptadvertising provide General Fundresources and contribute to voter-approvedresources for police and fire, parks andpreserves, and transit programs. Portionsof several categories and the entireadvertising category are restricted to theConvention Center Fund and/or the SportsFacilities Fund. Effective April 1, 2010, the
Phoenix Emergency Privilege Sales Tax onFood provides for the taxation of the saleof food for home consumption under theretail classification at a rate of 2 percent.The tax will sunset on March 31, 2015 andprovides resources to the General Fundand the voter-approved NeighborhoodProtection, 2007 Public Safety Expansion,Parks and Preserves and Transit 2000Funds. Beginning in May 2005, 2 percent ofutilities sales tax collections paid by those
utilities with a franchise agreement weredirected to the newly established PublicSafety Enhancement Fund. Finally, anadditional 2 percent tax on thetelecommunications category providesresources for the Capital ConstructionFund. The table on the following pageprovides a listing of the local sales taxcategories, indicating the specific tax ratesfor each fund and the total tax rate foreach category.
CURRENT LOCAL SALES TAX RATES BY CATEGORY
2007General Neighborhood Public Safety Public Safety Parks & Transit Convention Sports Capital
Fund Protection Expansion Enhancement Preserves 2000 Center Facilities Construction Total
Advertising – – – – – – 0.5% – – 0.5%Contracting 0.7% 0.1% 0.2% – 0.1% 0.4% 0.5% – – 2.0%Job Printing 0.7% 0.1% 0.2% – 0.1% 0.4% 0.5% – – 2.0%Publishing 0.7% 0.1% 0.2% – 0.1% 0.4% 0.5% – – 2.0%Transportation/Towing 0.7% 0.1% 0.2% – 0.1% 0.4% 0.5% – – 2.0%Restaurants/Bars 0.7% 0.1% 0.2% – 0.1% 0.4% 0.5% – – 2.0%Leases/Rentals/
Personal Property 1.2% 0.1% 0.2% – 0.1% 0.4% – – – 2.0%Short-Term MotorVehicle Rental 1.2% 0.1% 0.2% – 0.1% 0.4% – 2.0% – 4.0%Commercial Rentals 1.3% 0.1% 0.2% – 0.1% 0.4% – – – 2.1%Lodging RentalsUnder 30 Days 1.2% 0.1% 0.2% – 0.1% 0.4% 2.0% 1.0% – 5.0%Lodging Rentals30 Days and Over 1.2% 0.1% 0.2% – 0.1% 0.4% – – – 2.0%Retail 1.2% 0.1% 0.2% – 0.1% 0.4% – – – 2.0%Amusements 1.2% 0.1% 0.2% – 0.1% 0.4% – – – 2.0%Utilities 2.7%1 – – 2.0%2 – – – – – 4.7%Telecommunications 2.7% – – – – – – – 2.0% 4.7%
1The General Fund portion of the utilities category includes the 2.0% franchise fee paid by utilities with a franchise agreement.2The Public Safety Enhancement designated 2.0% sales tax applies only to those utilities with a franchise agreement.
LocalSales Tax
43.7%
GENERAL FUNDSTotal Revenues – $948.6 Million

The General Fund portion of the localsales tax estimate is $398,016,000 for 2011-12. This is an increase of $19,188,000 or 5.1percent from the 2010-11 estimate of$378,828,000. The increase in local salestax revenue is based on the assumptionthe recovery will continue at a modestpace. Estimated growth of 6.5 percent isprojected in the retail sales category.Projected increases in other categoriesinclude 2.0 percent for utility andfranchise; 8.0 percent for commercialrentals; 6.0 percent for restaurants andbars; and 7.0 percent for hotel/motel roomrentals.
As shown in the pie chart above, theretail category represents approximately43 percent of the local General Fund salestax. Personal income growth, which is usedas a trend indicator for retail sales activity,is projected at 3.6 percent for 2011-12.
The tax on food for home consumption,which was effective April 1, 2010, isprojected to generate approximately $28.0million in General Fund revenue in 2010-11 and $29.3 million in 2011-12.
General Fund sales tax revenue iscollected on three rental categories: leasesand rentals of personal property,commercial real property rentals andapartment rentals. For 2011-12, thesecategories are expected to increase 4.0percent, 8.0 percent and 5.0 percentrespectively. These three categoriescombined are approximately 18 percent oflocal General Fund sales tax revenue.
The contracting category is expected togrow by 4.0 percent in 2011-12. Due to thecollapse of the housing market andsignificant reductions in commercialconstruction in the past two years,contracting sales tax is expected toincrease by only 1.0 percent in 2010-11.For 2011-12, economic indicators such asjob creation and population growthindicate residential and commercialconstruction activity will improve, howeverat a slow rate. This category representsapproximately 4 percent of the localGeneral Fund sales tax revenue.
The restaurants and bars category isexpected to increase 6.0 percent and thehotel/motel category is expected toincrease 7.0 percent in 2011-12. These twocategories, combined with revenue fromshort-term motor vehicle rentals, are
closely related to tourism activity. Theexpected growth rate for these categoriesfor 2010-11 are 5.0 percent and 6.0 percentrespectively. Revenues from these tourism-related activities represent approximately6 percent of local General Fund sales taxrevenue.
The utility tax category isapproximately 23 percent of local GeneralFund sales tax revenue. The categoryincludes electricity, natural and artificialgas, water consumption, sewer service andcommunications activities. The 2011-12estimate for utility sales and franchise taxrevenue is $89,707,000, which is anincrease of 2.0 percent over the 2010-11estimate. The increase is due to expectedmodest future increases in account growth.
A use tax is assessed on the purchaseof tangible personal property, which isstored, used or consumed within the city,and for which a local sales tax has notbeen paid at an equivalent rate to the cityof Phoenix rate. The tax also applies toitems purchased for resale andsubsequently used or consumed in thebusiness. The 2011-12 estimate of$15,623,000 for use tax is 6.0 percent or$884,000 more than the 2010-11 estimate.This category is subject to fluctuations inpurchasing practices, as well as economicdrivers. The use tax category isapproximately 4.0 percent of local GeneralFund sales tax revenue.
The following table shows GeneralFund sales tax collections since 2007-08.The amounts shown exclude the twoadditional utility tax items that arecollected based on water service accounts.
78
Various Leasesand Rentals
18%
Retail 43%
Other 6%
Tourism-related6%
Contracting4%
Utility& Franchise
23%
GENERAL FUNDS Local Sales Taxes
GENERAL FUND SALES TAXES(In Thousands of Dollars)
Fiscal Year Revenues % Change From Previous Year
2007-08 $408,515 (3.2)%
2008-09 358,249 (12.3)
2009-10 338,533 (5.5)
2010-11 (Est.) 378,828 11.9
2011-12 (Est.) 398,016 5.1

79
STATE-SHARED REVENUES
This major revenue category consists ofthe city’s share of the state sales tax, thestate income tax and vehicle license tax.The 2011-12 estimate for this category is$280.8 million, which is $21.5 million or 7.1percent less than the 2010-11 estimate of$302.3 million. The decrease is due to aprojected decline of 15.0 percent in state-shared income taxes, which reflectsnegative personal and corporate incomegrowth in 2009-10 due to the recession andthe impact of the 2010 Census. The 2010Census decreases the city’s populationpercentage share from 30.33 percent to28.78 percent for state shared sales tax,from 30.30 percent to 28.75 percent for
state shared income tax and from 42.55percent to 40.92 percent for state sharedVehicle License Tax. State-shared vehiclelicense tax revenue for 2011-12 isestimated to decline at 0.9 percent overthe 2010-11 estimate.
State Sales Tax
The state sales tax rate on most taxableactivities is 6.6 percent. The revenues aresplit between a “distribution base,” ofwhich Phoenix receives a share, and a“combined non-shared” category, which isallocated entirely to the state. Withexceptions for some categories, thedistribution base consists of either 20 or 40percent of collections depending on the
Privilege License Fees
The city charges a $20 fee to process anapplication for a privilege tax license andassesses a $50 annual fee for existinglicenses. These fees are intended torecover the costs associated withadministering a fair and efficient sales taxsystem. This category also includes a $2per unit ($50 maximum) annual fee oneach apartment complex for non-transientlodging. The 2011-12 estimate for privilegelicense fee revenue of $2,465,000represents a 5.3 percent increase from the2010-11 estimate of $2,342,000. Theincrease is based on the assumption thatas the economy improves the number ofapplications will increase.
Other General Fund Excise Taxes
The utility tax collected on water serviceaccounts was implemented on Oct. 1, 1990,and provides resources to help offset jailcosts paid to Maricopa County formisdemeanor defendants. The 2011-12estimate of $14,000,000 for this category is2.2 percent higher than the 2010-11estimate of $13,700,000 and assumes thatas the economy improves collections onwater service accounts will increase.
State-SharedRevenue
29.6%
GENERAL FUNDSTotal Revenues – $948.6 Million
________________________________________________________________________STATE SALES TAXES(In Thousands of Dollars)________________________________________________________________________
Cities’ Share of State Collections Phoenix’s Share __________________ ______________________________
Fiscal Year Total % Change Percent Amount % Change ________________________________________________________________________
2007-08 $447,061 3.2% 30.3% $135,134 (4.5)%2008-09 387,051 (13.4) 30.3 116,275 (14.0)2009-10 356,998 (7.8) 30.3 106,916 (8.0)2010-11 (Est.) 366,102 2.6 30.3 110,137 3.02011-12 (Est.) 383,194 4.7 28.81 110,696 0.5
1Impact of 2010 Census population changes.
tax classification. The 0.6 percenteducation tax included in the total tax rateis not included in the distribution base. InJune 2010, the voters of Arizona approvedProposition 100 which increased the taxrate by 1.0 percent for 36 months and isnot included in the distribution base.Under the current formula, incorporatedcities receive 25 percent of the distributionbase. These funds are distributed toindividual cities on the basis of relativepopulation percentages. Phoenix’s share ofthe distribution to cities for 2011-12 isestimated at 28.78 percent.
The city’s share of the state sales taxfor 2011-12 is expected to be $110,696,000,which is $559,000 or 0.5 percent more thanthe 2010-11 estimate of $110,137,000. Thisestimate is based on the assumption that,similar to the local economy, the stateeconomy will improve in 2011-12. Theestimate also accounts for the decrease inthe city’s population percentage share dueto the 2010 Census as previouslymentioned. At the state level, retail salesare anticipated to increase 5.0 percentover the current fiscal year. The tablebelow shows the cities’ share of state salestaxes, Phoenix’s allocation and annualincrease/decrease since 2007-08. Thepopulation factor changes with decade ormid-decade census counts and periodicadjustments made throughout the year.
State Income Tax
Since 1973, cities in Arizona have shared15 percent of the actual state personal andcorporate income tax collected two yearsearlier. Individual cities receive theirportion based on the cities’ share of thestate population.
The 15 percent portion of the stateincome tax, which will be distributed tocities and towns in 2011-12, is expected tobe $424.6 million. The distributionrepresents actual individual and corporateincome tax collections by the state in the2009-10 fiscal year. The anticipated $424.6
million is a 10.4 percent decline from theprevious fiscal year. The decline isattributable to reduced individual andcorporate income tax collections as aresult of the economic recession.Phoenix's total distribution for 2011-12 isestimated at $122,065,000 and is adecrease of $21,582,000 or 15.0 percentfrom the 2010-11 estimate of $143,647,000.
The following table shows the totalcities’ share of state income tax, Phoenix’sshare, percentage allocation and annualincrease/decrease since 2007-08. Similar tosales tax sharing, population is changedonly on the basis of a census count withperiodic corrections made throughout theyear.
80
STATE INCOME TAX(In Thousands of Dollars)
Fiscal Year
2007-08 15.0% $684,519 24.2% 30.3% $207,694 24.0%2008-09 15.0 727,6771 6.3 30.3 220,806 6.32009-10 15.0 628,656 13.6 30.3 190,546 (13.7)2010-11 (Est.) 15.0 473,927 (24.6) 30.3 143,647 (24.6)2011-12 (Est.) 15.0 424,573 (10.4) 28.82 122,065 (15.0)
1Distribution set by the legislature of $717.1 million, plus one-time distribution of $10.5 million.2Impact of 2010 Census population changes.
Cities’ Share of State Collections Phoenix’s Share
% Sharedw/Cities
Total % Change Percent Amount % Change
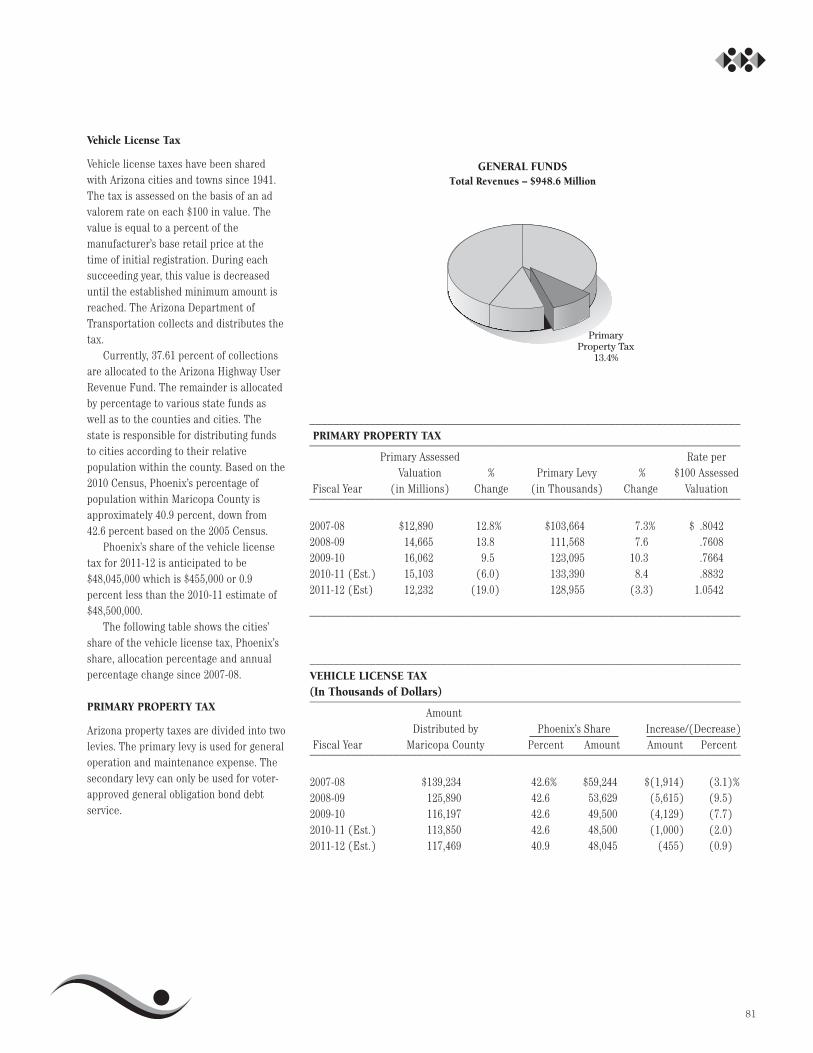
81
Vehicle License Tax
Vehicle license taxes have been sharedwith Arizona cities and towns since 1941.The tax is assessed on the basis of an advalorem rate on each $100 in value. Thevalue is equal to a percent of themanufacturer’s base retail price at thetime of initial registration. During eachsucceeding year, this value is decreaseduntil the established minimum amount isreached. The Arizona Department ofTransportation collects and distributes thetax.
Currently, 37.61 percent of collectionsare allocated to the Arizona Highway UserRevenue Fund. The remainder is allocatedby percentage to various state funds aswell as to the counties and cities. Thestate is responsible for distributing fundsto cities according to their relativepopulation within the county. Based on the2010 Census, Phoenix’s percentage ofpopulation within Maricopa County isapproximately 40.9 percent, down from42.6 percent based on the 2005 Census.
Phoenix’s share of the vehicle licensetax for 2011-12 is anticipated to be$48,045,000 which is $455,000 or 0.9percent less than the 2010-11 estimate of$48,500,000.
The following table shows the cities’share of the vehicle license tax, Phoenix’sshare, allocation percentage and annualpercentage change since 2007-08.
PRIMARY PROPERTY TAX
Arizona property taxes are divided into twolevies. The primary levy is used for generaloperation and maintenance expense. Thesecondary levy can only be used for voter-approved general obligation bond debtservice.
PrimaryProperty Tax
13.4%
GENERAL FUNDSTotal Revenues – $948.6 Million
________________________________________________________________________PRIMARY PROPERTY TAX________________________________________________________________________
Primary Assessed Rate per Valuation % Primary Levy % $100 Assessed
Fiscal Year (in Millions) Change (in Thousands) Change Valuation ________________________________________________________________________
2007-08 $12,890 12.8% $103,664 7.3% $ .80422008-09 14,665 13.8 111,568 7.6 .76082009-10 16,062 9.5 123,095 10.3 .76642010-11 (Est.) 15,103 (6.0) 133,390 8.4 .88322011-12 (Est) 12,232 (19.0) 128,955 (3.3) 1.0542
________________________________________________________________________
________________________________________________________________________VEHICLE LICENSE TAX(In Thousands of Dollars)________________________________________________________________________
AmountDistributed by Phoenix’s Share Increase/(Decrease)
Fiscal Year Maricopa County Percent Amount Amount Percent________________________________________________________________________
2007-08 $139,234 42.6% $59,244 $(1,914) (3.1)%2008-09 125,890 42.6 53,629 (5,615) (9.5)2009-10 116,197 42.6 49,500 (4,129) (7.7)2010-11 (Est.) 113,850 42.6 48,500 (1,000) (2.0)2011-12 (Est.) 117,469 40.9 48,045 (455) (0.9)

The annual increase in the primaryproperty tax levy is limited by the ArizonaConstitution to a 2 percent increase overthe prior levy plus an estimated levy forpreviously unassessed property (primarilynew construction), and allowable tortliability claims.
Before 1996-97, the maximum levyallowed by the Arizona Constitution hadbeen levied each year. Leading up to 1996-97, due to a number of years of decliningassessed valuations, deferral of theproperty tax-supported CapitalImprovement Program was necessary. Anew revenue policy also was established.This policy called for a maximum andminimum allowable combined primary andsecondary property tax rate.
By 1996-97, the application of thisrevenue policy had driven the combinedrate down to the adopted minimum of$1.82. By Council policy, the $1.82 rateremains in effect today. The 2006 BondCommittee recommended that maximumallowable primary property taxes be leviedin order to help support operating andmaintenance costs resulting from 2006bond-funded capital projects.
The chart above shows the changes inthe primary property tax rate since 2006-07. Because the levy is capped at 2 percentregardless of the growth in propertyvalues, the primary property tax ratetrended down in 2007-08 and 2008-09 asassessed values were rising. However, dueto the decline in property values thatoccurred as a result of the recentrecession, that trend has reversed.
The estimated 2011-12 primaryproperty tax levy is $128,955,000. This is a3.3 percent decrease from the 2010-11 levyof $133,390,000. The change in the primarylevy reflects an estimated $2,544,000increase for collections associated withnew properties entering the rolls, plus$2,479,000 for the State Constitutionallowed 2 percent increase on the prioryear levy, and a $9,458,000 decrease over
82
Fiscal Year
2008-09
$1.25
$1.00
$0.75
$0.50
$0.25
$0.00 2009-10 2010-11
$0.88
2011-12
$1.05
Primary Property Tax Rate(combined rate each year is $1.82)
2006-07
$0.85$0.76
2007-08
$0.80 $0.77
the prior year due to allowable tort liabilityclaims for 2010-11. Tort liability claims arenot included in 2011-12. The primary(limited) assessed valuation of $12.23billion is approximately 19.0 percent belowthe 2010-11 primary (limited) assessedvaluation of $15.10 billion.
Historically, actual property taxcollections are slightly lower than theamount levied. For 2011-12, actualcollections for primary property tax areestimated to be $126,763,000 or 98.3percent of the levy amount.
The 2011-12 levy results in anestimated primary property tax rate of$1.0542 per $100 of assessed valuation.This would result in a secondary propertytax rate of $0.7658 to maintain a totalproperty tax rate of $1.82 per $100 ofassessed valuation.
The table on the previous page showsprimary assessed valuation, primaryproperty tax revenues and primary ratessince 2007-08.

83
USER FEES/OTHER REVENUES
This major revenue category consists oflicenses and permits, fines and forfeitures,cable television fees, parks and librariesfees, various user fees designed to recoverthe costs of providing specific city services,and other miscellaneous General Fundrevenue sources. The 2011-12 estimate forthis category is $126.2 million, which is$6.1 million or 4.6 percent less than the2010-11 estimate of $132.3 million.Following are descriptions of the variouscategories and explanations of the revenueestimates.
Licenses and Permits
This category consists of various businesspermit application and annual feesincluding liquor license applications,amusement machines, annual liquorlicenses and other business licenseapplications and fees. The 2011-12estimate of $3,270,000 is higher than the2010-11 estimate of $3,098,000. It isassumed that as the economy continues toimprove, growth in this category will berealized.
Cable Communications
The city imposes a 5 percent fee on thegross receipts of cable television licenseesin return for the use of streets and publicrights of way by cable companies in theprovision of cable television service. The2011-12 estimate of $9,566,000 isunchanged from the 2010-11 estimate. Theprojection assumes no change in thecustomer base for the current cableprovider. Revenue payments are offset byannual payments to the EducationalAccess Account, which are adjustedannually by the consumer price index.
Fines and Forfeitures
This category is comprised of varioussanctions including traffic movingviolations, criminal offense fines, parkingviolations, driving under the influence anddefensive driving program revenues. The2011-12 estimate is $20,759,000 andassumes no growth from 2010-11 due tothe slow recovery from the recentrecession.
Court Default Fee
A $25 default fee was implemented in1993-94 in order to recover court costsassociated with defendants who fail toappear for court appearances or fail to paypreviously imposed sanctions on civiltraffic violations. The 2011-12 estimate forthis revenue category is $1,100,000 and nogrowth is anticipated from 2010-11.
User Feesand Other Revenues
13.3%
GENERAL FUNDSTotal Revenues – $948.6 Million

Fire
The Fire Department receives fees fromvarious services. The majority of therevenue comes from emergencytransportation service (ETS). This userfee includes basic life support andadvanced life support services and relatedcharges for mileage and supplies for theprovision of ambulance service. The 2011-12 estimate for ETS is $36,750,000, whichis $1,550,000 or 4.4 percent greater thanthe 2010-11 estimate of $35,200,000. Theprojected increase is due to anticipatedgrowth in the number of transports and aninflationary increase of 4.2 percent whichis set by the Arizona Department of HealthServices.
Other Fire revenue sources include fireprevention inspection fees, computer-aideddispatch (CAD) and various other servicesprovided to the community. The 2011-12estimate for other Fire services is$11,161,000 which is $198,000 or 1.8percent more than the 2010-11 estimate of$10,963,000. The increase is based onhistorical growth rates and assumesmodest growth in 2011-12.
Hazardous Materials Permit andInspection Fee
Because incidents involving hazardousmaterials have increased over the years, ahazardous materials permit and inspectionfee was established in October 2001.Revenues from this category are used torecover direct costs incurred for inspectingbusinesses that use hazardous materials.Upon review in 2003-04, the annual permitfee amount was raised. This annual permitnow varies from $400 to $1,650 anddepends on the volume of hazardousmaterials stored on site. The 2011-12estimate is $1,300,000, which is unchangedfrom the 2010-11 estimate. Due to therecent recession the number of inspectionshas slowed compared to prior years.
Library Fees
Library fee and fine revenue for 2011-12 isexpected to be $1,256,000, which is $18,000or 1.5 percent above the 2010-11 estimateof $1,238,000. The increase reflects modestgrowth based on the overall assumptionthat as the economy continues to improvecollection of library fees and fines willincrease.
Parks and Recreation Fees
This category includes parks concessionrevenues, swimming pool revenues, fees forthe use of various park facilities such asball fields and recreation programs,activities at Municipal Stadium, MaryvaleStadium and the Papago Baseball Facility,and other miscellaneous park fees. The2011-12 estimate of $7,103,000 is $74,000or 1.0 percent below the 2010-11 estimateof $7,177,000. The decrease in 2011-12 isdue to reductions in collections for athleticfield utility revenue and the PhoenixCenter of the Arts program revenue, whichis now operated by a non-profitorganization.
Planning
User fees in this category include rezoningfees and zoning adjustment fees for usepermits and variances. The 2011-12estimate of $993,000 is slightly less thanthe 2010-11 estimate of $1,002,000 due tothe lack of activity experienced in thiscategory as a result of the recentrecession.
Police
The Police Department receives revenuesfor various services and programs. Policeservices are provided on a fee-per-hourbasis for school and athletic events as wellas other activities where a lawenforcement presence is desired. Inaddition, a false alarm program includesboth permit fees and assessments for falsealarm responses. For 2011-12, the estimateof $12,598,000 is 23.0 percent less than the2010-11 estimate of $16,371,000. Thedecrease is due to a one time legalsettlement received from Western Union in2010-11.
Street Transportation
This user fee category includes permit feesfor utility construction in the public rightsof way as well as utility ordinanceinspections. The 2011-12 estimate of$5,124,000 is $1,236,000 or 19.4 percentless than the 2010-11 estimate of$6,360,000. The decrease is primarily dueto revenue received in 2010-11 for a onetime utility ordinance inspection projectfor Qwest Communications.
Other Service Charges
Revenue in this category is composed ofseveral non-tax sources including interestincome, parking meter revenue, in lieuproperty taxes, sales of surplus andabandoned property, and various rental,parking and concession categories. Theproposed 2011-12 estimate of $12,813,000is $33,000 or 0.3 percent more than the2010-11 estimate of $12,780,000 due toanticipated increases in activity forparking meter revenues.
All Other Fees
This fee category consists of miscellaneousservice charges in the Finance, Housing,Human Services and NeighborhoodServices departments and miscellaneouscategories. The 2011-12 estimate of$2,368,000 is $3,008,000 or 56.0 percentless than the 2010-11 estimate of$5,376,000. The decrease is primarilyattributable to revenue received from thesale of the Arizona Center in 2010-11.
84
85
NON-GENERAL FUNDS
Non-General Fund revenues consist of twomajor categories: Special Revenue andEnterprise funds. The following sectionsprovide descriptions of the various revenuesources in each category and explanationsof 2011-12 revenue estimates. The table onthe next page provides the 2010-11 and2011-12 estimates and 2009-10 actualrevenue amounts for revenues within thesetwo categories.
SPECIAL REVENUE FUNDS
This category consists of several revenuesources that are earmarked for specificpurposes. Included in this category arevoter-approved sales taxes forNeighborhood Protection, Parks andPreserves, Transit 2000, Public SafetyEnhancement, and 2007 Public SafetyExpansion. Also included in this categoryare revenue from Court Awards,Development Services, CapitalConstruction, Sports Facilities, ArizonaHighway User Revenue funds, PublicTransit, Community Reinvestment,Secondary Property Tax, grant funds andother revenues.
Neighborhood Protection Sales Tax
This 0.1 percent sales tax rate wasapproved by the voters in October 1993and implemented in December 1993. Aspresented to the voters, the 0.1 percentincrease is specifically earmarked forPolice neighborhood protection programs(70 percent), Police Block Watchprograms (5 percent) and Fireneighborhood protection programs (25percent). The 2011-12 estimate of$26,908,000 is $1,451,000 or 5.7 percentgreater than the 2010-11 estimate of$25,457,000. These estimates areconsistent with those for the samecategories in the local sales tax discussion.Also, $48,000 is estimated for combinednet interest earnings in 2011-12.
2007 Public Safety Expansion Tax
The 2007 Public Safety Expansion sales taxis a 0.2 percent sales tax approved byvoters in September 2007 andimplemented in December 2007. Revenuesare allocated 80 percent to Police and 20percent to Fire. The funds are to be usedfor hiring additional police personnel andfirefighters; to hire crime sceneinvestigation teams to improve evidencecollection; and to improve fire protectionservices, improve response times, andincrease paramedic and other emergencymedical services. The 2011-12 estimate is$53,766,000 or 5.8 percent more than the2010-11 estimate of $50,828,000. Theseestimates are consistent with those for thesame categories in the local sales taxdiscussion. Also, $140,000 is estimated forinterest earnings in 2011-12.
Public Safety Enhancement Sales Tax
The Public Safety Enhancement sales taxwas implemented on May 1, 2005, and ismade up of the 2.0 percent increment ofthe 2.7 percent sales tax on utilities withfranchise agreements. The fund isallocated between Police and Fire needs.The Police Public Safety EnhancementFund is allocated 62 percent of revenuesand is dedicated to Police and EmergencyManagement needs. The Fire Public SafetyEnhancement Fund is allocated 38 percentof the revenues collected and is dedicatedto Fire needs. The 2011-12 estimate of$24,611,000 is $599,000 or 2.5 percentgreater than the 2010-11 estimate of$24,012,000.
Parks and Preserves Sales Tax
The Parks and Preserves sales tax is a 0.1percent sales tax rate increase approved byvoters in September 1999 and implementedin November 1999. Revenues from the 0.1percent tax are allocated to parkimprovements and acquisition of desertpreserves. This tax was renewed by votersfor a 30-year period in May 2008. Sixtypercent of the revenues are to be used forparks and recreation and 40 percent fordesert preserves. The 2011-12 estimate of$26,910,000 is $1,495,000 or 5.9 percentmore than the 2010-11 estimate of$25,415,000. These estimates are consistentwith the estimates for the same categoriesin the local sales tax discussion. Also,$600,000 is estimated for interest earningsin 2011-12.
Transit 2000 Funds
The Transit 2000 tax is a 0.4 percent salestax approved by the voters in March 2000and implemented in June 2000. The 0.4percent tax is specifically earmarked fortransit programs and improvements. The2011-12 estimate of $107,640,000 is$5,980,000 or 5.9 percent greater than the2010-11 estimate of $101,660,000. Theseestimates are consistent with theestimates for the same categories in thelocal sales tax discussion.
Also included in this fund are fare boxand other miscellaneous transit systemrevenues. Fare box revenues are therevenues collected by the transit servicefor bus ridership. The 2011-12 fare boxrevenue estimate of $43,883,000 is 2.3percent greater than the 2010-11 estimate.The increase is primarily attributable toanticipated marginal increases inridership. The 2011-12 estimate alsoincludes interest earnings and othermiscellaneous revenue of $8,443,000 whichis a 3.3 percent decrease from 2010-11estimate of $8,729,000. The decrease isprimarily attributable to decreasedinterest earnings.

86
NON-GENERAL FUND REVENUES BY MAJOR SOURCE(In Thousands of Dollars)
Increase/(Decrease)Revenue Source 2009-10 2010-11 2011-12 from 2010-11 Est.
Actual Estimate Budget Amount Percent
Special Revenue FundsNeighborhood Protection $21,550 $25,505 $26,956 $1,451 5.7% 2007 Public Safety Expansion 43,493 50,978 53,906 2,928 5.7% Public Safety Enhancement 23,978 24,012 24,611 599 2.5% Parks and Preserves 24,280 26,015 27,510 1,495 5.7% Transit 2000 139,002 153,287 159,966 6,679 4.4% Court Awards 5,179 4,707 11,425 6,718 142.7% Development Services 28,168 31,000 33,100 2,100 6.8% Capital Construction 17,683 16,951 17,502 551 3.3% Sports Facilities 13,615 13,868 14,781 913 6.6%Arizona Highway User Revenue 104,745 105,632 91,126 (14,506) (13.7%)Local Transportation Assistance1 3,771 – – – NA Regional Transit Revenues 58,096 47,126 28,864 (18,262) (38.8%)Community Reinvestment 2,748 7,375 3,854 (3,521) (47.7%)Secondary Property Tax 200,977 156,041 99,757 (56,284) (36.1%)Regional Wireless Cooperative 99 2,050 3,622 1,572 76.7% Impact Fee Program Administration 301 159 203 44 27.7% Court Special Fees 1,866 2,155 2,082 (73) (3.4%)Monopole Rental 142 140 140 – 0.0% Tennis Center 21 22 22 – 0.0% Vehicle Impound Program 3,860 3,418 3,143 (275) (8.0%)Heritage Square 17 19 19 – 0.0% Affordable Housing Program 2,012 1,739 5,248 3,509 201.8% Other Restricted (gifts/trusts) 17,290 20,767 20,967 200 1.0% Grants
Public Housing Grants 86,034 96,490 82,230 (14,260) (14.8%)Human Services Grants 43,805 44,172 42,766 (1,406) (3.2%)Community Development 18,897 20,529 34,665 14,136 68.9% Criminal Justice 12,597 15,809 11,713 (4,096) (25.9%)Public Transit Grants 12,617 21,401 9,983 (11,418) (53.4%)Other Grants 56,156 75,038 119,478 44,440 59.2%
Subtotal - Grants $230,106 $273,439 $300,835 $27,396 10.0%
Total Special Revenue Funds $942,999 $966,405 $929,639 $(36,766) (3.8%)
Enterprise FundsAviation 308,088 321,917 329,036 7,119 2.2% Water System 345,587 358,621 366,646 8,025 2.2% Wastewater System 223,079 231,790 230,882 (908) (0.4%)Solid Waste 138,906 140,143 142,568 2,425 1.7% Convention Center 52,406 60,590 57,391 (3,199) (5.3%)Golf Courses 5,552 5,922 6,130 208 3.5%
Total Enterprise Funds $1,073,618 $1,118,983 $1,132,653 $13,670 1.2%
TOTAL NON-GENERALFUND REVENUE $2,016,617 $2,085,388 $2,062,292 $(23,096) (1.1%)1In April 2010 the Legislature passed a bill permanently sweeping the Local Tranpsortation Assistance Fund.
87
Court Awards Funds
The city of Phoenix receives funds as aresult of participation in the arrest and/orprosecution of certain criminal cases.These funds, referred to as Court Awardsfunds, represent court-ordered forfeituresof seized assets. Their use is limited topolice and prosecutor functions. Revenueestimates are based on cases in progress.The estimate for 2011-12 is $11,425,000,which is $6,718,000 or 142.7 percentgreater than the 2010-11 estimate of$4,707,000. The increase is due to surplusfunds that are required to be spent in2011-12.
Development Services
Revenues in this user fee category includebuilding permits and plans review,subdivision and site plan fees, sign permitfees and engineering permits and planreview fees. These fees are used to fullysupport the activities of DevelopmentServices. The 2011-12 estimate is$33,100,000, which is $2,100,000 or 6.8percent more than the 2010-11 estimate of$31,000,000. This increase assumes agradual increase in permit and reviewactivity as the economy continues toimprove.
Capital Construction
This category includes revenue from a 2percent increase in the sales tax ontelecommunications implemented inFebruary 1998 and is intended toreimburse Phoenix residents for the use oftheir public rights of way by thetelecommunications industry. The 2011-12estimate is $17,377,000, or a 3.7 percentincrease over the 2010-11 estimate. Thesefunds are used primarily for right-of-wayimprovements in the Street TransportationCapital Improvement Program. The 2011-12 estimate also includes interest earningsof $125,000.
Sports Facilities
Sports facilities revenues consist of a 1percent portion of the 5.0 percenthotel/motel tax category, a 2 percent taxon short-term motor vehicle rentals, andinterest revenue generated by the fund.The 2011-12 estimate is $14,386,000, whichis $913,000 or 6.8 percent more than the2010-11 estimate of $13,473,000. Therevenue estimates are consistent with theGeneral Fund sales tax estimates in thehotel/motel and short-term vehicle rentalcategories. The 2011-12 estimate includes$6.1 million for the hotel/motel portionand $8.2 million for the short-term carrental portion. Also, $395,000 is estimatedin 2011-12 for interest revenue.
Arizona Highway User Revenue
The State Transportation Financing Planadopted by the Legislature in 1981 andamended in 1982 and 1985 included a 13cent per gallon gas tax plus other user feesand charges such as registrations, driver’slicenses, motor carrier taxes, othermiscellaneous fees and an increased shareof the motor vehicle license taxes.Additional gasoline taxes were added in1986 (3 cents per gallon), in 1988 (1 centper gallon), and in 1990 (1 cent pergallon) for a total state gas tax rate of 18cents per gallon.
A new distribution formula for ArizonaHighway User Revenue (AHUR) waspassed by the Legislature and signed bythe governor in May 1996 (effective July 1,1996). It was intended to be revenue
neutral to cities. This distribution formulaprovides 27.5 percent to incorporatedcities and towns (distributed one-half onthe relative population of the cities andtowns and one-half on the county origin ofsales/relative population of the counties)and 3 percent to cities over 300,000population (Phoenix, Tucson and Mesa).As a result of the 2010 Census and cuts bythe state of Arizona, Phoenix’s share wasadjusted. For 2011-12, it is anticipated thatPhoenix will receive $72.2 million from the27.5 percent share and $18.0 million fromthe 3 percent share. As mentioned in theCity Manager’s Budget Message, the statemade cuts to AHUR which will be effectivein 2011-12, resulting in the loss of nearly$12 million in 2011-12.
The total 2011-12 AHUR estimate of$91,126,000 is $14,506,000 or 13.7 percentbelow the 2010-11 estimate of$105,632,000. Included in the estimate areinterest earnings and other income of$900,000 in 2011-12 and in 2010-11. Theallocation for Phoenix is estimated at anoverall reduction of 16.1 percent due tothe impact of the 2010 Census and cuts toAHUR made by the state of Arizona.Changes estimated at the state levelinclude gasoline tax collections increasingby 0.8 percent, motor carrier taxcollections (trucking) increasing by 0.3percent, vehicle license tax collectionsincreasing by 0.5 percent and vehicleregistrations including commercial carriersincreasing by 0.4 percent. The followingtable shows the state-shared ArizonaHighway Users allocations to the city ofPhoenix since 2007-08.
ARIZONA HIGHWAY USER REVENUES(In Thousands of Dollars)
Fiscal Year AHUR Distribution Amount Percent
2007-08 $125,289 ($4,934) (3.8%)
2008-09 109,620 (15,669) (12.5)
2009-10 103,979 (5,641) (5.1)
2010-11 (Est.) 104,732 753 0.7
2011-12 (Est.) 90,2261 (14,506) (16.1)
12010 Census adjustment to population is reflected.
Increase/(Decrease)

Regional Transit Revenues
This category includes revenue from theRegional Public Transportation Authority(RPTA) for the regional transportationplan, other state funding agencies, and thesale of bus service provided to otherjurisdictions. The 2011-12 estimate of$28,864,000 is $18,262,000 or 38.8 percentlower than the 2010-11 estimate of$47,126,000. The decrease is due to thecompletion of the initial light rail project,therefore reducing the amount ofreimbursements. The plan is funded by theMaricopa County transportation tax thatwas extended through December 2025 byProposition 400.
Community Reinvestment
The 2011-12 estimate of $3,854,000 is$3,521,000 or 47.7 percent lower than the2010-11 estimate of $7,375,000 andrepresents estimated revenues to bereceived through various economicredevelopment agreements in thedowntown area.
Secondary Property Tax
By law, the secondary property tax canonly be used to pay debt service on voter-approved general obligation bonds. Thereis no statutory limitation on the amount ofproperty taxes levied for debt servicepurposes.
As discussed in the General Fundrevenue section, the estimated 2011-12primary property tax rate is $1.0542. Tomaintain the $1.82 total rate, the resultingsecondary rate is $0.7658 per $100 ofassessed value for 2011-12. The 2011-12secondary property tax levy of $94,529,000is based on this rate and the secondary(full cash) assessed valuation of $12.34billion. This resulting levy is $56,224,000 or37.3 percent less than the 2010-11 levy of$150,753,000. This decrease is primarilydue to a decrease in assessed values.
Also included in the 2011-12 estimate is$140,000 in interest earnings and$5,088,000 in bond interest subsidies.
The table above shows secondary (fullcash) assessed valuation, secondaryproperty tax levies and secondary propertytax rates since 2007-08. The total propertytax rate of $1.82 for 2011-12 has remainedunchanged since 1995-96.
Impact Fee Program Administration
In 1987, the City Council established anImpact Fee Program. Impact fees arecharged to new development in the city’speripheral planning areas. Impact feesassess new development for itsproportionate costs of publicinfrastructure that will be required due tothe development. Impact fees may only beused to pay for the identified publicinfrastructure. In conjunction with theImpact Fee Program, an administrative feecollected as a percentage of the grossimpact fee is also charged. Thisadministrative fee pays for the costs ofadministering the overall Impact FeeProgram.
Beginning in 2004-05, the revenue fromthe administrative fee and the relatedcosts were significant enough to requireseparate accounting. The 2010-11 and2011-12 revenue estimates are $159,000and $203,000 respectively. The 2011-12revenue estimate has decreased by $97,630when compared to the 2009-10 actualrevenue amount of $300,630.
88
________________________________________________________________________SECONDARY PROPERTY TAX ________________________________________________________________________
Secondary Assessed Rate per Valuation Secondary Levy $100 Assessed
Fiscal Year (in Millions) % Change (in Thousands) % Change Valuation________________________________________________________________________
2007-08 $16,069 31.1% $163,227 36.6% $1.01582008-09 18,856 17.3 199,724 22.4 1.05922009-10 18,861 0.0 198,722 (0.5) 1.05362010-11 (Est.) 16,092 (14.7) 150,753 (24.1) 0.93682011-12 (Est.) 12,344 (23.3) 94,529 (37.3) 0.7658
89
Other Restricted Fees
Included in this category are revenuesassociated with the Court TechnologyEnhancement fee and the JudicialCollection Enhancement Fund, HeritageSquare, the Tennis Center at WashingtonPark, Vehicle Impound fees, AffordableHousing Program revenues, storm watermanagement fees, and monopole rentalsfrom several city parks. Also included isrevenue from restricted fees for recreationand other programs, and donationsspecified for various city programs.
The 2011-12 estimate of $31,621,000 is$3,361,000 or 11.9 percent above the 2010-11 estimate of $28,260,000. The increase isprimarily due to projected increases in theaffordable housing program for publichousing rental income.
Public Housing Grants
The 2011-12 Public Housing grantsrevenue included in the annual operatingbudget is $82,230,000 which is a 14.8percent decrease from 2010-11 of$96,490,000. This decrease is due to areduction in HOME program funds fromthe federal government. The HOMEprogram is aimed at increasing theavailability of affordable rental housingand expanding home ownershipopportunities for first-time homebuyers.Other items in this category includehousing subsidies, interest income andhousing assistance payments.
Human Services Grants
The 2011-12 revenue estimate of$42,766,000 is $1,406,000 or 3.2 percentless than the 2010-11 estimate of$44,172,000. The decrease is due to areduced amount of grant revenue for theFederal Head Start Program and AmericanRecovery and Reinvestment Act (ARRA).This category includes funds from theDepartment of Health and HumanServices, Workforce Investment Act, AgingProgram Grants and Head Start funds.
Community Development Block Grant
Each year since 1974, the city has receivedCommunity Development Block Grantfunds from the U.S. Department ofHousing and Urban Development. Thesefunds are used to support a variety ofprojects and programs that must meet thefollowing national objectives: benefit low-and moderate-income persons; aid in theprevention or elimination of slums andblight; or meet other urgent communitydevelopment needs. The 2011-12 CDBGentitlement is $34,665,000 which is$14,136,000 or 68.9 percent more than the2010-11 estimate of $20,529,000. Theincrease is due to an increase in CDBGgrants from the federal government.
Criminal Justice Grants
The 2011-12 grant revenue for criminaljustice programs is estimated to be$11,713,000 which is $4,096,000 or 25.9percent less than the 2010-11 estimate of$15,809,000. The decrease is due to areduction in ARRA funding. This categoryincludes Police, Court and Lawdepartment grants. Grants include fundingfor the Police Department trainingacademy, drug trafficking prevention andother crime related prevention programs.
Public Transit Grants
The 2011-12 Federal TransitAdministration Grant estimate is$9,983,000 reflecting a decrease of$11,418,000 or 53.4 percent below the2010-11 estimate of $21,401,000. The 2010-11 estimate accounts for one time federaltransit administration grant savings that isnot expected to occur in 2011-12.
Other Grants
The 2011-12 budget also includes$119,478,000 for federal, state and othergrants which is $44,440,000 or 59.2 percentmore than the 2010-11 estimate of$75,038,000. The increase is due toadditional ARRA grants for theNeighborhood Stabilization Program. Thiscategory includes funding for theneighborhood stabilization program,various parks and recreation and libraryactivities as well as programs such asworkforce development.
ENTERPRISE FUNDS
This category includes revenues from thecity’s six Enterprise funds includingAviation, Water, Wastewater, Solid Waste,Convention Center and Golf. TheseEnterprise funds fully recover their coststhrough user fees associated with theprovision of their services. This categoryalso includes the Convention Center that,in addition to the user fees associated withthe operation of the Convention Center, issupported by earmarked sales taxes.Following are descriptions of eachEnterprise Fund category and explanationsof the revenue estimates.
Aviation
Aviation revenue estimates include landingfees, concession revenues and interestincome at Sky Harbor International, DeerValley and Goodyear airports. TotalAviation revenue for 2011-12 is anticipatedto be $329,036,000, which is $7,119,000 or2.2 percent greater than the 2010-11estimate of $321,917,000. The proposed2011-12 estimate anticipates conservativegrowth in airline fees, landing fees andconcessions revenues.
The table on the next page showsAviation revenue by major category andannual percent change since 2007-08.

90
SUMMARY OF WATER SYSTEM REVENUES (In Thousands of Dollars)
2010-11 2011-122007-08 2008-09 2009-10 (Est.) (Est.)
Water Sales $235,342 $240,068 $254,732 $261,566 $268,882 Environmental Consumption Charge 35,977 41,015 45,852 47,531 48,884 Raw Water Charge 15,957 15,943 19,066 21,799 24,552 Interest 13,976 8,270 6,243 3,104 1,254 Development Fees 4,772 1,859 1,606 1,200 1,500 Combined Service Fees 2,249 2,905 3,126 6,000 6,000 Val Vista 7,861 7,171 8,314 9,723 9,439 All Other 15,771 10,948 6,648 7,698 6,135
Total Water Revenue $331,905 $328,179 $345,587 $358,621 $366,646
Change From Prior Year 6.4% (1.1%) 5.3% 3.8% 2.2%
SUMMARY OF AVIATION REVENUES(In Thousands of Dollars)
2010-11 2011-122007-08 2008-09 2009-10 (Est.) (Est.)
Airline Operation $ 95,741 $ 103,068 $ 101,188 $ 103,000 $ 108,000
Concessions and Rentals 182,420 161,110 159,358 171,300 173,317
Rental Car Facility 36,146 33,948 36,135 37,000 37,000
Interest 10,967 8,584 3,263 1,620 1,620
Other/Federal Grants 6,550 6,107 3,426 3,793 3,768
Goodyear 1,506 1,504 1,703 1,707 1,724
Deer Valley 2,741 2,731 3,015 3,497 3,607
Total Aviation Revenue $336,071 $317,052 $308,088 $321,917 $329,036
Change From Prior Year 4.1% (5.7%) (2.8%) 4.5% 2.2%
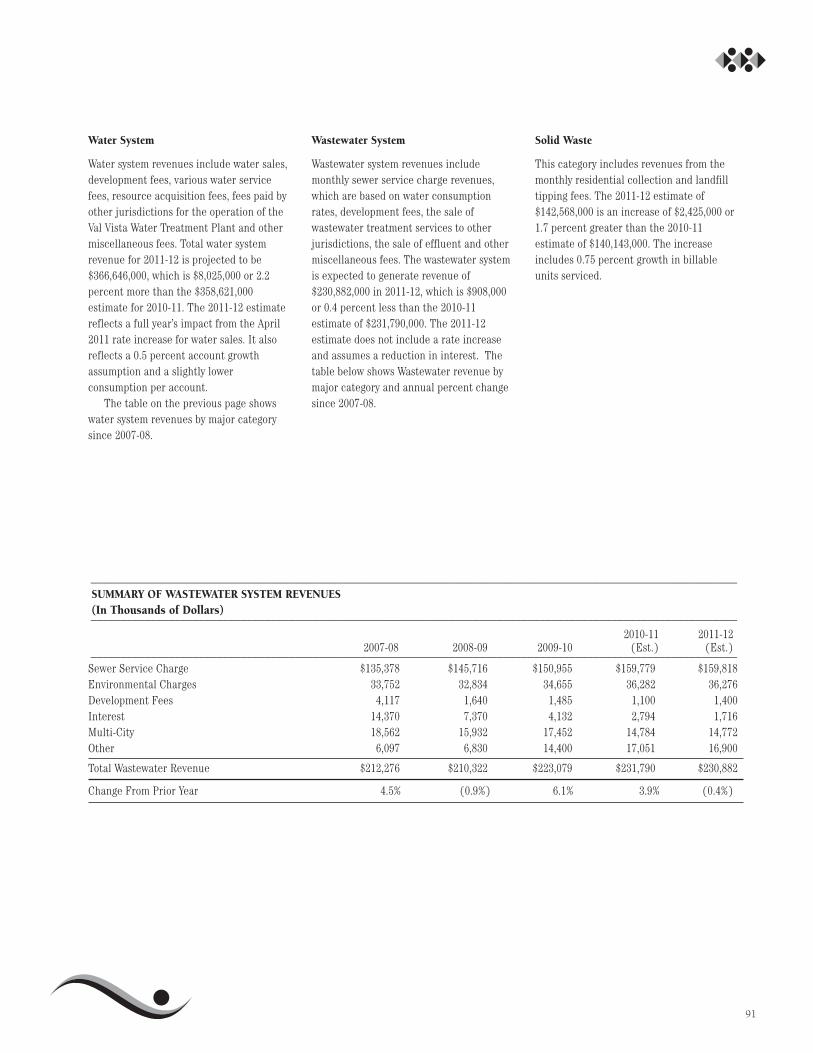
91
Water System
Water system revenues include water sales,development fees, various water servicefees, resource acquisition fees, fees paid byother jurisdictions for the operation of theVal Vista Water Treatment Plant and othermiscellaneous fees. Total water systemrevenue for 2011-12 is projected to be$366,646,000, which is $8,025,000 or 2.2percent more than the $358,621,000estimate for 2010-11. The 2011-12 estimatereflects a full year’s impact from the April2011 rate increase for water sales. It alsoreflects a 0.5 percent account growthassumption and a slightly lowerconsumption per account.
The table on the previous page showswater system revenues by major categorysince 2007-08.
Wastewater System
Wastewater system revenues includemonthly sewer service charge revenues,which are based on water consumptionrates, development fees, the sale ofwastewater treatment services to otherjurisdictions, the sale of effluent and othermiscellaneous fees. The wastewater systemis expected to generate revenue of$230,882,000 in 2011-12, which is $908,000or 0.4 percent less than the 2010-11estimate of $231,790,000. The 2011-12estimate does not include a rate increaseand assumes a reduction in interest. Thetable below shows Wastewater revenue bymajor category and annual percent changesince 2007-08.
Solid Waste
This category includes revenues from themonthly residential collection and landfilltipping fees. The 2011-12 estimate of$142,568,000 is an increase of $2,425,000 or1.7 percent greater than the 2010-11estimate of $140,143,000. The increaseincludes 0.75 percent growth in billableunits serviced.
____________________________________________________________________________________________________________SUMMARY OF WASTEWATER SYSTEM REVENUES(In Thousands of Dollars)____________________________________________________________________________________________________________
____________________________________________________________________________________________________________Sewer Service Charge $135,378 $145,716 $150,955 $159,779 $159,818Environmental Charges 33,752 32,834 34,655 36,282 36,276Development Fees 4,117 1,640 1,485 1,100 1,400Interest 14,370 7,370 4,132 2,794 1,716Multi-City 18,562 15,932 17,452 14,784 14,772Other 6,097 6,830 14,400 17,051 16,900
Total Wastewater Revenue $212,276 $210,322 $223,079 $231,790 $230,882
Change From Prior Year 4.5% (0.9%) 6.1% 3.9% (0.4%)
2010-11 2011-122007-08 2008-09 2009-10 (Est.) (Est.)
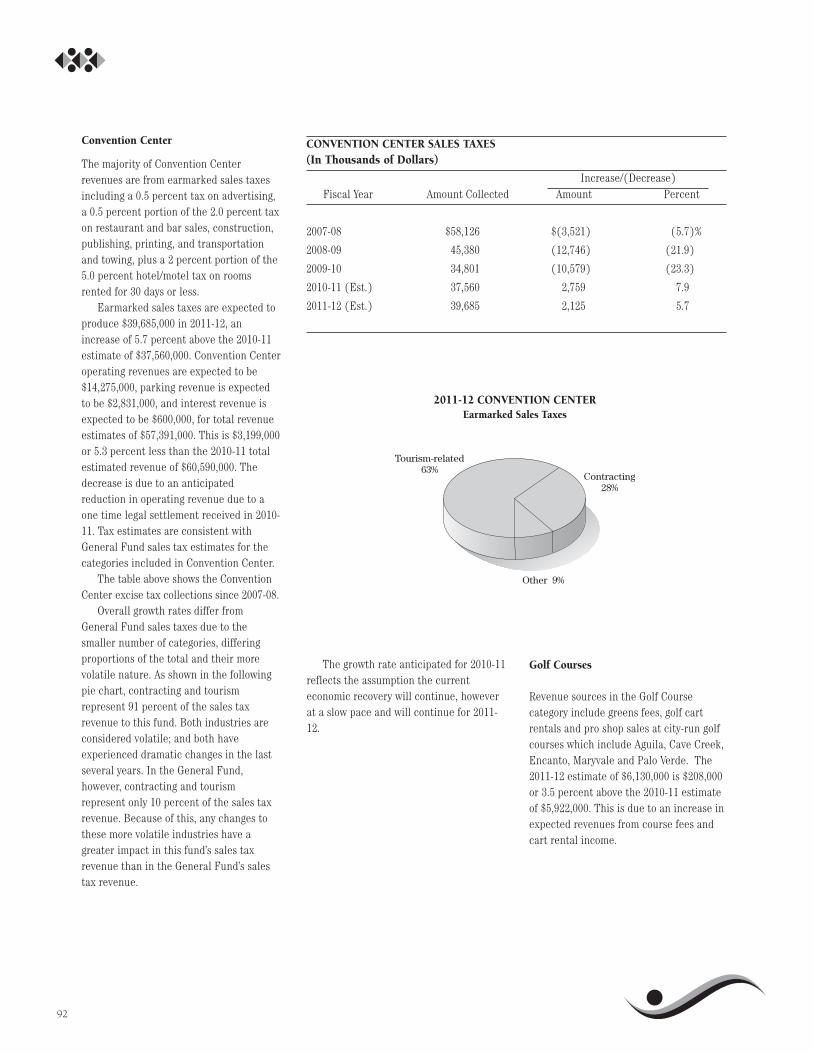
Convention Center
The majority of Convention Centerrevenues are from earmarked sales taxesincluding a 0.5 percent tax on advertising,a 0.5 percent portion of the 2.0 percent taxon restaurant and bar sales, construction,publishing, printing, and transportationand towing, plus a 2 percent portion of the5.0 percent hotel/motel tax on roomsrented for 30 days or less.
Earmarked sales taxes are expected toproduce $39,685,000 in 2011-12, anincrease of 5.7 percent above the 2010-11estimate of $37,560,000. Convention Centeroperating revenues are expected to be$14,275,000, parking revenue is expectedto be $2,831,000, and interest revenue isexpected to be $600,000, for total revenueestimates of $57,391,000. This is $3,199,000or 5.3 percent less than the 2010-11 totalestimated revenue of $60,590,000. Thedecrease is due to an anticipatedreduction in operating revenue due to aone time legal settlement received in 2010-11. Tax estimates are consistent withGeneral Fund sales tax estimates for thecategories included in Convention Center.
The table above shows the ConventionCenter excise tax collections since 2007-08.
Overall growth rates differ fromGeneral Fund sales taxes due to thesmaller number of categories, differingproportions of the total and their morevolatile nature. As shown in the followingpie chart, contracting and tourismrepresent 91 percent of the sales taxrevenue to this fund. Both industries areconsidered volatile; and both haveexperienced dramatic changes in the lastseveral years. In the General Fund,however, contracting and tourismrepresent only 10 percent of the sales taxrevenue. Because of this, any changes tothese more volatile industries have agreater impact in this fund’s sales taxrevenue than in the General Fund’s salestax revenue.
92
CONVENTION CENTER SALES TAXES (In Thousands of Dollars)
Fiscal Year Amount Collected Amount Percent
2007-08 $58,126 $(3,521) (5.7)%
2008-09 45,380 (12,746) (21.9)
2009-10 34,801 (10,579) (23.3)
2010-11 (Est.) 37,560 2,759 7.9
2011-12 (Est.) 39,685 2,125 5.7
Increase/(Decrease)
Tourism-related63%
Contracting28%
Other 9%
2011-12 CONVENTION CENTEREarmarked Sales Taxes
The growth rate anticipated for 2010-11reflects the assumption the currenteconomic recovery will continue, howeverat a slow pace and will continue for 2011-12.
Golf Courses
Revenue sources in the Golf Coursecategory include greens fees, golf cartrentals and pro shop sales at city-run golfcourses which include Aguila, Cave Creek,Encanto, Maryvale and Palo Verde. The2011-12 estimate of $6,130,000 is $208,000or 3.5 percent above the 2010-11 estimateof $5,922,000. This is due to an increase inexpected revenues from course fees andcart rental income.
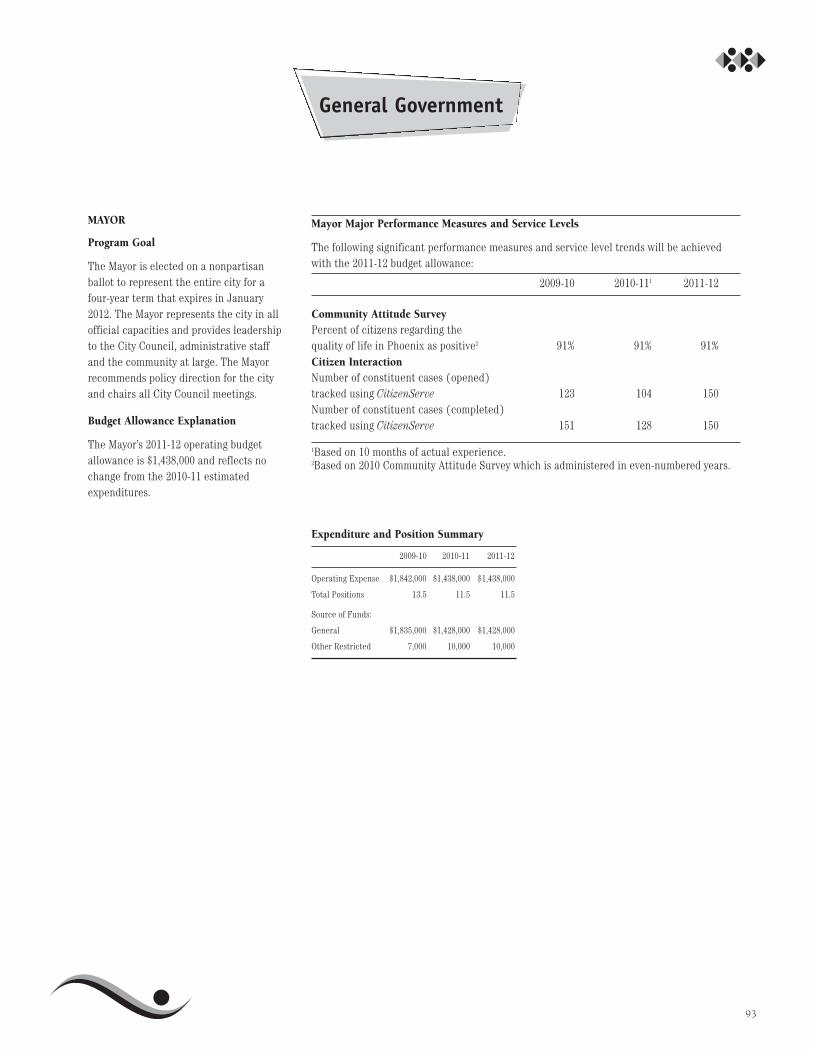
MAYOR
Program Goal
The Mayor is elected on a nonpartisanballot to represent the entire city for afour-year term that expires in January2012. The Mayor represents the city in allofficial capacities and provides leadershipto the City Council, administrative staffand the community at large. The Mayorrecommends policy direction for the cityand chairs all City Council meetings.
Budget Allowance Explanation
The Mayor’s 2011-12 operating budgetallowance is $1,438,000 and reflects nochange from the 2010-11 estimatedexpenditures.
General Government
Expenditure and Position Summary
2009-10 2010-11 2011-12
Operating Expense $1,842,000 $1,438,000 $1,438,000
Total Positions 13.5 11.5 11.5
Source of Funds:
General $1,835,000 $1,428,000 $1,428,000
Other Restricted 7,000 10,000 10,000
Mayor Major Performance Measures and Service Levels
The following significant performance measures and service level trends will be achievedwith the 2011-12 budget allowance:
2009-10 2010-111 2011-12
Community Attitude SurveyPercent of citizens regarding the quality of life in Phoenix as positive2 91% 91% 91%Citizen InteractionNumber of constituent cases (opened)tracked using CitizenServe 123 104 150Number of constituent cases (completed)tracked using CitizenServe 151 128 150
1Based on 10 months of actual experience.2Based on 2010 Community Attitude Survey which is administered in even-numbered years.
93

94
CITY COUNCIL
Program Goal
The City Council is composed of eightcouncil members elected by districts on anonpartisan ballot. Four-year terms forcouncil members from even-numbereddistricts expire in January 2014. Terms forcouncil members from odd-numbereddistricts expire in January 2012. The CityCouncil serves as the legislative andpolicy-making body of the municipalgovernment and has responsibilities forenacting city ordinances, appropriatingfunds to conduct city business andproviding policy direction to theadministrative staff. Under the provisionsof the City Charter, the City Councilappoints a city manager, who is responsiblefor carrying out its established policies andadministering operations.
Budget Allowance Explanation
The 2011-12 City Council operating budgetallowance of $3,323,000 is $31,000 or 0.9percent less than 2010-11 estimatedexpenditures and reflects decreasedcharges from Information TechnologyServices for IT support due to a change inhow enterprise technology costs are beingdistributed to departments.
Expenditure and Position Summary
2009-10 2010-11 2011-12
Operating Expense $3,062,000 $3,354,000 $3,323,000
Total Positions 40.0 30.0 30.0
Source of Funds:
General $3,062,000 $3,354,000 $3,323,000
City Council Performance Measures and Service Levels
The following significant performance measures and service level trends will be achievedwith the 2011-12 budget allowance:
2009-10 2010-111 2011-12
Percent of citizens who regard the city of Phoenix as a good place to live.2 91% 91% 91%
Number of citizen cases tracked using CitizenServe. 3,228 2,045 5,500
1Based on 10 months actual experience.2Based on 2010 Community Attitude Survey which is administered in even-numberedyears.
The City Council holds “formal” council meetings, Wednesdays at 3 p.m. in the
City Council Chambers where ordinances and resolutions, the laws of Phoenix,
and formal actions are adopted.
CITY MANAGER
Program Goal
The city manager provides professionaladministration of the policies and objectivesestablished by the Mayor and City Council,develops alternative solutions to communityproblems for Mayor and City Councilconsideration and plans programs that meet thefuture public needs of the city. Deputy citymanagers oversee and provide assistance to citydepartments to ensure achievement of theirdepartmental objectives and the objectives ofthe city government as a whole.
Budget Allowance Explanation
The City Manager’s Office 2011-12 operatingbudget allowance of $ 2,289,000 is $85,000 or 3.9percent more than 2010-11 estimatedexpenditures. The increase is due to thetransfer of a position for a citywide volunteercoordinator and normal inflationary factors.
REGIONAL WIRELESS COOPERATIVE(RWC)
Program Goal
The Regional Wireless Cooperative (RWC) is anindependent, multi-jurisdictional organizationwhich manages and operates a regional radiocommunications network built to seamlesslyserve the interoperable communication needsof first responders and other municipal radiousers in and around Central Arizona's Valley ofthe Sun. Formerly known as the PhoenixRegional Wireless Network, the RWC hasexpanded to service a still growing list of cities,towns and fire districts, along with many otherarea entities who serve public safety needs. TheRWC was formed through a governancestructure founded on the principle ofcooperation for the mutual benefit of allmembers.
95
Expenditure and Position Summary
2009-10 2010-11 2011-12
Operating Expense $2,314,000 $2,204,000 $2,289,000
Total Positions 19.0 18.0 18.0
Source of Funds:
General $2,111,000 $1,890,000 $1,973,000
Water 203,000 314,000 316,000
Expenditure and Position Summary
2009-10 2010-11 2011-12
Operating Expense — $3,537,000 $3,630,000
Total Positions 5.0 4.0 4.0
Source of Funds:
RWC — $3,537,000 $3,630,000
City Manager’s Office Major Performance Measures and Service Levels
The following significant performance measures and service level trends will be achievedwith the 2011-12 budget allowance:
2009-10 2010-111 2011-12
Public satisfaction with city services2 88% 83% 83%
Percent of employees agreeing that the city is a good place to work3 96% 97% 97%
Items processed for City Council subcommittee action 284 328 250
Number of community and non- profit meetings attended4 245 190 150
1Based on the 2008 Community Attitude Survey which is administered in even-numbered years.
2Based on 2010 Community Attitude Survey which is administered in even-numberedyears.
3Based on 2009 Employee Survey which is administered in odd-numbered years.4Decrease in current year and 2011-12 due to decreased staff levels and lesssubcommittee activity.
Budget Allowance Explanation
The RWC 2011-12 operating budgetallowance of $3,630,000 is $93,000 or2.6 percent more than 2010-11estimated expenditures. The increasereflects the addition of maintenancestaff as the program expands toinclude additional service and newmembers within the cooperative.
96
GOVERNMENT RELATIONS
Program Goal
The Office of Government Relationsrepresents the city, as appropriate, incontacts with federal, state, regional,county and other city governments.Government Relations also is charged withcitywide grants coordination.
Budget Allowance Explanation
The Government Relations 2011-12operating budget allowance of $1,321,000 is$87,000 or 7.1 percent more than 2010-11estimated expenditures. This increasereflects the addition of a managementassistant I position needed to assist withcitywide grants management, and is offsetby decreased funding for subscriptions,memberships and consultants, which willimpact the department’s ability to providecity representation at the Arizona StateLegislature and other local governmentmeetings.
Government Relations Major Performance Measures and Service Levels
The following significant performance measures and service level trends will be achievedwith the 2011-12 budget allowance:
2009-10 2010-111 2011-12
Number of governments, communities, regional and private sector agencies, neighborhood associations, commissions and organizations communicated with during the year. 508 500 500
Number of Arizona state legislative bill versions and amendments evaluated and prepared to support or oppose. 2,846 3,500 3,500
1Based on 10 months actual experience.
Expenditure and Position Summary
2009-10 2010-11 2011-12
Operating Expense $1,408,000 $1,234,000 $1,321,000
Total Positions 5.0 6.0 6.0
Source of Funds:
General $1,311,000 $1,234,000 $1,321,000
Other Restricted 97,000 — —
PUBLIC INFORMATION
Program Goal
The Public Information Office disseminatesinformation on city governmental servicesto residents, and assists them in using andunderstanding the information. The officealso encourages participation in citygovernment and develops programming forthe government access cable televisionchannel.
Budget Allowance Explanation
The Public Information 2011-12 operatingbudget allowance of $2,625,000 is $35,000or 1.3 percent less than 2010-11 estimatedexpenditures. The decrease is primarilydue to a change in how enterpriseinformation technology costs are beingdistributed to city departments and theelimination of the specialized standalonePDF version of the City Connectionemployee newsletter. This is partiallyoffset by a restoration of funding forclosed-captioning of City Council PolicySessions and all other PHX11programming.
Expenditure and Position Summary
2009-10 2010-11 2011-12
Operating Expense $2,985,000 $2,660,000 $2,625,000
Total Positions 27.2 23.5 23.5
Source of Funds:
General $2,658,000 $2,327,000 $2,319,000
Other Restricted 327,000 333,000 306,000
Public Information Major Performance Measures and Service Levels
The following significant performance measures and service level trends will be achievedwith the 2011-12 budget allowance:
2009-10 2010-111 2011-12
Percent of news releases that generate media coverage 78% 81% 81%
New PHX 11 programs produced per year2 300 288 290
Percent of news distributed to stakeholders by 5 p.m. daily 90% 93% 93%
Percent of e-mail responses to public inquiries within one day 99% 98% 98%
Average response time to public records requests (days) 7.5 3.7 4.0
Phoenix.gov page visits (monthly average) 1,203,700 1,120,000 1,120,000
*Based on 10 months actual experience.2Reduced number of programs produced in 2010-11 was due to budget reductions.

97
Fiscal Year *Estimated
2008-09
$4
$3
$2
$1
$0
City AuditorImpact of Recommendations
2007-08
Millions
$2.6 $2.6$2.1
2009-10
$3.1
2010-11* 2011-12*
$2.0
CITY AUDITOR
Program Goal
The City Auditor Department supports thecity manager and elected officials inmeeting residents’ needs for qualitygovernment, products and services byproviding independent and objectivefeedback on the city’s programs, activitiesand functions. The city auditor’s work isvital in maintaining trust and confidencethat city resources are used effectively andhonestly. The City Auditor Departmentbudget also funds an annual independentaudit conducted by outside auditors inaccordance with the City Charter. Thisincludes an audit of city accounting andfinancial records, the federal single audit,review of the City of Phoenix Employees’Retirement System, external audits ofspecific activities and review of businesssystems for possible improvements.
Budget Allowance Explanation
The City Auditor 2011-12 operating budgetallowance of $2,575,000 is $373,000 or 12.7percent less than 2010-11 estimatedexpenditures. The decrease is due to thecompletion of Council-approved innovationand efficiency audits performed by outsideconsultants and programmed only in 2010-11. This decrease is partially offset bynormal inflationary costs.
City Auditor Major Performance Measures and Service Levels
The following significant performance measures and service trends will be achieved with the2011-12 budget allowance:
2009-10 2010-111 2011-12
Percent of audit plan completed 62% 75% 75%
Performance audit and management reports issued2 161 140 130
Average audit cycle time (calendar days)2 161 156 156
Economic impact of audits as a result of identified $3.1 $2.6 $2.0improvements or cost savings (millions)
Hearing rulings issued timely according to time 100% 100% 100%frames listed in the City Code
1Based on 10 months actual experience.2Number of audit reports issued and average cycle time can vary due to the size andcomplexity of audits conducted.
Expenditure and Position Summary
2009-10 2010-11 2011-12
Operating Expense $2,509,000 $2,948,000 $2,575,000
Total Positions 26.5 26.5 26.5
Source of Funds:
General $2,509,000 $2,948,000 $2,575,000

98
EQUAL OPPORTUNITY
Program Goal
The Equal Opportunity Departmentpromotes and enforces equal opportunitiesfor city employees and the public throughvoluntary affirmative action, education,community involvement and enforcementprograms. These programs are carried outby a combination of staff and volunteerpanels appointed by the Mayor and CityCouncil.
Budget Allowance Explanation
The Equal Opportunity 2011-12 budgetallowance of $2,690,000 is $27,000 or 1.0percent less than 2010-11 estimatedexpenditures. The decrease is primarilydue to increased charges to federal fundsfor additional compliance monitoring.
Equal Opportunity Major Performance Measures and Service Levels
The following significant performance measures and service trends will be achieved with the2011-12 budget allowance:
2009-10 2010-111 2011-12
Discrimination complaints in employment, public accommodations, housing and Americans with Disabilities Act (ADA) accessibility, investigated and closed 242 176 176
Percentage of discrimination complaints investigated timely2 89% 79% 79%
Outreach presentations to area businesses and small business advocacy organizations 13 13 13
Number of disadvantaged business enterprises (DBEs) certified based on target of 65 firms3 65 76 76
Number of small business enterprises (SBEs) certified based on target of 800 firms3 729 738 738
Construction contracts monitored for use of M/W/D/SBE subcontractors 980 850 900
1Based on 10 months actual experience.2Case timelines may be dictated by state and federal enforcement agencies and not by
city timelines.3Number of certified DBE and SBE firms increased in 2010-11 due to increased interest incity business opportunities as a result of the economic downturn.
Expenditure and Position Summary
2009-10 2010-11 2011-12
Operating Expense $3,060,000 $2,717,000 $2,690,000
Total Positions 25.0 26.0 26.0
Source of Funds:
General $2,622,000 $2,323,000 $2,287,000
Community DevelopmentBlock Grant 237,000 237,000 245,000
Federal and State Grants 183,000 138,000 145,000
Other Restricted 18,000 19,000 13,000

99
Fiscal Year
2001 2009
100%
75%
50%
25%
0%
Human ResourcesPercent of city employees who agree the city
of Phoenix is a good place to work*
2003
*Results from the biennial Employee Opinion Survey.The next survey is scheduled for Fall 2011.
2005
96% 97%97% 97%
2007
97%
HUMAN RESOURCES
Program Goal
The Human Resources Department partnerswith departments and employees to hire,compensate, support and develop a diverseworkforce that is dedicated to deliveringhigh-quality services to the community.
Budget Allowance Explanation
The Human Resources Department 2011-12operating budget allowance of $11,730,000 is$1,121,000 or 10.6 percent more than 2010-11estimated expenditures. The increase isprimarily due to funding for the employeecompensation study, the carry forward offunds for the pension study, and the transferof existing staff from other departments tocentralize the provision of human resourceservices for small and medium departments.These increases are partially offset by achange in how enterprise informationtechnology costs are being distributed todepartments.
Human Resources Department Major Performance Measures and Service Levels
The following significant performance measures and service trends will be achieved withthe 2011-12 budget allowance:
2009-10 2010-111 2011-12
Percentage of qualified applicants who 47.3% 45.3% 45.0%are minorities (target is 28%)
Percentage of qualified applicants who 39.0% 40.0% 40.0%are female (target is 44%)
Annualized employee turnover rate 5.2% 6.0% 6.0%
Employee performance evaluations 92% 92% 92%completed on time (target is 90%)
The number of employee suggestions 179 200 220received2
1Based on 10 months actual experience.2New measure to help track employee participation in the effort to improve efficiency ofcity operations and services.
Expenditure and Position Summary
2009-10 2010-11 2011-12
Operating Expense $12,644,000 $10,609,000 $11,730,000
Total Positions 79.6 77.1 93.1
Source of Funds:
General $11,348,000 $9,861,000 $11,008,000
City Improvement 978,000 331,000 303,000
Other Restricted 318,000 417,000 419,000

100
PHOENIX EMPLOYMENT RELATIONSBOARD
Program Goal
The Phoenix Employment Relations Boardoversees administration of the city’s meetand confer ordinance. Primaryresponsibilities of the board includeconducting representation elections, andselecting mediators and fact finders toresolve impasses. The board consists offive members appointed by the CityCouncil and has one staff member.
Budget Allowance Explanation
The Phoenix Employment Relations Board2011-12 operating budget allowance of$162,000 is $28,000 or 20.9 percent morethan 2010-11 estimated expenditures. Thisincrease is primarily due to an adjustmentin expected costs.
Phoenix Employment Relations Board Major Performance Measures and Service Levels
The following significant performance measures and service trends will be achieved with the2011-12 budget allowance:
2009-10 2010-111 2011-12
Number of cases filed annually2 19 5 9
1Based on 10 months actual experience.2Number of cases filed varies depending upon specific issues encountered.
Expenditure and Position Summary
2009-10 2010-11 2011-12
Operating Expense $103,000 $134,000 $162,000
Total Positions 1.0 1.0 1.0
Source of Funds:
General $103,000 $134,000 $162,000
RETIREMENT SYSTEMS
Program Goal
Retirement Systems provides staff supportto the general, police and fire retirementboards and administers retirementprograms for all city employees.
Budget Allowance Explanation
The Retirement Systems 2011-12 grossoperating budget allowance of $1,720,000is $38,000 or 2.3 percent more than 2010-11 estimated expenditures. The increase isprimarily due to normal inflationaryincreases.
Retirement Systems Major Performance Measures and Service Levels
The following significant performance measures and service trends will be achieved with the2011-12 budget allowance:
2009-10 2010-111 2011-12
General city retirements2 433 450 400
Public safety retirements2 234 350 200
General city and public safety member contactsAppointments2 926 975 800Walk-in service2 2,389 2,600 2,100Telephone calls2 9,591 9,900 9,800
Overall member satisfaction survey as rated on a scale of 1 to 4, with 4 being the best. 3.81 3.84 3.80
Success of educational classes as rated on a scale of 1 to 4, with 4 being the best. 3.73 3.70 3.70
1Based on 10 months actual experience. 22010-11 increase is due to increased activity associated with budget reductions.
Expenditure and Position Summary
2009-10 2010-11 2011-12
Operating Expense $1,620,000 $1,682,000 $1,720,000(Gross1)
Total Positions 14.0 14.0 14.0
Source of Funds:
General (Gross*) $1,620,000 $1,682,000 $1,720,000
1Gross costs are recovered through citywide assessmentsto all city departments.

101
LAW
Program Goal
The Law Department provides effectivelegal services to the Mayor and CityCouncil, city manager, departments andadvisory boards; interprets and enforcescity, state and federal laws as they pertainto city services and activities; andeffectively administers and prosecutescriminal cases filed in Phoenix MunicipalCourt using the prosecutorial function anddiscretion in a fair, impartial and efficientmanner.
Budget Allowance Explanation
The Law Department 2011-12 operatingbudget allowance of $20,042,000 is$250,000 or 1.2 percent less than 2010-11estimated expenditures. The decrease isprimarily due to the elimination of aprosecutor position from the Trial Bureauand reduced charges from the InformationTechnology Services Department.
Law Department Major Performance Measures and Service Levels
The following significant performance measures and service trends will be achieved withthe 2011-12 budget allowance:
2009-10 2010-111 2011-12
Criminal cases sent to diversion 7,035 4,300 4,300
Pre-trial disposition conferences set 62,949 59,000 59,000
New civil cases opened in the fields of condemnation, collection, taxes and civil litigation, excluding liability and other cases assigned to outside counsel 805 800 800
Number of defendants submitted for charging review 54,499 46,000 46,000
Number of civil cases closed, including those assigned to outside counsel and handled through the alternative dispute resolution process 1,067 1,000 1,000
Ordinances and resolutions for City Council adoption drafted and reviewed 1,159 1,000 1,000
Number of jury trials prosecuted 195 200 200
1Based on 10 months actual experience.
Expenditure and Position Summary
2009-10 2010-11 2011-12
Operating Expense $20,211,000 $20,292,000 $20,042,000
Total Positions 210.0 204.0 203.0
Source of Funds:
General $18,870,000 $18,505,000 $18,235,000
Court Awards 265,000 282,000 282,000
Federal and State Grants 1,013,000 1,450,000 1,471,000
Other Restricted 63,000 55,000 54,000
102
INFORMATION TECHNOLOGY
Program Goal
Information Technology Services (ITS)coordinates the use of informationtechnology across the various departmentsand agencies of city government to ensurethat accurate and timely information isprovided to residents, elected officials, citymanagement and staff in the most cost-effective manner possible. The departmentprovides operating departments withinformation processing through theapplication and coordination of computertechnology and procures, manages andmaintains the city’s radio, telephone andcomputer network systems.
Budget Allowance Explanation
The Information Technology Services 2011-12 operating budget allowance of$33,956,000 is $29,687,000 more than 2010-11 estimated expenditures. The increasereflects an organizational change in howenterprise information technology costsare being distributed to city departments.The increase is only due to the accountingdifference, as the size of the department’soperational costs and position countactually decreased due to budgetreductions and efficiency measures.
The increase is partially offset bybudget reductions including theelimination of a lead IT systems specialistthat will impact the department’s ability toreview technical solutions and standardsand the elimination of twotelecommunications specialists thatsupport the vehicle make ready process.The budget also eliminates atelecommunications operator due tochanges in the Police Department’soperating procedures that have resulted ina decreased demand for after-hoursassistance, and eliminates two IT analystprogrammer positions responsible forsupporting the web and a projectmanagement tool.
An Innovation and Efficiency TaskForce recommendation also transferredvarious printing functions from ITS to theCity Clerk Department. This resulted inthe elimination of three positions.
Information Technology Major Performance Measures and Service Levels
The following significant performance measures and service trends will be achieved with the2011-12 budget allowance:
2009-10 2010-111 2011-12
Percentage of on-time operations center services 99.0% 99.0% 99.0%
Number of ITD-supported network devices2 16,995 17,160 17,560
2009-10 2010-11 2011-12
Critical systems availability percentage:Enterprise network 99.9% 99.9% 99.9%Business systems 99.0% 99.0% 99.0%Internet services 99.0% 99.0% 99.0%Telephone network 99.9% 99.9% 99.9%Microwave network 99.9% 100.0% 100.0%
Number of visits to phoenix.gov3 16,405,001 14,900,000 15,200,000
Average cycle time of telephone service requests < 13 days < 13 days < 13 days
Average number of CityCom phone calls processed daily 84,200 84,500 84,500
Average cycle time of wireless communication repairs 0.88 hours 0.89 hours 0.89 hours
Units of portable and mobile radio equipment 19,500 19,000 19,000
1Based on 10 months actual experience.2The increase in devices is due to expanding the city's operational service and businesscontinuity at Phoenix One, the city’s new Alternate Information Technology Center and therelated equipment.
3Decreased visits to phoenix.gov in 2010-11 were because the website is leaner now (lessclicks to locate content on the site). Also, fewer people did online business with the city in2010-11.
Expenditure and Position Summary
2009-10 2010-11 2011-12
Operating Expense4 $3,296,000 $4,269,000 $33,956,000
Total Positions 202.0 191.0 182.0
Source of Funds:
General $1,736,000 $3,188,000 $32,872,000
City Improvement 1,018,000 410,000 491,000
Other Restricted 130,000 250,000 250,000
Aviation 195,000 198,000 158,000
Water 217,000 223,000 185,000
4 2009-10 and 2010-11 reflect net costs; most costs are
charged to other departments for services provided. In
2011-12, most costs will stay in ITS and be charged to
departments via Central Service Cost Allocation.
103
CITY CLERK AND ELECTIONS
Program Goal
The City Clerk Department maintainsorderly and accessible records of all cityactivities and transactions includingposting all public meeting notifications;preparing agendas and minutes for CityCouncil formal meetings; providing foreffective administration of city electionsand annexations; administering liquor,bingo and regulatory license services; andproviding printing, typesetting, documentimaging and mail delivery services to allcity departments.
Budget Allowance Explanation
The City Clerk 2011-12 operating budgetallowance of $6,293,000 is $1,640,000 or35.2 percent more than 2010-11 estimatedexpenditures. The increase is primarilydue to a change in how enterpriseinformation technology costs are beingdistributed to city departments, andfederal laws that require the realigning ofcouncil districts as a result of the 2010census. The increase is partially offset bybudget reductions that decrease fundingfor software and training to maintaincompatibility with newer versions of officesoftware.
City Clerk Major Performance Measures and Service Levels
The following significant performance measures and service trends will be achieved withthe 2011-12 budget allowance:
2009-10 2010-111 2011-12
Number of Council formal and special meeting agenda items 2,611 2,200 2,200
Open meeting law notices posted 3,201 2,900 2,900
Percent of open meeting law notices posted in accordance with state law2 100% 100% 100%
Total printing and copy impressions (millions) 32.8 30.5 31.5
City Council regular and special elections held 2 0 1
License services applications and contacts3 N/A 21,700 21,700
Records imaged and available for public access on-line 122,759 135,000 135,000
1Based on 10 months actual experience.2Includes meeting notices and meeting result postings as required by state law.3This is a new performance measure; therefore, no historical data is available.
Expenditure and Position Summary
2009-10 2010-11 2011-12
Operating Expense $4,983,000 $4,653,000 $6,293,000
Total Positions 72.0 67.0 66.0
Source of Funds:
General $4,818,000 $4,622,000 $6,268,000
City Improvement $164,000 $27,000 21,000
Other Restricted 1,000 4,000 4,000

104
FINANCE
Program Goal
The Finance Department strives tomaintain a fiscally sound governmentalorganization that conforms to legalrequirements and generally acceptedfinancial management principles;maintains effective procurementprocedures for commodities and services;provides for effective treasurymanagement and a citywide riskmanagement program; acquires, managesand disposes of property for publicfacilities; provides an effective debtmanagement program; and providesfinancial advisory services for all citydepartments.
Budget Allowance Explanation
The 2011-12 Finance Departmentoperating budget allowance of $19,844,000is $1,753,000 or 8.1 percent less than 2010-11 estimated expenditures. This isprimarily due to changes in how enterpriseinformation technology costs are beingdistributed to city departments. Inaddition, charges to the Water ServicesDepartment were added for cashieringservices due to consolidation of theseservices to one location.
Finance Major Performance Measures and Service Levels
The following significant performance measures and service trends will be achieved with the2011-12 budget allowance:
2009-10 2010-111 2011-12
Sales tax and franchise fees collected (millions) $627 $673 $673
Average real estate acquisition cycle time (months) 14.8 16.0 17.0
Average property damage claims cycle time (days) 40 40 40
Average invitation for bid (IFB) cycle time (days) 101 100 100
1Based on 10 months actual experience.
Expenditure and Position Summary
2009-10 2010-11 2011-12
Operating Expense $21,582,000 $21,597,000 $19,844,000
Total Positions 266.8 249.2 248.2
Source of Funds:
Aviation 148,000 192,000 270,000
City Improvement 59,000 11,000 9,000
General $19,223,000 $19,150,000 $17,160,000
Other Restricted 315,000 361,000 374,000
Public Housing 2,000 1,000 13,000
Sports Facilities 109,000 129,000 129,000
Wastewater 767,000 759,000 759,000
Water 959,000 994,000 1,130,000
105
BUDGET AND RESEARCH
Program Goal
The Budget and Research Departmentensures effective, efficient allocation ofcity resources to enable the City Council,city manager and city departments toprovide quality services to our residents.
Budget Allowance Explanation
The Budget and Research Department’s2011-12 operating budget allowance of$3,191,000 is $14,000 or 0.4 percent morethan 2010-11 estimated expenditures andreflects normal inflationary increases.
Budget and Research Major Performance Measures and Service Levels
The following significant performance measures and service trends will be achieved withthe 2011-12 budget allowance:
2009-10 2010-111 2011-12
Percent variance of actual versus estimated expenditures for each major fund (data for the General Fund is shown) (-2.5)% 0% -± .5% 0% -± 1%
Percent variance of actual versus estimated revenues for each major fund (data for the General Fund is shown) (-3.2)% 0% -± .5% 0% -± 1%
Percent of Requests for Council Action processed within 24 hours 82% 75% 75%
Capital Improvement Program expenditures as a percentage of estimate 49% 70% 65%
1Based on 10 months actual experience.
Expenditure and Position Summary
2009-10 2010-11 2011-12
Operating Expense $2,827,000 $3,177,000 $3,191,000
Total Positions 27.0 26.0 26.0
Source of Funds:
General $2,827,000 $3,177,000 $3,191,000

106
The Police Department and the community have worked together to make
Phoenix one of the safest major cities in the U.S.
POLICE
Program Goal
The Police Department provides thecommunity with a law enforcement systemthat integrates and uses all departmental,civic and community resources for policeservices and protection of the lives andproperty of our residents.
Budget Allowance Explanation
The Police Department 2011-12 operatingbudget allowance of $548,323,000 is$14,224,000 or 2.7 percent more than 2010-11 estimated expenditures. Thisincrease is primarily due to normalinflationary adjustments, increased Court
Public Safety
107
The Public Safety ProgramRepresents 32.5% of the Total Budget.
The Public Safety program budget includesthe Police Department, Fire Departmentand Emergency Management.
Police Major Performance Measures and Service TrendsThe following significant performance measures and service trends will be achieved withthe 2011-12 budget allowance:
2009-10 2010-111 2011-12
Average Response Time (Minutes)2
Priority 1 – Emergency 5.1 5.0 5.0Priority 2 – Non-Emergency 18.0 17.2 17.2Priority 3 – All Others 41.7 39.8 39.8Telephone Callbacks3 113.0 115.4 115.4
Percentage of phone calls to 9-1-1 and Crime Stop answered within 10 seconds4 94% 90% 90%
Cases accepted by the county attorney for issuance of complaint 28,612 26,400 26,400
Moving violation citations issued 256,392 234,800 234,800
Traffic accidents 22,418 23,000 23,000
Percentage of cases cleared:Murder 88% 68% 68%Rape 25% 21% 21%Robbery 24% 21% 21%Aggravated Assault 46% 44% 44%Burglary 5% 5% 5%Theft 22% 20% 20%Auto Theft 7% 6% 6%Arson 12% 15% 15%
1Based on 10 months actual experience.2Due to changes with the new Computer Aided Dispatch (CAD) system implementedMarch 2010, call response time data has demonstrated inconsistencies that are currentlybeing resolved.
3The number of calls and response times for incidents handled by callback are impacted bythe working hours and vacancy levels of this unit.
4Police Communications staff was increased in FY 2009-10 in preparation for the opening oftwo new precincts in early FY 2010-11. Changes in the percent of calls answered within 10seconds may be affected by: new employee training, the transition from one communicationsfacility to two, an anticipated learning curve as the department converted to the new CADsystem in March 2010, and the reassignment of staff to operate new precinct duties.

Awards funding and increased vehiclereplacement costs that are partially offsetby a reduction in grant funds and GeneralFund budget reductions totaling $1.1million.
The General Fund budget reductionsinclude the elimination of two vacantsworn management positions and 16 FTEof civilian support. The savings for thetransition of the callback unit to aprimarily Internet-based service are forless than a full year in 2011-12 to allow aphased implementation. The budget alsoreflects the elimination of the Office of thePublic Safety Manager and the publicsafety manager position.
108
Fiscal Year
2010-11*2008-09
8
6
4
2
0
Police — Violent Crimes per 1,000 Residents
2007-08
5.9
2009-10
*Estimated
5.55.7
2011-12*
5.76.6
Expenditure and Position Summary
2009-10 2010-11 2011-12
Operating Expense $546,307,000 $534,099,000 $548,323,000
Total Positions 4,827.7 4,496.7 4,477.7
Source of Funds:
General $435,585,000 $418,377,000 $428,454,000
Public Safety Expansion 43,889,000 48,450,000 48,830,000
Neighborhood Protection 21,901,000 21,334,000 20,958,000
Public Safety Enhancement 20,410,000 18,826,000 19,364,000
Federal and State Grants 8,766,000 14,360,000 10,242,000
Court Awards 4,241,000 4,417,000 6,509,000
Other Restricted 4,479,000 4,371,000 4,582,000
City Improvement 5,216,000 2,174,000 2,951,000
Sports Facilities 1,053,000 1,106,000 1,106,000
Convention Center 767,000 684,000 684,000
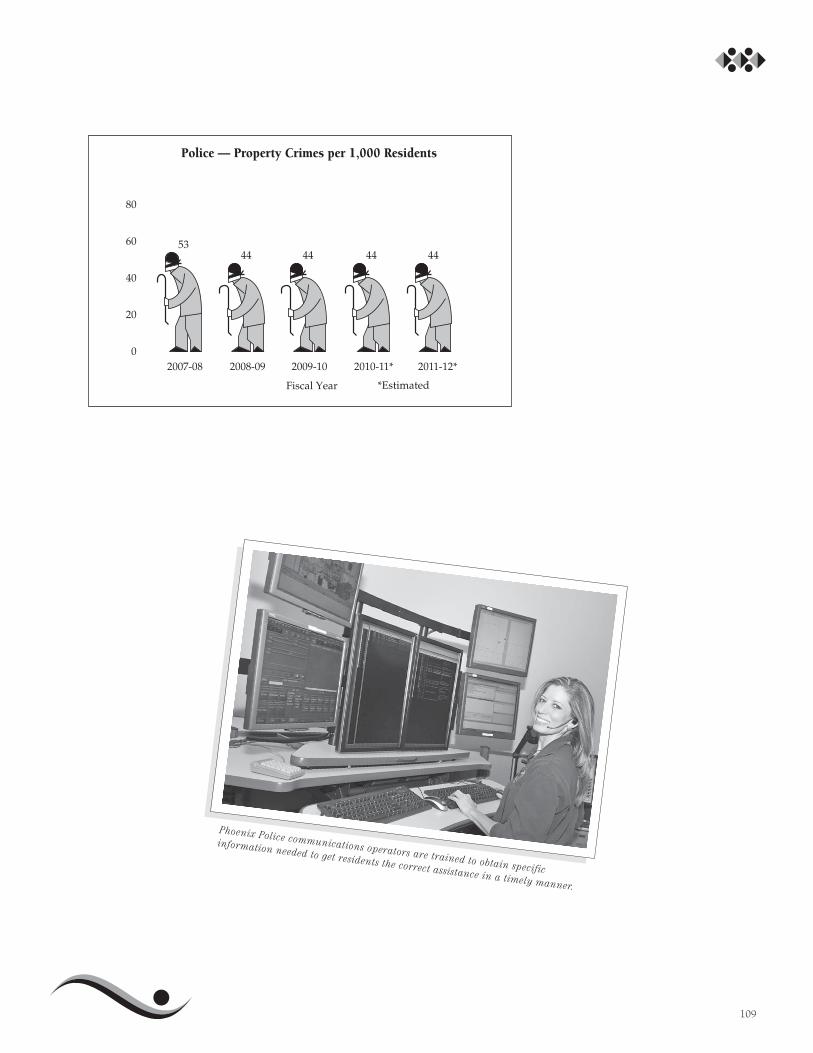
109
Fiscal Year
80
60
40
20
0
Police — Property Crimes per 1,000 Residents
2007-08
53
2008-09
44 44 44 44
2009-10
*Estimated
2010-11* 2011-12*
Phoenix Police communications operators are trained to obtain specific
information needed to get residents the correct assistance in a timely manner.
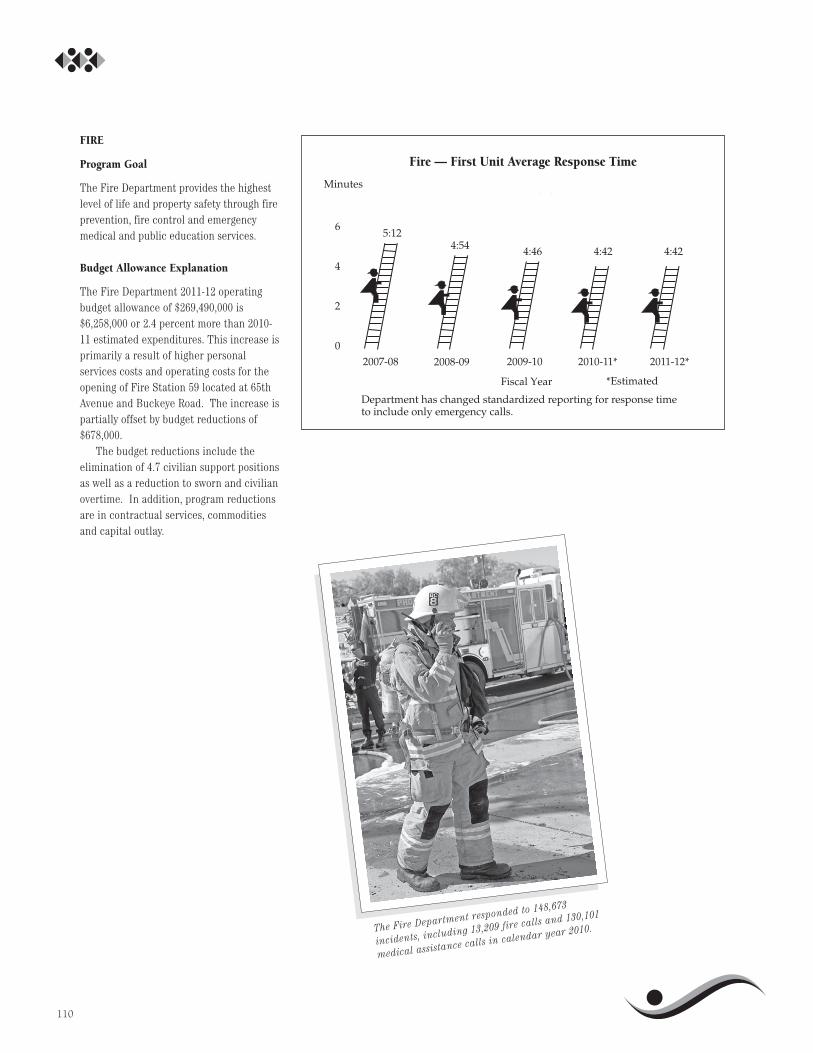
FIRE
Program Goal
The Fire Department provides the highestlevel of life and property safety through fireprevention, fire control and emergencymedical and public education services.
Budget Allowance Explanation
The Fire Department 2011-12 operatingbudget allowance of $269,490,000 is$6,258,000 or 2.4 percent more than 2010-11 estimated expenditures. This increase isprimarily a result of higher personalservices costs and operating costs for theopening of Fire Station 59 located at 65thAvenue and Buckeye Road. The increase ispartially offset by budget reductions of$678,000.
The budget reductions include theelimination of 4.7 civilian support positionsas well as a reduction to sworn and civilianovertime. In addition, program reductionsare in contractual services, commoditiesand capital outlay.
110
The Fire Department responded to 148,673
incidents, including 13,209 fire calls and 130,101
medical assistance calls in calendar year 2010.
Minutes
Fiscal Year
Department has changed standardized reporting for response time to include only emergency calls.
6
4
2
02008-09
Fire — First Unit Average Response Time
2007-08
5:124:54 4:46 4:42 4:42
2010-11*
*Estimated
2011-12*2009-10

111
Fire Department Major Performance Measures and Service Levels
The following significant performance measures and service trends will be achieved withthe 2011-12 budget allowance:
2009-10 2010-111 2011-12
Percent of fire and emergency medical call responses within four minutes 35.5% 36.0% 36.5%
Patient transports to Valley hospitals via emergency medical vehicles 62,886 63,500 64,000
Percentage of time Advanced Life Support (ALS) medical calls are responded to with paramedic units within five minutes 59.4% 60.0% 60.0%
Number of fire investigations to determine cause only 725 760 800
Number of calls by type:Emergency Medical 126,968 127,000 128,000Fire 13,359 13,000 13,000Other (mountain/swift water/trench/tree rescues/other) 5,277 5,000 5,000
1Based on 10 months actual experience.
Fiscal Year *Estimated
40%
30%
20%
10%
0%
Fire — Percentage of Time First Unit Arrives on Scene in Four Minutes or Less
2007-08
27.7
2008-09
33.0
2009-10
35.5
2010-11*
36.0
2011-12*
36.5
Expenditure and Position Summary
2009-10 2010-11 2011-12
Operating Expense $269,117,000 $263,232,000 $269,490,000
Total Positions 2,066.2 2,008.2 2,003.5
Source of Funds:
General $222,091,000 $220,950,000 $226,892,000
Public SafetyEnhancement 11,246,000 10,897,000 11,242,000
NeighborhoodProtection 8,441,000 6,918,000 7,314,000
Public SafetyExpansion 11,946,000 13,246,000 13,968,000
Development Services 1,876,000 1,335,000 1,064,000
Federal andState Grants 5,918,000 4,448,000 2,788,000
Other Restricted 4,116,000 4,768,000 4,828,000
City Improvement 3,483,000 670,000 1,394,000

EMERGENCY MANAGEMENT
Program Goal
The Emergency Management Programprovides the city with the capability toplan for, mitigate, respond to and recoverfrom large-scale community emergenciesand disasters as a result of human-caused,technological or natural hazards.
Budget Allowance Explanation
The Emergency Management 2011-12operating budget allowance of $481,000 is$44,000 or 8.4 percent less than 2010-11estimated expenditures. The decreasereflects the elimination of a softwareupgrade at the Emergency OperationsCenter and the elimination of theemergency management coordinatorposition through the organizational reviewprocess.
112
Expenditure and Position Summary
2009-10 2010-11 2011-12
Operating Expense $618,000 $525,000 $481,000
Total Positions 6.0 5.0 5.0
Source of Funds:
General $81,000 $71,000 $30,000
Public SafetyEnhancement 454,000 454,000 451,000
Federal & StateGrants 83,000 — —
The Emergency Operations Center is opened when necessary to manage the
distribution of city services and resources to respond to and recover from an
emergency event of significant impact to the city.

113

114
The Phoenix Municipal Court is a recognized judicial leader throughout Arizona
and the U.S. for its innovative and progressive work in the areas of technology,
customer service, case management, fiscal responsibility, and judicial and staff
accountability.
MUNICIPAL COURT
Program Goal
The Municipal Court provides, withintegrity, to all individuals who comebefore this court: equal access,professional and impartial treatment, andjust resolution of all court matters.
Budget Allowance Explanation
The Municipal Court’s 2011-12 operatingbudget allowance of $40,847,000 is$1,080,000 or 2.7 percent less than 2010-11estimated expenditures. The decreasereflects ongoing employee concessions, theelimination of one administrative assistantII from the Management Services Division,reduced funding for contractedinterpreters due to decreased demand, andreduced funding for printed forms.
Criminal Justice
115
The Criminal Justice Program Represents 2.4% of the Total Budget.
The Criminal Justice program budgetincludes the Municipal Court, PublicDefender and City Prosecutor.
Municipal Court Major Performance Measures and Service Levels
The following significant performance measures and service trends will be achieved with the2011-12 budget allowance:
2009-10 2010-111 2011-12
Criminal filings 105,915 95,000 97,500
Civil filings 248,000 225,000 230,000
Average number of days from arraignment to hearing for minor traffic cases 35.0 35.0 35.0
Number of criminal cases with a pending trial date at year end 3,347 3,000 3,400
Percent of trials/hearings appealed 1.75% 2.1% 2.1%
Average cycle time for sending out restitution and bail refund checks 1.4 days 2.0 days 2.5 days
Average hold time for incoming information calls to the Customer Call Center 5 minutes 5.0 minutes 5.0 minutes
1Based on 10 months actual experience.

116
Fiscal Year *Estimated
2007-08
100%
60%
40%
20%
0
80%
Municipal Court - Percent of criminal casesresolved within 180 days from case filing
2008-09
97.1% 97.0%
2009-10
96.9% 96.9% 96.9%
2010-11* 2011-12*
Expenditure and Position Summary
2009-10 2010-11 2011-12
Operating Expense $38,096,000 $39,767,000 $40,847,000
Total Positions 318.4 315.4 314.4
Source of Funds:
General $30,492,000 $29,589,000 $30,954,000
Other Restricted 1,995,000 6,783,000 6,568,000
City Improvement 5,539,000 3,395,000 3,325,000
Federal and State Grants 70,000 — —
Phoenix Municipal Court handles cases that range from minor traffic violations
to Class 1 misdemeanors. Annually, the court processes an average of 350,000
cases including 80,000 criminal charges.
PUBLIC DEFENDER
Program Goal
The Public Defender Program provideslegal representation for indigentdefendants in Phoenix Municipal Court.
Budget Allowance Explanation
The Public Defender Program’s 2011-12operating budget allowance of $4,708,000is $49,000 or 1.1 percent more than the2010-11 estimated expenditures. This is aresult of normal inflationary increases thatare partially offset by reductions forcontracted court-appointed attorneycompensation.
117
Expenditure and Position Summary
2009-10 2010-11 2011-12
Operating Expense $4,536,000 $4,659,000 $4,708,000
Total Positions 9.0 9.0 9.0
Source of Funds:
General $4,536,000 $4,659,000 $4,708,000
Public Defender Major Performance Measures and Service Levels
The following significant performance measures and service trends will be achieved with the2011-12 budget allowance:
2009-10 2010-111 2011-12
Defendants charged with misdemeanor crimes represented in Phoenix Municipal Court 15,379 16,000 14,000
Defendants represented at Jail Court (first appearance after arrest), and K-Court (second appearance after arrest for those not bonding out after their first appearance) 33,122 26,000 26,000
1Based on 10 months actual experience.

118
METRO light rail carried nearly 24 million riders over its first two years of
operation.
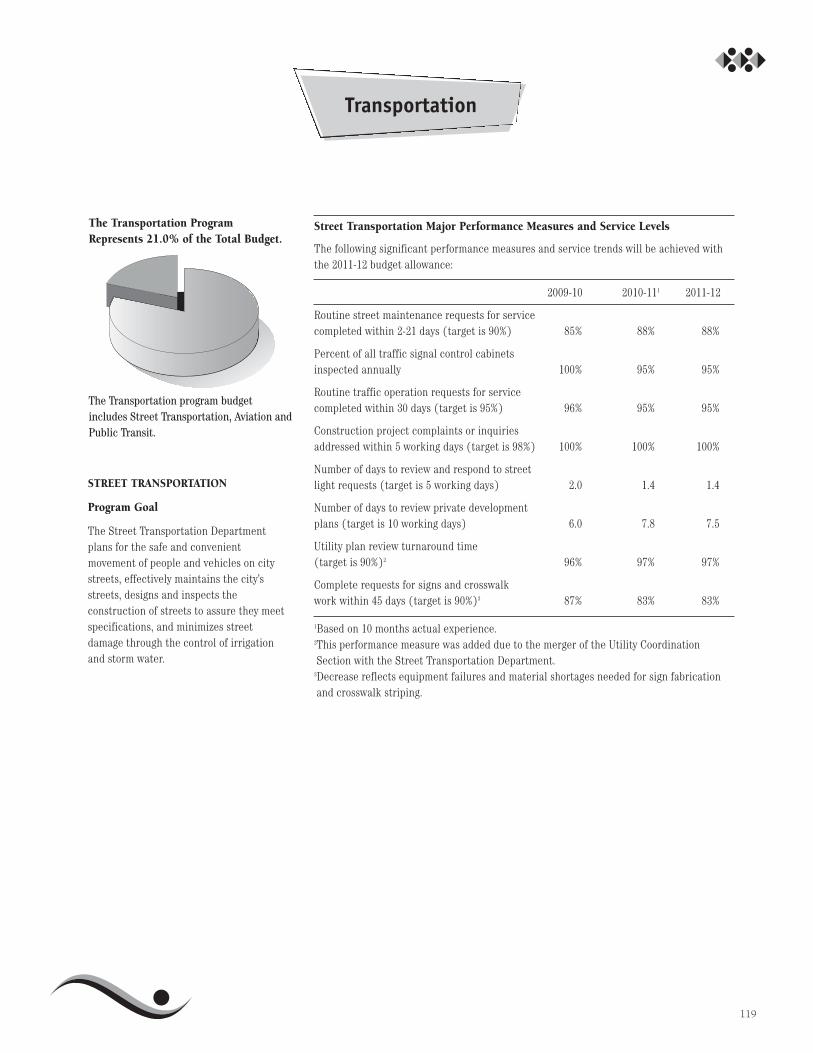
STREET TRANSPORTATION
Program Goal
The Street Transportation Departmentplans for the safe and convenientmovement of people and vehicles on citystreets, effectively maintains the city’sstreets, designs and inspects theconstruction of streets to assure they meetspecifications, and minimizes streetdamage through the control of irrigationand storm water.
Transportation
119
Street Transportation Major Performance Measures and Service Levels
The following significant performance measures and service trends will be achieved withthe 2011-12 budget allowance:
2009-10 2010-111 2011-12
Routine street maintenance requests for service completed within 2-21 days (target is 90%) 85% 88% 88%
Percent of all traffic signal control cabinets inspected annually 100% 95% 95%
Routine traffic operation requests for service completed within 30 days (target is 95%) 96% 95% 95%
Construction project complaints or inquiries addressed within 5 working days (target is 98%) 100% 100% 100%
Number of days to review and respond to street light requests (target is 5 working days) 2.0 1.4 1.4
Number of days to review private development plans (target is 10 working days) 6.0 7.8 7.5
Utility plan review turnaround time (target is 90%)2 96% 97% 97%
Complete requests for signs and crosswalk work within 45 days (target is 90%)3 87% 83% 83%
1Based on 10 months actual experience.2This performance measure was added due to the merger of the Utility CoordinationSection with the Street Transportation Department.
3Decrease reflects equipment failures and material shortages needed for sign fabricationand crosswalk striping.
The Transportation ProgramRepresents 21.0% of the Total Budget.
The Transportation program budgetincludes Street Transportation, Aviation andPublic Transit.

Budget Allowance Explanation
The Street Transportation 2011-12operating budget allowance of $70,408,000is $3,662,000 or 5.5 percent more than2010-11 estimated expenditures. Thisincrease is primarily due to transitioningthe purchase of replacement vehicles fromfinancing to all cash and the carry forwardof funding for the storm water databaseconversion. The increase is also due toadditional contractual costs for landscapeand streetlight maintenance, and utilitycosts for completed streetscape projectsfrom the 2006 Bond Program. The 2011-12budget will be adjusted for expectedreductions of nearly $12 million, primarilyto the Capital Improvement Programbudget, due to state reductions to ArizonaHighway User Revenue.
120
Fiscal Year
2009-10
Street Transportation –Maintenance Rapid Response
% within24 Hours
100%
80%
60%
40%
20%
0%
97.8%
2010-11*
97.2%
2011-12*
97.0%96.9%
(Responding to urgent issues such as obstructions in the roadway)
In 2008, the city completed an extensive review of every department’s performancemeasures. Many new measures were created to better assess the efficiency andeffectiveness of services being provided. Historical data is not available for thisnew measure.
2007-08 2008-09
*Estimated
Expenditure and Position Summary
2009-10 2010-11 2011-12
Operating Expense $63,352,000 $66,746,000 $70,408,000
Total Positions 719.0 667.0 667.0
Source of Funds:
General $20,984,000 $21,579,000 $22,527,000
Arizona HighwayUser Revenue 41,798,000 43,474,000 44,528,000
City Improvement 403,000 67,000 140,000
Capital Construction 129,000 130,000 135,000
Federal and State Grants 31,000 25,000 23,000
Other Restricted 7,000 1,471,000 3,055,000
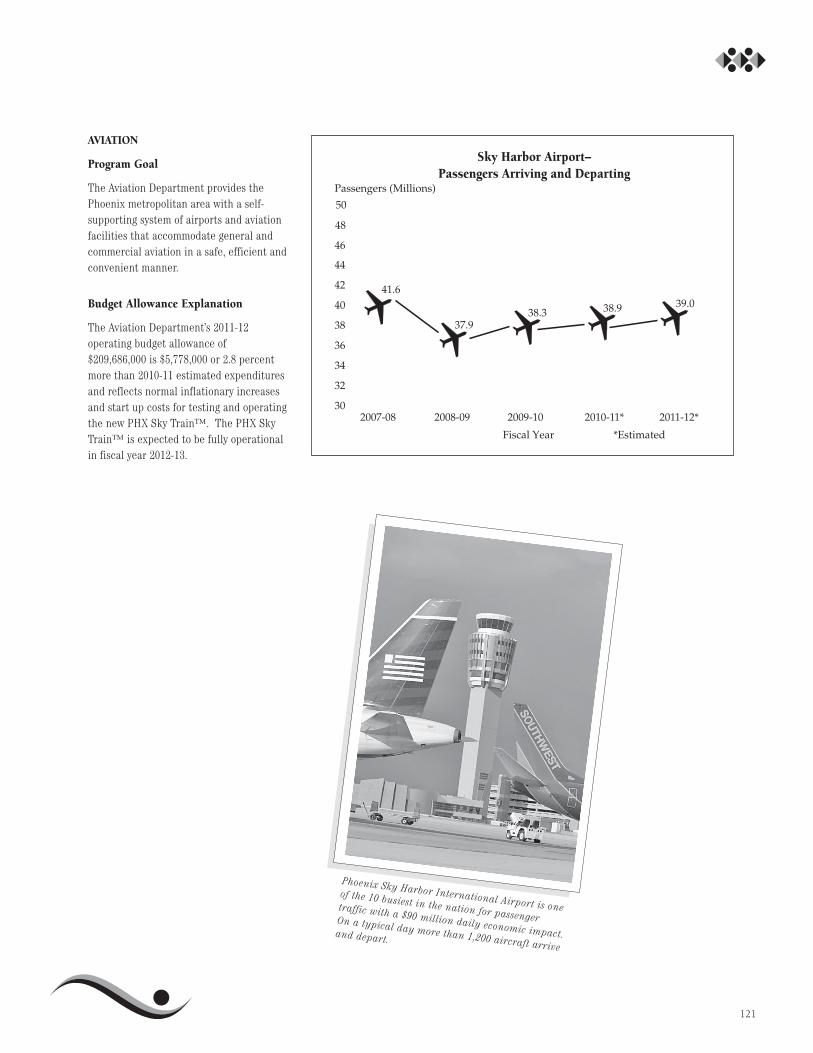
AVIATION
Program Goal
The Aviation Department provides thePhoenix metropolitan area with a self-supporting system of airports and aviationfacilities that accommodate general andcommercial aviation in a safe, efficient andconvenient manner.
Budget Allowance Explanation
The Aviation Department’s 2011-12operating budget allowance of$209,686,000 is $5,778,000 or 2.8 percentmore than 2010-11 estimated expendituresand reflects normal inflationary increasesand start up costs for testing and operatingthe new PHX Sky Train™. The PHX SkyTrain™ is expected to be fully operationalin fiscal year 2012-13.
121
Passengers (Millions)
Fiscal Year *Estimated
2008-09 2009-10 2010-11* 2011-12*30
32
34
38
41.6
36
40
42
44
2007-08
46
Sky Harbor Airport–Passengers Arriving and Departing
37.938.3 38.9
48
50
39.0
Phoenix Sky Harbor International Airport is oneof the 10 busiest in the nation for passengertraffic with a $90 million daily economic impact.On a typical day more than 1,200 aircraft arriveand depart.
The budget also reflects the addition ofeleven support positions needed totransfer various contracted services to citystaff. Transitioning these contracts to citystaff is expected to save the AviationDepartment an estimated $385,000.
122
Expenditure and Position Summary
2009-10 2010-11 2011-12
Operating Expense $194,786,000 $203,908,000 $209,686,000
Total Positions 850.7 841.0 852.0
Source of Funds:
Aviation $194,786,000 $203,908,000 $209,686,000
Aviation Major Performance Measures and Service Levels
The following significant performance measures and service trends will be achieved withthe 2011-12 budget allowance:
2009-10 2010-111 2011-12
Airline rental rates (cost per square foot):Terminal 2 $69.60 $76.08 NA2
Terminal 3 $76.56 $79.32 NA2
Terminal 4 $85.20 $89.88 NA2
Gross sales per departing passenger:Terminal 2 $7.63 $7.84 $8.00Terminal 3 $8.76 $9.00 $9.18Terminal 4 $8.97 $9.07 $9.25
Aircraft takeoffs and landings 1,038,335 1,025,000 1,025,000
Total international passengers 2,004,012 2,010,000 2,050,000
Air cargo processed (in tons) 260,830 268,000 270,000
1Based on 10 months actual experience. 2Airline rental rates for 2011-12 have not yet been finalized.

PUBLIC TRANSIT
Program Goal
The Public Transit Department providesimproved public transit services andincreased ridership in the Phoenixurbanized area through the operation of acoordinated regional fixed-route andparatransit bus transportation system.
Budget Allowance Explanation
The Public Transit 2011-12 operatingbudget allowance of $247,576,000 is$9,090,000 or 3.8 percent more than 2010-11 estimated expenditures. This increase isprimarily due to increases in the price offuel, a scheduled increase in debt servicepayments for light rail bonds and normalinflationary increases. Additionally,funding was added for a taxi-subsidyprogram, funded by Transit 2000 sales taxrevenue, to help address the need forsame-day transportation of Phoenixresidents under the age of 65 who arecertified for paratransit service under theAmericans with Disabilities Act (ADA).The department has also applied for agrant that would add Federal TransitAdministration funding for that service.
123
Fiscal Year *Estimated
2010-11*2009-10
Transit–Annual Bus Ridership
(Boardings)Millions
60
40
20
0
2007-08
37
2011-12*
38
46 48
39
2008-09
Annual ridership decreased from 2008-09 levels as a result of patron substitutions. (Light rail ridership in lieu of bus ridership.)
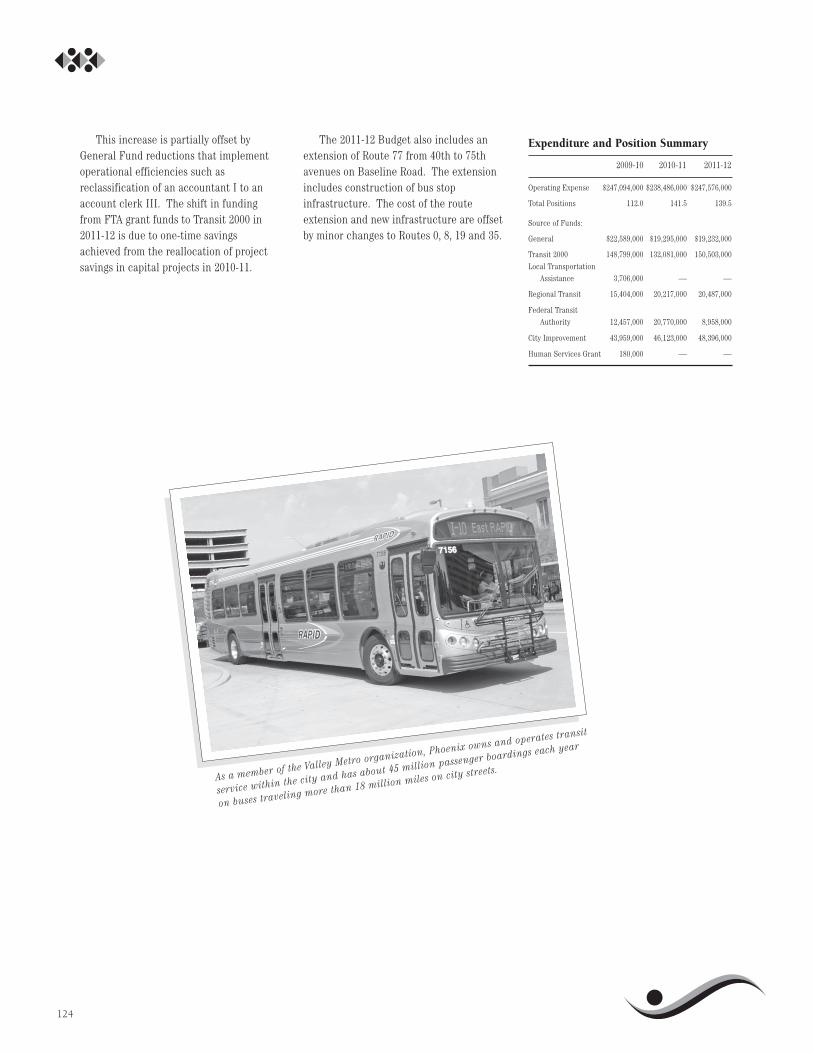
This increase is partially offset byGeneral Fund reductions that implementoperational efficiencies such asreclassification of an accountant I to anaccount clerk III. The shift in fundingfrom FTA grant funds to Transit 2000 in2011-12 is due to one-time savingsachieved from the reallocation of projectsavings in capital projects in 2010-11.
The 2011-12 Budget also includes anextension of Route 77 from 40th to 75thavenues on Baseline Road. The extensionincludes construction of bus stopinfrastructure. The cost of the routeextension and new infrastructure are offsetby minor changes to Routes 0, 8, 19 and 35.
124
Expenditure and Position Summary
2009-10 2010-11 2011-12
Operating Expense $247,094,000 $238,486,000 $247,576,000
Total Positions 112.0 141.5 139.5
Source of Funds:
General $22,589,000 $19,295,000 $19,232,000
Transit 2000 148,799,000 132,081,000 150,503,000
Local Transportation
Assistance 3,706,000 — —
Regional Transit 15,404,000 20,217,000 20,487,000
Federal Transit
Authority 12,457,000 20,770,000 8,958,000
City Improvement 43,959,000 46,123,000 48,396,000
Human Services Grant 180,000 — —
As a member of the Valley Metro organization, Phoenix owns and operates transit
service within the city and has about 45 million passenger boardings each year
on buses traveling more than 18 million miles on city streets.

125
Public Transit Major Performance Measures and Service Levels
The following significant performance measures and service trends will be achieved withthe 2011-12 budget allowance:
2009-10 2010-111 2011-12
On-time performance for bus service 94.6% 94.2% 94.2%
On-time performance for Dial-a-Ride prescheduled service 96.5% 95.0% 95.0%
Cost recovery from bus fares 23.3% 24.0% 24.2%
Bus boardings per revenue mile 2.05 2.21 2.24
Average weekday ridership - light rail (Phoenix only 2 23,923 27,720 28,274
Number of Reserve-A-Ride Trips3 160,786 123,749 125,234
1Based on 10 months actual experience.2The 2009-10 figure represents Jan. 1, 2010-June 30, 2010 ridership.3Reduction in trips in 2010-11 is due to elimination of demand service.

126
Downtown Phoenix is the heart of the Phoenix metropolitan area. In addition
to the 83,000 workers who make downtown their daytime home, more than
10 million people visit the areas many cultural, sport and entertainment
venues each year.
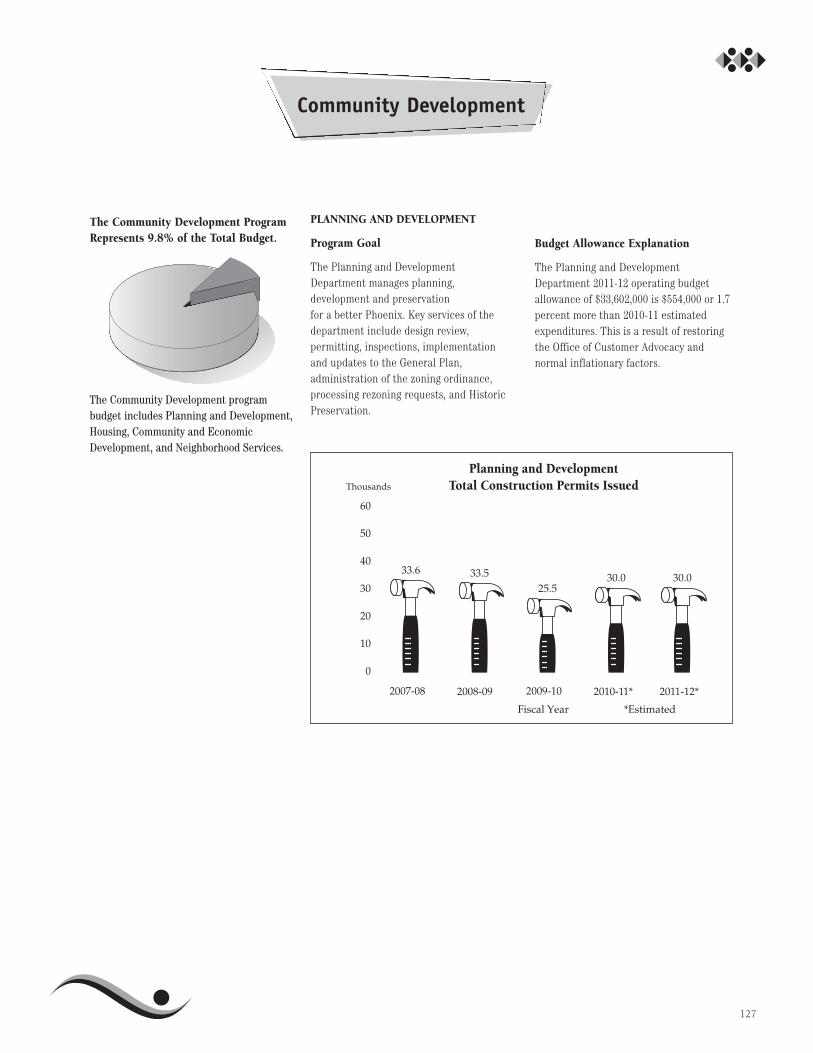
PLANNING AND DEVELOPMENT
Program Goal
The Planning and DevelopmentDepartment manages planning,development and preservation for a better Phoenix. Key services of thedepartment include design review, permitting, inspections, implementationand updates to the General Plan,administration of the zoning ordinance,processing rezoning requests, and HistoricPreservation.
Budget Allowance Explanation
The Planning and DevelopmentDepartment 2011-12 operating budgetallowance of $33,602,000 is $554,000 or 1.7percent more than 2010-11 estimatedexpenditures. This is a result of restoringthe Office of Customer Advocacy andnormal inflationary factors.
Community Development
127
The Community Development ProgramRepresents 9.8% of the Total Budget.
The Community Development programbudget includes Planning and Development,Housing, Community and EconomicDevelopment, and Neighborhood Services.
Fiscal Year *Estimated
2009-102007-08
Planning and DevelopmentTotal Construction Permits IssuedThousands
60
50
40
30
20
10
0
2008-09
33.6 33.5
2010-11*
30.0
2011-12*
30.025.5
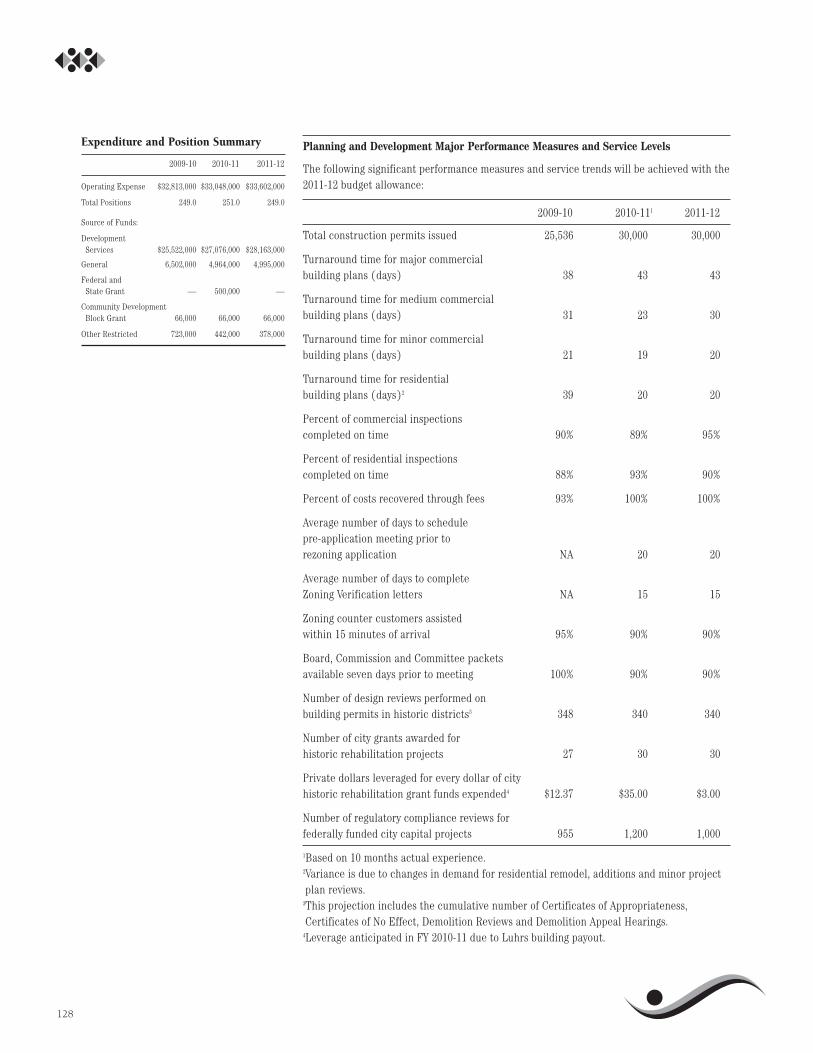
128
Planning and Development Major Performance Measures and Service Levels
The following significant performance measures and service trends will be achieved with the2011-12 budget allowance:
2009-10 2010-111 2011-12
Total construction permits issued 25,536 30,000 30,000
Turnaround time for major commercial building plans (days) 38 43 43
Turnaround time for medium commercial building plans (days) 31 23 30
Turnaround time for minor commercial building plans (days) 21 19 20
Turnaround time for residential building plans (days)2 39 20 20
Percent of commercial inspections completed on time 90% 89% 95%
Percent of residential inspections completed on time 88% 93% 90%
Percent of costs recovered through fees 93% 100% 100%
Average number of days to schedule pre-application meeting prior to rezoning application NA 20 20
Average number of days to complete Zoning Verification letters NA 15 15
Zoning counter customers assisted within 15 minutes of arrival 95% 90% 90%
Board, Commission and Committee packets available seven days prior to meeting 100% 90% 90%
Number of design reviews performed on building permits in historic districts3 348 340 340
Number of city grants awarded for historic rehabilitation projects 27 30 30
Private dollars leveraged for every dollar of city historic rehabilitation grant funds expended4 $12.37 $35.00 $3.00
Number of regulatory compliance reviews for federally funded city capital projects 955 1,200 1,000
1Based on 10 months actual experience.2Variance is due to changes in demand for residential remodel, additions and minor projectplan reviews.
3This projection includes the cumulative number of Certificates of Appropriateness,Certificates of No Effect, Demolition Reviews and Demolition Appeal Hearings.
4Leverage anticipated in FY 2010-11 due to Luhrs building payout.
Expenditure and Position Summary
2009-10 2010-11 2011-12
Operating Expense $32,813,000 $33,048,000 $33,602,000
Total Positions 249.0 251.0 249.0
Source of Funds:
Development Services $25,522,000 $27,076,000 $28,163,000
General 6,502,000 4,964,000 4,995,000
Federal and State Grant — 500,000 —
Community Development Block Grant 66,000 66,000 66,000
Other Restricted 723,000 442,000 378,000

129
HOUSING
Program Goal
The Housing Department provides andpromotes diversified living environmentsfor low-income families, seniors andpersons with disabilities through theoperation and leasing of assisted andaffordable housing.
Budget Allowance Explanation
The Housing Department’s 2011-12operating budget allowance of $75,136,000 is $2,128,000 or 2.8 percent less than 2010-11 estimated expenditures. Thedecrease is due to reduced NeighborhoodStabilization Program (NSP) funding andreduced HOPE VI grant funding as thecompletion of the Krohn West projectnears. Also reflected in the budget is thetransfer of a partially general fundedmanagement services administrator toalternative funding sources.
Housing Major Performance Measures and Service Levels
The following significant performance measures and service trends will be achieved withthe 2011-12 budget allowance:
2009-10 2010-111 2011-12
Affordable housing units for families and individuals 1,444 2,174 2,174
Rental assistance provided for low-income residents in the private housing market 5,758 5,883 6,008
City-owned and operated public housing units for families and seniors 2,476 2,336 2,261
Percent of Section 8 vouchers under lease 91% 94% 95%
Occupancy rate for public housing units 98% 98% 98%
1Based on 10 months actual experience.
Expenditure and Position Summary
2009-10 2010-11 2011-12
Operating Expense $73,670,000 $77,264,000 $75,136,000
Total Positions 187.2 192.2 191.2
Source of Funds:
Public Housing $66,484,000 $70,007,000 $70,824,000
Community Development Block Grant 2,853,000 2,128,000 1,663,000
Other Restricted 1,710,000 1,688,000 1,466,000
Federal and State Grants 1,995,000 2,008,000 902,000
HOPE VI 344,000 1,246,000 152,000
City Improvement 74,000 73,000 72,000
General 210,000 114,000 57,000

COMMUNITY AND ECONOMIC DEVELOPMENT
Program Goal
The Community and EconomicDevelopment Department creates orfacilitates development activities that addor retain jobs, enhances city revenues andenhances the quality of life includingbusiness development in Sky HarborCenter, downtown redevelopment area andother non-redevelopment areas.
Budget Allowance Explanation
The Community and EconomicDevelopment Department’s 2011-12operating budget allowance of $26,859,000is $3,444,000 or 11.4 percent less than2010-11 estimated expenditures and isprimarily the result of expiring AmericanRecovery and Reinvestment Act (ARRA)funds. Also reflected is the reclassificationof a vacant assistant director position to adeputy director position.
130
Community and Economic Development Major Performance Measures and Service Levels
The following significant performance measures and service trends will be achieved with the2011-12 budget allowance:
2009-10 2010-111 2011-12
Projected jobs created/retained within the city of Phoenix as a result of department efforts 5,000 4,085 4,500
Projected average annual salary for new jobs with companies newly located in Phoenix $42,000 $42,000 $41,000
Individuals serviced in employment and training programs2
Adult 350 1,033 1,725Youth 1,600 940 1,400
1Based on 10 months actual experience.2Adult and youth totals increased significantly in FY 2009-10 and the latter part of 2010 as aresult of additional funding received from the American Recovery and Reinvestment Act(ARRA) that ended Dec. 31, 2010 for adult programs and Sept. 30, 2010 for youth programs.A decrease is projected for 2011-12 due to losses in ARRA funding of $7.9 million.
Expenditure and Position Summary
2009-10 2010-11 2011-12
Operating Expense $25,899,000 $30,303,000 $26,834,000
Total Positions 102.0 105.0 105.0
Source of Funds:
General 4,944,000 4,506,000 4,886,000
Aviation 11,000 69,000 69,000
City Improvement 2,529,000 1,336,000 2,697,000
Community Reinvestment 217,000 312,000 333,000
Convention Center 516,000 463,000 453,000
Other Restricted 2,380,000 5,487,000 3,173,000
Sports Facilities 133,000 133,000 135,000
Wastewater — — —
Water 575,000 553,000 567,000
Federal and State Grants 13,684,000 16,599,000 14,069,000
Community Development Block Grant 910,000 845,000 477,000
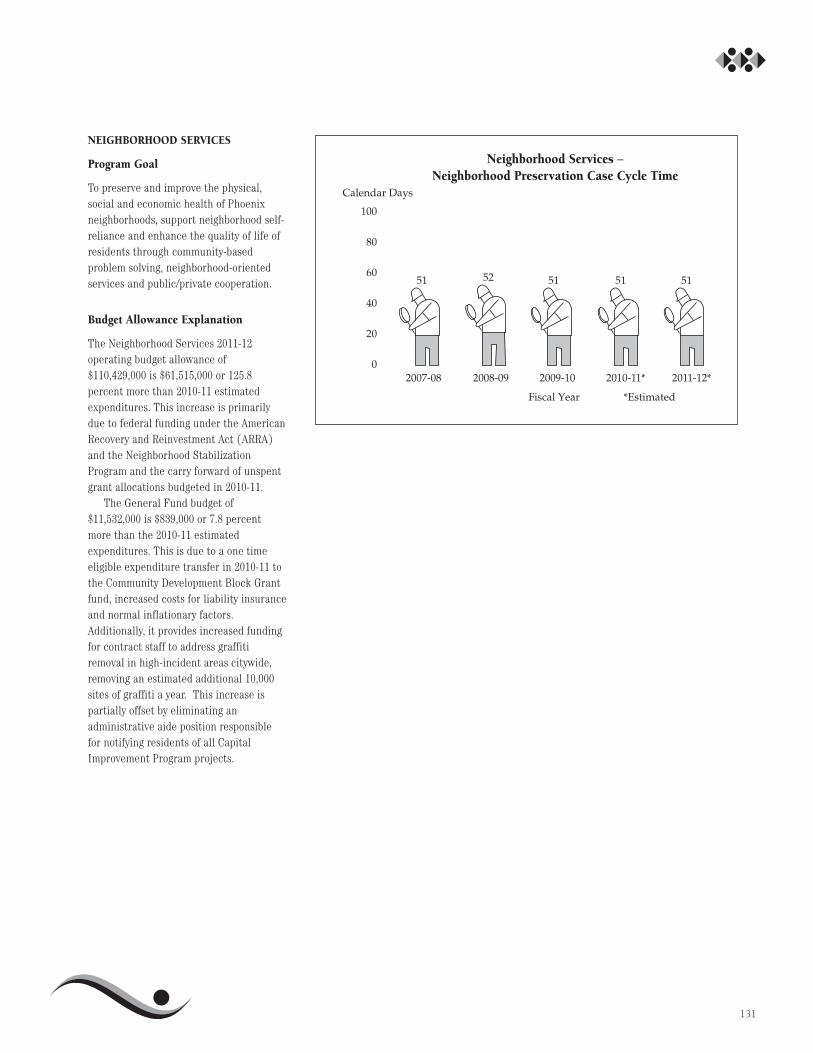
131
NEIGHBORHOOD SERVICES
Program Goal
To preserve and improve the physical,social and economic health of Phoenixneighborhoods, support neighborhood self-reliance and enhance the quality of life ofresidents through community-basedproblem solving, neighborhood-orientedservices and public/private cooperation.
Budget Allowance Explanation
The Neighborhood Services 2011-12operating budget allowance of$110,429,000 is $61,515,000 or 125.8percent more than 2010-11 estimatedexpenditures. This increase is primarilydue to federal funding under the AmericanRecovery and Reinvestment Act (ARRA)and the Neighborhood StabilizationProgram and the carry forward of unspentgrant allocations budgeted in 2010-11.
The General Fund budget of$11,532,000 is $839,000 or 7.8 percentmore than the 2010-11 estimatedexpenditures. This is due to a one timeeligible expenditure transfer in 2010-11 tothe Community Development Block Grantfund, increased costs for liability insuranceand normal inflationary factors.Additionally, it provides increased fundingfor contract staff to address graffitiremoval in high-incident areas citywide,removing an estimated additional 10,000sites of graffiti a year. This increase ispartially offset by eliminating anadministrative aide position responsiblefor notifying residents of all CapitalImprovement Program projects.
Calendar Days
Fiscal Year *Estimated
2010-11*2009-10
100
80
60
40
20
0
Neighborhood Services _
Neighborhood Preservation Case Cycle Time
2007-08 2008-09
51 51 51
2011-12*
5152
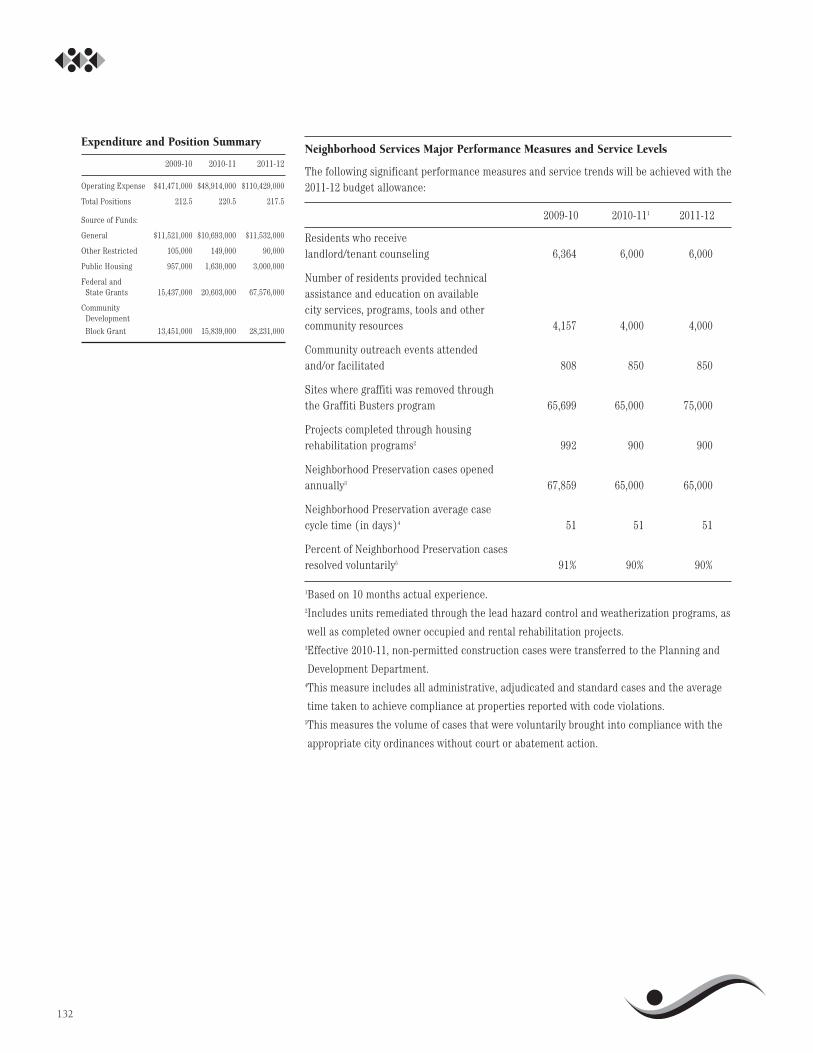
132
Neighborhood Services Major Performance Measures and Service Levels
The following significant performance measures and service trends will be achieved with the2011-12 budget allowance:
2009-10 2010-111 2011-12
Residents who receive landlord/tenant counseling 6,364 6,000 6,000
Number of residents provided technical assistance and education on available city services, programs, tools and other community resources 4,157 4,000 4,000
Community outreach events attended and/or facilitated 808 850 850
Sites where graffiti was removed through the Graffiti Busters program 65,699 65,000 75,000
Projects completed through housing rehabilitation programs2 992 900 900
Neighborhood Preservation cases opened annually3 67,859 65,000 65,000
Neighborhood Preservation average case cycle time (in days)4 51 51 51
Percent of Neighborhood Preservation cases resolved voluntarily5 91% 90% 90%
1Based on 10 months actual experience.2Includes units remediated through the lead hazard control and weatherization programs, as
well as completed owner occupied and rental rehabilitation projects. 3Effective 2010-11, non-permitted construction cases were transferred to the Planning and
Development Department. 4This measure includes all administrative, adjudicated and standard cases and the average
time taken to achieve compliance at properties reported with code violations. 5This measures the volume of cases that were voluntarily brought into compliance with the
appropriate city ordinances without court or abatement action.
Expenditure and Position Summary
2009-10 2010-11 2011-12
Operating Expense $41,471,000 $48,914,000 $110,429,000
Total Positions 212.5 220.5 217.5
Source of Funds:
General $11,521,000 $10,693,000 $11,532,000
Other Restricted 105,000 149,000 90,000
Public Housing 957,000 1,630,000 3,000,000
Federal and State Grants 15,437,000 20,603,000 67,576,000
Community Development
Block Grant 13,451,000 15,839,000 28,231,000
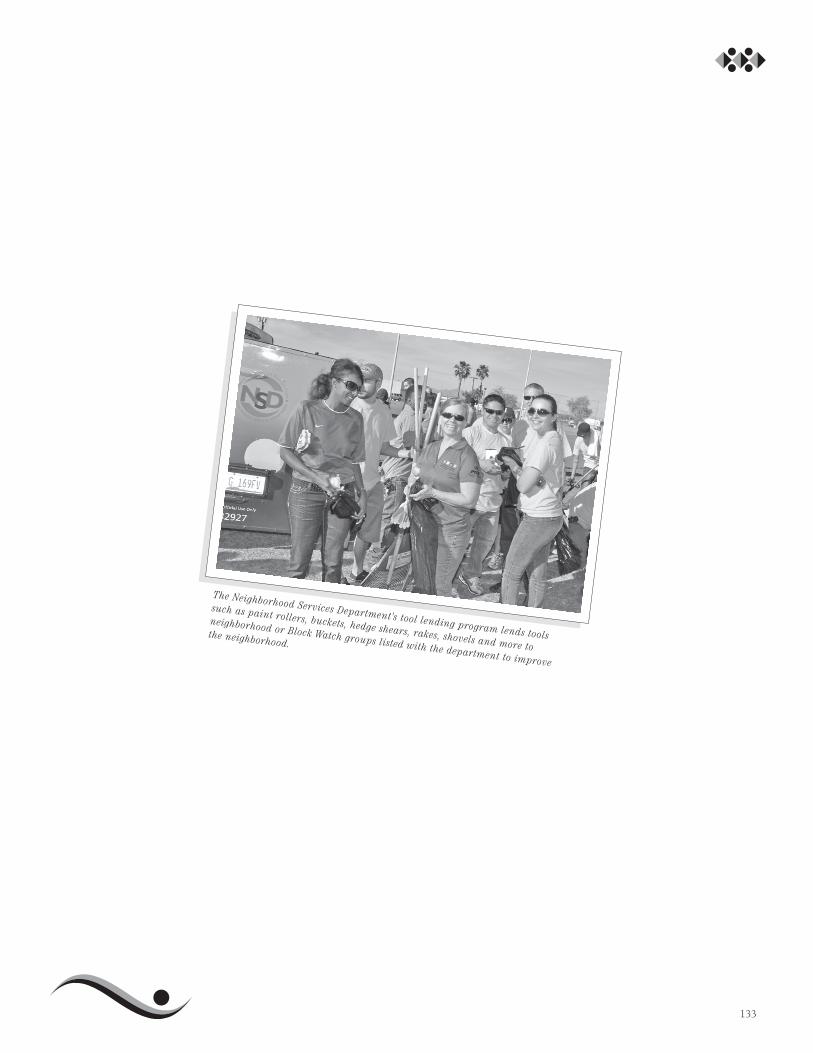
133
The Neighborhood Services Department’s tool lending program lends tools
such as paint rollers, buckets, hedge shears, rakes, shovels and more to
neighborhood or Block Watch groups listed with the department to improve
the neighborhood.

134
Parks and open spaces are the backbone of a healthy and sustainable
environment. At 2,104 feet, North Mountain Park is a landmark Phoenix peak
and offers an array of trails and city views such as this desert view on Trail 8.

PARKS AND RECREATION
Program Goal
The Parks and Recreation Departmentprovides and maintains a diverse parksand recreation system available andaccessible to all, which contributes to thephysical, mental, social and cultural needsof the community and permits outlets thatcultivate a wholesome sense of civic prideand social responsibility.
Budget Allowance Explanation
The Parks and Recreation 2011-12 budgetallowance of $96,395,000 is $3,098,000 or3.3 percent more than 2010-11 estimatedexpenditures. The increase is primarilydue to transitioning the purchase ofreplacement vehicles from financing to allcash, the restoration of eight pools that hadbeen closed on a rotating basis beginningin May 2008 and normal inflationaryincreases. In addition, the 2011-12 budgetincludes funding for the operating costs for500 acres of newly acquired land for theSonoran Preserve and the maintenance offacilities related to the opening of TovreaCastle.
Community Enrichment
135
The Community Enrichment ProgramRepresents 10.0% of the Total Budget.
The Community Enrichment programbudget includes Parks and Recreation,Library, Golf, Phoenix Convention Center,Human Services and the Phoenix Office ofArts and Culture.
Fiscal Year
2009-10
Parks and Recreation –Recreation Facility Attendance
Thousands
800
600
400
200
0
645
577
In 2008, the city completed an extensive review of every department’s performancemeasures. Many new measures were created to better assess the efficiency andeffectiveness of services being provided. Historical data is not available for thisnew measure.
2007-08 2008-09
*Estimated
2010-11*
590
2011-12*
590
The increase is offset by budgetreductions that include converting a full-time park ranger II position to 1.5 FTE ofpart-time and eliminating a managementassistant I position responsible formanaging concessions and cell towerrevenue contracts. Further reductionsinclude reduced utility support for theArizona Science Center and elimination ofevening and weekend IT helpdesk support.

136
Parks and Recreation Major Performance Measures and Service Levels
The following significant performance measures and service trends will be achieved withthe 2011-12 budget allowance:
2009-10 2010-111 2011-12
Construction projects completed (target is 75% or more) 69% 75% 75%
Percentage of safe and clean park facilities (target is 80% or greater)2 88% 75% 75%
Fill 80% or more of all non-team sport registration openings 70% 60% 60%
Recreation Facility Attendance 645,226 590,000 590,000
Usage of athletic field’s available programmable time (target is 60% or greater) 58% 50% 50%
Community usage of facility’s available programmable time (target is 60% or greater) 37% 40% 40%
1Based on 10 months actual experience.2Reduced performance in 2010-11 due to significant budget reductions.
Expenditure and Position Summary
2009-10 2010-11 2011-12
Operating Expense $96,854,000 $93,297,000 $96,395,000
Total Positions 1,028.3 1,000.4 999.4
Source of Funds:
General $89,235,000 $86,336,000 $89,567,000
Other Restricted 2,703,000 3,660,000 3,637,000
City Improvement 2,000,000 411,000 333,000
Federal and State Grants 801,000 618,000 617,000
Convention Center 324,000 350,000 239,000
Parks and Preserves 1,791,000 1,922,000 2,002,000

LIBRARY
Program Goal
The Library provides information andresources that are relevant, accessible andresponsive to the intellectual needs andinterests of the community.
Budget Allowance Explanation
The Library 2011-12 budget allowance of$36,070,000 is $1,543,000 or 4.5 percentmore than 2010-11 estimated expenditures.The increase is primarily due to theaddition of operating costs for the newSouth Mountain Community branch libraryand restoration of same-day service to theAccessibility Center of Burton Barr CentralLibrary with the addition of 0.3 FTE ofpart-time staff. The increase is partiallyoffset by budget reductions that wouldimpact the availability of materials andappearance of the libraries.
137
18
12
6
0
Millions
Fiscal Year The project increase in 2011-12 is due to the opening of the new South Mountain Community Library.
*Estimated
2009-102007-08
Library _Library Material Circulation
(Items circulated)
14.4
2011-12*
14.3
2010-11*
13.8
2008-09
15.8
14.2
Last year, more than 4 million people visited Burton Barr Central Library
and Phoenix Public Library’s 15 branch locations, and checked out more
than 14 million books, DVDs and CDs.
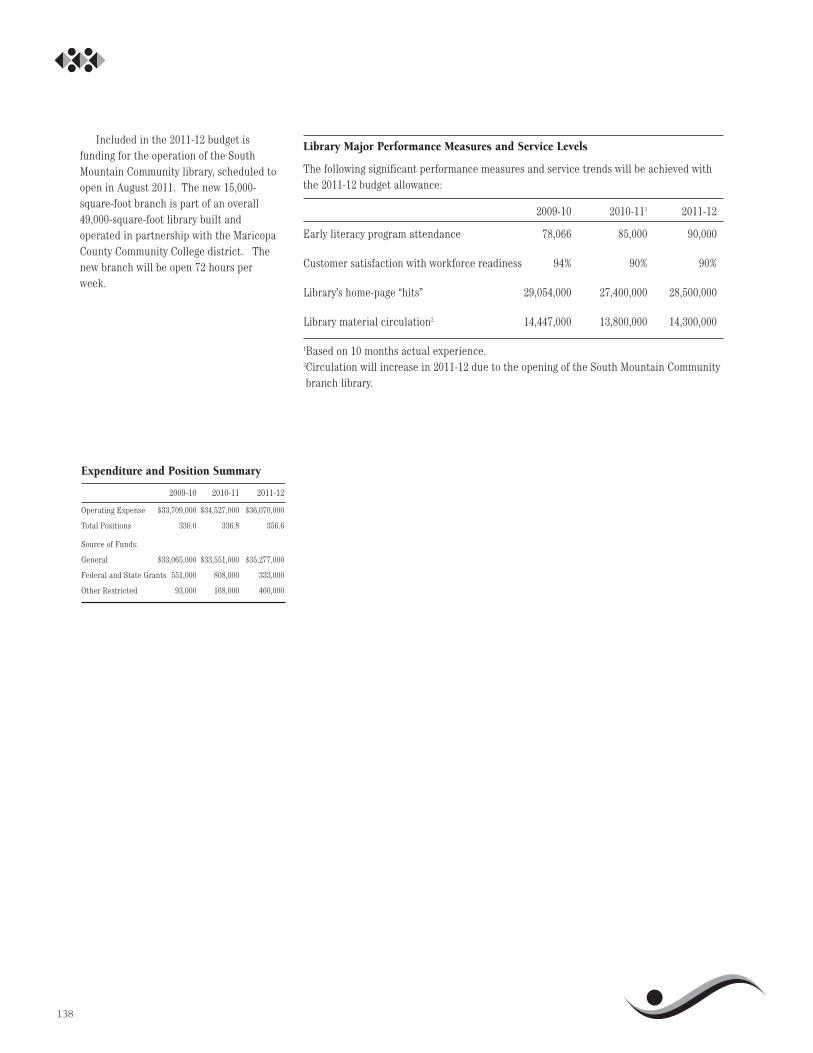
Included in the 2011-12 budget isfunding for the operation of the SouthMountain Community library, scheduled toopen in August 2011. The new 15,000-square-foot branch is part of an overall49,000-square-foot library built andoperated in partnership with the MaricopaCounty Community College district. Thenew branch will be open 72 hours perweek.
138
Library Major Performance Measures and Service Levels
The following significant performance measures and service trends will be achieved withthe 2011-12 budget allowance:
2009-10 2010-111 2011-12
Early literacy program attendance 78,066 85,000 90,000
Customer satisfaction with workforce readiness 94% 90% 90%
Library’s home-page “hits” 29,054,000 27,400,000 28,500,000
Library material circulation2 14,447,000 13,800,000 14,300,000
1Based on 10 months actual experience.2Circulation will increase in 2011-12 due to the opening of the South Mountain Communitybranch library.
Expenditure and Position Summary
2009-10 2010-11 2011-12
Operating Expense $33,709,000 $34,527,000 $36,070,000
Total Positions 330.0 336.8 356.6
Source of Funds:
General $33,065,000 $33,551,000 $35,277,000
Federal and State Grants 551,000 808,000 333,000
Other Restricted 93,000 168,000 460,000

GOLF
Program Goal
The Golf Program provides quality golfservices 365 days a year to residents andvisitors.
Budget Allowance Explanation
The Golf 2011-12 operating budgetallowance of $8,341,000 is $42,000 or onehalf of one percent more than 2010-11estimated expenditures. The increase isdue to normal inflationary increases.
139
Fiscal Year *Estimated
2007-08 2009-10
100%
75%
50%
25%
0%
58% 54%
2010-11*
57%
2011-12*
60%59%
City Golf Courses _Tee Time Usage
(Percent of available tee times being utilized)
2008-09
This measure includes only 18-hole golf courses.
Golf Major Performance Measures and Service Levels
The following significant performance measures and service trends will be achieved withthe 2011-12 budget allowance:
2009-10 2010-111 2011-12
Number of Golf Rounds2 246,000 235,000 244,000
1Based on 10 months actual experience.2Reduced rounds in 2010-11 are the result of current economic conditions. This measureincludes 9 and 18 hole golf courses.
Expenditure and Position Summary
2009-10 2010-11 2011-12
Operating Expense $7,926,000 $8,299,000 $8,341,000
Total Positions 95.4 95.4 95.4
Source of Funds:
Golf $7,926,000 $8,299,000 $8,341,000
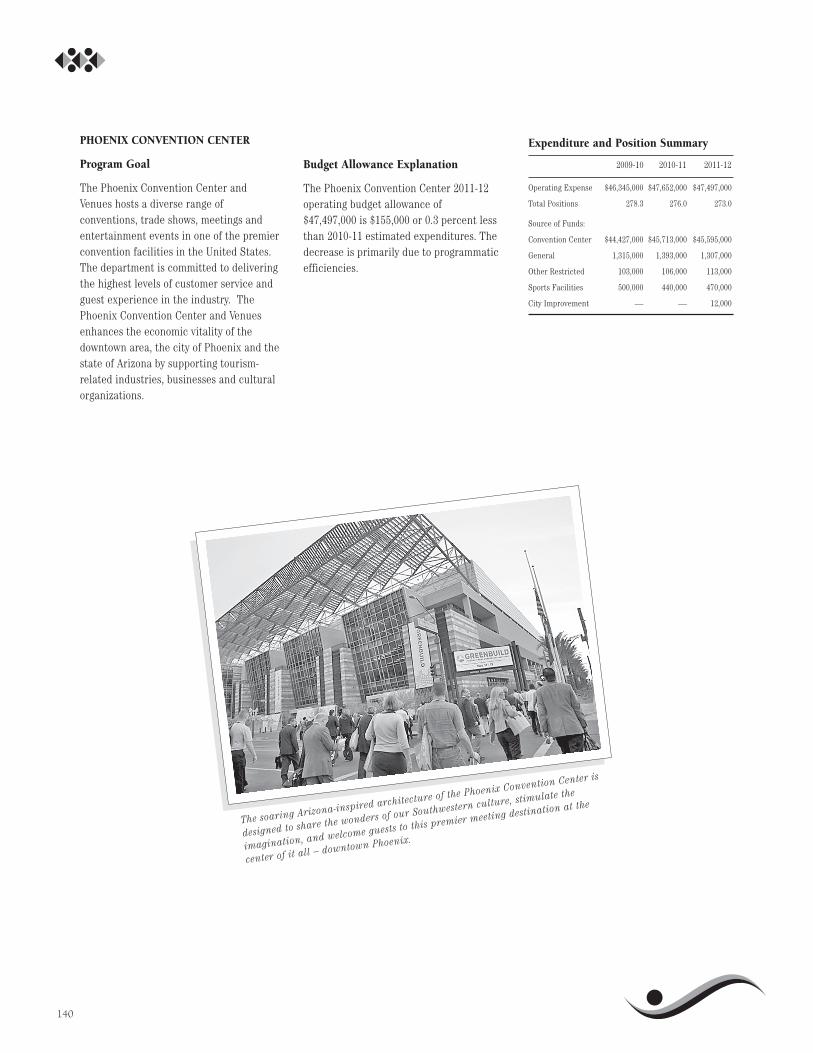
PHOENIX CONVENTION CENTER
Program Goal
The Phoenix Convention Center andVenues hosts a diverse range ofconventions, trade shows, meetings andentertainment events in one of the premierconvention facilities in the United States.The department is committed to deliveringthe highest levels of customer service andguest experience in the industry. ThePhoenix Convention Center and Venuesenhances the economic vitality of thedowntown area, the city of Phoenix and thestate of Arizona by supporting tourism-related industries, businesses and culturalorganizations.
Budget Allowance Explanation
The Phoenix Convention Center 2011-12operating budget allowance of $47,497,000 is $155,000 or 0.3 percent lessthan 2010-11 estimated expenditures. Thedecrease is primarily due to programmaticefficiencies.
140
Expenditure and Position Summary
2009-10 2010-11 2011-12
Operating Expense $46,345,000 $47,652,000 $47,497,000
Total Positions 278.3 276.0 273.0
Source of Funds:
Convention Center $44,427,000 $45,713,000 $45,595,000
General 1,315,000 1,393,000 1,307,000
Other Restricted 103,000 106,000 113,000
Sports Facilities 500,000 440,000 470,000
City Improvement — — 12,000
The soaring Arizona-inspired architecture of the Phoenix Convention Center is
designed to share the wonders of our Southwestern culture, stimulate the
imagination, and welcome guests to this premier meeting destination at the
center of it all – downtown Phoenix.
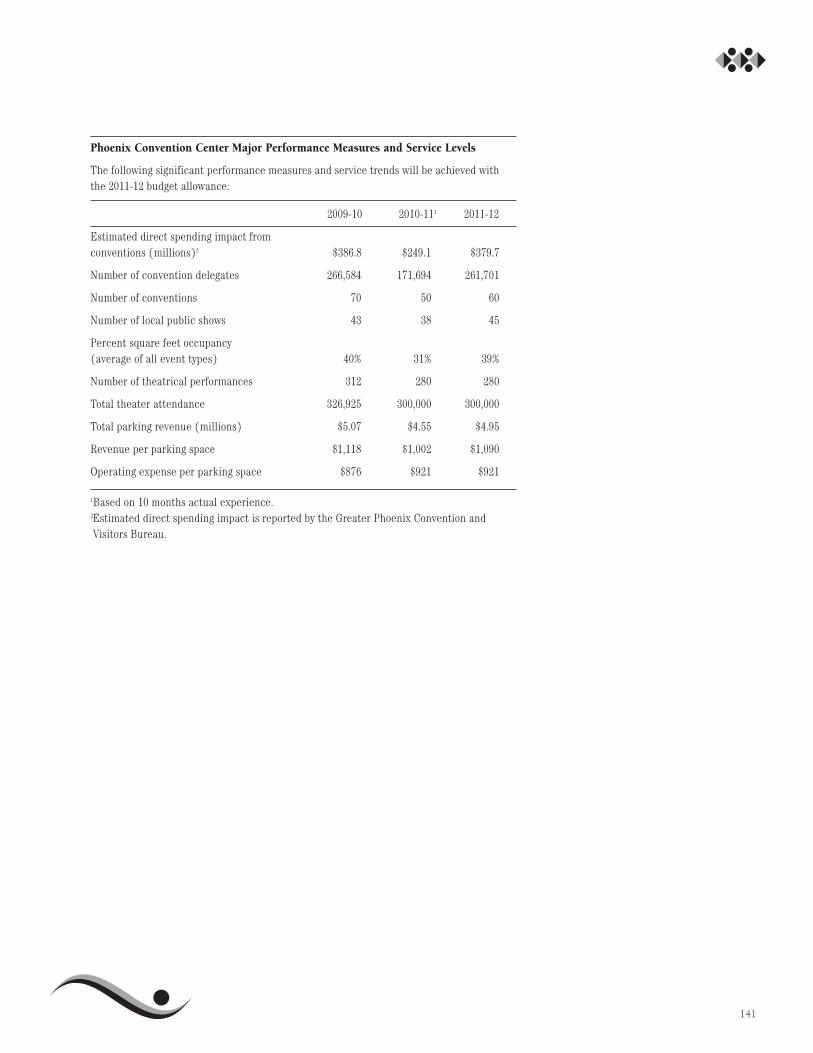
141
Phoenix Convention Center Major Performance Measures and Service Levels
The following significant performance measures and service trends will be achieved withthe 2011-12 budget allowance:
2009-10 2010-111 2011-12
Estimated direct spending impact from conventions (millions)2 $386.8 $249.1 $379.7
Number of convention delegates 266,584 171,694 261,701
Number of conventions 70 50 60
Number of local public shows 43 38 45
Percent square feet occupancy (average of all event types) 40% 31% 39%
Number of theatrical performances 312 280 280
Total theater attendance 326,925 300,000 300,000
Total parking revenue (millions) $5.07 $4.55 $4.95
Revenue per parking space $1,118 $1,002 $1,090
Operating expense per parking space $876 $921 $921
1Based on 10 months actual experience.2Estimated direct spending impact is reported by the Greater Phoenix Convention andVisitors Bureau.

HUMAN SERVICES
Program Goal
The Human Services Departmentpromotes self-sufficiency by providing awide array of services that foster theeconomic, physical and social well-being ofresidents.
Budget Allowance Explanation
The Human Services 2011-12 operatingbudget allowance of $62,377,000 is$656,000 or 1.0 percent less than 2010-11estimated expenditures. The decrease isprimarily due to the expiration, inSeptember 2012, of the American Recoveryand Reinvestment Act (ARRA) funding forthe Early Head Start Program. Thedecrease is partially offset by new facilityoperating costs and normal inflationaryincreases. The 2011-12 budget alsoincludes a General Fund elimination of aHuman Services program coordinatorposition as a result of an operationalimprovement recommendation from anefficiency study.
142
Fiscal Year *Estimated
Thousands
2007-08 2009-10
750
600
450
300
150
0
660
Human Services _
Meals Served by Senior Nutrition Program
2008-09
656 613
2010-11*
611
2011-12*
612
Included in total are breakfast, congregate and home delivery meals.
Human Services Department senior centers provide access to services including
nutrition programs, educational opportunities, advocacy, transportation and
more.

In addition, new facility operating costsare included in the budget for theoperation of the new Helen Drake SeniorCenter. The new facility replaces theManzanita Senior Center, which was in aleased facility.
143
Expenditure and Position Summary
2009-10 2010-11 2011-12
Operating Expense $62,833,000 $63,033,000 $62,377,000
Total Positions 458.0 415.5 416.3
Source of Funds:
General $17,643,000 $17,763,000 $18,493,000
Human ServicesGrants 43,628,000 44,172,000 42,766,000
Community DevelopmentBlock Grant 839,000 665,000 675,000
Federal and State Grant 9,000 23,000 15,000
Water 250,000 250,000 250,000
Other Restricted 45,000 91,000 91,000
City Improvement 419,000 69,000 87,000
Human Services Major Performance Measures and Service Levels
The following significant performance measures and service trends will be achieved withthe 2011-12 budget allowance:
2009-10 2010-111 2011-12
Percentage of families served at the Watkins Overflow Shelter moved into permanent housing 75% 60% 60%
Number of households served2 22,957 25,231 20,885
Percentage of school attendance for Head Start 88% 85% 85%
Medical and dental exams completed for Head Start 6,979 7,000 7,000
Number of meals served to seniors3 613,000 611,000 612,000
Number of victim services provided 6,732 5,500 5,500
1Based on 10 months actual experience.2Number of households served is projected to be higher in 2010-11 due to a one-timeincrease in Low Income Home Energy Assistance Program (LIHEAP) grant funding andlower in 2011-12 due to a planned reduction in Community Services Block Grant funding.
3Meals served includes breakfast, congregate and home delivery meals.

PHOENIX OFFICE OF ARTS AND CULTURE
Program Goal
The Phoenix Office of Arts and Culturesupports the development of the arts andcultural community in Phoenix, and seeksto raise the level of awareness andparticipation of city residents in thepreservation, expansion and enjoyment ofarts and culture.
Budget Allowance Explanation
The Phoenix Office of Arts and Culture2011-12 operating budget allowance of$842,000 is $259,000 or 23.5 percent lessthan 2010-11 estimated expenditures. Thedecrease is mainly due to the Internationaland Sister Cities programs beingconsolidated into the Community andEconomic Development Department, andless grant funding in 2011-12.
144
Expenditure and Position Summary
2009-10 2010-11 2011-12
Operating Expense $1,249,000 $1,101,000 $842,000
Total Positions 15.0 12.0 12.0
Source of Funds:
General $926,000 $1,033,000 $814,000
Federal and State Grants 249,000 52,000 19,000
Local TransportationAssistance 65,000 — —
Other Restricted 9,000 16,000 9,000
Arizona Artist Laurie Lundquist and Sherman Group Landscape Architect Michael
Tarek collaborated to design canal trail enhancements along the 31st Avenue
irrigation canal, from Camelback Road to Missouri Avenue. In addition to the
trail, the art elements included portal entry markers, seating areas, fencing and
sustainable landscaping.

145
Phoenix Office of Arts and Culture Major Performance Measures and ServiceLevels
The following significant performance measures and service trends will be achieved withthe 2011-12 budget allowance.
2009-10 2010-111 2011-12
Grant applications processed to support arts activities through schools and nonprofit organizations2 37 24 24
Grant awards administered to support arts activities through schools and nonprofit organizations2 56 37 24
Completed Percent-for-art projects to enhance city capital improvement projects with artwork 7 12 10
Local artists/arts organizations training workshops3 14 — —
Arts management consulting projects coordinated by Arts and Business Council3 50 — —
Percent of projects in Art Plan being implemented 64% 60% 65%
Community Presentations 43 38 35
1Based on 10 months actual experience.2Due to reductions in funding for grants, there were fewer grant categories and fewerapplications.
3Arts management consulting projects were eliminated in 2010-2011.
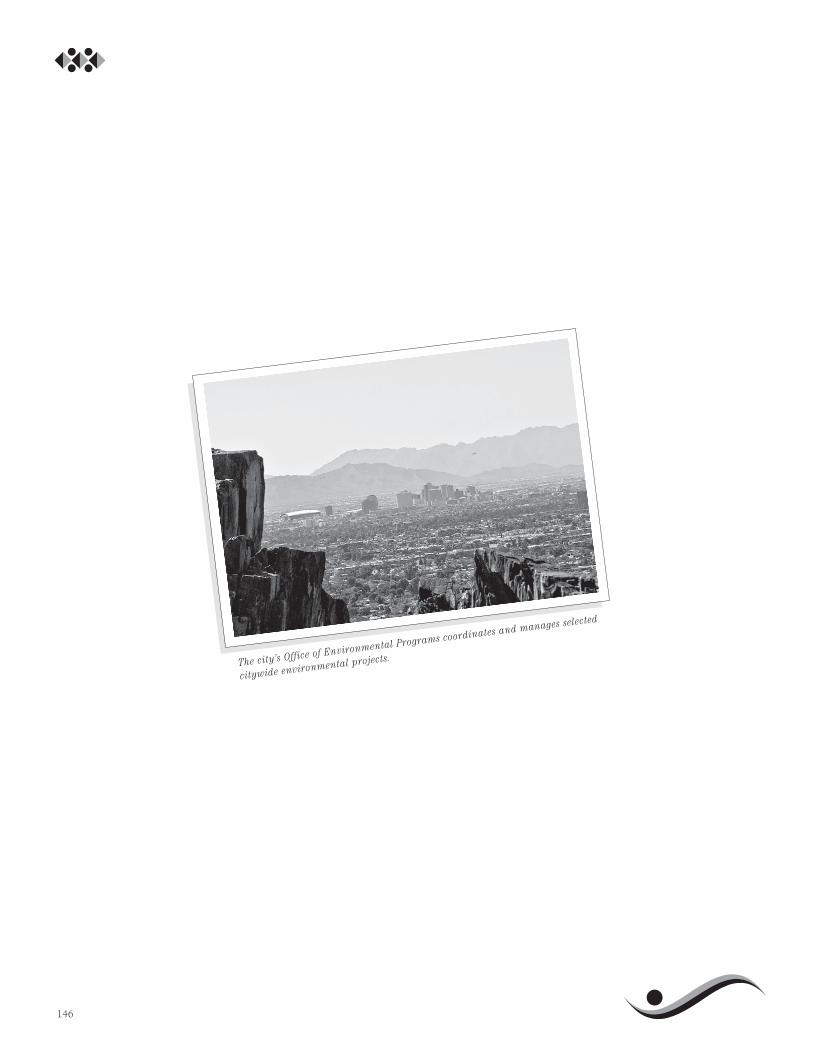
146
The city’s Office of Environmental Programs coordinates and manages selected
citywide environmental projects.

WATER SERVICES
Program Goal
The Water Services Department isresponsible for the Water and Wastewaterprograms. The Water Program provides asafe and adequate domestic water supplyto all residents in the Phoenix waterservice area. The Wastewater Programassists in providing a clean, healthyenvironment through the effectivemanagement of all waterborne wastesgenerated within the Phoenix drainagearea.
Budget Allowance Explanation
The Water Services 2011-12 operatingbudget allowance of $280,039,000 is$11,887,000 or 4.4 percent more than 2010-11 estimated expenditures. Theincrease is primarily due to an increase incosts for water and wastewater treatment,such as increased cost of chemicals, newfacility operating costs and normalinflationary increases.
Environmental Services
147
The Environmental Services Program Represents 17.0% of the Total Budget.
The Environmental Services programbudget includes Water Services, SolidWaste Management, Public Works andEnvironmental Programs.
Fiscal Year *Estimated
2008-09 2009-102007-08
100%
80%
60%
40%
20%
0%
Water ServicesWaterline Leaks Repaired
(Percent repaired within 48 hours)
96% 96% 96% 96% 96%
2010-11* 2011-12*

The budget adds funding necessary tocomply with federally mandated waterquality requirements. This includes newfacility operating costs to operate andmaintain the new granular activatedcarbon (GAC), chlorine dioxide treatment,and powder activated carbon processes atthe Val Vista Water Treatment Plant; andchlorine dioxide treatment processes atthe 24th Street Water Treatment Plant.
148
Expenditure and Position Summary
2009-10 2010-11 2011-12
Operating Expense $250,747,000 $268,152,000 $280,039,000
Total Positions 1,527.1 1,497.1 1,496.1
Source of Funds:
Water $164,732,000 $175,771,000 $186,864,000
Wastewater 86,015,000 90,712,000 91,290,000
Federal and State Grants — 101,000 —
Other Restricted — 1,568,000 1,885,000
The increase in the budget is partiallyoffset by a full year of savings from positionreductions resulting from improvements inorganizational efficiency.
The Phoenix Water Services Department produces
about 100 billion gallons of tap water annually
that is delivered to more than 400,000 customers.

149
Water Services Major Performance Measures and Service Levels
The following significant performance measures and service trends will be achieved withthe 2011-12 budget allowance:
2009-10 2010-111 2011-12
Water main break/leaks per year 199.2 262.8 228.0
Waterline leaks repaired within 48 hours 96% 96% 96%
Percent of miles of sewer cleaned per year 34.8% 35.0% 35.0%
Sanitary sewer overflows per 100 miles 1.04 1.00 1.00
Gallons of water produced system wide (billions) 114.8 110.7 112.4
Gallons of wastewater treated (billions) 62.2 63.3 64.0
Telephone Calls-Received 1,163,929 1,302,398 1,180,000
Telephone Calls-Percent Answered2 92% 90% 92%
1Based on 10 months actual experience.2Percent answered is calculated based on total calls logged into the queue and callsanswered. Callers can elect to end their call before receiving assistance and would not becounted as “answered.”
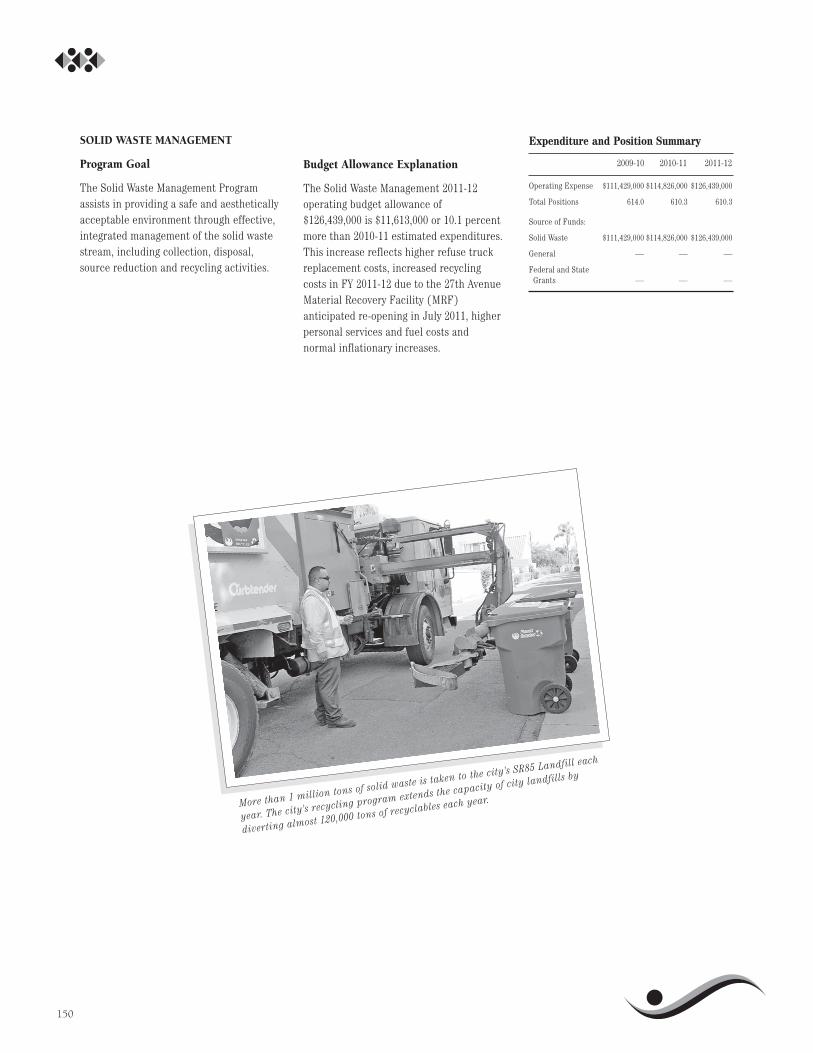
SOLID WASTE MANAGEMENT
Program Goal
The Solid Waste Management Programassists in providing a safe and aestheticallyacceptable environment through effective,integrated management of the solid wastestream, including collection, disposal,source reduction and recycling activities.
Budget Allowance Explanation
The Solid Waste Management 2011-12operating budget allowance of$126,439,000 is $11,613,000 or 10.1 percentmore than 2010-11 estimated expenditures.This increase reflects higher refuse truckreplacement costs, increased recyclingcosts in FY 2011-12 due to the 27th AvenueMaterial Recovery Facility (MRF)anticipated re-opening in July 2011, higherpersonal services and fuel costs andnormal inflationary increases.
150
Expenditure and Position Summary
2009-10 2010-11 2011-12
Operating Expense $111,429,000 $114,826,000 $126,439,000
Total Positions 614.0 610.3 610.3
Source of Funds:
Solid Waste $111,429,000 $114,826,000 $126,439,000
General — — —
Federal and StateGrants — — —
More than 1 million tons of solid waste is taken to the city’s SR85 Landfill each
year. The city’s recycling program extends the capacity of city landfills by
diverting almost 120,000 tons of recyclables each year.

151
_______________________________________________________________________Solid Waste Management Major Performance Measures and Service Levels
The following significant performance measures and service trends will be achieved with the2011-12 budget allowance:
2009-10 2010-111 2011-12
Residential households served with twice-per-week contained solid waste and recyclable material collections 392,825 394,000 397,000
Tons of residential recyclable materials collected 112,800 114,000 114,000
Tons of total solid waste disposed at city landfills 929,700 1,050,000 1,050,000
Tons of solid waste from city residences disposed 629,700 650,000 650,000
1Based on 10 months actual experience.
Fiscal Year *Estimated
2008-09
Solid Waste — Recyclable Material Processed
150
125
100
75
50
25
0
Thousands of Tons
2009-10
112.8
2010-11*
114.0
2011-12*
114.0119.4
2007-08
128.0
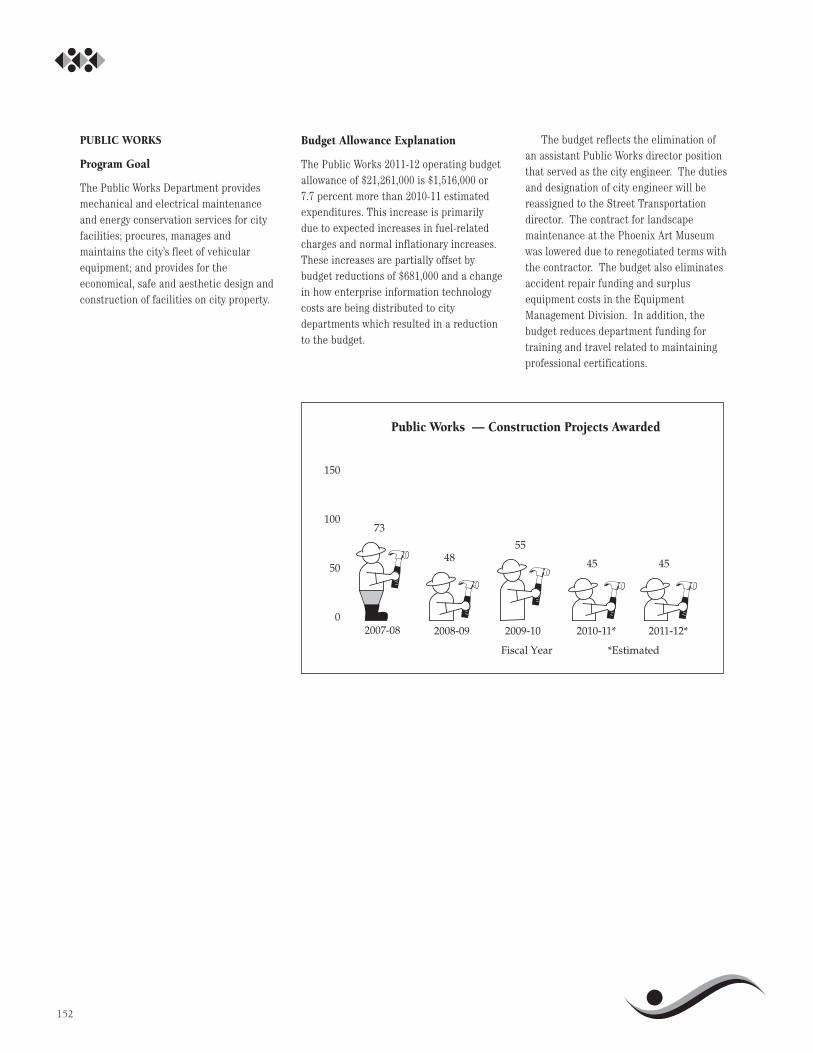
PUBLIC WORKS
Program Goal
The Public Works Department providesmechanical and electrical maintenanceand energy conservation services for cityfacilities; procures, manages andmaintains the city’s fleet of vehicularequipment; and provides for theeconomical, safe and aesthetic design andconstruction of facilities on city property.
152
Budget Allowance Explanation
The Public Works 2011-12 operating budgetallowance of $21,261,000 is $1,516,000 or7.7 percent more than 2010-11 estimatedexpenditures. This increase is primarilydue to expected increases in fuel-relatedcharges and normal inflationary increases.These increases are partially offset bybudget reductions of $681,000 and a changein how enterprise information technologycosts are being distributed to citydepartments which resulted in a reductionto the budget.
The budget reflects the elimination ofan assistant Public Works director positionthat served as the city engineer. The dutiesand designation of city engineer will bereassigned to the Street Transportationdirector. The contract for landscapemaintenance at the Phoenix Art Museumwas lowered due to renegotiated terms withthe contractor. The budget also eliminatesaccident repair funding and surplusequipment costs in the EquipmentManagement Division. In addition, thebudget reduces department funding fortraining and travel related to maintainingprofessional certifications.
Fiscal Year *Estimated
2008-09
Public Works — Construction Projects Awarded
150
100
50
02009-10 2010-11*2007-08
73
5548 45
2011-12*
45
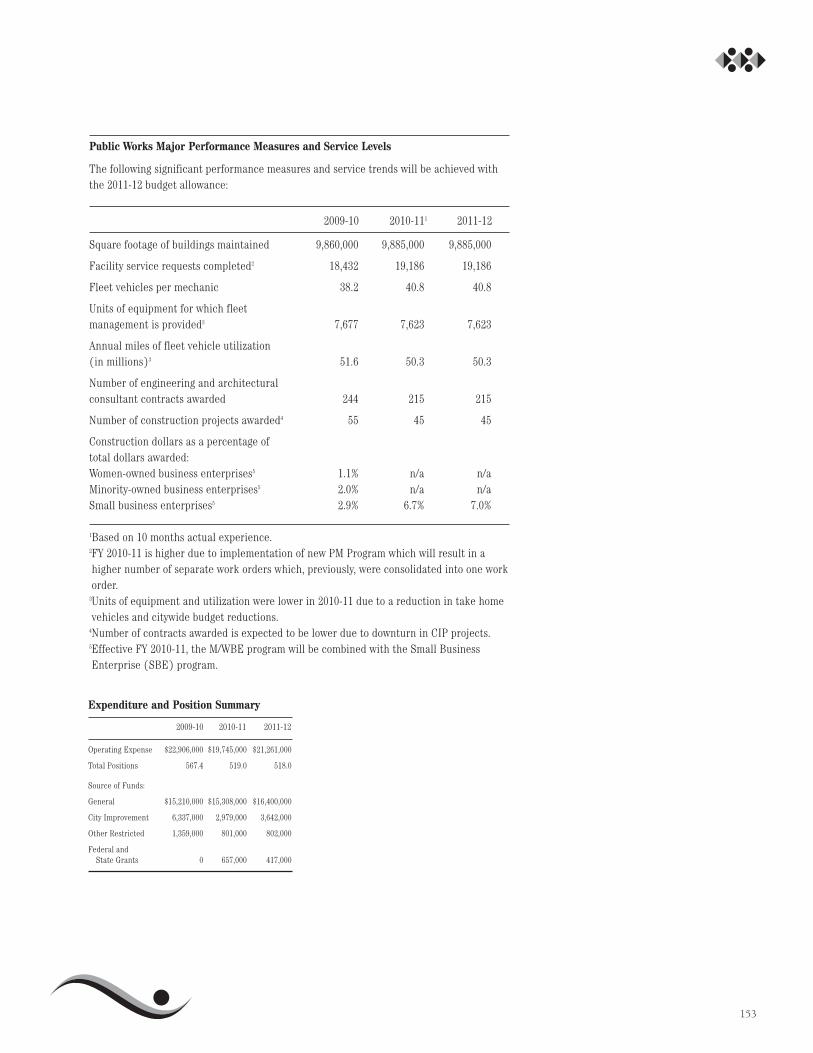
153
Public Works Major Performance Measures and Service Levels
The following significant performance measures and service trends will be achieved withthe 2011-12 budget allowance:
2009-10 2010-111 2011-12
Square footage of buildings maintained 9,860,000 9,885,000 9,885,000
Facility service requests completed2 18,432 19,186 19,186
Fleet vehicles per mechanic 38.2 40.8 40.8
Units of equipment for which fleet management is provided3 7,677 7,623 7,623
Annual miles of fleet vehicle utilization (in millions)3 51.6 50.3 50.3
Number of engineering and architectural consultant contracts awarded 244 215 215
Number of construction projects awarded4 55 45 45
Construction dollars as a percentage oftotal dollars awarded:Women-owned business enterprises5 1.1% n/a n/aMinority-owned business enterprises5 2.0% n/a n/aSmall business enterprises5 2.9% 6.7% 7.0%
1Based on 10 months actual experience.2FY 2010-11 is higher due to implementation of new PM Program which will result in ahigher number of separate work orders which, previously, were consolidated into one workorder.
3Units of equipment and utilization were lower in 2010-11 due to a reduction in take homevehicles and citywide budget reductions.
4Number of contracts awarded is expected to be lower due to downturn in CIP projects.5Effective FY 2010-11, the M/WBE program will be combined with the Small BusinessEnterprise (SBE) program.
Expenditure and Position Summary
2009-10 2010-11 2011-12
Operating Expense $22,906,000 $19,745,000 $21,261,000
Total Positions 567.4 519.0 518.0
Source of Funds:
General $15,210,000 $15,308,000 $16,400,000
City Improvement 6,337,000 2,979,000 3,642,000
Other Restricted 1,359,000 801,000 802,000
Federal and State Grants 0 657,000 417,000

154
ENVIRONMENTAL PROGRAMS
Program Goal
The Office of Environmental Programsprovides coordination and monitoring forthe city’s environmental programs andactivities, and develops and implementsregulatory policies and programs.
Budget Allowance Explanation
The Office of Environmental Programs2011-12 operating budget allowance of$1,407,000 is $101,000 or 6.7 percent lessthan the 2010-11 estimated expendituresand reflects a reduction in grant fundingfor Brownfields training. Also, reflected isthe elimination of an environmentalprogram specialist that was eliminatedthrough the organizational review process.
Expenditure and Position Summary
2009-10 2010-11 2011-12
Operating Expense $1,277,000 $1,508,000 $1,407,000
Total Positions 14.0 13.0 13.0
Source of Funds:
General $1,124,000 $944,000 $978,000
Federal and State Grants 1,000 134,000 25,000
Water 118,000 215,000 225,000
Capital Construction 34,000 70,000 70,000
Other Restricted Funds — 145,000 109,000
5,000
4,000
3,000
2,000
1,000
02007-08 2008-09
Fiscal Year *Estimated
Number Trained
Environmental ProgramsTotal Training Provided to Employees/Consultants
on Environmental Issues
2,417
1,508
686
2,448
2009-10 2010-11*
520
2011-12*
The decrease between FY 2009-10 and FY 2011-12 reflects budget reductions to training, larger internal departments developing and implementing their own stormwater training programs, and Maricopa County assuming all dust control training.
Environmental Programs Major Performance Measures and Service Levels
The following significant performance measures and service level trends will be achievedwith the 2011-12 budget allowance:
2009-10 2010-111 2011-12
Number of facility assessments and technical assistance visits conducted2 72 120 100
Number of brownfields projects implemented 0 2 0
Pollution prevention and hazardous materials/hazardous waste compliance assistance provided3 138 115 115
1Based on 10 months actual experience.2Departments are assessed on a cyclical basis. The annual variance reflects differentdepartments which have a varying number of facilities.
3Projection based on historical data and available funding.
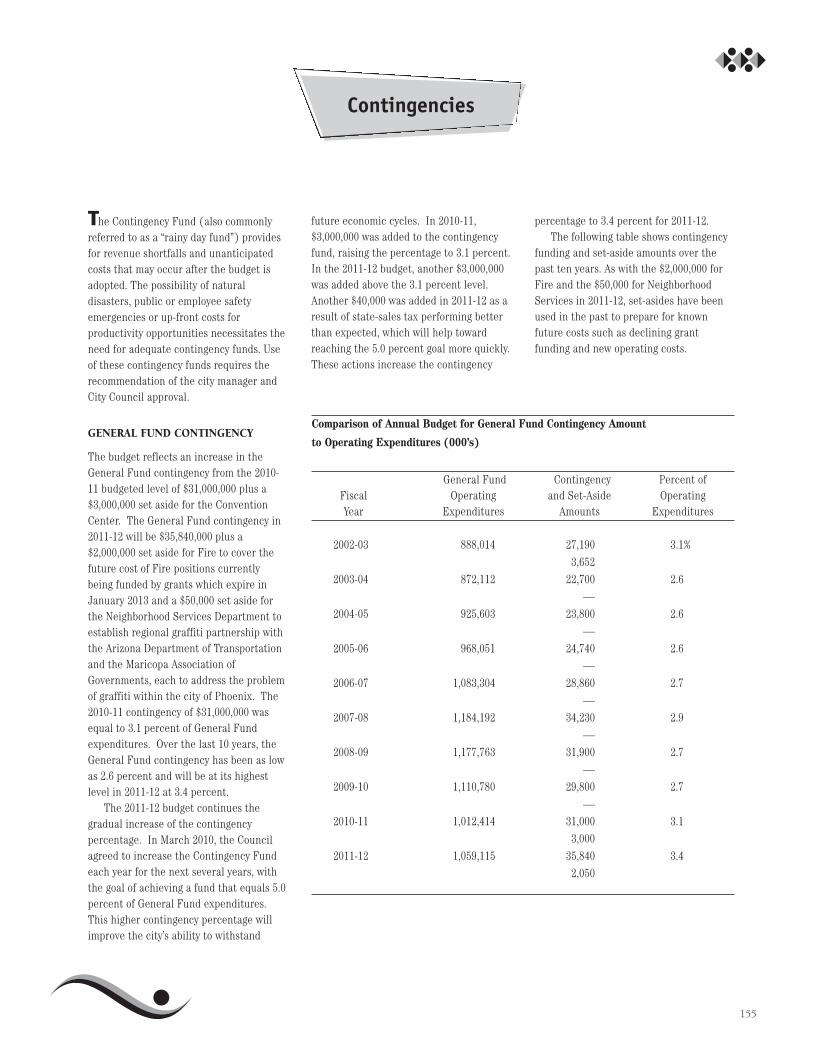
The Contingency Fund (also commonlyreferred to as a “rainy day fund”) providesfor revenue shortfalls and unanticipatedcosts that may occur after the budget isadopted. The possibility of naturaldisasters, public or employee safetyemergencies or up-front costs forproductivity opportunities necessitates theneed for adequate contingency funds. Useof these contingency funds requires therecommendation of the city manager andCity Council approval.
GENERAL FUND CONTINGENCY
The budget reflects an increase in theGeneral Fund contingency from the 2010-11 budgeted level of $31,000,000 plus a$3,000,000 set aside for the ConventionCenter. The General Fund contingency in2011-12 will be $35,840,000 plus a$2,000,000 set aside for Fire to cover thefuture cost of Fire positions currentlybeing funded by grants which expire inJanuary 2013 and a $50,000 set aside forthe Neighborhood Services Department toestablish regional graffiti partnership withthe Arizona Department of Transportationand the Maricopa Association ofGovernments, each to address the problemof graffiti within the city of Phoenix. The2010-11 contingency of $31,000,000 wasequal to 3.1 percent of General Fundexpenditures. Over the last 10 years, theGeneral Fund contingency has been as lowas 2.6 percent and will be at its highestlevel in 2011-12 at 3.4 percent.
The 2011-12 budget continues thegradual increase of the contingencypercentage. In March 2010, the Councilagreed to increase the Contingency Fundeach year for the next several years, withthe goal of achieving a fund that equals 5.0percent of General Fund expenditures.This higher contingency percentage willimprove the city’s ability to withstand
future economic cycles. In 2010-11,$3,000,000 was added to the contingencyfund, raising the percentage to 3.1 percent.In the 2011-12 budget, another $3,000,000was added above the 3.1 percent level.Another $40,000 was added in 2011-12 as aresult of state-sales tax performing betterthan expected, which will help towardreaching the 5.0 percent goal more quickly.These actions increase the contingency
percentage to 3.4 percent for 2011-12. The following table shows contingency
funding and set-aside amounts over thepast ten years. As with the $2,000,000 forFire and the $50,000 for NeighborhoodServices in 2011-12, set-asides have beenused in the past to prepare for knownfuture costs such as declining grantfunding and new operating costs.
Contingencies
155
Comparison of Annual Budget for General Fund Contingency Amount
to Operating Expenditures (000’s)
General Fund Contingency Percent of Fiscal Operating and Set-Aside OperatingYear Expenditures Amounts Expenditures
2002-03 888,014 27,190 3.1%
3,652
2003-04 872,112 22,700 2.6
—
2004-05 925,603 23,800 2.6
—
2005-06 968,051 24,740 2.6
—
2006-07 1,083,304 28,860 2.7
—
2007-08 1,184,192 34,230 2.9
—
2008-09 1,177,763 31,900 2.7
—
2009-10 1,110,780 29,800 2.7
—
2010-11 1,012,414 31,000 3.1
3,000
2011-12 1,059,115 35,840 3.4
2,050
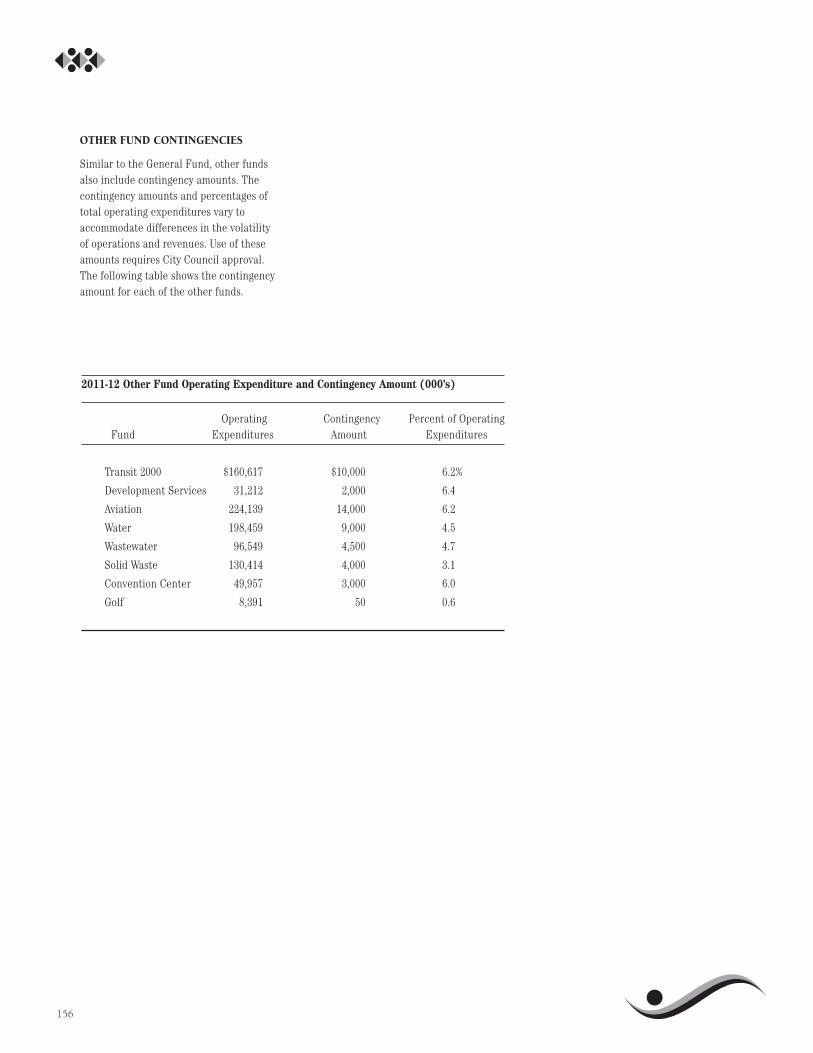
OTHER FUND CONTINGENCIES
Similar to the General Fund, other fundsalso include contingency amounts. Thecontingency amounts and percentages oftotal operating expenditures vary toaccommodate differences in the volatilityof operations and revenues. Use of theseamounts requires City Council approval.The following table shows the contingencyamount for each of the other funds.
156
2011-12 Other Fund Operating Expenditure and Contingency Amount (000’s)
Operating Contingency Percent of OperatingFund Expenditures Amount Expenditures
Transit 2000 $160,617 $10,000 6.2%
Development Services 31,212 2,000 6.4
Aviation 224,139 14,000 6.2
Water 198,459 9,000 4.5
Wastewater 96,549 4,500 4.7
Solid Waste 130,414 4,000 3.1
Convention Center 49,957 3,000 6.0
Golf 8,391 50 0.6

Debt service expenditures includepayments of principal, interest, sinkingfund transfers, costs of issuance and bondreserve requirements for bonds issued. Thedebt service allowance in 2011-12 forexisting debt and future bond sales is$570,296,000. As shown in the following piechart, the $570.3 million is funded bySecondary Property Tax, Water, Aviation,Wastewater, City Improvement, ArizonaHighway User Revenue, Convention Center,Sports Facilities, Solid Waste and othermiscellaneous funds. City Improvementincludes $63.9 million in generalgovernment nonprofit corporation bondsdebt service payments funded by GeneralFund ($13.7 million), Transit 2000 ($48.4million), Housing ($0.1 million) andcapital funds ($1.7 million).
Secondary Property Tax shown in thepie chart represents the annual tax levy fordebt service, federal subsidy and relatedinterest earnings.
Types of Bonds Issued and Security
Under Arizona law, cities are authorized toissue voter-approved general obligation,highway user revenue and utility revenuebonds. For the city of Phoenix, thisincludes property tax-supported bonds andrevenue bonds (such as water revenue andairport revenue bonds).
The city’s general obligation bonds are“full faith and credit” bonds. This meansthey are secured by a legally bindingpledge to levy property taxes without limitto make annual bond principal andinterest payments. Water and airportrevenue bonds are secured by a pledge ofthese enterprises’ net revenues (revenuesnet of operation and maintenanceexpenses) and do not constitute a generalobligation of the city backed by generaltaxing power. Highway user revenue bonds
are secured by state-shared gas taxes andother highway user fees and charges andalso are not general obligations of the city.
Debt Management
In general, the city has used generalobligation bonds to finance capitalprograms of general government (non-enterprise) departments. These includeprograms such as fire protection, policeprotection, libraries, parks and recreation,service centers and storm sewers. The debtservice on these bonds is paid from thesecondary property tax levy. By state law,the city can only use its secondaryproperty tax levy to pay principal andinterest on long-term debt.
Currently, to finance the capitalprograms of enterprise departments, thecity has used revenue bonds secured byand repaid from the revenues of theseenterprises. In the past, the city also hasused general obligation bonds for water,airport, sanitary sewer and solid wastepurposes when deemed appropriate.
Since the 1950s, the city has used acommunity review process to develop andacquire voter approval for generalobligation bond programs. At a bondelection held on March 14, 2006, votersapproved all of the $878.5 million of the2006 Citizens’ Bond Committee-recommended bond authorizations. Theseauthorizations provided funding toconstruct capital improvements in thefollowing areas:
n Police and Fire Protection
n Police, Fire and Computer Technology
n Parks, Recreation and MountainPreserves
n Education Facilities
n Library Facilities
n Street Improvements
n Storm Sewers
n Senior Facilities
n Cultural Facilities
n Affordable Housing NeighborhoodRevitalization
Debt Service
157
AHUR 3.9%
Aviation 14.6%
Secondary Property Tax 17.5%
Water 20.3%
Wastewater 16.5%
Solid Waste 2.6%
City Improvement* 11.2%
2011-12 Debt Service
Convention Center
3.4%Other 10.0%
*Funded by General, Transit 2000 taxes and capital funds.
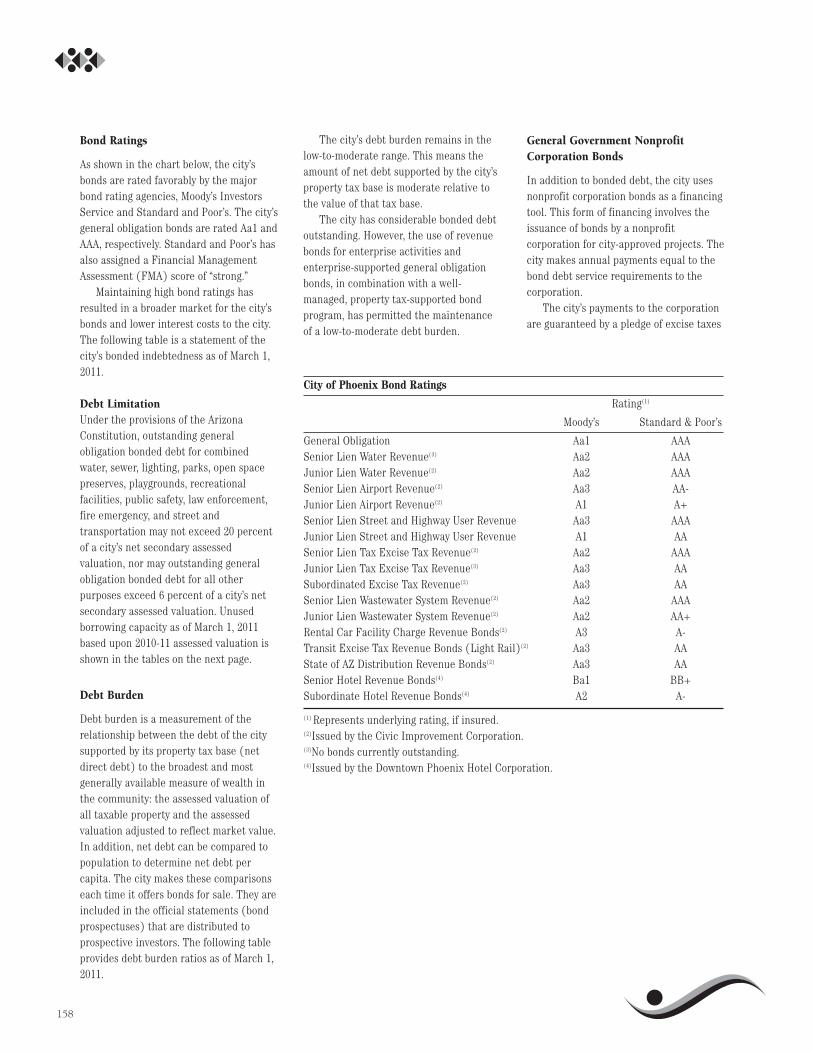
Bond Ratings
As shown in the chart below, the city’sbonds are rated favorably by the majorbond rating agencies, Moody’s InvestorsService and Standard and Poor’s. The city’sgeneral obligation bonds are rated Aa1 andAAA, respectively. Standard and Poor’s hasalso assigned a Financial ManagementAssessment (FMA) score of “strong.”
Maintaining high bond ratings hasresulted in a broader market for the city’sbonds and lower interest costs to the city.The following table is a statement of thecity’s bonded indebtedness as of March 1,2011.
Debt LimitationUnder the provisions of the ArizonaConstitution, outstanding generalobligation bonded debt for combinedwater, sewer, lighting, parks, open spacepreserves, playgrounds, recreationalfacilities, public safety, law enforcement,fire emergency, and street andtransportation may not exceed 20 percentof a city’s net secondary assessedvaluation, nor may outstanding generalobligation bonded debt for all otherpurposes exceed 6 percent of a city’s netsecondary assessed valuation. Unusedborrowing capacity as of March 1, 2011based upon 2010-11 assessed valuation isshown in the tables on the next page.
Debt Burden
Debt burden is a measurement of therelationship between the debt of the citysupported by its property tax base (netdirect debt) to the broadest and mostgenerally available measure of wealth inthe community: the assessed valuation ofall taxable property and the assessedvaluation adjusted to reflect market value.In addition, net debt can be compared topopulation to determine net debt percapita. The city makes these comparisonseach time it offers bonds for sale. They areincluded in the official statements (bondprospectuses) that are distributed toprospective investors. The following tableprovides debt burden ratios as of March 1,2011.
The city’s debt burden remains in thelow-to-moderate range. This means theamount of net debt supported by the city’sproperty tax base is moderate relative tothe value of that tax base.
The city has considerable bonded debtoutstanding. However, the use of revenuebonds for enterprise activities andenterprise-supported general obligationbonds, in combination with a well-managed, property tax-supported bondprogram, has permitted the maintenanceof a low-to-moderate debt burden.
General Government NonprofitCorporation Bonds
In addition to bonded debt, the city usesnonprofit corporation bonds as a financingtool. This form of financing involves theissuance of bonds by a nonprofitcorporation for city-approved projects. Thecity makes annual payments equal to thebond debt service requirements to thecorporation.
The city’s payments to the corporationare guaranteed by a pledge of excise taxes
158
City of Phoenix Bond Ratings
Rating(1)
Moody’s Standard & Poor’s
General Obligation Aa1 AAASenior Lien Water Revenue(3) Aa2 AAAJunior Lien Water Revenue(2) Aa2 AAASenior Lien Airport Revenue(2) Aa3 AA-Junior Lien Airport Revenue(2) A1 A+Senior Lien Street and Highway User Revenue Aa3 AAAJunior Lien Street and Highway User Revenue A1 AASenior Lien Tax Excise Tax Revenue(2) Aa2 AAAJunior Lien Tax Excise Tax Revenue(3) Aa3 AASubordinated Excise Tax Revenue(2) Aa3 AASenior Lien Wastewater System Revenue(2) Aa2 AAAJunior Lien Wastewater System Revenue(2) Aa2 AA+Rental Car Facility Charge Revenue Bonds(2) A3 A-Transit Excise Tax Revenue Bonds (Light Rail)(2) Aa3 AAState of AZ Distribution Revenue Bonds(2) Aa3 AASenior Hotel Revenue Bonds(4) Ba1 BB+Subordinate Hotel Revenue Bonds(4) A2 A-
(1) Represents underlying rating, if insured.(2)Issued by the Civic Improvement Corporation.(3)No bonds currently outstanding.(4)Issued by the Downtown Phoenix Hotel Corporation.
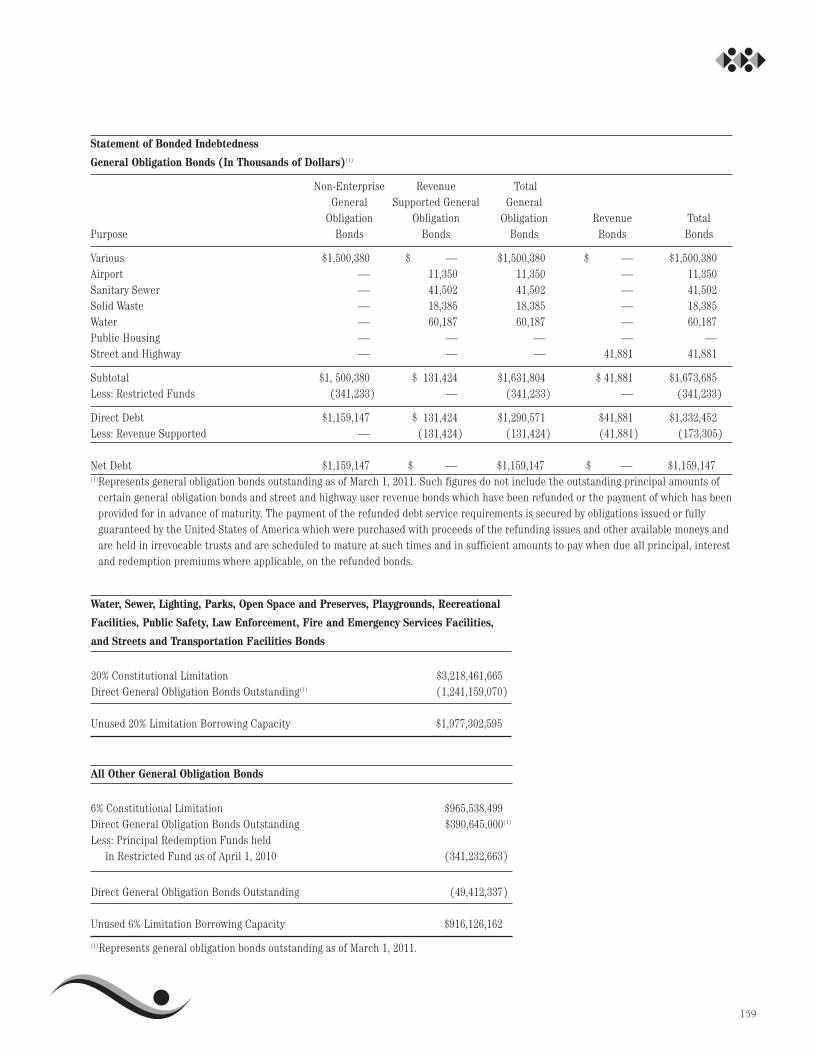
159
Statement of Bonded Indebtedness
General Obligation Bonds (In Thousands of Dollars)(1)
Non-Enterprise Revenue TotalGeneral Supported General General
Obligation Obligation Obligation Revenue TotalPurpose Bonds Bonds Bonds Bonds Bonds
Various $1,500,380 $ — $1,500,380 $ — $1,500,380Airport — 11,350 11,350 — 11,350Sanitary Sewer — 41,502 41,502 — 41,502Solid Waste — 18,385 18,385 — 18,385Water — 60,187 60,187 — 60,187Public Housing — — — — —Street and Highway — — — 41,881 41,881
Subtotal $1, 500,380 $ 131,424 $1,631,804 $ 41,881 $1,673,685Less: Restricted Funds (341,233) — (341,233) — (341,233)
Direct Debt $1,159,147 $ 131,424 $1,290,571 $41,881 $1,332,452Less: Revenue Supported — (131,424) (131,424) (41,881) (173,305)
Net Debt $1,159,147 $ — $1,159,147 $ — $1,159,147(1)Represents general obligation bonds outstanding as of March 1, 2011. Such figures do not include the outstanding principal amounts of
certain general obligation bonds and street and highway user revenue bonds which have been refunded or the payment of which has beenprovided for in advance of maturity. The payment of the refunded debt service requirements is secured by obligations issued or fullyguaranteed by the United States of America which were purchased with proceeds of the refunding issues and other available moneys andare held in irrevocable trusts and are scheduled to mature at such times and in sufficient amounts to pay when due all principal, interestand redemption premiums where applicable, on the refunded bonds.
Water, Sewer, Lighting, Parks, Open Space and Preserves, Playgrounds, Recreational
Facilities, Public Safety, Law Enforcement, Fire and Emergency Services Facilities,
and Streets and Transportation Facilities Bonds
20% Constitutional Limitation $3,218,461,665Direct General Obligation Bonds Outstanding(1) (1,241,159,070)
Unused 20% Limitation Borrowing Capacity $1,977,302,595
All Other General Obligation Bonds
6% Constitutional Limitation $965,538,499Direct General Obligation Bonds Outstanding $390,645,000(1)
Less: Principal Redemption Funds held in Restricted Fund as of April 1, 2010 (341,232,663)
Direct General Obligation Bonds Outstanding (49,412,337)
Unused 6% Limitation Borrowing Capacity $916,126,162
(1)Represents general obligation bonds outstanding as of March 1, 2011.
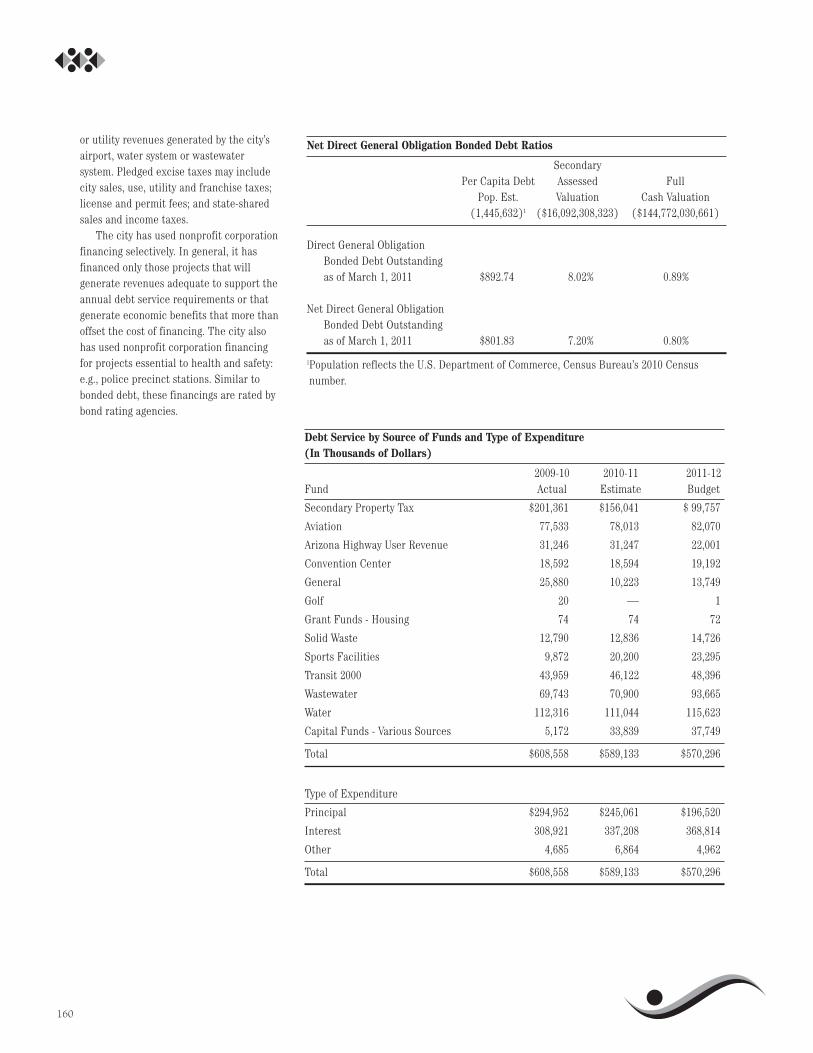
or utility revenues generated by the city’sairport, water system or wastewatersystem. Pledged excise taxes may includecity sales, use, utility and franchise taxes;license and permit fees; and state-sharedsales and income taxes.
The city has used nonprofit corporationfinancing selectively. In general, it hasfinanced only those projects that willgenerate revenues adequate to support theannual debt service requirements or thatgenerate economic benefits that more thanoffset the cost of financing. The city alsohas used nonprofit corporation financingfor projects essential to health and safety:e.g., police precinct stations. Similar tobonded debt, these financings are rated bybond rating agencies.
160
Debt Service by Source of Funds and Type of Expenditure(In Thousands of Dollars)
2009-10 2010-11 2011-12Fund Actual Estimate Budget
Secondary Property Tax $201,361 $156,041 $ 99,757
Aviation 77,533 78,013 82,070
Arizona Highway User Revenue 31,246 31,247 22,001
Convention Center 18,592 18,594 19,192
General 25,880 10,223 13,749
Golf 20 — 1
Grant Funds - Housing 74 74 72
Solid Waste 12,790 12,836 14,726
Sports Facilities 9,872 20,200 23,295
Transit 2000 43,959 46,122 48,396
Wastewater 69,743 70,900 93,665
Water 112,316 111,044 115,623
Capital Funds - Various Sources 5,172 33,839 37,749
Total $608,558 $589,133 $570,296
Type of Expenditure
Principal $294,952 $245,061 $196,520
Interest 308,921 337,208 368,814
Other 4,685 6,864 4,962
Total $608,558 $589,133 $570,296
Net Direct General Obligation Bonded Debt Ratios
SecondaryPer Capita Debt Assessed Full
Pop. Est. Valuation Cash Valuation(1,445,632)1 ($16,092,308,323) ($144,772,030,661)
Direct General Obligation Bonded Debt Outstanding as of March 1, 2011 $892.74 8.02% 0.89%
Net Direct General Obligation Bonded Debt Outstanding as of March 1, 2011 $801.83 7.20% 0.80%
1Population reflects the U.S. Department of Commerce, Census Bureau’s 2010 Censusnumber.

The Capital Improvement Program is afive-year plan for capital expendituresneeded to replace, expand and improveinfrastructure and systems. Other planningprocesses, the most significant of whichare explained in this section, identify theneed and provide funding for capitalprojects and related operating costs.
On April 5, 2011, the City Councilreviewed the Preliminary 2011-16 CapitalImprovement Program and forwarded the2006 bond-funded portion for review andconsideration by the 2006 BondCommittee. The bond committee met onApril 20 and reviewed property taxassessed valuation results, the status ofbond sales, current property tax and bondpolicies and the general obligation bond-funded portion of the Preliminary CapitalImprovement Program.
The Capital Improvement Programreflected here includes the preliminaryplan presented to Council in April updatedfor project cost and timing changes, plusthe addition of several projects that hadbeen reflected as operating expendituresthat were determined to moreappropriately belong in the capital budget.
2011-16 Capital Improvement Program Development
The annual citywide Capital ImprovementProgram update process began in January2011 when departments prepared revised2010-11 estimates and updated their five-year capital improvement programs. The2010-11 estimates reflect updatedconstruction cost estimates, project delays,awarded contract amounts, project carry-overs and other program changes. The2011-16 program includes projects plannedfor authorized bond funding and the latestestimates for pay-as-you-go projectsfunded with operating funds, federal funds,impact fees and other sources. Alsoincluded are net new operating costsand/or savings. Budget and Research staffreviewed the departments’ programs forfunding availability, reasonableness andtechnical accuracy.
Presented in this citywide program areprojects reviewed and adopted throughseveral planning processes. These includecapital projects funded through the mostrecently adopted multi-year rate plans forenterprise funds such as Water,Wastewater and Solid Waste, and fromother planning processes including thefive-year Arterial Streets Plan,infrastructure financing plans for impactfees and various multi-year facilitymaintenance plans. Also reflected arecapital projects from sales tax and voter-approved 2006 Bond Program.
In conjunction with the CIP process,the Engineering and ArchitecturalServices Division works with departmentsto level design and construction bid awarddates evenly throughout the fiscal year. Byavoiding bidding capital projects duringthe last quarter of the fiscal year, the cityhas controlled construction costs andincreased project quality by making betteruse of locally available constructionresources.
2006 Citizens’ Bond Committee Program
Voter-approved bond authorizations are themajor funding source for the generalgovernment portion of the CapitalImprovement Program. The city generallyseeks new voter-approved programs onfive-year cycles. Consistent with thatplanning cycle, a Citizens’ BondCommittee process was initiated by theCity Council in June 2005. More than 700community volunteers were appointed bythe City Council to serve on 17 bondsubcommittees to help shape the program.
Two of the committees evaluated thecity’s capacity to service new debt and tofund the operating costs of new capitalfacilities. These committees reviewedmulti-year forecasts for assessed valuationand property tax levies, and for GeneralFund revenues and expenses. Theyrecommended annual bond and operatingcost capacities before 14 service-relatedcommittees began their work to evaluatefive-year capital facility needs identified bycity departments as well as capital projectfunding requests by community nonprofitorganizations. Through the work of thesesubcommittees, the Citizens’ BondCommittee recommended nearly 200capital projects to the City Council.
The City Council formed the $878.5million in projects into seven propositionsall of which were approved by the voters inMarch 2006. Consistent with past practiceto continue community oversight, the 2006Bond Committee met on April 20, 2011, toreview current policies and the 2006 bond-funded portion of the 2011-16 CapitalImprovement Program. Theyrecommended approval of the updatedplan presented.
Overview of Capital Improvement Program Process
161

Enterprise Funds
Fees for the Water, Wastewater and SolidWaste enterprise funds are billed tocustomers on a single billing. As a result,all three of these enterprise fundscomplete annual updates to their multi-year rate plans on a similar timeline.These plans are first reviewed by the CityCouncil Transportation, Infrastructure andSustainability Subcommittee prior toaction on the plans by the full CityCouncil. Bond and pay-as-you-go fundedcapital projects, debt service, andoperating and maintenance costs ofexisting services and planned capitalprojects are all provided for in these multi-year rate plans. User fee rate changes aretypically implemented in March of eachyear to support the updated plans. ThePhoenix Convention Center enterprisefund receives most of its resources fromearmarked sales taxes. To support asignificant expansion and renovation of thePhoenix Convention Center, an extensivemulti-year forecast was developed toestablish pay-as-you-go, bond and relateddebt service, and operations andmaintenance cost capacities without a taxrate increase. The first and second phasesof the expansion are open for business.The second phase was completed inDecember 2008. The capital and financialplan was critical to securing $600 millionin bond funding split equally between thecity and state of Arizona to expand andmodernize the facility.
Capital Construction Funds
The Capital Construction fund wasestablished in 1998-99 and provides about$20 million each year for criticalinfrastructure improvements in the right ofway. Citizen input from a series of publicmeetings supported using these funds forneighborhood street rehabilitation,sidewalks and wheelchair ramps, trafficsafety and traffic calming projects, andneighborhood traffic mitigation projects.Funds are programmed in these projectcategories for each year of the CapitalImprovement Program. Individual projectswill be determined during the first year ofthe program based on traffic engineeringdata and neighborhood input.
Parks and Preserves Funds
In September 1999, the voters approved a10-year, one-tenth of one percent sales taxto purchase state trust lands for theSonoran Desert Preserve, and for thedevelopment and improvement of regionaland neighborhood parks. This tax wasrenewed by voters in May 2008 for 30 years.The 2011-16 Capital Improvement Programincludes $78.5 million of these funds,which are programmed for regional,community and neighborhood parks, andSonoran Preserve land acquisition. Landacquisitions are planned and timed to takeadvantage of state grant fundingopportunities.
Transit 2000 Funds
The voters approved Proposition 2000 onMarch 14, 2000. This initiative authorizeda four-tenths of one percent sales tax for aperiod of 20 years to implement the Transit2000 plan. The plan provides funding forlight rail, buses, right of wayimprovements, passenger facilities and
related operating costs. The 2011-16Capital Improvement Program includes$31.2 million of these funds, which areprogrammed for:
n Additional vehicles and upgrades toexisting vehicles ($1.0 million)
n New and expanded passenger andmaintenance facilities ($12.8 million)
n Bus pullouts, left-turn arrows andbicycle lanes ($4.6 million)
n Technology upgrades ($2.5 million)
n Light rail, bus rapid transit and relatedsupport services ($9.8 million)
n Contingencies ($0.5 million)
Five-Year Arterial Streets Plan
Each year the Street TransportationDepartment updates its five-year plan andfunding for major street and storm drainconstruction. This program is primarilyfunded through Arizona Highway UserRevenue (AHUR) including state-sharedrevenue from gas taxes and vehicle licensetaxes. The update begins with the Budgetand Research Department providing anupdated current year and five-year forecastof AHUR revenue, and requirements forAHUR to support operating expendituresand debt service to determine the amountsavailable for pay-as-you-go capital projects.Also included in the plan are any neededupdates to voter-approved bond projects aswell as funding sources from othergovernment agencies in projects such asflood control. The plan is then presentedto the Transportation, Infrastructure andSustainability Subcommittee beforeforwarding on to the City Council.
This preliminary program primarilyreflects the five-year Arterial Street planthat will be presented to the City Councilin June.
162

163
SUMMARY OF 2011-16 CAPITAL IMPROVEMENT PROGRAM(In Thousands of Dollars)
Source of Funds 2011-12 2012-13 2013-14 2014-15 2015-16 5-Year Total
Arts and Cultural Facilities $14,804 $1,828 $– $– $– $16,632
Aviation 435,812 125,513 57,339 43,878 55,372 717,914
Economic Development 10,254 19,019 4,000 4,000 4,000 41,273
Energy Conservation 17,747 8,468 1,000 1,000 1,000 29,215
Facilities Management 19,198 8,413 4,081 789 1,330 33,811
Fire Protection 21,140 13,973 – – – 35,113
Historic Preservation 2,759 2,591 434 – – 5,784
Housing 60,044 15,052 11,678 11,678 11,678 110,130
Human Services 2,857 12,188 – – – 15,045
Information Technology 14,254 12,277 8,703 7,940 7,200 50,374
Libraries 7,698 8,511 1,850 2,100 200 20,359
Neighborhood Services 11,786 6,211 – – – 17,997
Parks, Recreation and Mountain Preserves 99,758 46,267 1,000 1,000 1,000 149,025
Phoenix Convention Center 2,212 3,579 5,443 4,967 5,565 21,766
Police Protection 25,509 17,940 – – – 43,449
Public Transit 77,991 56,121 59,534 46,975 32,658 273,279
Solid Waste Disposal 29,244 7,020 15,785 17,050 10,050 79,149
Street Transportation and Drainage 155,265 146,716 77,804 85,874 82,201 547,860
Wastewater 107,163 58,961 110,541 45,464 135,595 457,724
Water 197,602 100,648 116,495 132,960 203,715 751,420
Total Operating Funds $1,313,097 $671,296 $475,687 $405,675 $551,564 $3,417,319
Programming of Impact Fees
In 1987, the City Council adopted anordinance requiring new development inthe city’s peripheral planning areas to payits proportionate share of the costsassociated with providing publicinfrastructure. An impact fee program wasdeveloped that is based on projectedinfrastructure requirements within severalplanning areas. Impact fees collected for aspecific planning area must be expendedfor capital infrastructure in the plan forthat area and may not be used for anyother purpose. In addition, impact fee-funded projects must directly benefit theparties that paid the fees.
Impact fee collections initiallyprogressed slowly because of a slowdownin construction in the late 1980s and early1990s. By 2004, impact fee collections hadexperienced strong growth. With thedownturn in the economy, impact feecollections have declined significantly.Since the revenue streams are dependenton what can be volatile developmentactivity, only impact fee revenues that havebeen collected are planned in the CapitalImprovement Program.
Operating costs for impact fee-fundedprojects are included in the rate planningprocess for Water, Wastewater and SolidWaste. Operating costs for the other
impact fee programs are identified in theCapital Improvement Program and arefunded through the annual operatingbudget as costs for operating andmaintaining new capital projects. Budgetand Research staff has worked with thePlanning and Development Department aswell as operating department staff toappropriately program $110.8 million inavailable impact fees in the 2011-16Preliminary Capital Improvement Program.Additional impact fees will be programmedin future capital improvement programs asthese fees are collected.

164
SUMMARY OF 2011-16 CAPITAL IMPROVEMENT PROGRAMBY SOURCE OF FUNDS
(In Thousands of Dollars)
Fund 2011-12 2012-13 2013-14 2014-15 2015-16 5-Year Total
Operating Funds:
General Funds $3,733 $5,492 $4,916 $4,874 $5,460 $24,475
Parks and Preserves 46,534 29,006 1,000 1,000 1,000 78,540
Transit 2000 16,426 5,711 3,530 2,985 2,522 31,174
Development Services 66 55 59 257 – 437
Capital Construction 26,250 18,229 18,759 19,305 19,872 102,415
Arizona Highway Users 44,485 36,400 63,541 60,625 61,231 266,282
Public Transit 8,766 7,028 4,048 7,603 5,215 32,660
Community Reinvestment 4,400 2,000 2,000 2,000 2,000 12,400
Community Development Block Grants (CDBG) 3,310 171 170 171 171 3,993
Other Restricted 16,140 10,750 10,500 10,500 10,500 58,390
Grant Funds 57,925 23,135 5,762 5,762 5,762 98,346
Enterprise Funds:
Aviation 54,721 33,492 19,426 15,356 15,650 138,645
Convention Center 2,167 2,285 3,272 2,732 3,335 13,791
Solid Waste 14,682 6,175 7,177 6,327 9,250 43,611
Wastewater 73,558 43,011 69,649 36,605 56,478 279,301
Water 113,158 65,424 104,283 127,650 107,967 518,482
Total Operating Funds $486,321 $288,364 $318,092 $303,752 $306,413 $1,702,942
Bond Funds:
Property Tax Supported:
1988 Various Purpose $669 $1,581 $– $– $– $2,250
1989 Historic Preservation 35 – – – – 35
2001 Various Purpose 5,813 14,223 100 1,900 – 22,036
2006 Various Purpose 107,608 138,411 5,080 – – 251,099
Nonprofit Corporation Bonds:
Aviation 35,279 6,238 482 – – 41,999
Convention Center – – – – – –
Solid Waste 4,277 170 4,825 10,500 – 19,772
Transit 2000 2,170 – – – – 2,170
Wastewater 12,564 3,529 7,923 2,319 47,275 73,610
Water 51,094 34,135 9,536 4,531 88,407 187,703
Other 10,255 500 – – – 10,755
Total Bond Funds $229,764 $198,787 $27,946 $19,250 $135,682 $611,429

165
SUMMARY OF 2011-16 CAPITAL IMPROVEMENT PROGRAM (continued)BY SOURCE OF FUNDS
(In Thousands of Dollars)
Fund 2011-12 2012-13 2013-14 2014-15 2015-16 5-Year Total
Other Capital Sources:
Impact Fees $84,182 $15,258 $3,908 $920 $6,580 $110,848
Passenger Facility Charge 321,300 69,364 14,462 8,813 15,313 429,252
Other Cities' Share -
SROG and Val Vista 11,145 6,032 35,621 7,178 33,103 93,079
Solid Waste Remediation 1,632 700 3,810 250 800 7,192
Capital Grants 103,975 53,404 48,393 59,568 52,574 317,914
Federal, State and
Other Participation 40,133 30,191 21,001 5,944 1,099 98,368
Private Participation – – – – – –
Capital Reserves 20,887 9,196 2,454 – – 32,537
Parks Capital Gifts 1,071 – – – – 1,071
Other Capital 12,687 – – – – 12,687
Total Other Capital Sources $597,012 $184,145 $129,649 $82,673 $109,469 $1,102,948
TOTAL $1,313,097 $671,296 $475,687 $405,675 $551,564 $3,417,319

166

The Capital Improvement Program (CIP)totals $3.4 billion over the next five years.As shown in the pie chart on this page,funding for the 2011-16 program comesfrom five main sources: $0.3 billion in1988, 1989, 2001 and 2006 voter-approvedbond funds, $1.6 billion in pay-as-you-gooperating funds, $0.3 billion in variousenterprise bonds, $0.1 billion in Transit2000 and Parks and Preserve Initiativefunds, and $1.1 billion in other funds. The$1.1 billion in other funds includes $93.1million in payments by other cities andagencies for participating in projects inprograms such as Water and Wastewater,$317.9 million in capital grants, $110.8million in development impact fees, $429.3million in passenger facility charges, $98.4million in government and otherparticipation, $32.5 million in capitalreserves, $7.2 million in Solid Wasteremediation funding and $13.7 millionfrom miscellaneous capital sources.
Projects in the first year total $1.3billion and are funded from pay-as-you-gooperating funds ($486.3 million), bondfunds ($229.8 million) and other capitalfinancing ($597.0 million). A financialorganization chart at the end of thissection presents a visual overview of thefirst year by source of funds and additionalschedules summarize the 2011-12 CapitalBudget by source of funds and the 2011-12Capital Improvement Program by fundgroup and program. A brief overview ofthe five-year plan for each programfollows.
Arts and Cultural Facilities
The $16.6 million Arts and CulturalFacilities program is funded with 2001 and2006 bonds. The following projects areplanned for bond funding:
n Renovate a facility for the ArizonaOpera
n Renovate a facility for the BlackTheatre Troupe
n Complete renovation and expansion ofthe Phoenix Theatre
n Renovate a facility for Ballet Arizona
Aviation
The Aviation program totals $717.9 millionand includes projects for Phoenix SkyHarbor International Airport and twosatellite airports, Phoenix Deer Valley andPhoenix Goodyear. The Aviation program isfunded with Aviation operating revenue,federal grant funds, Aviation nonprofitcorporation bonds and Passenger FacilityCharge funds.
Major improvements for Sky HarborInternational Airport include the following:
n Develop and manage airportinfrastructure
n Construct the PHX Sky Train™ system
n Construct roadway, runway and taxiwayimprovements
n Acquire and maintain properties for theCommunity Noise Reduction Program
n Implement various developmentstudies and services
n Rehabilitate Terminal 4 includingrebuilding moving walkways, food andbeverage tenant space improvements,pavement reconstruction and restroomremodeling
2011-16 Capital Improvement Program Highlights
167
EnterpriseBonds
$0.3 Billion
Property Tax Bonds$0.3 Billion
Pay-As-You-Go$1.6 Billion
Transit 2000 andParks and Preserves
$0.1 Billion
Other$1.1 Billion
2011-16 Preliminary Capital Improvement ProgramSources of Funds
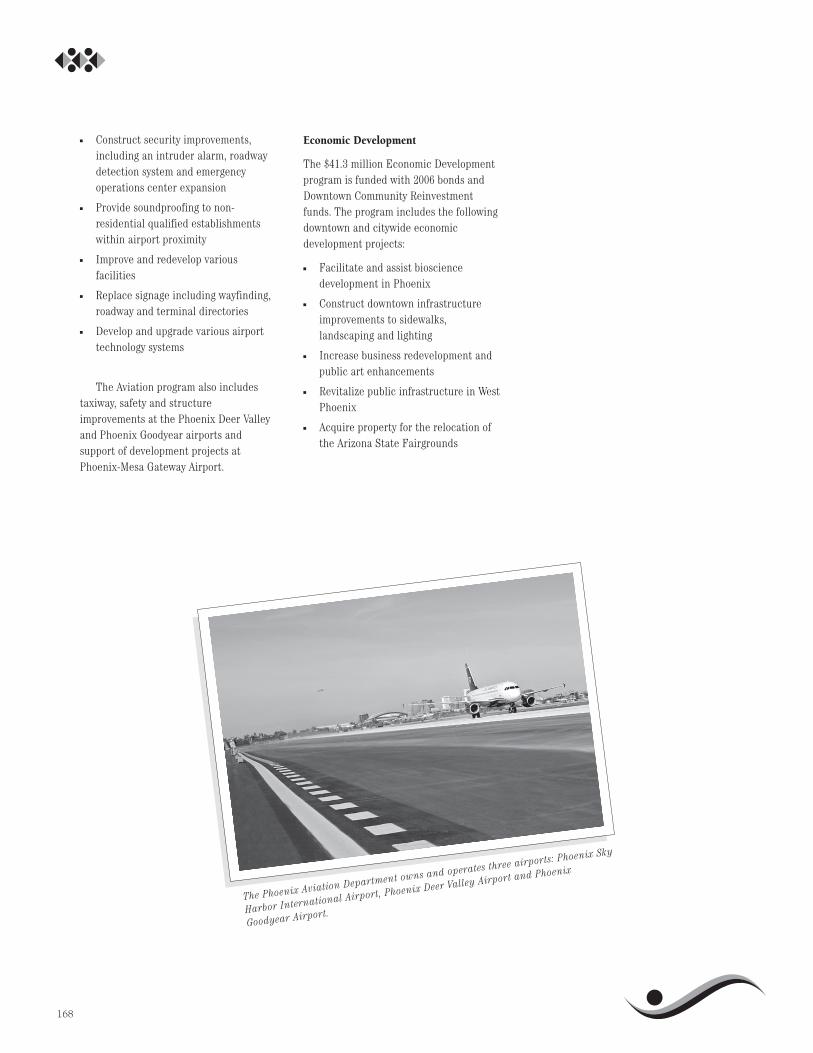
n Construct security improvements,including an intruder alarm, roadwaydetection system and emergencyoperations center expansion
n Provide soundproofing to non-residential qualified establishmentswithin airport proximity
n Improve and redevelop variousfacilities
n Replace signage including wayfinding,roadway and terminal directories
n Develop and upgrade various airporttechnology systems
The Aviation program also includestaxiway, safety and structureimprovements at the Phoenix Deer Valleyand Phoenix Goodyear airports andsupport of development projects atPhoenix-Mesa Gateway Airport.
Economic Development
The $41.3 million Economic Developmentprogram is funded with 2006 bonds andDowntown Community Reinvestmentfunds. The program includes the followingdowntown and citywide economicdevelopment projects:
n Facilitate and assist biosciencedevelopment in Phoenix
n Construct downtown infrastructureimprovements to sidewalks,landscaping and lighting
n Increase business redevelopment andpublic art enhancements
n Revitalize public infrastructure in WestPhoenix
n Acquire property for the relocation ofthe Arizona State Fairgrounds
168
The Phoenix Aviation Department owns and operates three airports: Phoenix Sky
Harbor International Airport, Phoenix Deer Valley Airport and Phoenix
Goodyear Airport.

Energy Conservation
The $29.2 million Energy ConservationProgram is funded with General, Water andWastewater operating funds. This programincludes capital projects to continue thecity's energy conservation efforts and alsoincludes energy efficient retrofit costreduction efforts at various city facilities.
The city's Energy ConservationProgram has been in place for more than20 years. Through the program's efforts inaddressing energy efficient retrofits,energy efficient design and management,metering for efficient operations andimplementation of new technology, firstyear annualized cost savings average$250,000.
Energy saving retrofits have beencompleted for lighting, heating,ventilation, air conditioning and controlsystems. American Recovery andReinvestment funds will be usedextensively to make city facilities moreenergy efficient.
Facilities Management
The Facilities Management program totals$33.8 million and is funded with 2001bonds, 2006 bonds, nonprofit corporationbonds, general funds, impact fees andother restricted funds. The followingprojects are planned for 2001 and 2006bond funding:
n Replace critical facility and supportsystems in Phoenix City Hall andPersonnel Building
n Reconfigure Phoenix City Hall toincrease work space efficiency
Also included in the program is fundingfor remediation of contaminated soil fromleaking underground storage tanks.Planned uses of general funds andnonprofit corporation bonds include majorfacility repairs and maintenance forservice centers, maintenance shops andoffice buildings according to the facilitymanagement plan.
Fire Protection
The $35.1 million Fire Protection programis funded with impact fees, nonprofitcorporation bonds, 2001 and 2006 bonds.The following fire stations are planned forbond funding:
Fire Station Construction
n New Station 55 near the borders of theDeer Valley and North Gateway villagesalong the I-17 corridor
n New Station 59 in Estrella Village
n New Station 74 in west AhwatukeeFoothills
The following firefighter training andtechnology projects are also included forbond funding:
n Study and pilot new firecommunication technology
n Design and construct a Dispatch andEmergency Operations Center
169
The Phoenix Fire Department is one of the busiest fire departments in the
U.S. Phoenix currently has 57 fire stations, 8 battalions, 65 engine
companies, 14 ladder companies and 32 rescue companies.

Historic Preservation
The Historic Preservation program totals$5.8 million and is funded with federal andstate grant funds, 1989, 2001 and 2006bonds. The following projects are planned:
n Provide grants for low incomehomeowners to complete exteriorrehabilitation work on their homes
n Acquire and rehabilitate threatenedhistoric buildings citywide
n Provide matching grants for residentialand commercial historic propertyowners to rehabilitate historicproperties in exchange for conservationeasements
n Provide funds to rehabilitate city-owned historic buildings and facilities
Housing
The Housing program totals $110.1 millionand is funded with CommunityDevelopment Block Grant (CDBG) funds,2006 bonds and public housing federalgrant funds.
Housing projects using 2006 bond fundsinclude:
n Acquire and expand city-ownedproperties for affordable housing
n Provide a new loan program to increaseaffordable properties
n Install air conditioning units in publichousing to replace obsolete evaporativecoolers
170
The city’s Housing Department offers various housing programs that provide
homes to more than 25,000 Phoenix residents.
Nonprofit projects using 2006 bond fundsinclude:
n Provide funding for construction of theUnited Methodist Outreach MinistriesNew Day Center homeless shelter forfamilies
Modernization projects for publichousing units are proposed based on theavailability of grant funds. City Councilapproved allocations of CommunityDevelopment Block Grant funds also areprogrammed.

Human Services
The $15.0 million Human Services programis funded with 2001 and 2006 bonds andprovides for design and construction of theSouthwest Family Services Center, the 51stAvenue Senior Center, and the purchase ofland for the 16th Street Senior Center.
In addition, there is one nonprofit project:
n Native American Connections Businessand Cultural Center
171
Information Technology
The $50.4 million Information Technologyprogram is funded with 2006 bonds;nonprofit corporation bonds; Water,Wastewater, Solid Waste Disposal andAviation revenues; general funds and otherrestricted funds. Projects planned for 2006bond funding include the following:
n Acquire electronic equipment toprovide improved customer service
n Establish and equip an alternateinformation technology operationscenter to ensure business continuity
n Deploy voice/data convergence-readyequipment to upgrade and enhancestaff connectivity
n Improve the city’s GeographicInformation System
Libraries
The Libraries program totals $20.4 millionand is funded with 2001 and 2006 bonds,impact fees, library revenue, federal grants,and general funds. Projects planned for2001 and 2006 bond funding include thefollowing:
n Complete construction of SouthMountain Regional Branch Library
n Acquire land for a west AhwatukeeBranch Library
n Complete the replacement of PaloVerde Branch Library
n Complete improvements to IronwoodBranch Library
n Replace the central heating and coolingsystem at Burton Barr Library
n Complete library technologyimprovements
Impact fees are included to acquireland for a west Ahwatukee Branch Library,to design a new library in the Desert Viewarea, and to partially fund the design andconstruction of an Estrella Branch Library.Federal grants and general funds areproposed to construct a Workforce LiteracyCenter at Ocotillo Branch Library.
Phoenix Public Library’s mission is to connect today’s community to a world of
possibilities.
Neighborhood Services
The Neighborhood Services program totals$18.0 million and is funded with federalgrants, Community Development BlockGrant (CDBG) funds and 2006 bonds.
Proposed projects include the following:
n Purchase and redevelop foreclosedproperties to assist with neighborhoodstabilization
n Partner with the community and othercity departments to address criticalneighborhood projects and blightelimination
n Acquire property and providedevelopment incentives for blightelimination and revitalization
n Construct neighborhood infrastructuresuch as sidewalks, lighting, alleyimprovements and landscaping toenhance aging neighborhoods
Parks, Recreation and Mountain Preserves
The Parks, Recreation and MountainPreserves program totals $149.0 millionand is funded with nonprofit corporationbonds, 2001 and 2006 bonds, parksmonopole sites revenue, impact fees,grants, Parks and Preserves Initiative andother restricted funds. The programprovides for acquisition and developmentof new park sites, preserves, specialtyareas and improvements to existing parks.
The following major projects are plannedfor 2001 and 2006 bond funds:
n Construct, improve and renovate parkscitywide
n Acquire land for neighborhood mini-park sites
n Renovate aquatics facilities citywide
n Renovate and construct park upgradesto comply with the Americans withDisabilities Act
n Construct La Pradera CommunityCenter
n Design and renovate the PhoenixCenter for the Arts
Parks and Preserves projects includeimprovements to community andneighborhood parks and land for theSonoran Preserve. Impact fees areincluded to acquire and develop park sitesin the Ahwatukee, Deer Valley, DesertView, Estrella, Laveen and North Gatewayareas, and to acquire open space preserveland in the northern areas. Parksmonopole sites revenue is included to addamenities to parks with monopole sites.
Phoenix Convention Center
The $21.8 million Phoenix ConventionCenter program is funded with ConventionCenter operating revenue, 2001 and 2006bonds, and general funds. In addition tothe Convention Center, this programincludes projects and improvements forthe Herberger and Orpheum Theaters,Symphony Hall plus the Regency, Heritageand Convention Center parking garages.
172

Police Protection
The Police Protection program totals $43.4million and is funded with 2006 bonds. Thefollowing projects are planned:
n Design and construct aircraft hangarfacilities at the Deer Valley Airport
n Acquire land for a new northwestprecinct
n Upgrade or replace the PoliceAutomated Computer Entry (PACE)System
n Renovate buildings for use as theCactus Park Precinct
Public Transit
The $273.3 million Public Transit programis funded with Transit 2000 revenue,regional transportation revenue includingthe half-cent countywide sales tax, Transitnonprofit corporation bonds, ArizonaHighway User Revenue, capitalconstruction and grants from varioussources.
Phoenix voters approved Transit 2000,a 0.4 percent sales tax, on March 14, 2000,to fund extensive improvements to thecity’s public transit system. Projects in thePublic Transit program include thefollowing:
n Acquire buses and purchase Dial-a-Ride replacement vans
n Improve and maintain bus stops, park-and-ride locations and transit centers
n Renovate, refurbish and equip Northand South maintenance facilities
n Implement technology enhancementsincluding a wireless communicationsystem for the regional bus system
n Acquire land and plan for future lightrail northwest extension
n Develop Desert Sky, East Baseline andLaveen/59th Avenue park-and-ridefacilities
Solid Waste Disposal
The $79.1 million Solid Waste Disposalprogram includes projects at the city’sopen landfill, closed landfills and transferstations, and is funded with Solid Wasterevenue, Solid Waste Remediation fundsand nonprofit corporation bond funds.Projects planned in the Solid Wasteprogram include:
n Monitor and maintain methane gasextraction systems, cell lining andcapping, and install landscaping at theclosed Skunk Creek Landfill
n Monitor and maintain methane gasextraction systems and cell lining atthe State Route 85 Landfill
n Maintain soil capping and the methanegas collection system at the closed 19thAvenue Landfill
n Monitor groundwater and methane gasand install landscaping at the closed27th Avenue Landfill
173

Street Transportation and Drainage
The Street Transportation and Drainageprogram totals $547.9 million and isfunded with Arizona Highway UserRevenues, 2006 bonds, CapitalConstruction funds and participation fromother agencies. Included in the programare major street, storm drainage, trafficimprovement and other streetmaintenance and improvement projects.
Major street and storm drainage projectsfor 2006 bond funding include:
n Construct a bridge at Riverview Drivebetween 18th and 22nd streets
n Expand city of Phoenix wirelessnetwork for connections to on-streetdevices for traffic signal coordination
n Construct Camelback Corridorimprovements
n Construct improvements to 32nd Streetfrom Washington Street to McDowellRoad
n Construct a downtown storm drainrelief system
n Construct landscape and streetscapeimprovements in the West PhoenixRevitalization Area
n Construct historic districts streetscapeimprovements
n Design and construct traffic calminginfrastructure
n Storm drain rehabilitation
n Construction local drainageimprovements
n Construct phase II of the IntelligentTransportation System (ITS) fiberoptic backbone
n Design and partially construct adrainage system along Arcadia Drivefrom Indian School and Camelbackroads, and along Lafayette Boulevardfrom Arcadia Drive to 44th Street
Major street projects for AHUR fundinginclude the following projects:
n Construct one mile of major street atLower Buckeye Road from 43rd to 35thavenues
n Design, acquire right-of-way, andconstruct one mile of major street atBuckeye Road from 7th to 16th streets
n Construct one and a half miles of majorstreet on Seventh Avenue fromSouthern Avenue to the Salt River
n Design, acquire right-of-way andconstruct one mile of major street atBaseline Road from 59th to 51stavenues
n Design, acquire right-of-way andconstruct one mile of major street at64th Street from Utopia to the Loop 101
n Implement safety enhancements in thereverse lane corridor
n Construct one mile of major street atPinnacle Peak Road from 43rd to 35thavenues
n Construct one and a half miles of majorstreet at Pinnacle Peak Road from 55thto 43rd avenues
n Construct one mile of major street at35th Avenue from Baseline Road toSouthern Avenue
n Construct 7.5 miles of major street andbridges at Sonoran Boulevard (includesfunding from state and local aid)
n Acquire land, design and constructBlack Mountain Parkway ramps to theState Route 51 (includes funding fromfederal aid)
n Complete the design, acquire land andconstruct Avendia Rio Salado Parkway(includes funding from federal aid)
n Construct one mile of major street at43rd Avenue from Lower Buckeye toBuckeye roads
n Construct a mile of major street at 75thAvenue from Lower Buckeye toBuckeye roads
n Construct one mile of major street at56th Street from Deer Valley toPinnacle Peak roads
n Construct a mile of major street at32nd Street from Southern Avenue toBroadway Road
n Construct a mile of major street atBuckeye Road from 67th to 59thavenues
n Construct a mile of major street atLower Buckeye Road from 51st to 43rdavenues
n Construct a bridge at GreenwayParkway and Cave Creek Wash
n Retrofit landscaping on existing majorstreets
n Major street overlay
n Major street slurry seal and crack seal
Capital Construction funding is plannedfor the following types of projects:
n Local paving and drainage projects
n Residential street resurfacing
n Landscaping along freeways
n Sidewalks
n Sidewalk ramps
n Dust control
n Traffic calming
174
Wastewater
The Wastewater program totals $457.7million and is funded with Wastewateroperating revenue, Wastewater nonprofitcorporation bonds, impact fees and othercities' share in joint ventures funds.
Major Wastewater projects include thefollowing:
n Expand 91st Avenue WastewaterTreatment Plant
n Repair and replace wastewatertreatment plant equipment
n Study, design and construct theRegional Capacity Management Facility
n Construct relief sewers citywide
n Expand, improve and replace sewer liftstations
n Construct parallel sections of theBroadway Sewer from 32nd Street to51st Avenue to provide additionalcapacity
n Rehabilitate selected sewers of varioussizes and materials located throughoutthe city
n Improve technology includingautomatic meter reading
n Construct pump station
n Various Wastewater managementstudies, security improvements, staffcharges and consultant fees
n Construct a Wastewater collectionmaintenance yard
n Design the Tres Rios Flood Control andEcosystem Restoration
Water
The $751.4 million Water program isfunded with Water operating revenue,nonprofit corporation bonds, impact feesand city of Mesa participation in the ValVista Water Treatment Plant joint venture.
Major projects include the following:
n Acquire and construct new wells andrehabilitate existing wells
n Construct new reservoirs, andrehabilitate existing reservoirs andbasins
n Rehabilitate existing booster stations
n Complete construction of a granulatedactivated carbon regeneration facilityat Val Vista Water Treatment Plant
n Replace and rehabilitate the Val VistaTransmission Main from the Val VistaWater Treatment Plant to 48th Street
n Rehabilitate the Val Vista WaterTreatment Plant
n Design and construct a joint sludgedewatering facility for Union HillsWater Treatment Plant and Cave CreekWater Reclamation Plant
n Construct treatment optimizationstrategies, process control efficiencyimprovements and implement plantequipment rehabilitation at Cave CreekWater Reclamation Plant, 24th Street,Union Hills and Deer Valley WaterTreatment Plants
n Construct production improvements towater treatment plants, reservoirs,wells and booster stations such astreatment processes, chemicalfacilities, equipment and facilityimprovements
n Install new service meters andconstruct plumbing connections foralley service relocations
n Repair and replace leaking waterservices
n Construct water main improvementsrecommended in the integrity studyand rehabilitate existing mainscitywide
n Construct new mains in growth areas
n Relocate water lines for light railnorthwest extension
n Inspect and assess 260 miles of 42-inchand larger water transmission mains
n Design and construct new water mainsand install new fire hydrants in theGarfield Neighborhood (7th to 16thstreets and Van Buren to Rooseveltstreets)
n Acquire and install software andhardware to automate meter reading
n Conduct various water system studies
n Construct security upgrades at remotefacilities
175
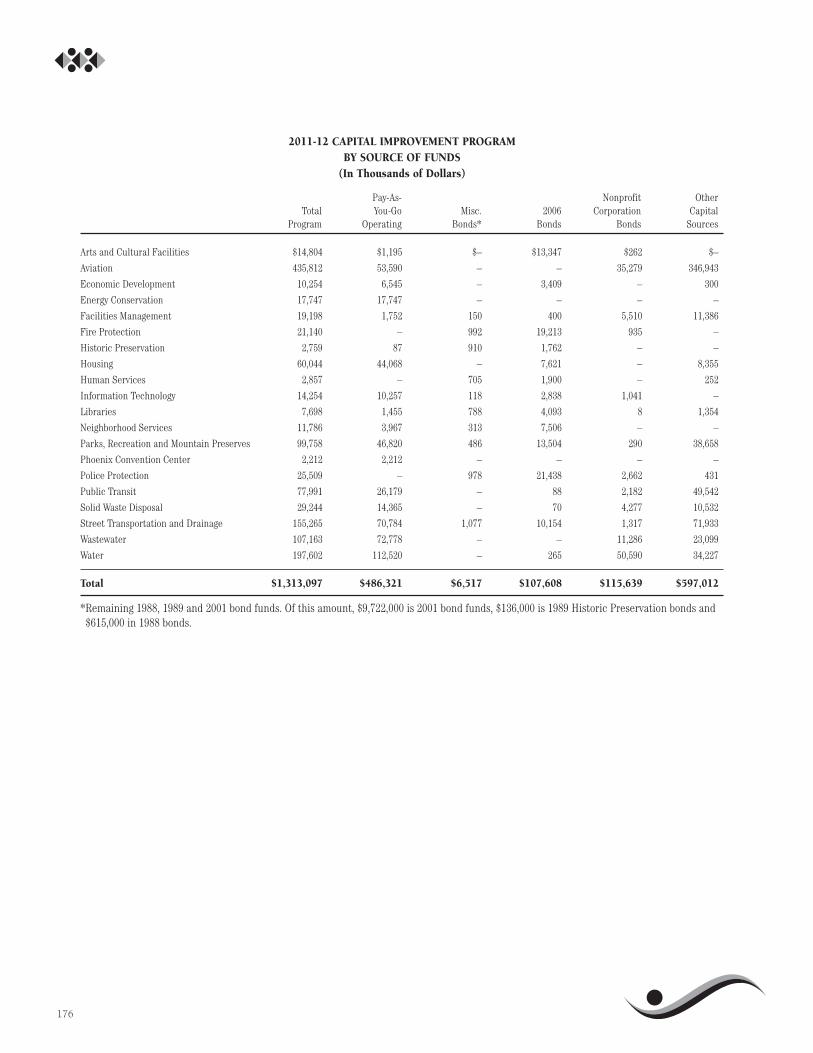
176
2011-12 CAPITAL IMPROVEMENT PROGRAMBY SOURCE OF FUNDS
(In Thousands of Dollars)
Arts and Cultural Facilities $14,804 $1,195 $– $13,347 $262 $–
Aviation 435,812 53,590 – – 35,279 346,943
Economic Development 10,254 6,545 – 3,409 – 300
Energy Conservation 17,747 17,747 – – – –
Facilities Management 19,198 1,752 150 400 5,510 11,386
Fire Protection 21,140 – 992 19,213 935 –
Historic Preservation 2,759 87 910 1,762 – –
Housing 60,044 44,068 – 7,621 – 8,355
Human Services 2,857 – 705 1,900 – 252
Information Technology 14,254 10,257 118 2,838 1,041 –
Libraries 7,698 1,455 788 4,093 8 1,354
Neighborhood Services 11,786 3,967 313 7,506 – –
Parks, Recreation and Mountain Preserves 99,758 46,820 486 13,504 290 38,658
Phoenix Convention Center 2,212 2,212 – – – –
Police Protection 25,509 – 978 21,438 2,662 431
Public Transit 77,991 26,179 – 88 2,182 49,542
Solid Waste Disposal 29,244 14,365 – 70 4,277 10,532
Street Transportation and Drainage 155,265 70,784 1,077 10,154 1,317 71,933
Wastewater 107,163 72,778 – – 11,286 23,099
Water 197,602 112,520 – 265 50,590 34,227
Total $1,313,097 $486,321 $6,517 $107,608 $115,639 $597,012
*Remaining 1988, 1989 and 2001 bond funds. Of this amount, $9,722,000 is 2001 bond funds, $136,000 is 1989 Historic Preservation bonds and$615,000 in 1988 bonds.
Total Program
Pay-As-You-Go
OperatingMisc.
Bonds*2006
Bonds
NonprofitCorporation
Bonds
OtherCapital
Sources
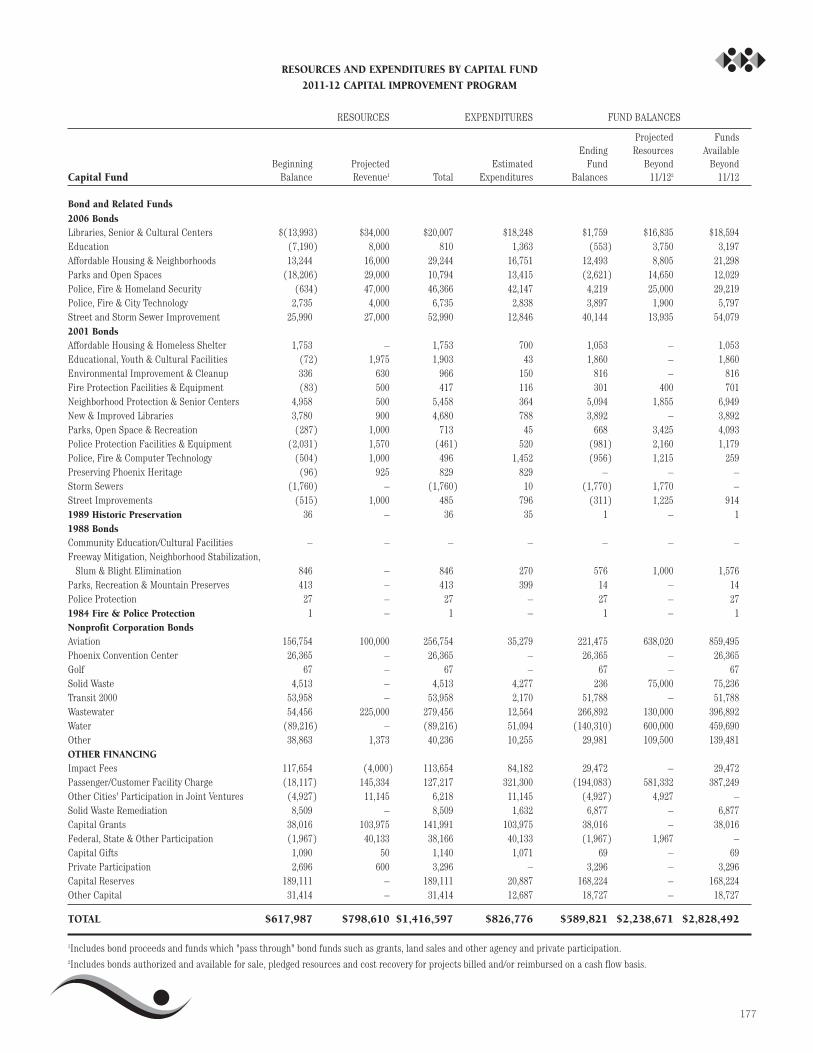
177
RESOURCES AND EXPENDITURES BY CAPITAL FUND
2011-12 CAPITAL IMPROVEMENT PROGRAM
RESOURCES EXPENDITURES FUND BALANCES
Projected FundsEnding Resources Available
Beginning Projected Estimated Fund Beyond BeyondCapital Fund Balance Revenue1 Total Expenditures Balances 11/122 11/12
Bond and Related Funds
2006 BondsLibraries, Senior & Cultural Centers $(13,993) $34,000 $20,007 $18,248 $1,759 $16,835 $18,594Education (7,190) 8,000 810 1,363 (553) 3,750 3,197 Affordable Housing & Neighborhoods 13,244 16,000 29,244 16,751 12,493 8,805 21,298Parks and Open Spaces (18,206) 29,000 10,794 13,415 (2,621) 14,650 12,029Police, Fire & Homeland Security (634) 47,000 46,366 42,147 4,219 25,000 29,219Police, Fire & City Technology 2,735 4,000 6,735 2,838 3,897 1,900 5,797Street and Storm Sewer Improvement 25,990 27,000 52,990 12,846 40,144 13,935 54,079 2001 BondsAffordable Housing & Homeless Shelter 1,753 – 1,753 700 1,053 – 1,053Educational, Youth & Cultural Facilities (72) 1,975 1,903 43 1,860 – 1,860Environmental Improvement & Cleanup 336 630 966 150 816 – 816Fire Protection Facilities & Equipment (83) 500 417 116 301 400 701Neighborhood Protection & Senior Centers 4,958 500 5,458 364 5,094 1,855 6,949New & Improved Libraries 3,780 900 4,680 788 3,892 – 3,892Parks, Open Space & Recreation (287) 1,000 713 45 668 3,425 4,093Police Protection Facilities & Equipment (2,031) 1,570 (461) 520 (981) 2,160 1,179Police, Fire & Computer Technology (504) 1,000 496 1,452 (956) 1,215 259Preserving Phoenix Heritage (96) 925 829 829 – – –Storm Sewers (1,760) – (1,760) 10 (1,770) 1,770 –Street Improvements (515) 1,000 485 796 (311) 1,225 914 1989 Historic Preservation 36 – 36 35 1 – 11988 BondsCommunity Education/Cultural Facilities – – – – – – –Freeway Mitigation, Neighborhood Stabilization,
Slum & Blight Elimination 846 – 846 270 576 1,000 1,576Parks, Recreation & Mountain Preserves 413 – 413 399 14 – 14Police Protection 27 – 27 – 27 – 271984 Fire & Police Protection 1 – 1 – 1 – 1Nonprofit Corporation BondsAviation 156,754 100,000 256,754 35,279 221,475 638,020 859,495Phoenix Convention Center 26,365 – 26,365 – 26,365 – 26,365Golf 67 – 67 – 67 – 67Solid Waste 4,513 – 4,513 4,277 236 75,000 75,236Transit 2000 53,958 – 53,958 2,170 51,788 – 51,788Wastewater 54,456 225,000 279,456 12,564 266,892 130,000 396,892Water (89,216) – (89,216) 51,094 (140,310) 600,000 459,690Other 38,863 1,373 40,236 10,255 29,981 109,500 139,481 OTHER FINANCINGImpact Fees 117,654 (4,000) 113,654 84,182 29,472 – 29,472Passenger/Customer Facility Charge (18,117) 145,334 127,217 321,300 (194,083) 581,332 387,249Other Cities' Participation in Joint Ventures (4,927) 11,145 6,218 11,145 (4,927) 4,927 –Solid Waste Remediation 8,509 – 8,509 1,632 6,877 – 6,877Capital Grants 38,016 103,975 141,991 103,975 38,016 – 38,016Federal, State & Other Participation (1,967) 40,133 38,166 40,133 (1,967) 1,967 –Capital Gifts 1,090 50 1,140 1,071 69 – 69Private Participation 2,696 600 3,296 – 3,296 – 3,296Capital Reserves 189,111 – 189,111 20,887 168,224 – 168,224Other Capital 31,414 – 31,414 12,687 18,727 – 18,727
TOTAL $617,987 $798,610 $1,416,597 $826,776 $589,821 $2,238,671 $2,828,492
1Includes bond proceeds and funds which "pass through" bond funds such as grants, land sales and other agency and private participation. 2Includes bonds authorized and available for sale, pledged resources and cost recovery for projects billed and/or reimbursed on a cash flow basis.

178

179
2011-12 Capital Improvement Program$1,313,097,000
Impact Fees$84,182,000
Capital Grants$103,975,000
Other Cities’Participation$11,145,000
PassengerFacility Charge
$321,300,000
Other Agency andPrivate Participation
$41,204,000
Solid WasteRemediation
$1,632,000
Other Capital$12,687,000
Capital Reserves$20,887,000
General Fund$3,733,000
Parks and Preserves$46,534,000
Transit 2000$16,426,000
Capital Construction$26,250,000
Arizona HighwayUser Revenue$44,485,000
CommunityReinvestment
$4,400,000
Other Restricted$19,450,000
Public Transit$8,766,000
Grant$57,925,000
Aviation$54,721,000
Wastewater$73,558,000
Water$113,158,000
Solid Waste$14,682,000
Development Services$66,000
Convention Center$2,167,000
BOND FUNDS$229,764,000
OTHER CAPITAL$597,012,000
OPERATING FUNDS$486,321,000
2006 G.O.Various Purpose
$107,608,000
2001 G.O.Various Purpose
$5,813,000
Solid Waste$4,277,000
Aviation$35,279,000
1988 G.O.Various Purpose
$669,000
Transit 2000$2,170,000
1989 G.O.Various Purpose
$35,000
Wastewater$12,564,000
Other Bonds$10,255,000
Water$51,094,000
2011-12 Capital Improvement Program Organizational Chart

180
181
Capital facilities include the police andfire stations, senior centers, parks,swimming pools, libraries, culturalfacilities and customer service centersneeded to deliver services to our residents.Capital improvements also includeinvestment in commercial andneighborhood development, redevelopmentand revitalization. Since these types ofcapital projects are assets with a multi-year life, issuing bonded debt is anappropriate way to pay for these expenses,as it allows the initial costs to be repaidover the years the investment is used. Theservice delivery costs and day-to-dayoperating expenses such as staff salaries orsupplies are not capital assets. These costsare not funded with bonded debt and mustbe paid from the city's annual operatingfunds.
New Facilities Funding and TheirOperating Costs
In accordance with Bond Committeerecommendations, an annual 2 percentincrease to the maximum allowable primaryproperty tax levy is included to providefunding to operate new capital facilities. OnMarch 14, 2006, Phoenix voters approved an$878.5 million bond program. EstimatedGeneral Fund expenditures to operate thesebond funded projects are updated annually.For Enterprise Fund operations, multi-yearrate planning processes are used to providethe City Council with the effects new capitalfacilities will have on future rate-payers.That is, each year, the City Councilconsiders the impact of future capitalfacilities as it sets annual utility rates. Ratesare increased today to pay for tomorrow’sfacilities. Finally, for more than 20 years theenergy conservation program has generatedannual cost savings in excess of the fundsinvested. This program provides for energyefficient retrofits, energy efficient designand metering for efficient operations.
Identifying Operating Costs
Each fall, departments are asked to reviewall capital projects, their estimatedcompletion dates, any costs associatedwith operating new facilities and systems,and the funding source(s) for these costs.These costs are reviewed jointly by theBudget and Research, and Public Worksdepartments. The 2011-12 budget includes$8.8 million in new operating andmaintenance costs for new facilities andsystems. The funding sources for 2011-12operating costs include General and Waterfunds. The schedule on the next pageprovides project funding sources,operating and maintenance costs for 2011-12, along with the full-year operating andmaintenance costs for 2012-13, and thesource of funds that will be used for thesecosts.
Operating Costs for New Capital Facilities
OPERATING COSTS FOR NEW CAPITAL FACILITIES
Project and Construction # of 2011-12 2012-13Funding Source FTEs Costs Costs
FireFire Station #59 (2006 Police,Fire and Homeland SecurityBonds)
– Provide operating costs to open a new firestation located at 65th Avenue and BuckeyeRoad.
$133,000 $133,000
Helen Drake Senior Center(Arizona Department ofEnvironmental Quality Grant,2006 Libraries, Youth, Seniorand Cultural FacilitiesBonds)
1.8 Add staff and associated operating costs for thenew Helen Drake Senior Center, scheduled toopen in January 2012. This center replaces thesmaller Manzanita Senior Center, which was aleased facility.
$144,000 $354,000Human Services
182
City of Phoenix BranchLibrary at South MountainCommunity College (2001Bonds, 2006 Bonds)
19.5 Provide funding for staff, contractual servicesand commodities to operate the new branchlibrary at South Mountain Community Collegeopening in August 2011. The new 15,000-square-foot branch is part of an overall 49,000-square-foot facility built and operated in partnershipwith the Maricopa County Community CollegeDistrict.
$1,127,000 $1,236,000Library
New Sonoran PreserveAcreage (Parks CIP Grant,PPPI, PPPI 40% Mountain &Desert Preserves)
2.0 Add staff and funding to protect and maintain500 acres of new preserve property, and eightmiles of new trails, to be purchased inDecember 2011.
$171,000 $342,000Parks and Recreation
Downtown StreetscapeProjects (2006 StreetImprovement and StormwaterBonds)
— Add funding for contracted landscape andstreetlight maintenance and utility costs forcompleted streetscape projects. Costs in 2012-13 represent 12 months of operations.
$15,000 $51,000Street Transportation
Tovrea Castle Improvements(PPPI)
0.5 Add staff to maintain the landscaping,restrooms, temporary visitor center and parkinglot at Tovrea Castle opening in July 2011.
$28,000 $28,000
OPERATING COSTS FOR NEW CAPITAL FACILITIES (continued)
Project and Construction # of 2011-12 2012-13Funding Source FTEs Costs Costs

183
Water Services
Val Vista Water TreatmentPlant Disinfectant ByproductMitigation Improvements(2007 Water Bonds, 2008Water Bonds)
— Add funding for chemicals and electricity at thenew granular activated carbon facility at the ValVista Water Treatment Plant. Costs in 2012-13represent 12 months of operations.
$7,016,000 $14,286,000
24th Street Water TreatmentPlant Disinfectant ByproductMitigation Improvements(Water Revenue Pay-As-You-Go, 2007 Water Bonds, 2008Water Bonds)
— Add funding for chemicals at the new chlorinedioxide facility at the 24th Street WaterTreatment Plant. Costs in 2012-13 represent 12months of operations.
$188,000 $375,000
OPERATING COSTS FOR NEW CAPITAL FACILITIES (continued)
Project and Construction # of 2011-12 2012-13Funding Source FTEs Costs Costs
Net Total Costs $8,822,000 $16,805,000
Source of Funds
General $1,618,000 $2,144,000
Water $7,204,000 $14,661,000
Total Source of Funds $8,822,000 $16,805,000

184

185
Summary Schedules

186

187
2009-10 SCHEDULE 1: RESOURCES AND EXPENDITURES BY FUNDACTUAL
(In Thousands of Dollars)
Resources Expenditures
Beginning EndingFund Fund Transfer Debt Fund
Balances Revenue Recovery To From Total Operating Capital Service Total Balances
General Funds:General $45,580 $260,804 $1,070 $736,349 $129,814 $913,989 $866,542 $695 $- $867,237 $46,752Parks and Recreation – 19,111 74 70,050 – 89,235 89,235 – – 89,235 – Library – 1,349 17 31,700 – 33,066 33,065 1 – 33,066 –Cable Communications – 9,330 – – 4,546 4,784 4,784 – – 4,784 –
Total General Funds $45,580 $290,594 $1,161 $838,099 $134,360 $1,041,074 $993,626 $696 $– $994,322 $46,752
Special Revenue Funds:Excise Tax $– $917,441 $– $– $917,441 $– $– $– $– $– $–Neighborhood Protection-Police (4,951) (163) – 15,131 98 9,919 20,629 – – 20,629 (10,710)2
Neighborhood Protection-Fire (2,179) (74) – 5,403 35 3,115 8,441 – – 8,441 (5,326)2
Neighborhood Protection-Block Watch 2,099 171 – 1,081 7 3,344 1,272 – – 1,272 2,072
2007 Public Safety Expansion-Police 16,832 281 – 34,505 106 51,512 43,889 – – 43,889 7,623
2007 Public Safety Expansion-Fire 5,351 81 – 8,626 26 14,032 11,946 – – 11,946 2,086
Public Safety Enhancement-Police (2,220) – – 14,867 – 12,647 20,863 – – 20,863 (8,216)2
Public Safety Enhancement-Fire (1,932) – – 9,111 – 7,179 11,247 – – 11,247 (4,068)2
Parks and Preserves 41,547 2,665 425 21,615 66 66,186 1,791 14,843 – 16,634 49,552Transit 2000 235,879 52,537 2,528 125,297 44,223 372,018 148,799 3,210 – 152,009 220,009Court Awards 1,263 5,179 2 – – 6,444 4,506 – – 4,506 1,938Development Services 13,726 28,168 2 – 2,546 39,350 27,398 35 – 27,433 11,917Capital Construction 7,109 269 579 17,434 – 25,391 163 21,963 – 22,126 3,265Sports Facilities 32,663 1,113 – 13,804 550 47,030 1,795 – 9,872 11,667 35,363Arizona Highway User Revenue 10,903 104,745 3,098 543 595 118,694 41,798 22,520 31,246 95,564 23,130Local Transportation Assistance – 3,771 – – – 3,771 3,771 – – 3,771 –Regional Transit 7,491 58,096 87 – 38,832 26,842 15,404 248 – 15,652 11,190Community Reinvestment 14,141 2,748 – 16 5,092 11,813 217 1,136 – 1,353 10,460Secondary Property Tax 100 200,977 – 69,911 69,527 201,461 – – 201,361 201,361 100Impact Fee Program
Administration 961 301 – – – 1,262 756 – – 756 506Regional Wireless Cooperative – 99 – – 99 – – – – 99City Improvement 701 – – 63,873 – 64,574 – – 63,873 63,873 701Other Restricted Funds 34,407 25,209 91 1,050 501 60,256 20,347 1,858 – 22,205 38,051Grant Funds 22,213 230,107 545 – 1,227 251,638 191,199 33,121 – 224,320 27,318
Total Special RevenueFunds $436,104 $1,633,721 $7,357 $410,572 $1,080,872 $1,406,882 $576,231 $98,934 $314,657 $989,822 $417,060
Enterprise Funds:Aviation $173,626 $308,088 $2,649 $15,089 $9,433 $490,019 $195,140 $13,607 $77,533 $286,280 $203,739Water 145,364 345,587 2,003 24,885 33,068 484,771 167,054 58,754 112,316 338,124 146,647Wastewater 136,640 223,079 3,792 5,000 26,775 341,736 86,782 24,205 69,743 180,730 161,006Solid Waste 45,013 138,906 1,431 – 9,273 176,077 111,429 2,326 12,790 126,545 49,532 Convention Center 50,800 17,605 144 49,006 3,115 114,440 46,034 1,018 18,592 65,644 48,796Golf Course (7,345) 5,552 – – 279 (2,072) 7,926 – 20 7,946 (10,018)3
Total Enterprise Funds $544,098 $1,038,817 $10,019 $93,980 $81,943 $1,604,971 $614,365 $99,910 $290,994 $1,005,269 $599,702
GRAND TOTAL $1,025,782 $2,963,132 $18,537 $1,342,651 $1,297,175 $4,052,927 $2,184,222 $199,540 $605,651 $2,989,413 $1,063,514
1 General fund sales tax revenue is reflected as a transfer from the excise tax fund. Total transfer equates to $655.9 million, and is included in the General Fundsrevenue total of $946.5 million shown on Schedule 2.
2The dedicated public safety funds have been severly impacted by declines in sales tax revenues. In November 2010, the Mayor and City Council adopted a plan tobalance Fire by June 30, 2014 and Police by June 30, 2015.
3The Parks Department is exploring various ideas, including alternative operating structures, to correct the negative fund balance in the Golf Course Fund.
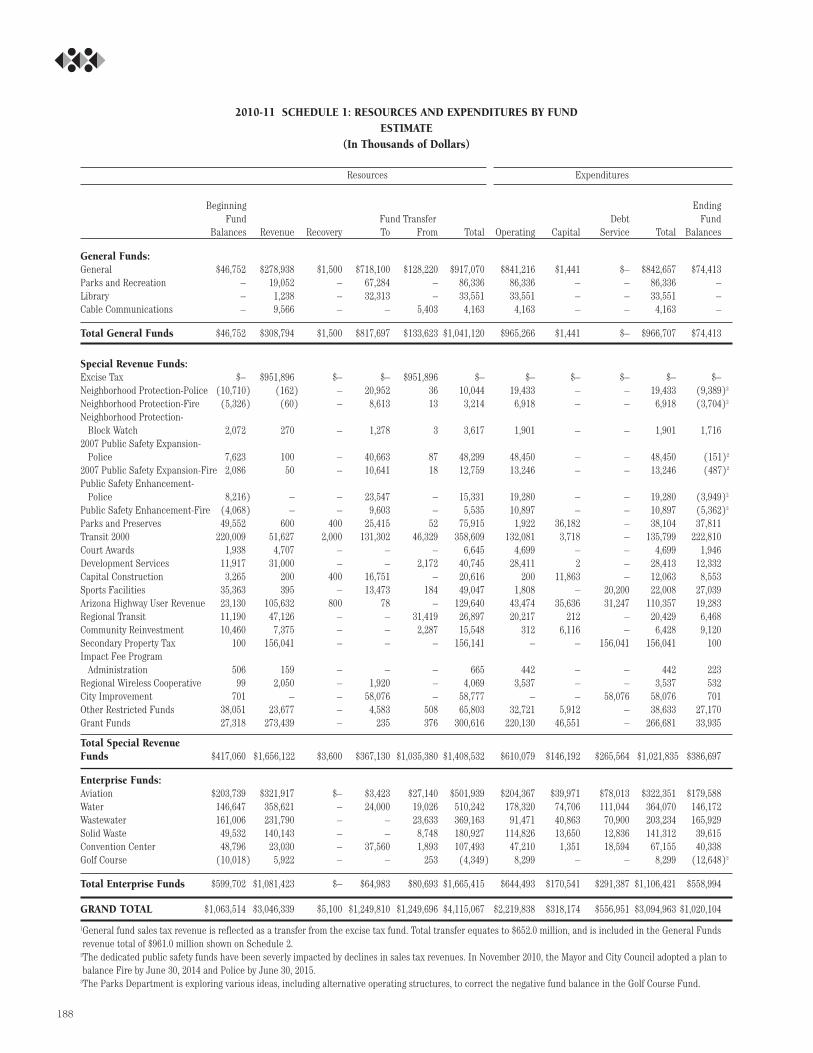
188
2010-11 SCHEDULE 1: RESOURCES AND EXPENDITURES BY FUNDESTIMATE
(In Thousands of Dollars)
Resources Expenditures
Beginning EndingFund Fund Transfer Debt Fund
Balances Revenue Recovery To From Total Operating Capital Service Total Balances
General Funds:General $46,752 $278,938 $1,500 $718,100 $128,220 $917,070 $841,216 $1,441 $– $842,657 $74,413 Parks and Recreation – 19,052 – 67,284 – 86,336 86,336 – – 86,336 – Library – 1,238 – 32,313 – 33,551 33,551 – – 33,551 – Cable Communications – 9,566 – – 5,403 4,163 4,163 – – 4,163 –
Total General Funds $46,752 $308,794 $1,500 $817,697 $133,623 $1,041,120 $965,266 $1,441 $– $966,707 $74,413
Special Revenue Funds:Excise Tax $– $951,896 $– $– $951,896 $– $– $– $– $– $– Neighborhood Protection-Police (10,710) (162) – 20,952 36 10,044 19,433 – – 19,433 (9,389)2
Neighborhood Protection-Fire (5,326) (60) – 8,613 13 3,214 6,918 – – 6,918 (3,704)2
Neighborhood Protection-Block Watch 2,072 270 – 1,278 3 3,617 1,901 – – 1,901 1,716
2007 Public Safety Expansion-Police 7,623 100 – 40,663 87 48,299 48,450 – – 48,450 (151)2
2007 Public Safety Expansion-Fire 2,086 50 – 10,641 18 12,759 13,246 – – 13,246 (487)2
Public Safety Enhancement-Police 8,216) – – 23,547 – 15,331 19,280 – – 19,280 (3,949)2
Public Safety Enhancement-Fire (4,068) – – 9,603 – 5,535 10,897 – – 10,897 (5,362)2
Parks and Preserves 49,552 600 400 25,415 52 75,915 1,922 36,182 – 38,104 37,811Transit 2000 220,009 51,627 2,000 131,302 46,329 358,609 132,081 3,718 – 135,799 222,810 Court Awards 1,938 4,707 – – – 6,645 4,699 – – 4,699 1,946Development Services 11,917 31,000 – – 2,172 40,745 28,411 2 – 28,413 12,332 Capital Construction 3,265 200 400 16,751 – 20,616 200 11,863 – 12,063 8,553 Sports Facilities 35,363 395 – 13,473 184 49,047 1,808 – 20,200 22,008 27,039Arizona Highway User Revenue 23,130 105,632 800 78 – 129,640 43,474 35,636 31,247 110,357 19,283 Regional Transit 11,190 47,126 – – 31,419 26,897 20,217 212 – 20,429 6,468 Community Reinvestment 10,460 7,375 – – 2,287 15,548 312 6,116 – 6,428 9,120Secondary Property Tax 100 156,041 – – – 156,141 – – 156,041 156,041 100Impact Fee Program
Administration 506 159 – – – 665 442 – – 442 223Regional Wireless Cooperative 99 2,050 – 1,920 – 4,069 3,537 – – 3,537 532 City Improvement 701 – – 58,076 – 58,777 – – 58,076 58,076 701Other Restricted Funds 38,051 23,677 – 4,583 508 65,803 32,721 5,912 – 38,633 27,170 Grant Funds 27,318 273,439 – 235 376 300,616 220,130 46,551 – 266,681 33,935
Total Special RevenueFunds $417,060 $1,656,122 $3,600 $367,130 $1,035,380 $1,408,532 $610,079 $146,192 $265,564 $1,021,835 $386,697
Enterprise Funds:Aviation $203,739 $321,917 $– $3,423 $27,140 $501,939 $204,367 $39,971 $78,013 $322,351 $179,588Water 146,647 358,621 – 24,000 19,026 510,242 178,320 74,706 111,044 364,070 146,172 Wastewater 161,006 231,790 – – 23,633 369,163 91,471 40,863 70,900 203,234 165,929 Solid Waste 49,532 140,143 – – 8,748 180,927 114,826 13,650 12,836 141,312 39,615Convention Center 48,796 23,030 – 37,560 1,893 107,493 47,210 1,351 18,594 67,155 40,338 Golf Course (10,018) 5,922 – – 253 (4,349) 8,299 – – 8,299 (12,648)3
Total Enterprise Funds $599,702 $1,081,423 $– $64,983 $80,693 $1,665,415 $644,493 $170,541 $291,387 $1,106,421 $558,994
GRAND TOTAL $1,063,514 $3,046,339 $5,100 $1,249,810 $1,249,696 $4,115,067 $2,219,838 $318,174 $556,951 $3,094,963 $1,020,104
1General fund sales tax revenue is reflected as a transfer from the excise tax fund. Total transfer equates to $652.0 million, and is included in the General Fundsrevenue total of $961.0 million shown on Schedule 2.
2The dedicated public safety funds have been severly impacted by declines in sales tax revenues. In November 2010, the Mayor and City Council adopted a plan tobalance Fire by June 30, 2014 and Police by June 30, 2015.
3The Parks Department is exploring various ideas, including alternative operating structures, to correct the negative fund balance in the Golf Course Fund.
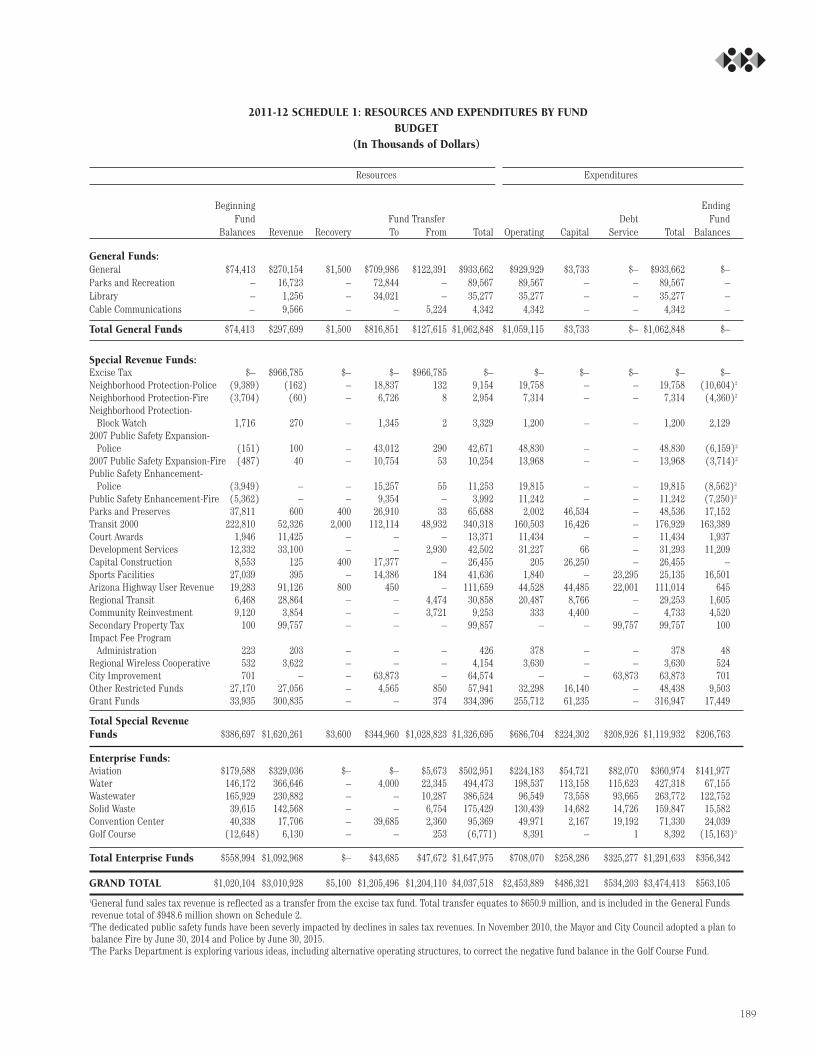
189
2011-12 SCHEDULE 1: RESOURCES AND EXPENDITURES BY FUNDBUDGET
(In Thousands of Dollars)
Resources Expenditures
Beginning EndingFund Fund Transfer Debt Fund
Balances Revenue Recovery To From Total Operating Capital Service Total Balances
General Funds:General $74,413 $270,154 $1,500 $709,986 $122,391 $933,662 $929,929 $3,733 $– $933,662 $–Parks and Recreation – 16,723 – 72,844 – 89,567 89,567 – – 89,567 –Library – 1,256 – 34,021 – 35,277 35,277 – – 35,277 – Cable Communications – 9,566 – – 5,224 4,342 4,342 – – 4,342 –
Total General Funds $74,413 $297,699 $1,500 $816,851 $127,615 $1,062,848 $1,059,115 $3,733 $– $1,062,848 $–
Special Revenue Funds:Excise Tax $– $966,785 $– $– $966,785 $– $– $– $– $– $–Neighborhood Protection-Police (9,389) (162) – 18,837 132 9,154 19,758 – – 19,758 (10,604)2
Neighborhood Protection-Fire (3,704) (60) – 6,726 8 2,954 7,314 – – 7,314 (4,360)2
Neighborhood Protection-Block Watch 1,716 270 – 1,345 2 3,329 1,200 – – 1,200 2,129
2007 Public Safety Expansion-Police (151) 100 – 43,012 290 42,671 48,830 – – 48,830 (6,159)2
2007 Public Safety Expansion-Fire (487) 40 – 10,754 53 10,254 13,968 – – 13,968 (3,714)2
Public Safety Enhancement-Police (3,949) – – 15,257 55 11,253 19,815 – – 19,815 (8,562)2
Public Safety Enhancement-Fire (5,362) – – 9,354 – 3,992 11,242 – – 11,242 (7,250)2
Parks and Preserves 37,811 600 400 26,910 33 65,688 2,002 46,534 – 48,536 17,152Transit 2000 222,810 52,326 2,000 112,114 48,932 340,318 160,503 16,426 – 176,929 163,389Court Awards 1,946 11,425 – – – 13,371 11,434 – – 11,434 1,937 Development Services 12,332 33,100 – – 2,930 42,502 31,227 66 – 31,293 11,209 Capital Construction 8,553 125 400 17,377 – 26,455 205 26,250 – 26,455 –Sports Facilities 27,039 395 – 14,386 184 41,636 1,840 – 23,295 25,135 16,501 Arizona Highway User Revenue 19,283 91,126 800 450 – 111,659 44,528 44,485 22,001 111,014 645Regional Transit 6,468 28,864 – – 4,474 30,858 20,487 8,766 – 29,253 1,605Community Reinvestment 9,120 3,854 – – 3,721 9,253 333 4,400 – 4,733 4,520 Secondary Property Tax 100 99,757 – – – 99,857 – – 99,757 99,757 100 Impact Fee Program
Administration 223 203 – – – 426 378 – – 378 48Regional Wireless Cooperative 532 3,622 – – – 4,154 3,630 – – 3,630 524 City Improvement 701 – – 63,873 – 64,574 – – 63,873 63,873 701 Other Restricted Funds 27,170 27,056 – 4,565 850 57,941 32,298 16,140 – 48,438 9,503 Grant Funds 33,935 300,835 – – 374 334,396 255,712 61,235 – 316,947 17,449
Total Special RevenueFunds $386,697 $1,620,261 $3,600 $344,960 $1,028,823 $1,326,695 $686,704 $224,302 $208,926 $1,119,932 $206,763
Enterprise Funds:Aviation $179,588 $329,036 $– $– $5,673 $502,951 $224,183 $54,721 $82,070 $360,974 $141,977Water 146,172 366,646 – 4,000 22,345 494,473 198,537 113,158 115,623 427,318 67,155 Wastewater 165,929 230,882 – – 10,287 386,524 96,549 73,558 93,665 263,772 122,752Solid Waste 39,615 142,568 – – 6,754 175,429 130,439 14,682 14,726 159,847 15,582 Convention Center 40,338 17,706 – 39,685 2,360 95,369 49,971 2,167 19,192 71,330 24,039 Golf Course (12,648) 6,130 – – 253 (6,771) 8,391 – 1 8,392 (15,163)3
Total Enterprise Funds $558,994 $1,092,968 $– $43,685 $47,672 $1,647,975 $708,070 $258,286 $325,277 $1,291,633 $356,342
GRAND TOTAL $1,020,104 $3,010,928 $5,100 $1,205,496 $1,204,110 $4,037,518 $2,453,889 $486,321 $534,203 $3,474,413 $563,105
1General fund sales tax revenue is reflected as a transfer from the excise tax fund. Total transfer equates to $650.9 million, and is included in the General Fundsrevenue total of $948.6 million shown on Schedule 2.
2The dedicated public safety funds have been severly impacted by declines in sales tax revenues. In November 2010, the Mayor and City Council adopted a plan tobalance Fire by June 30, 2014 and Police by June 30, 2015.
3The Parks Department is exploring various ideas, including alternative operating structures, to correct the negative fund balance in the Golf Course Fund.

190
SCHEDULE 2: REVENUES BY MAJOR SOURCE(In Thousands of Dollars)
Revenue Source
GENERAL FUNDS
Local Sales Taxes and Related Fees $355,589 $395,275 $39,686 11.2% $414,906 $19,631 5.0%
State-Shared Revenues
Sales Tax1 106,916 110,137 3,221 3.0% 110,696 559 0.5%
State Income Tax1 190,546 143,647 (46,899) (24.6%) 122,065 (21,582) (15.0%)
Vehicle License Tax 49,500 48,500 (1,000) (2.0%) 48,045 (455) (0.9%)
Subtotal $346,962 $302,284 $(44,678) (12.9%) $280,806 $(21,478) (7.1%)
Primary Property Tax $121,366 $131,100 $9,734 8.0% $126,763 $(4,337) (3.3%)
User Fees/Other Revenue
Licenses & Permits 2,869 3,098 229 8.0% 3,270 172 5.6%
Cable Communications 9,330 9,566 236 2.5% 9,566 – 0.0%
Fines and Forfeitures 20,215 20,761 546 2.7% 20,759 (2) 0.0%
Court Default Fee 1,110 1,100 (10) (0.9%) 1,100 – 0.0%
Fire 41,538 46,163 4,625 11.1% 47,911 1,748 3.8%
Hazardous Materials Inspection Fee 1,297 1,300 3 0.2% 1,300 – 0.0%
Library Fees 1,349 1,238 (111) (8.2%) 1,256 18 1.5%
Parks and Recreation 6,813 7,177 364 5.3% 7,103 (74) (1.0%)
Planning 999 1,002 3 0.3% 993 (9) (0.9%)
Police 15,681 16,371 690 4.4% 12,598 (3,773) (23.0%)
Street Transportation 5,159 6,360 1,201 23.3% 5,124 (1,236) (19.4%)
Other Service Charges 12,481 12,780 299 2.4% 12,813 33 0.3%
Other 3,757 5,376 1,619 43.1% 2,368 (3,008) (56.0%)
Subtotal $122,598 $132,292 $9,694 7.9% $126,161 $(6,131) (4.6%)
Total General Funds $946,515 $960,951 $14,436 1.5% $948,636 $(12,315) (1.3%)
1Includes the impact of the 2010 Census which decreases the city's population percentage from 30.33% to 28.78% for state shared sales tax and from 30.30% to28.75% for state shared income tax, effective 2011-12.
2009-10Actual
2010-11Estimate
2011-12Budget
Increase/(Decrease)From 2009-10 Estimate
Amount Percent
Increase/(Decrease)From 2010-11 Estimate
Amount Percent
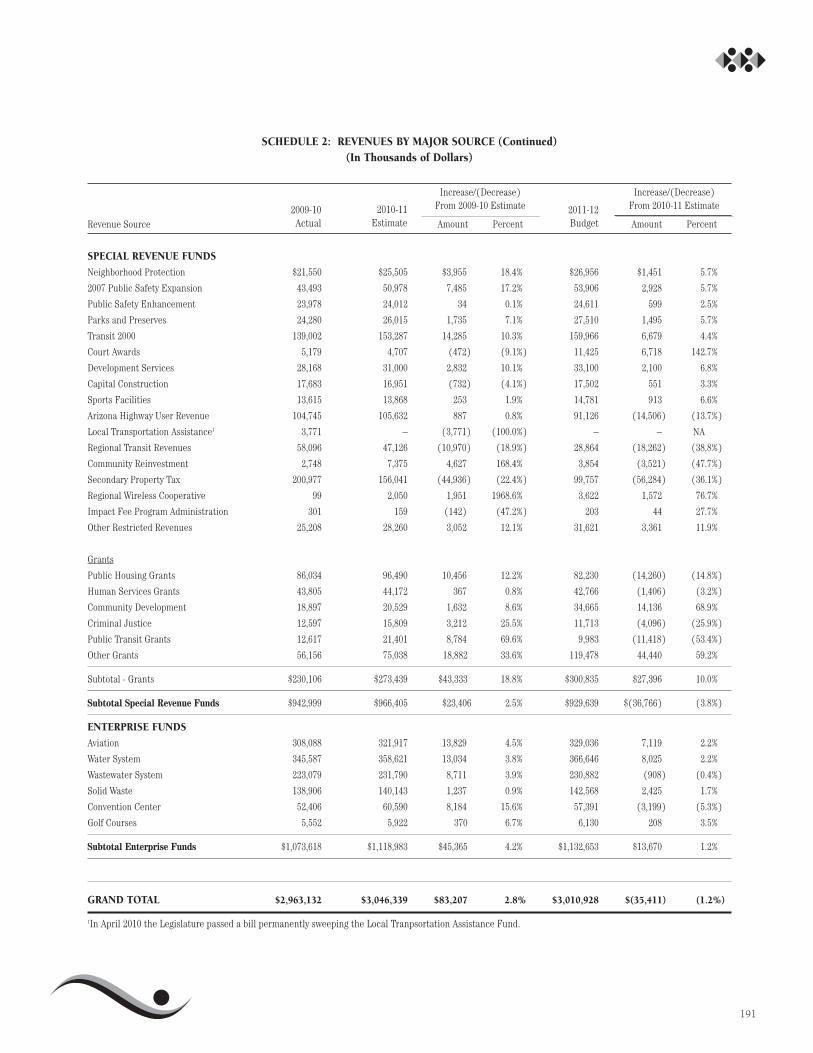
191
SCHEDULE 2: REVENUES BY MAJOR SOURCE (Continued)(In Thousands of Dollars)
Revenue Source
SPECIAL REVENUE FUNDS
Neighborhood Protection $21,550 $25,505 $3,955 18.4% $26,956 $1,451 5.7%
2007 Public Safety Expansion 43,493 50,978 7,485 17.2% 53,906 2,928 5.7%
Public Safety Enhancement 23,978 24,012 34 0.1% 24,611 599 2.5%
Parks and Preserves 24,280 26,015 1,735 7.1% 27,510 1,495 5.7%
Transit 2000 139,002 153,287 14,285 10.3% 159,966 6,679 4.4%
Court Awards 5,179 4,707 (472) (9.1%) 11,425 6,718 142.7%
Development Services 28,168 31,000 2,832 10.1% 33,100 2,100 6.8%
Capital Construction 17,683 16,951 (732) (4.1%) 17,502 551 3.3%
Sports Facilities 13,615 13,868 253 1.9% 14,781 913 6.6%
Arizona Highway User Revenue 104,745 105,632 887 0.8% 91,126 (14,506) (13.7%)
Local Transportation Assistance1 3,771 – (3,771) (100.0%) – – NA
Regional Transit Revenues 58,096 47,126 (10,970) (18.9%) 28,864 (18,262) (38.8%)
Community Reinvestment 2,748 7,375 4,627 168.4% 3,854 (3,521) (47.7%)
Secondary Property Tax 200,977 156,041 (44,936) (22.4%) 99,757 (56,284) (36.1%)
Regional Wireless Cooperative 99 2,050 1,951 1968.6% 3,622 1,572 76.7%
Impact Fee Program Administration 301 159 (142) (47.2%) 203 44 27.7%
Other Restricted Revenues 25,208 28,260 3,052 12.1% 31,621 3,361 11.9%
Grants
Public Housing Grants 86,034 96,490 10,456 12.2% 82,230 (14,260) (14.8%)
Human Services Grants 43,805 44,172 367 0.8% 42,766 (1,406) (3.2%)
Community Development 18,897 20,529 1,632 8.6% 34,665 14,136 68.9%
Criminal Justice 12,597 15,809 3,212 25.5% 11,713 (4,096) (25.9%)
Public Transit Grants 12,617 21,401 8,784 69.6% 9,983 (11,418) (53.4%)
Other Grants 56,156 75,038 18,882 33.6% 119,478 44,440 59.2%
Subtotal - Grants $230,106 $273,439 $43,333 18.8% $300,835 $27,396 10.0%
Subtotal Special Revenue Funds $942,999 $966,405 $23,406 2.5% $929,639 $(36,766) (3.8%)
ENTERPRISE FUNDS
Aviation 308,088 321,917 13,829 4.5% 329,036 7,119 2.2%
Water System 345,587 358,621 13,034 3.8% 366,646 8,025 2.2%
Wastewater System 223,079 231,790 8,711 3.9% 230,882 (908) (0.4%)
Solid Waste 138,906 140,143 1,237 0.9% 142,568 2,425 1.7%
Convention Center 52,406 60,590 8,184 15.6% 57,391 (3,199) (5.3%)
Golf Courses 5,552 5,922 370 6.7% 6,130 208 3.5%
Subtotal Enterprise Funds $1,073,618 $1,118,983 $45,365 4.2% $1,132,653 $13,670 1.2%
GRAND TOTAL $2,963,132 $3,046,339 $83,207 2.8% $3,010,928 $(35,411) (1.2%)
1In April 2010 the Legislature passed a bill permanently sweeping the Local Tranpsortation Assistance Fund.
2009-10Actual
2010-11Estimate
2011-12Budget
Increase/(Decrease)From 2009-10 Estimate
Amount Percent
Increase/(Decrease)From 2010-11 Estimate
Amount Percent
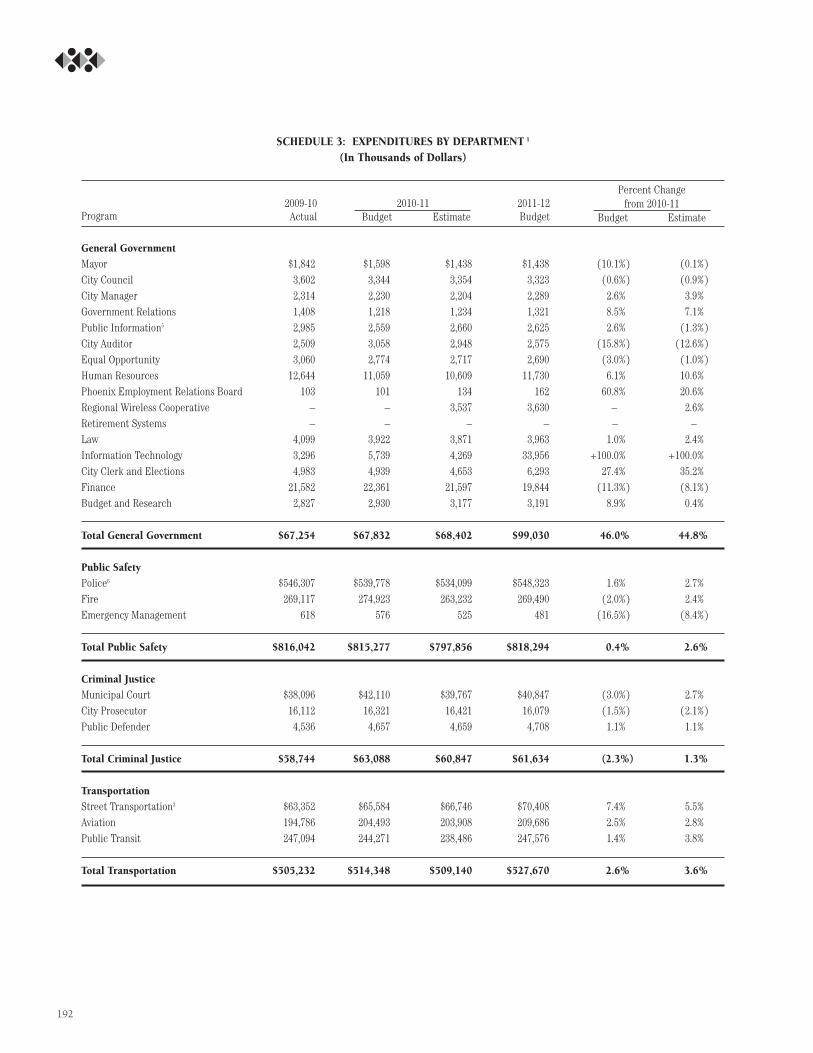
192
SCHEDULE 3: EXPENDITURES BY DEPARTMENT 1
(In Thousands of Dollars)
Program
General Government
Mayor $1,842 $1,598 $1,438 $1,438 (10.1%) (0.1%)City Council 3,602 3,344 3,354 3,323 (0.6%) (0.9%)City Manager 2,314 2,230 2,204 2,289 2.6% 3.9%Government Relations 1,408 1,218 1,234 1,321 8.5% 7.1%Public Information5 2,985 2,559 2,660 2,625 2.6% (1.3%)City Auditor 2,509 3,058 2,948 2,575 (15.8%) (12.6%)Equal Opportunity 3,060 2,774 2,717 2,690 (3.0%) (1.0%)Human Resources 12,644 11,059 10,609 11,730 6.1% 10.6%Phoenix Employment Relations Board 103 101 134 162 60.8% 20.6%Regional Wireless Cooperative – – 3,537 3,630 – 2.6%Retirement Systems – – – – – –Law 4,099 3,922 3,871 3,963 1.0% 2.4%Information Technology 3,296 5,739 4,269 33,956 +100.0% +100.0%City Clerk and Elections 4,983 4,939 4,653 6,293 27.4% 35.2%Finance 21,582 22,361 21,597 19,844 (11.3%) (8.1%)Budget and Research 2,827 2,930 3,177 3,191 8.9% 0.4%
Total General Government $67,254 $67,832 $68,402 $99,030 46.0% 44.8%
Public Safety
Police6 $546,307 $539,778 $534,099 $548,323 1.6% 2.7%Fire 269,117 274,923 263,232 269,490 (2.0%) 2.4%Emergency Management 618 576 525 481 (16.5%) (8.4%)
Total Public Safety $816,042 $815,277 $797,856 $818,294 0.4% 2.6%
Criminal Justice
Municipal Court $38,096 $42,110 $39,767 $40,847 (3.0%) 2.7%City Prosecutor 16,112 16,321 16,421 16,079 (1.5%) (2.1%) Public Defender 4,536 4,657 4,659 4,708 1.1% 1.1%
Total Criminal Justice $58,744 $63,088 $60,847 $61,634 (2.3%) 1.3%
Transportation
Street Transportation2 $63,352 $65,584 $66,746 $70,408 7.4% 5.5%Aviation 194,786 204,493 203,908 209,686 2.5% 2.8%Public Transit 247,094 244,271 238,486 247,576 1.4% 3.8%
Total Transportation $505,232 $514,348 $509,140 $527,670 2.6% 3.6%
2009-10Actual
2011-12BudgetBudget
2010-11Estimate
Percent Changefrom 2010-11
Budget Estimate

193
SCHEDULE 3: EXPENDITURES BY DEPARTMENT 1 (Continued)(In Thousands of Dollars)
Program
Community Development
Planning and Development Services5 $32,813 $35,984 $33,048 $33,602 (6.6%) 1.7%Housing 73,670 82,881 77,264 75,136 (9.3%) (2.8%)Community and Economic Development 25,899 24,787 30,303 26,859 8.4% (11.4%)Neighborhood Services5 41,471 105,802 48,914 110,429 4.4% +100.0%
Total Community Development $173,853 $249,454 $189,529 $246,026 (1.4%) 29.8%
Community Enrichment
Parks and Recreation $96,854 $97,515 $93,297 $96,395 (1.1%) 3.3%Library5 33,709 35,379 34,527 36,070 2.0% 4.5%Golf 7,926 8,697 8,299 8,341 (4.1%) 0.5%Phoenix Convention Center 46,345 51,308 47,652 47,497 (7.4%) (0.3%)Human Services5 62,833 58,858 63,033 62,377 6.0% (1.0%)Office of Arts and Culture 1,249 1,075 1,101 842 (21.7%) (23.6%)
Total Community Enrichment $248,916 $252,832 $247,909 $251,522 (0.5%) 1.5%
Environmental Services
Water $250,747 $286,986 $268,152 $280,039 (2.4%) 4.4%Solid Waste Management 111,429 121,873 114,826 126,439 3.7% 10.1%Public Works2 22,906 29,230 19,745 21,261 (27.3%) 7.7%Environmental Programs 1,277 1,356 1,508 1,407 3.8% (6.7%)
Total Environmental Services $386,359 $439,445 $404,231 $429,146 (2.3%) 6.2%
Contingencies3 $– $98,450 $– 84,440 (14.2%) –
Innovation and Efficiency Savings4 $– $(6,951) $– $– – –
GRAND TOTAL $2,256,400 $2,493,775 $2,277,914 $2,517,762 1.0% 10.5%
1For purposes of this schedule, department budget allocations include Grants and City Improvement debt service payments.2Engineering and Architectural Services was consolidated as part of the 2010-11 budget cuts. Fiber Optic and Cable utilities are now included in StreetTransportation. Engineering and Architectural Services is now part of Public Works and Street Transportation.
3The General Fund contingency includes a $2 million set aside for Fire and $50 thousand for Neighborhood Services.4The Innovation and Efficiency Task Force was created in January 2010 and given the goal of achieving $10 million in savings from April 2010 through June2011. As of May 2010, $3,049,000 in savings was identified. The remaining $6,951,000 was identified after the 2010-11 budget was adopted.
5The following consolidations were implemented mid-year in the 2010-11 citywide reorganization: Family Advocacy with Human Services; Historic Preservationwith Planning and Development; International and Sister Cities with Community and Economic Development; and portions of Education and Youth with LibraryServices, Neighborhood Services and Public Information.
6The Office of the Public Safety Manager is shown combined with the Police Department through 2010-11. The Public Safety Manager is eliminated in 2011-12and the administrative position assigned to this office is assigned to the Police Department.
2009-10Actual
2011-12BudgetBudget
2010-11Estimate
Percent Changefrom 2010-11
Budget Estimate
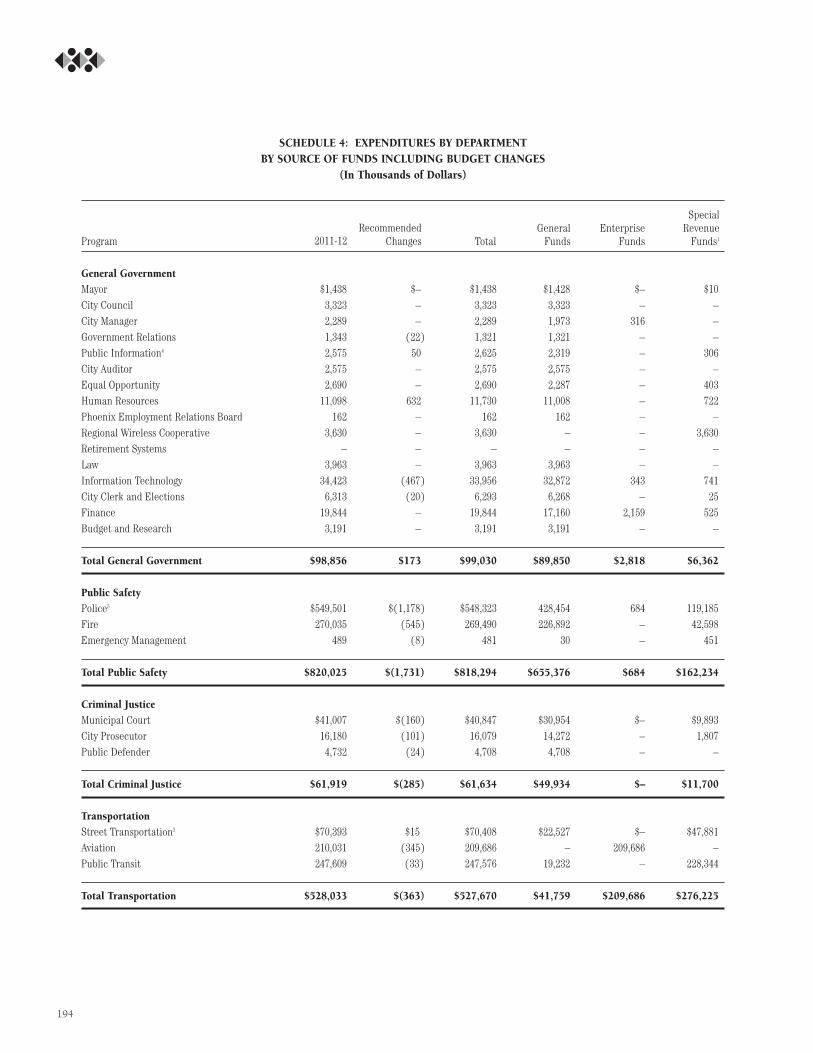
194
SCHEDULE 4: EXPENDITURES BY DEPARTMENTBY SOURCE OF FUNDS INCLUDING BUDGET CHANGES
(In Thousands of Dollars)
Program
General Government
Mayor $1,438 $– $1,438 $1,428 $– $10City Council 3,323 – 3,323 3,323 – –City Manager 2,289 – 2,289 1,973 316 –Government Relations 1,343 (22) 1,321 1,321 – –Public Information4 2,575 50 2,625 2,319 – 306City Auditor 2,575 – 2,575 2,575 – –Equal Opportunity 2,690 – 2,690 2,287 – 403Human Resources 11,098 632 11,730 11,008 – 722Phoenix Employment Relations Board 162 – 162 162 – –Regional Wireless Cooperative 3,630 – 3,630 – – 3,630Retirement Systems – – – – – –Law 3,963 – 3,963 3,963 – –Information Technology 34,423 (467) 33,956 32,872 343 741 City Clerk and Elections 6,313 (20) 6,293 6,268 – 25Finance 19,844 – 19,844 17,160 2,159 525Budget and Research 3,191 – 3,191 3,191 – –
Total General Government $98,856 $173 $99,030 $89,850 $2,818 $6,362
Public Safety
Police5 $549,501 $(1,178) $548,323 428,454 684 119,185Fire 270,035 (545) 269,490 226,892 – 42,598Emergency Management 489 (8) 481 30 – 451
Total Public Safety $820,025 $(1,731) $818,294 $655,376 $684 $162,234
Criminal Justice
Municipal Court $41,007 $(160) $40,847 $30,954 $– $9,893City Prosecutor 16,180 (101) 16,079 14,272 – 1,807Public Defender 4,732 (24) 4,708 4,708 – –
Total Criminal Justice $61,919 $(285) $61,634 $49,934 $– $11,700
Transportation
Street Transportation2 $70,393 $15 $70,408 $22,527 $– $47,881 Aviation 210,031 (345) 209,686 – 209,686 –Public Transit 247,609 (33) 247,576 19,232 – 228,344
Total Transportation $528,033 $(363) $527,670 $41,759 $209,686 $276,225
2011-12Recommended
ChangesGeneral
FundsTotalEnterprise
Funds
SpecialRevenue
Funds1

195
SCHEDULE 4: EXPENDITURES BY DEPARTMENTBY SOURCE OF FUNDS INCLUDING BUDGET CHANGES (Continued)
(In Thousands of Dollars)
Program
Community Development
Planning and Development Services4 $33,586 $16 $33,602 $4,995 $– $28,607Housing 75,136 – 75,136 57 – 75,079Community and Economic Development 26,910 (51) 26,859 4,886 1,089 20,884Neighborhood Services4 110,332 97 110,429 11,532 – 98,897
Total Community Development $245,964 $62 $246,026 $21,470 $1,089 $223,467
Community Enrichment
Parks and Recreation $96,379 $16 $96,395 $89,567 $239 $6,589Library4 35,006 1,064 36,070 35,277 – 793Golf 8,341 – 8,341 – 8,341 –Phoenix Convention Center 47,481 16 47,497 1,307 45,595 595Human Services4 62,388 (11) 62,377 18,493 250 43,634Office of Arts and Culture 842 – 842 814 – 28
Total Community Enrichment $250,437 $1,085 $251,522 $145,458 $54,425 $51,639
Environmental Services
Water $280,017 $22 $280,039 $– $278,154 $1,885Solid Waste Management 126,415 24 126,439 – 126,439 – Public Works2 21,941 (680) 21,261 16,400 – 4,861Environmental Programs 1,407 – 1,407 978 225 204
Total Environmental Services $429,780 $(634) $429,146 $17,378 $404,818 $6,950
Contingencies3 $– $– $84,440 $37,890 $34,550 $12,000
GRAND TOTAL $2,435,014 $(1,693) $2,517,762 $1,059,115 $708,070 $750,577
1For purposes of this schedule, department budget allocations include Grants and City Improvement debt service payments.2Engineering and Architectural Services was consolidated as part of the 2010-11 budget cuts. Fiber Optic and Cable utilities are now included in StreetTransportation. Engineering and Architectural Services is now part of Public Works and Street Transportation.
3The General Fund contingency includes a $2 million set aside for Fire and $50 thousand for Neighborhood Services.4The following consolidations were implemented mid-year in the 2010-11 citywide reorganization: Family Advocacy with Human Services; HistoricPreservation with Planning and Development; International and Sister Cities with Community and Economic Development; and portions of Education andYouth with Library Services, Neighborhood Services and Public Information.
5The Office of the Public Safety Manager is shown combined with the Police Department through 2010-11. The Public Safety Manager is eliminated in 2011-12 and the administrative position assigned to this office is assigned to the Police Department.
RecommendedChanges Total
SpecialRevenue
Funds12011-12General
FundsEnterprise
Funds
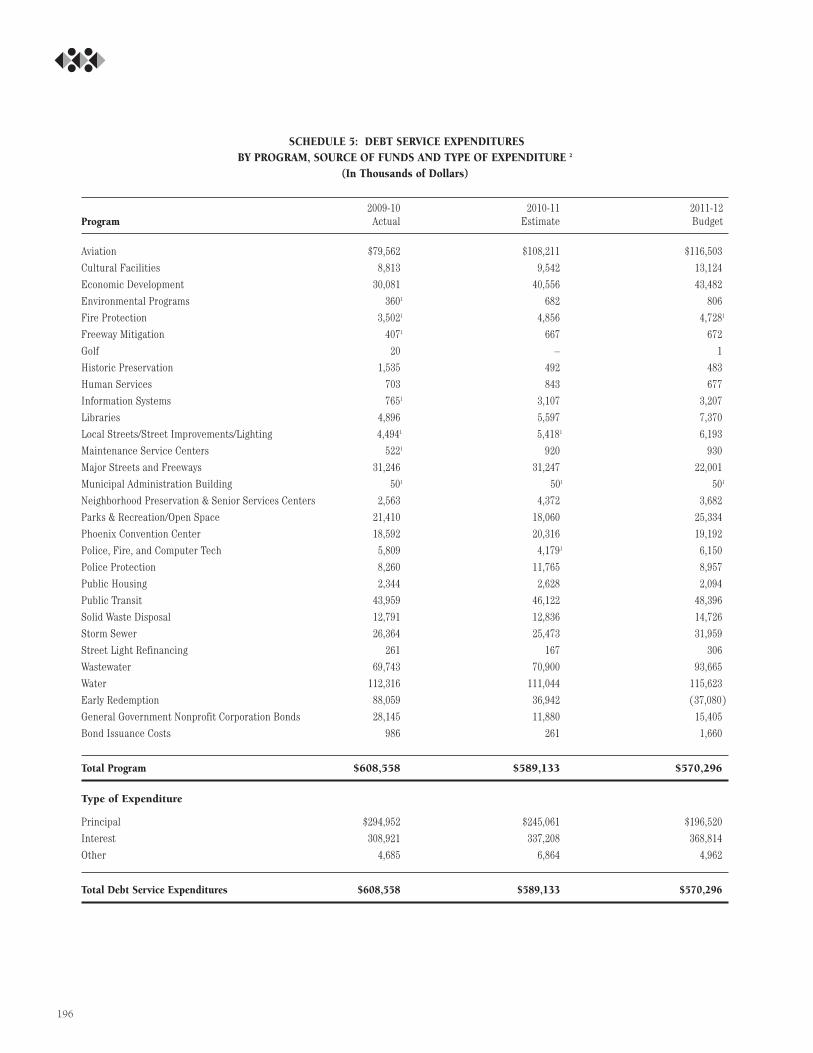
196
SCHEDULE 5: DEBT SERVICE EXPENDITURES BY PROGRAM, SOURCE OF FUNDS AND TYPE OF EXPENDITURE 2
(In Thousands of Dollars)
2009-10 2010-11 2011-12Program Actual Estimate Budget
Aviation $79,562 $108,211 $116,503
Cultural Facilities 8,813 9,542 13,124
Economic Development 30,081 40,556 43,482
Environmental Programs 3601 682 806
Fire Protection 3,5021 4,856 4,7281
Freeway Mitigation 4071 667 672
Golf 20 – 1
Historic Preservation 1,535 492 483
Human Services 703 843 677
Information Systems 7651 3,107 3,207
Libraries 4,896 5,597 7,370
Local Streets/Street Improvements/Lighting 4,4941 5,4181 6,193
Maintenance Service Centers 5221 920 930
Major Streets and Freeways 31,246 31,247 22,001
Municipal Administration Building 501 501 501
Neighborhood Preservation & Senior Services Centers 2,563 4,372 3,682
Parks & Recreation/Open Space 21,410 18,060 25,334
Phoenix Convention Center 18,592 20,316 19,192
Police, Fire, and Computer Tech 5,809 4,1791 6,150
Police Protection 8,260 11,765 8,957
Public Housing 2,344 2,628 2,094
Public Transit 43,959 46,122 48,396
Solid Waste Disposal 12,791 12,836 14,726
Storm Sewer 26,364 25,473 31,959
Street Light Refinancing 261 167 306
Wastewater 69,743 70,900 93,665
Water 112,316 111,044 115,623
Early Redemption 88,059 36,942 (37,080)
General Government Nonprofit Corporation Bonds 28,145 11,880 15,405
Bond Issuance Costs 986 261 1,660
Total Program $608,558 $589,133 $570,296
Type of Expenditure
Principal $294,952 $245,061 $196,520
Interest 308,921 337,208 368,814
Other 4,685 6,864 4,962
Total Debt Service Expenditures $608,558 $589,133 $570,296
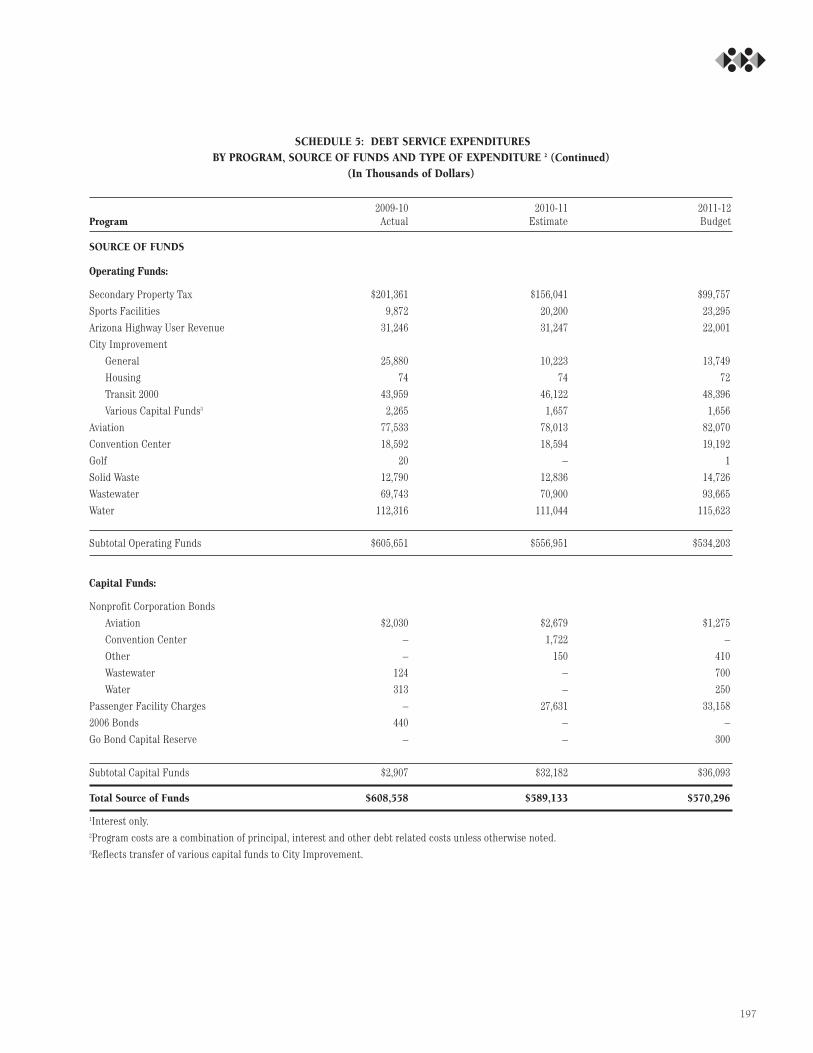
SCHEDULE 5: DEBT SERVICE EXPENDITURES BY PROGRAM, SOURCE OF FUNDS AND TYPE OF EXPENDITURE 2 (Continued)
(In Thousands of Dollars)
2009-10 2010-11 2011-12Program Actual Estimate Budget
SOURCE OF FUNDS
Operating Funds:
Secondary Property Tax $201,361 $156,041 $99,757
Sports Facilities 9,872 20,200 23,295
Arizona Highway User Revenue 31,246 31,247 22,001
City Improvement
General 25,880 10,223 13,749
Housing 74 74 72
Transit 2000 43,959 46,122 48,396
Various Capital Funds3 2,265 1,657 1,656
Aviation 77,533 78,013 82,070
Convention Center 18,592 18,594 19,192
Golf 20 – 1
Solid Waste 12,790 12,836 14,726
Wastewater 69,743 70,900 93,665
Water 112,316 111,044 115,623
Subtotal Operating Funds $605,651 $556,951 $534,203
Capital Funds:
Nonprofit Corporation Bonds
Aviation $2,030 $2,679 $1,275
Convention Center – 1,722 –
Other – 150 410
Wastewater 124 – 700
Water 313 – 250
Passenger Facility Charges – 27,631 33,158
2006 Bonds 440 – –
Go Bond Capital Reserve – – 300
Subtotal Capital Funds $2,907 $32,182 $36,093
Total Source of Funds $608,558 $589,133 $570,296
1Interest only.2Program costs are a combination of principal, interest and other debt related costs unless otherwise noted.3Reflects transfer of various capital funds to City Improvement.
197
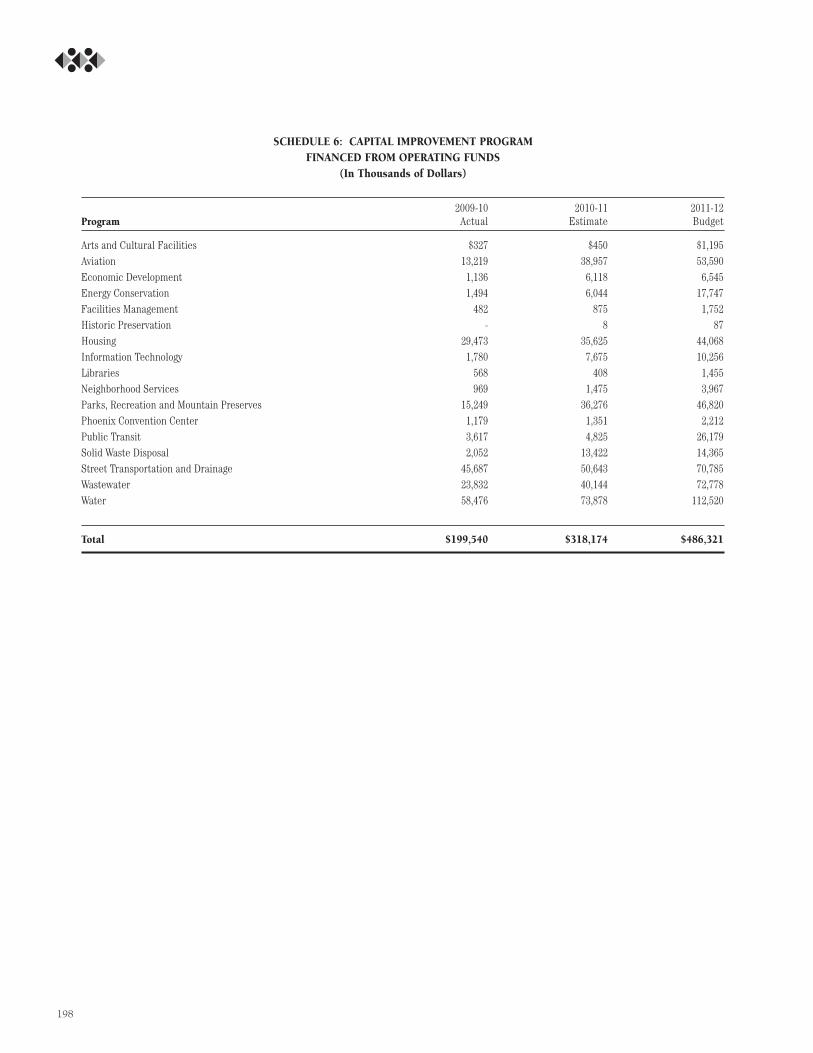
198
SCHEDULE 6: CAPITAL IMPROVEMENT PROGRAM FINANCED FROM OPERATING FUNDS
(In Thousands of Dollars)
2009-10 2010-11 2011-12Program Actual Estimate Budget
Arts and Cultural Facilities $327 $450 $1,195 Aviation 13,219 38,957 53,590Economic Development 1,136 6,118 6,545Energy Conservation 1,494 6,044 17,747Facilities Management 482 875 1,752Historic Preservation - 8 87Housing 29,473 35,625 44,068Information Technology 1,780 7,675 10,256Libraries 568 408 1,455Neighborhood Services 969 1,475 3,967Parks, Recreation and Mountain Preserves 15,249 36,276 46,820 Phoenix Convention Center 1,179 1,351 2,212Public Transit 3,617 4,825 26,179Solid Waste Disposal 2,052 13,422 14,365Street Transportation and Drainage 45,687 50,643 70,785Wastewater 23,832 40,144 72,778Water 58,476 73,878 112,520
Total $199,540 $318,174 $486,321
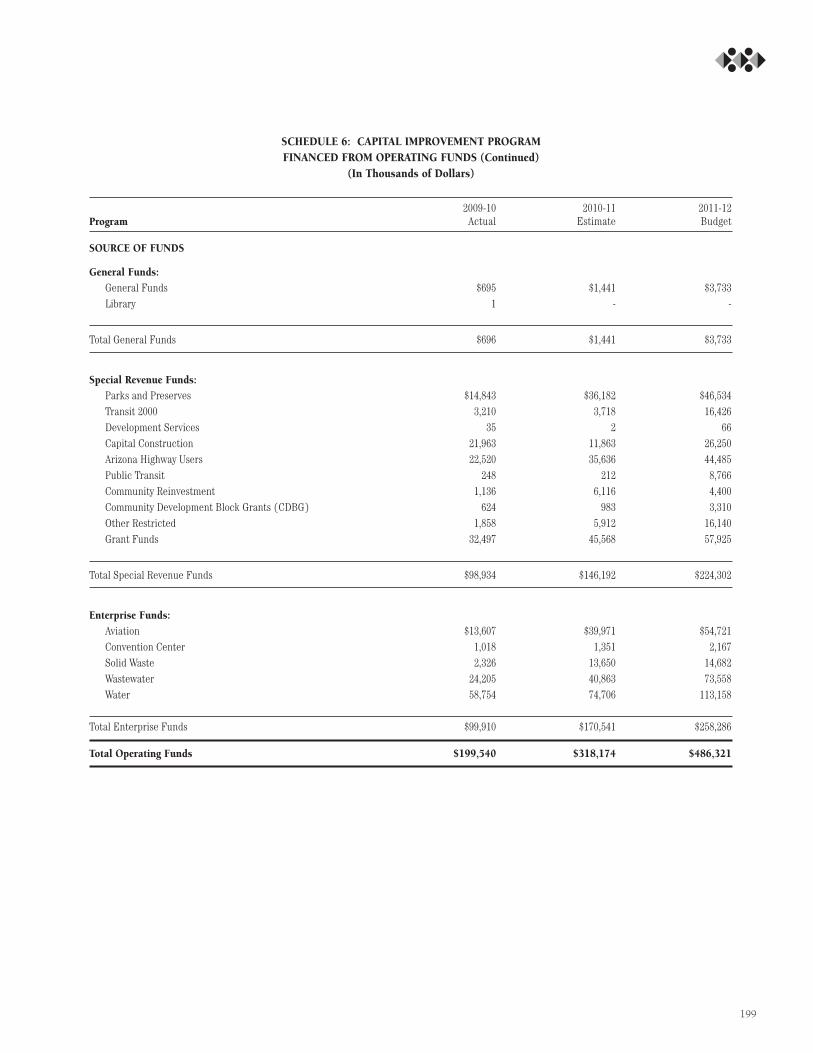
199
SCHEDULE 6: CAPITAL IMPROVEMENT PROGRAM FINANCED FROM OPERATING FUNDS (Continued)
(In Thousands of Dollars)
2009-10 2010-11 2011-12Program Actual Estimate Budget
SOURCE OF FUNDS
General Funds:
General Funds $695 $1,441 $3,733 Library 1 - -
Total General Funds $696 $1,441 $3,733
Special Revenue Funds:
Parks and Preserves $14,843 $36,182 $46,534 Transit 2000 3,210 3,718 16,426 Development Services 35 2 66 Capital Construction 21,963 11,863 26,250 Arizona Highway Users 22,520 35,636 44,485 Public Transit 248 212 8,766 Community Reinvestment 1,136 6,116 4,400 Community Development Block Grants (CDBG) 624 983 3,310 Other Restricted 1,858 5,912 16,140 Grant Funds 32,497 45,568 57,925
Total Special Revenue Funds $98,934 $146,192 $224,302
Enterprise Funds:
Aviation $13,607 $39,971 $54,721 Convention Center 1,018 1,351 2,167 Solid Waste 2,326 13,650 14,682 Wastewater 24,205 40,863 73,558 Water 58,754 74,706 113,158
Total Enterprise Funds $99,910 $170,541 $258,286
Total Operating Funds $199,540 $318,174 $486,321

200
SCHEDULE 7: NET INTERFUND TRANSFERS TO THE GENERAL FUND(In Thousands of Dollars)
2011-12
2009-10 2010-11 Increase/Actual Estimate Budget (Decrease)
TRANSFERS TO THE GENERAL FUND
Enterprise Funds
AviationCentral Service Cost Allocation $5,037 $4,364 $5,673 $1,309
Water FundsCentral Service Cost Allocation 5,906 5,291 10,215 4,924In Lieu Property Taxes 11,239 11,657 12,130 473 GO Bond Debt 15,923 2,050 – (2,050)
Total 33,068 18,998 22,345 3,347
Wastewater FundsCentral Service Cost Allocation 2,265 1,945 2,263 318 In Lieu Property Taxes 7,823 7,997 8,024 27GO Bond Debt 6,394 13,677 – (13,677)
Total 16,482 23,619 10,287 (13,332)
Solid WasteCentral Service Cost Allocation 4,526 4,668 5,035 367 In Lieu Property Taxes 1,141 1,087 1,119 32Go Bond Debt 2,358 2,373 – (2,373)
Total 8,025 8,128 6,154 (1,974)
Convention CenterCentral Service Cost Allocation 2,154 1,725 2,277 552
Golf CoursesParks Administration 279 253 253 –
Total from Enterprise Funds $65,045 $57,087 $46,989 $(10,098)

201
SCHEDULE 7: NET INTERFUND TRANSFERS TO THE GENERAL FUND (Continued)(In Thousands of Dollars)
2011-12
2009-10 2010-11 Increase/Actual Estimate Budget (Decrease)
Special Revenue Funds
ExciseTransfer to General Fund $655,920 $652,157 $650,937 $(1,220)
Development ServicesCentral Service Cost Allocation 2,546 2,172 2,930 758
Sports FacilitiesCentral Service Cost Allocation 111 105 105 – Phoenix Union Parking Maintenance 79 79 79 –
Total 190 184 184 –
Public Housing - In Lieu Property Taxes 302 302 302 – Know 99 Transfer – 400 – (400)ASU Facilities Operations Fund – 108 650 542 Downtown Community Reinvestment Fund – 287 1,721 1,434 Capital Project Funds 7,800 – – –T2000 Central Service Costs – – 407 407 Neighborhood Protection Central Service Costs – – 109 109 Public Safety Enhancement Central Service Costs – – 55 55 Public Safety Expansion Central Service Costs – – 278 278 Housing Central Office Central Service Costs – – 200 200
Total from Special Revenue Funds $666,758 $655,610 $657,773 $2,163
Total Transfers to the General Fund $731,803 $712,697 $704,762 $(7,935)
Transfers from the General Fund
Public Safety Fund Balancing – 15,000 – (15,000)Arizona Highway User Revenue Reimbursement – 78 450 372Regional Wireless Cooperative – 1,814 – (1,814)Retiree Rate Stabilization Fund 1,020 1,026 1,029 3Infrastructure Repayment Agreements 1,164 482 298 (184)City Improvement 25,880 10,223 13,749 3,526
Total Transfers from the General Fund $28,064 $28,623 $15,526 $(13,097)
Net Transfers to the General Fund $703,739 $684,074 $689,236 $5,162
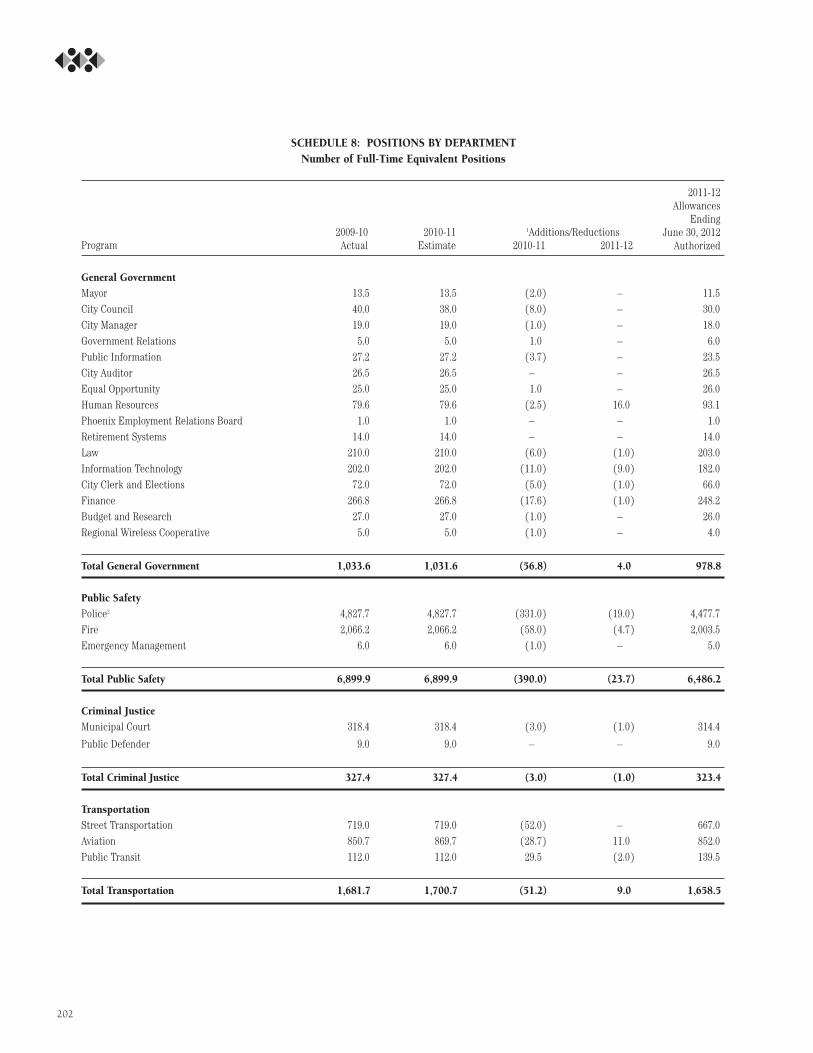
202
SCHEDULE 8: POSITIONS BY DEPARTMENTNumber of Full-Time Equivalent Positions
Program
General Government
Mayor 13.5 13.5 (2.0) – 11.5City Council 40.0 38.0 (8.0) – 30.0City Manager 19.0 19.0 (1.0) – 18.0Government Relations 5.0 5.0 1.0 – 6.0Public Information 27.2 27.2 (3.7) – 23.5City Auditor 26.5 26.5 – – 26.5Equal Opportunity 25.0 25.0 1.0 – 26.0Human Resources 79.6 79.6 (2.5) 16.0 93.1Phoenix Employment Relations Board 1.0 1.0 – – 1.0Retirement Systems 14.0 14.0 – – 14.0Law 210.0 210.0 (6.0) (1.0) 203.0Information Technology 202.0 202.0 (11.0) (9.0) 182.0City Clerk and Elections 72.0 72.0 (5.0) (1.0) 66.0Finance 266.8 266.8 (17.6) (1.0) 248.2Budget and Research 27.0 27.0 (1.0) – 26.0Regional Wireless Cooperative 5.0 5.0 (1.0) – 4.0
Total General Government 1,033.6 1,031.6 (56.8) 4.0 978.8
Public Safety
Police2 4,827.7 4,827.7 (331.0) (19.0) 4,477.7Fire 2,066.2 2,066.2 (58.0) (4.7) 2,003.5Emergency Management 6.0 6.0 (1.0) – 5.0
Total Public Safety 6,899.9 6,899.9 (390.0) (23.7) 6,486.2
Criminal Justice
Municipal Court 318.4 318.4 (3.0) (1.0) 314.4
Public Defender 9.0 9.0 – – 9.0
Total Criminal Justice 327.4 327.4 (3.0) (1.0) 323.4
Transportation
Street Transportation 719.0 719.0 (52.0) – 667.0Aviation 850.7 869.7 (28.7) 11.0 852.0Public Transit 112.0 112.0 29.5 (2.0) 139.5
Total Transportation 1,681.7 1,700.7 (51.2) 9.0 1,658.5
2009-10Actual
2010-11Estimate
1Additions/Reductions2010-11 2011-12
2011-12Allowances
EndingJune 30, 2012
Authorized

203
SCHEDULE 8: POSITIONS BY DEPARTMENTNumber of Full-Time Equivalent Positions (Continued)
Program
Community Development
Planning and Development 249.0 249.0 2.0 (2.0) 249.0Housing 187.2 187.2 5.0 (1.0) 191.2Community and Economic Development 102.0 101.0 4.0 – 105.0Neighborhood Services 212.5 212.5 8.0 (3.0) 217.5
Total Community Development 750.7 749.7 19.0 (6.0) 762.7
Community Enrichment
Parks and Recreation 1,028.3 1,029.0 (28.6) (1.0) 999.4Library 330.0 332.0 4.8 19.8 356.6Golf 95.4 95.4 – – 95.4Phoenix Convention Center 278.3 278.3 (2.3) (3.0) 273.0Human Services 458.0 458.0 (42.5) 0.8 416.3Office of Arts and Culture 15.0 15.0 (3.0) – 12.0
Total Community Enrichment 2,205.0 2,207.7 (71.6) 16.6 2,152.7
Environmental Services
Water Services 1,527.1 1,524.1 (27.0) (1.0) 1,496.1Solid Waste Management 614.0 614.0 (3.7) – 610.3Public Works 567.4 567.4 (48.4) (1.0) 518.0Environmental Programs 14.0 14.0 (1.0) – 13.0
Total Environmental Services 2,722.5 2,719.5 (80.1) (2.0) 2,637.4
TOTAL 15,620.8 15,636.5 (633.7) (3.1) 14,999.7
1Additions/Reductions reflect the combined total of budget reductions, budget additions and new positions associated with opening new facilities. 2The Office of the Public Safety Manager is shown combined with the Police Department through 2010-11. The public safety manager position iseliminated in 2011-12 and the administrative position assigned to this office is assigned to the Police Department.
2009-10Actual
2010-11Estimate
1Additions/Reductions2010-11 2011-12
2011-12Allowances
EndingJune 30, 2012
Authorized

204
Accrual Basis Accounting – The mostcommonly used accounting method, whichreports income when earned and expenses whenincurred, as opposed to cash basis accounting,which reports income when received andexpenses when paid. For the city'sComprehensive Annual Financial Report(CAFR), Phoenix recognizes grant revenues ona modified cash basis. Generally AcceptedAccounting Principles (GAAP) recognizes grantrevenues on an accrual basis.
Appropriation – An authorization granted bythe City Council to make expenditures and toincur obligations for purposes specified in theappropriation ordinances. Three appropriationordinances are adopted each year: 1) theoperating funds ordinance, 2) the capital fundsordinance, and 3) the re-appropriated fundsordinance.
Arizona Highway User Revenue (AHUR) –Various gas tax and vehicle licensing feesimposed and collected by the state and sharedwith cities and towns. This revenue must beused for street or highway purposes.
Balanced Budget – Arizona law (Title 42Arizona Revised Statutes) requires the CityCouncil to annually adopt a balanced budget bypurpose of public expense. State law definesthis balanced budget as “the primary propertytax levy, when added together with all otheravailable resources, must equal theseexpenditures.” Therefore, no General Fundbalances can be budgeted in reserve forsubsequent fiscal years. Instead, an amount forcontingencies (also commonly referred to as a“rainy day fund”) is included in the budget eachyear. The City Charter also requires an annualbalanced budget. The Charter further requiresthat “the total of proposed expenditures shallnot exceed the total of estimated income andfund balances.”
Base Budget Allowances – Funding forongoing expenditures for personnel,commodities, contractual services andreplacement of existing equipment previouslyauthorized. The base budget allowance providesfunding to continue previously authorizedservices and programs.
Block Watch Fund – This fund is the BlockWatch portion of the Neighborhood ProtectionFund. This fund is a portion of a voter-approved0.1 percent sales tax increase approved inOctober 1993. Grant funds are awarded tocommunities for innovative methods to detercrime-related problems in their neighborhoods.The city disburses these funds through anannual application process.
Bonds – Debt instruments that requirerepayment of a specified principal amount on acertain date (maturity date), along with interestat a stated rate or according to a formula fordetermining the interest rate.
Bond Rating – An evaluation of a bond issuer'scredit quality and perceived ability to pay theprincipal and interest on time and in full. Twoagencies regularly review city bonds andgenerate bond ratings - Moody's InvestorsService and Standard and Poor's Ratings Group.
Budget – A plan of financial operation for aspecific time period (the city of Phoenix'sadopted budget is for a fiscal year July 1 – June30). The budget contains the estimatedexpenditures needed to continue the city'soperations for the fiscal year and revenuesanticipated to finance them.
Capital Budget – See Capital ImprovementProgram.
Capital Funds – Resources derived fromissuance of bonds for specific purposes, relatedfederal project grants and participation fromother agencies used to finance capitalexpenditures.
Capital Improvement Program (CIP) – Aplan for capital expenditures needed tomaintain and expand the public infrastructure(for example, roads, sewers, water lines orparks). It projects these infrastructure needsfor a set number of years and is updatedannually to reflect the latest priorities, costestimates or changing financial strategies. Thefirst year of the adopted Capital ImprovementProgram becomes the Annual Capital Budget.
Capital Outlay – Items that cost more than$5,000 and have a useful life of more than twoyears.
Capital Project – New facility, technologysystem, land acquisition or equipmentacquisition, or improvements to existingfacilities beyond routine maintenance. Capitalprojects are included in the CapitalImprovement Program and become fixed assets.
Carryover – Expenditure originally planned forin the current fiscal year, but because of delays,is postponed to the following fiscal year.
CDBG – See Community Development BlockGrant.
Central Service Cost Allocation – Themethod of distributing expenses for general staffand administrative overhead to the benefitingactivity.
CIP – See Capital Improvement Program.
City Connection – Weekly employeenewsletter containing information about theorganization, news about employees, andpersonnel and benefits updates.
City Manager’s Budget – See PreliminaryBudget.
City of Phoenix Employees’ RetirementSystems (COPERS) – A pension plan forfull-time employees who retire from service withthe city of Phoenix.
Glossary
205

Civic Improvement Corporation (CIC) – Non-profit corporation established in1973 as the main financing arm of the city ofPhoenix to issue debt obligations secured byenterprise fund revenues or excise tax pledges.
Commodities – Consumable goods such asoffice supplies, repair and replacement parts,small tools and fuel, which are not of a capitalnature.
Community Development Block Grant(CDBG) – Grant funds allocated by the federalgovernment to the city of Phoenix to use for theprevention and removal of slum and blight, andto benefit low- and moderate-income persons.The city disburses these funds through anannual application process open to all nonprofitorganizations and city departments.
Comprehensive Annual FinancialReport (CAFR) – Official annual report ofthe city of Phoenix which includes statements ofrevenue, expenditures and changes in fundbalances.
Contingency – An appropriation of funds tocover unforeseen events that occur during thefiscal year, such as flood emergencies, federalmandates shortfalls in revenue and similareventualities.
Contractual Services – Expenditures forservices performed by firms, individuals or othercity departments.
Council-Manager Form of Government – Anorganizational structure in which the Mayor andCity Council appoint an independent citymanager to be the chief operating officer of alocal government. In practice, a City Councilsets policies and the city manager is responsiblefor implementing those policies effectively andefficiently.
Court Awards Fund – Revenues provided bycourt awards of confiscated property under boththe federal and state organized crime acts.These funds are used for additional lawenforcement activities in the Police and Lawdepartments.
Cycle Time – The amount of time, from thecustomer’s perspective, it takes to complete adefined task, process or service.
Debt Service – Payment of principal andinterest on an obligation resulting from theissuance of bonds.
Depreciation – The decline in the value of anasset due to general wear and tear orobsolescence.
DBE – Disadvantaged Business Enterprise
Encumbrance – A reservation of funds to coverpurchase orders, contracts or other fundingcommitments that are yet to be fulfilled. Thebudget basis of accounting considers anencumbrance to be the equivalent ofexpenditure.
Enterprise Funds – Funds that are accountedfor in a manner similar to a private business.Enterprise funds usually recover their costs(including depreciation) through user fees. Thecity has five such self-supporting funds:Aviation, Water, Wastewater, Golf and SolidWaste. In addition, the Phoenix ConventionCenter Fund, which is primarily supported byearmarked excise taxes, uses enterprise fundaccounting to provide for the periodicdetermination of net income.
Estimate – The most recent prediction ofcurrent year revenue and expenditures.Estimates are based upon several months ofactual expenditure and revenue information andare prepared to consider the impact ofunanticipated costs or other economic changes.
Excise Tax Fund – This fund is used toaccount for tax revenues ultimately pledged topay principal and interest on various debtobligations. This fund includes local sales taxes,state-shared sales taxes, state-shared incometaxes and sales tax license fees.
Expenditures – Refers to current cashoperating expenses and encumbrances.
Expenditure Limit – See State ExpenditureLimit
Fiduciary Funds – Funds used to account forassets held by the city of Phoenix as a trustee oragent. These funds cannot be used to supportthe city’s own programs.
Fiscal Year – The city’s charter designates July 1 to June 30 as the fiscal year.
FTE – See Full-Time Equivalent Position.
Full-Time Equivalent Position (FTE) – Aposition converted to the decimal equivalent ofa full-time position based on 2,080 hours peryear. For example, a part-time clerk working for20 hours per week would be equivalent to onehalf of a full-time position or 0.5 FTE.
Fund – An independent governmentalaccounting entity with a self-balancing group ofaccounts including assets, liabilities and fundbalance, which record all financial transactionsfor specific activities of government functions.
Fund Balance – As used in the budget, theexcess of resources over expenditures. Thebeginning fund balance is the residual fundsbrought forward from the previous fiscal year.
GAAP – See Generally Accepted AccountingPrinciples.
General Obligation Bonds (G.O. Bonds) –Bonds that require voter approval and finance avariety of public capital projects such as streets,buildings, parks and improvements. The bondsare backed by the “full faith and credit” of theissuing government.
General Funds – Resources derived from taxesand fees that have unrestricted use, meaningthey are not earmarked for specific purposes.
Generally Accepted Accounting Principles(GAAP) – Uniform minimum standards offinancial accounting and reporting that governthe form and content of basic financialstatements. The city's Comprehensive AnnualFinancial Report (CAFR) outlines adjustmentsneeded to convert Phoenix's budget basis ofaccounting to a GAAP basis.
206
GFOA – Government Finance OfficersAssociation
Goal – A statement of broad direction, purposeor intent based on the needs of the community.A goal is general and timeless; that is, it is notconcerned with a specific achievement in agiven time period.
G. O. Bonds – See General Obligation Bonds.
Grant – A contribution by one government unitor funding source to another. The contributionis usually made to aid in the support of aspecified function (e.g., library materials ordrug enforcement, but it is sometimes forgeneral purposes).
HUD – U.S. Department of Housing and UrbanDevelopment
Infrastructure – Facilities that support thedaily life and growth of the city, for example,roads, water lines, sewers, public buildings,parks and airports.
Impact Fees – Fees adopted by the CityCouncil in 1987 requiring new development inthe city's outlying planning areas to pay itsproportional share of the costs associated withproviding necessary public infrastructure.
Improvement Districts – Special assessmentdistricts formed by property owners who desireand are willing to pay for mutually enjoyedimprovements such as streets, sidewalks, sewersand lighting.
In Lieu Property Taxes (or In Lieu Taxes) –An amount charged to certain city enterpriseand federally funded operations that equal thecity property taxes that would be due on plantand equipment if these operations were for-profit companies. This includes the Water,Wastewater, Solid Waste and Public Housingfunds.
Levy – See Tax Levy.
Mandate – Legislation passed by the state orfederal government requiring action or provisionof services and/or programs. Examples includethe Americans with Disabilities Act, whichrequires actions such as physical facilityimprovements and provision of specializedtransportation services.
M/W/SBE – Minority, Women, and SmallBusiness Enterprise
Modified Accrual Basis – Method underwhich revenues are recognized in the periodthey become available and measurable, andexpenditures are recognized in the period theassociated liability is incurred. Mostgovernment accounting follows this method.
Neighborhood Protection Fund – This fund,also referred to as Proposition 301, is used toaccount for the funds generated by the 0.1percent increase in the sales tax approved byvoters in October 1993. The funds are to be usedfor the expansion of police, fire, and blockwatch programs. The breakdown of funding is asfollows: Police 70 percent, Fire 25 percent andBlock Watch 5 percent.
Net Direct Debt Ratio – The ratio betweenproperty tax-supported debt service andsecondary-assessed valuation. The Net DirectDebt Ratio is one way to gauge the ability of alocal property tax base to support generalobligation debt service.
Objective – Desired output-orientedaccomplishments that can be measured andachieved within a given time frame, andadvance the activity and organization toward acorresponding goal.
Operating Funds – Resources derived fromcontinuing revenue sources used to financeongoing operating expenditures and “pay-as-you-go” capital projects.
Ordinance – A formal legislative enactment bythe City Council. If it is not in conflict with anyhigher form of law, such as a state statute orconstitutional provision, it has the full force andeffect of law within the boundaries of the city.
Outstanding Bonds – Bonds not yet retiredthrough principal and interest payments.
Parks and Preserves Fund – This fund isused to account for the funds generated by the0.1 percent increase in the sales tax approved byvoters in 1999 and reauthorized in 2008. Thefunds are to be used for the purchase of statetrust lands for the Sonoran Desert PreserveOpen Space, and the development of regionaland neighborhood parks to enhance communitysafety and recreation.
Pay-As-You-Go Capital Projects – Capitalprojects whose funding comes from day-to day city operating revenue sources.
Percent-for-Art – An ordinance that allocatesup to 1 percent of the city's capitalimprovement budget to fund public art projects.
Personal Services – All costs related tocompensating city employees includingemployee benefits costs such as contributionsfor retirement, social security, and health andindustrial insurance. It also includes fees paidto elected officials, jurors, and election judgesand clerks. It does not include fees forprofessional or other services.
Plan Six Agreements – Agreements to providefunding to accelerate the construction of theWaddell and Cliff dams, and modification of theRoosevelt and Stewart dams, for the benefit ofthe city of Phoenix. These benefits include theuse of additional unappropriated water,controlling floods, improving the safety ofexisting dams, and providing new and improvedrecreational facilities.
PLT – See Privilege License Tax.
Preliminary Budget – A balanced budgetpresented to the City Council by the citymanager (sometimes referred to as the CityManager's Budget) based upon an earlier TrialBudget, City Council and community feedbackand/or changing economic forecasts. Any CityCouncil changes to the Preliminary Budget areincorporated into the final adopted budget.
Primary Property Tax – A tax levy that canbe used to support any public expense.
Privilege License Tax (PLT) – The city ofPhoenix's local sales tax, made up of more than14 general categories.
Privilege License Tax Fees – Includes feescharged for Privilege License Tax (PLT) licensesand the annual fee per apartment unit on therental of non-transient lodging. Fees recover thecosts associated with administering an efficientand equitable system. A PLT license allows thelicensee the privilege to conduct taxablebusiness activities and to collect and remitthose taxes.
207

Program – A group of related activitiesperformed by one or more organizational units.
Property Tax – A levy upon each $100 ofassessed valuation of property within the city ofPhoenix. Arizona has two types of propertytaxes. Primary property taxes support the city'sGeneral Fund and secondary property taxes paygeneral obligation debt.
Proposition 1 – See Public Safety ExpansionFund
Proposition 301 – See NeighborhoodProtection Fund
Public Safety Enhancement Funds – ThePublic Safety Enhancement funds are used toaccount for a 2.0 percent increment of the 2.7 percent sales tax on utilities with franchiseagreements. The Police Public SafetyEnhancement Fund is dedicated to Police andEmergency Management needs and receives 62 percent of the revenues generated. The FirePublic Safety Enhancement Fund is dedicatedto Fire needs and receives 38 percent of therevenues generated.
Public Safety Expansion Funds – This fundis used to account for the 0.2 percent increasein sales tax approved by Phoenix voters in 2007.The funds will be used to add 500 policepersonnel and 100 firefighters to the City ofPhoenix. The Police Department receives 80 percent of revenues, the Fire Departmentreceives 20 percent.
Reappropriated Funds – Funds for contractsentered in a previous fiscal year but which arestill in progress.
Recoveries – Canceled prior yearencumbrances.
Regional Wireless Cooperative (RWC) – Anindependent, multi-jurisdictional organizationthat manages and operates a regional radiocommunications network built to seamlesslyserve the interoperable communication needs offirst responders and other municipal radio usersin and around Central Arizona’s Valley of theSun.
RPTA – Regional Public TransportationAuthority
Resources – Total amounts available forappropriation including estimated revenues,fund transfers and beginning fund balances.
Restricted Funds – See Special Revenue Fund.
Salary Savings – Budget savings realizedthrough employee turnover or vacant positions.
Secondary Property Tax – A tax levyrestricted to the payment of debt service onbonded debt.
Self-Insurance – Self-funding of insurancelosses. With the exception of airport operations,police aircraft operations, and excess generaland automobile liability for losses in excess of$7.5 million, the city is self-insured for generaland automobile liability exposures.
Special Revenue Fund – A fund used toaccount for receipts from revenue sources thathave been earmarked for specific activities andrelated expenditures. Examples include ArizonaHighway User Revenue (AHUR) funds, whichmust be used for street and highway purposes,and secondary property tax, which is restrictedto general-bonded debt obligations.
Sports Facilities Fund – A special revenuefund established to account for revenue raisedfrom a designated portion of the hotel/motel taxand tax on short-term motor vehicle rentals.These funds pay the city's portion of the debtservice and other expenditures related to thedowntown sports arena.
State Expenditure Limit – A limitation onannual expenditures imposed by the ArizonaConstitution as approved by the voters in 1980.The limitation is based upon a city's actual1979-80 expenditures adjusted for interimgrowth in population and inflation. Certainexpenditures may be exempt by the StateConstitution or by voter action.
State-Shared Revenues – Revenues levied andcollected by the state but shared with localgovernments as determined by state governmenteach year. In Arizona, a portion of the state'ssales, income and vehicle license tax revenuesare distributed on the basis of a city's relativepopulation percentage.
Supplemental – Resources to provide new orenhanced programs or services over the basebudget allocation.
Tax Levy – The total amount to be raised bygeneral property taxes for purposes specified inthe Tax Levy Ordinance.
Technical Review – A detailed line-item reviewof each city department's budget conducted bythe Budget and Research Department.
Transit 2000 Fund – This fund is used toaccount for the 0.4 percent sales tax dedicatedto transit approved by voters on March 14, 2000.Also included in this fund are fare boxcollections.
Trial Budget – A budget developed in earlyspring that presents a proposed balanced budgetfor discussion by the City Council and thecommunity before the city manager submits hisor her Preliminary Budget in late spring.
User Fees or User Charges – A fee paid for apublic service or use of a public facility by theindividual or organization benefiting from theservice.
208