The Mechanisms of Wet Clutch Friction Behaviour...The Mechanisms of Wet Clutch Friction Behaviour by...
233
The Mechanisms of Wet Clutch Friction Behaviour by Marc Philip Ingram A thesis submitted to Imperial College London for the degree of Doctor of Philosophy and Diploma of Imperial College (D.I.C.) January 2010 Tribology Section Department of Mechanical Engineering Imperial College London
Transcript of The Mechanisms of Wet Clutch Friction Behaviour...The Mechanisms of Wet Clutch Friction Behaviour by...

The Mechanisms of Wet Clutch Friction Behaviour
by
Marc Philip Ingram
A thesis submitted to Imperial College London
for the degree of Doctor of Philosophy
and Diploma of Imperial College (D.I.C.)
January 2010
Tribology Section
Department of Mechanical Engineering
Imperial College London

I
Abstract
Wet clutches are used in automatic transmissions to bring about gear changes and also to reduce
energy loss in the torque converter. These friction devices are susceptible to stick-slip effects, which
result in the vehicle giving an unsteady ride. Stick-slip effects can be avoided by ensuring the wet
clutch and lubricant combination produces a friction coefficient that increases with sliding speed. This
friction characteristic is achieved by using a specific material on one of the two clutch surfaces and by
using certain surface active chemicals, which are added to the lubricant. Although wet clutches have
been studied throughout the industry for many decades, the mechanism of the generated friction is still
not fully understood. In this thesis the friction mechanisms are clarified by the experimental study of
the wet clutch in terms of its real area of contact, its flash temperatures and the friction characteristics,
which are measured over a broad range of conditions. These results are used along with theoretical
calculations to first clarify the lubrication regime, which is found to be predominantly boundary due to
the roughness of the friction material and the small size of the contact units formed. The generated
friction is then attributed to surface active additives, which form solid-like films on the clutch
surfaces. These friction characteristics can be modified by varying the nature of the solid-like film,
and when a close-packed film is formed, this displays the friction increasing with speed characteristic
due to an activated shearing mechanism, which is linked to the speed of molecular rearrangement at
the surface.

II
Acknowledgments
The author would like to express the greatest thanks to Prof. Hugh Spikes for his wonderful support
and unwavering enthusiasm throughout this project. A grateful acknowledgement is offered to
Infineum for the funding of this project, and I am particularly grateful to the supervisors, Ksenija
Topolovec-Miklozic, Raymond Watts, Joe Noles, Steve Harris and Kerry Cogen for their support and
encouragement.
Special thanks are expressed to Mark Fowell for his assistance with writing a computer program used
in Chapter 4, and Tom Reddyhoff for his assistance with the temperature measurements of Chapter 5.
Richard Underwood, Connor Myant, Mark Torrance, Saverio Reina, Matt Smeeth and Chrissy Stevens
are also acknowledged for their assistance during the course of this work. I would also like to express
my thanks to all other lab members, past and present who together bring a wonderful array of cultures,
personalities and skills, making the lab a wonderfully dynamic and fun place to work.
A loving acknowledgment is shown to my family and Emily who have shown continual love and
support, throughout my time as a student.

III
Table of Contents
Acronyms and Abbreviations………...……………………………………………………………………VII
List of Tables………………………………………………………………………………………….……….IX
List of Figures……………………………………………….………………………………………………….X
1 Chapter 1 - Introduction .............................................................................................................................. 1
1.1 General introduction .............................................................................................................................. 1 1.2 Introduction to the problem .................................................................................................................... 1 1.3 Wet clutch study .................................................................................................................................... 2 1.4 Thesis layout .......................................................................................................................................... 3
2 Chapter 2 - Background ............................................................................................................................... 4
2.1 Automatic Transmission ........................................................................................................................ 4 2.1.1 Torque converter ............................................................................................................................... 6 2.1.2 Planetary Gear Set ............................................................................................................................. 7 2.1.3 Control valve assembly ..................................................................................................................... 8 2.1.4 Transmission Control Unit ................................................................................................................ 9 2.1.5 Bands and Clutches ........................................................................................................................... 9
2.2 Wet Clutches .......................................................................................................................................... 9 2.2.1 Band Brakes ..................................................................................................................................... 10 2.2.2 Multi-plate clutch ............................................................................................................................ 10 2.2.3 Lock-up clutch ................................................................................................................................. 12 2.2.4 Slipping clutch ................................................................................................................................. 12
2.3 Friction Materials ................................................................................................................................. 13 2.3.1 Friction Material History ................................................................................................................. 14 2.3.2 Organic Friction Material Manufacture ........................................................................................... 15
2.3.2.1 Fibres ...................................................................................................................................... 16 2.3.2.2 Fillers ...................................................................................................................................... 17 2.3.2.3 Chemicals ............................................................................................................................... 18 2.3.2.4 Binders .................................................................................................................................... 18 2.3.2.5 Friction Material Mechanical Properties ................................................................................. 20 2.3.2.6 Channel Patterns ..................................................................................................................... 21
2.4 Wet Clutch Friction Characteristics ..................................................................................................... 21 2.4.1 Shifting Clutch ................................................................................................................................. 22 2.4.2 SAE No.2 Machine .......................................................................................................................... 22 2.4.3 Slipping Clutch ................................................................................................................................ 24 2.4.4 Low Velocity Friction Apparatus .................................................................................................... 26 2.4.5 Bench-top Friction Screeners .......................................................................................................... 27 2.4.6 Vehicle Testing ................................................................................................................................ 27
2.5 Summary .............................................................................................................................................. 28
3 Chapter 3 – Literature Review on Wet Clutch Friction .......................................................................... 29
3.1 Wet Clutch Operation Characteristics .................................................................................................. 29 3.1.1 Contact conditions and contact area ................................................................................................ 30 3.1.2 Lubrication Regimes ........................................................................................................................ 31 3.1.3 Lubrication Regime in Wet Clutches............................................................................................... 33 3.1.4 Engagement Regime in Wet Clutches ............................................................................................. 37
3.2 ATF Additives ..................................................................................................................................... 40 3.2.1 Friction Modifiers ............................................................................................................................ 41
IV
3.2.2 Detergents ........................................................................................................................................ 42 3.2.3 Dispersants ...................................................................................................................................... 44
3.3 Summary .............................................................................................................................................. 46
4 Chapter 4 – Contact Properties of Wet Clutch Friction Materials ........................................................ 48
4.1 Introduction .......................................................................................................................................... 48 4.1.1 Friction Material Morphology ......................................................................................................... 49 4.1.2 Friction Material Contact ................................................................................................................. 53 4.1.3 Friction Material Wear .................................................................................................................... 55
4.2 Experimental Method ........................................................................................................................... 57 4.2.1 Contact Visualization Technique ..................................................................................................... 57 4.2.2 Otsu threshold selection ................................................................................................................... 59 4.2.3 Test Samples .................................................................................................................................... 60 4.2.4 Loading System ............................................................................................................................... 61 4.2.5 Rubbing Technique.......................................................................................................................... 61 4.2.6 Fibre Analysis with AFM ................................................................................................................ 62
4.3 Results and Discussion ........................................................................................................................ 63 4.3.1 Contact Unit Distribution ................................................................................................................ 63 4.3.2 Friction Material Contact at Different Pressures ............................................................................. 65 4.3.3 Wear of the Friction Material .......................................................................................................... 67 4.3.4 AFM of fibres .................................................................................................................................. 70
4.4 Summary .............................................................................................................................................. 72
5 Chapter 5 – Friction Material Temperature Measurement .................................................................... 73
5.1 Introduction .......................................................................................................................................... 73 5.1.1 Temperature measurement of clutches and brakes .......................................................................... 74
5.2 Experimental Technique ...................................................................................................................... 76 5.2.1 Infra Red Camera and lenses ........................................................................................................... 78 5.2.2 Calibration ....................................................................................................................................... 79 5.2.3 Samples & Lubricants ..................................................................................................................... 79 5.2.4 Experimental procedure ................................................................................................................... 80
5.3 Results .................................................................................................................................................. 80 5.3.1 Temperature map ............................................................................................................................. 80 5.3.2 Temperature vs. Sliding Time ......................................................................................................... 81 5.3.3 Temperature vs. Speed .................................................................................................................... 83
5.4 Discussion ............................................................................................................................................ 86 5.5 Summary .............................................................................................................................................. 87
6 Chapter 6 – Friction Screener Development ............................................................................................ 89
6.1 Introduction .......................................................................................................................................... 89 6.2 Wet Clutch Friction Screeners Review ................................................................................................ 90 6.3 Mini Traction Machine ........................................................................................................................ 92
6.3.1 Specimens ........................................................................................................................................ 94 6.3.2 Contact Conditions .......................................................................................................................... 96
6.4 MTM Modifications ............................................................................................................................. 97 6.4.1 Loading System ............................................................................................................................... 97 6.4.2 Friction Measurement ...................................................................................................................... 97
6.5 Standard Testing Method ..................................................................................................................... 99 6.6 Evaluation and Limitations ................................................................................................................ 100 6.7 Summary ............................................................................................................................................ 102
7 Chapter 7 – Wet Clutch Study of Industrial Additives ......................................................................... 103
7.1 Introduction ........................................................................................................................................ 103 7.1.1 Additive Mechanisms .................................................................................................................... 104 7.1.2 Temperature variation .................................................................................................................... 105 7.1.3 Overbased detergent films ............................................................................................................. 105
7.2 Experimental ...................................................................................................................................... 105 7.2.1 Friction Screener ........................................................................................................................... 105
V
7.2.2 MTM SLIM ................................................................................................................................... 106 7.2.3 Lubricants ...................................................................................................................................... 106
7.2.3.1 Friction Modifiers ................................................................................................................. 107 7.2.3.2 Dispersants ............................................................................................................................ 108 7.2.3.3 Detergents ............................................................................................................................. 108 7.2.3.4 Blends ................................................................................................................................... 110
7.3 Results ................................................................................................................................................ 110 7.3.1 Industrial additive monoblends ...................................................................................................... 110
7.3.1.1 Friction Modifiers ................................................................................................................. 110 7.3.1.2 Dispersants ............................................................................................................................ 112 7.3.1.3 Detergents ............................................................................................................................. 114
7.3.2 Boundary film formation of the detergents .................................................................................... 115 7.3.3 Industrial Additive Blends ............................................................................................................. 118 7.3.4 Temperature Effects of Industrial Additives ................................................................................. 120
7.3.4.1 Friction Modifiers ................................................................................................................. 122 7.3.4.2 Dispersants ............................................................................................................................ 124 7.3.4.3 Detergents ............................................................................................................................. 125
7.4 Discussion .......................................................................................................................................... 126 7.5 Summary ............................................................................................................................................ 128
8 Chapter 8 – Model Additive Effects in Wet Clutches ............................................................................ 129
8.1 Introduction ........................................................................................................................................ 129 8.1.1 Organic Friction Modifiers ............................................................................................................ 130 8.1.2 Boundary Film Properties .............................................................................................................. 132 8.1.3 High Friction Boundary Films ....................................................................................................... 133
8.2 Method ............................................................................................................................................... 135 8.3 Results and Discussion ...................................................................................................................... 137
8.3.1 Varying alkyl chain length ............................................................................................................ 137 8.3.2 Varying structure ........................................................................................................................... 140 8.3.3 Mixed chain lengths....................................................................................................................... 142 8.3.4 Model FMs with Dispersants ......................................................................................................... 145
8.4 Summary ............................................................................................................................................ 146
9 Chapter 9 – Wet Clutch Friction with Treated Surfaces ...................................................................... 148
9.1 Introduction ........................................................................................................................................ 148 9.1.1 High static friction by the base oil ................................................................................................. 149 9.1.2 Additive Adsorption ...................................................................................................................... 149
9.2 Method ............................................................................................................................................... 150 9.2.1 Dried samples ................................................................................................................................ 150 9.2.2 Plasma cleaning ............................................................................................................................. 150 9.2.3 DLC ............................................................................................................................................... 153 9.2.4 Cellulose Disk ............................................................................................................................... 154 9.2.5 Lubricants ...................................................................................................................................... 154 9.2.6 Friction Screener Method .............................................................................................................. 155
9.3 Results and Discussion ...................................................................................................................... 155 9.3.1 Dried samples ................................................................................................................................ 157 9.3.2 Plasma cleaned .............................................................................................................................. 158 9.3.3 DLC ............................................................................................................................................... 161 9.3.4 Cellulose Disk ............................................................................................................................... 163
9.4 Summary ............................................................................................................................................ 164
10 Chapter 10 - Discussion ............................................................................................................................ 166
10.1 Introduction ........................................................................................................................................ 166 10.2 Prevalent lubrication regime .............................................................................................................. 167
10.2.1 Introduction ................................................................................................................................... 167 10.2.2 Effect of Roughness ....................................................................................................................... 168 10.2.3 Effect of porosity/permeability ...................................................................................................... 169 10.2.4 Effect of contact units on load support .......................................................................................... 170 10.2.5 Fluid lubrication regime at contact units ....................................................................................... 173

VI
10.2.5.1 Possible piezoviscous contribution ................................................................................... 176 10.2.5.2 Effect of ageing ..................................................................................................................... 177
10.2.6 Summary ....................................................................................................................................... 177 10.3 Thin viscous films and solid-like films .............................................................................................. 178
10.3.1 Highly viscous surface film ........................................................................................................... 178 10.3.2 Solid-like adsorbed film ................................................................................................................ 182 10.3.3 High friction boundary film ........................................................................................................... 188 10.3.4 Deviations from the model ............................................................................................................ 190 10.3.5 Friction-speed behaviour of dry contact ........................................................................................ 192 10.3.6 High static friction with base oil .................................................................................................... 192
10.4 Summary ............................................................................................................................................ 199
11 Chapter 11 – Conclusions and Further Work ........................................................................................ 201
11.1 Introduction ........................................................................................................................................ 201 11.2 Experimental study ............................................................................................................................ 201 11.3 Friction mechanisms .......................................................................................................................... 202 11.4 Further work ...................................................................................................................................... 203
References…………………………………………………………………………..…………………………205
Appendix A……………………………………..……………………………………………………………..214
Appendix B…………………………………………………………………..………………………………..217

VII
Acronyms and Abbreviations
2D Two dimensions
3D Three dimensions
AFM Atomic force microscope
AISI American Iron and Steel Institute
AT Automatic transmission
ATF Automatic transmission fluid
CSTCC Continuously-slipping torque converter clutch
CX Alkyl chain, where X is the number of carbon atoms
DC Direct current
Det Detergent
Disp Dispersant
DETA Diethylenetriamine
DLC Diamond-like carbon
ECCC Electronically-controlled converter clutch
ECU Engine control unit
EHL Elastohydrodynamic
FIB Focussed ion beam
FM Friction modifier
HMW High molecular weight
I-EHL Isoviscous elastic
IR Infrared
LMW Low molecular weight
LVFA Low velocity friction apparatus
MMW Medium molecular weight
MTM Mini Traction Machine
MW Molecular weight
PAM Polyamine
PAO Polyalphaolefin
PIB Polyisobutylene
PIBSA Polyisobutylene succinic anhydride
R Alkyl group
RF Radio frequency
RMS Root mean squared
SAE Society of Automotive Engineers

VIII
SLIM Spacer layer image mapping
SRR Slide/roll ratio
TBN Total base number
TCU Transmission control unit
TEPA Tetraethylenepentamine
TGA Thermogravimetric
UV Ultraviolet
w/w weight in weight
XANES X-ray absorption near edge structure
XPS X-ray photoelectron spectroscopy
IX
List of Tables
Table 2.1: Examples of chemicals and materials used in the production of friction materials ..............16
Table 4.1: Navitar parts used to build the optical system ......................................................................59
Table 4.2: Composition of a friction material sample, by thermogravimetric analysis .........................60
Table 6.1: Friction screener sample specifications ................................................................................95
Table 6.2: Composition of the steel alloy AISI 52100 ...........................................................................96
Table 6.3: Friction screener test limits .................................................................................................102
Table 7.1: Physical properties of Nexbase 3030 base oil .....................................................................107
Table 7.2: Details of the commercial friction modifiers studied using the friction screener ...............107
Table 7.3: Structure of Dispersants used in the study ..........................................................................108
Table 7.4: Details of the detergents used in this study .........................................................................109
Table 7.5: The composition and concentration of the four additive blends .........................................110
Table 8.1: The mixing ratio’s used to study the effect on mixed size monolayer films .......................136
Table 8.2: Friction slope equations by three carboxylic acids with varying alkyl chain length...........139
Table 10.1: Viscosity of the PAO 40 base oil ......................................................................................156
X
List of Figures
Figure 2.1: Cut away picture of a automatic transmission, showing the main components ................... 5
Figure 2.2: Schematic diagram of a torque converter ............................................................................. 6
Figure 2.3: Schematic representation of a planetary gear set .................................................................. 8
Figure 2.4: Schematic representation of a band brake ...........................................................................10
Figure 2.5: Exploded schematic diagram of a multi-plate clutch, reproduced from ..............................11
Figure 2.6: Photograph of a multi-plate clutch pack, showing the steel disks and the friction disks .....12
Figure 2.7: Photograph of a torque converter with a slipping clutch .....................................................13
Figure 2.8: The chemical structure of phenolic resin .............................................................................19
Figure 2.9: Representation of the torque in a wet clutch during an engagement ...................................23
Figure 2.10: Representation of a SAE No. 2 result, with the "hunting" effect .......................................23
Figure 2.11: Representation of friction against velocity for a slipping clutch system ...........................25
Figure 3.1: Representation of two rough surfaces in contact .................................................................30
Figure 3.2: Stribeck curve of friction versus the bearing index for a conventional lubricated contact ..32
Figure 3.3: Stribeck curve for a wet clutch contact, reproduced from Miyazaki ...................................34
Figure 3.4: Stribeck curve of a wet clutch contact lubricated with a base oil and a fully formulated
ATF ........................................................................................................................................................35
Figure 3.5: Stribeck curve of a wet clutch contact, with a highly porous friction material, and a lower
porosity friction material ........................................................................................................................36
Figure 3.6: Representation of the Engagement of a Shifting Clutch ......................................................38
Figure 3.7: Three phase model of shifting clutch engagement ..............................................................39
Figure 3.8: Representation of a calcium carbonate particle, surrounded by sulphonate molecules, to
form a detergent .....................................................................................................................................43
Figure 3.9: Molecular structure of a PIBSA PAM dispersant ................................................................45
Figure 4.1: FIB image of a paper based friction material ......................................................................50
Figure 4.2: A three dimensional Talysurf image of a friction material surface .....................................51
Figure 4.3: Microscope image of a individual fibre, isolated from a friction material ..........................52
Figure 4.4: AFM image of a fibre found on a paper based friction material .........................................52
Figure 4.5: Schematic representation of a fibre in intermittent contact with a flat counter-surface ......53
Figure 4.6: Schematic representation of a network of fibres loaded against a flat counter-surface .......54
Figure 4.7: Example of a binary image showing the real area of contact of a friction material as black
pixels on a white background .................................................................................................................55
Figure 4.8: Diagram of the optical set-up used to capture contact images between a friction material
sample and a glass disk ..........................................................................................................................58
Figure 4.9: Diagram of the experimental set-up used during the sliding wear procedure .....................61
XI
Figure 4.10: The full contact area of a 10 mm diameter friction material disk, loaded against a glass
window. ..................................................................................................................................................64
Figure 4.11: Enlarged image of the contact area, showing detailed shapes of the contact units ............65
Figure 4.12: Example binary images showing the increasing real area of contact with pressure. ........65
Figure 4.13: The increase of real contact area and number of individual contact units with nominal
contact pressure for two different size friction material samples.. .........................................................66
Figure 4.14: Example binary image of two contact units, increasing in size with load until they
agglomerate ............................................................................................................................................67
Figure 4.15a & 4.15b: The increase of real contact area and the number of individual contact units for
a friction material during a dry sliding wear process. ............................................................................67
Figure 4.16: The increase of real contact area for a friction material during a lubricated sliding wear
process. ...................................................................................................................................................68
Figure 4.17: Diagram of a cross section of a resin coated cellulose fibre with increasing sliding
distance due to a truncating wear mechanism, .......................................................................................68
Figure 4.18: The average contact unit size during the dry sliding test ..................................................69
Figure 4.19: Microscope image of the worn friction material, with the corresponding raw contact
image and the binary contact image .......................................................................................................70
Figure 4.20: AFM images of two fresh fibres with corresponding line profiles ....................................71
Figure 4.21: AFM images of two worn fibres with corresponding line profiles ....................................71
Figure 5.1: Photograph of the IR temperature experimental set-up ......................................................77
Figure 5.2: Schematic representation of sample housing for the IR temperature measurement ...........78
Figure 5.3: Temperature map of BW6100/Cr surface sliding at 0.436 m/s with a 20 N load. ...............81
Figure 5.4: Graph of the contact unit temperature change for three friction materials during a constant
sliding speed of 0.430 m/s and 20 N load for 1 hour, in a dry contact ...................................................82
Figure 5.5: Graph of the contact unit temperature change for three friction materials during a constant
sliding speed of 0.430 m/s and 20 N load for 1 hour, in a base oil lubricated contact ...........................82
Figure 5.6: Graph of the contact unit temperature change for three friction materials during a
increasing sliding speed test at 20 N load, in a dry contact ....................................................................84
Figure 5.7: Graph of the contact unit temperature change for three friction materials during a
increasing sliding speed test at 20 N load, in a base oil lubricated contact ............................................84
Figure 5.8: Graph of the contact unit temperature change for the BW1777 friction materials during
increasing sliding speed test at 20 N load, in a ATF lubricated contact, at room temperature ..............85
Figure 5.9: Graph of the contact unit temperature change for the BW1777 friction materials during a
increasing sliding speed test at 20 N load, in a ATF lubricated contact, at 100 °C ...............................85
Figure 6.1: Friction material test piece configuration used by Gao .......................................................91
Figure 6.2: Diagram of a Mini Traction Machine .................................................................................93
Figure 6.3: Diagram of the specimen configuration within the MTM ...................................................94
XII
Figure 6.4: Macroscope image of a steel ball, used as the upper specimen in the MTM .......................95
Figure 6.5: Macroscope image of a friction material disk, manufactured for use on a MTM ...............96
Figure 6.6: Graph of the repeatability evaluation, of the friction screener with a base oil ..................100
Figure 6.7: Graph of the repeatability evaluation, of the friction screener with a ATF .......................101
Figure 7.1: Molecular structure of a Polyisobutenyl succinic anhydride polyamine (PIBSA PAM)
dispersant ..............................................................................................................................................108
Figure 7.2: Molecular structure of a Calcium Sulphonate molecule ....................................................109
Figure 7.3: Graph of the friction results of four industrial friction modifiers ......................................111
Figure 7.4: Graph of the friction results of three dispersants with varying PIB molecular weight ......112
Figure 7.5: Graph of the friction results of two dispersants with varying polyamine ..........................113
Figure 7.6: Graph of the friction results of three industrial overbased detergents ...............................114
Figure 7.7: Graph of the friction coefficient versus sliding speed for a neutral and overbased detergent.
..............................................................................................................................................................115
Figure 7.8: Graph of the film thickness of the boundary films formed by three detergents measured
during a MTM SLIM sliding/rolling test .............................................................................................116
Figure 7.9: Interference images showing the build up of a boundary film on the surface of a steel ball
during rubbing ......................................................................................................................................116
Figure 7.10: Friction versus entrainment speed after 120 minutes of sliding in the MTM SLIM test .117
Figure 7.11 to 7.14: Graphs of the friction results comparing four blends…………………………..119
Figure 7.15: Graph of the friction of a wet clutch contact lubricated with a base oil at 50, 100 and 150
°C .........................................................................................................................................................121
Figure 7.16: Graph of the friction of a wet clutch contact lubricated with a ATF at 50, 100 and 150 °C
..............................................................................................................................................................122
Figure 7.17 to 7.20: Graphs of the friction results of four FMs with varying temperature ..................123
Figure 7.21 to 7.24: Graphs of the friction results of four dispersants with varying temperature .......124
Figure 7.25 to 7.27: Graphs of the friction results for three detergents with varying temperature ......125
Figure 8.1: Schematic representation of a FM film between two surfaces ..........................................130
Figure 8.2: Idealised representation of two mixed size FM monolayer on opposing surfaces ............134
Figure 8.3: Molecular structures of four carboxylic acids used to study the effect of some structural
changes of the friction characteristics in a wet clutch ..........................................................................136
Figure 8.4: Graph of the friction characteristics of three carboxylic acid model friction modifiers with
varying alkyl chain length ....................................................................................................................137
Figure 8.5: Graph of the friction characteristics of three primary amine model friction modifiers with
varying alkyl chain length ....................................................................................................................138
Figure 8.6: Graph of log friction coefficient versus log sliding speed for three carboxylic acids ......139
Figure 8.7: Graph of the friction characteristics of C18 acids with varying structures ........................140

XIII
Figure 8.8: Graph of the friction characteristics of model friction modifier blends at varying ratio’s
..............................................................................................................................................................143
Figure 8.9: Graph of the friction characteristics of three model FM blends compared to the result for
C6 and C12 acid ...................................................................................................................................144
Figure 8.10: Graph of the friction coefficient at 10 mm/s sliding speed against the molar ratio of the
model friction modifier mixtures .........................................................................................................145
Figure 8.11: Graph of the friction characteristics when a dispersant is combined with a model friction
modifier ................................................................................................................................................146
Figure 9.1: Picture of a friction material disk, with four water drops on the surface, demonstrating the
hydrophobic nature of the material ......................................................................................................152
Figure 9.2: Picture of a friction material disk after plasma cleaning for two hours, three water drops
were applied to the surface ...................................................................................................................152
Figure 9.3: Optical microscope images of the friction material before and after the DLC coating
process ..................................................................................................................................................154
Figure 9.4: Graph of the friction characteristics of steel on friction material, after the drying process,
and lubricated with a base oil ...............................................................................................................155
Figure 9.5: Contact image of a friction material against a glass disk, a) dry, b) lubricated .................156
Figure 9.6: Graph of the friction characteristics of steel on friction material, lubricated with
hexadecane, at 1, 3 and 6 N load ..........................................................................................................156
Figure 9.7: Graph of the friction characteristics of dried test samples, steel on friction material ........157
Figure 9.8: Graph of the friction characteristics of a base oil with standard specimens and a plasma
cleaned disk ..........................................................................................................................................158
Figure 9.9: Graph of the friction characteristic variation when a plasma cleaned disk is exposed to the
atmosphere ...........................................................................................................................................159
Figure 9.10: Graph of the friction characteristics of a ATF with standard specimens and a plasma
cleaned disk ..........................................................................................................................................160
Figure 9.11: Graph of the friction characteristics of water with standard specimens and a plasma
cleaned disk ..........................................................................................................................................160
Figure 9.12: Graph of the friction characteristics of a base oil with all four DLC coating combinations
..............................................................................................................................................................161
Figure 9.13: Graph of the friction characteristics of a model friction modifier with all four DLC
coating combinations ...........................................................................................................................162
Figure 9.14: Graph of the friction characteristics for DLC ball on SD1777 friction material, dry and
lubricated ..............................................................................................................................................163
Figure 9.15: Graph of the friction characteristics for a steel ball on a cellulose disk, dry and lubricated
..............................................................................................................................................................164

XIV
Figure 10.1: Graph of friction coefficient versus Log ηv/P for a PAO 40 base oil at 40, 60, 80 and
100°C ...................................................................................................................................................169
Figure 10.2: Geometry of a square linear pad bearing .........................................................................171
Figure 10.3: Schematic diagram of an array of contact units ...............................................................172
Figure 10.4: EHL lubrication map indicating the regime of the contact unit lubrication regime ........174
Figure 10.5: Graph of the calculated central film thickness for a contact unit, using isoviscous-elastic
theory....................................................................................................................................................175
Figure 10.6: Graph of the calculated friction coefficient for a contact unit, using isoviscous-elastic
theory....................................................................................................................................................176
Figure 10.7: The relative viscosity profiles used in the viscous thin-film analysis..............................180
Figure 10.8: Graph of the calculated film thickness using an extended Reynolds equation ................180
Figure 10.9: Graph of the calculated friction coefficient using an extended Reynolds equation .........181
Figure 10.10: Graph showing the pseudo "Stribeck" curve on a log/log plot of friction coefficient
versus sliding speed ..............................................................................................................................182
Figure 10.11: Graph of the shear strength versus sliding speed results by Briscoe .............................183
Figure 10.12: Graph of the shear strength versus sliding speed results by Chugg ...............................184
Figure 10.13: Graph of the approximate shear strength versus the natural logarithm of sliding speed for
a wet clutch lubricated with three model friction modifiers.................................................................186
Figure 10.14: Variation of the shear strength of the films formed by dodecanoic and stearic acid in the
wet clutch friction screener. .................................................................................................................187
Figure 10.15: Representation of the friction coefficient variation with sliding speed for a friction
modifier solution and a friction modifier + friction enhancer solution ................................................188
Figure 10.16: Representation of two flat surfaces separated by a friction modifier monolayer .........189
Figure 10.17: Representation of a friction modifier film incorporating a large dispersant molecule .189
Figure 10.18: Representation of a friction modifier film incorporating a large branched detergent
molecule ...............................................................................................................................................189
Figure 10.19: Representation of the friction coefficient variation with sliding speed for a dry and a
base oil lubricated wet clutch ...............................................................................................................193
Figure 10.20: A 2d representation of a wetting liquid between two solid surfaces .............................194
Figure 10.21: Diagram of the lubricant meniscus formed between a ball and a disk..........................195
Figure 10.22: Diagram of the meniscus bridges formed between the friction material fibers and the
steel ball...............................................................................................................................................196
Figure 10.23: Diagram of the contact angle between a fibre and the steel surface, before and after the
plasma treatment ..................................................................................................................................197

1 .
Chapter 1
Introduction
1.1 General introduction
Wet clutches are used within automatic transmissions for two primary functions. The first is to change
gear ratios, which is achieved by the engagement and disengagement of different wet clutches, which
allows the vehicle to accelerate and decelerate seamlessly. The second function of the wet clutch is to
directly couple the engine to the gear box at high speeds, bypassing the inefficient torque converter,
which is only required at lower vehicle speeds. Wet clutches are high friction interfaces, which
operate both as brakes and as a device to transmit torque. They are vital to the operation of the
automatic transmission and any shortcoming of the clutch performance is translated into poor vehicle
performance.
1.2 Introduction to the problem
The lubrication requirement of wet clutches differs from most other engineered components. Most
engine and transmission parts that are subject to a moving contact must be lubricated to reduce friction
and wear and to transport heat and debris away from the contact. In a wet clutch, a lubricant is used

2
for heat and debris removal and to reduce wear, but it is desirable to have the highest possible friction
coefficient, as this increases the efficiency of the clutch and enhances its performance, leading to
shorter gear changes and greater vehicle acceleration.
Under certain conditions wet clutches are susceptible to stick-slip and self excitation effects. These
can cause undesirable noise and vibration in the vehicle. To avoid these effects, the wet clutch should
have a friction coefficient that increases with sliding speed, over the entire operational range. Wet
clutch manufactures and automatic transmission fluids (ATFs) formulators have therefore strived to
maintain a positive gradient friction coefficient versus sliding speed within their systems, with high
values of friction. This is achieved by the use of friction material on the clutch surfaces and chemical
additives in the ATF. Although the industry has been successful at increasing the performance of wet
clutches, the mechanisms of the generated friction are not fully understood.
1.3 Wet clutch study
In this thesis these friction mechanisms are studied using three primary methods:
(i) A contact visualisation technique is used to study the contact properties of the wet clutch.
(ii) An infrared temperature mapping technique is used to measure the flash temperatures in a wet
clutch-type contact.
(iii) A friction screener is used to study the friction generated within a wet clutch-type contact over
a variety of conditions.
Contact visualisation is used to collect geometrical data on the contact units formed in a wet clutch.
The geometrical data can then be used to clarify the lubrication regime of the slipping wet clutch using
conventional hydrodynamic and elastohydrodynamic theory. The infrared mapping technique is then
used to measure the flash temperatures generated at these units over a variety of conditions, to increase
the understanding of the change in temperature on the generated friction. The friction screener is used
to study the friction characteristics of the wet clutch over many conditions, which builds up a broad
picture of the mechanisms, imparted by chemical additives and friction surfaces.

3
The experimental results from all three techniques can then be used, along with theoretical
calculations for film thickness and friction coefficient to suggest the mechanism of the friction
generated within slipping wet clutches.
1.4 Thesis layout
This thesis will first offer a background to the subject of wet clutches in Chapter 2, including what
they consist of, where they are found, how they operate and how they are currently tested. Chapter 3
is a literature review on the subject of wet clutches and the additives used in the ATF to modify the
friction characteristics. This reviews the current understanding of the wet clutch friction
characteristics, including both shifting and slipping clutches.
Chapters 4 to 9 are the experimental chapters, including the three primary techniques used for the
investigation. Chapter 4 describes a contact visualisation technique, used to observe the wet clutch
contact, over a range of loads and during a sliding wear procedure. Chapter 5 contains the results from
a flash temperature study on wet clutch friction materials, using an infrared mapping technique.
Chapter 6 describes a friction screener that has been developed to study the friction characteristics of a
wet clutch contact over a range of conditions. The results obtained using this screener are detailed in
Chapters 7, 8 and 9. Chapter 10 is a discussion which brings together the results contained within this
thesis, along with some calculations to underpin suggestions of the origins of the friction behaviour
within the wet clutch.

4
2 .
Chapter 2
Background
In this chapter an introduction of wet clutches is given, by describing an automatic transmission and
how wet clutches are used during its operation. The friction materials used on wet clutches are also
described by discussing their manufacture and composition. Finally the testing methods used to study
the friction of wet clutches are considered. The aim of this chapter is to give the reader a basic
understanding of wet clutches.
2.1 Automatic Transmission
Automatic transmissions (AT’s) are used in a vehicle to control the torque transmitted from the engine
to the driving wheels. They contain a range of reduction gears, allowing the vehicle to move at low
speeds and accelerate from a standstill to its top speed. All gear changes and gear selection are
handled by the AT, removing the need for a driver to operate a manual clutch and select the
appropriate gears. The AT was first introduced by General Motors in 1939 [1] and is favoured over
manual transmissions in some countries such as the USA and Japan. In the UK, manual transmissions
are favoured overall, although ATs are more common in vehicles with an engine capacity above 2.5
litres [2].

5
An AT contains several components which handle gear changes, provide all available gear ratios and
ensure a smooth ride. Figure 2.1 is a cutaway picture of an AT showing the components that make up
the transmission. Engine power is transmitted to the AT through the torque converter. The power is
then passed through the transmission via the planetary gear sets to the output shaft which is connected
to the driving wheels. The location of the torque converter, some shifting clutches and planetary gear
sets are shown.
Figure 2.1: Cut away picture of a automatic transmission, showing the main components [3]
The AT is a complex vehicle system containing many components. Its primary function is to provide
reduction gears between the engine and the driving wheels. This is achieved by using planetary gear
sets which provide several reduction gears and a reverse gear. Wet clutches are used to change the
reduction gear ratio by locking-up and engaging different parts of the planetary gear set. Wet clutches
are also now commonly found in the torque converter, to directly couple the engine to the gear box.
The main components of the transmission, the torque converter, planetary gear sets, transmission
control unit and the wet clutches are described below.
Torque Converter
Shifting Clutch
Planetary Gear Set

6
2.1.1 Torque converter
The torque converter is a hydraulic link between the engine and the transmission. In the torque
converter all the engine power is transferred to the transmission by the momentum of a fluid between
two sets of angled blades. This allows the engine to idle without stalling when the vehicle is
stationary, and at low speeds, when a large difference in speed exists between the engine speed and the
speed of the transmission turbine shaft, it provides a variable amount of torque multiplication. The
torque converter thus acts as a reduction gear, which allows the vehicle to accelerate rapidly. It also
acts as a fluid coupling between the engine and the driving wheels, adsorbing any torque fluxes from
the engine, removing them from the drivetrain and ensuring a smooth ride.
Torque converters contain a pump, a turbine and a stator (Figure 2.2). The pump and the turbine have
specially angled blades, which are designed to transmit torque via a fluid link between the two
components. The pump is linked to the engine, and rotates at the same rate, driving fluid from its
blades onto the accepting blades of the turbines. The torque is thus transferred to the turbine and the
transmission turbine shaft solely via the fluid. A stator reverses the flow of the fluid exiting the
turbine, so that it re-enters the pump in the same direction as the pump rotation, eliminating the drag
effect of the fluid and the strain on the engine, increasing the efficiency of the torque converter [4].
Figure 2.2: Schematic diagram of a torque converter [4]
Pump Turbine
Stator
Housing
Engine Crankshaft Turbine Shaft

7
At low vehicle speeds the torque converter is ideal for providing torque multiplication, allowing
greater acceleration of the vehicle. However energy is lost as heat to the fluid and to the turbine,
making the torque converter inefficient. At higher driving speeds, when the vehicle is cruising at a
constant speed, engine fluctuations are no longer a concern, so the torque converter is no longer
needed. The pump and the turbine can be locked together, to provide a mechanical link between the
engine and the turbine shaft. This removes the fluid link of the torque converter and its associated
losses from the drivetrain, improving fuel economy. This operation is carried out by a “lock-up” wet
clutch.
Driven by the need to increase fuel economy further, in modern ATs the torque converter is locked-up
at lower driving speeds, when engine fluctuations are still a concern. This is done by a slipping clutch,
which reduces the speed difference between the torque converter pump and turbine and can slip to a
certain extent, adsorbing any engine speed fluctuations and removing them from the drivetrain. Thus
torque converters, especially more recent examples, will contain a wet clutch to improve efficiency.
These are discussed further in section 2.2.
2.1.2 Planetary Gear Set
A planetary gear set (also called epicyclic gears) contain three types of gears: a sun gear, a ring gear
and 3 or 4 planet gears (Figure 2.3). Each gear type can be the torque input, the torque output or be
held stationary. For torque to be transmitted one of the gears must be held stationary.

8
Figure 2.3: Schematic representation of a planetary gear set
One planetary gear set can provide three different gear ratios, two forward and one reverse. The gear
ratio will depend on the size and number of teeth of each gear component. By using two planetary
gear sets in a row, four forward gear ratios can be achieved and one reverse, as is found in many ATs.
This configuration can be seen in Figure 2.1.
Wet clutches are used to control the planetary gear sets by linking the gears to inputs and outputs, or
by holding them stationary. During a gear change the clutches can engage and disengage
simultaneously, changing the path that the torque is directed through the transmission. Each different
path through the transmission will provide a different gear ratio. The time of engagement is thus
dependent on the wet clutch performance and ultimately on the friction value.
2.1.3 Control valve assembly
In earlier vehicles, control of the transmission was handled by a control valve assembly, usually
housed on the underside of the transmission. The control valve assembly consists of many channels
and valves used to detect pressure and direct fluid to different areas of the transmission as required.
The inputs to the control unit are the gear selector, throttle and a governor. The gear selector and
throttle are both controlled by the driver while the governor senses road speed from the transmission
output shaft. The variation of all three inputs will change the hydraulic pressure on different valves
Ring gear Planet gear
Sun gear

9
within the control. At set limits fluid is directed to different parts of the transmission which activate a
gear change.
2.1.4 Transmission Control Unit
The Transmission Control Unit (TCU) uses inputs from the vehicle, driver and the Engine Control
Unit (ECU) to calculate how the transmission should operate for optimum performance. The TCU has
the same function as the control valve assembly in older transmissions, but being electronically
controlled rather than mechanically controlled, the control of the transmission is more precise and can
be altered dynamically during operation. This has led to more efficient transmissions and therefore
more fuel efficient vehicles. The TCU has also allowed user-definable transmission performance,
such as “Sport” mode, which has gear changes at higher engine speeds, giving faster acceleration but
compromising on fuel economy.
2.1.5 Bands and Clutches
Bands and clutches are friction devices engaged by hydraulic pressure used to prevent motion (brakes)
or to transmit torque. All clutches found in a automatic transmission are exposed to the circulating
lubricant, and are referred to as “wet clutches”, as opposed to “dry” clutches found elsewhere.
2.2 Wet Clutches
Wet clutches are used within the automatic transmission to bring about a gear change or to transfer
torque directly from the engine to the transmission, bypassing the torque converter. The clutches can
be broadly classified into four categories:
(i) Band brake
(ii) Multi-plate clutch
(iii) Lock-up clutch
(iv) Slipping clutch
Multi-plate clutches and band brakes are used to activate gear changes within the transmission, while
lock-up and slipping clutches are used to reduce the power losses within the torque converter.

10
2.2.1 Band Brakes
A band brake is a steel strip with friction material bonded onto one of its sides, wrapped around a
rotating drum. One end of the band is anchored whilst the other is connected to a piston or lever. The
drum is usually the ring gear of a planetary gear set. When the piston or lever is activated, the band
tightens around the drum, preventing it from rotating. A schematic diagram of a band brake unit is
shown in Figure 2.4.
Figure 2.4: Schematic representation of a band brake [5]
The torque applied in the band brake is dependent on the direction of rotation. In the system shown in
Figure 2.4, the drum is rotating clockwise and when engaged, the band will tighten around the drum
and a large amount of friction will occur. This is called a self-energizing system. If the drum is
rotating counter-clockwise, when the band is applied the system will loosen the band so lower friction
will occur between the surfaces. This is called a de-energizing system. Band brakes are used in
conjunction with multi-plate clutches to bring about gear changes in the transmission. They are
smaller and lighter than multi-plate clutches, and are also used elsewhere in speed control systems due
to their changing torque capacity [5].
2.2.2 Multi-plate clutch
A multi-plate clutch consists of several annular disks, which are spline-coupled alternatively to the
inner and outer housing. An exploded diagram of a multi-plate clutch is shown in Figure 2.5. The
friction material is bonded to both sides of every alternate disk and these disks are called the friction
plates or the friction disks. A photograph of a clutch “pack” is shown in Figure 2.6, which is in the
same alternative configuration as it is in the clutch housing. In this example, the steel disks are splined
Piston
Band
Anchor
Drum

11
to the outer housing, and the friction disks to the inner housing. Contact in a wet clutch always occurs
between friction material and steel.
The two sets of disks, those with friction material and those without, are held apart by a spring,
allowing them to rotate independently when disengaged. To engage the pack, a force is applied
through the disks loading them all together, reducing any speed difference to zero. Multi-plate
clutches are used to activate gear changes in the transmissions, and it is desirable to have fast gear
changes to aid in better acceleration of the vehicle. So the time of a clutch pack engagement is short,
usually under one second, during which time a large amount of torque is transferred until both surfaces
are rotating at the same speed. A disk pack containing several disks is used because this gives a large
surface area and can therefore transmit a greater torque force.
Figure 2.5: Exploded schematic diagram of a multi-plate clutch, reproduced from [6]

12
Figure 2.6: Photograph of a multi-plate clutch pack, showing the steel disks and the friction disks
The friction disks shown in Figure 2.6 have a channel pattern cut into the friction material. These
channels allow lubricant to flow out from between the surface during an engagement and can also
allow the lubricant to flow to the surfaces when engaged, aiding in heat removal.
2.2.3 Lock-up clutch
The lock-up clutch is used at higher vehicle speeds when torque multiplication in the torque converter
is no longer needed. It is usually situated between the torque converter housing and the turbine and,
when engaged, the turbine and the impeller are locked together, eliminating the power losses of the
fluid link. The input and output speed of the torque converter will then be equal.
2.2.4 Slipping clutch
The continuously slipping clutch, also called the continuously slipping torque converter clutch
(CSTCC) or the electronically-controlled converter clutch (ECCC), is a relatively new addition to
ATs, and replaces the lock-up clutch. While the lock-up clutch can only enhance fuel economy at
higher speeds, the continuously slipping clutch allows power losses to be reduced at lower speeds,
which constitutes the majority of urban driving conditions, while still allowing total lock-up of the
torque converter at high speeds. The slipping clutch, like the lock-up clutch is placed between the
torque converter housing and the turbine (Figure 2.7), and can reduce the speed difference between
Steel disk Friction disk

13
these two components, providing a mechanical link between them. During operation the load applied
to the slipping clutch is controlled to allow a small amount of sliding between the surfaces. This
reduces the relative speeds of the input and output of the torque converter, increasing efficiency while
also adsorbing the engine torque fluctuations, giving a smooth ride.
Figure 2.7: Photograph of a torque converter with a slipping clutch [7]
The slipping clutch, like the shifting clutch, has two different disks, a steel disk and a friction disk.
The friction disks are coated with a friction material which is vital for the operation of the clutches,
and is discussed below with regard for its history, manufacture, composition and mechanical
properties.
2.3 Friction Materials
Friction materials are used on surfaces of vehicle components that require high friction. They are used
in brakes, clutches and wet clutches. In a wet clutch the friction material must have the following
properties:
Resistant to wear when rubbed against steel
Able to maintain a high friction coefficient throughout its lifetime
Very rough, ensuring operation in the boundary lubrication regime (and thus high friction)
Slipping Clutch

14
Resistant to stick-slip
Cost effective
The friction materials used are usually a composite, containing many different materials, utilising their
individual properties in order to form a finished material with all the desired characteristics. Friction
materials have been used in wet clutches since the advent of the AT, and are complex in composition
and structure. The history of the friction material will first be discussed followed by the
manufacturing processes and materials used in the current production.
2.3.1 Friction Material History
Historically, asbestos was the material of choice, because it has the following properties:
Resistant to wear
Low cost
Flexible
Maintain a stable friction value over a range of temperature
In 1981 it was estimated that over 95 percent of friction materials manufactured were based on
asbestos, but health concerns and new regulations prompted its withdrawal from the marked and in the
mid 1980s asbestos-based friction materials were replaced, mainly with cellulose-based friction
materials. These health concerns also prompted the introduction of new controls for the handling of
old asbestos friction materials when being serviced or replaced by mechanics. To reduce the exposure
of the mechanics to the harmful dust released by the asbestos, the clutches (and some brake linings)
were handled using low pressure enclosures, and wetting methods. In 1989, the United States
Environmental Protection Agency banned the use of asbestos in friction materials [8].
The replacement cellulose materials cost 25 percent more than the asbestos product, but had a similar
durability [9]. Early cellulose based friction materials were strengthened with fibreglass, Kevlar®, or
both. An early observation with fibreglass was that the fibres tended to break loose, travelling through

15
the lubricant and caused abrasive wear elsewhere in the transmission. This limited the use of
fibreglass in wet clutch friction materials. Sintered bronze materials were also used since these
materials have a higher thermal conductivity than organic (cellulose) friction materials and can
therefore withstand much higher operating temperatures. Sintered bronze materials are used in
applications with low oil flows, but are known to give lower friction than organic friction materials
[9].
Current friction materials used in wet clutches in passengers cars are mostly cellulose-based, and are
strengthened with phenolic resin. Over the years the size and weight of the transmission are being
continuously reduced, so the friction materials are required to handle greater torque forces over a
smaller area, putting greater stresses on the material. This has led to the strengthening of the
cellulose-based materials with other materials. In more demanding applications such as in heavy duty
transmission found within large trucks, carbon fibre and Kevlar® are sometimes used instead of
cellulose fibres [10]. These carbon fibre-based materials are more resistant to wear in these
demanding applications, and have a better heat conductivity.
2.3.2 Organic Friction Material Manufacture
Organic friction materials are manufactured in a similar manner to everyday paper, using the same
basic process and equipment [11]. The only major difference is the addition of a large quantity of
resin at the final stage of production, to increase the strength of the paper material. Paper is made by
mixing fibres, fillers and chemicals in water, to produce a “stock” which is then dried on a wire mesh
travelling at a high speed, and pressed into rolls of base paper. During the drying process, the
capillary action of water between the fibres bring them into close proximity of each other, and they are
held together by hydrogen bonding between the hydroxyl groups on the cellulose and hemicelluloses
molecules. The paper material formed consists of a three dimensional matrix of randomly-oriented
individual fibres, intertwined and held together at the overlapping junctions to form a strong material.
The fillers and chemicals which are also present are retained at random locations on the fibre surfaces
during drying.

16
This base paper is then passed through a liquid mixture of two chemicals (usually phenol and
formaldehyde) which react during a curing process to form a resin, which is a solid. The resulting
friction material is then bound to a steel component ready for housing in the transmission.
The end friction material can contain between four and twenty different materials, which in
combination produce a composite material with desirable properties for use in a transmission. The
material must be porous, resistant to heat and have both low static friction and high sliding friction that
do not vary with temperature to a great extent.
Some commonly used friction material components are listed in Table 2.1.
Table 2.1: Examples of chemicals and materials used in the production of friction materials
A friction material used in a wet clutch will usually contain at least one material from each group,
although most friction materials will contain several materials from each group. Friction material
selection is usually done using a large testing matrix, where lots of different candidate friction
materials which contain a large variety of mixtures are tested. The friction material with the best
performance is normally used [9]. Of course the material used must sometimes be a compromise
between cost and performance.
The selection of a friction material can be complicated further because each material can be varied by
its production method. Each type of material used to make a friction material is described in more
detail below.
2.3.2.1 Fibres
Fibres are primarily used in friction materials to form a strong, porous paper material, with a rough
surface. This allows the lubricant to circulate within the material, keeping it cool, and prevents
Fibres Cellulose, Cotton linter, Aramid, Kevlar, Carbon fibre, Lapinus, Basalt
Fillers Sintered bronze, Diatomaceous earth, clay, Silicone particles, Cashew dust, Barites,
Calcium carbonate,
Chemicals Friction modifiers, graphite, alumina, chromium oxide, silicone
Binders Phenolic resin, modified phenolic resin, cresylic phenolic resin
17
hydrodynamic film build up at high rotational speeds. Fibres are a large percentage of the total weight
in most friction materials. A typical friction material will be made up of 40 % by mass of fibres. In
organic friction material the fibres used are usually cellulose fibres derived from plants and trees [11].
During paper manufacture, the fibres are diluted to about 1% of fibre weight in water, and dried on a
wire mesh, to produce a randomly-oriented, three dimensional matrix of fibres, with the fibres
randomly oriented mainly in a plane parallel to the wire mesh.
The properties of the paper material can be changed by varying some of the properties of the fibres,
such as fibre morphology, specific weight, length, diameter, and fibril configuration [11-13]. The
pulping agents and the pulping process used to manufacture the paper also have a large effect on the
properties of the resulting paper.
The type of fibres, the density of fibres and the production method can all affect the porosity of the
final material. Fibrillation – a process used in paper manufacturing that makes the surfaces of the
fibres rough, can alter the measured porosity of the material, and thus its performance. Fibrillation
increases the angle between the fibrils and the fibres, where fibrils are small cellulose “scales” on the
outer surface of organic fibres. Fibrillation can also increase the surface area of the fibres and thus the
number of inter-fibre bonds, increasing the overall strength of the material.
The fibres used in friction materials are usually a blend of different types of fibres. Cellulose fibre is
used primarily in passenger car wet clutch friction material and these can be reinforced with other
fibres such as Aramid and Kevlar® to increase the strength of the final material. Other fibres derived
from glass and steel are also occasionally found. Carbon fibre is increasingly being used in more
demanding applications, but has been limited by its high cost.
2.3.2.2 Fillers
Fillers are added to augment the hardness and the heat capacity of the friction material. They are
usually relatively cheap materials such as naturally-occurring minerals and even fly ash [14]. During
the papermaking process, the filler material is retained at random points in the fibre matrix, and
embedded in some fibres. It therefore affects the morphology of the material, reducing the porosity.

18
Fillers can also affect the friction coefficient, when present on the surface of the friction material.
Some fillers are chosen because of their high heat capacity which prevents the clutch from reaching
high temperatures, and thus increases its service life, as well as improving performance.
The mixing ratio between fibres and filler materials affects the physical and chemical properties of the
final friction material. Generally, the greater the percentage of filler, the harder the friction material,
and the higher its friction coefficient. However, as the filler content is increased, the porosity of the
material is reduced as more of the fibre matrix is filled with filler material. This makes the material
less resistant to heat, due to poor lubricant circulation through the bulk of the material. Also the lack
of fibres means loss of a strong three dimensional matrix, eventually producing a friction material with
lower strength.
2.3.2.3 Chemicals
Certain chemicals are added to influence the frictional characteristics of the friction material. Friction
modifier type additives and solid lubricants like graphite are used to decrease the low speed friction
coefficient of the material. This can eliminate undesirable stick-slip effects. Abrasive particles such
as aluminium oxide can be added to increase the overall friction coefficient of the material.
2.3.2.4 Binders
The binder impregnates and covers the base paper containing the fibre, fillers and chemicals to
produce the friction material. The binder increases the mechanical strength of the material, its heat
resistance and its wear resistance. It can also influence the friction coefficient.
The binder covers the entire material and is present on the surface of the material. It is exposed to the
sliding condition against the steel counter-surface so it important that it provides the desired friction
characteristics without causing significant amounts of wear.
The binder contributes to the strength of the material by bonding crossing fibres together [15].
Cellulose fibres in paper materials are held together by hydrogen bonding and this inter-fibre bonding
is augmented with the resin. Binders must be thermally stable and oxidation resistant at high
temperatures. Phenolic resins are commonly used binders which do not begin to decompose until a

19
temperature of above 300 °C is reached. This is an important feature of friction materials, because the
surfaces of a clutch can reach temperatures over 200 °C during an engagement.
Phenolic resins, are formed in a reaction between phenol and formaldehyde. This thermosetting
reaction produces a resin with a three dimensional network structure which is very thermally and
chemically stable (Figure 2.8).
Figure 2.8: The chemical structure of phenolic resin [16]
The phenolic resin can be modified by varying the mole ratio of phenol and formaldehyde and by
using different catalysts. This can change the molecular weight and eventual pH of the material, and
can produce binders with varying properties. Generally, the higher the mole ratio of formaldehyde,
the greater the bridging density of the phenol resin, and thus the greater its strength. But it is also an
advantage to have an abundance of free phenol, as this can strengthen the chemical bonding between
the fibres and the resin, forming a more adherent coating. Simple phenolic resins can be modified by
the addition of other ingredients such as epoxy, rubber and cardanol [17]. The phenol can also be
functionalised, which can affect the properties of the resin [18].
20
The molecular weight of the resin determines its distribution along the paper thickness before the
curing process. A lower molecular weight phenolic resin penetrates the base paper material more
easily, to produce a more homogeneous coating after the curing process. The distribution of the resin
throughout the material thickness affects the porosity, elasticity and resistance against delamination.
2.3.2.5 Friction Material Mechanical Properties
The mechanical properties of a friction material are similar to those of paper. The strength of the
paper material is a combination of the strength of individual fibres and the strength of inter-fibre
bonding. Each fibre can be connected to fifty others [12]. Cellulose fibres are very strong in the
longitudinal direction and can have a tensile strength of above 10 MPa. It is the weaker inter-fibre
bonding that is usually broken when a piece of paper is torn. In friction materials the inter-fibre bonds
are strengthened with a binder, which forms a reinforcing coating around the inter-fibre junction. The
reacting chemicals of the binder may also hold the fibres together chemically, by forming a covalently
bonded resin bridge between them.
As with paper, the majority of the fibres in friction materials lie perpendicular to the direction of
thickness. This means that friction material is strong in the planar directions due to the strength of the
fibres and the inter-fibre bonds and is anisotropic [15].
The elastic modulus of a cellulose fibre is ~ 25 GPa, but the elastic modulus of the paper that is
formed by these fibres is smaller, because of its porosity. The pores within the paper carry no load,
and the random orientations of the fibres in the paper prevent some of the fibres supporting the load.
The elastic modulus of a paper based friction material is usually about 100 MPa [19].
The shear strength of a friction material is an important parameter as it prevents the material from
delaminating during shearing. The shear strength depends on the inter-fibre bonds which are
strengthened with the binder. The shear strength of the friction material can be increased by
increasing the bridging density of the binder. The shear strength of a paper based friction material
coated with a phenolic resin is ~ 2 MPa [13].

21
2.3.2.6 Channel Patterns
Some clutches have been designed with channels cut into the friction material. These channels form
specific patterns in the friction material, which are designed to enhance the clutch performance. The
channels allow fluid to flow out of the clutch contact during engagement, decreasing engagement time,
but also reduce the overall surface area of the clutch and thus the maximum torque force that can be
transferred. The channels aid in the cooling of the clutches, allowing fluid to flow into the clutch
interface when engaged, and can help to remove wear debris. The channel patterns can also be used to
reduce the drag forces transmitted by the clutch when disengaged [20].
2.4 Wet Clutch Friction Characteristics
A very important feature of the wet clutch is its friction coefficient and the dependence of this on
sliding speed. The friction should be as high as possible, to increase efficiency of the clutch, allowing
the use of smaller clutch plates, and decrease engagement times in shifting clutches. The friction
coefficient of the clutch should also increase with sliding speed since this eradicates the stick-slip
effects that sometimes occur. The stick-slip effects found in wet clutches are called “shudder” and
“hunting”. Shudder occurs in slipping clutches, as the result of self excited oscillations, leading to
audible noise and vibration being transmitted through the drivetrain, giving the passengers an unstable
ride. Hunting occurs in shifting clutches, when a sharp increase of torque is present at the end of the
engagement. This causes a sharp increase in speed at the end of an engagement, making the vehicle
jolt forward.
Both these effects are the result of a high static friction coefficient or a friction coefficient that
decreases with speed. To eradicate these effects from wet clutches, the friction coefficient should
increase with speed over the entire operational range.
The friction characteristics of the wet clutch will now be discussed by considering the shifting and
slipping clutch separately.

22
2.4.1 Shifting Clutch
Shifting clutches are used to engage and disengage different parts of the transmission, bringing about
gear changes. The friction in the clutch should be as high as possible, so that a large amount of torque
can be transferred through the clutch in a short space of time, leading to faster gear changes. During
the engagement the friction should be fairly constant, so that the gear change will be smooth. A
problem that sometimes exists in shifting clutches is that the friction will increase towards the end of
the engagement, leading to a short, sharp increase in the transmitted torque and the vehicle jolts
forward. Although this effect has no detrimental effects on the vehicle, it will give the passengers a
unsteady ride, which is undesirable. The hunting effect generally occurs when a poor friction material
and ATF combination is used, or when the system has aged. These effects are studied using a Society
of Automotive Engineers (SAE) No.2 machine.
2.4.2 SAE No.2 Machine
The engagement of a shifting clutch can be studied using a SAE No. 2 machine. This electric motor-
driven test machine allows the study of the frictional characteristics of a shifting clutch during a
simulated engagement of wet clutch specimens [21]. During a standard test, a flywheel is driven at
3600 rpm and a pressure is then applied through the clutch pack which acts as a brake to the flywheel.
During the rapid deceleration of the flywheel, the friction transmitted through the clutch pack is
measured. Three friction values are used to evaluate the engagement; the initial μi, dynamic μd and
maximum or end friction coefficient μ0. The initial friction value (μi) is recorded at the very beginning
of the engagement when the full pressure has been applied to the clutch pack. The dynamic friction
(μd ) value is usually taken when the speed of the flywheel is at half the initial speed. The maximum
or end friction (μ0) is taken at the end of the engagement, when rotation has almost ceased. A
representation of the friction forces generated in a wet clutch during an engagement is shown in Figure
2.9.

23
Figure 2.9: Idealised representation of the friction in a wet clutch during an engagement
The friction generated during a wet clutch engagement can be affected by clutch pad
morphology/porosity and composition, reaction plate composition, ATF viscosity and ATF
composition.
At the end of the engagement, it is desirable for the μ0 value to be lower than or equal to the μd. If a
high μ0 is present the gear shift in a real system may be abrupt with a surge of power at the end of the
engagement. This effect is sometimes called “hunting” (Figure 2.10)
Figure 2.10: Representation of a SAE No. 2 result, with the "hunting" effect (red line)
High µ0

24
The use of a clutch system with a low static friction value will prevent the hunting effect, and as a
result this has been the main focus for its prevention. Other methods have been reported, such as
using a dynamic engagement method, where the load applied through the clutch pack is carefully
controlled during the engagement [22]. Decreasing the applied load at the end of the engagement can
sometimes reduce the hunting effect.
The dynamic friction value is broadly seen as an indication of the speed of the engagement. Higher
dynamic friction values are regarded as a method of producing faster engagements. This value is
taken when the flywheel speed is half the initial speed. The dynamic friction value can be increased
by adding different additives to the lubricant or using a different clutch material. A change in the
porosity of the friction material can sometimes affect the dynamic friction, although it is unclear
whether the friction is directly affected by the porosity, or the different materials used to achieve those
porosities.
The SAE No.2 machine is generally used to carry out many repeat engagements to age the wet
clutch/ATF system and monitor the changing friction characteristics.
2.4.3 Slipping Clutch
Slipping clutches found inside the torque converter reduce the speed difference between the pump and
the turbine, and can also adsorb any power fluctuations from the engine by allowing the clutch
surfaces to slip, thus ensuring a smooth ride. To ensure satisfactory operation, the static coefficient of
friction μs should be lower than the sliding coefficient of friction of the clutch. If μs is higher than the
sliding coefficient of friction, a stick-slip condition may result; similarly if the clutch system friction
decreases with speed a self-excited condition may exist. Both conditions result in an audible noise and
unstable ride commonly referred to as “shudder”. Shudder may occur in new systems, in which case it
is called “green shudder” and is only temporary and is lost after the running-in process. It may also
occur in an aged system, where the desirable friction characteristics of the clutch have been lost.
Shudder may also be present in poorly designed systems, where the ATF and the wet clutch combine
to give poor friction characteristics.

25
The frictional characteristics of a slipping clutches can be studied by measuring the friction over a
range of sliding speeds (μ-v curve). This provides some insight into its operational performance. It is
widely accepted that a slipping clutch system that produces a positive gradient μ-v curve will good
operational performance. A system that produces a negative gradient μ-v curve may demonstrate poor
operational performance, resulting in stick-slip and a self excited condition (Figure 2.11).
Figure 2.11: Representation of friction against velocity for a slipping clutch system
The most desirable friction characteristics of a slipping clutch is to have high overall friction and a
positive gradient μ-v curve over the entire speed range. This gives the clutch component a greater
torque capacity, allowing smaller parts to be used, while maintaining a smooth ride. This is achieved
by using correct friction material and ATF combinations. The friction characteristics of a slipping wet
clutch can be studied by using a machine commonly referred to as a low velocity friction apparatus,
and also some other bench-top screeners are used. These will now be discussed.

26
2.4.4 Low Velocity Friction Apparatus
The Low Velocity Friction Apparatus (LVFA) is used extensively throughout the lubricant industry to
study wet clutch friction. Unlikely an SAE No.2 machine, which uses a dynamic loading engagement
to mimic the action of a shifting clutch, the LVFA measures the friction during a steady state of
loading, which is more like the conditions found within slipping clutches.
The LVFA uses a annular disk-on- full disk configuration. The upper, annular disk is driven by a
motor, and the friction on the lower disk is measured using a force transducer. The load is applied by
a lever attached to the lower specimen and a dead weight. The specimens are housed in an oil bath,
and the temperature can be increased using heaters. The specimens used are not standardised at
present, and several authors have published results using the LVFA with different specimen styles.
The sample housing can be easily modified to accommodate a range of samples. Some authors report
using real annular clutch disks employed in transmissions, while others use smaller steel disks with
friction material bonded as an annulus on the outer diameter of one of the disks. Alternatively a steel
annulus can be used against a plain friction material disk [23]. To ensure an equal pressure over the
disks, a Gimbal mechanism can be placed on the lower specimen. This allows the specimen to move
around two orthogonal axes, and, during loading, the two disks will align and produce an even
pressure over the contact.
During a test the friction is measured during speed ramps, in which the speed is varied between a set
range. The friction is also measured at a slow constant speed. During a speed ramp the sliding speed
on the upper specimen is first increased from ~ 0.001 to 2.5 m/s, in 15 seconds, while recording the
friction. The friction is then also recorded on the descending sweep in the same speed range. The
pressure in the contact can vary from about 0.5 to 5 MPa, depending on the weight used to apply the
load, and the contact geometry.
A complex testing method is generally used to mimic the conditions of the slipping clutch during
operation, over a range of temperatures and pressures. This ages the ATF and the wet clutch surfaces.
The system should maintain a positive gradient friction versus speed curve, which indicates

27
satisfactory performance in the vehicle. Once a negative gradient friction versus speed curve is
produced this indicates the point at which the shudder effect will be observed in the vehicle.
2.4.5 Bench-top Friction Screeners
The SAE No. 2 and LVFA are used extensively to study wet clutch lubrication, but there are other
friction screeners which have been developed, and can offer some advantages over the two larger
machines.
Several other testing methods have been used to study the wet clutch friction characteristics, and these
will be reviewed fully in Chapter 6, when the friction screener test developed and used in this thesis
will also be described. Generally the friction screeners can have a disk-on-disk, coupon-on-disk or a
ball on disk configuration, and all will follow either the dynamic engagement method to simulate the
shifting clutch, or a steady-state load to simulate the slipping clutch. They are used both for the study
of additives and additive combinations along with different friction materials. Ageing processing can
also be carried out. Bench-top friction screeners are developed as a cost effective method for testing
wet clutch friction, and generally give more repeatable results than the conventional LVFA and SAE
No.2 methods.
2.4.6 Vehicle Testing
Test vehicles are used to evaluate the performance of a wet clutch and ATF combinations. Sometimes
taxi cabs are used, because the running conditions of these vehicles are severe, and perform a harsh
test on the components. The taxi cabs are used in normal service, and samples of the ATF may be
taken at set intervals. When shuddering appears, the mileage is noted by the driver [24].
Test beds can also be used, where a vehicle is placed on a rolling road and put through a simulated real
driving condition. Shudder and gear shifting severity is evaluated by a trained person who sits in the
vehicle[25, 26].

28
2.5 Summary
Wet clutches are used in an automatic transmission to transmit torque and prevent sliding. They are
used to change gear ratios by engaging and disengaging different parts of planetary gear sets. A clutch
is also used in the torque converter, to reduce the speed difference between the pump and the turbine,
increasing the efficiency of the vehicle.
Wet clutches must have a high friction interface for efficient operation. One surface of a wet clutch
disk pair is coated with a friction material, which is a composite of fibers, fillers, chemicals and a
binder. The roughness of the material prevents the formation of a significant lubricant film, and the
wet clutch stays in the boundary lubrication regime, up to high sliding speeds, ensuring high friction.
For satisfactory operation which excludes the undesirable stick-slip effects, “hunting” and “shudder”,
the wet clutch should have a friction coefficient that increases with speed. The mechanism by which
this friction characteristic is achieved is not fully understood. The current understanding is outlined in
the proceeding chapter.

29
3 .
Chapter 3
Literature Review on Wet Clutch Friction
Wet clutches have been used as high friction interfaces since the advent of automatic transmissions in
1940, although the exact mechanism by which the friction is generated is still not fully understood.
The friction characteristics generated within shifting and slipping clutches are unique to this type of
contact, and should be fully understood to allow development of the correct clutch surfaces and
lubricants for use in the AT. In this review, the mechanism of the shifting and slipping clutches are
discussed with special attention paid to the lubrication regime. The available literature concerning
ATF additive effects on wet clutches is then also reviewed.
3.1 Wet Clutch Operation Characteristics
Wet clutches are used in ATs as shifting and slipping clutches, and both need specific frictional
responses during operation for satisfactory running of the transmission. The desired friction
characteristics can be achieved by using special clutch surfaces and surface-active additives in the
ATF which lubricates the clutches. In this review, the mechanisms of the friction will be considered

30
by first studying the nature of the contact between the clutch surfaces, and then the lubrication regime
of the shifting and slipping clutch during operation.
3.1.1 Contact conditions and contact area
A key feature of wet clutches is the texture of the friction material. This is usually a paper based
material, strengthened with a resin and other materials. The manufacture of friction materials and
their composition is outlined by Kitahara [13] and Bijwe [17], and their performance in a wet clutch is
discussed by Chiba [15], Satapathy [27] and Sanda [28]. The main reasons for using a friction
material in a wet clutch is to provide a high friction interface, for fast clutch engagements during gear
changing [5], and to enable the transmission of a large amount of torque across the interface in a
slipping clutch [29].
A very important feature of the wet clutch is the contact condition, which exists between the friction
material disk and a steel disk. This specific contact will be reviewed, after first considering the
contact between two nominally flat contacts.
When two solid surfaces are loaded against each other, contact only occurs at certain micro-contact
areas, and the real area of contact is only a small percentage of the nominal contact area. This is due
to the surface roughness present on both surfaces. Contact only occurs on the highest asperities of
each surface, which therefore experience high local pressures (Figure 3.1).
Figure 3.1: Representation of two rough surfaces in contact
Smooth surfaces are desirable in most engineered components that are lubricated, as these show
reductions in friction and wear, due to the ability of hydrodynamic lubricant films to form between the
Contact Points

31
surfaces and reduce solid-solid contact. In a wet clutch, however, high friction is desirable, so the
formation of a hydrodynamic lubricant film is deliberately hindered by using very rough surfaces. A
friction material is used as one of the contacting surfaces and this is a very rough surface, which
remains rough even after the running-in process [19, 30]. Organic friction material roughness (used in
most passenger vehicles) can range between Rq = 2 and 8 µm. The amplitude between the peaks and
the valleys can be as high as 50 µm. This is much higher than the roughness of most other engine and
transmission components which are usually below 200 nm, and ensures that the contact formed is only
a small percentage of the nominal area [31, 32]. Also, the angles of the surface slopes are much higher
than normal steel surfaces, due to the friction material consisting of fibres.
3.1.2 Lubrication Regimes
The above contact conditions have a very strong influence on the lubrication regime of wet clutches.
This is implicit in some previous publications [33, 34] but has very rarely been explicitly spelt out
[35]. This aspect is discussed in section 3.1.3 but prior to that the concepts of lubrication regimes and
the Stribeck curve are briefly outlined.
The lubrication regime of a lubricated contact can be determined using a Stribeck curve. To produce a
Stribeck curve, the entrainment speed and the lubricant viscosity are varied in a contact to produce a
large range of Bearing Index, S, while the friction is monitored. The Bearing Index, S, is given by the
equation:
S = ηU/P (3.1)
where η is the lubricant viscosity, U is the entrainment speed and P is the pressure. Generally, the
Stribeck curve will show three distinct lubrication regimes: boundary, mixed and hydrodynamic
(Figure 3.2).

32
The prevalent regime depends on the ratio of the surface roughness and the hydrodynamic film
thickness in the contact. This can be described using the lambda ratio or specific film thickness:
22
0
21 qqRR
h
(3.2)
where h0 is the minimum hydrodynamic film thickness and Rq are the root mean square roughnesses of
the two surfaces. Boundary lubrication is present when the lubricant film thickness is lower than the
composite surface roughness of the contacting surfaces. In this case λ < 1, and contact occurs at the
surface asperities which supports the load. This accounts for the high friction and high wear rates, as
surface asperities must be sheared during sliding, and can be deformed and removed. Boundary
lubricant additives can be used to reduce the friction in this regime.
The mixed lubrication regime occurs when the film thickness is equal to and up to three times the
composite surfaces roughness (1< λ < 3) [36]. In this regime the surfaces are partially separated by the
lubricant film, but contact sill occurs at the highest asperities. The load is shared between surface
Mixed Boundary
Fri
ctio
n
Log(Bearing Index, S)
Hydrodynamic
Figure 3.2: Stribeck curve of friction versus the bearing index for a conventional lubricated contact

33
asperities and the fluid film pressure. In an idealised system the friction may be described by equation
(3.3) [37]
fb xx )1( (3.3)
where x is the fraction of the applied load supported by asperity contact, µb is the boundary friction
coefficient and µf is the fluid film friction coefficient. The larger the film thickness, the lower the
friction, as more load is supported by the lubricant film until the surfaces are completely separated and
no contact occurs between them. At this point the load is completely supported by the fluid film and
the friction is determined by the shear strength of this film. This is then the hydrodynamic regime,
where λ > 3. The hydrodynamic regime is desired in most engineered components due to the low
friction and subsequent low wear rates. But in a wet clutch, high friction is desired.
3.1.3 Lubrication Regime in Wet Clutches
When the friction of a wet clutch is studied over a large range of S, it has been found that friction does
not vary to a great extent, and is relatively high. This suggests that the lubrication regime remains in
the boundary region, because a decrease of friction would be expected when a lubricant film is formed
between the surfaces and the contact enters the hydrodynamic lubrication regime.
Some authors have used an LVFA to study the lubrication regime of a wet clutch. A large range of S
is achieved by using a range of speeds and lubricants with different viscosities. In the results
published by Sano [21], Matsumoto [38], Ito [34] and Miyazaki [39], the friction coefficient remains
between 0.1 and 0.3 over a large range of S. An example by Miyazaki is given in Figure 3.3.

34
Figure 3.3: Stribeck curve for a wet clutch contact, reproduced from Miyazaki [39]
The friction coefficient produced by lubricating the wet clutch with two different base oils, P26 and
P460, with dynamic viscosities 4.8 and 31.6 mm2/s respectively, remained between 0.1 and 0.2 under
all conditions. The addition of a friction modifier (FM1), reduced the friction for both base oils over
the majority of the speed range, but this effect was lost at ηU/P values above 105 (mPas.mms-1/MPa).
When a base oil was used as the lubricant, the friction was high at low speeds and generally decreased
with speed. When a friction modifier was added, or a fully formulated ATF used, the friction was low
at low speeds, and increased with speed. This effect has also been shown by Ito [34] (Figure 3.4).
There is a clear difference in the friction characteristics caused by the presence and absence of
additives at low values of S. At medium and high values of S, the friction tended to similar values,
regardless of the presence or absence of additives.

35
Figure 3.4: Stribeck curve of a wet clutch contact lubricated with (a) base oil and (b) a fully formulated ATF
(reproduced from Ito [34])
At higher values of S, the measured friction is dependent on the lubricant viscosity and the porosity of
the friction material [34, 38]. When a friction material with a low porosity is used, a drop in friction
has been observed at high S values. This has been studied by Matsumoto [38] and reproduced in
Figure 3.5. This is consistent with a more conventional Stribeck curve, in which the friction is
reduced as a lubricant film is formed between the contacting surfaces, as the system moves from the
boundary regime to the mixed and hydrodynamic regime. The low porosity of the material has been
suggested to aid in the formation of a hydrodynamic film [38], whereas a material with a high porosity
will prevent a hydrodynamic film from forming, by reducing the lubricant film pressure and thus

36
retarding the associated reduction in friction [34]. Friction then remains high over a large speed range.
Most friction materials are designed on the concept that the porous materials have the highest friction
over a large range of speed [17].
Figure 3.5: Stribeck curve of a wet clutch contact, with a highly porous friction material (top), and a lower porosity
friction material (bottom) (reproduced from [38])
The friction in the high S range was shown by Sano [21] to also be influenced by the viscosity of the
lubricant, which the author attributes to the formation of a fluid film at the friction surfaces.
At low values of S (below 10-8 m) the friction was shown to be independent of lubricant viscosity or
friction material porosity [21, 34]. Sano [21] and Miyazaki [39] both suggest that at low values of S,
the lubrication regime can be described as being in the mixed regime. Miyazaki suggests there is a

37
constant ratio between the boundary and the fluid contribution to the friction, but Sano states that the
friction is dependent on the varying ratio between the fluid and the boundary contribution, so that as a
fluid film forms it supports a greater proportion of the load at higher speeds.
Matsumoto [38] and Ito [34] suggest that at the low values of S the wet clutch operates in the
boundary regime, where the friction is independent of the oil viscosity and the friction material
porosity, and is influenced by chemical additives. This hypothesis is supported by Yamamoto [35]
who believes that the porosity of the friction material reduces the oil film pressure within a wet clutch,
and that boundary lubrication is present over a large speed range. Eguchi [31] used a electrical contact
resistance method to study a wet clutch between the sliding speeds of 18 – 526 mm/s. A drop in
conductance was seen at higher speeds, which the author suggests is the wet clutch moving from the
boundary into the mixed regime.
In summary there are many hypotheses of the lubrication regime of a wet clutch, when studied
experimentally over a range of S, although a full explanation including the effect of surface active
additives is still absent. One conclusion is that at S values ~ 10-7 m there appears to be a change of
regime, which has been demonstrated by all the papers reviewed in this section, although it is unclear
whether it is a shift from boundary to mixed [38] or from mixed to hydrodynamic [21]. This will be
discussed further in Chapter 10.
3.1.4 Engagement Regime in Wet Clutches
In a shifting clutch, the disks in a clutch pack are held apart by a spring, with one half of the disks
rotating at a given speed of up to 20 m/s or 3,600 rpm. A force is applied through the clutch pack,
forcing all the disks together, until no speed difference exists between them. During the clutch
engagement a large amount of torque is transferred through the surfaces in a short time [22].
The total torque transferred is the combination of the hydrodynamic and the boundary friction [6, 40,
41]. At the start of the engagement the torque transferred will be a combination of the shearing of the
lubricant between the plates and the boundary friction, between the contacting asperities. The friction
material is porous and usually contains grooves in the material [42], so the lubricant between the

38
clutch surfaces will be removed quickly [43] and the surfaces will make contact. The boundary
friction will then be the dominant force in the transmitted torque. A representation of the proposed
origin of friction in a shifting clutch during engagement is shown in Figure 3.6.
Figure 3.6: Representation of the Engagement of a Shifting Clutch (Reproduced from Yang [44])
This model, developed by Yang [44] suggests that at the beginning of a shifting clutch engagement,
the hydrodynamic torque makes a significant contribution to the overall resultant torque transmitted
within the clutch. This has been confirmed experimentally by Gil [43], who measures the oil pressure
in the contact during the engagement. As the engagement continues the fluid film between the
surfaces will be lost quickly to the pores of the material, and the boundary friction on the material
asperities will transfer the majority of the torque. The hydrodynamic contribution at the start of
engagement can be modified by varying the viscosity of the lubricant [21] the porosity of the friction
material [45] and the groove patterns [42]. By using a friction material with a high porosity, it has
been suggested that the fluid will flow out of the contact at a greater rate, through the pores into the
bulk of the material [45], thus affecting the lubrication regime and therefore the observed friction. The
ATF viscosity can also affect the hydrodynamic torque. A more viscous ATF will be slower to flow
out of the contact region during an engagement, and so the hydrodynamic region will be extended
[21]. Any grooves present on the clutch will also help to remove any hydrodynamic film by directing
fluid away from the contact by centrifugal forces [38, 42, 46].

39
The engagement of a wet clutch has also been described as a three phase model [40, 41] (Figure 3.7).
Figure 3.7: Three phase model of shifting clutch engagement developed by Ting [40]
In Ting’s model [40], the squeeze phase occurs at the beginning of the engagement, when the
approaching surfaces displace the fluid from between their approaching surfaces. All the torque is
transferred by the shearing fluid, which is rapidly displaced from between the disks. There is a sharp
rise of the friction at the start of the engagement which could be attributed to the thinning oil film
between the approaching surfaces. This increases the shear velocity between the surfaces and
therefore increases the shear force and the friction as the surfaces approach [47]. During the mixed
asperity contact phase, solid-to-solid contact does beginning to occur, and some of the torque is the
result of boundary friction, but the friction from the shearing fluid still is a significant amount of the
total torque being transferred. The mixed asperity contact phase is the transitional phase, and is only
present for a very short time during the engagement. In the consolidating contact phase [41] the load
is supported entirely on the asperities of the surfaces, and so the torque produced is exclusively the
boundary friction. The material will deform under compression, until a steady state is reached.
During the consolidating contact phase, lubricant film cavitation has been visualised in the contact
[48].

40
The understanding of the engagement lubrication regime is important as it allows for more informed
friction material surfaces and ATF formulations to be used. In this thesis the engagement of the wet
clutch is not studied directly, but much of the work can be translated to help in the understanding of
the contact condition and the action of surface active additives on the generated friction.
3.2 ATF Additives
Chemical additives are present in an ATF to ensure the fluid can perform several functions. The ATF
must compliment every working part of the transmission [49, 50]. This will include:
(i) Maintaining the correct viscosity to allow flow through the smaller channels in the control unit
(ii) Be sufficiently oxidative resistant in the extreme conditions found during transmission
operation
(iii) Control deposits and prevent wear and blockages
(iv) Maintain good frictional characteristics in wet clutches
The three properties that are paramount in the design of the ATF are viscometric properties, oxidation
stability and the imparted friction characteristics. The viscometric properties are controlled by the
base oil, and viscosity modifier additives [51]. The oxidation of the fluid can be reduced by using an
oxidation-resistant base oil, and by the addition of anti-oxidant additives [24].
The friction characteristics of wet clutches are the result of the delivery of additives from the ATF to
the surfaces of the clutch. The ATF additive package will contain a number of surface active
compounds which can affect the friction characteristic of a wet clutch, these include Friction
Modifiers, Dispersants and Detergents [52, 53]. Friction modifiers can reduce the friction in wet
clutches and give a positive gradient µ-v curve. Dispersants and detergents can increase the friction
within wet clutches [35] and are sometimes called “friction enhancers”.
The effects of lubricant additives in a steel-on-steel contact are quite well understood since extensive
work has been conducted on this type of contact. By comparison, the action and mechanisms of the
same chemical additives in a clutch-type contact are not well understood. In the following sections,

41
the three class of additives, friction modifiers, dispersants and detergents will be described considering
the current understanding of their action on wet clutches and the imparted friction characteristics.
3.2.1 Friction Modifiers
In a wet clutch, friction modifiers (FMs) have the effect of decreasing the friction between a friction
pad and steel in the lower sliding speed range [21, 50, 52, 54, 55] to produce the desirable
characteristic of friction increasing with speed. Nakada [56] suggests that friction modifiers can
adsorb onto the friction material fibres and the steel plates, preventing direct contact between the
plates. Willermet [24] suggests the FMs adsorb onto the cellulose component of the friction material
and form easily sheared surface layers, reducing boundary friction.
Some friction characteristics produced by FMs on a wet clutch have been published [50, 54, 55],
although, usually the chemical structures of the FMs are not disclosed. From the available data, it is
evident that FMs generally give a positive gradient friction versus sliding speed curve, and reduce the
overall friction. The extent to which the friction is reduced depends on the structures of the FM
molecules.
Changing the head group on the friction modifier will affect the affinity of the molecule for the
surface, and its ability to form an effective friction reducing layer [57]. This effect has been studied in
a wet clutch by Kugimiya [54], who studied four friction modifiers: Oleyl alcohol, Oleylamine, Oleic
acid and Oleamide using a LVFA. These model FMs showed varying degrees of friction reduction in
the wet clutch contact, with the exception of Oleyl alcohol which had a negligible effect when
compared to the base oil. No explanation of the different friction reduction by the FMs was given by
the author, although it is probably due to the different abilities of the four FMs to form strongly bound,
ordered layers on the surfaces. A range of FMs were also studied by Kugimiya [50] in a wet clutch
contact. The friction characteristics differed for amines, amides, alcohols and acids, which the author
attributes to the length of the hydrocarbon chains and the functional head groups.
Friction modifiers will continue to reduce the friction in a wet clutch in combination with other
additives, such as zinc dialkyl dithiophosphate [56] detergents [58] and dispersants [56]. The

42
durability of friction modifiers during the ageing of the fluid is also an important parameter [55]. The
effectiveness of some friction modifiers is lost after the fluid and the friction materials have been aged
during operation of the transmission. This could lead to an increase of the static friction within wet
clutches, which will then exhibit the undesirable stick-slip effects. Therefore, although most FMs give
the desirable friction characteristic in a wet clutch, the FM must also provide this characteristic for the
lifetime of the fluid.
Slough [60] used scanning force microscopy to study the friction effects of a ATF solution at low
speeds (0.2 to 9 mm/s) on an aged friction material. The friction was found to decrease and the
gradient of the friction versus sliding speed slope became positive with increasing concentration of a
friction modifier. This implies that the friction modifier adsorbs onto the friction material to an extent,
dependent on its concentration.
Although friction modifiers produce the desirable positive gradient friction versus speed curve in a wet
clutch, under certain conditions, they also reduce the overall friction of the system, and therefore
reduce the amount of torque that is transferred between the interfaces [56]. This can be counteracted
by the addition of friction enhancers (especially dispersants and detergents), which can increase the
overall friction in a wet clutch [35, 52, 60, 61]. At certain concentrations of friction modifiers and
friction enhancers, the friction within a wet clutch can be high while still maintaining the positive
gradient characteristic.
3.2.2 Detergents
Detergents are used to reduce the formation of viscous base oil degradation products, to keep these in
solution, and can also neutralise acidic species. In a AT detergents prevent the pore-plugging action of
the base oil degradation products on the wet clutch friction material, and prevent the degradation of
the friction material itself by neutralising acidic species, which could otherwise attack the friction
material [62, 63]. Thus, detergents extend the lifetime of wet clutches.
Detergents are surface active and can influence the friction characteristics of wet clutches. The
majority of published work has focussed on overbased calcium or magnesium sulphonate detergents,

43
although others such as metal phenates are also used industrially. Calcium sulphonate detergents
consist of CaCO3 particle cores surrounded by sulphonate molecules (Figure 3.8). To provide
solubility, the sulphonate has a alkyl chain, which can have a varying degree of branching and
molecular weight.
Figure 3.8: Representation of a calcium carbonate particle, surrounded by sulphonate molecules, to form a detergent
Overbased detergents, which contain a high concentration of CaCO3, are sometimes added to
lubricants to supplement the antiwear performance as it is understood that they can form a protective
chemical film on the surfaces of metal parts during rubbing and thus provide a protective coating [64].
The film formed by the overbased detergent consists of predominantly calcium carbonate [65].
Within a shifting clutch, detergents have been shown to increase the µd and decrease the µs [60],
therefore decreasing the time of the clutch engagements, without promoting stick-slip effects. A large
range of detergents have been studied in clutch engagement and it has been found that the type of
metal, the head group structure and the extent of overbasing of the detergent have only a limited effect
on the µd within the shifting clutch [60]. However a large effect was seen for all these variables on the
µs. The author attributes these effects to the formation of a thin, adsorbed film on the steel surface.
He suggests that this thin, adsorbed film increases the local viscosity around the friction material
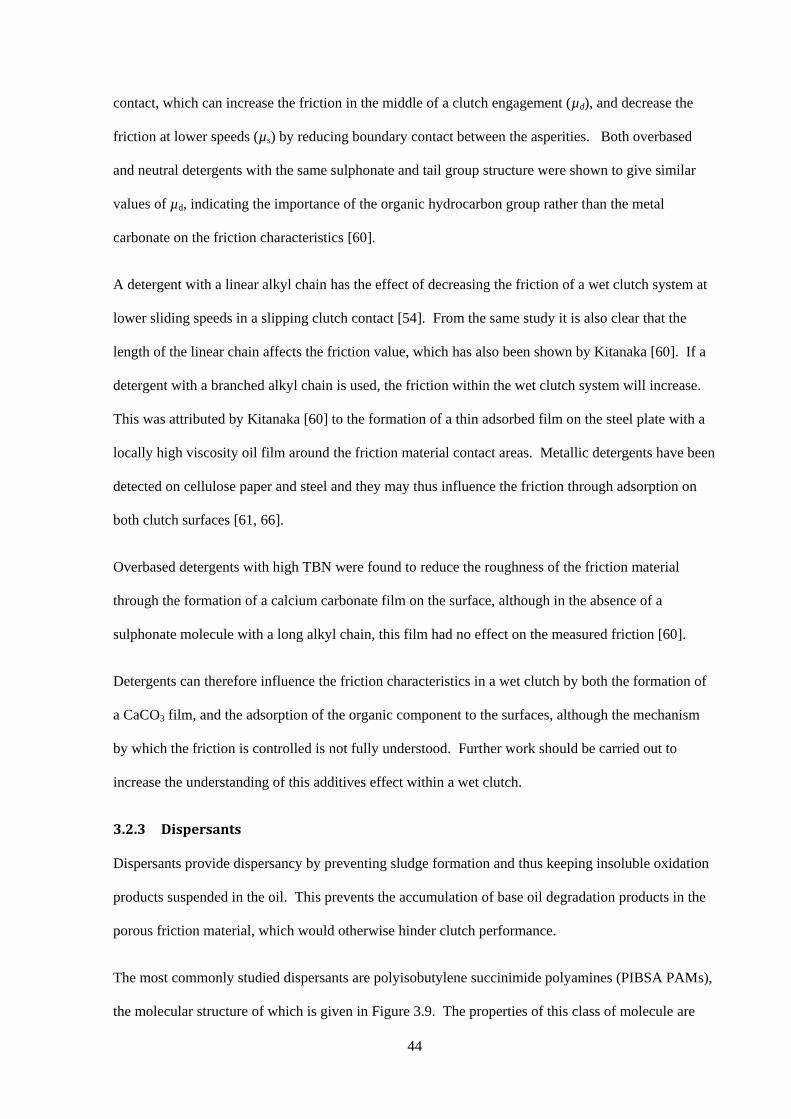
44
contact, which can increase the friction in the middle of a clutch engagement (µd), and decrease the
friction at lower speeds (µs) by reducing boundary contact between the asperities. Both overbased
and neutral detergents with the same sulphonate and tail group structure were shown to give similar
values of µd, indicating the importance of the organic hydrocarbon group rather than the metal
carbonate on the friction characteristics [60].
A detergent with a linear alkyl chain has the effect of decreasing the friction of a wet clutch system at
lower sliding speeds in a slipping clutch contact [54]. From the same study it is also clear that the
length of the linear chain affects the friction value, which has also been shown by Kitanaka [60]. If a
detergent with a branched alkyl chain is used, the friction within the wet clutch system will increase.
This was attributed by Kitanaka [60] to the formation of a thin adsorbed film on the steel plate with a
locally high viscosity oil film around the friction material contact areas. Metallic detergents have been
detected on cellulose paper and steel and they may thus influence the friction through adsorption on
both clutch surfaces [61, 66].
Overbased detergents with high TBN were found to reduce the roughness of the friction material
through the formation of a calcium carbonate film on the surface, although in the absence of a
sulphonate molecule with a long alkyl chain, this film had no effect on the measured friction [60].
Detergents can therefore influence the friction characteristics in a wet clutch by both the formation of
a CaCO3 film, and the adsorption of the organic component to the surfaces, although the mechanism
by which the friction is controlled is not fully understood. Further work should be carried out to
increase the understanding of this additives effect within a wet clutch.
3.2.3 Dispersants
Dispersants provide dispersancy by preventing sludge formation and thus keeping insoluble oxidation
products suspended in the oil. This prevents the accumulation of base oil degradation products in the
porous friction material, which would otherwise hinder clutch performance.
The most commonly studied dispersants are polyisobutylene succinimide polyamines (PIBSA PAMs),
the molecular structure of which is given in Figure 3.9. The properties of this class of molecule are

45
well understood [67] and they have been used as model dispersants in the published studies of the
friction characteristics of wet clutches.
Figure 3.9: Molecular structure of a PIBSA PAM dispersant
The large polyamine head group is used to attach the dispersants to polar and aromatic groups on
sludge particles. The large PIB tail groups prevent agglomeration of the particles by steric
stabilisation [62].
The polar head group of the dispersants can also attract the dispersant to surfaces, so these additives
are likely to be present on the surfaces in wet clutches. When dispersants are present within ATF
formulations they can increase the friction within wet clutches. In slipping clutches they increase the
friction coefficient but give a negative gradient curve. In shifting clutches dispersants can increase the
μd, and can therefore decrease the time of a clutch engagement, but can also increase the μs, promoting
stick-slip effects.
Kitanaka [60] and Shirahama [61] used an SAE No. 2 machine to study the effect of dispersants on the
frictional characteristics in a shifting clutch-type contact. By increasing the molecular weight of the
PIB group on a PIBSA PAM dispersant, the μs was found to decrease. Four dispersants were
employed with different PIB molecular weight between 610 to 2350, resulting in a decrease in static
coefficients of friction from ~ 0.20 to ~ 0.16. Kitanaka describes this effect as the result of the
dispersants adsorbing onto the friction material. With increasing molecular weight, the PIB chains
become longer and the concentration of alkenyl group on the friction material surface increases. This
results in a decrease in the real contact area between the two surfaces resulting in a decrease in friction
between the sliding pair. This hypothesis is not supported by any surface analysis, which would

46
confirm or disprove the presence of dispersant molecules on the surface of the friction material and the
steel. However, a reference is made by Shirahama to an experiment conducted by Toritani and Itoh
[66] in which the adsorption of some additives on a cellulose paper material were studied, the results
showing that a borated dispersant has a high affinity for the cellulose paper surface.
The effect of the same dispersants on the μd was also reported by Kitanaka[60] and Shirahama [61].
By adding a dispersant to a base oil, an increase in friction coefficient from 0.10 (for a base oil only)
to 0.135 (with dispersant present) was observed. The molecular weight of the PIB seemed to have
little effect. This was attributed to the adsorption of the dispersants, forming a strong oil film with a
locally high viscosity, provoking a rise in μd when a dispersant is present in the oil.
An LVFA was used by Kugimiya [54] to study the action of some dispersants and parts of their
molecular structure on the μ-v characteristics in a clutch type contact. The results show that all
dispersants had the effect of decreasing the friction at low sliding speeds, and increased the friction at
sliding speeds higher than 0.l m/s, compared to the base oil. All the dispersants produced a negative
gradient friction versus speed curve.
3.3 Summary
From the literature reviewed in this chapter it appears that both slipping and shifting wet clutches
operate primarily in the boundary lubrication regime, with friction coefficient in the range 0.1 to 0.2.
This is due to morphology of the friction material surface and also, it has been suggested, its porosity.
The friction material consists of protruding fibres and this makes it very rough with steep asperity
slopes. This means that the contact actually consists of many tiny friction units which are too small to
generate a significant hydrodynamic film. This will be further discussed and analysed in chapter 4 of
this thesis.
It is clear from the literature that friction modifiers are able to reduce static and low speed friction
coefficient and that this helps produce the desired friction characteristics of a wet clutch of a positive
friction/speed slope. It is not clear, however, from the literature why the friction increases with sliding
speed. Previous work and practice also shows that detergents and dispersants can have the effect of

47
increasing friction at higher sliding speeds. The origins of this effect are obscure – some workers have
suggested it is due to their forming a “viscous film” but there is no direct evidence from this.
Based on the literature a number of questions are identified that need to be addressed to understand
wet clutch friction.
(i) What are the geometry, contact pressure and temperature of wet clutch contact and does
this information help understand the origins of wet clutch friction behaviour?
(ii) Why does friction increase with speed – is this due to the formation of a viscous fluid film
or from some other cause?
(iii) What is the mechanism by which detergents and dispersants increase friction?

48
4 .
Chapter 4
Contact Properties of Wet Clutch Friction Materials
This chapter examines the contact properties of friction material against a relatively flat counterface.
A contact visualisation technique is used to view the contact formed by a friction material over a
range of pressures and during a running-in procedure.
4.1 Introduction
Wet clutches are used to lock-up components and transmit torque in automatic transmissions. Two
types of wet clutches are usually found within a modern automatic transmission, a slipping clutch and
a shifting clutch. For satisfactory operation of the transmission both type of clutch must have a high
friction coefficient over a wide range of operating conditions. This is achieved by using friction
materials on the surface of the clutch which are very rough, so that the overall clutch contact under
load comprises a large number of individual, tiny “contact units” rather than a single large contact
patch. Such a contact morphology results in a negligible fluid film being formed so that the load
continues to be supported by isolated asperities or contact units, even up to high sliding speeds.
Friction thus continues to result from boundary lubrication rather than hydrodynamic lubrication up to
high clutch speeds.
49
From the condition described above, the importance of understanding the size, geometry and number
of contact units in a wet clutch is evident. This information is needed to both understand how wet
clutches work and degrade in practice and also to produce valid simulations of wet clutch lubrication.
This chapter describes an experimental study of the nature of the contact units in a wet clutch and how
these depend on the operating parameters of load and rubbing time.
4.1.1 Friction Material Morphology
Friction materials contain a tangled web of fibres, forming a strong three dimensional network, with
many fibre-fibre bonds. The fibre network allows pores to exist throughout the entire thickness of the
material [15], which aids in fluid transport within the clutch. The density and the strength of the fibre
network is increased by filler materials and the binder. Filler materials exist in the voids between
fibres, and the resin forms a homogenous coating over the fibres and the filler materials, bonding them
all together.
A commonly-used, paper-based friction material was analysed by the author at high magnification
using two techniques:
(i) Focussed ion beam (FIB) imaging [68] (Figure 4.1)
(ii) Talysurf three dimensional profilometry (Figure 4.2)
The FIB imaging technique is used to generate high magnification images of the surface of the
material, by bombarding the surface with an ion source (Gallium) and detecting the ions and electrons
that are emitted. Two images obtained using this technique are shown in Figure 4.1. The FIB images
represent a 1 mm2 and a 0.25 mm2 area of the paper based material at magnifications of 247 X and
1000 X respectively. The images highlight the randomly-arranged, fibrous nature of the material as
well as the presence of pores between the fibres and the filler material.

50
Figure 4.1: FIB image of a paper based friction material
Fibres can clearly be identified in the material, along with rough areas which are probably the filler
material, the resin, or a mixture of the two. Pores in the uppermost region of the material exist
between fibres, and for this particular material have an approximate mean area of 100 µm2 and a
density of 25 mm-2.
The 3D Talysurf trace (Figure 4.2) reveals more detailed topographical information, showing the
uppermost regions of the material to be long and elongated, corresponding to fibres. The diameters of
the uppermost fibres are 30 to 50 μm. The measured roughness of the friction material is ~ 4 µm.
This value has been confirmed using a optical profilometer.

51
Figure 4.2: A three dimensional Talysurf image of a friction material surface
The FIB images and the Talysurf trace both indicate that the friction material contains many fibres,
which control the morphology of the material and make it very rough. The fibres weave over and
under each other and at the overlapping junctions, the fibres may be bonded together by the resin,
increasing the strength and rigidity of the material [15]. The fibres exist in the uppermost regions of
the material. During contact between the friction material and a steel countersurface, it is the
uppermost fibres that will form the contact points. The composition of the fibres should, therefore, be
studied further.
When a friction material is manufactured, one of the last steps is the coating of the entire material in
resin. Figure 4.3 shows a microscope image of a fibre, isolated from the friction material at two
different magnifications. The smooth, white cellulose fibre is coated with a rough, dark orange resin.
The diameter of the fibre is ~ 50 μm at the widest part, and varies along its length dependent on the
amount of resin coating. In some regions the cellulose is visible, where a resin coating is absent or
only a thin resin coating exists.

52
Figure 4.3: Microscope image of a individual fibre, isolated from a friction material
Detailed topographical information can be gained from the fibres by studying them using Atomic
Force Microscopy (AFM). The fibres can be imaged by AFM by landing the tip on a fibre, and then
carefully scanning across the fibre at a slow speed. An AFM topography image of an individual fibre
in the uppermost region of the friction material is shown in Figure 4.4.
Figure 4.4: AFM image of a fibre found on a paper based friction material
The diameter of the fibre in Figure 4.4 is approximately 30 µm. It is probably coated with the resin,
which can be more easily seen from the microscope images in Figure 4.3. The AFM shows that the
resin bonded to the fibres covers the inner cellulose surface. The topography of a cellulose fibre will
resemble a “fish scale” pattern due to the micro-fibrils on its surface [69]. The micro-fibrils are absent

53
from the surface of this fibre. The fibre shows a variable thickness coating of resin, and globules of
material on its surface which is probably a mixture of the resin, and the filler materials. It is the top
region of the fibres that will be in contact with the counterface. This region is not smooth, and has its
own micro-roughness [19].
4.1.2 Friction Material Contact
The fibrous nature of the material means that the surface is very rough, with much higher surface
slopes than the steel counter surface. When in contact, only the uppermost regions of the friction
material make contact with the steel surface. The morphology of the material indicates that the
uppermost regions of the material are composed mainly of fibres, which are coated with a resin. Thus,
it is these fibres that form the contact. The uppermost fibres are not densely distributed in the
uppermost regions of the material, and do not have a uniform height, so as a result the contact will
occur only at the highest points of the uppermost fibres. The fibres weave over the surface of the
friction material and will only form contact points at the highest points (Figure 4.5).
Figure 4.5: Schematic representation of a fibre in intermittent contact with a flat counter-surface
A representation of the contact formed by a network of fibres is shown in Figure 4.6. The fibres will
only make contact with the counter-surface at the highest points, forming small discrete contact
patches. These contact patches can have varying 2D shapes. They are generally circular for a fresh
material at low contact pressures, and can become elongated at higher pressure and after wearing, as
more area of an individual fibre forms a contact point.
Nominally
flat surface
Fibre
Friction material
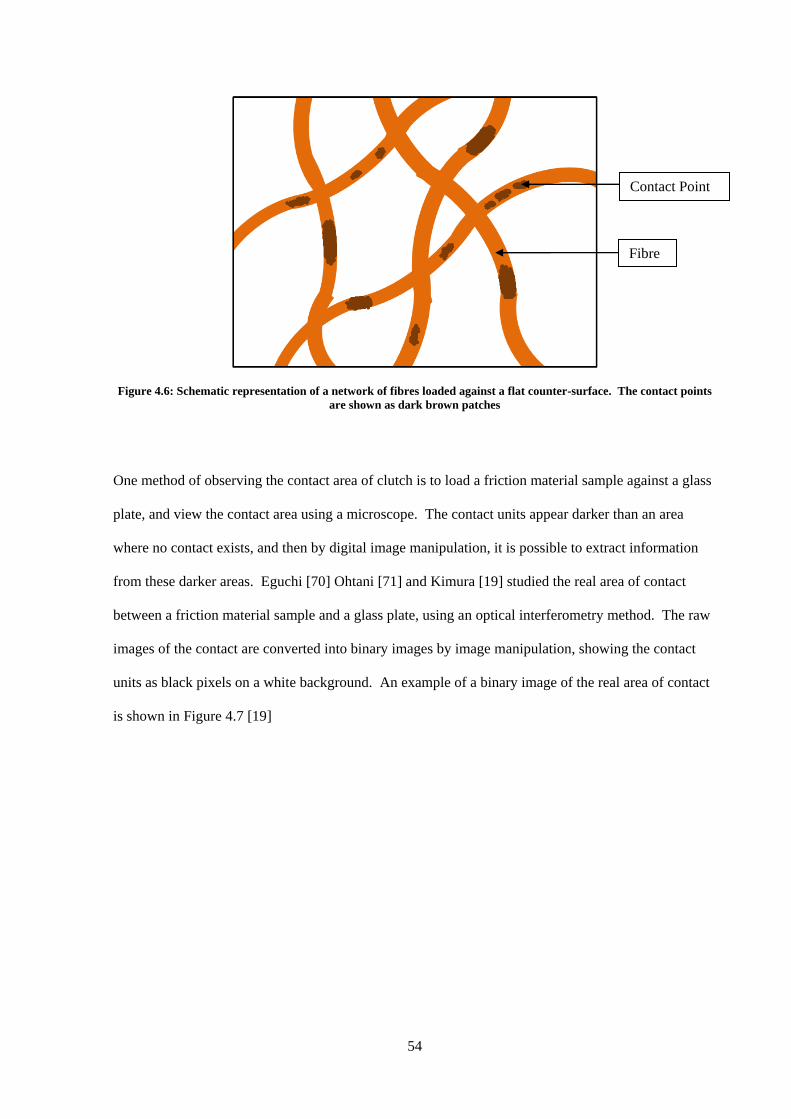
54
Figure 4.6: Schematic representation of a network of fibres loaded against a flat counter-surface. The contact points
are shown as dark brown patches
One method of observing the contact area of clutch is to load a friction material sample against a glass
plate, and view the contact area using a microscope. The contact units appear darker than an area
where no contact exists, and then by digital image manipulation, it is possible to extract information
from these darker areas. Eguchi [70] Ohtani [71] and Kimura [19] studied the real area of contact
between a friction material sample and a glass plate, using an optical interferometry method. The raw
images of the contact are converted into binary images by image manipulation, showing the contact
units as black pixels on a white background. An example of a binary image of the real area of contact
is shown in Figure 4.7 [19]
Fibre
Contact Point

55
Figure 4.7: Example of a binary image showing the real area of contact of a friction material as black pixels on a
white background (reproduced from [19])
The contact consists of many discrete patches, which are mostly circular, but some elongated streaks
are present, which correspond to a large part of a fibre in contact. By counting the number of black
pixels, the real area of contact can be determined. The real area of contact was shown by Eguchi [70]
and Otani [71] to vary between 1 and 6 % of the apparent contact area, depending on the load applied
between the surfaces. Otani found that at higher pressures the contact patches became more
elongated, corresponding to larger areas of the tops of the fibres coming into contact as the fibre
deforms.
4.1.3 Friction Material Wear
During the operation of a friction material it will wear, which can affect the performance of the clutch.
Wear occurs on the uppermost regions of the friction material during sliding, as material is lost from
the fibres by adhesive, abrasive and ploughing wear. The outer resin layer will probably be lost in the
first instance, but the inner cellulose fibres, and regions of filler materials may also be lost, as the wear
of the material continues. The removal of material in this way will cause the formation of smooth, flat

56
areas on the uppermost regions of the contact units, parallel to the direction of sliding, leading to the
formation of larger contact units. The larger units will make the material less rough and
hydrodynamic films may form between them and the steel surface, leading to a reduction of friction
and poor clutch performance. The removal of material will also change the surface chemistry of the
material, as the outer resin layer is removed, the inner cellulose or filler material, may be exposed.
The wear of the friction material and its effect on the real area of contact has been studied
experimentally by Sanda [28], and theoretically by Kimura [19]. Sanda used a SAE No. 2 machine to
wear a friction material, and subsequently studied the surface topography of the material. The ratio of
flat area on the uppermost regions was calculated, and related to the wearing of the material. The ratio
of flat area increased rapidly during the first ~ 25 engagements and reached between 10 and 20 % of
the nominal contact area after 100 engagements, depending on the roughness of the counter surface.
Three countersurface disks were used to wear the friction material, with varying roughness. The
higher the roughness of the steel countersurface, the greater the wear of the friction material. In a wet
clutch, rough steel counter surfaces are used as they increase the friction coefficient during
engagement, decreasing the engagement time, probably by preventing the entrainment of a fluid and
inhibiting the formation of a hydrodynamic film. Conversely, if a rough steel disk is used, the lifetime
of the friction material will be reduced due to its increased rate of wearing. A compromise must
therefore be found.
Kimura [19] modelled the friction material contact condition by considering the contact units as
spherical and columnar asperities, representing particulates and fibres respectively. The asperities are
individually supported by an elastic halfspace, on a common base plane. The wear of the asperities is
dependent on the individual load they support. The real area of contact, which the author describes as
the “contour contact area”, increases to 10 % of the apparent contact area after 1000 simulated clutch
engagements.

57
4.2 Experimental Method
The contact formed between a friction material sample and a smooth glass counter-surface has been
studied by the author, using polarised white light and a microscope. The contact units formed were
photographed over a range of pressures and during a dry and a lubricated wear process. This appraoch
has improvements compared to previously published studies by the introduction of a automated
threshold selection technique and by extracting more information about the size and number of contact
units formed.
4.2.1 Contact Visualization Technique
An optical system was used to capture well-defined contact images between a friction material sample
and a glass disk (Figure 4.8). The friction material sample was loaded against a glass disk in a
modified ultra thin film thickness rig (PCS Instruments, Acton, UK), which uses a motorized loading
stage, applying loads between 5 and 40 N. A microscope set-up using white light and a digital camera
was used to visualise the contact area. Using white light, the contact areas formed by the paper based
friction material appear darker than areas not in contact. Contact units appear darker because light
reflected from the underside of the glass disk and the friction material combine destructively, whereas
regions where the friction material is over half a wavelength of light away from the glass appear
lighter. The contact points can then be determined by analysing the images, and extracting the darker
points. Using this method it is sometimes hard to extract the contact units when only a small
difference in colour exists. Light polarisers can be used to increase the clarity of the contact images,
by utilising the phase shift that occurs at the contact points. The white light passes through a polariser
and a quarter wave plate, and is reflected on the bottom face of the glass disk. The reflected light then
passes through a second polariser (analyser) and into the digital camera. The camera used to capture
the images was a Moticam 1000. At the contact units a light phase shift occurs and so the phase of the
light from the reflected areas and the non-reflected areas are not equal. By adjusting the quarter wave
plate and the polarisers, the partially reflected light at the contact units can be further reduced by
preventing light at a specific phase from passing through the polariser. As a result, the contact units
will then appear even darker, making subsequent image analysis more accurate.

58
Figure 4.8: Diagram of the optical set-up used to capture contact images between a friction material sample and a
glass disk
The optical system used was a high magnification zoom lens system manufactured by Navitar [72], at
6.5 x magnification. It consisted of several parts from the 6000 series, which are placed together to
build the optical system. The optical system consisted of the parts shown in Table 4.1.
Digital Camera
Analyzer
Beam Splitter
Quarter Wave Plate
Lens
Polarizer
White Light
Friction Material Sample Silicone Elastomer
Sample Mount

59
Table 4.1: Navitar parts used to build the optical system
Part description Part code
“C” mount coupler 1-6010
Right angle adapters 1-61997
Analyzer 1-60816
Zoom lens (with coaxial illumination) 1-60123A
¼ wave plate assembly 1-60981
For each measurement, two images were captured: an unloaded image of the area of interest followed
by a loaded image. These two images were then subtracted to produce a greyscale image highlighting
the contact units and removing any variation in light intensity which sometimes exists across the
illuminated area. This is then converted into a binary image by the selection of a threshold. Threshold
selection was confirmed using a numerical technique by Otsu (Section 4.2.2)[73]. The real contact
area (Ar) is then calculated by counting the black pixels, and is expressed as a percentage of the
nominal area (An). To calculate the number of individual contact units (N), groups of black pixels
connected to at least one of their 8 neighbours were determined to be a single contact unit. N is then
the number of groups.
4.2.2 Otsu threshold selection
In a digital image, when an object needs be identified, it is desirable to have a clear difference in
colour between the object and the rest of the image (background). This makes identifying the object
easier. In our greyscale contact images, the contact units appear darker than the background. To
convert the greyscale image into a binary image, where the contact units are black pixels and the
background are white pixels, a threshold value must be selected below which every pixel with a
greyscale value becomes white, and above which every pixel becomes black, thus separating the
contact areas from the non-contact areas. To select a threshold, the greyscale histogram of grey pixel
value would ideally show two clear peaks, corresponding to the different regions (background and
contact). To convert to a binary image, a threshold could then be chosen in the valley between the two

60
peaks. In some images it is difficult to identify a valley, such as when the peaks overlap, or when the
valley is hidden by noise.
Otsu has shown [73] that a threshold that best separates the two greyscale regions can be found by
discriminant analysis. The best threshold is selected by searching statistically for the best criterion
measure values, which include the within-class variance, the between-class variance, and the total
variance of levels. By maximising one of the three criterion measure values, two distinct regions are
identified in the histogram, and the threshold value is placed between the regions. This method is
completely automated, requiring no input from the user apart from the original grey level histogram.
The threshold values selected using this method are similar to those selected manually using trial and
error.
4.2.3 Test Samples
The clutch samples used in this study were paper based friction material, with the manufacturer’s code
SD-1777. Thermogravimetric analysis [74] has been carried out on the friction material, to determine
its composition. A summary of the results is shown in Table 4.2.
Table 4.2: Composition of a friction material sample, by thermogravimetric analysis
Compound Percentage weight
Cellulose fibre 33
Kevlar® fibre 5
Phenolic resin 34.5
Diatomaceous earth 26
Water and volatile organic compounds 1.5
The material also contains a small amount of graphite chunks, and rubber, but at a concentration too
low to be revealed by the TGA results.
The samples were disk shaped, with diameters of 3 and 10 mm and consisted of a 2.5 mm thick steel
backing disk with a 0.5 mm thick friction material bonded onto one side. These disks were loaded
against the flat surface of a stationary glass disk. The clutch disk was mounted on a low elastic

61
modulus silicone elastomer layer which ensured that the two surfaces aligned under load to produce an
even contact pressure across the whole contact area.
4.2.4 Loading System
The load was applied between the friction material sample and the glass disk using an ultrathin film
thickness machine (PCS Instruments). A spacer was mounted between the loading stage and the
sample to elevate the sample to the correct height so that it could be loaded against a glass disk. Loads
of between 5 and 40 N could be applied between the samples.
4.2.5 Rubbing Technique
To wear the friction material in a controlled manner, a Mini Traction Machine (PCS Instruments) was
used to slide the friction material against a steel disk at a constant speed and load. A diagram of the
experiment is shown in Figure 4.9. The lower specimen was a high carbon (SAE 1030), tumbled steel
disk, with a large rubbing track. The RMS roughness of the steel disk was 3.6 µm, which was
measured using a Hobson-Taylor Talysurf. The upper specimen was a 10 mm diameter friction
material disk, which was mounted onto the ball shaft using a specially-machined component. A low
elastic modulus silicone elastomer was placed between the friction material sample and the upper
specimen holder. During loading the angle of the upper specimen holder and the silicone elastomer
layer ensured that the two surfaces aligned correctly, to give a contact with an evenly distributed load.
A 5 N load was used in this rubbing test, which corresponded to a mean nominal contact pressure of
0.06 MPa.
Figure 4.9: Diagram of the experimental set-up used during the sliding wear procedure
Steel Disk
Silicone Elastomer
Upper Specimen Holder
Load Applied
Direction of Sliding
Friction Material Sample
62
The lower disk was rotated at a speed of 10 mm/s, at ambient conditions. Periodically the friction
material specimen was removed, and studied using the contact visualization technique, to calculate the
real area of contact.
The wearing process was carried out both in a dry condition, and also in the presence of a lubricant.
The lubricant used was a group III base oil, Nexbase 3030, which was used at room temperature, with
a viscosity of ~ 20 mm2/s. During the lubricated sliding test, any residual oil present on the friction
material had to be removed before the sample could be studied using the contact visualisation
technique. If lubricant was present on the friction material sample, capillary bridges formed between
the sample and the glass disk, which appeared in the contact visualisation technique as contact units.
The lubricant was removed by immersing the sample in hexane and ultrasonically cleaning for 40
minutes. The sample was then dried with hot air to remove the solvent. The cleaning procedure was
conducted on a control sample for 40 minutes, and no significant change in the visible morphology or
the measured real contact area was found.
The dry wearing process was carried out with measuring the real area of contact in-situ using the same
friction material sample throughout the test. In the lubricated test a different sample was used at each
sliding distance, because a repeated cleaning procedure might damage the material and effect the
measurements.
4.2.6 Fibre Analysis with AFM
Atomic force microscopy (AFM) was used to study the morphology of individual fibres before and
after the dry sliding procedure, using a diCaliber (Veeco, Cambridge, UK) in “tapping mode”. The
resolution of the AFM in the Z direction is below 1 nm. The measurements were taken by carefully
landing the AFM tip on a fibre, before scanning with the tip traversing back and forth across the width
of the fibre. The speed of the scanning tip was 100 µm/s.

63
4.3 Results and Discussion
4.3.1 Contact Unit Distribution
An image of the entire contact area between a 10 mm diameter fresh clutch disk and the glass disk,
produced by manually stitching together smaller localised images, is shown in Figure 4.10. The
applied load was 30 N, which corresponds to a nominal mean contact pressure of ~ 0.4 MPa. The
contact consists of many tiny, irregularly-distributed units which together comprise about 1 percent of
the nominal area. This means that the actual mean contact pressure at the units is ~ 40 MPa. The
image of the entire contact area shows that the contact units are randomly distributed throughout the
contact. Occasionally, a long elongated black streak is visible, which probably corresponds to a
contact formed by part of a fibre.

64
Figure 4.10: The full contact area of a 10 mm diameter friction material disk, loaded against a glass window.
Figure 4.11 shows an enlarged view of part of the image to illustrate more clearly the shape of the
contact units. The majority of units are elliptical and presumably formed by part of a fibre, or a region
of filler material, both of which are probably coated with resin.

65
Figure 4.11: Enlarged image of the contact area, showing detailed shapes of the contact units
In this example, the contact patches sometimes follow a pattern, forming clusters along a certain path.
These contact units are probably formed by different points on the same fibre.
4.3.2 Friction Material Contact at Different Pressures
The influence of load on the size and number of contact units formed by the friction material has been
studied. An accurate loading system was used to apply loads of between 5 and 40 N, which, since two
differently-sized friction material disks were employed, enabled a wide range of nominal pressures,
spanning 0.06 to 5.5 MPa, to be achieved. An example of the binary images of the contact showing
the increase of the real area of contact with increasing load is shown in Figure 4.12.
Figure 4.12: Example binary images showing the increasing real area of contact with pressure (black pixels are
contact points).
0.7 MPa 3.1 MPa 5.6 MPa
1 mm
0.7 MPa 3.1 MPa 5.6 MPa
1 mm
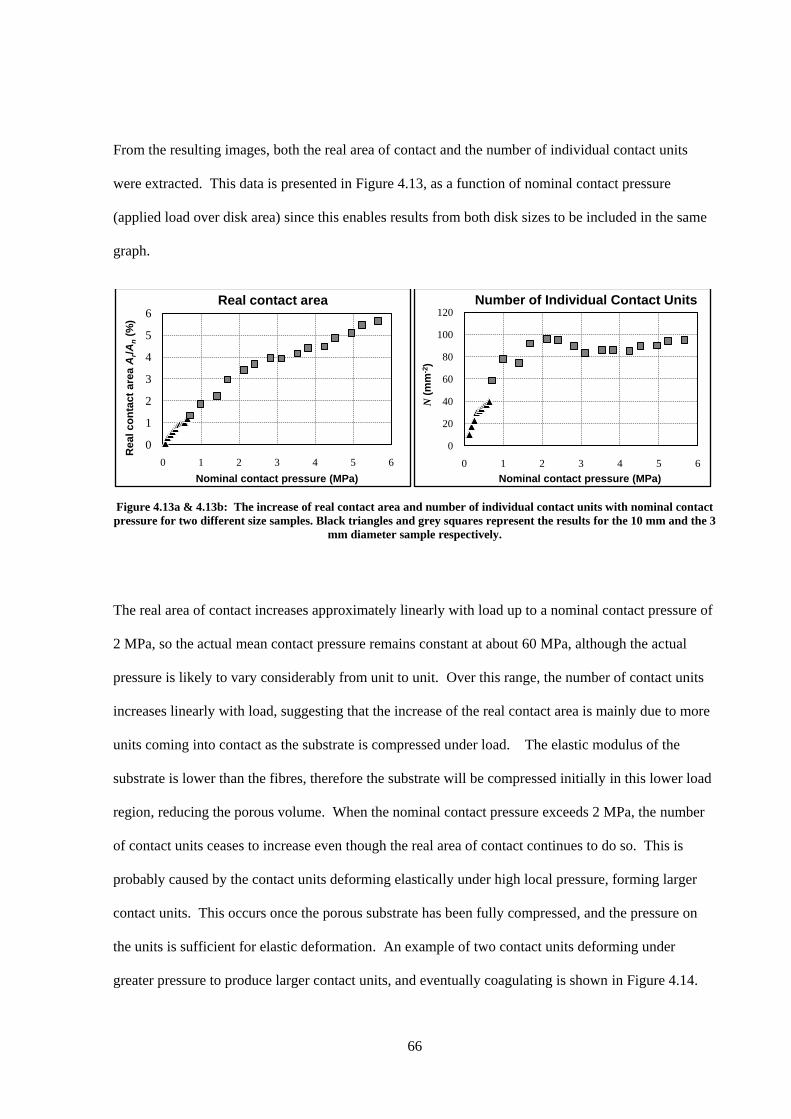
66
From the resulting images, both the real area of contact and the number of individual contact units
were extracted. This data is presented in Figure 4.13, as a function of nominal contact pressure
(applied load over disk area) since this enables results from both disk sizes to be included in the same
graph.
Figure 4.13a & 4.13b: The increase of real contact area and number of individual contact units with nominal contact
pressure for two different size samples. Black triangles and grey squares represent the results for the 10 mm and the 3
mm diameter sample respectively.
The real area of contact increases approximately linearly with load up to a nominal contact pressure of
2 MPa, so the actual mean contact pressure remains constant at about 60 MPa, although the actual
pressure is likely to vary considerably from unit to unit. Over this range, the number of contact units
increases linearly with load, suggesting that the increase of the real contact area is mainly due to more
units coming into contact as the substrate is compressed under load. The elastic modulus of the
substrate is lower than the fibres, therefore the substrate will be compressed initially in this lower load
region, reducing the porous volume. When the nominal contact pressure exceeds 2 MPa, the number
of contact units ceases to increase even though the real area of contact continues to do so. This is
probably caused by the contact units deforming elastically under high local pressure, forming larger
contact units. This occurs once the porous substrate has been fully compressed, and the pressure on
the units is sufficient for elastic deformation. An example of two contact units deforming under
greater pressure to produce larger contact units, and eventually coagulating is shown in Figure 4.14.
0
1
2
3
4
5
6
0 1 2 3 4 5 6
Real co
nta
ct
are
a A
r/A
n(%
)
Nominal contact pressure (MPa)
Real contact area
0
20
40
60
80
100
120
0 1 2 3 4 5 6
N(m
m-2
)
Nominal contact pressure (MPa)
Number of Individual Contact Units

67
Figure 4.14: Example binary image of a two contact units, increasing in size with load until they agglomerate
4.3.3 Wear of the Friction Material
During a sliding contact in a clutch, the friction material will wear, producing flatter contact regions
on the tops of the fibres. This was studied by sliding a friction material against a steel surface, and
periodically taking a measurement using the contact visualization technique. This was carried out for
both a dry contact (Figure 4.15) and a lubricated contact (Figure 4.16).
Figure 4.15a & 4.15b: The increase of real contact area and the number of individual contact units for a friction
material during a dry sliding wear process.
The real area of contact increases with sliding in both the dry and the lubricated test, although much
more so in the dry test. An increase from below ~ 2 % of the nominal area for the fresh material to ~
24 % after 18 m of sliding in the dry condition is found (Figure 4.15). When the same sliding wear
process is carried out in a group III base oil lubricant, the rate of the increase of the real area of contact
is greatly reduced. An extended sliding distance of 240 m in a lubricant was used and the results
indicate that the real area of contact reached only 5 % of the nominal area. This is probably due to the
lubricant protecting the surface. The lubricant will not form a significant hydrodynamic film at the
0
5
10
15
20
25
0 3 6 9 12 15 18
Real co
nta
ct
are
a A
r/A
n (%
)
Sliding Distance (m)
Dry Run-in
0
20
40
60
80
100
0 3 6 9 12 15 18
N(m
m-2
)
Sliding Distance (m)
Dry Run-in
0.7 MPa 5.6 MPa
20 µm

68
sliding speed used (10 mm/s), so the protection may have come from the formation of a boundary film
between the tops of the fibres and the steel. The measured friction coefficient during the lubricated
sliding test was ~ 0.15. The lubricant may also be carrying abrasive particles away from the contact.
Figure 4.16: The increase of real contact area for a friction material during a lubricated sliding wear process.
During the sliding wear process, it is likely that the fibres are truncated, as first the outermost resin
layer is removed and then possibly some fibre. This truncating wear mechanism increases the flat area
on the uppermost parts of the friction material, parallel to the sliding surface, increasing the real area
of contact (Figure 4.17). There is some initial increase in the number of contact units for the dry
condition, but after 300 seconds of sliding, this number remains relatively constant (Figure 4.15b)
even though the real area of contact continues to rise. This indicates that the units are becoming larger
as wear takes place.
Figure 4.17: Diagram of a cross section of a resin coated cellulose fibre with increasing sliding distance due to a
truncating wear mechanism,
0
5
10
15
20
25
0 30 60 90 120 150 180 210 240
Real co
nta
ct
are
a A
r/A
n (%
)
Sliding Distance (m)
Lubricated Run-in
Resin coating
Cellulose fibre
Sliding distance
Flat regions, produced by wear
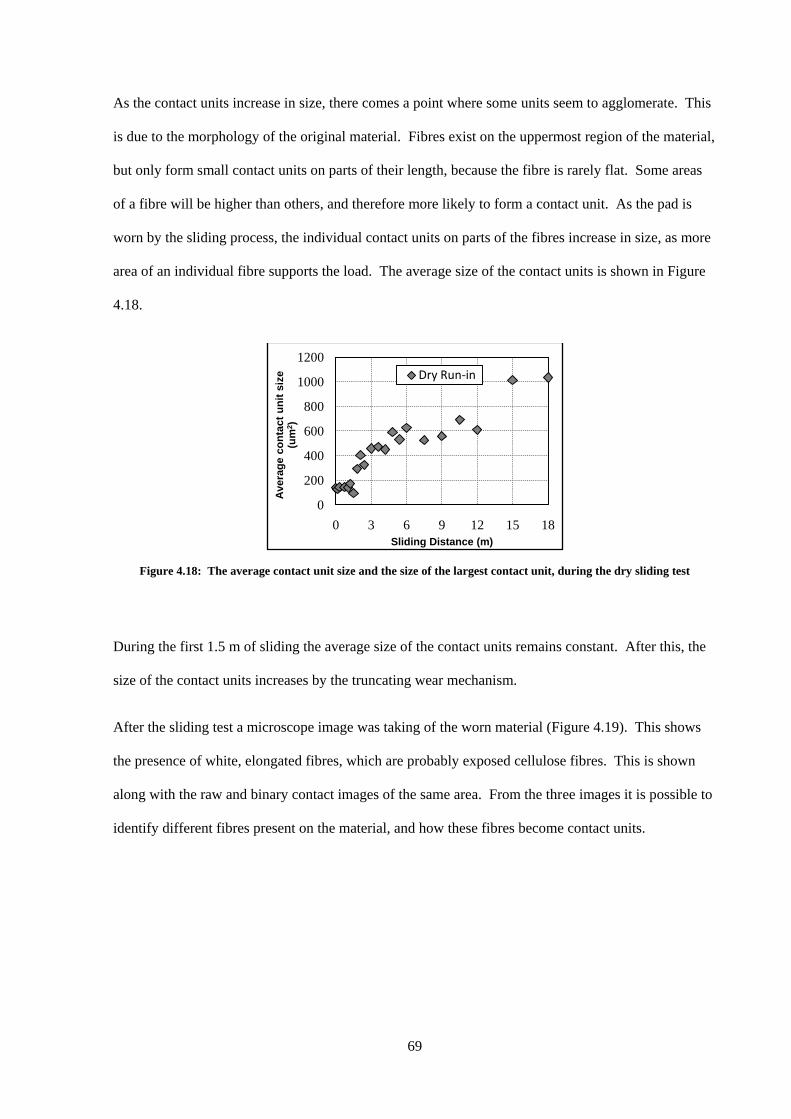
69
As the contact units increase in size, there comes a point where some units seem to agglomerate. This
is due to the morphology of the original material. Fibres exist on the uppermost region of the material,
but only form small contact units on parts of their length, because the fibre is rarely flat. Some areas
of a fibre will be higher than others, and therefore more likely to form a contact unit. As the pad is
worn by the sliding process, the individual contact units on parts of the fibres increase in size, as more
area of an individual fibre supports the load. The average size of the contact units is shown in Figure
4.18.
Figure 4.18: The average contact unit size and the size of the largest contact unit, during the dry sliding test
During the first 1.5 m of sliding the average size of the contact units remains constant. After this, the
size of the contact units increases by the truncating wear mechanism.
After the sliding test a microscope image was taking of the worn material (Figure 4.19). This shows
the presence of white, elongated fibres, which are probably exposed cellulose fibres. This is shown
along with the raw and binary contact images of the same area. From the three images it is possible to
identify different fibres present on the material, and how these fibres become contact units.
0
200
400
600
800
1000
1200
0 3 6 9 12 15 18
Avera
ge c
on
tact
un
it s
ize
(um
2)
Sliding Distance (m)
Dry Run-in

70
Figure 4.19: Microscope image of the worn friction material (left), with the corresponding raw contact image (middle)
and the binary contact image (right)
4.3.4 AFM of fibres
Atomic Force Microscopy (tapping mode) has been used to study the topography of individual fibres,
before and after the sliding process. AFM images of a fresh material (Figure 4.20) and a worn
material (Figure 4.21) are shown along with a line profile of height versus width, across the images,
used to highlight the shape and the topography of the fibres. Before rubbing the fibres have a curved
topography, with a diameter of approximately 30 μm, probably corresponding to the fibre diameter.
After rubbing, flat regions are found on the top of the fibres, suggesting that a truncating wear
mechanism has taken place [19, 71] leading to the observed increase in the average contact unit size.

71
Figure 4.20: AFM images of two fresh fibres with corresponding line profiles
Figure 4.21: AFM images of two worn fibres with corresponding line profiles

72
4.4 Summary
The contact formed between a wet clutch friction material and a glass disk has been studied using an
optical microscope technique. The friction material forms many small, discrete contact units when
loaded against a relatively flat countersurface. Contact units formed by wet clutch friction materials
have been studied over a range of pressures and during rubbing. The real contact area increases
approximately linearly with applied load, and at nominal pressures of above 2 MPa, the contact units
may be deforming elastically to give larger units. During sliding, the real area of contact increases
dramatically due to a truncating wear mechanism on the contact units. The presence of the lubricant
during the sliding reduces the wear. Detailed topographical information of individual fibres has been
collected from the friction material before and after the sliding process. Flat regions are found on the
top of fibres exposed to the sliding condition, supporting the truncating wear mechanism theory.
Excessive wear of the friction material during operation within a clutch is usually noted by a reduction
of the friction within the system. This may be due to the degradation of the rough material to form a
smooth surface, which will promote the formation of a significant hydrodynamic film. Thus it is
desirable to have a friction material which remains rough after exposure to the harsh sliding conditions
within a clutch. This will maintain a small real area of contact, consisting of small, discrete contact
units and prevent the formation of a hydrodynamic film between the surfaces.
This study provides values for typical contact parameters present in a wet clutch which will be used
later in this thesis for simple modelling of the lubrication conditions to help in interpreting
experimental friction results. Before wear, typical fractional contact area values are 1 to 5 %, typical
contact unit areas are 40 to 160 µm2 and typical mean contact unit pressures are ~ 60 MPa.

73
5 .
Chapter 5
Friction Material Temperature Measurement
In this chapter, the temperature of the wet clutch contact units are measured during rubbing, using a
Infrared camera. The temperatures of three different friction materials are measured, in a dry
condition and also lubricated. The results are discussed with reference to the composition of the
friction materials, and will be used when discussing the wet clutch friction mechanisms in Chapter 10
of this thesis.
5.1 Introduction
During sliding of two bodies, friction will occur at the contact units, and this energy will be dissipated
almost entirely as heat [75]. In a high friction interface, such as that present within a wet clutch, a
large amount of heat can be generated in a short time during a clutch engagement, but less so during
the more moderate conditions in the slipping clutch. The temperature rise of the clutches during
operation may alter the friction characteristics, and can promote the degradation of the ATF and the

74
friction material. It is important that the temperature generated within a clutch contact is measured, to
help fully understand the friction effects within this device.
5.1.1 Temperature measurement of clutches and brakes
During both clutch engagement in a shifting clutch and extended periods of sliding in a slipping
clutch, the contacting surfaces will undergo frictional heating. The contact within a wet clutch
consists of many, small contact units, which occupy only a small percentage of the nominal area; they
therefore experience a relatively high contact pressure. During sliding in a clutch contact, the
temperature of these contact units will increase, leading to wear and morphology changes of this
boundary contact. The friction materials used in wet clutch applications usually have low thermal
conductivity, due to their porous nature and the predominant use of heat insulating materials. The heat
generated in the contact is thus dissipated mainly by conduction into the steel surfaces and removal by
the circulating lubricant. Jang [76] has shown that the friction generated is predominantly the result of
the boundary friction, after the fluid film has been removed from between the approaching disks.
Many authors have modelled the temperatures within a wet clutch [76-80]. By comparison,
experimental work on the same subject is lacking. Thermocouples can be embedded into the bulk of
the steel surfaces to measure the temperature rise during engagements [81]. However these measure
the bulk of the steel material, which will be sensitive to the position of the thermocouples, resulting in
lower measured temperatures than experienced at the sliding surface. A more direct method of
measuring the flash temperatures within a clutch is to detect the Infrared (IR) radiation from the
contact region, by directly viewing the contact through a transparent surface [82]. Osanai [83]
measured the temperature of a wet clutch during an engagement using an IR thermograph and
compared the results to a theoretical model. The results showed the temperature can increase by
200°C during an engagement, and was dependent on the initial sliding speed and the pressure during
the engagement. Holgerson [47] also used an IR thermometer to measure the average temperature of a
4 mm diameter spot on a friction material surface during an engagement. The temperature was seen to
rise over 100 °C during a simulated clutch engagement. A similar IR experimental technique has been
used to study dry clutches of formula one racing cars, by measuring the temperature increase during

75
the racing start of the vehicle [84]. This technique has also been used to study the temperature rise of
a carbon fibre aircraft brake, which is engaged shortly after the aircraft has landed on the runway [85].
Both cases show temperature rises of up to 1000 °C in these extreme environments. By comparison,
the temperature increase of the wet clutch during normal operation is much lower, although even in
these comparably modest temperatures, the ATF and the friction material may degrade [83]. No
literature yet exists on the flash temperature at individual contact units of slipping clutches, with a near
constant load and a lower sliding speed range.
In a wet clutch, the heat generated during sliding of the surfaces can be dissipated by conduction into
the solid surfaces or the circulating ATF, and by radiation from the hot surfaces to cooler surfaces
[77]. The steel disks within a wet clutch provide a thermal mass with a large conductivity, allowing
the heat generated to be dissipated into the bulk of the disk and also, if it is connected to another
metallic component such as the torque converter or the clutch housing, the heat can be conducted
further away from the contact surface. Organic friction materials are, by comparison, poor heat
conductors. The values of thermal conductivity given by Jang [76] are 46.04 W/mK for the steel and
0.75 W/mK for the friction material. Since friction materials are porous and no heat can be conducted
across the voids in the material, the heat must be conducted through the fibres, which are
predominantly cellulose and themselves good heat insulators. Recently, carbon fibre has been added
to organic friction materials to help improve the latters’ thermal conductivity [86]. The carbon fibres
can be oriented in the direction of the friction material thickness, helping to conduct the heat away
from the surface into the steel base plate to which the friction material is bonded [84].
In sliding devices that experience high temperatures, “hot-spots” can be formed on the surfaces [87].
This can occur in a wet clutch when non-uniformities exist in the contact pressure distribution, which
leads to more frictional heating and greater temperature rises on areas of greater pressure. Thermal
expansion of the material occurs at these hottest areas, which subsequently enlarge to support a greater
proportion of the applied load. This effect has been studied in wet clutches by Fairbank [88] and
Hirano [89]. Here the thermal distortion of the steel plate can give rise to raised areas on the steel
disks, which will therefore experience higher pressures and flash temperatures, and eventually lead to
76
thermo-elastic deformation. This effect is usually seen in shifting clutches under harsh repeated
engagements, when the steel separator plates can reach up to 600 °C, but can be reduced by using
friction materials with high conductivity filler materials [89].
In practice, the wet clutch contact consists of many small contact units, which many authors have
neglected to acknowledge during temperature studies. The flash temperatures during the sliding with
a wet clutch occur on the contact units, which are only a small percentage of the nominal area. Much
of the published work has studied the average temperature on the contact which will be a combination
of the flash temperatures on the contact units and the bulk temperature of the circulating lubricant. In
this investigation, the temperature of the contact units is measured directly using an IR camera.
The temperature rise of three friction material samples, in both a dry and a lubricated condition is
studied under a constant load, with increasing sliding speed, and over an extended sliding period. (All
current publications report only the temperature change of the dynamic engagement of a shifting
clutch). The conditions employed in this experiment are chosen to resemble the conditions within a
slipping clutch, as closely as possible, by employing a steady state of load and sliding speeds in the
range 0.01 to 2 m/s at contact pressure of approximately 0.25 MPa.
This experiment is used to build up an understanding of the temperature changes that occur on the
contact units during sliding. This will enable the author discuss with more confidence the friction
mechanisms of the wet clutch contact later in this thesis.
5.2 Experimental Technique
To measure the temperatures at the contact units formed in a wet clutch contact in a pure sliding
regime, a conventional EHL rig (PCS Instruments, Acton, UK) is used to provide the sliding and the
loading of the contact. An IR camera is mounted above the contact, and is focussed through the upper
disc specimen onto the contact region. A photograph of the experimental set-up is given in Figure 5.1.

77
The IR camera is mounted on an adjustable X-Y-Z stage, so it can be easily positioned and focussed
on the contact. The contact is achieved by mounting a 10 mm diameter friction material disk on a
rectangular sample mount (Figure 5.2). The friction material sample is then loaded against a sapphire
disk, using the EHL rig loading system. A chromium coated sapphire disk is used as the counterface
due to its high IR permeability. The thermal conductivity of the sapphire disk and the chromium
coating is 23.1 and 69.1 W/mK respectively [90].
IR Camera mount IR Camera and lens
EHD test rig
Sample housing
Figure 5.1: Photograph of the experimental set-up, showing the EHL rig (PCS Instruments) and the IR
camera. (Reproduced from [90])

78
A low elastic modulus, silicone elastomer is placed between the friction material sample and the
sample mount. It is approximately 3 mm thick, and allows the friction material sample to self align
against the sapphire disk, forming a contact with a nominally even pressure distribution.
In this work the lower surface of the sapphire disc (in contact with the friction material) was coated
with an IR opaque, 100 nm thick, layer of chromium. The radiation reaching the camera from this
layer was used to determine the temperature of the contact. Since the measured radiation should
originate primarily from the chromium surface in contact with the sapphire (or just within the
chromium) rather than from the lower surface of the chromium in contact with the friction material,
the temperature actually measured was probably slightly lower than the true friction
material/chromium sliding contact. This likely discrepancy is discussed in Appendix B, where it is
shown using flash temperature theory that the temperature 100 nm within a body subject to a moving
heat source is about 10% lower than that at the surface. Thus it should be noted that the measured
contact temperatures described in this chapter may be up to 10% lower than those actually present.
5.2.1 Infra Red Camera and lenses
The camera is positioned above the sapphire disc and focussed through the sapphire into the contact in
order to measure IR radiation emitted from the chromium coating in the contact region. The camera
has an InSb detector [91]; sensitive to IR of wavelength from 3 µm to 5 µm. The 320×256 focal plane
array, combined with the 5× objective lens, (maximum magnification possible due to the divergence
Sample housing of EHD rig
IR Camera
lens
Friction material
sample
Loading System
Sample mount
Sapphire disk with Cr coating
Figure 5.2: Schematic representation of the position of the test sample, Sapphire disk and the IR camera,
within the EHL lubricant housing (Reproduced from [90])

79
limit of IR radiation), results in a resolution of 6.3 µm/pixel. Each temperature map covered a
rectangular area of 2.0 × 1.61 mm.
5.2.2 Calibration
Calibration involved measuring the radiation emitted from the chromium layer through the sapphire
disk, while gradually increasing the temperature of the bulk lubricant in contact with the layer. This
gave a calibration curve of camera reading (counts) versus contact temperature. Subsequent images of
camera count values from the contact area can then be readily converted into temperature.
5.2.3 Samples & Lubricants
Three wet clutch friction material samples were studied. These were all supplied by BorgWarner
(Michigan, USA), and carried the manufacturers code BWA1777, BW1799LF and BW6100. They
consist of a 2.5 mm thick steel backing disk with a 0.5 mm thick friction material bonded onto one
side.
The composition of the BW1777 is very similar to the composition of the SD1777 which has been
determined using thermogravimetric analysis (Table 4.2). This material is used in automatic
transmissions in passenger cars, where thermal stresses are moderate [92]. BW1799LF has a similar
composition to the BW1777 material, consisting of primarily cellulose fibres and phenolic resin,
although BW1799LF contains numerous graphite particles on the surface, which act as a friction
modifier. BW6100 is used in applications which experience large thermal stresses. The BW6100 has
a higher thermal capacity than the BW1777 material [92], as it contains carbon fibres.
The change of the temperature of the friction material samples were studied in the absence of a
lubricant, denoted “dry”, and also in the presence of either a base oil or a fully formulated ATF
lubricant. The base oil used is a group III lubricant supplied by Neste oil, named Nexbase 3030. This
base oil is used in ATF formulations. The composition of the ATF is unknown, although it contains
several chemical additives. The lubricant was added to the EHL lubricant pot in sufficient quantity to
fully immerse the contact, and is therefore also present on the underside of the sapphire disk outside
the contact region.

80
5.2.4 Experimental procedure
The friction material sample was washed in hexane in an ultrasonic bath for 20 minutes, then dried
using hot air. The chromium-coated sapphire disk was washed using toluene and acetone, to remove
lubricant between tests. A transparent sapphire disk (without a chromium coating) is used in the first
instance to focus the camera on the centre of the contact. This was then replaced with the chromium
coated disk to allow temperature measurement. A load of 20 N is applied through the contact,
corresponding to a nominal contact pressure of 0.25 MPa (a contact unit mean pressure of ~ 51 MPa).
An IR image is then captured when the sapphire disk is stationary, and this is used as the base line,
allowing the removal of any variation in IR measurement across the contact, such as from spherical
aberration caused by the camera lens. This also cancels out any variations in sensitivity between
elements in the camera’s focal plane array.
The sapphire disk is then rotated, applying a sliding motion between it and the friction material
sample. Images of the contact are taken at set time intervals and at different speeds. The speed of the
sapphire disk can be controlled between 0.02 and 2.5 m/s. When a lubricant is present, the disk was
not rotated faster than 1.1 m/s, since at this speed the churning motion forced the lubricant out from
the sample housing. During the temperature versus sliding time test, the speed was held constant at
0.412 m/s and an IR image was captured every 30 seconds.
5.3 Results
5.3.1 Temperature map
An example of a map showing the temperature rise across the contact during the sliding of the
sapphire disk against the friction material is shown in Figure 5.3. Discrete peaks visible in the
temperature distribution correspond to the temperature rise, resulting from the frictional heat generated
at the contact units. The areas are hottest at the centre, where the contact unit is located; the heat is
then conducted away by the chromium layer and the sapphire disk in the lateral and the vertical
direction, so the heat spots appear larger than the actual size of the contact units. The readings used in

81
this study are taken at the hottest point in the centre of a heat island, which is taken to correspond to
the maximum asperity contact temperature.
Figure 5.3: Temperature map in °C above room temperature of BW6100/Cr surface sliding at 0.436 m/s with a 20 N
load, dry.
5.3.2 Temperature vs. Sliding Time
The friction material is loaded against the chromium coated sapphire disk with 20 N load, and the
sapphire disk is rotated at 0.430 m/s for 60 minutes. This test was carried out both in the absence of a
lubricant (Figure 5.4), and when lubricated with a group III base oil (Figure 5.5). The starting
temperature for each test was recorded and was 22 °C. This test shows the steady-state temperature
rise of the contact units.
Dis
tan
ce
in
th
e Y
dir
ec
tio
n (
µm
)
Distance in the X direction (µm)

82
Figure 5.4: Maximum contact unit temperature change for three friction materials during a constant sliding speed of
0.430 m/s and 20 N load for 1 hour, in a dry contact (test at room temperature)
Figure 5.5: Maximum contact unit temperature change for three friction materials during a constant sliding speed of
0.430 m/s and 20 N load for 1 hour, in a base oil lubricated contact (test at room temperature)
The use of a lubricant markedly reduces the steady-state temperature rise at the contact units, probably
due to the combination of reduced coefficient of friction and removal of the heat generated at the
contact units.
0
2
4
6
8
10
12
14
0 10 20 30 40 50 60 70
Te
mp
era
ture
ch
an
ge
(°C
)
Sliding Time (minutes)
BWA 1777
BW 6100
BW 1799LF
0
2
4
6
8
10
12
14
0 10 20 30 40 50 60 70
Te
mp
era
ture
ch
an
ge
(°C
)
Sliding Time (minutes)
BWA 1777
BW 6100
BW 1799LF
Dry
Lubricated

83
The BWA 1777 friction material shows the highest friction rise for both the dry and the lubricated
sliding test. BWA 1777 and BW6100 have similar coefficients of friction when rubbed against steel
surfaces, BW1799LF has a lower coefficient of friction due to the increased content of graphite on the
surface of this material. The variation of the steady-state temperature is therefore dependent on both
the friction coefficient and the thermal conductivity of the materials.
BWA 1777 and BW 1799LF materials are used in passenger cars which experience moderate thermal
stresses. BW 6100 on the other hand is used in applications with higher thermal stresses, and contains
filler materials and carbon fibres which the manufacture suggest [92] increase the thermal capacity of
the material. The BW6100 may therefore be able to dissipate the heat generated at the contact units,
into other regions of the material, close to the surface. BW1799LF has a lower coefficient of friction
and will therefore generate lower flash temperatures.
5.3.3 Temperature vs. Speed
In this test, the speed of the sapphire disk is increased in set increments and an IR image of the contact
is taken after 5 seconds of sliding at each speed. This test has been carried out in the dry condition
(Figure 5.6), lubricated with a base oil (Figure 5.7) and lubricated with a fully formulated ATF at
room temperature (Figure 5.8) and at 100 °C (Figure 5.9).
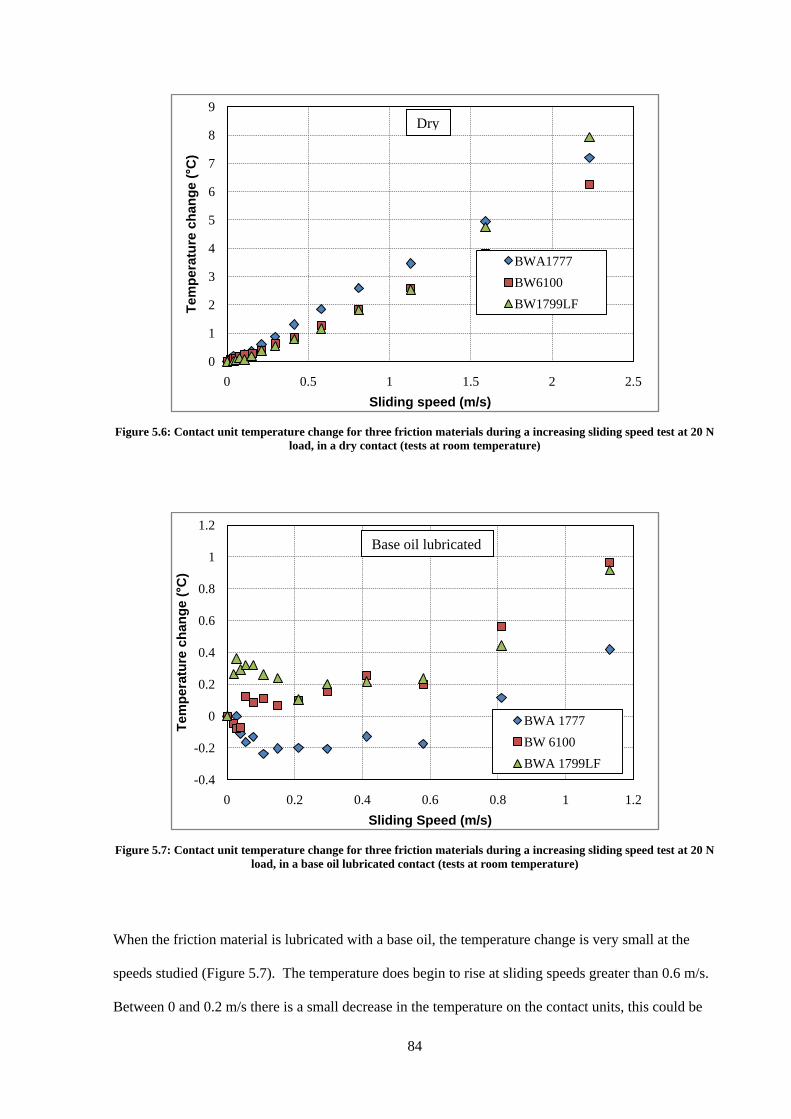
84
Figure 5.6: Contact unit temperature change for three friction materials during a increasing sliding speed test at 20 N
load, in a dry contact (tests at room temperature)
Figure 5.7: Contact unit temperature change for three friction materials during a increasing sliding speed test at 20 N
load, in a base oil lubricated contact (tests at room temperature)
When the friction material is lubricated with a base oil, the temperature change is very small at the
speeds studied (Figure 5.7). The temperature does begin to rise at sliding speeds greater than 0.6 m/s.
Between 0 and 0.2 m/s there is a small decrease in the temperature on the contact units, this could be
0
1
2
3
4
5
6
7
8
9
0 0.5 1 1.5 2 2.5
Te
mp
era
ture
ch
an
ge
(°C
)
Sliding speed (m/s)
BWA1777
BW6100
BW1799LF
-0.4
-0.2
0
0.2
0.4
0.6
0.8
1
1.2
0 0.2 0.4 0.6 0.8 1 1.2
Te
mp
era
ture
ch
an
ge
(°C
)
Sliding Speed (m/s)
BWA 1777
BW 6100
BWA 1799LF
Dry
Base oil lubricated

85
due to the changing friction coefficient of this type of system with speed. The friction coefficient of a
wet clutch decreases with speed when lubricated with a base oil, and so the heat generated may reduce
with speed in this sliding speed range. Above 0.2 m/s the friction coefficient remains fairly constant.
Figure 5.8: Contact unit temperature change for the BW1777 friction materials during increasing sliding speed test at
20 N load, in a ATF lubricated contact, (test at room temperature)
Figure 5.9: Contact unit temperature change for the BW1777 friction materials during a increasing sliding speed test
at 20 N load, in a ATF lubricated contact, (test at 100 °C)
0
0.5
1
1.5
2
2.5
3
3.5
4
0 0.2 0.4 0.6 0.8 1 1.2
Te
mp
era
ture
ch
an
ge
(°C
)
Sliding speed (m/s)
0
0.5
1
1.5
2
2.5
3
3.5
4
0 0.2 0.4 0.6 0.8 1 1.2
Te
mp
era
ture
ch
an
ge
(°C
)
Sliding speed (m/s)
ATF lubricated – room temp
ATF lubricated – 100 °C

86
When the BWA 1777 friction material is lubricated with a fully formulated ATF, there is a slightly
larger increase in the flash temperatures with sliding speed (Figure 5.8 & 5.9). This could be due to
two effects:
(i) The wet clutch lubricated with an ATF will show a friction coefficient that increases with
sliding speed. Therefore at higher sliding speeds we would expect greater flash temperatures
on the contact units, due to the higher friction coefficient.
(ii) The additives present in the ATF may also form an adsorbed chemical film of the surface of
the friction material contact units and the chromium coating on the sapphire disk. This
chemical film may restrict the conduction of the heat in to the bulk of the materials [75,88].
5.4 Discussion
In a wet clutch, the real area of contact is formed at discrete high points on the rough friction material.
During sliding these contact units will experience frictional heating, which cannot be readily
conducted into the friction material bulk because of its porosity and the low thermal conductance of
the materials used in its manufacture. The heat generated is therefore predominantly dissipated
through the steel counter-surface and the circulating lubricant, although increasingly, friction materials
contain components that can increases their heat capacity.
The temperature of the contact units formed by three different friction materials has been studied. The
materials which have been tailored to meet the demands of clutches which experience higher thermal
stresses are found to have a lower temperature increase than the friction materials used in clutches
which experience moderate thermal stresses. The BWA 1777 and BW 1799LF are both used in wet
clutch applications that experience moderate thermal stresses, whereas BW6100 is used in more
demanding applications. BW6100 contains carbon fibre and filler materials which increase the high
heat capacity of the friction material, helping to cool the contact units during frictional heating [89,
92].
An interesting observation is how the temperature change of the three materials varies with sliding
speed and is dependent on the µ-v characteristics of the system (Figure 5.7). The temperature tends to

87
decrease with sliding speed between 0.02 and 0.2 m/s when the contact is lubricated with a base oil.
As will be shown in Chapter 7, in this speed range the coefficient of friction decreases with sliding
speed. This may account for the reduction in the flash temperatures in this speed range. Conversely,
when the wet clutch is lubricated with a ATF, the friction coefficient increases with sliding speed,
which may account for the increase of the measured flash temperature with speed for this system.
When the BW1777 material is lubricated with a fully formulated ATF, the contact unit temperatures
are greater than that for the base oil of similar viscosity. This could be due to the additives within the
ATF adsorbing onto the friction material and the chromium coating on the sapphire disk, reducing the
conduction of the heat away from the sliding surfaces. This observation agrees with results published
by Fairbank [88] which shows an increase of friction heating in the presence of boundary lubricant
additives.
The contact unit temperatures have been measured to further the understanding of the generated
friction within a wet clutch. When lubricated, the temperatures measured on the contact units reach
only 2 °C at the higher sliding speed studied (1.15 m/s). This suggests that the friction coefficients
measured in the friction screener test (Chapters 6-9) will not be influenced by flash temperature
effects.
5.5 Summary
An IR mapping technique was used to study the flash temperatures formed on contact units formed
between a friction material sample and a sapphire disk. The contact unit temperatures differ for the
three materials, and can be attributed to the different abilities of the friction materials to conduct the
heat away from the contact unit and the changing friction coefficient.
When the contact was lubricated, a large reduction in the contact unit temperature has been observed,
which can be attributed to the reduction of the friction coefficient, and the convection of heat from the
contact unit by the lubricant.

88
The contact unit temperatures measured in this chapter will be used later on in this thesis when
discussing the friction of the wet clutch system since frictional heating can be largely ruled out as a
contributing factor to the measured friction, when studying friction versus sliding speed curves of
lubricated, slipping clutches.

89
6 .
Chapter 6
Friction Screener Development
Many studies of wet clutch friction are carried out using an LVFA or a SAE No. 2 machine, which are
large, expensive to build and operate, and are sometimes inaccurate. For more intricate studies of the
wet clutch friction an accurate and reliable method which is also relatively low cost and rapid is
needed. In this chapter, friction screeners intended for this purpose developed by other authors will
be reviewed, followed by a description of the development and the evaluation of the friction screener
used in this thesis.
6.1 Introduction
The performance of wet clutches within automatic transmissions can be predicted by studying the
friction characteristics of the material/lubricant combination. Generally, an LVFA (Low Velocity
Friction Apparatus)-type machine can be used to evaluate the performance of slipping clutches, and an
SAE (Society of Automotive Engineers) No. 2 machine can be used to study the engagement of
shifting clutches. Both the LVFA and the SAE No. 2 machine are large and expensive to build and
operate. These machines are intended to place the clutch components and the ATF under large
stresses during long test cycles which can accommodate a range of pressures, speeds and temperatures.

90
As such they are not suited for use on more controlled studies which require very accurate friction
measurements. For the purpose of this thesis a more accurate friction screener is needed which allows
the study of a controlled contact with accurate friction measurements. This was achieved by
modifying an Mini Traction Machine (MTM) (PCS Instruments, Acton UK), to allow the study of the
friction between a steel ball and a friction material disk under pure sliding conditions. The
modifications included changes to the loading system and the friction measurement technique. The
friction screener developed is highly repeatable and has been used in Chapters 7-9 of this thesis to
investigate various aspects of wet clutch friction.
6.2 Wet Clutch Friction Screeners Review
A limited number of published works on wet clutch friction describe the use of novel friction
screeners. The vast majority of friction screeners are intended for studying the friction between two
steel surfaces, under high contact pressures, like those found in many engine and gearbox parts. A wet
clutch operates at much lower mean contact pressures of approximately 1 MPa, due to the contact
between two annular disks having a large nominal contact area. A good wet clutch screener must
operate at low pressures, which requires an accurate loading system if a pin-on-disk configuration is
used and an accurate force transducer to measures the consequently low friction forces. This section
reviews some of the friction screeners used in wet clutch studies in the literature.
Gao [93] used a friction testing apparatus modified from a pin-on-disk simulator. In this, three pieces
of friction material were attached to a disk and spaced 120° apart (Figure 6.1). This assembly was
loaded against a steel plate, and driven in a temperature controlled fluid pot. The friction was
measured on the lower steel specimen, by measuring the resultant torque between the specimens
during sliding.

91
This set up is similar to that used by Ito [34]. When using this sample configuration, it was essential
to bond the friction material sample exactly parallel to the steel plate, to ensure three compliant
contacts. If the friction material samples were not parallel, an uneven contact pressure would exist
across the sample. Also, the manufacture of samples in this configuration was time consuming, and
could result in all the samples having small variations, reducing the repeatability of this screener.
Ost [23] developed a friction screener that used a small coupon of friction material loaded against a
steel disk. The coupon was loaded against the steel disk by a pneumatic piston, through a ball and
socket joint, allowing the two flat surfaces to align. The coupons were prepared by cutting and milling
of full clutch disks, and might therefore have been altered by the heating during the cutting processes,
and cutting debris might have been present on their surfaces.
Devlin [53] used an MTM with a steel ball loaded against a friction material disk. Both samples were
rotated at speeds of 0.04 m/s to 0.4 m/s with a slide/roll ratio of 20 %. This set up was used to study
the effect of additives on different friction materials, but the experimental conditions were different to
a real clutch system. A 20 % slide/roll ratio was applied between the specimens, whereas a real clutch
operates in a purely sliding contact. Rolling may affect the friction performance of the additives,
giving different values to those found in a pure sliding system, and it may also promote entrainment of
the fluid.
Figure 6.1: Friction material test piece configuration used by Gao [93]

92
Marklund [94] used a pin-on-disk machine manufactured by Phoenix Tribology called the TE67 [95],
to study the friction of a sintered bronze friction material. The friction material was a 3 mm disk and
was connected to the end of the pin. Marklund compared the pin-on-disk method to a disk-on-disk test
rig at similar conditions and showed that both methods give a similar trend, although the friction
coefficient value varied slightly between the tests. This was attributed to the presence of grooves on
the friction material in the disk-on-disk test. The same instrument was used by Bezzazi [96] to study
the clutch facings of manual clutches.
Most of the smaller, simple friction screeners have a steady loading state, similar to that of the LVFA,
but Holgerson [47] developed a friction screener with a dynamic loading system, allowing the wet
clutch engagements to be studied. His screener had the same basic principle parts as the SAE No.2,
although the inertia of the flywheel, which was directly driven by a motor, was easily changed by the
addition of more weight. The load was applied by a hydraulic cylinder, and could apply pressures of
up to 7 MPa between the test specimens. The specimens used were annular clutch disks from
transmissions. The temperature of the engagements was also measured using a IR thermometer placed
through a hole in the housing.
In this thesis, a ball-on-disk configuration is adopted to study the friction between a steel ball and a
friction material disk. The use of a ball eliminates alignment problems commonly present between
flat-on-flat surfaces. An MTM is used, as was employed by Devlin [53] to study wet clutch friction.
However, unlike Devlin, pure sliding and low contact pressures are employed, so as to reproduce the
wet clutch conditions more realistically.
6.3 Mini Traction Machine
The Mini Traction Machine (MTM) is a bench top screener, commonly used to study the friction
between a steel ball and a steel disk (Figure 6.2). The MTM was originally designed for studying
friction within elastohydrodynamic contacts [97]. Its success warranted its use to study lubricants and
surfaces over a range of conditions, such as the conditions found within engine components [98] and
bio-tribology applications such as soft contact EHL [99].

93
In an MTM, both ball and disk are independently driven by DC motors, so that any combination of
sliding and rolling can be achieved. The ball and disk can be driven at speeds between 0.01 m/s and 5
m/s and the contact is achieved by loading the ball against the disk by means of a stepper motor and a
load beam. Loads of between 5 and 75 N can be applied using the standard instrument, corresponding
to contact pressures in the 1 GPa region if the standard AISI 52100 steel samples are also used. The
specimens are housed in a temperature controlled pot, which is used to hold the lubricant which
immerses the contact. The lubricant can be controlled at temperatures between ambient and 150°C.
Lower temperatures can be achieved by using an optional coolant circulation system.
Figure 6.2: Diagram of a Mini Traction Machine (PCS Instruments)
The upper specimen shaft is supported by a gimbal arrangement, so that it can rotate around two
orthogonal axes. One axis is normal to the direction of the load, and the second is normal to the
friction force direction. The central axis of the ball shaft and the disk shaft intersect to establish a
parabolic path on the ball surface. The angle of the ball shaft with respect to the disk is chosen to
minimize spin in the contact [97]. The load is applied by driving a small motor to tilt the ball shaft
about an axis. The stepper motor and the ball shaft are connected by a load beam, which deflects
under strain when a load is being applied between the ball and the disk. The deflection of this load
beam is measured using a strain gauge and is used to calculate the load being applied.
Load beam
Stepper motor
Ball motor
Disk motor
Ball specimen
Disk specimen

94
A high stiffness force transducer is placed between the ball shaft and a solid mount, in the direction of
the friction force (Figure 6.3). The compression and extension of the force transducer can be used to
calculate the force on the ball in the direction of sliding, and therefore the friction.
Figure 6.3: Diagram of the specimen configuration within the MTM
6.3.1 Specimens
The steel ball used has a 19.05 mm diameter and is manufactured from the bearing steel AISI 52100
and polished to a RMS surface roughness of approximately 10 nm. The friction material disks used in
this study were specially manufactured by Borg Warner and consist of a 1.5 mm thick steel base, with
a 0.5 mm thick friction material bonded onto one surface. To ensure they are the same height as the
standard specimens (6 mm) used in the MTM instrument, a spacer disk (4 mm) is used to raise the
friction material samples from the base of the disk mounting. The specifications of the samples are
given in Table 6.1.
Load
Ball specimen
Disk specimen Direction of disk rotation
Friction force
Force transducer

95
Table 6.1: Friction screener sample specifications
Sample and Parameter Value
Ball Sample (Figure 6.4)
Material
Diameter
RMS Surface Roughness
Elastic Modulus
Poisons Ratio
Steel, AISI 52100
19 mm
~ 10 nm
207 GPa
0.3
Disk Sample (Figure 6.5)
Material
Diameter
RMS Surface Roughness
Young’s Modulus
Poissons Ratio
Friction Material, SD-1777
50 mm
~ 5 μm
~ 120 MPa
~ 0.05
Figure 6.4: Image of a steel ball, used as the upper specimen in the MTM. The diameter of the ball is 19 mm

96
Figure 6.5: Image of a friction material disk, manufactured for use on a MTM. The disk has an outer diameter of 50
mm
The steel balls composition is given in Table 6.2.
Table 6.2: Composition of the steel alloy AISI 52100
Fe C Mn Cr Si P S
Base metal 0.98 – 1.1 % 0.25 – 0.45 % 1.3 – 1.6 % 0.15 – 0.4 % 0.025 % max 0.025 % max
The composition of the SD1777 friction material was determined using TGA analysis, and is given in
Table 4.2.
6.3.2 Contact Conditions
The contact is achieved by loading a steel ball against the friction material disk. The wet clutch
operates with nominal contact pressures between 0.1 to 10 MPa, so a similar nominal pressure should
be used in this study. A load of 3 N produces a contact radius of approximately 0.5 mm, and therefore
a mean contact pressure of approximately 3 MPa. This was calculated both using the Hertz theory
97
[100], and also by measuring the width of the wear track on the friction material disk after a short
sliding test. In the standard testing method described in this chapter, a 3 N load is used.
6.4 MTM Modifications
To apply a load of 3 N accurately and to measure the subsequent lower frictional forces, modifications
were made to the hardware and the software of the MTM, as detailed below.
6.4.1 Loading System
In order to measure friction at contact pressures in the 3 MPa range, a load of 3 N was needed, which
required the replacement of the loading system with a more accurate loading system. In the MTM
system the load beam is connected between the ball shaft housing and a stepper motor. As the stepper
motor rotates it raises the load beam, which rotates the ball shaft housing about an axis, loading the
ball sample against the disk. The deflection of the load beam is used to measure the load applied
between the ball and the disk. The load beam deflection is detected by a strain gauge which is
calibrated by placing the ball in the contact position, and then applying a known force against the ball,
deflecting the load beam.
To accurately apply low loads in the MTM the standard 3 mm thick load beam was replaced with a 1
mm thick load beam, which had greater deflection under loading. This was then calibrated using a
200 g dead weight. After installing and calibrating the 1 mm thick load beam, loads of between 0.5 to
8 N could be applied accurately.
6.4.2 Friction Measurement
The method for measuring the friction in the MTM involves measuring the force normal to the
direction of loading on the ball. The ball and its motor are housed on a flexure, which is stiff in the
direction of loading but can be displaced in the direction in which the frictional force is measured.
The friction force is measured by a force transducer, located between the ball motor and a solid steel
support. The force transducer generates a signal in millivolts, dependent on its compression. This
signal is amplified and linear filtered (0 – 5 V), and then converted to a digital 12 bit value between 0
and 4096. The digital value is multiplied by the traction slope value from the calibration to give a

98
force in Newtons. The traction slope is calibrated by applying a known force to the transducer, and
measuring the transducer output.
In a sliding/rolling test, the friction is measured in both directions, by first rotating the ball faster than
the disk, and then rotating the disk faster than the ball. These two values are given as TF1 and TF2 in
the output file, which are then averaged and multiplied by the force constant to give a force in
Newtons. The force in Newtons is then divided by the load given by the loading beam to give a
friction coefficient. This averaging method has the effect of cancelling any non-zero offset of the
friction load cell present when no friction force is applied. This removes the need to accurately
determine the “zero” point of the friction, the point at which no deflection is applied to the ball, which
can vary with temperature and due to hysteresis, leading to errors in the friction measurements. The
measurement of friction on both directions and averaging has thus been widely adopted as the standard
testing method used on this machine.
In a pure sliding, unidirectional system, this averaging method of measuring the friction to remove any
zero force offset is not possible. The wet slipping clutch operates in a pure sliding regime, with only
one direction of sliding. Therefore the system should follow the same regime. When a force is
applied to the force transducer, and released, the output at the rest state given by the transducer can
vary. Knowledge of this zero friction reading is important to accurately calculate the friction at each
speed. To overcome the problem of the varying zero friction reading between speed steps, the MTM
software was rewritten so that a zero friction value is recorded at each step of the testing profile, by
halting the disk rotation and unloading the ball. After the zero friction value was recorded the disk
was then rotated at the desired speed, the ball is loaded against the disk and the friction then measured,
using the newly acquired zero value as a baseline. At least four measurements are taken during the
speed step, each one consisting of the average of the force measurement taking at a frequency of one
KHz for five revolutions of the disk. This method of measuring the friction for a unidirectional system
has been shown to give repeatable results as will be demonstrated using the “standard testing method”
described below.

99
6.5 Standard Testing Method
The steel ball sample is cleaned in toluene for 20 minutes in a ultrasonic bath, followed by cleaning in
acetone for 20 minutes, also in the ultrasonic bath. The friction material sample is cleaned in hexane
for 20 minutes in the ultrasonic bath. The friction screener lubricant pot and ball shaft is rinsed with
toluene, followed by propanol, to remove any residual oil.
The friction material disk and the steel ball are fastened in the test rig, and a lubricant is added to the
pot. Sufficient lubricant, approximately 40 ml, is added to cover the disk. The pot is loosely sealed
with a steel lid, and a plastic cover for insulation. The computer control program is then started. The
lubricant is heated up to the test temperature (usually 100°C), with the disk rotating at 0.1 m/s to
provide oil circulation around the pot. When the desired temperature is reached, this is maintained for
30 minutes to ensure the temperature is stable before the beginning of the test. The ball is loaded
against the disk with a load of 3 N, with the disk rotating at a sliding speed of 0.1 m/s. When the load
is achieved, the disk continues to rotate at 0.1 m/s for 10 minutes. This short break-in step ensures that
a stable friction coefficient is reached before the friction versus speed measurements are taken.
Although this step is called the break-in step it is very mild compared to the conditions used in some
of the published work using the LVFAs and the SAE No. 2 machine, and the test specimens can still
be considered “fresh”.
After the break-in procedure the disk rotation is halted and the ball is unloaded from the disk. A zero
friction value is also recorded. The friction is then measured between the speeds of 0.01 m/s and 0.6
m/s for the short test and 0.01 and 2 m/s for the extended speed test, at the desired load. Before each
speed step the rotation is halted and the contact de-coupled, and a zero friction value recorded, which
is then used when calculating the friction. The disk speeds studied are – 0.01, 0.02, 0.04, 0.06, 0.08,
0.1, 0.12, 0.14, 0.16, 0.2, 0.25, 0.3, 0.35, 0.4, 0.45, 0.5, 0.55, 0.6, 0.7, 0.8, 0.9, 1, 1.2, 1.4, 1.6, 1.8, 2
m/s. The sliding speeds used here were chosen to represent the sliding speeds experienced by a
slipping wet clutch in an AT.

100
At the lower speeds the friction values sometimes vary, dependent on the position of the disk, so a
longer step is needed to record more friction values to achieve a better average. Between 0.01 and
0.14 m/s, the friction is measured for 60 seconds, above this the friction is measured for 30 seconds.
The friction versus speed step may take 20 minutes. The length of the entire test is less than 1 hour
and 15 minutes.
6.6 Evaluation and Limitations
The repeatability of the friction screener was evaluated by carrying out four identical tests, and
studying the variation in friction. This evaluation was carried out using the standard testing method at
100°C for a base oil (Figure 6.6) and a fully formulated ATF (Figure 6.7). The base oil used is a
group III base oil, with a kinematic viscosity of 3 mm2/s. The fully formulated ATF has a kinematic
viscosity of 5.5 mm2/s and contains a variety of chemical additives.
Figure 6.6: Repeatability evaluation, standard testing procedure with a Nexbase 3030 base oil lubricant. Symbols
represent the average of four measurements; the error bars denote the maximum and minimum measured friction
over the four tests
0
0.05
0.1
0.15
0.2
0.25
0 0.5 1 1.5 2
Fri
cti
on
Co
eff
icie
nt
Sliding Speed (m/s)
Base Oil

101
Figure 6.7: Repeatability evaluation, standard testing procedure with a fully formulated ATF. Symbols represent the
average of three measurements; the error bars denote the maximum and minimum measured friction over three tests
At low speeds there is some small variation in the measured friction for the base oil test (Figure 6.6),
other than this the measured friction values are very similar across the repeat tests. The variation of
the measured friction in the ATF lubricated test is very small (Figure 6.7). The friction screener that
has been developed can therefore be considered quite repeatable.
It should also be noted that the shape of the curves correspond to data published elsewhere [54,101],
and the values of the friction coefficient are also similar. The mechanisms that control these friction
characteristics are discussed in Chapter 10.
As the MTM has been modified to apply lower loads, the main limitation of the instrument will be the
measurement of the small friction forces generated in the contact. Friction forces become scattered
below values of 0.1 N, therefore below this value the friction measurements will be inaccurate. One
reason for this is that at lateral forces of 0.1 N, only 12 digital points are used to denote the difference
between the zero and the measured friction point, of the ~ 2000 available. However scatter may also
result from slight variations in the zero offset value between when it is measurement and sliding
friction is measured, which become significant only when the sliding friction measured is very small.
The practical operational range of the friction screener is given in Table 6.3.
0
0.05
0.1
0.15
0.2
0.25
0 0.5 1 1.5 2
Fri
cti
on
Co
eff
icie
nt
Sliding Speed (m/s)
ATF

102
Table 6.3: Friction screener test limits
Property Value
Temperature Ambient – 150
°C
Applied Load 0.5 – 8 N
Sliding Speed 0.01 – 5 m/s
Measured Friction Forces 0.1 – 10 N
By using the standard testing samples of the steel ball and the SD-1777 friction material disk, this load
enables nominal contact pressures of between 1.6 and 4.2 MPa to be achieved.
6.7 Summary
A friction screener has been developed to study the friction of a wet clutch type contact. The friction
screener is a modified MTM, with low loading capabilities and an accurate method for measuring the
resulting low friction forces. The test geometry is achieved between a steel ball and a friction material
coated steel disk. The contact area can be lubricated, and the temperature can be controlled accurately.
Repeat testing using the screener showed very small variations in the friction from test to test, with a
friction variation of less than 10 % for the worst result at low speed.
This friction screener is used throughout this the thesis to accurately generated friction versus sliding
speed results of a wet clutch contact. These friction characteristic curves can be used to predict the
performance of a wet clutch/lubricant combination in an automatic transmission.

103
7
Chapter 7
Wet Clutch Study of Industrial Additives
In this chapter lubricant additives used in ATF formulations are studied using the friction screener.
Friction modifiers, dispersants and detergents, which all influence the friction of wet clutches, have
been studied individually, as a mixture of two additive blends, and at a range of temperatures. The
film forming ability of overbased detergents has also been studied using the MTM SLIM. This chapter
is used to give insight into the friction effects of the additives used in ATF formulations which will be
expanded in Chapter 8 and 9 by using model additives and different surfaces, to study the frictional
action of additives in more detail.
7.1 Introduction
Wet clutch and ATF combinations must exhibit the characteristic of friction increasing with sliding
speed, which prevents stick-slip effects “hunting” and “shifting”. To provide this desirable friction
characteristic in a wet clutch, the ATF contains some surface active additives. Three classes of
additives are usually included in ATF formulations to control the friction characteristics of wet

104
clutches, these are friction modifiers, dispersants and detergents. Friction modifiers are used to
reduce the static friction of a wet clutch and produce the positive gradient friction versus sliding speed
curve. But friction modifiers also reduce the overall friction of the wet clutch and therefore reduce the
amount of torque that can be transmitted, reducing its efficiency. Dispersants and detergents are
added to the ATF formulation along with the FM to increase the friction within a wet clutch.
Dispersants and detergents are sometimes referred to as “friction enhancers” due to their action of
increasing the friction within a wet clutch. The friction modifier ensures the desirable friction
characteristics, while the addition of a detergent and dispersant to the friction modifier increases the
friction and maintains the desirable friction characteristics.
Although the effect of the different additives on wet clutch performance is known, the mechanisms by
which they work are not understood. In this chapter the three classes of additives used to control
friction characteristics in wet clutches, friction modifiers, dispersants and detergents, will be studied
using the friction screener under different conditions, to build up knowledge of the effects of these
additives.
7.1.1 Additive Mechanisms
Friction modifiers, dispersants and detergents are surface active molecules and may therefore
chemisorb or physisorb to the surfaces within a wet clutch. Friction modifiers have been shown to
adsorb onto steel surfaces forming closely packed, well-ordered layers that reduce friction between
sliding surfaces [102]. Dispersants and detergents are also surface active since they contain polar
groups which will allow the molecules to adsorb onto a surface. Dispersants and detergents have been
shown to adsorb onto the surface of cellulose, a major component in the friction material [66], and
may also adsorb onto steel surfaces. A selection of FM, dispersants and detergents which are currently
used in ATF formulations will be studied individually and as simple mixtures containing two and three
additives.

105
7.1.2 Temperature variation
During operation of the automatic transmission the temperature of the fluid and the clutches can vary
due to environmental conditions and the operation of the components. In colder climates, the
temperature of the ATF during the first minutes of vehicle operation can be very low. During a
punishing driving cycle, when many gear changes take place in a short space of time, such as during
racing of the vehicle, the repeated engagement of the clutches can increase the temperature on the
contacting surfaces dramatically. Under both conditions, the wet clutches should maintain their
friction characteristics so that the vehicle continues to operate without exhibiting the hunting and
shudder phenomenon. The friction screener was used to evaluate the effect of temperature on the
three classes of additives, and a fully formulated ATF.
7.1.3 Overbased detergent films
Overbased detergents are known to form a chemical film consisting of calcium or magnesium
carbonate on steel surfaces. The boundary film formation of three overbased detergents was studied
using a Spacer Layer Image Mapping (SLIM) technique. It is important to understand the influence of
the carbonate film, and whether its thickness is related to the frictional action of the detergent in a wet
clutch.
7.2 Experimental
7.2.1 Friction Screener
To study additive effects on friction within a wet clutch the friction screener described in Chapter 6
was used, with a steel ball on a friction material disk test configuration. The steel ball was the steel
alloy (AISI 52100) and the friction material used carried the manufactures code SD-1777. The
composition of the friction material is shown in Table 4.2.
The test sequence employed is summarised below.
(i) The lubricant was heated to the desired temperature (100 °C in the standard test) with the disk
rotating at 0.1 m/s to circulate the lubricant.
106
(ii) Once the desired temperature was reached, the lubricant was held at this temperature for 30
minutes, to ensure the lubricant temperature stabilised.
(iii) The ball was loaded against the disk at the desired load (3 N in the standard test), and the disk
rotated at 0.1 m/s for ten minutes. The friction was measured during this “break-in” condition.
(iv) A friction versus speed plot was then obtained, by recording the friction measured on the ball
when loaded against the disk at set disk sliding speeds, ranging from 0.01 to 0.6 m/s. The load
between the ball and disk during this was 3 N.
(v) The lubricant was then cooled, until it reached a safe temperature for the samples to be
handled and replaced.
7.2.2 MTM SLIM
The Mini Traction Machine with Spacer Layer Image Mapping (MTM SLIM), has been used to study
boundary film formation of three overbased detergent additives. In this test, a 19 mm diameter steel
ball (AISI 52100) and a SD-1777 friction material disk are subject to a sliding/rolling contact with a
slide/roll ratio of 0.5, under a load of 31 N (~ 6 MPa nominal contact pressure) at an entrainment
speed of 0.1 m/s for a total of 2 hours. At set intervals of 5, 15, 30, 60 and 120 minutes, a Stribeck
curve is taken at 31 N load between the speeds 0.01 and 3.5 m/s at a 0.5 slide/roll ratio. An
interference image is also taken from the steel ball at these intervals, which allows the visualisation
and the quantification of the build up of a chemical film on the ball [103]. Unlike the unidirectional
pure sliding friction screener, mixed sliding/rolling is used in the MTM SLIM test to deposit a
homogeneous film on the steel ball for SLIM analysis.
7.2.3 Lubricants
Three classes of lubricant additives have been studied; friction modifiers, dispersants and detergents.
These have been studied separately as monoblends, where only one additive is studied is present in a
base oil. The additive concentrations chosen in this study are in the upper concentration range of
current ATF formulations.

107
The base oil that was used during this testing was a group III lubricant supplied by Neste oil. It carries
the commercial name “Nexbase 3030”. Nexbase 3030 is currently used in some commercial ATF
formulations. Some of its properties are given in Table 7.1.
Table 7.1: Physical properties of Nexbase 3030 base oil
Property Value
Viscosity
At 100 °C
At 40 °C
3 mm2/s
12 mm2/s
Viscosity Index 111
Density at 15C 825 kg/m3
7.2.3.1 Friction Modifiers
Four friction-modified base oil solution were prepared, all at a 1 % wt. concentration in Nexbase 3030.
Some structural details of the FMs are shown in Table 7.2. A selection of four will be studied, all of
which are currently used in ATF formulations. The full structures of the FM cannot be revealed as
they are confidential. Model FMs are studied in Chapter 8, where the full structures are known.
Table 7.2: Details of the commercial friction modifiers studied using the friction screener
Label Structure
FM W Long chain amide
FM X Intermediate chain amide
FM Y Long chain succinimide polyamine
FM Z Long chain ethoxylated amine
FM W and FM X have the same head group, but have different length alkyl chains. FM Y has a
polyamine head group, similar to a dispersant, and a linear alkyl chain with no branching. FM Z has a
head group containing hydroxyl groups.

108
7.2.3.2 Dispersants
Polyisobutenyl succinic anhydride polyamine (PIBSA PAM) dispersants were used in this study
(Figure 7.1).
The dispersants differed by polyisobutylene (PIB) molecular weight and polyamine type. Two types
of polyamines were used; tetraethylenepentamine (TEPA) and diethylenetriamine (DETA). The
details of each dispersant used is outlined in Table 7.3.
Table 7.3: Structure of Dispersants used in the study
These dispersants were manufactured using high purity chemicals and PIB polymers with a narrow
molecular weight distribution. These dispersants are similar in structure to those used within ATF
formulations. Each dispersant was blended at a concentration of 3 % wt. in Nexbase 3030.
7.2.3.3 Detergents
Four detergents where studied; a linear chain calcium sulphonate, two branched chain calcium
sulphonates and a branched chain magnesium sulphonate. The details of these detergents are shown in
Table 7.4. The structure of a calcium sulphonate molecule is given in Figure 7.2, where the “R”
Dispersant Label PIB Molecular Weight Polyamine Type
M1 450 TEPA (n=2)
M2 950 TEPA
M3 2225 TEPA
M4 950 DETA (n=1)
Figure 7.1: Polyisobutenyl succinic anhydride polyamine (PIBSA PAM) dispersant

109
groups are hydrogen or alkyl chains that can be linear or branched. Det K, L and M are overbased
while Det N is neutral. Det L and N differ only in terms of the CaCO3 concentration.
Table 7.4: Details of the detergents used in this study
Label Alkyl chain structure Detergent type TBN
Det K Linear Ca Sulphonate 300
Det L Branched Ca Sulphonate 300
Det M Branched Mg Sulphonate 400
Det N Branched Ca Sulphonate Neutral
SO3-
R
R
SO3-
R
R
Ca2+
Figure 7.2: Molecular structure of a Calcium Sulphonate molecule
All four detergents were studied at 3 % wt. in Nexbase 3030.
Overbased detergents contain a high concentration of metal carbonate, which is used to neutralise
acidic species that become present during the lifetime of a lubricant. A detergent thus consists of a
nanosized-metal carbonate core, surrounded by sulphonate molecules (Figure 3.8).
TBN or Total Base Number is a measure of how basic a detergent is. A 300 TBN Ca Sulphonate
contains the base equivalent to 300 mg of KOH per gram. The degree of overbasing is limited by the
oil solubility and the filterability [62].

110
7.2.3.4 Blends
The friction characteristics of simple blends containing two additive types were studied using the
friction screener. One of each type of additive; friction modifier, dispersant and detergent were
selected and blended in the Nexbase 3030 base oil at the concentration shown in Table 7.5.
Table 7.5: The composition and concentration of the four additive blends
FM W
(long chain amide)
Disp M2
(MMW PIB TEPA)
Det L
(Branched Ca Sulphonate)
Blend 1 1 wt. % 3 wt. %
Blend 2 1 wt. % 3 wt. %
Blend 3 3 wt. % 3 wt. %
Blend 4 1 wt. % 3 wt. % 3 wt. %
These blends were then studied using the friction screener, using the standard test procedure at 100°C.
7.3 Results
7.3.1 Industrial additive monoblends
The results obtained using the friction screener to study individual additives are given in the following
sections.
7.3.1.1 Friction Modifiers
Figure 7.3 shows the behaviour of the four different FMs studied using the friction screener, in a pure
sliding clutch contact at 100 °C.

111
Figure 7.3: Wet clutch friction results of four industrial friction modifiers
All the friction modifiers decrease the friction coefficient of the system compared to the base oil only,
and produce a positive gradient friction versus sliding speed curve. Friction modifiers are known to
adsorb onto steel surfaces, to form boundary films with low shear strength [102]. In a wet clutch, FMs
presumably reduce the static friction by the same mechanism, by forming a low shear film on the
surfaces. The degree of the friction reduction is probably dependent on both the structure of the FM
molecules which may dictate their effectiveness and the concentration of the blend. In this study, FM
W shows the lowest friction values over the entire speed range. FM W has a relatively long alkyl
chain and may therefore be able to form strong, ordered monolayers between the two material
surfaces, decreasing friction. FMs with longer alkyl chain length are known to be more effective at
reducing friction [104]. In comparison FM X, which has the same head group but a shorter alkyl chain
length, produces the same positive gradient μ-v curve in the test but gives a higher friction value
throughout the entire speed range. This may be the result of the lower molecular weight FM forming a
thinner or less supportive film on the surface of the two materials which may thus have a higher shear
strength.
0
0.05
0.1
0.15
0.2
0.25
0 0.1 0.2 0.3 0.4 0.5 0.6
Fri
cti
on
Co
eff
icie
nt
Sliding Speed (m/s)
FM W FM X
FM Y FM Z
Base Oil

112
FM Y gives the highest friction over the speed range. The alkyl chain used in this additive is slightly
branched which probably results in a boundary film with a higher shear strength than the other friction
modifiers.
7.3.1.2 Dispersants
The friction effects of four dispersants with sliding speed have been studied in a clutch contact at 100
°C. Three dispersants (M1, M2 and M3) have the same TEPA polyamine head group, and have
varying PIB molecular weights. The friction behaviour of these three dispersants is shown in Figure
7.4. Dispersants M2 and M4 have the same molecular weight PIB tail group and have different
polyamine head groups (TEPA and DETA respectively). The results for these two dispersants are
shown in Figure 7.5.
Figure 7.4: Wet clutch friction results of three dispersants with varying PIB molecular weight
The μ-v characteristics shown in Figure 7.4 indicate that all the dispersants have the effect of
increasing the friction within the wet clutch system compared to base oil over the majority of the
speed range. The low molecular weight (LMW) dispersant (M1) has the greatest effect of increasing
0
0.05
0.1
0.15
0.2
0.25
0 0.1 0.2 0.3 0.4 0.5 0.6
Fri
cti
on
Co
eff
icie
nt
Sliding Speed (m/s)
Base Oil
M1 - LMW PIB Dispersant
M2 - MMW PIB Dispersant
M3 - HMW PIB Dispersant
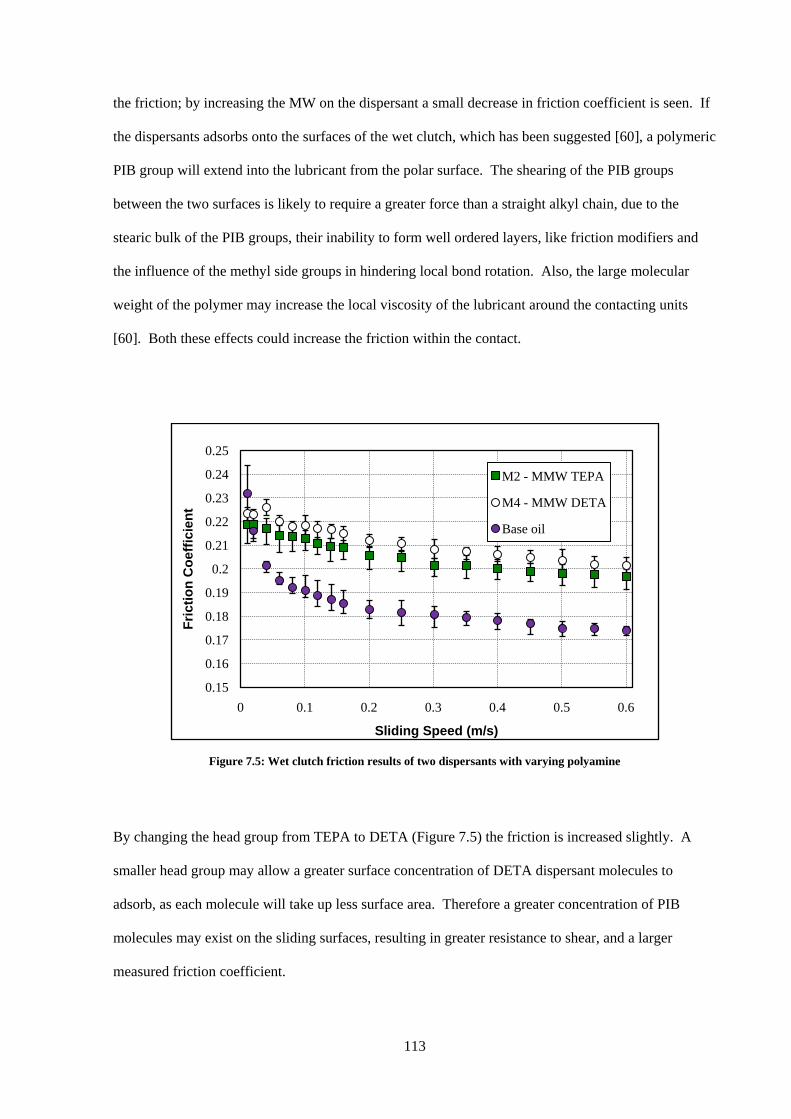
113
the friction; by increasing the MW on the dispersant a small decrease in friction coefficient is seen. If
the dispersants adsorbs onto the surfaces of the wet clutch, which has been suggested [60], a polymeric
PIB group will extend into the lubricant from the polar surface. The shearing of the PIB groups
between the two surfaces is likely to require a greater force than a straight alkyl chain, due to the
stearic bulk of the PIB groups, their inability to form well ordered layers, like friction modifiers and
the influence of the methyl side groups in hindering local bond rotation. Also, the large molecular
weight of the polymer may increase the local viscosity of the lubricant around the contacting units
[60]. Both these effects could increase the friction within the contact.
Figure 7.5: Wet clutch friction results of two dispersants with varying polyamine
By changing the head group from TEPA to DETA (Figure 7.5) the friction is increased slightly. A
smaller head group may allow a greater surface concentration of DETA dispersant molecules to
adsorb, as each molecule will take up less surface area. Therefore a greater concentration of PIB
molecules may exist on the sliding surfaces, resulting in greater resistance to shear, and a larger
measured friction coefficient.
0.15
0.16
0.17
0.18
0.19
0.2
0.21
0.22
0.23
0.24
0.25
0 0.1 0.2 0.3 0.4 0.5 0.6
Fri
cti
on
Co
eff
icie
nt
Sliding Speed (m/s)
M2 - MMW TEPA
M4 - MMW DETA
Base oil

114
7.3.1.3 Detergents
The µ-v characteristics of three overbased detergents have been studied using the friction screener at
100 °C. The results are shown in Figure 7.6.
Figure 7.6: Wet clutch friction results of three industrial overbased detergents
The μ-v data indicates that the branched chain overbased detergents raise the friction of the wet clutch
relative to that of the base oil only system, whilst a linear chain detergent reduces the friction
coefficient over the speed range. The linear chain detergent exhibits a similar mechanism to the
friction modifier, reducing the friction at low sliding speeds and producing a positive gradient μ-v
curve. The linear chain detergent may be forming a closely packed array of molecules similar to the
action of a friction modifier, preventing friction material-steel contact and providing a low shear
interface. Det L and M, which have a branched alkyl chain, produce higher friction values compared
to the base oil only lubricant at sliding speeds above 0.05 m/s. The branched chain detergent is
expected to adsorb onto the surfaces, leaving a high molecular weight alkyl chain pointing into the
lubricant. During the sliding of the surfaces, the branched alkyl chains on both surfaces will be
sheared. The shear stress of these chains is likely to be higher due to their large size, increased stearic
0
0.05
0.1
0.15
0.2
0.25
0 0.1 0.2 0.3 0.4 0.5 0.6
Fri
cti
on
Co
eff
icie
nt
Sliding Speed (m/s)
Base Oil
Det K - Linear Chain Ca Sulphonate
Det L - Branched Chain Ca Sulphonate
Det M - Branched Chain Mg Sulphonate

115
repulsion between approaching shearing molecules and hindered rotation: therefore the friction will be
higher.
To investigate the affect of overbasing on the friction characteristics, two detergents which only differ
in the extent of overbasing have been studied. Det L is overbased and therefore has a higher
concentration of CaCO3. Det N is the same detergent but has not been overbased and is therefore
neutral and contains a lower concentration of CaCO3. Det L will therefore be more likely to form a
thick boundary film on the steel surface during rubbing. The friction versus sliding speed result
(Figure 7.7) shows that these two detergents give very similar results. Similar findings are also
discussed by Kitanaka [60], suggesting that the CaCO3 film does not have a significant effect on the
friction characteristics.
Figure 7.7: Friction coefficient versus sliding speed for a detergent, neutral (Det N) and overbased (Det L).
7.3.2 Boundary film formation of the detergents
Overbased detergent additives are capable of forming thick chemical films of metal carbonate on the
surface of a steel/steel contact during rubbing. This film forming ability has been studied in the
steel/friction material contact using the MTM SLIM at 100 °C. A sliding/rolling test was employed
between a steel ball and a friction material disk. The thickness of the films formed by the detergents
0.15
0.16
0.17
0.18
0.19
0.2
0.21
0.22
0.23
0.24
0.25
0 0.1 0.2 0.3 0.4 0.5 0.6
Fri
cti
on
Co
eff
icie
nt
Sliding Speed (m/s)
Base oil
Det L - Overbased Calcium Sulphonate
Det N - Neutral Ca Sulphonate

116
on the steel ball during the test can be quantified by using a calibration file based on the intensity of
the primary colours (Figure 7.8). The raw interference images are shown below the film thickness
results (Figure 7.9). The initial, blue image signifies no film is present on the ball. As the interference
images become orange, this indicates a boundary film is being formed on the surface.
Figure 7.8: Film thickness of boundary film formed by three detergents measured during a MTM SLIM
sliding/rolling test
Figure 7.9: Interference images (~ 300 μm diameter) showing the build up of a boundary film on the surface of a steel
ball during rubbing
0
10
20
30
40
50
60
Initial After Stribeck
5 mins 15 mins 30 mins 60 mins 120 mins
Film
Th
ick
ne
ss
(n
m)
Det M
Det L
Det K
Det M
Det L
Det K
After Stribeck
5 mins 120 mins Initial 60 mins 30 mins 15 mins

117
The film formed on the steel surface probably consists of a metal carbonate, which is present in these
overbased detergents. The branched Mg Sulphonate forms the thickest chemical film, reaching 50 nm
in the final reading after 120 minutes of rubbing. The branched Ca Sulphonate detergent forms a
marginally thicker film than its linear chain counterpart. The base oil was also tested and did not form
a boundary film.
The TBN of a detergent determines its boundary film forming ability. A detergent with a higher TBN
(Det M in this case) will have a greater concentration of the metal carbonate, which will migrate to the
surface and form a film. So the greater the TBN and the concentration of metal carbonate within the
detergent, the thicker the boundary film formed.
Below is the friction coefficient versus mean speed for all solutions at the end of the two hour test,
with a slide/roll ratio of 50 %.
Figure 7.10: Friction versus entrainment speed after 120 minutes of sliding in the MTM SLIM test
The friction relationship between the three detergents is similar to that seen in the μ-v results in Figure
7.6. Det K which has a linear alkyl chain, decreases the friction compared to the base oil over the
entire speed range. Det L and M which both have branched alkyl chains increase the friction over the
0
0.05
0.1
0.15
0.2
0.25
0.001 0.01 0.1 1 10
Fri
cti
on
Co
eff
icie
nt
Mean Entrainment Speed (m/s)
Det K
Det L
Det M
Nexbase 3030

118
speed range. This may indicate that although the thick measured film is thought to predominantly
consist of a metal carbonate, the alkyl chain of the detergent still controls the friction of the contact.
The organic part of the detergent structure (which includes the sulphonate and the long alkyl chain)
may adsorb onto the surface of this metal carbonate film and onto the surface of the friction material,
and will primarily dictate the friction/speed relationship.
It is interesting to note that relatively thick metal carbonate films are formed on the steel ball even
though the counter-surface is friction material. The latter means that the contact pressure is much
lower than that present in previous studies with steel/steel contacts. Even so the metal carbonate still
forms a thick, adherent film on the steel.
7.3.3 Industrial Additive Blends
After studying the friction effects of individual additives in the Section 7.3.1, the effect of mixtures of
additives was studied. For simplicity, only one additive from each class has been used, these are
detailed in Table 7.5. The friction result for each blend is presented, along with the result for the
individual additives used in the blend for comparison (Figure 7.11 to 7.14).

119
Figure 7.11 Figure 7.12
Figure 7.13 Figure 7.14
Figure 7.11 to 7.14: Comparison of four additive blends. Each graph shows the result for the blend (1 - 4), along with
the result of the individual additives used in the blend for comparison.
When a dispersant or a detergent is added to a friction modifier, as is the case in Figures 7.11 and 7.12,
the positive gradient friction curves are translated to higher friction values. In this case the detergent
increases the friction more than the dispersant. In Blend 4, where all three additive types are present
(Figure 7.14), the positive gradient friction curve is still present. Blend 3, a combination of a
detergent and a dispersant, gives a friction result between the two respective monoblend results
(Figure 7.13), producing a negative gradient µ-v curve. In a real system Blend 1, 2 & 4, would be
0
0.05
0.1
0.15
0.2
0.25
0 0.2 0.4 0.6
Fri
cti
on
Co
eff
icie
nt
Sliding Speed (m/s)
Blend 1 (FM & Disp)
FM
Disp
0
0.05
0.1
0.15
0.2
0.25
0 0.2 0.4 0.6
Blend 2 (FM & Det)
FM
Det
0
0.05
0.1
0.15
0.2
0.25
0 0.2 0.4 0.6
Blend 3 (Disp & Det)
Disp
Det
0
0.05
0.1
0.15
0.2
0.25
0 0.2 0.4 0.6
Blend 4 (FM & Disp & Det)
FM
Disp
Det

120
expected to exhibit good performance in a wet clutch, whereas, Blend 3 might exhibit stick-slip
effects.
From the results shown in Figure 7.11 to 7.14, it seems that the friction modifier predominantly
controls the shape of the friction result, always ensuring a desirable positive gradient μ-v curve. The
addition of a detergent or dispersant increases the overall friction, but the positive gradient
characteristic is maintained. A branched chain Ca Sulphonate detergent has a greater effect on
increasing the friction than a PIB TEPA dispersant, at the concentrations studied. These results
exhibit the reason why friction modifiers, dispersants and detergents are blended together. At the
correct mixing ratios, the positive gradient µ-v curve can be produced with overall high friction
coefficient, ensuring a combination of no stick-slip effects with large torque capacities in wet clutches.
The mechanisms of the friction with mixtures of FMs and larger molecules such as detergents and
dispersants are studied further in Chapter 8.
7.3.4 Temperature Effects of Industrial Additives
During the operation of the transmission, the temperature within the wet clutch can vary over a large
range, due to environmental and driving conditions. The friction characteristics of a base oil, a ATF
and the friction altering additives will be studied at three temperatures: 50, 100 and 150 °C.
The friction results from the base oil provide a base line, from which the performance of the additives
can be compared. The results may highlight the effect of the changing viscosity of the lubricant with
temperature. The composition of the ATF is unknown, although it will almost certainly contain a
mixture of friction modifiers, dispersants and detergents, along with other additives, such as
antioxidants and viscosity modifiers, which do not significantly affect the friction under these
conditions.
At each temperature studied, the base oil produced a negative gradient μ-v curve (Figure 7.15). The
high static friction for the base oil is affected by a change in temperature. The changing temperature
will have a large effect on the viscosity of the lubricant, and it may also alter the properties of the

121
friction material. Under these boundary lubrication conditions, the lubricant viscosity is not expected
to alter the friction to a large extent.
Figure 7.15: The friction of a wet clutch contact lubricated with a base oil at 50, 100 and 150 °C
At all three temperatures studied, the ATF produces a positive gradient μ-v curve (Figure 7.16). This
is in contrast to the result in a similar study by Yoshizawa [25], where the μ-v curve takes on a
negative gradient at lower temperatures. The difference can be attributed to their almost certainly
being differences in the formulation of the fluid used in this study and that employed by [25]. The
ATF used to obtain the results in Figure 7.16 probably contains a friction modifier which is still active
at low temperatures, whereas in the corresponding study [25], the desirable friction characteristics are
lost at lower temperatures, and may indicate that the friction modifier(s) used in that study becomes
inactive at low temperatures.
0
0.05
0.1
0.15
0.2
0.25
0 0.1 0.2 0.3 0.4 0.5 0.6
Fri
cti
on
Co
eff
icie
nt
Sliding Speed (m/s)
50C
100C
150C
Base oil

122
Figure 7.16: The friction of a wet clutch contact lubricated with a ATF at 50, 100 and 150 °C
As the temperature is raised, the friction coefficient is lowered over the entire speed range. The
reduction in friction could be attributed to the changing shear strength of the boundary film at different
temperatures [105], or to the composition of the boundary film, which may depend on the temperature,
due to the competitive adsorption of many additives.
7.3.4.1 Friction Modifiers
The friction characteristics of four friction modifiers were studied at varying temperatures, and are
shown in Figures 7.17 to 7.20. FM W and FM X were not completely soluble at 50 °C, and were
therefore not tested at this temperature.
0
0.05
0.1
0.15
0.2
0.25
0 0.1 0.2 0.3 0.4 0.5 0.6
Fri
cti
on
Co
eff
icie
nt
Sliding Speed (m/s)
50C
100C
150C
ATF

123
Figure 7.17 Figure 7.18
Figure 7.19 Figure 7.20
Figure 7.17 to 7.20: Comparison of the friction of four friction modifiers with varying temperature
Each friction modifier shows a positive gradient μ-v curve at all the temperatures studied. As the
temperature is increased, the friction is reduced for all the lubricants tested. This is unlikely to be a
viscosity effect since the test is operating in the boundary and mixed regime, but may be attributed to
the changing shear strength of the absorbed species at different temperatures, or simply that a more
“effective” friction reducing layer is formed at higher temperatures.
0
0.05
0.1
0.15
0.2
0.25
0 0.2 0.4 0.6
Fri
cti
on
Co
eff
icie
nt
Sliding Speed (m/s)
100C
150C
FM W
0
0.05
0.1
0.15
0.2
0.25
0 0.2 0.4 0.6
100C
150C
FM X
0
0.05
0.1
0.15
0.2
0.25
0 0.2 0.4 0.6
50C
100C
150C
FM Y
0
0.05
0.1
0.15
0.2
0.25
0 0.2 0.4 0.6
50C
100C
150C
FM Z

124
7.3.4.2 Dispersants
The friction characteristics of four dispersants were studied at varying temperatures, and are shown in
Figures 7.21 to 7.24.
Figure 7.21 Figure 7.22
Figure 7.23 Figure 7.24
Figure 7.21 to 7.24: Comparison of friction versus speed results for four dispersants with varying temperature
The results for the dispersants indicate a more complex effect is occurring. As the temperature is
increased from 100 to 150 °C the static friction is reduced. The reduction of the static friction is
greater for dispersants with higher molecular weight PIB groups. At 50°C all the dispersants produce
a negative gradient μ-v curve, with a static friction value, similar to the base oil-only condition. At
0
0.05
0.1
0.15
0.2
0.25
0 0.2 0.4 0.6
Fri
cti
on
Co
eff
icie
nt
Sliding Speed (m/s)
50C
100C
150C
Dispersant M1
0
0.05
0.1
0.15
0.2
0.25
0 0.2 0.4 0.6
50C
100C
150C
Dispersant M2
0
0.05
0.1
0.15
0.2
0.25
0 0.2 0.4 0.6
50C
100C
150C
Dispersant M3
0
0.05
0.1
0.15
0.2
0.25
0 0.2 0.4 0.6
50C
100C
150C
Dispersant M4

125
150°C, the low speed friction of all the dispersants decrease, producing a small positive gradient μ-v
curve. This effect is more pronounced for the M3 (higher MW PIB) dispersant.
7.3.4.3 Detergents
The friction characteristics of three detergents were studied at varying temperatures, and are shown in
Figures 7.25 to 7.27.
Figure 7.25
Figure 7.26 Figure 7.27
Figure 7.25 to 7.27: Comparison of friction versus speed results for three detergents with varying temperature
Detergent K, which has a linear alkyl chain, produced a positive gradient μ-v curve at each of the three
temperatures studied. As the temperature is increased from 50 to 100 °C the friction coefficient
0
0.05
0.1
0.15
0.2
0.25
0 0.2 0.4 0.6
Fri
cti
on
Co
eff
icie
nt
Sliding Speed (m/s)
50C
100C
150C
Detergent K
0
0.05
0.1
0.15
0.2
0.25
0 0.2 0.4 0.6
Fri
cti
on
Co
eff
icie
nt
Sliding Speed (m/s)
50C
100C
150C
Detergent L
0
0.05
0.1
0.15
0.2
0.25
0 0.2 0.4 0.6
Fri
cti
on
Co
eff
icie
nt
Sliding Speed (m/s)
50C
100C
150C
Detergent M
126
decreases, similar to the effect seem with the friction modifiers, although the decrease in friction of the
detergent is greater. There is very little change in friction for detergent K between 100 and 150 °C.
Detergent L, a calcium sulphonate with a branched alkyl chain, gave higher friction coefficient values
compared to the linear alkyl chain, detergent K, at each of the three temperatures. At 50°C, detergent
L produced a negative gradient μ-v curve over the entire speed range. The value of friction coefficient
at the lowest speed is similar to that of the base oil, but at higher speeds, the detergent solution gave
greater friction compared to the base oil. As the temperature is raised, the low speed friction values
decrease, producing a positive gradient μ-v curve over the lower speed range of the test. At 150°C the
friction varies very little at speeds of over 0.1 m/s.
Detergent M is a magnesium sulphonate detergent with a branched alkyl chain. The largest values of
friction are found at the medium temperature of 100°C, over the entire speed range, whereas for
detergent L and K, the highest friction was realised at the lowest temperature. At 150°C, detergent M
produces a positive gradient μ-v curve over the entire speed range.
7.4 Discussion
Three classes of additives have been studied within a wet clutch contact; friction modifiers,
dispersants and detergents. Four examples of each class of additive were evaluated using the friction
screener. The film forming ability of three overbased detergents was studied in a wet clutch contact
using a MTM SLIM. The friction modifiers and the detergents are similar or identical to those
currently used in ATF formulations. The dispersants used in this sections are similar to those used in
ATF formulations, but have been synthesised to a high purity, ensuring a narrow molecular weight
distribution.
The friction modifiers were found to decrease the low speed friction of the wet clutch and to produce a
positive gradient friction versus sliding speed curve. The gradient of the friction slope produced by
each friction modifier is very similar. The friction slope is translated up or down depending on the
structure of the friction modifier, and will also probably be dependent on the concentration. There are
many structural differences between the FM molecules that can affect the friction, one maybe the

127
longer the alkyl chain, the greater the reduction of the friction. This is due to the longer alkyl chain
allowing a greater number of inter-molecular bonding in the boundary films, and so forming a more
strongly bound and a more effective friction reducing boundary layer of aligned molecules [104]. This
effect is studied further in Chapter 8.
The PIBSA PAM dispersants increased the friction compared to the base oil, and produced a negative
gradient friction versus sliding speed slope. The molecular weight of the PIB alkyl chain affects the
extent of the friction increase, the lower the MW of the PIB chain, the higher the friction. By reducing
the size of the amine head group by one ethylamine unit the friction is increased, which may be
attributed to the smaller size head group occupying less adsorption sites on the surfaces, and allowing
a larger concentration of the PIBSA PAM molecules to be present in the surface film. Therefore a
larger concentration of the PIB tail groups will be present on the surface, producing larger sliding
friction values through greater stearic repulsion. The PIB groups will produce a higher friction during
sliding due to the higher resistance to shearing of large, bulky groups, and it has also been suggested
that they increases the local viscosity around the contact units, accounting for the rise in friction [60].
The detergents studied indicate that the friction characteristics were more dependent on the structure
of their alkyl chain, than on the extent or type of overbasing. Linear alkyl chain detergents gave
similar friction characteristics to a friction modifier, reducing the friction compared to the base oil and
producing a positive gradient friction versus sliding speed curve, whilst detergents with branched alkyl
chains increased the friction compared to the base oil. The ability of overbased detergents to form a
boundary film in a wet clutch has been studied using a MTM SLIM. A boundary film was formed on
the steel surface, during a rubbing test against a friction material at relatively low contact pressures ~ 6
MPa for both overbased calcium and magnesium detergents. However this only has a limited effect
on the friction within a wet clutch in these tests. Both a overbased detergent and a neutral detergent
with the same sulphonate structure showed very similar friction properties, indicating that the alkyl
chain has the greatest effect on the friction.
128
Mixtures of additives were studied using the friction screener. When dispersants and detergents were
added in conjunction with a friction modifier, a positive gradient µ-v curve can be produced, with high
overall friction coefficient values. The friction modifiers are believed to form a monolayer of
molecules with a large number of van der Waal’s lateral side-chain interactions between the closely
packed arrays [104]. When a dispersant or a detergent is added to the friction modifier boundary film,
it may disrupt the closely packed layer, forming irregularities and increasing the shear strength of the
sliding layers. This is studied and discussed further in Chapter 8.
7.5 Summary
The friction characteristics of wet clutches are affected by surface active additives, namely, friction
modifiers, dispersants and detergents. In this chapter these additives have been studied using the
friction screener, to provide an insight into the effects of the different additives and their
combinations. The changing values of friction given by the different additives have been attributed to
the difference in the alkyl chain structure. The friction modifiers may form a boundary film with a
low shear strength, and thus reduce the friction with a wet clutch. Dispersants and detergents may also
form a boundary film, but this will consist of large branched alkyl chains, which will have a larger
barrier to shearing, leading to a rise in the friction. When the additives are combined, a hybrid
boundary film may form, exhibiting a shear strength that is a combination of all the molecules present
in the boundary film.
The friction characteristics of the additives are also dependent on the temperature.
The boundary film forming ability of detergents in a wet clutch has been studied, and although the
detergents form a boundary film of up to 50 nm thick in the wet clutch contact on the steel surface,
further testing suggests that this has minimal effect on the friction. The alkyl group structure
dominates the friction effects of the detergents.

129
8 .
Chapter 8
Model Additive Effects in Wet Clutches
In this chapter, model friction modifiers including carboxylic acids and primary amines of varying
molecular weight and degree of saturation, are used to study the effect of FM structural changes on
wet clutch friction. The friction mechanisms are discussed with reference to the shear strength of the
boundary films formed on the surfaces. The shear strength of the boundary films are modified through
the use of different model FMs, mixtures of FMs and doping the FM film with large dispersant
molecules.
8.1 Introduction
In a wet clutch it is desirable to have a certain friction characteristic, whereby friction increases with
sliding speed, since this eliminates stick-slip effects. This can be achieved by the addition of FMs to
the ATF formulations which reduces friction at very low speeds more than at higher sliding speeds.
However, the FMs also decrease the overall friction of wet clutches, reducing their torque capacity,
and therefore their efficiency. ATF formulations must therefore give the positive gradient µ-v curve,
while maintaining a high overall friction value. This can be achieved by using “less effective” FMs,
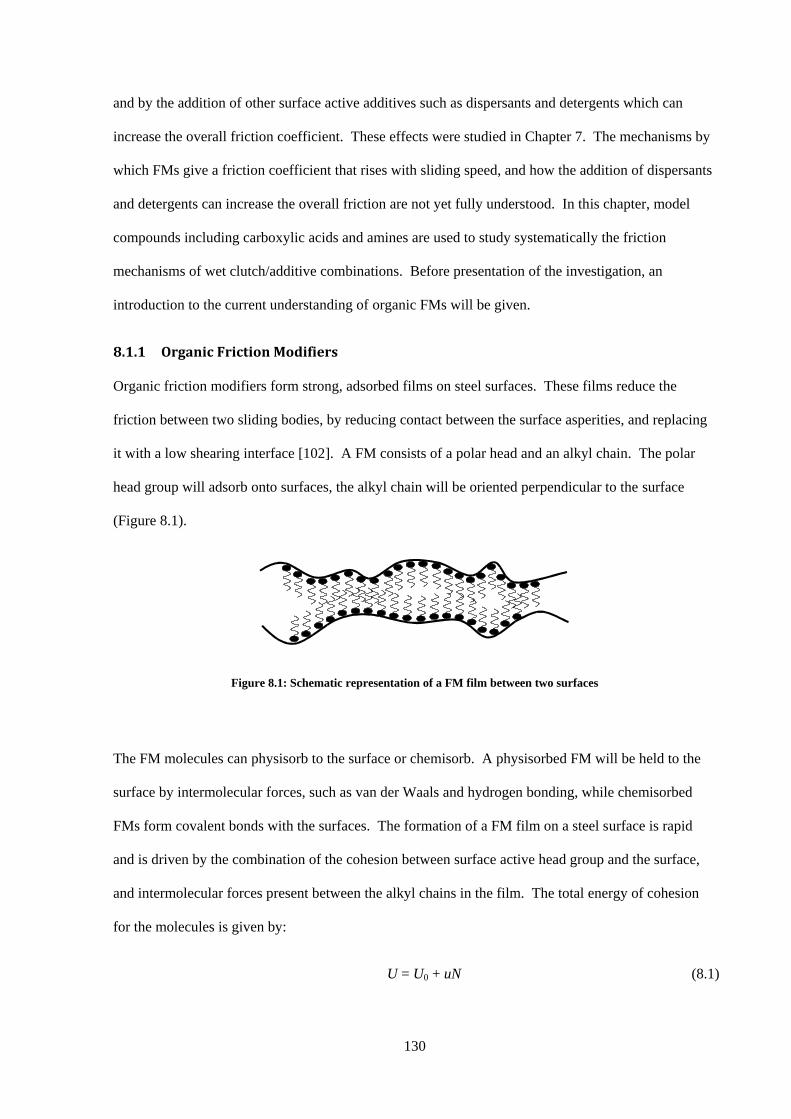
130
and by the addition of other surface active additives such as dispersants and detergents which can
increase the overall friction coefficient. These effects were studied in Chapter 7. The mechanisms by
which FMs give a friction coefficient that rises with sliding speed, and how the addition of dispersants
and detergents can increase the overall friction are not yet fully understood. In this chapter, model
compounds including carboxylic acids and amines are used to study systematically the friction
mechanisms of wet clutch/additive combinations. Before presentation of the investigation, an
introduction to the current understanding of organic FMs will be given.
8.1.1 Organic Friction Modifiers
Organic friction modifiers form strong, adsorbed films on steel surfaces. These films reduce the
friction between two sliding bodies, by reducing contact between the surface asperities, and replacing
it with a low shearing interface [102]. A FM consists of a polar head and an alkyl chain. The polar
head group will adsorb onto surfaces, the alkyl chain will be oriented perpendicular to the surface
(Figure 8.1).
Figure 8.1: Schematic representation of a FM film between two surfaces
The FM molecules can physisorb to the surface or chemisorb. A physisorbed FM will be held to the
surface by intermolecular forces, such as van der Waals and hydrogen bonding, while chemisorbed
FMs form covalent bonds with the surfaces. The formation of a FM film on a steel surface is rapid
and is driven by the combination of the cohesion between surface active head group and the surface,
and intermolecular forces present between the alkyl chains in the film. The total energy of cohesion
for the molecules is given by:
U = U0 + uN (8.1)

131
where U0 is the energy of adhesion of the polar head group to the surface, u is the energy of cohesion
of a methylene group and N is the total number of carbon atoms [106]. The adsorption forces between
the head group and the metal surface can be as high as 13 Kcal/mol [62]. The cohesive forces that
exist between the alkyl chains are composed of van der Waals forces between neighbouring methylene
groups, and can be up to 15 Kcal/mol for dimers [62]. The longer the alkyl chain, the greater the
number of interactions between neighbouring methylene groups and thus the stronger the total
cohesive force between two neighbouring molecules in the film [107]. The FM molecules therefore
form closely packed films on steel surfaces, with strong intermolecular bonds. Once a monolayer film
is formed by the FM, further layers may form on top, with alternating arrangement, so that the
terminal methyl groups are always interacting, and the polar heads are always interacting between
neighbouring layers. During the sliding of two surfaces with adsorbed FM films, shearing will occur
between the terminal methyl groups of the molecules, which have a low barrier to shearing,
accounting for the reduction of friction by this additive [36, 106].
The durability of the boundary film is dependent on the strength of adsorption of the surfactant
molecules and the number of layers in the multilayer [102]. During sliding, part of the boundary film
can be removed, by the destruction of the top layers. If the surfaces are in contact with a lubricant, the
boundary layers can be replenished by the free surfactant in the lubricant. Thus the boundary films are
sacrificial during sliding, and can quickly replenish, to ensure low friction during operation [36].
The friction of the boundary contact is a combination of the shearing of the FM boundary film and the
shearing of asperity contacts. Asperity junctions may still penetrate the FM film, and so asperity
junctions are still sheared and contribute to the overall friction. This can be represented by the
idealised equation [37]:
F = A[ ατm + (1- α) τf ] (8.2)
where
F = friction force
A = real area of contact,

132
α = fraction of surface in asperity contact
τm = shear strength of the junctions of asperity contact
τf = shear strength of the boundary lubricant film
The effectiveness of a FM film is measured by its ability to reduce friction and wear. This is achieved
by forming boundary films on the surfaces that reduce asperity contacts (reducing α) and have a low
shear strength (low τf). The friction reduction is dependent on the size and structure of the OFM.
Generally carboxylic acids, amines, phosphates and amides with alkyl chains between 8 carbons and
18 carbons are used as FMs in ATF formulations.
In a wet clutch, the FMs will form a boundary film on the steel surface and possibly also on the
friction material surface, although this has yet to be proved. The friction material used in most
passenger cars consists predominantly of cellulose fibres and phenolic resin [17], which will introduce
a large density of hydroxyl groups to the surface of the material, allowing hydrogen bonding between
some FMs and the friction material. The real area of contact in a wet clutch is only a small percentage
(approximately 5 %) of the nominal contact area and consists of many small, independent contact units
(Chapter 4). Thus for successful performance of the additives they must operate at these contact units,
which experience quite high pressure, and also frictional heating at high speeds (Chapter 5).
The friction increasing with speed characteristic imparted by this additive in a wet clutch is also not
fully understood, although it could probably be attributed to the shearing characteristic of the
boundary film, which may vary with sliding speed. This will be discussed further in Chapter 10.
8.1.2 Boundary Film Properties
The most effective boundary films are formed by FMs which have a polar head group and a long alkyl
chain with no unsaturation. These form strong resistant boundary films that exhibit large reductions of
friction [108]. The standard free energy of adsorption of a FM is the combination of the interaction
between the head group and the surface, and the interactions between the molecules alkyl chains in
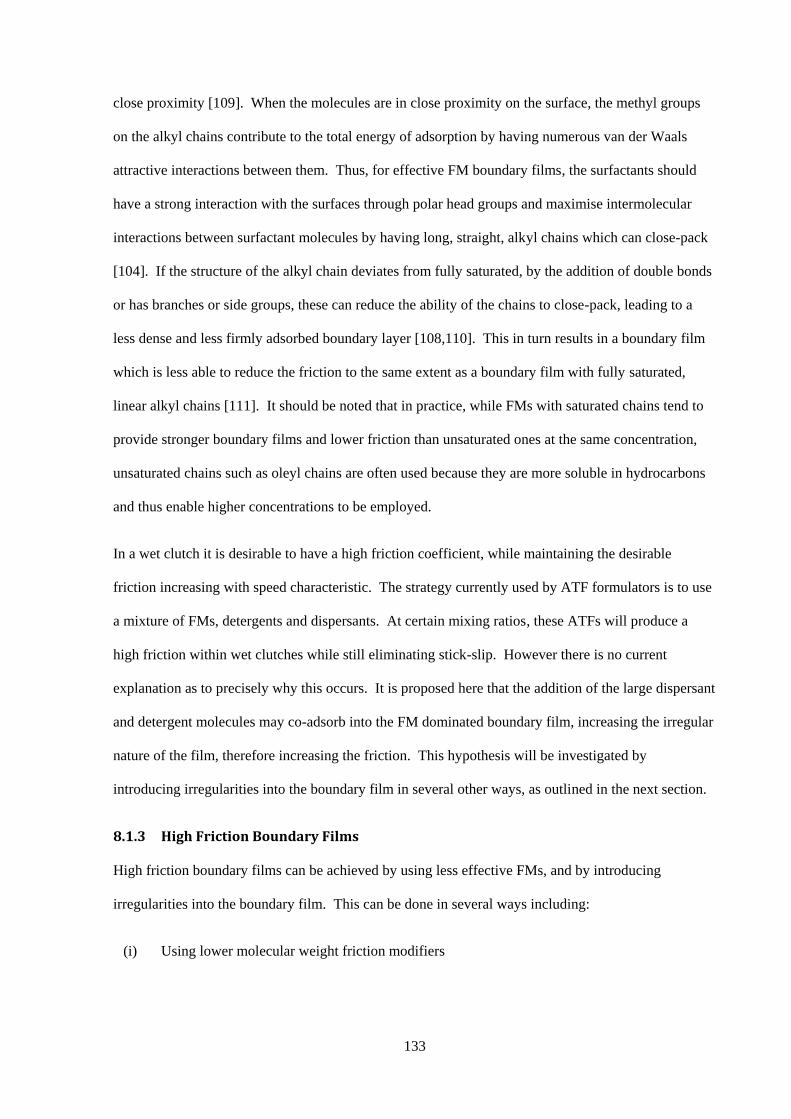
133
close proximity [109]. When the molecules are in close proximity on the surface, the methyl groups
on the alkyl chains contribute to the total energy of adsorption by having numerous van der Waals
attractive interactions between them. Thus, for effective FM boundary films, the surfactants should
have a strong interaction with the surfaces through polar head groups and maximise intermolecular
interactions between surfactant molecules by having long, straight, alkyl chains which can close-pack
[104]. If the structure of the alkyl chain deviates from fully saturated, by the addition of double bonds
or has branches or side groups, these can reduce the ability of the chains to close-pack, leading to a
less dense and less firmly adsorbed boundary layer [108,110]. This in turn results in a boundary film
which is less able to reduce the friction to the same extent as a boundary film with fully saturated,
linear alkyl chains [111]. It should be noted that in practice, while FMs with saturated chains tend to
provide stronger boundary films and lower friction than unsaturated ones at the same concentration,
unsaturated chains such as oleyl chains are often used because they are more soluble in hydrocarbons
and thus enable higher concentrations to be employed.
In a wet clutch it is desirable to have a high friction coefficient, while maintaining the desirable
friction increasing with speed characteristic. The strategy currently used by ATF formulators is to use
a mixture of FMs, detergents and dispersants. At certain mixing ratios, these ATFs will produce a
high friction within wet clutches while still eliminating stick-slip. However there is no current
explanation as to precisely why this occurs. It is proposed here that the addition of the large dispersant
and detergent molecules may co-adsorb into the FM dominated boundary film, increasing the irregular
nature of the film, therefore increasing the friction. This hypothesis will be investigated by
introducing irregularities into the boundary film in several other ways, as outlined in the next section.
8.1.3 High Friction Boundary Films
High friction boundary films can be achieved by using less effective FMs, and by introducing
irregularities into the boundary film. This can be done in several ways including:
(i) Using lower molecular weight friction modifiers

134
(ii) Using FM molecules with alkyl chains that are not fully saturated (i.e. the addition of C=C
double bonds)
(iii) Adding a mixture of FM molecules with different chain lengths
(iv) Mixing FM additives with larger additives such as dispersants and detergents
Method (i) and (ii) use less effective FMs. Friction modifiers with smaller alkyl chains form less
effective boundary films, with a greater number of low energy modes available for excitation [112].
Therefore these films have a high shear strength. The shear strength can also be increased by using
alkyl chains that are not fully saturated. The resulting cis-configuration can reduce the packing
density of the molecules in the boundary film, reducing intermolecular interactions. Less dense films
will lead to greater interpenetration of the alkyl chains during shearing, leading to higher shear
strength [36].
By using a mixture of FM molecules with different sized alkyl chains a mixed size boundary film may
be formed [113]. This method has been used to modify the friction and wetting properties of
monolayers [114]. In this study, mixed size monolayers are used to promote interpenetration between
the layers during sliding, resulting in greater friction. A idealised representation of two mixed size FM
monolayer on opposing, sliding surfaces is shown in Figure 8.2. The large discrepancy of film
thickness across the layer may promote interpenetration of the layer and increase the measured
friction.
Figure 8.2: Idealised representation of two mixed size FM monolayer on opposing surfaces

135
The strategy currently used by ATF formulators is to use a mixture of FMs, detergents and dispersants,
which presumably all adsorb to the surface to some extent forming a complex boundary film. It is
proposed that the FM type molecules are the dominant species in the film due to their ability to form
strongly adsorbed, ordered layers. The addition of the dispersants and detergents, may result in these
additives co-adsorbing onto the surfaces, disrupting the low shear strength film formed by the FM, by
the presence of the large branched or PIB alkyl chains, with a large barrier to sliding.
All four methods of producing a high friction boundary film will be studied, as outlined below.
8.2 Method
The impact of FMs on wet clutch friction is studied at 100 °C in pure sliding conditions with speeds of
0.01 to 2 m/s, and relatively low mean contact pressures (3 MPa), using a modified MTM (PCS
Instruments) as outlined in Chapter 6. The contact employed is a pin-on-disk type, between a
stationary steel ball (AISI 52100) and a rotating friction material disk (SD-1777) manufactured by
Borg Warner. The µ-v curves presented are recorded after an initial break-in procedure of 0.1 m/s for
10 minutes at 3 N load (~3 MPa) at 100 °C.
Simple linear carboxylic acids were used as model organic friction modifiers, including hexanoic,
dodecanoic and octadecanoic acid, to study the effect of chain length. These were all blended at a
concentration of 1 % w/w in the group III base oil, and denoted C6, C12 and C18 acid, respectively.
At these high concentrations, the discrepancy of the molar concentration should not affect the friction
measured. At concentrations above 0.2 % w/w Jahanmir [104] found that further increasing the
concentration of the carboxylic acids had no effect on the measured friction. The corresponding
amines with varying chain length, hexylamine, dodecylamine and octadecylamine were also studied at
1 % w/w in a group III base oil, these are denoted C6, C12 and C18 amine respectively in the results.
To study the effect of some structural changes on the friction, four carboxylic acids with 18 carbons
were used (Figure 8.3). Stearic acid has a fully saturated alkyl chain. Two mono-unsaturates were
used; oleic (9 cis-octadecenoic acid) and elaidic (9 trans-octadecenoic acid) acid, representing the cis

136
and the trans isomer respectively. 12-hydroxy stearic acid was used to study the effect of adding an
additional side group to the alkyl chain.
Figure 8.3: Molecular structures of four carboxylic acids used to study the effect of some structural changes of the
friction characteristics in a wet clutch
Four solutions of the acids were blended at a concentration of 1 % w/w in a group III base oil.
To study the effect of mixed size boundary films five solutions with varying concentrations of
hexanoic and dodecanoic acid were blended at a total of 1 % w/w in a solution of a group III base oil
(Table 8.1). These mixtures were then studied using the friction screener.
Table 8.1: The mixing ratio’s used to study the effect on mixed size monolayer films
Mixture Label
(Molar ratio C6:C12)
% Molar of C12
acid (C12/C6+C12)
1 (C6 Acid) 0
2 (10:1) 10
3 (5:1) 16
4 (1:1) 50
5 (1:5) 83
6 (1:10) 90
7 (C12 Acid) 100
Stearic acid Elaidic acid Oleic acid 12-hydroxyl stearic acid

137
A mixture of dodecanoic acid (1 % w/w) and a PIBSA PAM dispersant (3 % w/w) was studied, to
observe the effect of adding a large dispersant molecule to the FM boundary film. The structure of the
dispersant used is shown in Figure 7.1, and has a TEPA head group and two PIB chains with a
molecular weight of 950.
All model friction modifiers and the dispersant were used as received, without further purification.
The FMs were all blended with gentle heating and stirring to aid dissolving. Any solution that was
insoluble at room temperature was heated before addition to the friction rig.
8.3 Results and Discussion
8.3.1 Varying alkyl chain length
The effect of the alkyl chain length on the friction within a wet clutch was studied, using three
carboxylic acids and three amines of varying chain length. The results given by the friction screener
are shown in Figure 8.4 for the carboxylic acids and Figure 8.5 for the amines.
Figure 8.4: Friction characteristics of three carboxylic acid model friction modifiers with varying alkyl chain length
0
0.05
0.1
0.15
0.2
0.25
0 0.5 1 1.5 2
Fri
cti
on
Co
eff
icie
nt
Sliding Speed (m/s)
Base Oil
C6 acid
C12 acid
C18 acid

138
Figure 8.5: Friction characteristics of three primary amine model friction modifiers with varying alkyl chain length
The carboxylic acids and the primary amines show the same trends. As the molecular weight of the
alkyl chain is increased, this leads to a reduction in friction, while simultaneously maintaining the
positive gradient friction versus sliding speed characteristic. The higher molecular weight model FMs,
reduce the friction to a greater extent, presumably by forming more effective boundary films with
lower shear strength. These thicker films will also reduce asperity contact (reduce α). Lower
molecular weight FMs have a greater number of low energy modes available for excitation [112],
therefore these films have a higher shear strength, accounting for the trend in the friction behaviour.
An interesting observation is that the hexanoic acid and the hexylamine are both effective at reducing
the friction in the wet clutch contact (p ~ 3 MPa), and show the characteristic property of friction
increasing with speed result similar to the C12 and C18 model FMs. In a metal-on-metal contact
where the pressures are higher (p ~ 1 GPa), this short chain acid is expected to adsorb onto the steel
surfaces [115] but is usually considered ineffective at supporting the load and reducing the friction.
The gradients of the friction slopes shown in Figure 8.4 reveals a small difference between the friction
characteristics of the solid films formed by C12 and C18 acid compared to the hexanoic acid film.
0
0.05
0.1
0.15
0.2
0.25
0 0.5 1 1.5 2
Fri
cti
on
Co
eff
icie
nt
Sliding Speed (m/s)
Base oil
C6 amine
C12 amine
C18 amine

139
These results are plotted in a log/log curve in Figure 8.6, to allow comparison of the gradients, which
will be discussed further in Chapter 10.
Figure 8.6: Graph of log friction coefficient versus log sliding speed for three carboxylic acids
The equations of the slopes produced by these acids between 0.01 and 0.6 m/s are shown in Table 8.2.
Both C12 and C18 acid have the same gradient slope, whereas C6 acid has a slightly lower gradient
slope. All three gradients are much lower than the 0.4 to 0.6 range expected for a hydrodynamic film.
Table 8.2: Friction slope equations by three carboxylic acids with varying alkyl chain length
Carboxylic acid name Friction Slope Equation
Hexanoic acid (C6) µ = kv0.006
Dodecanoic acid (C12) µ = kv0.010
Octadecanoic acid (C18) µ = kv0.010
Hexanoic acid significantly reduces the friction in a wet clutch, and must therefore be forming a
reasonably closely packed boundary film, effective at the pressure experienced on the contact units.
The friction slope equation of this film as shown in Table 8.2 reveals a small difference in the shear
characteristics of this film, compared with the larger and presumably more effective boundary films
0.01
0.1
1
0.001 0.01 0.1 1
Log
Fric
tio
n C
oe
ffic
ien
t
Log Sliding Speed (m/s)
C6
C12
C18
Base oil

140
formed by the C12 and C18 acids. This could be due to the physical properties of the films formed by
the acids, which will differ due to the strength of the film being proportional to the length of the alkyl
chains. The transition temperature of the C12 and the C18 acid films is above the test temperature
(100 °C), whereas the transition temperature of the C6 acid film is below the test temperature [102].
The boundary film formed by the hexanoic acid may therefore be more disordered and the molecules
might behave more similar to that of a liquid, resulting in a greater barrier to shearing [116].
There is a steady decrease in friction with increasing chain length. At a certain chain length size, the
friction should reach a limit, so that further increase of the chain length will not continue to reduce the
friction [117]. This limit has been determined by Zisman to be 14 carbon atoms in the molecular
chain for fatty acids in a steel-on-glass contact. Therefore no significant reductions in friction for a
carboxylic acid with chain lengths above 18 carbon atoms are expected.
8.3.2 Varying structure
Four acids with 18 carbon atoms and varying structures were studied in a wet clutch contact. These
include; stearic (octadecanoic) acid, oleic acid, elaidic acid and 12-hydroxy stearic acid. The
structures of these molecules are shown in Figure 8.3, and the results obtained are shown in Figure
8.7.
Figure 8.7: Friction characteristics of C18 acids with varying structures
0
0.05
0.1
0.15
0.2
0.25
0 0.5 1 1.5 2
Fri
cti
on
Co
eff
icie
nt
Sliding Speed (m/s)
Base oil
Stearic acid
Oleic acid
Elaidic acid
12 hydroxy stearic acid

141
The stearic, elaidic and 12-hydroxy stearic acid all give a positive gradient curve, whereas the oleic
acid gives a negative gradient curve, similar in form to the base oil. Stearic acid has the lowest
friction coefficient over the entire speed range. Stearic acid is saturated and linearly symmetrical, and
can form resilient layers on surfaces, due to the strength of the intermolecular forces in the boundary
film. In the wet clutch contact it shows the lowest friction coefficient, and a positive gradient µ–v
curve, suggesting it forms the most effective friction reducing layers. By introducing unsaturation into
the alkyl chain, an increase in friction is seen. This is probably largely due to a reduction in the ability
of the molecules to form closely-packed layers. A double bond in the chain prevents rotation at that
point, and forces a bend or kink in the structure, which prevents such efficient packing as a fully
saturated alkyl chain. Oleic and elaidic acid are mono-unsaturated and represent the cis and the trans
isomer respectively. The results for these two mono-saturated isomers show a strikingly large
difference in their friction characteristics. Elaidic acid, has a positive gradient curve, with a friction
coefficient slightly higher than stearic acid. Oleic acid has a negative friction-speed gradient and
higher friction over the whole speed range. The differences presumably arise from the different
influence of the trans and cis double bond on the packing density of the molecules on the surfaces.
The cis double bond of the oleic acid forces a bent configuration, which is its low energy conformation
at 100 °C [118], which will lead to stearic blocking of adsorption sites, and the formation of a more
dispersed less effective friction reducing layer. The trans double bond of eliadic acid allows its
molecules to favour a much more linear chain structure and thus form a closer-packed monolayer.
Similar findings of the different behaviour of elaidic versus oleic acid are reported elsewhere, and
have been attributed to the oleic acid having a film thickness of 0.5 nm, corresponding to oleic acid
adsorbing horizontally onto the surface [118,119], and thus not forming a closely packed, boundary
film. Despite this, oleic acid has been shown to reduce friction in a steel-on-steel contact [120].
The 12-hydroxy stearic acid gives the highest friction positive gradient µ-v curve of the four acids
studied, which is the most desirable condition for wet clutch applications. The hydroxy group on 12-
hydroxylstearic acid provides the possibility of introducing hydrogen bonding into the boundary film,

142
leading to the formation of a resilient film, with strong intermolecular forces. However the size of the
hydroxy group may cause the formation of a less dense layer, promoting interpenetration between the
sliding layers and increasing the friction. The hydroxy group may also lead to the molecule lying
parallel to the surface, forming hydrogen bonding at the head group and the hydroxyl group with the
surface.
Thus the structure of the FM can strongly influence the µ-v behaviour, and by introducing
unsaturation and side groups to the FM structures the overall friction can be increased.
8.3.3 Mixed chain lengths
To increase the friction coefficient of a boundary film, the interpenetration of the sliding layers can be
increased by using two FMs with different chain lengths. This may produce a mixed size monolayer,
allowing the alkyl tails to overlap to a greater extent during sliding, increasing repulsion between the
molecules and therefore friction. Five blends with varying ratio of hexanoic and dodecanoic acid were
studied (Table 8.1).
Figure 8.8 shows the friction results for the five C6:C12 blends. The 1:10, 1:5 and 1:1 mixtures
produce positive gradient curves, while the 5:1 and the 10:1 mixtures produce a negative gradient
curve.

143
Figure 8.8: Friction characteristics of model friction modifier blends at varying ratio’s
The C12 acid will have greater side chain interactions between neighbouring molecules than the C6
acid, due to its longer chain. The boundary films formed by these mixtures are therefore probably
dominated by a C12 acid film, but as the concentration of the C6 increases, the shorter chain surfactant
may be present in increasing number of surface sites, so a mixed size film will be formed. Comparing
the C12 acid on its own versus the C12 with a small percentage of C6 (the 1:10 mixture)(Figure 8.9),
the friction is slightly higher for the mixture, and, as more C6 is added, the friction increases, probably
due to the disruption of the dominant C12 film.
0
0.05
0.1
0.15
0.2
0.25
0 0.5 1 1.5 2
Fri
cti
on
Co
eff
icie
nt
Sliding Speed (m/s)
C6:C12 acid, 10:1
C6:C12 acid, 5:1
C6:C12 acid, 1:1
C6:C12 acid, 1:5
C6:C12 acid, 1:10
144
Figure 8.9: The friction characteristics of three model FM blends compared to the result for C6 and C12 acid
At higher concentration of the C6 acid, the film will be less populated by the C12 acid and the average
film thickness will be less. A mixed size monolayer is probably formed with greater interpenetration
between layers than a homogenous size film. At the lowest speed of 0.01 m/s a steady rise of the
friction coefficient is seen with the introduction of the C6 acid (Figure 8.10). As the concentration of
C6 acid is increased, this will eventually compensate for its weaker intermolecular forces. A study
carried out by Folkers [121] found that to achieve a equal concentration of two surfactants on a surface
where one surfactant has twice as many methyl units, a solution containing a mixture of 10:1 (short
chain : long chain) surfactant is needed. This suggests that in the current study, the 10:1 mixture
(C6:C12) may be forming a boundary layer with approximately equal concentrations of both
surfactants on the surfaces, leading to the observed rise in friction (Figure 8.8). Barrena [113], who
also studied the effect of mixed size monolayer films on friction, found that a solution of C12 and C16
alkanethiols at a ratio of (1:1) produced a film with higher friction than the individual surfactants.
The shift from a positive to a negative gradient curve probably indicates that a mixed alkyl chain
length monolayer that is much less effective at reducing friction is formed. This shows friction
coefficients above 0.15 at 10 mm/s (Figure 8.10).
0.1
0.11
0.12
0.13
0.14
0.15
0.16
0.17
0 0.1 0.2 0.3 0.4 0.5 0.6
Fri
cti
on
Co
eff
icie
nt
Sliding Speed (m/s)
C6 acid
C6:C12 acid, 1:1
C6:C12 acid, 1:5
C6:C12 acid, 1:10
C12 acid
Increasing
concentration of C6
acid

145
Figure 8.10: The friction coefficient at 10 mm/s sliding speed against the molar ratio of the model friction modifier
mixtures
Mixed size FM layers can be used to increase the friction within wet clutches while maintaining the
desirable positive gradient friction versus speed characteristic, although the increase in friction is
small. For larger increases of friction, larger molecules may need to be added to the FM film, which
have a greater effect on disrupting the film and increasing its shear strength. This may be why the
addition of large surface active molecules; dispersants and detergents to ATF formulations leads to an
increase the friction within wet clutches.
8.3.4 Model FMs with Dispersants
The addition of dispersants and detergents to friction modifier films was studied experimentally in
Chapter 7, although the structures of the compounds were not fully known. In this section, the friction
curve of a model FM boundary film is increased by the addition of a dispersant (Figure 8.11).
Dispersants may co-adsorb onto the surface, forming irregularities in the FM film, increasing the
friction.
0
0.05
0.1
0.15
0.2
0.25
0 20 40 60 80 100
Fri
cti
on
Co
eff
icie
nt
at
10
mm
/s
% Molar of C12 acid (C12/C6+C12)

146
Figure 8.11: Friction characteristics when a dispersant is combined with a model friction modifier
The addition of the dispersant to the C12 acid increases the friction in the lower speed range of the
test, between 0.01 and 0.5 m/s. Above 0.5 m/s the friction coefficient by each solution is similar. The
dispersant may be present in the boundary film, and may be considered to be an irregularity, with large
PIB chains protruding from the otherwise relatively uniform height friction modifier film. The
dispersant thus probably increases the friction by increasing repulsion between the sliding layers,
through its large stearic bulk, and the disruption of the low shear boundary film.
8.4 Summary
Friction modifiers are added to ATF formulations to provide the desirable friction increasing with
speed characteristic in wet clutches. However the addition of the FMs also decreases the overall
friction in the clutch and reduces its torque capacity. Therefore, additives and additive combinations
that give a high friction within a wet clutch while maintaining the positive gradient slope are desired.
This can be achieved by using FMs that are less “effective” at reducing the friction, through the
introduction of unsaturation, and side groups on the alkyl chains, which form boundary films with
greater interpenetration between the sliding layers and therefore increase the friction. In this chapter a
0
0.05
0.1
0.15
0.2
0.25
0 0.5 1 1.5 2
Fri
cti
on
Co
eff
icie
nt
Sliding Speed (m/s)
Base oil
C12 acid
C12 acid and M2 Disp

147
series of carboxylic acids have been used as model FMs. By increasing the alkyl chain length the
friction is reduced, probably due to a more resilient and effective layer being formed, driven by the
increased number of intermolecular interactions between the methylene groups on the alkyl chain.
Interestingly, a considerable friction reduction is seen even when for the C6 acid and amine. Friction
reduction is not seen for such small chain compounds in steel-on-steel contacts and this may reflect the
fact that the clutch contact has a much lower pressure (both in terms of mean pressure and contact unit
pressure). It implies that the films formed by C6 surfactants are able to withstand 1 to 50 MPa
pressures but not 0.1 to 1 GPa pressures.
Increasing the amount of unsaturation on model FMs and the addition of side groups on the alkyl
chains, increases the friction. This is probably due to the reduction of the intermolecular interactions
in the film and the increasing number of irregularities in the film, promoting interpenetration between
the alkyl chains, increasing the shear strength and thus the friction. However there is a very striking
difference in friction behaviour between the cis oleic acid and its trans isomer, eliadic acid. This
serves to highlight the importance of molecular conformation on surface packing and of surface
packing on boundary friction.
The addition of a dispersant to the model FM was also found to increases the friction. The PIBSA
PAM dispersant is surface active and probably co-adsorbs to the surface of the steel and the friction
material. The dispersant molecules are large and highly branched, and should disrupt the low shear
sliding of the FM films if present on the surface, increasing the friction.
The adsorption of chemical additives on friction material surfaces has yet to be unambiguously
demonstrated, although some attempts have been made to identify these species by surface analysis
technique such as XPS [122]. In the following chapter, an attempt will be made to study the effect of
the different chemical additives on treated surfaces, and thus obtain some insight into their adsorption
behaviour.
148
9 .
Chapter 9
Wet Clutch Friction with Treated Surfaces
In this chapter the wet clutch specimen surfaces are modified by treatment in a plasma cleaner and by
coating with a thin diamond-like carbon (DLC) layer. The friction of pure cellulose material is also
studied. These treatments modify the surface properties, and therefore the wetting of the surfaces by
lubricants, and the adsorption of additives. In this chapter the effect of surface wetting and additive
adsorption on the friction characteristics in a wet clutch are studied and discussed.
9.1 Introduction
Some unresolved questions have been highlighted in the preceding two chapters, such as why does the
base oil lubricated wet clutch have a high static friction, and onto which surface do the additives
adsorb? These questions must be answered to help gain a complete understanding of the friction
generated in a wet clutch. Both these effects can be studied by modifying the surfaces of the wet
clutch specimens.

149
9.1.1 High static friction by the base oil
When a base oil is used to lubricate a wet clutch, a high static friction is measured. This effect has not
been fully explained. It is proposed here that this is due to the formation of capillary bridges between
the two surfaces, which is known to increase the contact pressures in rough surfaces [123].
In this chapter the increased static friction in the presence of a base oil is studied through the
modification of the surface properties, and discussed with reference to wetting effects [123]. These
wetting effects are manipulated through the use of plasma cleaned samples, dried samples and the use
of both a pure hydrocarbon lubricant and water.
9.1.2 Additive Adsorption
In a wet clutch contact, surface active additives can alter the friction characteristics (Chapter 7 and 8).
When surface active additives are introduced into the wet clutch contact, the friction characteristics are
altered, presumably by the adsorption of the additives on to the surfaces present within the wet clutch.
In this chapter the adsorption of the friction-altering additives is studied by varying the surfaces, both
by coating of the samples with a relatively inert diamond-like-carbon (DLC), and by replacement of
the friction material composite with a pure cellulose specimen.
Some additives such as FMs are known to adsorb onto steel surfaces, but less so onto relatively inert
surfaces such as DLC. By coating the wet clutch specimens with the relatively inert DLC coating, it
may be possible to determine the effect of the additive adsorption independently on either surface.
The friction material disk can also be coated with a thin, pure cellulose layer, to remove any effect of
the resin and the filler materials on adsorption.
In this chapter the surface modification techniques will be described first and then the friction
characteristics of these samples will be presented and discussed.

150
9.2 Method
9.2.1 Dried samples
The steel balls were cleaned with toluene with ultrasonic agitation, followed by acetone, both for 20
minutes. The friction material samples were washed in hexane for 20 minutes with ultrasonic
agitation. Both the balls and the friction material disks were then placed in a sealed dessicator with a
drying agent and allowed to rest for two weeks. The samples were then placed in the friction screener,
along with approximately 50 g of the drying agent lining the pot, which was then partially sealed. The
friction experiment was then conducted as normal, but with shorter steps at each speed, to ensure that
excess wear of the samples did not occur during the test.
9.2.2 Plasma cleaning
Plasma cleaning is used to alter the surface properties and remove contaminants. Plasma is a distinct
state of matter, consisting of a partially ionized gas, which can react with surfaces and surface
contaminants. The plasma consists of excited atomic, ionic, molecular and free radical species.
Oxygen plasma can be formed at low pressures, when a small quantity of oxygen gas in a chamber is
excited with radio frequency (RF) waves. The radio frequency excites the gas molecules causing them
to vibrate and their temperature to increase, until the plasma is formed. The presence of the plasma is
indicated by the UV and visible light that is emitted during the cleaning procedure. This appears as a
purple glow.
A simplified plasma formation equation is given below:
O2 + RF energy = 2 O atoms, ions and electrons, UV and visible light
Once formed, the oxygen plasma can change the surface properties of the friction material sample in
the following ways.
The active species of the plasma are able to remove a thin layer of contaminants that may exist on the
surface, which increases the surface energy and improves wettability [124]. This effect is only
temporary since contamination from the atmosphere will return the material to its original state.

151
The outer regions of the friction material fibres are coated with an inhomogeneous thin layer of
phenolic resin (Figure 4.3). The Oxygen plasma may partially remove this layer, by oxidation and
increasing the temperatures on the top molecular layers of the surface. This may begin to expose the
underlying cellulose fibres, which are hydrophilic. The plasma will also increase the hydrophilicity of
these cellulose fibres [124,125], by oxidising the lignin in the pulp, and removing hydrophobic
components such as unsaturated fatty acids from the fibre surfaces.
The oxygen plasma can also react with the surface of the friction material, changing the chemical
structure of the surface. Electrophilic atoms such as oxygen and molecular fragments such as –OH,
can become chemically bonded to the hydrocarbon and polymer chains on the surface, permanently
changing the wettability of the material [126].
The plasma treatment will normally only influence the surface of the material and not alter the bulk
properties. However plasmas have been shown to permeate into the inner layers of porous materials
[127], and can therefore also alter the surface properties of the material beyond the immediate surface
region.
In summary the oxygen plasma treatment probably has a combined effect of:
(i) Removing the organic components and other contaminants from the surface of the fibres
(ii) Partially removing the outer phenolic resin coating, exposing the underlying cellulose
(iii) Partially oxidizing the surface, increasing the surface energy
If a drop of water is applied to the surface of the standard friction material, it has a high contact angle,
over 90° and forms a bead on the surface. This is shown in Figure 9.1 where four drops of water were
applied to the friction material, and an image was taken a few seconds later.

152
Figure 9.1: Picture of a friction material disk, with four water drops on the surface, demonstrating the hydrophobic
nature of the material
The water beads remained on the surface of the material, and did not visibly penetrate into the surface,
even after 1 hour. Eventually the water evaporated from the surface.
After plasma cleaning the friction material disk for two hours, the water drops readily penetrate into
the bulk of the material, as shown by Figure 9.2 which was taken a couple of seconds after the water
droplets were placed on the surface. The friction material has therefore been rendered hydrophilic by
the plasma cleaning process, reducing the contact angle, allowing the water to wet the friction
material.
Figure 9.2: Picture of a friction material disk after plasma cleaning for two hours, three water drops were applied to
the surface, and the image taken a few sections after, the water readily passes into the material

153
A similar test was carried out using drops of mineral oil, and a less marked effect was seen. After
plasma cleaning the friction material sample, the oil sample flowed at a slower rate into the bulk of the
material, indicating the process had rendered the material relatively oleophobic.
9.2.3 DLC
Diamond-like-carbon (DLC) is a relatively new coating technology, applied to some engineered
surfaces. These thin (sub 10 µm) coatings are extremely hard, and demonstrate low friction in rubbing
contacts, and are therefore used to reduce wear and friction on some engine components. A problem
that arises when these coatings are introduced into engines is that chemical additives may not behave
in the same manner on these surfaces as they do on steel. DLC is a relatively inert material, although
reactive species such as Tungsten can be added to the DLC to improve its reactivity [128]. In this
study, DLC is used as a convenient method of applying a homogenous, inert coating on the fibrous
friction material and also on the steel ball, to restrict adsorption of chemical additives.
SD-1777 friction material MTM disks and AISI 52100 alloy steel balls were coated with a DLC
coating by Oerlikon Balzers (Droitwich, UK) using a proprietary Balinit® DLC a-C:H coating. This
DLC is an amorphous, primarily sp3 and hydrogenated coating, and was selected because it has been
shown not to give significantly reduced friction in the presence of organic friction modifiers,
suggesting little adsorption of the latter [129]. The DLC was applied to the friction material using a
plasma deposition method at 300 °C. Because of the low temperature, the morphology of the friction
material should not be significantly changed during the coating process. Optical microscope images
of the friction material, before and after the DLC coating, are shown in Figure 9.3. The DLC-coated
friction material remains fibrous, and has deposited a thin layer of DLC over the fibres. The friction
material samples appear grey after the coating treatment.

154
Figure 9.3: Optical microscope images of the friction material before (left) and after (right) the DLC coating process
9.2.4 Cellulose Disk
The cellulose disk was manufactured by bonding a thin piece of filter paper onto the friction material
disk using a small quantity of epoxy resin. Filter paper is made from pure cellulose fibre, and by
bonding a strip of this to the top of the friction material, the contributions of the resin and the filler
materials to adsorption and friction are removed. Care was taken to ensure only a small amount of
adhesive was used and the finished samples were analysed under the microscope to ensure no adhesive
was present on the surface. The contact will then occur between the cellulose material and the counter
steel ball. The filter paper used was manufactured by Whatman® Schleicher & Schuell® and was
supplied by Sigma-Aldrich. The filter paper is 0.18 mm thick, and has a basic weight of 85 g/m2.
9.2.5 Lubricants
Several different lubricants have been used in this section. The base oil used is a group III mineral oil,
Nexbase 3030, with a kinematic viscosity of 3 mm2/s at 100 °C. Hexadecane was used as a model
base oil, and was dried using alumina and silica before use. A fully formulated ATF was used, of
unknown composition, although it will certainly contain a variety of chemical additives, including
FMs, dispersants and detergents. The kinematic viscosity of the ATF was 5.5 mm2/s at 100 °C and it
was the same ATF as studied in the previous chapters. Solutions of additives were used to study
adsorption effects, including dodecanoic acid at a concentration of 1 % w/w in Nexbase 3030, and the

155
dispersant M2, with a TEPA head group and two PIB tails with molecular weight 950, at 3 % w/w in
Nexbase 3030.
9.2.6 Friction Screener Method
The friction screener described in Chapter 6 was used to study the friction characteristics of a selection
of samples and lubricants. Unless otherwise stated, the standard testing method used in this chapter
was 100 °C, with an applied load of 3 N. A short break-in stage at 0.1 m/s for 10 minutes was
followed by the friction versus speed stage, over the range 0.01 and 2 m/s, which is presented in the
results.
9.3 Results and Discussion
An unlubricated wet clutch contact produces a positive gradient µ-v curve. When a base oil lubricant
is added, the low speed friction is increased for a as-supplied friction material (Figure 9.4).
Figure 9.4: Friction characteristics of steel on friction material, after the drying process, and lubricated with a base oil
The increase of the static friction of a wet clutch when lubricated with a base oil could be due to the
introduction of capillary bridges between the surfaces. This surface wetting effect is known to
increase the friction in rough surfaces [123] by increasing the load between the surfaces, and therefore
0
0.05
0.1
0.15
0.2
0.25
0 0.5 1 1.5 2
Fri
cti
on
Co
eff
icie
nt
Sliding Speed (m/s)
Dry
Base oil lubricated

156
the subsequent measured friction is higher. A contact image of both a dry friction material and a
lubricated friction material is shown in Figure 9.5. The capillary bridges are clearly visible and are
presumably formed on the outside of the contact units and on near contact regions. These wetted
patches can act to pull the surfaces together, increasing the pressure on the contact units.
Figure 9.5: Contact image of a friction material against a glass disk, a) dry, b) lubricant
When the friction test is conducted with hexadecane, a pure hydrocarbon, the same high friction exists
at low speeds (Figure 9.6). This test was conducted at room temperature (22 °C), at three applied
loads, 1, 3 and 6 N.
Figure 9.6: Friction characteristics of steel on friction material, lubricated with hexadecane, at 1, 3 and 6 N load
0
0.05
0.1
0.15
0.2
0.25
0.3
0.35
0.4
0.45
0.5
0 0.1 0.2 0.3 0.4 0.5 0.6
Fri
cti
on
Co
eff
icie
nt
Sliding Speed (m/s)
1 N
3 N
6 N
Hexadecane, 22 °C
b a 1 mm

157
At 1 N load and at 0.01 m/s, the hexadecane produces one of the highest friction coefficient seen in
this study, at 0.42. The friction coefficient at 0.01 m/s reduces with increasing applied load. At high
applied loads, any additional load from wetting effects would be expected to form a smaller proportion
of the total and thus have less influence on the friction.
The high friction coefficient demonstrated by hexadecane at low speeds is probably due to the pure
hydrocarbon forming a capillary bridge with a low contact angle, and therefore increasing the pressure
at the contact units. This is in comparison to a mineral base oil, which will contain some polar species
resulting in a slightly higher contact angle, and a reduced contribution to the load, and so slightly
lower friction coefficient. This subject of wetting is discussed further in Chapter 10.
9.3.1 Dried samples
The friction characteristics of the dried specimens were studied, to see whether water moisture might
be contributing to the friction properties. The results are shown in Figure 9.7.
Figure 9.7: Friction characteristics of dried test samples, steel on sd-1777 friction material, at 100 °C
In the absence of a lubricant, the dried samples continue to exhibit a positive gradient curve. The
mechanism for this is discussed in Chapter 10. At higher speeds, large variations in the measured
0
0.05
0.1
0.15
0.2
0.25
0 0.5 1 1.5 2
Fri
cti
on
Co
eff
icie
nt
Sliding Speed (m/s)

158
friction are observed. This is probably due to the wearing of the samples after long sliding distances,
in the absence of a lubricant.
9.3.2 Plasma cleaned
The friction material sample was treated in a oxygen plasma for two hours. This rendered the material
relatively oleophobic (reduced the tendency of oil to wet the surfaces). It also decreased the static
friction when lubricated with a base oil (Figure 9.8).
Figure 9.8: Friction characteristics of a base oil with standard specimens and a plasma cleaned disk
The low speed friction coefficient measured at 0.01 m/s is reduced from 0.27 to 0.20 after the friction
material disk was plasma cleaned for two hours. Thus, the wetting properties of the friction material
can account for the increased friction seen at low speeds.
An interesting observation was that the effect of the plasma cleaning diminished with time, as the
samples were exposed to the atmosphere. This could indicate that the high static friction may return as
the oleophilic (hydrophobic) nature of the material is re-established after exposure to the atmosphere.
Figure 9.9 shows the friction characteristics of the wet clutch test when the plasma cleaned disks are
0
0.05
0.1
0.15
0.2
0.25
0.3
0 0.5 1 1.5 2
Fri
cti
on
Co
eff
icie
nt
Sliding Speed (m/s)
Standard Specimens
Plasma cleaned disk
Base oil

159
studied immediately after the cleaning process and after 1 and 2 hours of exposure to the atmosphere
after the cleaning process. All tests were lubricated with a group III mineral oil.
Figure 9.9: Friction characteristic variation when a plasma cleaned disk is exposed to the atmosphere
When the plasma cleaned samples were lubricated with a fully formulated ATF, the friction
characteristics were not affected (Figure 9.10). The surface active additives in the ATF such as the
FMs continue to adsorb onto the surfaces and render the surfaces oleophilic. Therefore the wetting
effects are not expected to affect the friction to a large extent when lubricant additives are present.
The plasma cleaning of the disk will increase the surface energy of the friction material, and surface
active additives will continue to adsorb onto the fibres.
0
0.05
0.1
0.15
0.2
0.25
0.3
0 0.5 1 1.5 2
Fri
cti
on
Co
eff
icie
nt
Sliding Speed (m/s)
Immediate
1 hour
2 hour
Base oil

160
Figure 9.10: Friction characteristics of a ATF with standard specimens and a plasma cleaned disk
When the wet clutch system is lubricated with de-ionised water (Figure 9.11), a negative gradient µ-v
curve is produced. The friction coefficient in the lower speed range is between 0.35 and 0.25. After
the friction material has been plasma cleaned, the friction coefficient is increased up to 0.48. This is
the opposite effect to that seen when the system is lubricated with a hydrocarbon.
Figure 9.11: Friction characteristics of water with standard specimens and a plasma cleaned disk
0
0.05
0.1
0.15
0.2
0.25
0.3
0 0.5 1 1.5 2
Fri
cti
on
Co
eff
icie
nt
Sliding Speed (m/s)
Plasma cleaned disk
Standard Specimens
0
0.05
0.1
0.15
0.2
0.25
0.3
0.35
0.4
0.45
0.5
0 0.5 1 1.5 2
Fri
cti
on
Co
eff
icie
nt
Sliding Speed (m/s)
plasma cleaned disk
Standard specimens
ATF
Water
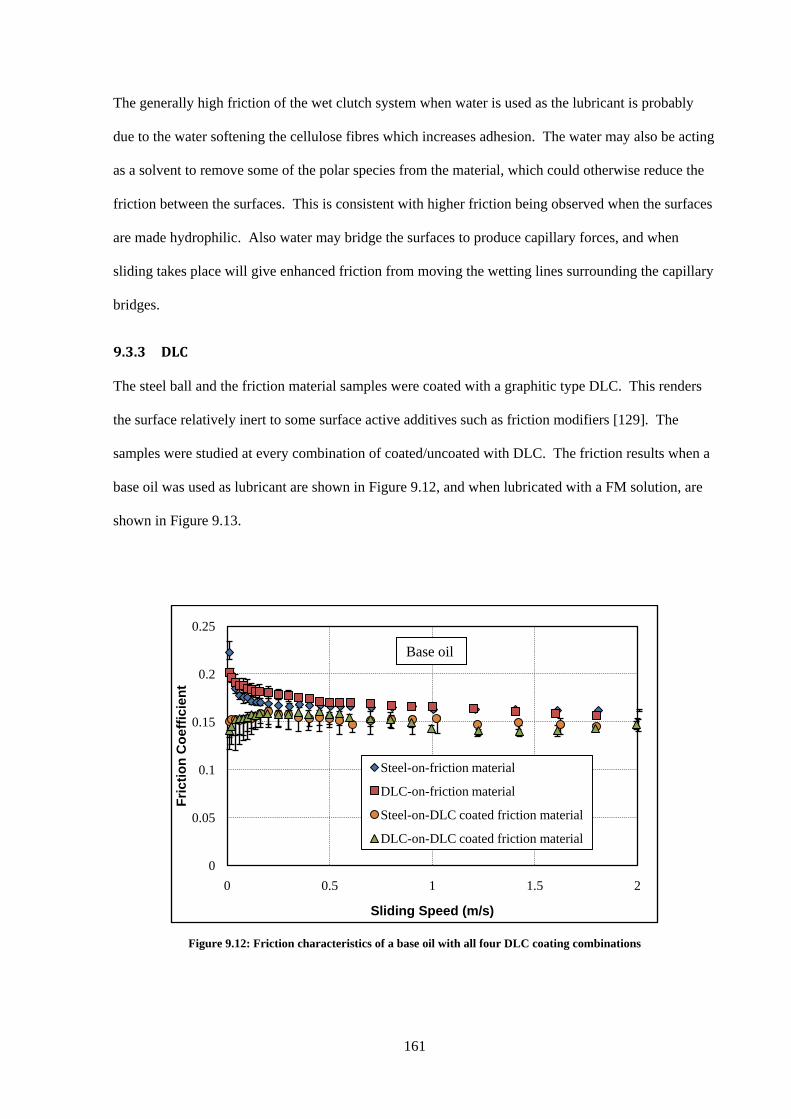
161
The generally high friction of the wet clutch system when water is used as the lubricant is probably
due to the water softening the cellulose fibres which increases adhesion. The water may also be acting
as a solvent to remove some of the polar species from the material, which could otherwise reduce the
friction between the surfaces. This is consistent with higher friction being observed when the surfaces
are made hydrophilic. Also water may bridge the surfaces to produce capillary forces, and when
sliding takes place will give enhanced friction from moving the wetting lines surrounding the capillary
bridges.
9.3.3 DLC
The steel ball and the friction material samples were coated with a graphitic type DLC. This renders
the surface relatively inert to some surface active additives such as friction modifiers [129]. The
samples were studied at every combination of coated/uncoated with DLC. The friction results when a
base oil was used as lubricant are shown in Figure 9.12, and when lubricated with a FM solution, are
shown in Figure 9.13.
Figure 9.12: Friction characteristics of a base oil with all four DLC coating combinations
0
0.05
0.1
0.15
0.2
0.25
0 0.5 1 1.5 2
Fri
cti
on
Co
eff
icie
nt
Sliding Speed (m/s)
Steel-on-friction material
DLC-on-friction material
Steel-on-DLC coated friction material
DLC-on-DLC coated friction material
Base oil

162
The DLC coated friction material acts to reduce the friction coefficient in the low sliding speed range,
between 0.01 and 0.2 m/s, whereas the coating of the steel specimen has only a small effect on the
measured friction, when lubricated with a base oil (Figure 9.12). It is clear that the high static friction
coefficient seen with base oil is produced by a friction material/base oil interaction rather than
steel/base oil. This is consistent with partial wetting of the friction material by the base oil.
Figure 9.13: Friction characteristics of a model friction modifier with all four DLC coating combinations
When the steel surface is coated with DLC, the C12 acid continues to reduce friction in the lower
speed range of the test, suggesting that this model FM can adsorb onto the friction material (Figure
9.13). The model FM reduces the friction coefficient for each combination, including surprisingly for
the DLC-on-DLC combination. The FM may therefore also have an effect on the relatively inert DLC
surfaces.
Figure 9.14 compares friction coefficient/speed behaviour when only the steel ball is coated with a
DLC, for the four cases of dry conditions, lubricated with a base oil, a FM solution and a dispersant
solution.
0
0.05
0.1
0.15
0.2
0.25
0 0.5 1 1.5 2
Fri
cti
on
Co
eff
icie
nt
Sliding Speed (m/s)
Steel-on-friction material
DLC-on-friction material
Steel-on-DLC coated friction material
DLC-on-DLC coated friction material
C12 acid

163
Figure 9.14: Friction characteristics for DLC ball on SD1777 friction material, dry and lubricated
The FM and the dispersant continue to have an effect on the friction when the steel sample is coated
with DLC, this suggests that these additives may be adsorbing onto the friction material.
9.3.4 Cellulose Disk
The friction material samples were coated with a cellulose fibre material to remove any contribution to
friction of the resin and the filler materials. The friction of these disks was then studied dry and
lubricated, with a base oil and a FM and dispersant solution (Figure 9.15).
0
0.05
0.1
0.15
0.2
0.25
0 0.5 1 1.5 2
Fri
cti
on
Co
eff
icie
nt
Sliding Speed (m/s)
dry
Base oil
C12 acid
M2 Disp
DLC-on-SD1777

164
Figure 9.15: Friction characteristics for a steel ball on a cellulose disk, dry and lubricated
The dispersant had a minimal effect on the friction in comparison with the base oil solution,
suggesting that the action of the dispersant to increase the friction has been reduced with the cellulose
coating. In a clutch system, the dispersant may therefore be adsorbing onto the resin and filler
components of the friction material. The friction modifier exhibited positive gradient friction
characteristics, and has been largely unaffected by the coating of the friction material with a cellulose.
The FM may therefore be adsorbing onto the steel surface and/or the cellulose.
9.4 Summary
In this chapter the friction characteristics of a wet clutch with altered surface properties of the samples
have been studied. This was done to provide an insight into both the wetting behaviour between the
rough surfaces, and the adsorption properties of FMs and dispersants on the steel and friction material
surfaces.
The addition of a hydrocarbon lubricant to the wet clutch increases the low speed friction, which could
be attributed to wetting effects. The wetting effects consist of the formation of capillary bridges
0
0.05
0.1
0.15
0.2
0.25
0 0.5 1 1.5 2
Fri
cti
on
Co
eff
icie
nt
Sliding Speed (m/s)
Dry
Nexbase 3030
Disp M2
FM W
Steel-on-cellulose

165
between the surfaces, which can pull the surfaces together, increasing the actual load, and the
measured friction coefficient. Once formed, the capillary bridges will also require energy to slide
along the smoother surface, this may also increase the low speed friction of the system. These wetting
effects are discussed further in Chapter 10.
The adsorption of additives onto wet clutch surfaces is unclear. The complexity of the friction
material makes the use of surface analysis techniques such as XPS and XANES, unreliable when
looking for small surfactant molecules on the surfaces. In this chapter, the steel and friction material
surfaces were treated with a relatively inert DLC, in an attempt to prevent adsorption. The friction
coefficient continued to be decreased by a FM and increased by a dispersant when the steel surface
was coated with DLC. These additives may therefore be adsorbing onto the friction material. When
the friction material was replaced with a pure cellulose coated specimen, the FM continued to reduce
friction and produced the characteristics positive gradient friction versus speed curve, but the friction
increase usually expected by the dispersant was lost. The FM therefore may be adsorbing onto both
the steel and friction material surfaces in the wet clutch, whereas the dispersant may only be adsorbing
onto the resin or the filler components of the friction material.

166
10 .
Chapter 10
Discussion
In this chapter, the experimental results obtained in this thesis and previous findings in the existing
literature are collated to offer suggestions of the mechanisms of the friction within a wet clutch. The
lubrication regime of the wet clutch is first clarified, followed by a discussion of the boundary
lubrication effect, which are believed to govern the friction characteristics.
10.1 Introduction
In this thesis, three areas of wet clutch behaviour have been studied: the contact morphology and thus
effective pressure, the flash temperature, and the friction characteristics. All are required to fully
understand the friction mechanisms within a wet clutch.
ATF and clutch manufactures have strived for many years to reduce stick-slip effects in wet clutches,
mainly by producing a positive gradient µ-v curve through the use of chemical additives in the ATFs
to reduce static friction, by employing solid lubricants in the clutch material and by using an

167
appropriate surface morphology. They have also sought to superimpose the positive µ-v curve on high
friction values over the whole sliding speed range. To a large extent they have been successful:
however the mechanisms by which these desirable friction characteristics are achieved by the
chemical additives and the friction material are not yet fully understood.
In this chapter the lubrication regime is first clarified by considering the clutch morphology and
consequent geometry of the contact and by applying conventional hydrodynamic and
elastohydrodynamic theory. Once the lubrication regime is established, the friction mechanisms can
be discussed in an informed manner, considering boundary lubrication effects and using the
experimental data collected in Chapters 7, 8 and 9.
10.2 Prevalent lubrication regime
10.2.1 Introduction
To fully understand the mechanisms of the friction generated within wet clutches, the lubrication
regime must first be identified. As entrainment speed is increased from a low value, most sliding,
lubricated engineering parts undergo a transition from the boundary lubrication regime into the
hydrodynamic lubrication regime, as a greater volume of fluid is entrained between the contacting
surfaces. This reduces and eventually eliminates asperity contact and results in a reduction in friction
coefficient, from µ ~ 0.1 for boundary lubrication to µ ~ 0.005 for hydrodynamic lubrication or µ ~
0.05 for piezoviscous EHL. In a wet clutch contact, the friction remains high over a wide range of
speeds and the conventional transition from boundary to conventional hydrodynamic lubrication is not
evident. The friction coefficient also increases with sliding speed, a condition that is not usually
demonstrated by engineered components. In this section, the reason that a conventional, friction-
reducing hydrodynamic film is not formed in a wet clutch contact is discussed.
The reason the wet clutch does not exhibit the “normal” lubrication behaviour of engineered
components is largely due to the properties of the contact imparted by the friction material. The

168
friction material is a composite material containing, fibres, resins, filler materials and friction
modifiers. The predominantly fibrous friction material produces a porous and a very rough surface.
The rough surface produces small contact units when loaded against a flat counter surface. The key
material features are thus;
(i) Roughness
(ii) Porosity/Permeability
(iii) The small size of the contact units
10.2.2 Effect of Roughness
The friction material has a rough surface which is created by protruding fibres in the uppermost region
of the material. The fibre diameters are typically 20 to 50 µm, and a large distance can exist between
the peaks and troughs of the surface roughness. The sides of the fibres are also steep due to their
circular cross section. The measured surface roughness of the friction material can be Rq = 2 to 8 µm.
Thus to fully separate the surfaces, a film thickness of greater than ~ 5 µm would be required. This
would require a very viscous lubricant and/or very fast entrainment speeds. Under the normal
conditions of a slipping clutch, the operating conditions cannot achieve this.
Some preliminary experiments were conducted to attempt to form a hydrodynamic film in the wet
clutch, by lubricating the friction screener samples with a highly viscous base oil, and running up to
high speeds. The base oil used was a synthetic Polyalphaolefin, with the following viscosity.
Table 10.1: Viscosity of the PAO 40 base oil
Temperature (°C) Viscosity (Pa.s)
40 0.3292
60 0.1277
80 0.0597
100 0.0322
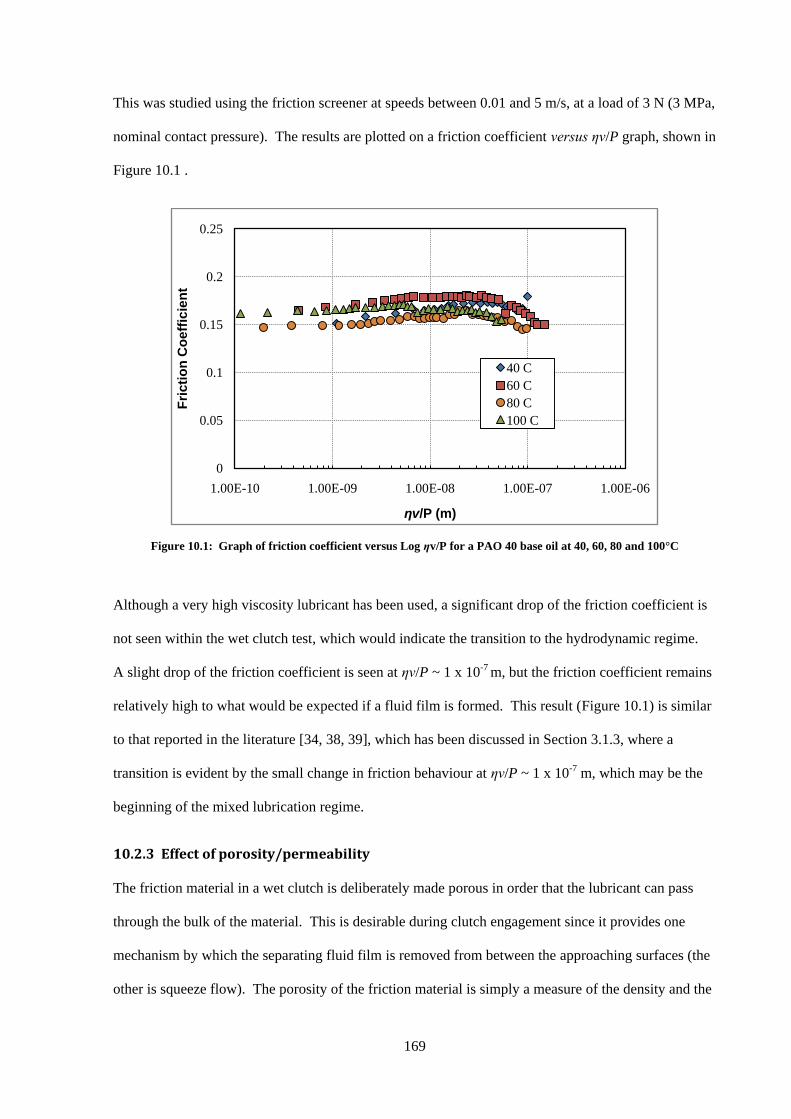
169
This was studied using the friction screener at speeds between 0.01 and 5 m/s, at a load of 3 N (3 MPa,
nominal contact pressure). The results are plotted on a friction coefficient versus ηv/P graph, shown in
Figure 10.1 .
Figure 10.1: Graph of friction coefficient versus Log ηv/P for a PAO 40 base oil at 40, 60, 80 and 100°C
Although a very high viscosity lubricant has been used, a significant drop of the friction coefficient is
not seen within the wet clutch test, which would indicate the transition to the hydrodynamic regime.
A slight drop of the friction coefficient is seen at ηv/P ~ 1 x 10⁻⁷ m, but the friction coefficient remains
relatively high to what would be expected if a fluid film is formed. This result (Figure 10.1) is similar
to that reported in the literature [34, 38, 39], which has been discussed in Section 3.1.3, where a
transition is evident by the small change in friction behaviour at ηv/P ~ 1 x 10⁻⁷ m, which may be the
beginning of the mixed lubrication regime.
10.2.3 Effect of porosity/permeability
The friction material in a wet clutch is deliberately made porous in order that the lubricant can pass
through the bulk of the material. This is desirable during clutch engagement since it provides one
mechanism by which the separating fluid film is removed from between the approaching surfaces (the
other is squeeze flow). The porosity of the friction material is simply a measure of the density and the
0
0.05
0.1
0.15
0.2
0.25
1.00E-10 1.00E-09 1.00E-08 1.00E-07 1.00E-06
Fri
cti
on
Co
eff
icie
nt
ηv/P (m)
40 C
60 C
80 C
100 C
170
size of the pores within the friction material. The flow of a liquid through the friction material is
called its permeability and this is a more important and complex property than porosity. Chavdar
[130] has shown that the lateral permeability of a lubricant through friction material is twice that of its
normal permeability due to the anisotropic nature of the material, with the majority of the fibres lying
in the lateral direction. Thus, the dominant processes for removal of a lubricant from the near surface
regions are (i) lubricant being accommodated within the inter-asperity regions of the material,
followed by (ii) lubricant being driven laterally through the material and out of the sides of the overall
contact by centrifugal forces and pressure.
Although the main purpose of friction material porosity is to enable rapid engagement, it will also
inhibit the build up of fluid pressure between the fibre contact units by allowing fluid to leak away
from these parts. Some authors have studied the influence of variation of the porosity of the friction
material on friction [34, 38, 42]. Materials with lower porosity were shown to have a reduced friction
at high speeds, suggesting the onset of a transition into the mixed and hydrodynamic regime.
However it should also be noted that some methods of decreasing the porosity of friction material,
such as increasing filler content, will also decrease the measured roughness of the material.
10.2.4 Effect of contact units on load support
Although the contact as a whole cannot generate enough hydrodynamic film thickness to separate the
clutch plate/rough clutch pad, it is possible that a fluid film might form at the individual contact units.
If this occurred, the friction would still be controlled by hydrodynamic lubrication. In practice this
will be shown below not to be the case, simply because it is not possible to build up significant fluid
pressures within contacts of very small width.
A very simple understanding of the influence of the morphology of a wet clutch material on friction
can be obtained from an elementary hydrodynamic lubrication analysis. The key concept is that
demonstrated experimentally in Chapter 4, that the overall contact actually consists of a large number
of very small contact units. The slopes of these units are steep (they are fibres) and they are separated
by regions where the gap between the surfaces is large. This, and the material porosity, means that

171
negligible hydrodynamic pressure is generated between the contact units so that the latter become
independent entities in hydrodynamic terms. It is easy to show that whatever the density of these
contact units, they are not able to generate significant hydrodynamic load support if they are very
small and independent.
Each contact unit may be approximated as a square plane slider bearing as shown schematically in
Figure 10.2.
Figure 10.2: Geometry of a square linear pad bearing (length into paper, L u= Bu)
The hydrodynamic load support of this contact unit bearing is given by Equation 10.1 [36].
)/,( uuu
uus
BLKfWLBu
h
2
20
6 Equation 10.1
where h0 = the minimum film thickness (at the bearing exit), us = sliding speed, η = lubricant dynamic
viscosity, Bu = contact unit bearing width, Lu = contact unit bearing length, K = convergence ratio,
o
o
h
hh 1
The optimum value of load support occurs when K 1, in which case Equation 10.1 becomes [36];
2
26
070
o
uusu
h
LBuW
.
Equation 10.2

172
Now consider the overall steel plate/clutch material contact to be square, of width B and length L and
to be made up of an array of equally spaced, small, identical contact units, as shown schematically in
Figure 10.3;
Figure 10.3: Schematic diagram of an array of contact units
The fraction of the nominal overall contact area that is made up of the units is X while the number of
units is N. The total area of all the contact units is NBuLu. This means that the area of each contact
unit, BuLu =BLX/N. Since the units are square, Bu = Lu = (BLX/N)0.5. Substituting this into Equation
10.2 gives;
51
2
6070
.
.
N
BLX
h
uW
o
su
Equation 10.3
The total load support for the textured pad is N times this value, i.e.
50
51
2
6070
.
.
.N
BLX
h
uW
o
sT
Equation 10.4
B
L
Lu
Bu
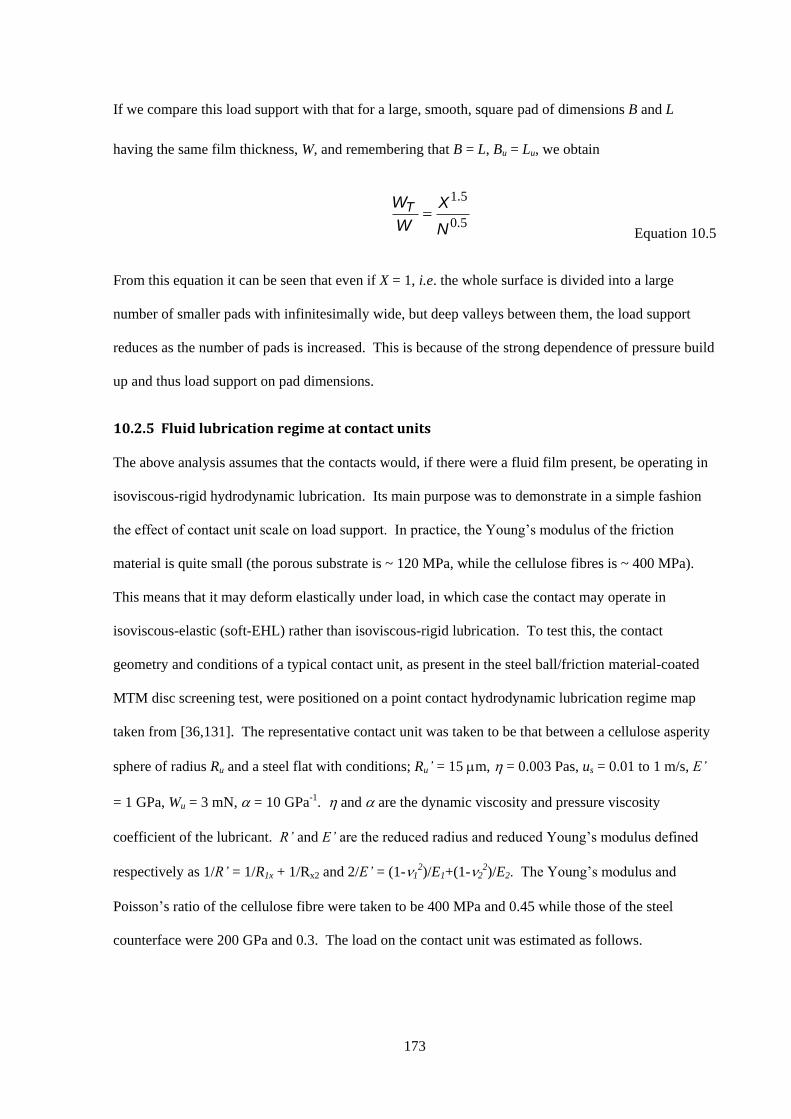
173
If we compare this load support with that for a large, smooth, square pad of dimensions B and L
having the same film thickness, W, and remembering that B = L, Bu = Lu, we obtain
50
51
.
.
N
X
W
WT
Equation 10.5
From this equation it can be seen that even if X = 1, i.e. the whole surface is divided into a large
number of smaller pads with infinitesimally wide, but deep valleys between them, the load support
reduces as the number of pads is increased. This is because of the strong dependence of pressure build
up and thus load support on pad dimensions.
10.2.5 Fluid lubrication regime at contact units
The above analysis assumes that the contacts would, if there were a fluid film present, be operating in
isoviscous-rigid hydrodynamic lubrication. Its main purpose was to demonstrate in a simple fashion
the effect of contact unit scale on load support. In practice, the Young’s modulus of the friction
material is quite small (the porous substrate is ~ 120 MPa, while the cellulose fibres is ~ 400 MPa).
This means that it may deform elastically under load, in which case the contact may operate in
isoviscous-elastic (soft-EHL) rather than isoviscous-rigid lubrication. To test this, the contact
geometry and conditions of a typical contact unit, as present in the steel ball/friction material-coated
MTM disc screening test, were positioned on a point contact hydrodynamic lubrication regime map
taken from [36,131]. The representative contact unit was taken to be that between a cellulose asperity
sphere of radius Ru and a steel flat with conditions; Ru’ = 15 m, = 0.003 Pas, us = 0.01 to 1 m/s, E’
= 1 GPa, Wu = 3 mN, = 10 GPa-1. and are the dynamic viscosity and pressure viscosity
coefficient of the lubricant. R’ and E’ are the reduced radius and reduced Young’s modulus defined
respectively as 1/R’ = 1/R1x + 1/Rx2 and 2/E’ = (1-12)/E1+(1-2
2)/E2. The Young’s modulus and
Poisson’s ratio of the cellulose fibre were taken to be 400 MPa and 0.45 while those of the steel
counterface were 200 GPa and 0.3. The load on the contact unit was estimated as follows.

174
The applied load in the screener test is W = 3 N. This acts on an overall ball on disc contact area of
radius, a = 570 m. (This was calculated from Hertz theory based on the Young’s modulus of the disc
being that of the composite bulk, E = 120 MPa, but was also very close to that measured
experimentally). The nominal mean pressure is thus W/a2 = 2.9 MPa. The fractional true area of the
contact was taken to be 0.05, based on work in Chapter 4. Thus the mean contact unit pressure is 58
MPa. From this, the contact unit load can be calculated from Hertz theory to be 3.06 mN while the
Hertzian flat radius au = 4 m. This estimate is clearly approximate and in practice there will be a
range of contact unit loads. However the lower elastic modulus of the substrate should ensure
reasonably even load sharing.
Figure 10.4 shows the location of this lubricated contact on the hydrodynamic regime map. A blue
line is shown to represent the range of speeds covered. It can be seen that the contact lies in the
isoviscous-elastic regime but quite close to the border with the piezo-viscous regime.
Figure 10.4: EHL lubrication map [131], indicating the regime of the contact unit lubrication regime
This indicates that the contact unit fluid lubrication regime is isoviscous-elastic. In this case, the
central film thickness for a point contact is given by [131]:
1.0E-05
1.0E-03
1.0E-01
1.0E+01
1.0E+03
1.0E+05
1.0E+07
1.0E+09
1.0E+11
1.0E+13
1.0E-05 1.0E-02 1.0E+01 1.0E+04 1.0E+07 1.0E+10 1.0E+13
Gv
Ge
Piezoviscous-rigid
Isoviscous-elastic
Isoviscous-rigid

175
22.064.0
3.3'
WUR
hc
Equation 10.6
and the friction coefficient can be estimated from [132]:
11.036.076.071.070.065.0
96.08.346.1
WUWUSRRWUtotal Equation 10.7
where
'' RE
UU
Equation 10.8
2'' RE
WW
Equation 10.9
The isoviscous elastic theory is used along with the above values to predict the central film thickness
(Figure 10.5) and friction coefficient (Figure 10.6) of the single contact unit, over a range of sliding
speeds.
Figure 10.5: The calculated central film thickness for a contact unit, using isoviscous-elastic theory
0
1
2
3
4
5
6
7
0 0.5 1 1.5 2
Film
Th
ick
ne
ss
(n
m)
Sliding Speed (m/s)
hc

176
Figure 10.6: The calculated friction coefficient for a contact unit, using isoviscous-elastic theory
The film thickness predicted using these assumptions is below 8 nm. The surface roughness of the
steel counter surface in the MTM is ~ 10 nm. Thus under these conditions, the predicted lubrication
regime is boundary/mixed. The predicted maximum friction coefficient, assuming isoviscous-elastic
hydrodynamic lubrication, is less than 0.02 and much lower than that measured in a wet clutch. Also
the gradient of the friction versus speed curve is greater than that exhibit by a wet clutch system. The
predicted slope of the versus v curve differs from that found experimentally, where a = kv0.01
relationship was observed in Chapters 7 and 8. The slope of the versus v curve shown in Figure
10.6, follows the equation µ = 0.019v0.368.
10.2.5.1 Possible piezoviscous contribution
The location of the contact unit conditions on the lubrication regime map suggests that the contact
units would operate in isoviscous EHL rather than piezoviscous EHL but is close to the piszoviscous
region. It is thus possible that there may be a slight piezoviscous effect on friction within the contact
itself. The mean pressure within the contact units is ~ 58 MPa. Assuming a Barus [133] exponential
dependence of viscosity on pressure with a pressure viscosity coefficient, of 10 GPa, this suggests
0.00
0.05
0.10
0.15
0.20
0.25
0 0.5 1 1.5 2
Fri
cti
on
Co
eff
icie
nt
Sliding Speed (m/s)
μ
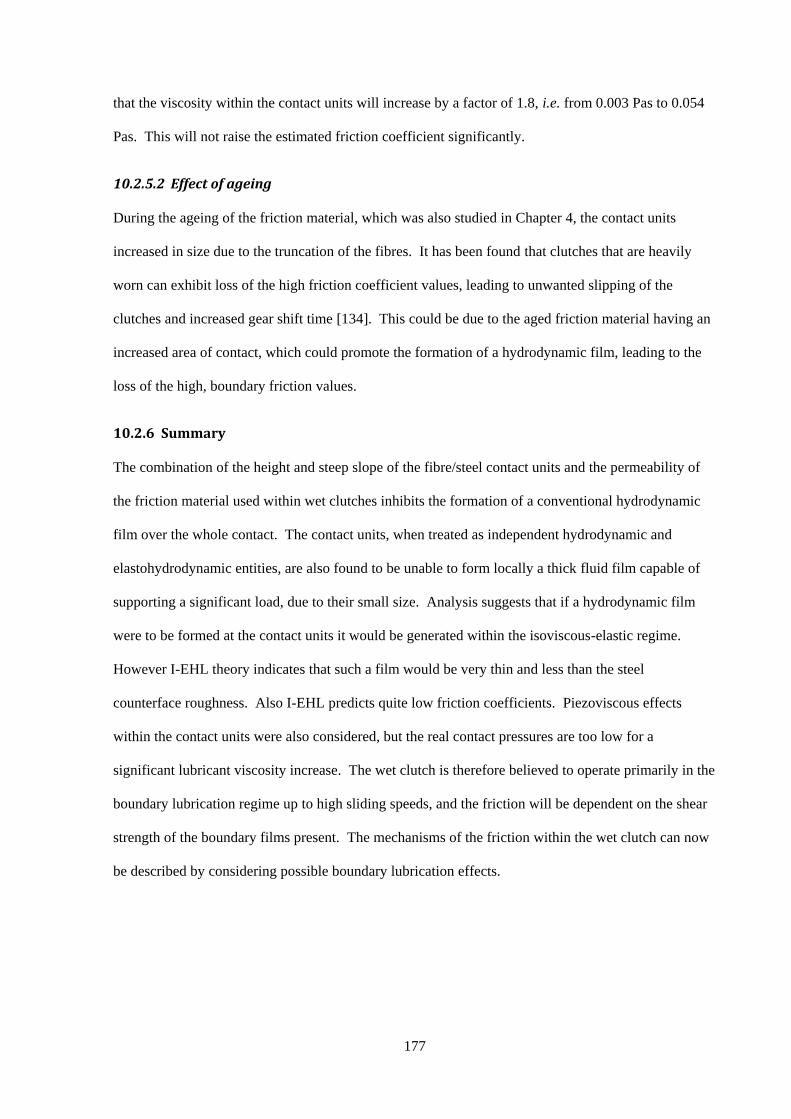
177
that the viscosity within the contact units will increase by a factor of 1.8, i.e. from 0.003 Pas to 0.054
Pas. This will not raise the estimated friction coefficient significantly.
10.2.5.2 Effect of ageing
During the ageing of the friction material, which was also studied in Chapter 4, the contact units
increased in size due to the truncation of the fibres. It has been found that clutches that are heavily
worn can exhibit loss of the high friction coefficient values, leading to unwanted slipping of the
clutches and increased gear shift time [134]. This could be due to the aged friction material having an
increased area of contact, which could promote the formation of a hydrodynamic film, leading to the
loss of the high, boundary friction values.
10.2.6 Summary
The combination of the height and steep slope of the fibre/steel contact units and the permeability of
the friction material used within wet clutches inhibits the formation of a conventional hydrodynamic
film over the whole contact. The contact units, when treated as independent hydrodynamic and
elastohydrodynamic entities, are also found to be unable to form locally a thick fluid film capable of
supporting a significant load, due to their small size. Analysis suggests that if a hydrodynamic film
were to be formed at the contact units it would be generated within the isoviscous-elastic regime.
However I-EHL theory indicates that such a film would be very thin and less than the steel
counterface roughness. Also I-EHL predicts quite low friction coefficients. Piezoviscous effects
within the contact units were also considered, but the real contact pressures are too low for a
significant lubricant viscosity increase. The wet clutch is therefore believed to operate primarily in the
boundary lubrication regime up to high sliding speeds, and the friction will be dependent on the shear
strength of the boundary films present. The mechanisms of the friction within the wet clutch can now
be described by considering possible boundary lubrication effects.

178
10.3 Thin viscous films and solid-like films
It has been shown above that the contact units in a wet clutch operate in the boundary lubrication
regime. The question of prime interest is what type of boundary film is present? There are two
possibilities. One is that the film is a “solid-like” adsorbed/reacted film; the other is a highly-viscous
surface film. Each of these alternatives is discussed below, in the context of the experimental
friction/speed results. The boundary film model of choice must satisfy the observation that friction
increases with speed and that certain additives reduce friction while others increase it.
10.3.1 Highly viscous surface film
The principle attraction of the viscous film model is that it is well known that in hydrodynamic
lubrication, friction increases with sliding speed. However in conventional hydrodynamic lubrication,
until thermal effects become significant, the coefficient of friction increases with the square root of
sliding speed and in I-EHL, with sliding speed raised to the power of 0.4. Both of these are much
larger than the friction/speed dependence seen in the current work. It has already been shown that
thermal effects are not significant. Also, conventional hydrodynamic lubrication and I-EHL generally
give very low friction coefficients, much less than the 0.1 to 0.15 range seen in the current work.
One possible way to explain the low friction/speed dependence and the high value of hydrodynamic
friction is to suppose that a very thin, highly viscous boundary film is formed on one or both surfaces,
having a very rapid fall-off in viscosity away from the surfaces. Such a film might provide the high
friction measured (because of its high viscosity) but be unable to generate a thick hydrodynamic film
(since this is curtailed by the rapidly-reducing viscosity as speed and thus separation increases).
A preliminary analysis was carried out to explore this possibility.
Dowson showed in 1962 [135] how Reynolds equation can be extended to allow for viscosity to vary
through the thickness of the film and his approach has more recently been applied by Qingwen [136].
The derivation is given in Appendix A and yields equations quite similar to the conventional Reynolds
equation and the corresponding shear stress equation at the surface;

179
oh
ozs
J
J
xu
y
pJ
yx
pJ
x Equation 10.10
ohh
hzx
J
u
J
J
x
p 1
0
10
Equation 10.11
where;
oh
hozohz
J
JJJJJ 11
Equation 10.12
and dzJh
h 0
01
, dz
zJ
h
h 0
1
, h
o
z
ooz dzdhJ
1 h
o
z
oz dzdh
zJ
1
Equation 10.13
With the assistance of Professor Spikes, equations 10.10 and 10.11 were solved using a finite
difference approach with a rectangular grid, for flat surface sliding against a flattened sphere to obtain
fluid pressures and thus film thickness and friction. The conditions were similar to those used in the
lubrication regime calculation above, i.e. R’ = 15 mm, Wu = 0.003 N, au = 4 μm, = 0.003 Pas. From
this, the impacts of friction of various different surface viscosity gradients were explored. The
presumed relative viscosity profiles used in this analysis are shown in Figure 10.7. (Relative viscosity
is viscosity divided by the viscosity of the bulk fluid a long distance from the surfaces, i.e. = 0.003
Pas).

180
Figure 10.7: The relative viscosity profiles used in the viscous thin-film analysis
Figure 10.8 and 10.9 show three typical solutions for film thickness and friction coefficient, for each
of the viscosity/distance profiles, with the isoviscous case included for comparison.
Figure 10.8: The calculated film thickness using an extended Reynolds equation
0
200
400
600
800
1000
0 1 2 3
Re
lati
ve
vis
co
sit
y
Distance from surface, nm
step
linear
exponential
0
1
2
3
4
5
6
0 0.1 0.2 0.3 0.4 0.5
Film
th
ick
ne
ss
(n
m)
Sliding speed (m/s)
steplinearexponentialisoviscous

181
Figure 10.9: The calculated friction coefficient using an extended Reynolds equation
From this work it was not found possible to reproduce the form of the friction/speed results obtained
experimentally. The friction/speed relationship calculated for the step and linear viscosity profiles
have high friction at lower speeds, which drops off sharply above ~ 0.02 m/s, when the calculated film
thickness is 2.2 and 2.7 nm respectively. This is caused by the sharp reduction of shear strength, as
the film thickness exceeds that of the viscous layer. Thus this viscous layer can lead to higher friction
values at low speeds, but this effect is soon lost when fluid entrainment exceeds the film thickness.
An interesting observation is that the step and linear friction results (Figure 10.9) produce a pseudo
Stribeck curve, in which the “boundary” region is characterised by the high friction produced due to
the shearing of the viscous layer. When the film thickness is greater than the thickness of the viscous
layer, the friction is lower, and is governed by hydrodynamic effects. This can be seen more clearly
on a log/log plot of the same results (Figure 10.10).
0
0.01
0.02
0.03
0.04
0.05
0.06
0 0.1 0.2 0.3 0.4 0.5
Fri
cti
on
Co
eff
icie
nt
Sliding speed (m/s)
steplinearexponentialisoviscous
182
Figure 10.10: Graph showing the pseudo "Stribeck" curve on a log/log plot of friction coefficient versus sliding speed
This result, although novel, indicates that the wet clutch friction characteristics cannot be attributed to
a viscous film on the surfaces, which has been suggested by some authors [39, 53, 54, 137, 138]. The
friction characteristics seen experimentally are very different to those in Figure 10.10.
One limitation of the above approach is that it treats the contact as isoviscous-rigid rather than
isoviscous-elastic although the use of a flattened sphere might be considered to represent a quasi-
Grubin approach. It would be quite feasible, though time-consuming, to combine varying viscosity
through the film thickness with an isoviscous-elastic solution but this was not attempted in the current
work, not least because the alternative boundary lubrication model to be described in the next section
appears to explain the observed friction/speed measurements quite effectively.
10.3.2 Solid-like adsorbed film
The alternative possible model is that an adsorbed/reacted boundary film is formed on the rubbing
surfaces, and the friction is controlled by the shearing of this layer. This is consistent with the levels
of friction measured at very low speeds but does not, at first sight, explain the observed friction/speed
behaviour.
0.0001
0.001
0.01
0.1
1
0.001 0.01 0.1 1
Lo
g f
ric
tio
n c
oe
ffic
ien
t
Log sliding speed (m/s)
step
linear
isoviscous

183
However careful examination of the literature shows that a number of authors have measured and
reported that the friction of adsorbed boundary films increases with speed.
The shear stress properties of solid-like, amphiphilic boundary films have been studied by Briscoe
[105] and more recently by Chugg [139]. Such boundary films can be formed by deposition of
Langmuir-Blodgett films or by adsorption of FM-type molecules from solution. The latter molecules
adsorb onto solid surfaces, forming self-assembled layers, with strong lateral intermolecular forces.
The boundary films are thus resilient, prevent asperity contact and provide a low shearing interface at
the methyl terminating groups.
Briscoe [105] investigated the dependence of shear strength on sliding speed for boundary films
formed by stearic acid and Chugg [139] studied the shear strength/speed behaviour of boundary films
formed by dioctadecyl dimethyl ammonium chloride (TA100). TA100 is an additive used in fabric
softeners to reduce friction between cloth fibres. Reproductions of results of these two authors are
shown in Figures 10.11 and 10.12.
Figure 10.11: Shear strength versus sliding speed results from Briscoe [105]

184
Figure 10.12: Shear strength versus sliding speed results from Chugg [139]
Both authors report that the shear strength of the adsorbed solid-like boundary films increased with
sliding speed. The relationship between the shear strength of the boundary film and the sliding speed
was shown by Briscoe [105] to follow the relationship:
vBA ln Equation 10.14
at constant temperature and pressure, where A and B are constants dependent on the properties of the
solid-like boundary film, and v is the sliding velocity. The constant B which represents the slope of
the shear stress versus log (sliding speed) plots is typically 0.06 to 0.12. Briscoe showed that equation
10.14 can be derived from Eyring’s model for thermally activated rate processes in fluid flow [139-
141], which can be simply understood by considering the rate of molecular rearrangement of the
adsorbed film as follows:
When two surfaces with adsorbed layer of densely packed FM-type molecules slide relative to one
another under load, the sliding will occur between the methyl groups on the end of the alkyl chains of
the FMs. There will be some interpenetration between the two FM layers, so for the molecules to slide
past each other, they will do so by minimizing the repulsive interactions between the approaching
molecules. The molecules may minimize the repulsive forces by translational, rotational and
conformational configuration changes [142]. At higher speeds the molecules have less time to change

185
their configurations, so the intermolecular repulsive forces between the sliding layers are increased.
This leads to higher shear strength of the boundary films with increasing speed.
Assuming sliding occurs between the FM boundary films adsorbed onto both surfaces, the friction is
dependent on the shear strength and the real area of contact according to the equation:
cAF Equation 10.15
where F is the friction, Ac is the real area of contact and τ is the shear strength of the boundary film.
Thus the friction and friction coefficient will also depend on sliding speed according to Equation
10.14.
The studies by Briscoe and Chugg discussed above were carried out at very low sliding speeds to
prevent the formation of a hydrodynamic film on the very smooth surfaces used. However it follows
that if a contact were to remain in the boundary lubrication regime to higher speed, the shear strength
would continue to follow the above dependence on speed, at least until thermal effects became
significant. Thus for the wet clutch contact, composed of many small, independent contact units,
which cannot generate a significant fluid film, the friction-speed behaviour will be governed by the
shear strength-speed dependence of the boundary films.
Frictional heating of the lubricated units was shown in Chapter 5 to be minimal up to 1 m/s, and the
pressure on the contact units can be assumed constant, thus the friction coefficient should depend on
the equation:
. suBA ln11 Equation 10.16
The shear strength of the boundary films formed on the contact units within the experiment in Chapter
8 can now be estimated, by assuming the real area of contact is 5 % of the nominal contact area. This
is plotted against the natural logarithm of sliding speed in Figure 10.13 for two model friction
modifiers; dodecanoic acid and stearic acid.

186
Figure 10.13: Graph of the approximate shear strength versus the natural logarithm of sliding speed for a wet clutch
lubricated with three model friction modifiers
It can be seen that same relationship as shown by Briscoe [105] between shear strength and the
logarithm of sliding speed is seen in these results from the wet clutch condition. Since friction in a
wet clutch follows the same F α lnv relationship as seen at low speeds in boundary lubrication, it
seems highly likely that the friction within the wet clutch, in the presence of a FM is controlled by the
activated shearing mechanism of the adsorbed FM layers. It is surprising that this mechanism has not
yet been mentioned in the wet clutch/ATF literature.
Friction modifier type additives produce the positive gradient µ-v curve, and the friction curve is
translated up or down depending on the effectiveness of the FM. The constant A (Equation 10.14) is
thus dependent on the “effectiveness” of the boundary film, while B (Equation 10.14) remains fairly
constant for most FMs studied in this thesis (and most friction/sliding speed results found in the
literature).
The shear strength of solid-like layers is also dependent on pressure and temperature. The relationship
between shear strength of the solid-like layers and temperature has been shown by Briscoe [105] to
follow the equation:
y = 0.788lnx + 11.69
y = 0.785lnx + 10.69
0
2
4
6
8
10
12
14
-5 -4 -3 -2 -1 0
Ap
pro
xim
ate
Sh
ea
r S
tre
ng
th (
MP
a)
ln Sliding Speed (m/s)
C 12 acid
C18 acid

187
T '
0 Equation 10.17
at constant speed and pressure, where β and τ0’ are constants, depending on the properties of the solid-
like layer. The same linear relationship was found for the two model friction modifiers, dodecanoic
acid and stearic acid, using the friction screener and the following conditions: 0.01 m/s sliding speed,
3 N load, standard testing specimens, between ambient and 100 °C. The friction measured has been
converted into approximate shear strength of the layers, by assuming the real area of contact is 5 % of
the nominal contact area (Figure 10.14).
Figure 10.14: Variation of the shear strength of the films formed by dodecanoic and stearic acid in the wet clutch
friction screener.
The flash temperatures measured in Chapter 5 indicate a rise of ~2 °C at the contact units during
sliding. These moderately low increases in temperature during sliding are not expected to greatly alter
the shear strength and therefore the friction, of the solid-like films within a wet clutch.
y = -0.029x + 11.61
y = -0.029x + 10.39
0
2
4
6
8
10
12
0 20 40 60 80 100 120
Ap
pro
xim
ate
Sh
ea
r S
tre
ng
th (
MP
a)
Temperature (°C)
C12 acid
C18 acid

188
10.3.3 High friction boundary film
The above insight as to the origins of the positive friction speed behaviour in wet clutches can now be
extended to help understand the increase in friction seen with the addition of dispersant and detergent
molecules.
As shown in Chapter 8 using model compounds, the friction/speed curve can be translated up or down,
dependent on the ability of the FM to form a well-ordered, solid-like boundary film. This translation
involves changes to the constant A, while B (the gradient) remains constant for most FMs. In Chapter
8, the addition of species with a different chain length was found to increase A, as did an overall
reduction in chain length. Dispersants and detergents can be added to a wet clutch lubricating fluid
along with FMs to increase the overall friction value. The dispersants and detergents are sometimes
called “friction enhancers”. Based on the new model, they probably increase friction by adsorbing
onto the surfaces to partially disrupt the FM boundary film, increasing its irregular nature and
increasing the overall shear strength and thus the constant A (Figure 10.15).
2 m/s
Fri
ctio
n
FM
FM + Disp/Det
Sliding Speed (m/s)
Figure 10.15: Representation of the friction coefficient variation with sliding speed for a friction
modifier solution and a friction modifier + friction enhancer solution

189
The dispersants and detergents molecules are much larger than FM molecules, and so, if a combined
boundary film is formed, the dispersant and detergent will protrude out of the thinner FM layer,
increasing stearic repulsion of the sliding layers thus increasing the shear strength of the films.
A simple hypothesis of the effect of adding dispersants and detergents to a FM-dominated boundary
film is given by the following diagrams. The friction modifier boundary film will provide a low shear
strength interface between the terminal methyl groups, and thus reduce friction (Figure 10.16). The
shear strength of the film is dependent on the sliding speed, following the activated shearing
mechanism.
Figure 10.16: Representation of two flat surfaces separated by a friction modifier monolayer
When a dispersant or a detergent is added to the friction modifier film, the large tail groups will
protrude out of the FM boundary film layer, disrupting the low shear strength interface (Figure 10.17
and 10.18).
Figure 10.17: Representation of a friction modifier film incorporating a large dispersant molecule
Figure 10.18: Representation of a friction modifier film incorporating a large branched detergent molecule

190
The friction modifier molecules have a large affinity for the surface, and thus will dominate the
surfaces and the friction behaviour within wet clutches. With the addition of large molecules such as
dispersants and detergents, the film will become disrupted and irregularities will exist that increase the
shear strength of the boundary film. This accounts for the shift in the overall friction characteristics
upon the addition of a dispersant/detergent to a FM solution.
Although FM molecules will dominate the surface coverage due to their high affinity for surfaces, at
very high relative concentrations of dispersants and detergents the desirable positive gradient friction
versus speed slope may be lost [58,101], resulting in poor clutch performance. Thus the overall
friction value (following the constant A), cannot be increased indefinitely. At some concentrations of
FM/dispersants/detergents mixtures, the boundary film will no longer be dominated by the FM solid-
like boundary film, but will be more disordered due to the presence of a high concentration of large
dispersant/detergent molecules so the activated shearing model will no longer be observed.
10.3.4 Deviations from the model
The activated shearing model can account for the vast majority of results discussed within this thesis,
but two results show a different trend. These will now be discussed. With oleic acid and, some ratios,
of C6/C12 blends, a reversal of the friction/speed trend is seen, whereby friction decreases with sliding
speed. This effect has also been observed by Briscoe [105]. This effect is presumably due to the
boundary films formed by these model FMs not forming a solid-like boundary film and/or not
providing an ordered, homogeneous film thickness shearing interface between the terminal methyl
groups on opposite surfaces.
Oleic acid has been shown to have a “U” shaped molecular configuration in some low energy
configurations [118], and may therefore fail to form a well-ordered, dense boundary film. By contrast,
the trans isomer, elaidic acid, which has a more linear configuration will form such a well-ordered
film. For the case of the mixture of FM molecules with different chain lengths, at some concentrations
of C6/C12 mixtures a mixed size monolayer may be produced, which will promote a large amount of
interpenetration between the sliding layers. This may not have the same friction relationship with

191
sliding speed as a homogenous thickness boundary film, due to the different nature of the sliding
interface.
Thus, those FMs that cannot form an ordered, solid-like boundary film with a homogeneous film
thickness, will not exhibit the activated shearing mechanism, and show a negative gradient µ-v curve,
similar to that of the base oil.
At sliding speeds above 0.6 m/s, the model FMs show a deviation away from the F α lnv trend, as the
friction becomes constant. The reasons for this could be:
(i) Frictional heating of the surfaces at these higher speeds
(ii) The onset of the formation of a thin lubricant fluid film, separating the surfaces
The frictional heating of the contact units has been studied experimentally in Chapter 5. The flash
temperatures on the contact units were found to be approximately 2 °C at sliding speeds above 0.4
m/s, and mean contact unit pressures of 51 MPa. The frictional heating at higher pressures will be
greater, and this may lead to the reduction of the shear strength of the boundary film. But under the
conditions employed in the friction screener, where contact unit pressures are approximately 90 MPa,
the flash temperature are not expected to significantly alter the shear strength of the boundary film.
At higher speeds, a thin viscous fluid film may start to form at the contact units, and partially separate
the surfaces. The lubrication regime may therefore become mixed boundary/hydrodynamic and the
load may be partially supported on some units, reducing the pressure on the boundary films. The
shear strength of solid like boundary films will decrease with decreasing pressure, leading to a
reduction of the friction. However initial calculations suggest this is unlikely for the pressures
experienced at the contact units. To fully understand this condition, the film thickness at the contact
units should be measured over a range of speed. Further work is therefore required to clarify the
friction behaviour in the higher speed range, between 0.6 and 2 m/s.

192
10.3.5 Friction-speed behaviour of dry contact
The dry wet clutch contact was shown to give the same positive gradient slope exhibited by lubricated
wet clutches with FMs (Figure 9.7). This has also, surprisingly, not been noted in the ATF literature
where the “base line” result against which additive effects are compared is nearly always the base oil
lubricated wet clutch. As has been shown in Figure 9.4, the dry wet clutch and the base oil lubricated
wet clutch give opposite friction versus speed results. The reason for this has not been explored.
The dry wet clutch should follow the activated shearing mechanism, due to the friction material
composition being primarily polymeric materials. Polymers have been shown by several authors to
give a shear strength that increases with sliding speed [143-145], following a similar τ α ln v
relationship as adsorbed monolayers. In a wet clutch, the shearing will first occur between the outer
phenolic resin on the fibres and the steel. During the sliding and wear process, phenolic resin (and
other friction material composites) will be transferred to the steel surface, and so the dry wet clutch
sliding interface will be steel-on-polymer and polymer-on-polymer. Thus the friction behaviour in the
dry condition can be also attributed to the activated shearing mechanism.
Once the wet clutch is lubricated with a base oil, the static friction increases, and a negative gradient
µ-v curve is produced, this can be attributed to wetting effects, and is discussed in the next section.
10.3.6 High static friction with base oil
In Chapter 9 it was noted that, while a dry wet clutch contact gives a positive gradient µ-v curve, the
addition of a base oil acted to increase the static friction, and produced a negative µ-v curve (Figure
10.19). This high static friction has been noted by Eguchi [146] and Tipton [147], although its origin
has not been fully discussed. In this section the high static friction imparted by the base oil can be
discussed with reference to wetting effects.

193
The increase of the static friction of a wet clutch when lubricated with a base oil may be due to the
introduction of capillary bridges between the surfaces. This surface wetting effect is known to
increase the friction in lightly-loaded rough surfaces [123], by increasing the actual load between the
surfaces and thus the friction. Also, once formed, the wetting lines, which comprise the
solid/liquid/gas boundary, will require energy to move during sliding [148].
This effect is discussed more fully below, by first introducing the theory of surface wetting and then
applying this to the wet clutch model.
The contribution of capillary bridges to the actual load on the contact units can be calculated by
considering the Laplace pressure. The Laplace pressure is the difference in pressure between the
inside and the outside of a liquid droplet. This difference in pressure is caused by the surface tension
at the liquid/gas interface, where cohesive forces between liquid molecules at the liquid/gas interface
are unequal to those in the bulk of the liquid. This phenomenon is responsible for the spherical shape
formed by liquid droplets, and can also act to pull lubricated surfaces together. The Laplace pressure
across the air-liquid interface between two surfaces is approximated by:
0.15
Fri
ctio
n C
oeff
icie
nt
2 m/s Sliding Speed
0.25
Dry
Base oil
Figure 10.19: Representation of the friction coefficient variation with sliding speed for a dry and a
base oil lubricated wet clutch

194
)coscos( 21
h
p LV (Equation 10.18)
for very thin films [149], where γLV is the interfacial tension of the liquid-air interface, h is the film
thickness and θ is the contact angle of the liquid-solid interface on both surfaces (Figure 10.20).
Figure 10.20: A 2d representation of a wetting liquid between two solid surfaces
In a contact of area Ar, the load support by the capillary effect can be given by:
)coscos( 21 h
AW r
LV (Equation 10.19)
Wetted surfaces with a liquid-solid contact angle of θ < 90° act to pull the surfaces together and
increase the load in a contact, whereas non-wetted surfaces with liquid-solid contact angles of θ < 90°
can reduce the load in the contact by pushing the surfaces apart.
The additional contact force resulting from the base oil meniscus in a sphere on flat contact can be
estimated using the following model:
Consider a lubricated ball on disk configuration, as shown in Figure 10.21.
195
The additional contact force formed by the lubricant meniscus is given by [123]:
)cos(cos2 21 RW Equation 10.20
Where R is the radius of the sphere, γ is the surface tension of the liquid and θ1 and θ2 are the contact
angles of the liquid on the two surfaces. If the contact angles are small Equation 10.20 simplifies to
RW 4 Equation 10.21
Thus if γ = 30x10-3 J/m2 and R = 10 mm, W is found to be 3.7 mN.
The contact area actually consists of many contact units, and meniscus bridges may form at and
around these discrete points. The number of contact units in the ball on disk configuration used in the
friction screener test can be estimated as follows:
The Youngs modulus (E) of the friction material is ~120 MPa, the radius of the steel ball is 10 mm and
the applied load is 3 N. The contact radius, a, can be calculated from Equation 10.22:
3/1
*4
3
E
WRa Equation 10.22
and is found to be 0.57 mm. The nominal contact pressure is then 2.93 MPa.
R
Ball
Disk
h Lubricant
Figure 10.21: Diagram of the lubricant meniscus formed between a ball and a disk

196
In Chapter 4, the real area of contact at 2.9 MPa was found to be 3 % of the nominal area. So the
mean pressure at the contact units is approximately 98 MPa.
Figure 4.18 suggests that the average contact area of a contact unit is ~ 150 μm2, therefore the load on
each contact unit = 98x106 x 150x10-12
= 0.0147 N.
Hence there are 3/0.0147 = 204 contact units supporting the load.
Now consider the meniscus bridges formed between the fibres of the friction material, and the
relatively flat steel countersurface, shown schematically in Figure 10.22.
The reduced modulus can be calculated with knowledge of the Youngs moldulus and poisson ratio of
the fibres (80 GPa, 0.3) and the steel, and is found to be 64 GPa.
The effective radius of each contact unit can then be calculated using:
W
aER
3
4 3*
Equation 10.23
0147.03
)108.13(10644 369
= 0.0152 m or 15 mm
This is much larger than the fibre radius seen in Figure 4.3, which is approximately 20 μm. The
discrepancy may be attributed to the elastic deformation of the contact units to give a larger effective
Fibre Meniscus
Steel ball
Figure 10.22: Diagram of the meniscus bridges formed between the friction material fibers and the steel ball

197
radius. Now use Equation 10.21, to calculate the additional force on each contact unit by a lubricant
menisciscus.
310300152.044 R
= 5.7 x 10⁻³ N
Then multiply by the number of contact units (204), so W = 1.16 N. This is the total additional load on
the contact. Thus the actual total load in the friction screener test is 3 N (applied) + 1.16 N (meniscus)
= 4.16 N. It is therefore possible that this additional force can increase the friction of the wet clutch
contact in the low speed range.
A plasma cleaning procedure was used in Chapter 9, to alter the wetting properties of the friction
material. After plasma cleaning the friction material disk, the contact angle between the fibres and a
hydrocarbon lubricant will increase, which will lead to a reduction of the meniscus force, and the
actual load (Figure 10.23).
After plasma cleaning the friction material, the base oil lubricated friction is reduced in the lower
speed range (Figure 9.8). This may be due to the reduced meniscus force between the surfaces,
resulting in a lower induced additional load between the surfaces and therefore a lower measured
friction coefficient.
Figure 10.23: Diagram of the contact angle between a fibre and the steel surface, before (a) and after (b)
the plasma treatment
Steel
Lubricant
Fibre cross section
(a) (b)

198
When the plasma cleaned disk is lubricated with a fully formulated ATF (Figure 9.10), there is no
observed change in the measured friction over the entire speed range. The additives present in the
ATF (predominantly the FM) will continue to adsorb onto both surfaces, increasing the oleophilicity.
This will reduce the contact angle between the surfaces and the boundary film [150]; the surfaces will
continue to be drawn together by the meniscus, but the low shear strength of the boundary film will
decrease the friction overall, although the shear strength of the boundary film may change due to the
increased pressure.
Another effect that may be taking place is that the energy needed to move the wetting line may
increase the low speed friction. This moving wetting line problem is an interesting topic of current
investigation [151-153], and is not yet fully understood, although some of the basic theory can be used
to understand the wet clutch phenomenon. A wetting line, which is the boundary of the
solid/lubricant/air junction, will require a force to move during sliding, as this requires the contact
angle to change from the stable, static contact angle, to a dynamic contact angle [148]. The force
required to move the wetting line is given by the equation:
LF DSw )cos(cos Equation 10.24
where θS is the static contact angle, θD is the dynamic contact angle and L is the wetted line length.
The dynamic contact angle is dependent on the speed of the wetting line [152].
If we assume all contact units are circular with a 10 µm diameter, and that the wetting line occurs
around the unit as a circle with a 40 µm diameter. θs = 0, θD = 10 and L = 1.26 x 10⁻⁴ m, a force of
6.93 x 10⁻⁶ N is required to move the wetting line out of equilibrium. This can then be multiplied by
the number of contact units in a particular contact to give the total force due to the moving wetting
line. If 60 contact units exist surrounded by a 40 µm diameter wetted area, the total force due to the
moving wetting line is 4.16 x 10⁻⁴ N.
In a wet clutch at low speeds, the capillary bridges will be well defined, and may translate across the
steel surface, remaining on the outside of the contact units formed on the friction material fibres, thus

199
the friction may be increased by the moving wetting line effect. At higher speeds, the capillary
bridges will be less well defined, due to the churning of the lubricant in the contact and possibly by
filling of the contact, so wetting effects will then be reduced.
Thus the high friction at low speeds of a oil wetted wet clutch contact can be attributed to the capillary
bridges formed between the two surfaces. These increase the pressure on the contact units and also
require energy to move.
10.4 Summary
In this chapter the lubrication of the wet clutch has been clarified. A separating “bulk” hydrodynamic
film does not form during sliding, since the fluid pressure is prevented by the porosity and the high
roughness of the surfaces. Although a bulk lubricant film cannot be formed, a local separating film
might form at the contact units. Using a simple hydrodynamic analysis it was shown that a surface
made up of small contact units is only able to generate much thinner hydrodynamic films than a
smooth surface. The lubrication analysis of the contact units was extended and showed that, if a fluid
film were present, it would lie in the iso-viscous elastic lubrication regime [131]. In this case, the film
thickness was found to remain below 4 nm over the speed range of interest, up to 1 m/s. The
roughness of the counterface steel surface is ~ 10 nm, thus the lubrication regime will remain in the
boundary/mixed regime. The friction coefficient was also calculated using this theory and was found
to be too low, and not to follow the friction/speed gradient seen experimentally in this work.
Boundary lubrication should therefore dominate the wet clutch contact, and this was studied assuming
both a highly viscous surface film and a solid-like boundary film. Some analysis of the lubrication of
a contact unit assuming fluid viscosity that varies with distance from the solid surfaces indicated that
the presence of a viscous film does not explain the observed friction-speed behaviour. However the
observed friction/speed behaviour does accord closely with that seen with studies of solid-like
deposited and adsorbed monolayers and explained in terms of an activated shear model. This gives
the relationship:

200
vBAA
F
c
ln Equation 10.25
where B ~ 0.06 - 0.1. F is the friction force, Ac is the real area of contact, v is the sliding speed and A
is the “effectiveness” of the boundary film.
The results presented in Chapters 7, 8 and 9 can then be discussed in terms of this equation and the
activated shearing mechanism of solid-like films formed by FM-type chemicals. The constant A is
dependent on the ability of the FM to form a friction-reducing layer. Less effective FMs have higher
values of A. This can also be evoked by the addition of large dispersant and detergent molecules
which can disrupt the low shear strength film, increasing the resistance to shear, the value of A and the
measured friction.
The high static friction coefficient that exists within a wet clutch when lubricated with just a
hydrocarbon base oil can be attributed to wetting effects. These wetting effects consist of both the
increased pressure on the contact units when capillary bridges pull the surfaces together, and the
energy required to move the wetting line at the solid/liquid/gas interface.

201
11 .
Chapter 11
Conclusions and further work
This chapter presents conclusions that can be drawn from the research described in this thesis.
Suggestions are made for work which can be carried out to support and continue the research into wet
clutch friction.
11.1 Introduction
This thesis contains the details of an experimental study that was carried out to further our
understanding of wet clutch friction characteristics. Up to the present, the mechanisms of the
generated friction within a slipping wet clutch are not fully understood. A tribological investigation
has therefore been carried out to clarify the lubrication regime, the wetting properties and the shear
strength of the boundary films within wet clutches.
11.2 Experimental study
The experimental study has included three primary techniques. A contact visualisation technique has
been used to study the contact condition of the wet clutch. This indicates that the contact consists of
many tiny, widely-spaced, individual contact units, of size typically 5 to 20 microns radius. The total
202
real area of contact is typically 5 % of the nominal area. This implies real, mean pressures in the
contact units of typically 50 MPa. The flash temperature study showed that the temperature rise in the
contact units during sliding is not significant, and will therefore not significantly alter the friction
characteristics of the slipping wet clutch up to speeds of ~ 1 m/s. These findings enable estimation of
the potential hydrodynamic lubrication regime and suggests this would be the isoviscous
elastohydrodynamic lubrication.
A specially-developed friction screener was used to study the friction characteristics of a wet clutch
type contact over a large range of conditions. This was used to study the effects of individual
additives, additive blends, a range of temperatures and different treated surfaces. The boundary
lubrication effects were then discussed with reference to the results obtained with this rig.
11.3 Friction mechanisms
The theoretical hydrodynamic film thickness in the range of contact conditions tested was estimated to
be 1 to 7 nm. This is much less than the roughness of the steel counterface so it was concluded that
the prevailing lubrication regime is boundary lubrication. The possibility of a highly-viscous surface
film being present was explored and discounted, indicating the presence of a classical, solid-like
adsorbed boundary film. The lack of a significant fluid film is largely due to the geometrical
restrictions on the generated pressure at the contact units, which are too small to support a significant
load.
The friction characteristics were found to be strongly dependent on the nature of the solid-like films
formed by chemical additives on the sliding surfaces. FM type additives give a positive gradient
friction versus log(sliding speed) curve, which maintains the same gradient and is translated to higher
or lower friction values (the constant A) depending on the “effectiveness” of the film. This friction-
speed behaviour was compared to, and found to be fully consistent with, early studies of the influence
of sliding speed on friction of absorbed and deposited monolayers at very low speeds and explained by
an activated shear model. In this model, shearing occurs between terminal methyl groups, and the
shear strength is dependent on the sliding speed due to the activated shearing mechanism. At low

203
sliding speeds, the boundary film molecules have sufficient time to change their configuration to
reduce repulsion of approaching molecules on opposing surfaces. At higher sliding speeds, the shear
strength of the boundary films increases, as the molecules have less time to alter their configuration to
that of minimal repulsion. Thus the friction is controlled by the shear strength of the boundary film,
which in turn is dependent on the sliding speed.
This addition of large molecules such as dispersants and detergents to the FM film, increases the
overall shear strength of the boundary film. This may be because these molecules protrude from the
ordered surfactant layer and increase repulsion during sliding.
When the wet clutch is lubricated with a base oil, a high static friction coefficient exists. In this thesis,
this effect has been studied and discussed with reference to wetting effects. Capillary bridges form on
the outside of the contact units and on near contact regions, increasing the pressure on the contact
units. The capillary bridges also require an additional force to slide, due to the moving wetting line
effect, where the contact angle is changed from a static to a dynamic contact angle. These wetting
effects are minimised when FM-type molecules are present
11.4 Further work
The friction mechanisms within the wet clutch have been described, the author believes for the first
time, with reference to activated shearing of solid like layers, and to wetting effects. The latter may be
studied further by observing lubricants doped with a fluorescent dye in wet clutch contacts, which can
be used to measure the film thickness. These may indicate fluid distribution, the presence of localised
capillary bridges and the impact of lubricant additives on this.
The activated shearing mechanism may also be studied in a more controlled manner, by using a AFM
with a colloid probe, or a surface force apparatus. The model FMs and other chemical active species
can then be studied in a more controlled environment, and additives and additive combinations could
be explored that could ultimately be used in the wet clutch. The activated shearing mechanism could
also be explored further using molecular dynamic simulations, to explore the influence of chemical

204
composition on the shear strength of the surface film and, especially, on the critical constant A in
Equation 10.13 that determines the magnitude of the boundary friction.
Adsorption of the chemical additives is known to occur on the steel, but has yet to be shown on the
friction material. The adsorbed chemical additives could be identified using a surface analysis
technique such as Time-of-flight Secondary ion mass spectroscopy (ToF SIMS).
The current hypothesis attributes the generated friction to the shearing of methyl tails of some surface
active molecules. The friction can be translated to higher values by disrupting the chemical film,
although the generated friction will be ultimately limited the shearing of terminal methyl groups. To
achieve greater friction values, the shear strength of the layers could be increased by increasing the
repulsion of the terminal groups. This could possibly be achieved by using larger groups and by using
charged groups. If a polar end group is to be used, however, steps must be taken to prevent the
molecule from bridging the surfaces. It may be possible to form an induced dipole at the terminated
group by a chemical reaction in the layer.

205
References
1. A.P. Skrobul and L.L. Megnin, “Automatic transmission fluids - a primer” Lubrication, 81(1),
1995, pp. 1-28.
2. R. Karlstetter, “Requirements for lubricants for the next generation of automatic transmissions”
Proceedings 10th International Colloquium, Esslingen, vol. 2, 1996, pp. 1299-1314.
3. http:// www.bestwesterntransmission.com.
4. R. Bosch, Automotive handbook. (WileyBlackwell, Germany, 2007).
5. Y. Kato and T. Shibayama, “Mechanisms of Automatic Transmissions and Their Requirements for
Wet Clutches and Wet Brakes” Jpn. J. Tribol., 39(12), 1994, pp. 1427-1437.
6. Y. Yang and R.C. Lam, “Theoretical and experimental studies on the interface phenomena during
the engagement of automatic transmission clutch” Tribol. Letts., 5(1), 1998, pp. 57-67.
7. https://www.lagunaspeed.com/product/660/BD+Torque+Converter.html.
8. US Occupational and Safety Health Administration. Rules and Regulations Standards for
Exposure to Asbestos Dust. 1976; 37 FR 11318.
9. F.A. Lloyd, J.N. Anderson and L.S. Bowles, “Effects of operating conditions on performance of
wet friction materials – a guide to material selection” SAE Paper 881280, 1988.
10. C. Morgan, R. Fewkes, T. A. McCombs, S. H. Tersigni and J. M. Jackson, “Low-speed carbon
fiber torque capacity and frictional properties test for ATFs” SAE Paper 2004-01-3026, 2004.
11. C.J. Biermann, Handbook of pulping and papermaking, (Academic press, London, 1996).
12. M. Alava and K. Niskanen, “The physics of paper”, Rep. Prog. Phys., 69. 2006, pp.669-723.
13. S. Kitahara and T. Matsumoto, “Present and future trends in wet friction materials” Jpn. J. Trib.,
39(12), 1994, pp. 1451-1459.
14. S. Mohanty and Y.P. Chugh, “Development of fly ash-based automotive brake lining” Trib. Int.,
40, 2007, pp. 1217-1224.
15. N. Chiba, M. Kano and M. Inoue, “Mechanism of compression fatigue of wet friction materials”
JSAE Review, 22, 2001, pp. 169-174.
16. http://en.wikipedia.org/wiki/Bakelite.
17. J. Bijwe, “Composites as friction materials: Recent developments in non-asbestos fiber reinforced
friction materials – a review” J. Polym. Compos., 18(3), 1993, pp. 378-396.
18. A. Gardziella, L.A. Pilato and A. Knop, Phenolic resins – Chemistry, applications,
standardization, safety and ecology, (Springer, Verlag, 1999).
19. Y. Kimura and C. Otani, “Contact and wear of paper-based friction materials for oil-immersed
clutches – wear model for composite materials” Trib. Int., 38, 2005, pp. 943-950.
20. H. Kitabayashi, C. Y. Li and H. Hiraki, “Analysis of the various factors affecting drag torque in
multiple-plate wet clutches” SAE Paper 2003-01-1973, 2003.
206
21. H. Sano and M. Takesue, “Friction characteristics of wet clutch in the process of dynamic
engagement” Jpn. J. Trib., 39(12), 1994, pp. 1567-1579.
22. M. Holgerson, “Optimizing the smoothness and temperatures of a wet clutch engagement through
control of the normal force and drive torque” J. Trib., 122, 2000, pp.199-123.
23. W. Ost, P. De Baets and J. Degrieck, “The tribological behaviour of paper friction plates for wet
clutch application investigated on SAE#II and pin-on-disk test rigs” Wear, 249, 2001, pp. 361-
371.
24. P.A. Willermet, G.K. Gupta, D. Honkanen, J.W. Sprys and D.G. McWatt, “ATF bulk oxidative
degradation and its effects on LVFA friction and the performance of a modulated torque
converter clutch” SAE Paper 982668, 1998.
25. K. Yoshizawa, T. Akashi and T. Yoshioka, “Proposal of new criteria and test methods for the
dynamic performance of ATF” SAE Paper 900810, 1990.
26. A. G. Papay and R. J. Hartley, “Frictional response of automatic transmission fluids in band and
disc clutches” SAE Paper 890721, 1989.
27. B. K. Satapathy and J. Bijwe, “Performance of friction materials based on variation in nature of
organic fibres. Part I. Fade and recovery behaviour” Wear, 257, 2004, pp.573-584.
28. S. Sanda, “Frictional characteristics of a wet clutch composed of paper-based facings during the
running-in process” Jpn. J. Trib., 39(12), 1994, pp. 1495-1504.
29. R. Ashikawa, T. Naruse, H. Kurashina, T. Matsuoka, T. Adachi and T. Nakayama, “ATF
characteristics required for the latest automatic transmissions” SAE Paper 932849, 1993.
30. H. Wada and T. Matsuoka, “Initial wet clutch frictional characteristics of ATF/B-CVTF under
low speed sliding conditions” SAE Paper 2003-01-1969, 2003.
31. M. Eguchi, Y. Kuwahara and T. Yamamoto, “Study on the origin of friction of a paper-based
facing for a wet clutch: Consideration based on analysis of real contact area by electrical contact
resistance method” Jpn. J Trib., 39(12), 1994, pp. 1553-1565.
32. C. Otani and Y. Kimura, “Analysis of the real contact area of a paper-based wet friction material”
Jpn. J. Trib., 39(12), 1994, pp. 1487-1494.
33. A. Suzuki, K. Hayashi, Y. Kotani, Y. Nagasawa and S. Sanda, “Mechanism of wet clutch with
paper based facings. Part 2 Effect of surface behaviour for µ-v characteristics” Proceedings of
the International Tribology Conference, Yokohama, 1995, pp. 1525-1530.
34. H. Ito, K. Fujimoto, M. Eguchi and T. Yamamoto, “Friction characteristics of a paper-based
facings for a wet clutch under a variety of sliding conditions” Trib. Trans., 36(1), 1993, pp. 134-
138.
35. T. Yamamoto, “The present and future state of tribological research into wet friction materials”
Jpn. J. Trib., 39(12), 1994, pp. 1419-1425.
36. G.W. Stachowiak and A.W. Batchelor, Engineering Tribology (Elsevier, Amsterdam, 1993).

207
37. H. A. Spikes, “Film-forming additives – direct and indirect ways to reduce friction” Lubrication
Science, 14, 2002, pp. 147-167.
38. T. Matsumoto, “A study of the influence of porosity and resiliency of a paper-based friction
material on the friction characteristics and hear resistance of the material” SAE Paper 932924,
1993.
39. M. Miyazaki and M. Hoshino, “Evaluation of vibration-preventive properties of lubricating oils in
wet friction plates and retention of such properties using a friction tester” SAE Paper 881674,
1988.
40. L. L. Ting, “Engagement behaviour of lubricated porous annular disks. Part I: Squeeze film
phase – surface roughness and elastic deformation effects” Wear, 34, 1975, pp. 159-172.
41. L. L. Ting, “Engagement behaviour of lubricated porous annular disks. Part II: Consolidating
contact phase – poroelastic effect” Wear, 34, 1975, pp. 173-182.
42. T. Miura, N. Seking, T. Azegami, Y. Murakami, K. Itonaga and H. Hasegawa, “Study on the
dynamic property of a paper-based wet clutch” SAE Paper 981102, 1998.
43. J. J. Gil, H. Sugiyama, T. Arai, N. Takakura and J. Takahashi, “A high-speed photography study
on engagement process of wet clutch” JSME Int. J., Series B, 39(1), 1996, pp. 149-155.
44. Y. Yang, R.C. Lam, T. Fujii, “Prediction of torque response during the engagement of wet
friction clutch” SAE Paper 981097, 1998.
45. S. Natsumeda, “Numerical simulations of engagement of a wet clutch composed of paper-based
facings” Jpn. J. Trib., 39, (12), 1994, pp. 1505-1515.
46. J. Wirth, “Research into the use of controlled surface technologies for clutch friction surfaces”
SAE Paper 2001-01-1157, 2001.
47. M. Holgerson, “Apparatus for measurement of engagement characteristics of a wet clutch”, Wear,
213, 1997, pp. 140-147.
48. J. J. Gil, H. Sugiyama, T. Arai, “Visualization of cavitation phenomena in wet clutch engagement
process” JSME Int. J., Series B, 40, (1), 1997, pp. 144-149.
49. C. D. Tipton, Handbook of lubrication and Tribology, Vol.1 – Application and maintenance,
Editors G. E . Totter and W. Scott, CRC Group, 2006.
50. T. Kugimiya, N. Yoshimura and J. Mitsui, “Tribology of automatic transmission fluid” Trib.
Letts. 5, 1998, pp. 49-56.
51. N. Umamori and T. Kugimiya, “Study of viscosity index improver for fuel economy ATF” SAE
Paper 2003-01-3256, 2003.
52. T. Ichihashi, “Recent developments in lubricating oils for wet clutches and wet brakes” Jpn. J.
Trib., 39, (12), 1994, pp. 1461-1470.
53. M. T. Devlin, S. H. Tersigni, J. Senn, T. L. Turner, T. Jao and K. Yatsunami, “Effect of friction
material on the relative contribution of thin-film friction to overall friction in clutches” SAE
Paper 2004-01-3025, 2004.

208
54. T. Kugimiya, “Effects of additives for ATF on µ-v characteristics” Proceedings of the
International Tribology Conference, Nagasaka, 2000, pp. 1355-1360.
55. T. Kugimiya et. al., “Next generation high performance ATF for slip-controlled automatic
transmission” SAE Paper, 972927, 1997, pp. 83-92.
56. T. Nakada, T. Nomura, T. Yoshioka and M. Nonoyama, “A study of additive effects on ATF
frictional properties using new test methods” SAE Paper, 902150, 1990.
57. Y. Zhu, H. Ohtani, M. Greenfield, M. Ruths and S. Granick, “Modification of boundary
lubrication by oil-soluble friction modifier additives” Trib. Letts., 15, (2), 2003, pp. 127-134.
58. T.S. Derevjanik, “Detergent and friction modifier effects on metal/metal and clutch
material/metal frictional performance” SAE Paper, 2001-01-1993, 2001.
59. C. G. Slough, H. Ohtani, M. P. Everson and D. J. Melotik, “The effect of friction modifiers on
the low-speed friction characteristics of automatic transmission fluids observed with scanning
force microscope” SAE Paper 981099, 1998.
60. M. Kitanaka, “Friction characteristics of some additives in ATFs” Proceedings 8th International
Colloquium Tribology 2000, Germany, 1992, 22.8-1.
61. S. Shirahama, “Adsorption of additives on wet friction pairs and their frictional characteristics”
Jpn. J. Trib., 39, (12), 1994, pp. 1479-1486.
62. R.M. Mortier and S.T. Orszulik, Chemistry and Technology of Lubricants (Blackie, London,
1997).
63. M. Maeda and Y. Murakami, “Testing method and effect of ATF performance on degradation of
wet friction materials” SAE Paper 2003-01-1982.
64. K. Topolovec-Miklozic, T. Reg Forbus and H. Spikes, “Film forming and friction properties of
overbased calcium sulphonate detergents” Tribol. Lett., 23, 2008, pp. 33-44.
65. S. Giasson, D. Espinat and T. Palermo, “Study of microstructural transformation of overbased
calcium sulphonates during friction” Lubr. Sci., 5-2, 1993, pp. 91-111.
66. R. Toritani and H. Itoh, Proceedings. Jpn. Tribology Conf., Jpn. Soc. Lubrication, Fukuoka,
October 1991, p. 517 (in Japanese).
67. E.S. Forbes and E.L. Neustadter, “The mechanism of action of polyisobutenyl succinimide
lubricating oil additives” Tribology, 5, (2), 1972, pp. 72-77.
68. N. Yao, Focused Ion Beam Systems: Basics and Applications (Cambridge University Press,
2007).
69. M. Alava and K. Niskanen, “The physics of paper”, Rep. Prog. Phys., 69. 2006, pp.669-723.
70. M. Eguchi and T. Yamamoto, “Shear characteristics of a boundary film for a paper-based wet
friction material: friction and real contact area measurement” Trib. Int., 38, 2005, pp. 327-335.
71. C. Otani and Y. Kimura, “Analysis of the real contact area of a paper-based wet friction material”
Jpn. J. Trib., 39, (12), 1994, pp. 1487-1494.

209
72. http://machinevision.navitar.com/ (Date accessed 4/09/09).
73. N. Otsu, “A threshold selection method from gray-level histograms” IEEE Trans. Syst. Man.
Cybernetics, smc-9, (1), 1979, pp. 62-66.
74. P. Gabbot, Principles and applications of thermal analysis, (Wiley-Blackwell, 2007).
75. J. F. Archard, “The temperature of rubbing surfaces” Wear, 2, 1958/59, pp. 438-455.
76. J. Y. Jang and M. M. Khonsari, “Thermal characteristics of a wet clutch” Trans. ASME., 121,
1999, pp. 610-617.
77. T. M. Cameron, T. McCombs, S. Tersigni and T. C. Jao, “Flash temperatures in clutches” SAE
Paper 2005-01-3890, 2005.
78. E. J. Berger, F. Sadegi and C. M. Krousgrill, “Finite element modelling of engagement of rough
and grooved wet clutches” ASME J. Trib., 118, pp. 137-146.
79. S. Natsumeda and T. Miyoshi, “Numerical simulations of engagement of paper based wet clutch
facing” ASME J. Trib., 116, pp. 232-237.
80. Y. Yang, R. C. Lam, Y. F. Chen and H. Yabe, “Modelling of heat transfer and fluid
hydrodynamics for a multidisc wet clutch” SAE Paper 950898, 1995.
81. D. R. Chrisope, D. W. Stinnett and R. J. Hartley, “Friction retention and thermal dscomposition
of fluid additives in wet clutch system” TAE Tribology Colloquium Esslingen, Germany, 1992.
82. A. Floquet and D. Play, “Contact temperatures in dry bearings: three dimensional theory and
verification” J. Lubr. Technol., 103, 1981, pp. 243-252.
83. H. Osanai, H. Ohnuma and K. Kato, “Temperature measurement and durability of the frictional
surfaces of paper-based wet frictional materials” Jpn. J. Trib., 39, (12), 1994, pp. 1471-1478.
84. G. Lawrence, G. Mace, N. Bowler, G. Goddard and D. Morrey, “Measurement of the interfacial
plate temperatures with a carbon clutch, and determination of effects upon its friction
characteristics” SAE Paper 2006-01-3634, 2006.
85. D. T. Marx, T. Policandriotes, S. Zhang, J. Scott, R. B. Dinwiddie and H. Wang, “Measurement
of interfacial temperatures during testing of a subscale aircraft brake” J. Phys. D: Appl. Phys. 34,
2001, pp. 976-984.
86. A. Kearsey, D. Wagner, “Carbon fiber for wet friction applications” SAE Paper 972754, 1997.
87. F. E. Kennedy, “Thermal and thermomechanical effects in dry sliding” Wear, 100, (1984), pp.
453-476.
88. D. Fairbank, K. Maruo, S. Du and T. Newcomb, “ATF additive effects on hot spot formation in
wet clutches” SAE Paper 2001-01-3594, 2001.
89. T. Hirano, K. Maruo, X. Gu and T. Fujii, “Development of friction material and quantitative
analysis for hot spot phenomenon in wet clutch system” SAE Paper 2007-01-0242, 2007.
90. T. Reddyhoff, H. A. Spikes and A. V. Olver, “Improved infrared temperature mapping of
elastohydrodynamic contacts” Proc. IMechE Part J: J. Engineering Trib., 223, 2009.
91. http://www.irassociates.com/insb.htm (date accessed: 02/09/09).

210
92. http://www.bwauto.com/products/ts/friction_products/friction_materials/ (date accessed:
19/08/09).
93. H. Gao, G. C. Barber and H. Chu, “Friction characteristics of a paper-based friction material” Int.
J. Automotive Tech., 3, (4), 2002, pp. 171-176.
94. P. Marklund and R. Larsson, “Wet clutch friction characteristics obtained from simplified pin on
disc test” Trib. Int., 41, 2008, pp. 824-830.
95. http://www.phoenix-tribology.com/ (date accessed 26/08/09).
96. M. Bezzazi, A. Khamlichi, A. Jabbouri, P. Reis and J. P. Davim, “Experimental characterization
of frictional behaviour of clutch facings using pin-on-disk machine”, Mater. Des., 28, 2007, pp.
2148-2153.
97. A. R. Lafountain, G. J. Johnston and H. A. Spikes, “The elastohydrodynamic traction of synthetic
base oil blends” Tribol. Trans., 44, (4), 2001, pp. 648-656.
98. C. Bovington, “Elastohydrodynamic lubrication: a lubricant industry perspective” Proc. Instn.
Mech. Engrs., Part J: J. Eng. Tribol., 213, (5), 1999, pp. 417-426.
99. J. de Vicente, J. R. Stokes and H. A. Spikes, “Rolling and sliding friction in compliant, lubricated
contact”, Proc. IMechE Part J: J. Engineering Trib., 220, 2006, pp. 55-63.
100. K. L. Johnson, Contact mechanics, (Cambridge University Press, Cambridge, 1987).
101. H. Ohtani, R. J. Hartley and D. W. Stinnett, “Prediction of anti-shudder properties of automatic
transmission fluids using a modified SAE No. 2 machine” SAE Paper 940821, 1994.
102. F. Bowden and D. Tabor, The Friction and Lubrication of Solids, (Clarendon Press, Oxford,
1986).
103. L. Taylor, A. Dratva and H. A. Spikes, “Friction and wear behaviour of Zinc
Dialkyldithiophosphate Additive” Tribology Transactions, 43, 2000, (3), pp. 469-479.
104. S. Jahanmir, “Chain length effects in boundary lubrication” Wear, 102, 1985, pp. 331-349.
105. B. J. Briscoe and D. C. B. Evans, “The shear properties of Langmuir-Blodgett layers” Proc. R.
Soc. Lond., A 380, 1982, pp. 389-407.
106. I. Iliuc, Tribology of thin layers, (Elsevier, Romania, 1974).
107. D. K. Schwartz, “Mechanisms and kinetics of self-assembled monolayer formation” Annu. Rev.
Phys. Chem., 52, 2001, pp. 107-137.
108. J. E. Davidson, et. al., “Molecular dynamics simulations to aid the rational design of organic
friction modifiers” J. Molecular Graphics and Modelling, 25, 2006, pp. 495-506.
109. R. Zhang and P. Somasundaran, “Advances in adsorption of surfactants and their mixtures at
solid/solution interfaces” Adv. Colloid. Interface Sci., 123-126, 2006, pp. 213-229.
110. M. Beltzer and S. Jahanmir, “Role of dispersion interactions between hydrocarbon chains in
boundary lubrication” ASLE Trans., 30, (1), 1986, pp. 47-54.
111. N. J. Fox, B. Tyrer and G.W. Stachowiak, “Boundary lubrication performance of free fatty acids
in sunflower oil” Trib. Letts., 16 (4), 2004.
211
112. J. Choi, H. Morishita, T. Kato, “Frictional properties of bilayered mixed lubricant films on an
amorphous carbon surface: effect of alkyl chain length and SAM/PFPE portion” App. Surf. Sci.,
228, 2004, pp.191-200.
113. E. Barrena, C. Ocal and M. Salmeron, “A comparative AFM study of the structural and frictional
properties of mixed and single component films on alkanethiols on Au(111)” Surf. Sci., 482-485,
2001, pp. 1216-1221.
114. S. M. Flores et. al. “Control of surface properties of self-assembled monolayers by tuning the
degree of molecular asymmetry” Surf. Sci., 600, 2006, pp. 2847-2856.
115. T. Allen and R. M. Patel, “The adsorption of long-chain fatty acids on finely divided solids using
a flow microcalorimeter” J. Colloid Interface Sci., 35, (4), 1971, pp. 647-655.
116. B. N. J. Persson Sliding Friction: Physical Principles and Applications (NanoScience and
Technology) (Springer, Berlin, 2000).
117. W. A. Zisman, “Friction and wear” Proceedings of the symposium on friction and wear, Detroit,
1957, Editor: R. Davies (Elsevier, New York, 1050) pp. 110
118. S. M. Lundgren, M. Ruths, K. Danerlov and K. Persson, “Effects of unsaturation on film
structure and friction of fatty acids in a model base oil” J. Colloid Interface Sci. 326, 2008, pp.
530-536.
119. M. Ruths, S. Lundgren, K. Danerlov and K. Persson, “Friction of fatty acids in nanometer-sized
contacts of different adhesive strength” Langmuir, 24, 2008, pp. 1509-1516.
120. R. C. Castle and C. H. Bovington, “The behaviour of friction modifiers under boundary and
mixed EHD conditions” Lubr. Sci., 15, (3), 2003, pp. 253-263.
121. J. P. Folkers, P. E. Laibinis and G. M. Whitesides, “Self-assembled monolayers of alkanethiols
on gold: comparison of monolayers containing mixture of short and long-chain constituents with
CH3 and CH2OH terminal groups” Langmuir, 8, 1992, pp. 1330-1341.
122. H. Zhao, A. Neville, A. Morina, J. Durham and R. Vickerman, “A new method to evaluate the
overall anti-shudder property of automatic transmission fluids – multiple parameters spider chart
evaluation” Proc. IMechE Part J: J. Engineering Trib., 222, (3), 2008, pp. 459-469.
123. X. Tian and B. Bhushan, “The micro-meniscus effect of a thin liquid film on the static friction of
rough surface contact” J. Phys. D: Appl. Phys., 29, 1996, pp. 163-178.
124. M. Pykonen et. al., “Effects of atmospheric plasma activation on surface properties of piment-
coated and surface-sized papers” Appl. Surf. Sci., 255, 2008, pp. 3217-3229.
125. A. K. Bledzki, S. Reihmane and J. Gassan, “Properties and modification methods for vegetable
fibers for natural fiber composites” J. Appl. Polym. Sci., 59, 1996, pp. 1329-1336.
126. M. Pykonen et. al., “Ageing effect in atmospheric plasma activation of paper substrates” Surf.
Coatings Tech., 202, 2008, pp. 3777-3786.
127. S. M. Mukhodpadhyay, P. Joshi, S. Datta and J. Macdaniel, “Plasma assisted surface coating of
porous solids” Appl. Surf. Sci., 201, 2002, pp. 219.

212
128. B. Krzan, F. Novotny-Farkas and J. Vizintin, “Tribological behaviour of tungsten-doped DLC
coating under oil lubrication” Trib. Int., 42, (2), 2009, pp. 229-235
129. K. Topolovec-Miklozic, F. Lockwood and H. Spikes, “Behaviour of boundary lubricating
additives on DLC coatings” Wear, 265, 2006, pp. 1893-1901.
130. B. Chavdar, “A permeameter measuring normal and lateral permeability and an investigation on
wet friction materials” Proceedings 47th International SAMPE Symposium, May 12-16, 2002, pp.
253-266.
131. B. J. Hamrock and D. Dowson, Ball bearing lubrication (Wiley, New York, 1981).
132. J. de Vicente, J. R. Stokes and H. A. Spikes, “The frictional properties of Newtonian fluids in
rolling-sliding soft-EHL contact” Tribology Letters, 20, (3-4), 2005, pp. 273 – 286.
133. R. Gohar, Elastohydrodynamics (Ellis Horwood ltd, 1988).
134. S. Li, M. T. Devlin, S. H. Tersigni, T. Jao, K. Yatsunami and T. M. Cameron, “Fundamentals of
anti-shudder durability: Part I – Clutch Plate Study” SAE Paper 2003-01-1983, 2003
135. D. Dowson, “A generalized reynolds equation for fluid-film lubrication” International Journal of
Mechanical Science, 4, 1962, pp. 159-170.
136. Q. Qingwen, H. Yahong and Z. Jun, “An adsorbent layer model for thin film lubrication” Wear,
221, 1998, pp. 9-14.
137. M. T. Devlin, S. H. Tersigni, J. Senn, T. L. Turner, T. Jao and K. Yatsunami, “Modelling friction
contributions in step-automatic clutches” Proc. Int. Symp. Tribol. Veh. Transm., 2005, pp. 125-
135
138. S. Sanda, Y. Nagasawa, A. Suzuki, K. Hayashi and H. Itoh, “Mechanism of friction of wet clutch
with paper based facings. Part 1 Observation and modelling of facing surface during
engagement” Proc. Int. Trib. Conf., Yokohama, 1995, pp 1519 - 1524
139. K. J. Chugg and M. Munawar Chaudhri, “Boundary lubrication and shear properties of thin solid
films of dioctadecyl dimethyl ammonium chloride (TA100)” J. Phys. D: Appl. Phys., 26, 1993,
pp. 1993-2000.
140. H. Eyring, “The activated complex in chemical reactions” J. Chem. Phys., 3, 1935, pp. 107-115.
141. H. Eyring, “Viscosity, plasticity, and diffusion as examples of absolute reaction rate” J. Chem.
Phys., 4, 1936, pp. 283 – 291.
142. Y. C. Kong, D. J. Tildesley and J. Alejandre, “The molecular dynamics simulation of boundary-
layer lubrication” Molecular Physics, 92, (1), 1997, pp. 7-18.
143. H. Unal, A. Mimaroglu, U. Kadioglu and H. Ekiz, “Sliding friction and wear behaviour of
polytetrafluoroethylene and its composites under dry conditions” Material and Design, 25, 2004,
pp. 239-245.
144. B. Jia, T. Li, X. Liu, P. Cong, “Tribological behaviors of several polymer-polymer sliding
combinations under dry friction and oil-lubricated conditions” Wear, 262, 2007, pp. 1353-1359.

213
145. N. K. Myshkin, M. I. Petrokovets and A. V. Kovalev, “Tribology of polymers: Adhesion,
friction, wear, and mass-transfer” Trib. Int., 38, 2005, pp. 910-921.
146. M. Eguchi, “The boundary friction-sliding velocity of paper-based wet friction materials” Jpn. J.
Tribol., 39, (12), 1994, pp. 1517-1527.
147. C. D. Tipton and E .A. Schiferi, “Fundamental studies on ATF friction I” SAE Paper 971621,
1997.
148. T. D. Blake, “The physics of moving wetting lines” J. Colloid Interface Sci., 299, 2006, pp. 1-13.
149. J. Chappuis, “Lubrication by a new principle: the use of non-wetting liquids” Wear, 77, 1982, pp.
303-313.
150. G. M. Whitesides and P. E. Laibinis, “Wet Chemical approaches to the characterization of
organic surfaces: self-assembled monolayers, wetting, and the physical-organic chemistry of the
solid-liquid interface” Langmuir, 6, (1), 1990, pp. 87-96.
151. P. G. de Gennes, “Wetting: statics and dynamics” R. Mod. Phys., 57 (3), Part I, 1985, pp. 827-
863.
152. R. V. Sedev, C. J. Budziak, J. G. Petrov and A. W. Neumann, “Dynamic contact angles at low
velocities” J. Colloid Interface Sci., 159, 1993, pp. 392-399.
153. T. D. Blake and Y. D. Shikhmurzaev, “Dynamic wetting by liquids of different viscosity” J.
Colloid Interface Sci., 253, 2002, pp. 196-202.

214
Appendix A
The following derivation was carried out by Prof. Spikes, in support of the work contained within this
thesis. The results gained from this work are shown and discussed in Chapter 10.
Derivation of generalized Reynolds equation for lubricant with viscosity varying with distance from
surfaces
Equilibrium of a fluid element
x
p
z
(analysis shown in x-direction; similar in y-direction)
Integrate twice to find the velocity profile
x
p
z
z
u
1czx
p
z
u
11
cz
x
p
z
u
2100
1ccdzdz
z
x
pzu
zz
u = u1 at z = 0
21 00 cu
11
00
1ucdzdz
z
x
pzu
zz
u = u2 at z = h
11
00
2
1ucdzdz
z
x
pu
hh
dzz
Jh
0
1
, dzJh
0
0
1

215
1112 ucJJx
pu o
oJ
uuJx
p
c121
1
1
00
121
0
1udz
J
uuJx
p
dzz
x
pzu
zz
dzz
Jz
z 0
1
, dzJz
z 0
0
1
10
0
121
1 uJJ
uuJx
p
Jx
pzu zz
0
02
0
010
0
11 1
J
Ju
J
JuJ
J
JJ
x
pzu zz
zz
Assume u2 = 0
0
010
0
11 1
J
JuJ
J
JJ
x
pzu z
zz
Integrate velocity gradient to find the flow
h
o
z
h
o
z
h
o
z
h
x dzJJ
udzJJ
JdzJ
x
pdzzuq 0
0
10
0
11
0
11
ozh
h
oz JdzJ 0 , zh
h
oz JdzJ 11
ozhozhzhx J
JuJ
J
JJ
x
pq
01
0
11
11
01
11 1J
Ju
J
JJJJ
x
pq ozh
o
ozhozhx

216
01
11
J
J
xu
J
JJJJ
x
p
xx
q ozh
o
ozhozhx
1
11
J
JJ
J
JJJJJ ozh
Ro
ozhozh
Continuity of flow through a column of fluid
Ryx J
xu
y
pJ
yx
pJ
xy
q
x
q
10
RJx
uy
pJ
yx
pJ
x
1
Derivation of surface shear stress
z
J
J
u
z
J
J
J
z
J
x
p
z
u z
o
zzx
010
0
11
z
z
J z
1 ,
10
z
J z
11 1
0
1
o
xJ
u
J
Jz
x
p
At z = 0, o
zxJ
u
J
J
x
p 1
0
1
0

217
Appendix B:
Calculation of the Variation in Temperature through the Chromium Layer
The calculation described below was carried out with the assistance of Dr. Thomas Reddyhoff
The flash temperatures measured in Chapter 5 are obtained not from the friction material/chromium
coating interface but from the chromium surface at the interface between the chromium and the
sapphire disc. This means that the measurements are actually taken from 100 nm (the thickness of the
chromium layer) within the moving, coated sapphire disc. The flash temperature at this location will
be lower than that of the rubbing surface itself and it is necessary to estimate the possible error from
this. The decay in flash temperature within a rubbing surface can be calculated from Jaegers’s
equations [1], which gives the temperature rise T at point (x,y,z) due to a moving source of heat q at
point (x’,y’,z’):
ydxd
R
RxxU
K
qT
A
ki
2exp
2
where:
A is the area of the contact unit (assumed to be a square of 20 µm × 20 µm)
R is the is the distance between points of heat input and temperature rise (x-((x’-x)2+(y’-
y)2+(z’-z)2)1/2
ΔU is the speed of the surface relative to the heat source.
K is the thermal conductivity of the Chromium layer (34 W/mK).
χ is the thermal diffusivity of the Chromium layer (8.0×10⁻⁶ m2/s).

218
For simplicity it is assumed that the sapphire has the same thermal properties as the chromium layer so
that the body can be treated as a half space. This equation can be solved using the small contact
approximate solution given in Jaeger’s paper.
Figure 1 shows the reduction in temperature within the moving body, calculated from Jaeger’s
equation, for a contact sliding at 0.4 m/s. At a depth of 100 nm, corresponding to the thickness of the
chromium later, the expected value is approximately 10% below that at the contact. For the conditions
tested, this reduction is effectively independent of entrainment speed and contact temperature. This
means that the temperature values described in Chapter 5 are probably about 10% smaller than the
sliding contact values.
Figure 1. Percentage of contact temperature across the chromium layer.
1. J. C. Jaeger, “Moving sources of heat and temperature at sliding contacts”. Proc. Roy. Soc.
NSW 76, 1942, pp. 203-224