The Little Book of Agile Metrics
44
The Little Book of Agile Metrics
Transcript of The Little Book of Agile Metrics

The Little Book of
Agile Metrics

02
Introduction
How to View Metrics
Team-LevelMetrics
Agile LeadershipMetrics
Executive-LevelMetrics
AGILE METRICS AT EVERY LEVEL
Page 3
Page 5
Page 12
Page 23
Page 39
The Little Book of Agile Metrics
Contents
01
03
04
05
2

In the last decade, Agile has evolved from a framework used by development teams to a topic of discussion across entire organizations, including at the board and shareholder levels. Despite all the attention, Agile efforts suffer from false starts and unexplained stalls all too often. A surprising number of these issues sprout from metrics.
Polaris was founded with a mission to share the joy of successful software development projects with everyone. To that end, this book is designed to be used by teams, Agile leaders, and executives to ensure success with Agile. The metrics we cover:
☑ Represent the most critical Agile measurements, collected from Polaris’ team of experts
☑ Have been field tested in real world projects, including both software development and organizationaltransformation efforts
☑ Have proven to enhance software development,collaboration, and business and IT transparency
Introduction
www.polarissolutions.com
3

Agile methods are frameworks and processes that provide guidance for managing teams and developing software. They aim to deliver value to users quickly, with feedback loops to help ensure delivery of the right product at the right time.
ExamplesSCRUM, EXTREME PROGRAMING, CRYSTAL CLEAR, FEATURE-DRIVEN DEVELOPMENT
Agile metrics serve as a compass to keep teams on track and enable data-driven conversations about ROI, value, and Agile maturity. A metric is a quantification that can be used to narrow in on something we could change, determine if we are adding value, and/or test hypotheses. A metric is not a flawless and unbiased representation of team productivity, software quality, or delivered value.
ExamplesTHROUGHPUT, CYCLE TIME, WIP LIMIT, IMPEDIMENT AGE
This book covers the most critical Agile metrics that can guide your software development and delivery practices.
QUICK TIP: AVOID GOING RIGHT TO OVERWHELMING YOUR TEAM WITH DASHBOARDS FULL OF METRICS.
Introduction
How to Use This Book
4
The Little Book of Agile Metrics
How to
ViewMetrics
5

During World War I, British Army officials became concerned about head injuries and decided to exchange cloth headgear for metal helmets.1
After implementation, there was actually an increase in soldiers hospitalized with head injuries.
Looking at this metric in a vacuum, we might jump to the conclusion that metal helmets resulted in more head injuries. In reality, the helmets allowed more soldiers to survive head injuries.
How to View Metrics
DON’T Jump to Conclusions
What does this have to do with Agile metrics?We live in a complex world and often use biases to interpret it. We must be aware of these biases when viewing metrics.
Next, we’ll discuss two out of hundreds of known biases and psychological phenomena that can cloud a clear view of metrics…
[1] Blast wave protection in combat helmet design, Ohio State University, 2018
6

Goodhart’s Law2 suggests when we optimize for a specific objective, people will work to obtain that objective regardless of the consequences.
Example A Call Center sets a new KPI for low call times, and reps are coached to bring their call time numbers down. After a month, one rep significantly decreases his call time. When pressed on how did it, he says he hung up on every third caller within 30 seconds.
The lesson? Be careful what you measure, because you just might get it. What metrics are you using that could encourage your team to “hang-up prematurely” on customers?
“When a measure becomes a target, it ceases to be a
good measure.”–Marilyn Strathern2
[2] Goodhart’s Law Rules the Modern World, Bloomberg, 2021
How to View Metrics
Goodhart’s Law
7

The Hawthorne effect3occurs when people change behavior because they’re aware that of being observed.
Example People asked to record what they consume each day are likely to lose weight, regardless of diet. Knowing that someone is paying attention makes them more aware of what they eat, often leading to better choices.
The Hawthorne effect requires us to be careful not to draw false cause-and-effect conclusions based on targets and single measurements.
Instead, we should ask questions and look at a combination of metrics.
8
How to View Metrics
Hawthorne Effect
[3] The Hawthorne Effect and Behavioral Studies, Verywell Mind, 2020

To avoid bias and false conclusions, answer the following questions before settling on a metric.
Who is the metric for?
What is the goal of the metric? Is it achieving its goal?
What information can be misleading or give an illusion of progress?
What complimentary metric can we use to balance this metric out?
How can you game and/or manipulate the metric?
What information about a team's progress is useful to see visually?
Are you using the metric for the intended purpose, or do you need to revisit?
When will you stop using the metric (e.g. when a goal has been reached)?
Do you have any metrics that help drive change or motivation?
Are you tracking any metrics for the wrong reasons?
How to View Metrics
10 Questions to Ask Before Choosing Metrics
1
2
3
4
5
6
7
8
9
10
9

• There isn’t an easy way to measure productivity.
• Delivering valuable software is the primary measure of success.
• Metrics are a catalyst for conversations.
• If we're only interested in showing how hard we’ve tried to meet a goal, traditional metrics will serve us well.
• Unfortunately, this creates “perverse incentives” that detract from the larger goal of delivering working product quickly.
Each metric tells a story that can be used to solve a problem:• What problem are we
experiencing?• What experiment can we
run to try and improve it?
Needs to be consumed by the team
Needs to be surrounded by conversations
You get what you measure
Should be part of an investigation/experiment
How to View Metrics
Metric Viewing Principles
• In isolation, spreadsheets and presentations don’t tell the entire story.
10

The Little Book of Agile Metrics
AgileMetricsat Every Level
11

• Velocity
• Say:Do Ratio
• Production Cycle Time
• Work in Progress (WIP)
• Story Churn
• Sprint GoalSuccess Rate
• Work vs. Wait Queues
• Throughput• Escaped
Defects
• Deployment Time
Team-LevelMetrics
Agile Metrics at Every Level
12

WHYVelocity tells us when something can be delivered. It represents the predictability of the team’s estimates and ability to complete work from sprint to sprint. Stability in this metric drives trust.
WHATA Velocity chart shows the number of story points completed in a sprint. Aim for flat Velocity, or +/- 10 percent.Each team’s relative story points are unique and cannot be compared. Never compare two teams’ Velocities.
ASK• Has the team’s makeup changed?• Are we in a seasonal period?• Is the team working at a sustainable pace?• Is the team swamping on issues?• Is the backlog of work unstable?• Have there been escalations, causing iteration priorities to
shift?
Team-Level Metrics
Velocity
Velocity Chart
13

WHYThe Say:Do Ratio helps new teams understand Agile maturity and existing teams understand the health of the backlog. It also aids in understanding the relationship between the team and the Product Owner.
WHATA percentage of the number of user stories committed to in a Sprint compared to actual number of stories finished gives you your Say:Do Ratio. Committed stories are the specific stories planned during Sprint Planning.
ASK• Has the team’s makeup changed?• Are we in a seasonal period? – There are times when the
seasonal nature of the work might cause higher volatility• Is our backlog of work unstable?• Have there been escalations, causing iteration priorities to
shift?
Team-Level Metrics
Say:Do Ratio
Say:Do Ratio Chart
14

WHYThis metric helps teams understand the impact of changes. Decreased Production Cycle Time leads to decreased Business Cycle Time. Large wait times can increase both Business and Production Cycle Time.
WHATProduction Cycle Time is the measure of how many days it takes to process a request, from when development starts until the team’s definition of done (DoD). Steady or decreasing Production Cycle time is preferred.
ASK• Is everyone testing, code reviewing, etc.? • Is the team swarming? • Does the team need to limit work in progress?• Does the team have dependencies that have not been
resolved?• Are there handcuffs or impediments getting in the team’s
way?
Team-Level Metrics
Production Cycle Time
15
Avg. User Story Production Cycle Time (in days)

WHYTracking and limiting WIP ensures the entire team takes ownership of a project and produces high quality code. Limiting makes it easier to identify inefficiency in a team's workflow.
WHATWIP limits restrict the number of stories in each status of a workflow. When the upper limit for a status has been reached, the team stops and works together to clear the bottleneck.
ASK• Has the team’s or teams’ makeup changed?• Does the team have a continuous improvement mindset?• Has the work complexity changed?• Are quality issues hampering the ability to deliver stories?
Team-Level Metrics
Work in Progress (WIP)
16

WHYTeams use this metric to help improve their ability to focus and achieve the goals originally set forth in Sprint Planning.
WHATStory Churn, also known as the “Chaos Metric”, is the number of stories/defects added to or removed from an iteration over time. If the number is high, it’s a strong indicator the team is frequently context switching. The goal should be a low, steady downward trend.
ASK• If churn is zero, is the team taking enough risks? Are they
gaming the metric?• Is the team constantly putting out fires? Are they responding
to reprioritized requests?• Is there a reciprocal commit in place between the Product
Owner and the team?• Are quality issues resulting in rework?
Team-Level Metrics
Story Churn
17

WHYThis metrics acknowledges that teams perform “better” when working towards a common goal. A Sprint Goal can also help break down objectives into smaller, easier-to-deliver outcomes.
WHATSprint Goal Success Rate measures the percentage of time a team successfully reaches its sprint goal in a given period.
ASK• Has the team’s or teams’ makeup changed?• Does the team have a continuous improvement mindset?• Has the work complexity changed?• Are quality issues hampering the ability to deliver stories?• Have there been escalations, causing Sprint priorities to
shift?
Team-Level Metrics
Sprint Goal Success Rate
x √√
18

WHYWe measure Work vs. Wait times to identify bottlenecks and areas of improvement. This metric clarifies the time it takes to develop a request according to your team’s DoD.
WHATWork time measures the time a team member actively works on a story, bug, spike, or tech debt in an iteration. Wait time measures the time a team member waits on something or someone before continuing work. It’s ideal to see a decrease in wait time and an increase in work time.
ASK• Has the team’s or teams’ makeup changed?• Does the team have a continuous improvement mindset?• Has the work complexity changed?• Are quality issues hampering the ability to deliver stories?• Are the teams swamping around bottlenecks and/or
blockers?• Is there a process bottleneck getting in the way?
Team-Level Metrics
Work vs. Wait Queues
Wait Queue Time Work Queue Time
19

WHYMeasuring throughput as a trend over time can provide insight into the rhythm of the team’s ability to deliver. It can also help to identify bottlenecks and areas of improvement.
WHATThroughput is the measure of how many days it takes to process a request, from when development starts until the team’s DoD.
ASK• Has the team’s or teams’ makeup changed?• Are we in a seasonal period?• Does the team have a continuous improvement mindset?• Has the work complexity changed?• Are quality issues hampering the ability to deliver stories?• Are the teams swamping around bottlenecks and/or
blockers?• Have there been escalations, causing iteration priorities to
shift?• Is the backlog of work unstable?
Team-Level Metrics
Throughput
Source: www.mazzlo.com
20

WHYWhen we are shipping code ship fast, we want to have confidence it is defect free.
WHATEscaped Defects measures the number of defects that are found after they have gone to production. Escaped defects should be zero or close to zero.
ASK• Are we working at a sustainable pace?• How can we catch bugs as they are created?• Are we testing at the right level? Unit? Functional Regression?• Does the team have a process improvement mindset?
Team-Level Metrics
Escaped Defects
21
Escaped Defects Over Time

WHYFaster deployment increases time to market, resulting in the end user obtaining value sooner. Smaller, faster batch sizes also help improve overall quality through lowered variability.
WHATDeployment Time simply measures the time it takes to deploy.
ASK• What processes are taking the longest to deploy?• If there was a sudden decline, did we miss a step? What
does our quality look like?
Team-Level Metrics
Deployment Time
One big release
Small frequent releases
22
One Big Release
Small, Frequent Releases

• Technical Debt
• Value Delivered• Cumulative Flow
Diagram (CFD)
• Team Morale• Skill Versatility
• Team Member vs. Company Turnover
• Epic or Release Burndown
• Percentage of Automated Test Coverage
• Impediment Age
• MTTR• Agile Release
Train Predictability• Cyclomatic Complexity• Running Tested
Features (RTF)• Release Cycle Time
• Process ImprovementEfforts
Agile LeadershipMetrics
Agile Metrics at Every Level
23

WHYUnaddressed Technical Debt compounds on itself. Products or systems that carry a lot of Tech Debt lead to unhealthy code bases, unhealthy backlogs, bad products, and unhappy employees and customers.
WHATTech Debt reflects the implied cost of additional rework caused by choosing an easy solution now, instead of using a better approach that would take longer. This metric measures the total number of Tech Debt items accomplished at the end of each iteration.
ASK• Is the team balancing feature development with Technical
Debt?• Are defects and failures related to compliance, security, and
performance increasing?• Are decisions being made that defer the need for necessary
redesigns and/or needed maintenance of code?
Agile Leadership Metrics
Technical Debt
24
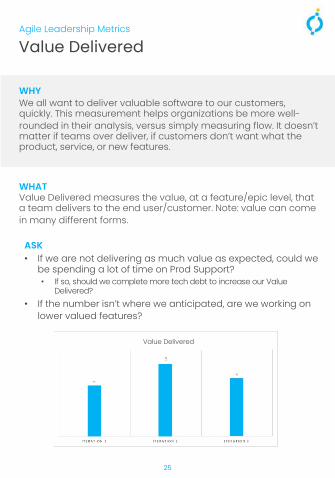
WHYWe all want to deliver valuable software to our customers, quickly. This measurement helps organizations be more well-rounded in their analysis, versus simply measuring flow. It doesn’t matter if teams over deliver, if customers don’t want what the product, service, or new features.
WHATValue Delivered measures the value, at a feature/epic level, that a team delivers to the end user/customer. Note: value can come in many different forms.
ASK• If we are not delivering as much value as expected, could we
be spending a lot of time on Prod Support? • If so, should we complete more tech debt to increase our Value
Delivered?• If the number isn’t where we anticipated, are we working on
lower valued features?
Agile Leadership Metrics
Value Delivered
25
Value Delivered

WHYA Cumulative Flow Diagram (CFD) is an important part of increased value delivery. Consistently increasing WIP will lead to more meetings and missed deadlines.
WHATCFDs allow you to see your team’s flow at a glance. An ideal CFD consistently trends upwards, with a steady number of WIP items.
ASK• Cliffs - Has there been significant scope change?• Flatlining - Do we wait to move our items along the Kanban
board until the end of an iteration?• Flatlining - Is there something blocking the team’s flow?• Increased WIP - Is the team starting work before completing
current work?
Agile Leadership Metrics
Cumulative Flow Diagram (CFD)
26
How to Read a CFD

WHYMorale is not as subjective as a happiness metric and less susceptible to changes in mood. Teams with high morale are more likely to support each other, have grit in the face of adversity, and be proud of their work. Ultimately, high morale results in higher quality work being delivered quicker, plus a more pleasant work environment.
WHATTo gauge Team Morale, measure before a retrospective. Average the scores and divide by number of prompts. Prompts you could use include:• In my team, I feel fit and strong
• I am proud of the work that I do for my team• I am enthusiastic about the work that I do for my team• I find the work that I do for my team of meaning and purpose
ASK• Does the organization have a culture of openness,
transparency, and support of growth?
Agile Leadership Metrics
Team Morale
27
“[Team] Morale is the enthusiasm and persistence with
which a member of a team engages in the prescribed activities of that group.”
– Frederick J. Manning 4
Team Morale Chart
[4] Frederick J. Manning. “Morale, Cohesion, and Esprit de Corps.” In Handbook of Military Psychology, 1991

WHYAgility leans towards small, cross-functional teams with an emphasis on skills over titles, as this structure helps reduce a hands-off approach. The Skill Versatility metric helps in understanding the Agile maturity of an organization.
WHATSkill Versatility measures the growth of cross-functionality within a team or teams.
ASK• What are our most critical applications and are they
resilient?• Where do we have a gap in demand vs. knowledge vs.
desire?• How do we work to close these gaps?
Agile Leadership Metrics
Skill Versatility
28

WHYPeople are a company’s most expensive and valuable asset. Teams working in an Agile fashion tend to have high job satisfaction and are less likely to leave the organization, and this metric provides direct insight into that.
WHATTeam Member vs. Company Turnover measures the attrition of members on a team relative to attrition of the company overall.
ASK• Are we addressing raised impediments?• Do the teams have the ability to solve impediments?• Have we had a significant change within the past 6 months
to the way teams are working?
Agile Leadership Metrics
Team Member vs. Company Turnover
29

WHYThis metric helps predict how many sprints it will take to complete an epic or release based on past sprints and changes during the sprints. It helps the business understand if a release is on track or if adjustments need to be made.
WHATEpic or Release Burndown shows the progress of an epic or release. This metric is similar to a Sprint Burndown, but focuses on the bigger picture. The actual number is based off team estimates and capacity.
ASK• Have there been escalations, causing iteration priorities to
shift?• Does the team have a DoD and/or definition of ready (DoR)?• Has the team’s makeup changed?• Are we in a seasonal period?• Is the backlog of work unstable?
Agile Leadership Metrics
Epic or Release Burndown
30

WHYPercentage of Automated Test Coverage helps businesses understand the progress of automated test coverage and Agile maturity. Automated testing can bring huge gains in terms of speed and efficiency.
WHATThis metric shows the percentage of automated test coverage compared to manual test coverage. Note: it does not indicate anything about the effectiveness of the testing; it only measures its dimension.
# of automated test coverage
total test coverage
ASK• Are we still able to catch defects before they are released to
production?
Agile Leadership Metrics
Percentage of Automated Test Coverage
31
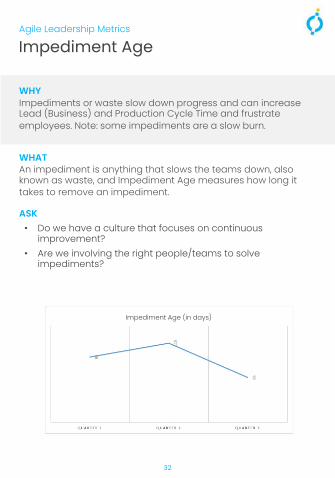
WHYImpediments or waste slow down progress and can increase Lead (Business) and Production Cycle Time and frustrate employees. Note: some impediments are a slow burn.
WHATAn impediment is anything that slows the teams down, also known as waste, and Impediment Age measures how long it takes to remove an impediment.
ASK• Do we have a culture that focuses on continuous
improvement?• Are we involving the right people/teams to solve
impediments?
Agile Leadership Metrics
Impediment Age
32
Impediment Age (in days)

The average speed of a system’s or product’s recovery process:
down time in a periodnumber of incidents
Agile Leadership Metrics
Mean Time to Recovery (MTTR)
33
ASK• Is there an issue with the alerts system?• Is something preventing the team from fixing the system
quicker?• What is the response time for fixing the request?
https://www.atlassian.com/incident-management/kpis/common-metrics
The average time it takes to repair a system or product:
sum of time spent on repairsnumber of repairs
Mean Time to Repair (MTTR)
The average time to fully resolve a failure of a system or product:
down time in a periodnumber of incidents
Mean Time to Resolve (MTTR)
The average time to recover from a product or system failure from the time the incident was first reported:
full resolution timenumber of incidents
Mean Time to Respond (MTTR)

WHYThis metric helps build trust with stakeholders by showing how teams are completing what they committed to completing. It can be used to help eliminate a culture of escalation.
WHATAgile Release Train (ART) Predictability compares planned business value vs. actual business value attained during a Program Increment for an ART. The goal is 80% to 100% predictability.
ASK• Have there been escalations, causing iteration priorities to
shift?• Has the work complexity changed?• Are quality issues hampering the ability to deliver stories?• Has the team’s makeup changed?• If we are not delivering as much value as expected, could we
be spending a lot of time on Prod Support?
Agile Leadership Metrics
Agile Release Train Predictability
34
PI Objective Predictability & Churn

WHYCYC helps teams understand software quality, and can be used to:
• Limit code complexity• Determine the number of test cases required• Help understand complexity of code for maintainability
WHATTo arrive at this metric, simply count the number of decisions in the source code.
ASK• What are our most critical systems? How do can we
decrease their complexity?• What enabling architecture can we put in place to ease
complexity?
Agile Leadership Metrics
Cyclomatic Complexity (CYC)
35

WHYRTF gauges the general health of a product’s development and ultimately helps the organization focus on outcome instead of process. It helps teams balance speed and quality.
WHATRTF measures how many features are passing all their acceptance tests.
ASK• Were their changes to scope of work items?• Is there an opportunity to adjust our acceptance criteria?• Is the team working at a sustainable pace?
Agile Leadership Metrics
Running Tested Features (RTF)
36
Running Tested Features

WHYSmall batch releases with short Release Cycle Time reduce risk by injecting less variability into an environment. Additionally, smaller releases can help improve predictability of when new features can be released to production.
WHATRelease Cycle Time measures how many days it takes to release to production.
ASK• What processes are taking the longest as we release?• If there was a sudden decline, did we miss a step? What
does our quality look like?• Have there been escalations, causing priorities to shift?• Are quality issues hampering our ability to release?
Agile Leadership Metrics
Release Cycle Time
37
Release Cycle Time (in days)

WHYAs we learned earlier in this book, you get what you measure. Therefore, if we measure process improvement, it can help our team work to hold space to grow a process improvement mindset.
WHATProcess Improvement Efforts is a measurement of the process improvement items your team has worked on or is working on.
ASK• Are we allowing our team to prioritize process improvement
items?• Do we have a culture that focuses on continuous
improvement?
Agile Leadership Metrics
Process Improvement Efforts
38
Process Improvement Items by Quarter

• Net Promoter Score (NPS)
• Business Cycle Time
• Organization Impediment Age
Executive-LevelMetrics
Agile Metrics at Every Level
39

WHYNet Promoter Score helps an organization understand customer satisfaction. Teams can deliver a high-quality product quickly, but if the customer isn’t happy it may not really matter.
WHATThis score measures how products and services meet or surpass customer expectations. It is impacted by all three aspects of software quality: functional (what the software does), structural (whether the software meets standards), and process (how the code was built).
ASK• Is there an opportunity to adjust our acceptance criteria?• Are we inviting end users to our demos and adjusting
according to their feedback?• Have we objectively observed our end users in the wild?
Executive-Level Metrics
Net Promoter Score (NPS)
40
Net Promoter Score = # Promoters - # DetractorsTotal Responders Total Responders

WHYBusiness Cycle Time can help teams find areas of improvement, assesses how they are operating, and understand how changes are impacting the organization. This is a key metric for understanding the health of your work and your teams.
WHATThis metric measures the time from when a request was entered into your work tracking tool, to when all work on the item is completed and the request has been considered done by the team’s DoD. A steady or decreasing Business Cycle Time is preferred.
ASK• Has the team’s or teams’ makeup changed?• Does the team have a continuous improvement mindset?• Has the work complexity changed?• Are quality issues hampering the ability to deliver stories?
Executive-Level Metrics
Business Cycle Time
41
Avg. User Story Business Cycle Time in Days

WHYImpediments or waste slow down progress and can increase Lead (Business) and Production Cycle Time and frustrate employees. Note: some impediments are a slow burn.
WHATAn impediment is anything that slows the teams down, also known as waste, and Organization Impediment Age measures how long it takes to remove an impediment at the organizational level.
ASK• Do we have a culture that focuses on continuous
improvement?• Are we involving the right people/teams to solve the
impediment?
Executive-Level Metrics
Organization Impediment Age
42
Impediment Age (in days)

Software was already a critical component for most modern companies, and 2020 further enabled “IT to transition from supporting the business to being the business.”5 We hope these metrics help you understand the impact of a development project or transformation on team morale, productivity, delivered value, user satisfaction, and more.
No matter where you’re at in your Agile transformation, Polaris can help. If you’re wondering where to start, stalled out, or struggling to measure success, reach out for a free Agile Enablement discovery session.
About PolarisWe provide modern software solutions to help companies across industries bring out the best in their teams, increase productivity, and achieve bigger wins, faster. Our offerings include:
• Application Modernization• Agile Enablement• Azure Cloud Solutions• DevOps Enablement
Learn more at polarissolutions.com
[5] Gartner Forecasts Worldwide IT Spending to Grow, 2021
The Little Book of Agile Metrics
Ensuring Success
43

Authors
Angela DuganPeople Lead
www.polarissolutions.com
Sara CaldwellLead Agile Guide
44