Top 10 Agile Metrics
69
XBOSoft, Inc. All Rights Reserved. 1 Agile Metrics
Transcript of Top 10 Agile Metrics
XBOSoft, Inc. All Rights Reserved. 1
Agile
Metrics
XBOSoft
Founded in 2006Dedicated to software quality
Software QA Consulting
Software Testing
Offices in San Francisco, Beijing and Amsterdam
XBOSoft, Inc. All Rights Reserved. 2
House Rules
• Everyone except the speakers is muted
• Questions via gotowebinar control panel OR via Twitter @XBOSoft using #Top10AgileMetrics
• Questions can be asked throughout the webinar, and will be answered if possible
• You’ll receive information for recording after the webinar
XBOSoft, Inc. All Rights Reserved. 3
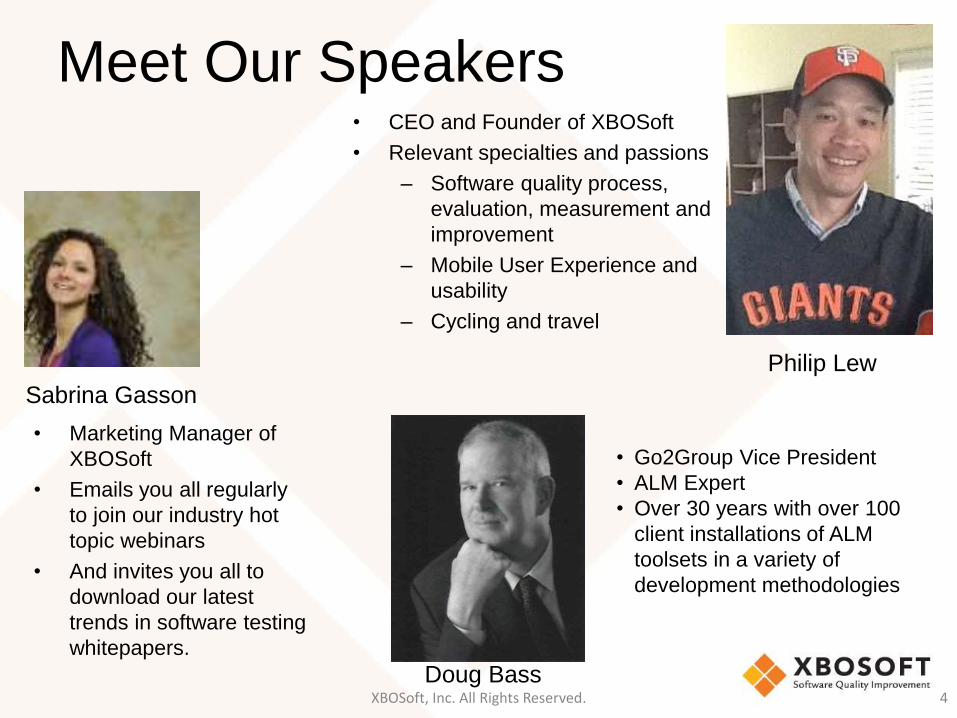
Meet Our Speakers• CEO and Founder of XBOSoft
• Relevant specialties and passions
– Software quality process,
evaluation, measurement and
improvement
– Mobile User Experience and
usability
– Cycling and travel
XBOSoft, Inc. All Rights Reserved. 4
Philip Lew
• Go2Group Vice President
• ALM Expert
• Over 30 years with over 100
client installations of ALM
toolsets in a variety of
development methodologies
Doug Bass
Sabrina Gasson
• Marketing Manager of
XBOSoft
• Emails you all regularly
to join our industry hot
topic webinars
• And invites you all to
download our latest
trends in software testing
whitepapers.

WHAT IS ONE OF THE MOST FAMOUS THINGS HE SAID?
XBOSoft, Inc. All Rights Reserved. 5
“LIFE IS LIKE A BOX OF CHOCOLATES, YOU NEVER KNOW WHAT YOU’RE GOING TO GET”
Agile Metrics
By using metrics, we can know what we are going to get!
Agenda
1. Agile, Frameworks and GQM
2. Applying GQM to Agile
3. Top 10 Agile Metrics
XBOSoft, Inc. All Rights Reserved. 7

Poll
XBOSoft, Inc. All Rights Reserved. 8

What We Can Agree On
• Want to minimize mistakes and doing things over (rework)
• Want to utilize resources effectively
• Want to predict when things could go wrong
• Want to do what we say we will do, when we say - timelines
• Fix defects early – later is more expensive
• Production defects are bad news
XBOSoft, Inc. All Rights Reserved. 10
What We Can Agree On About Metrics
• Want easy to get/capture
• Should have a valuable purpose toward improvement
– Evaluate
– Guide
– Insightful
– Actionable
XBOSoft, Inc. All Rights Reserved. 11
Agile – How Can We Improve?
• Some say no metrics needed
• Is velocity all you track?
• What is sacrificed for velocity?
• How can we know what and how we are doing or where to improve?
• How do we know if we’re using resources effectively?
• How do we know we are spending our effort/time in the right place?
XBOSoft, Inc. All Rights Reserved. 12

Poll
XBOSoft, Inc. All Rights Reserved. 13
Using Frameworks to
Organizing Our Thoughts
• Putting metrics into a framework helps us
to categorize and organize
• Helps us to make sure we have all
functions in our organization and process
covered
• Helps us to develop relationships between
different elements in our process
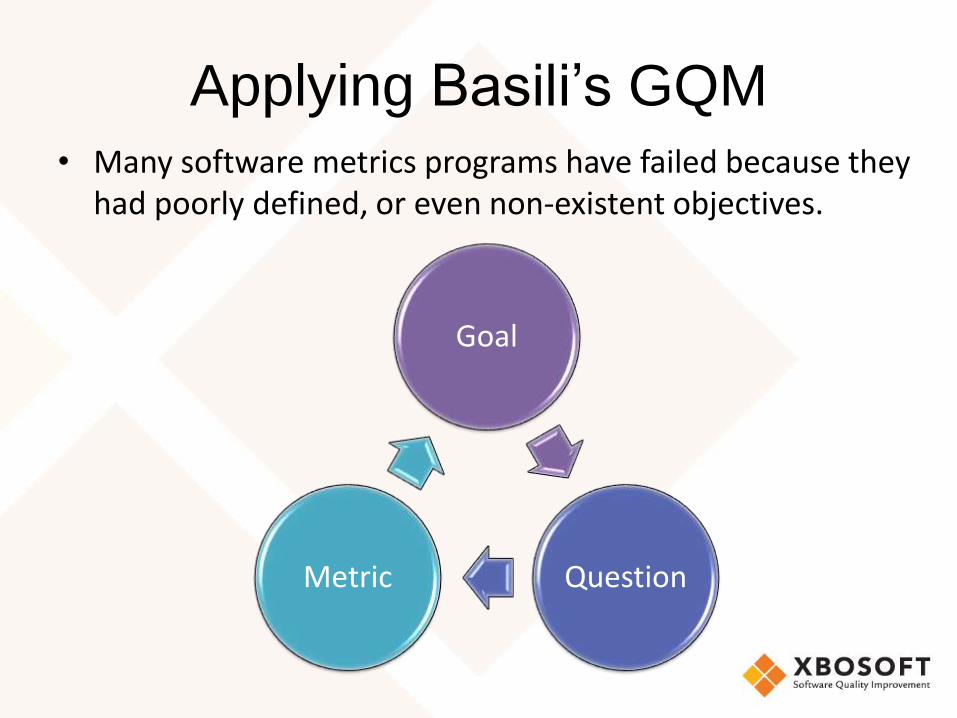
Applying Basili’s GQM• Many software metrics programs have failed because they
had poorly defined, or even non-existent objectives.
Goal
QuestionMetric
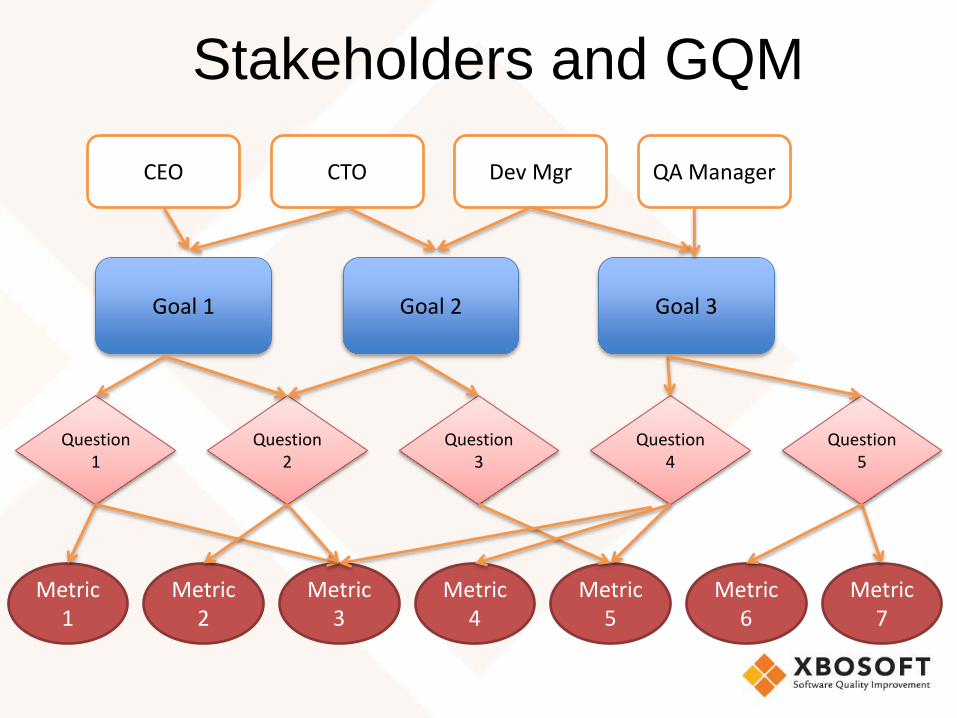
Stakeholders and GQM
Goal 1 Goal 2 Goal 3
Question 1
Question 2
Question 3
Question 4
Question 5
Metric 1
Metric 2
Metric 3
Metric 4
Metric 5
Metric 6
Metric 7
QA ManagerDev MgrCTOCEO
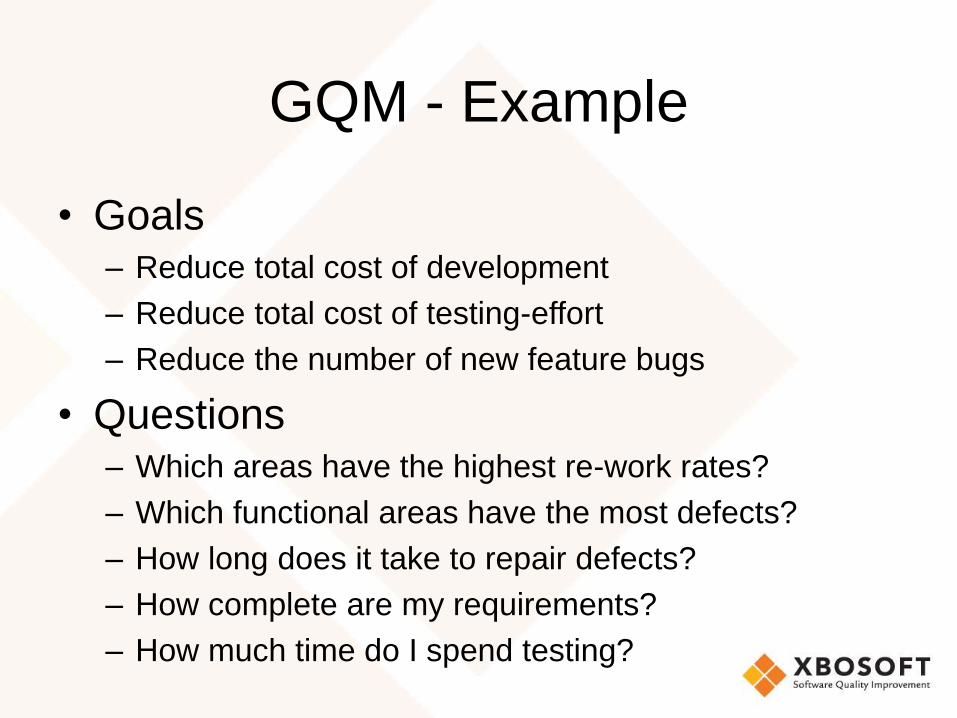
GQM - Example
• Goals– Reduce total cost of development
– Reduce total cost of testing-effort
– Reduce the number of new feature bugs
• Questions– Which areas have the highest re-work rates?
– Which functional areas have the most defects?
– How long does it take to repair defects?
– How complete are my requirements?
– How much time do I spend testing?
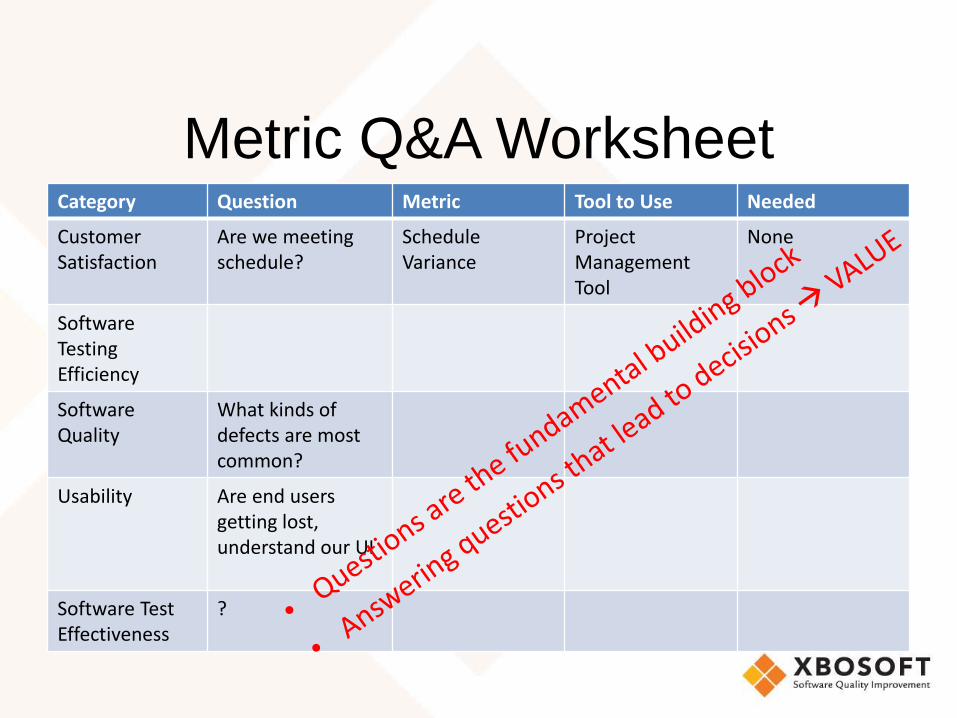
Metric Q&A WorksheetCategory Question Metric Tool to Use Needed
Customer Satisfaction
Are we meeting schedule?
Schedule Variance
Project Management Tool
None
SoftwareTesting Efficiency
SoftwareQuality
What kinds of defects are most common?
Usability Are end users getting lost, understand our UI
Software Test Effectiveness
?
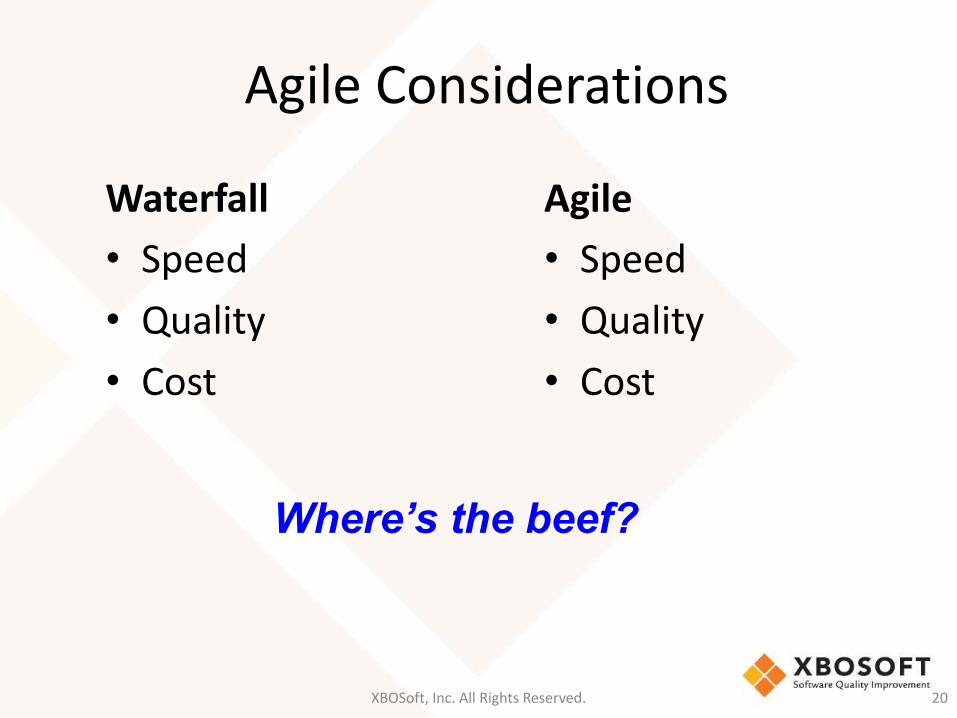
Agile Considerations
Waterfall
• Speed
• Quality
• Cost
Agile
• Speed
• Quality
• Cost
XBOSoft, Inc. All Rights Reserved. 20
Where’s the beef?
RETURN TO BASICSAgile Manifesto
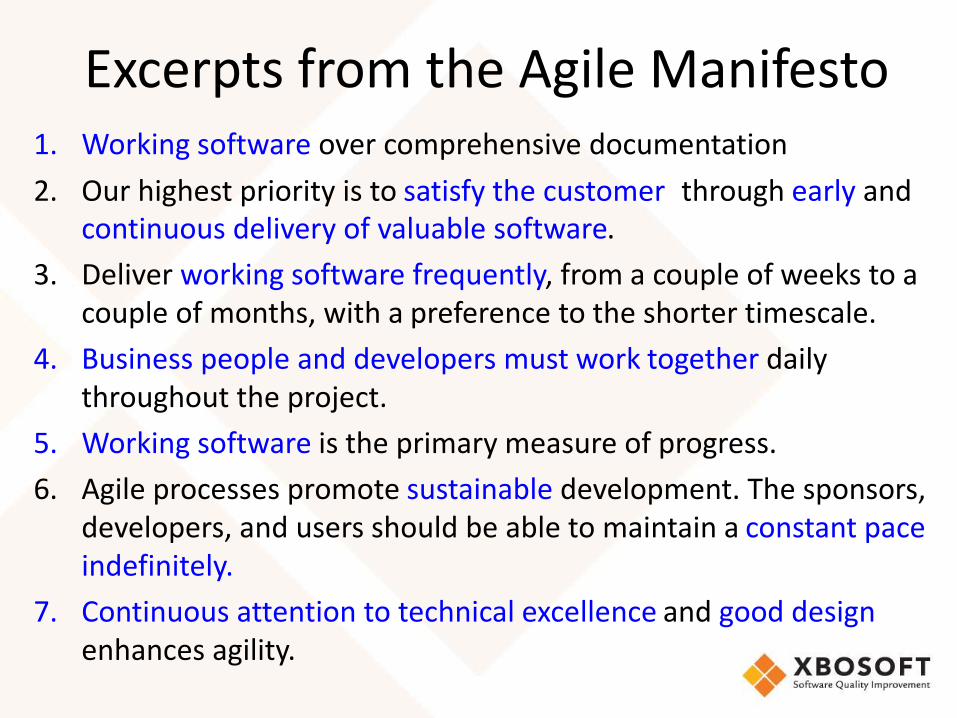
Excerpts from the Agile Manifesto1. Working software over comprehensive documentation
2. Our highest priority is to satisfy the customer through early and continuous delivery of valuable software.
3. Deliver working software frequently, from a couple of weeks to a couple of months, with a preference to the shorter timescale.
4. Business people and developers must work together daily throughout the project.
5. Working software is the primary measure of progress.
6. Agile processes promote sustainable development. The sponsors, developers, and users should be able to maintain a constant pace indefinitely.
7. Continuous attention to technical excellence and good design enhances agility.
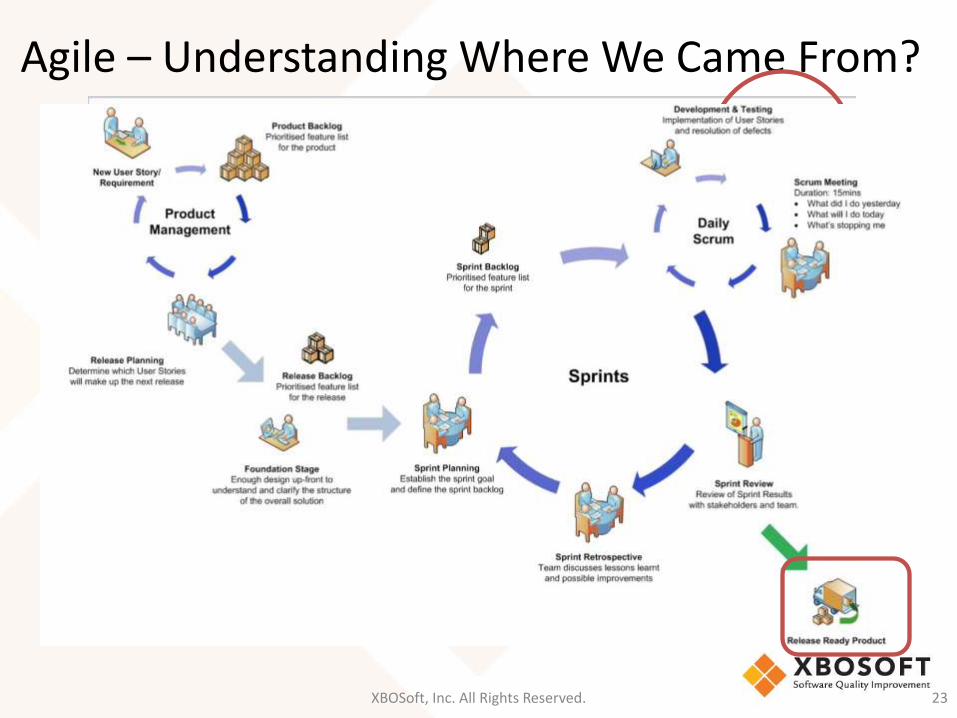
Agile – Understanding Where We Came From?
XBOSoft, Inc. All Rights Reserved. 23

Poll
XBOSoft, Inc. All Rights Reserved. 24
What are the Goals of Agile?
Speed Quality
Customer-User Satisfaction
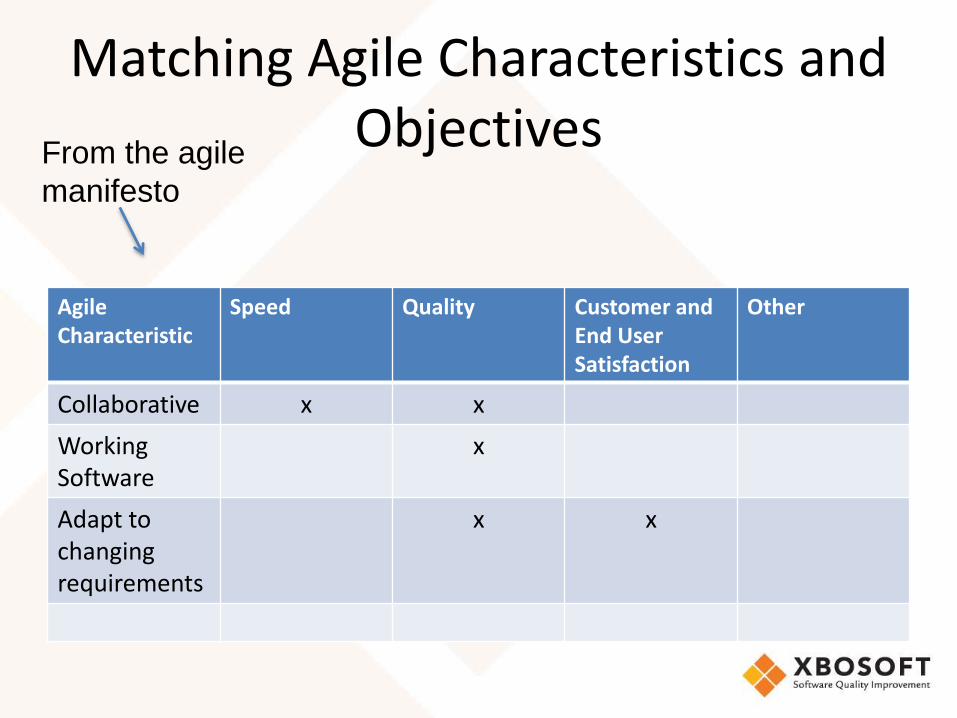
Matching Agile Characteristics and Objectives
AgileCharacteristic
Speed Quality Customer and End User Satisfaction
Other
Collaborative x x
WorkingSoftware
x
Adapt to changingrequirements
x x
From the agile
manifesto
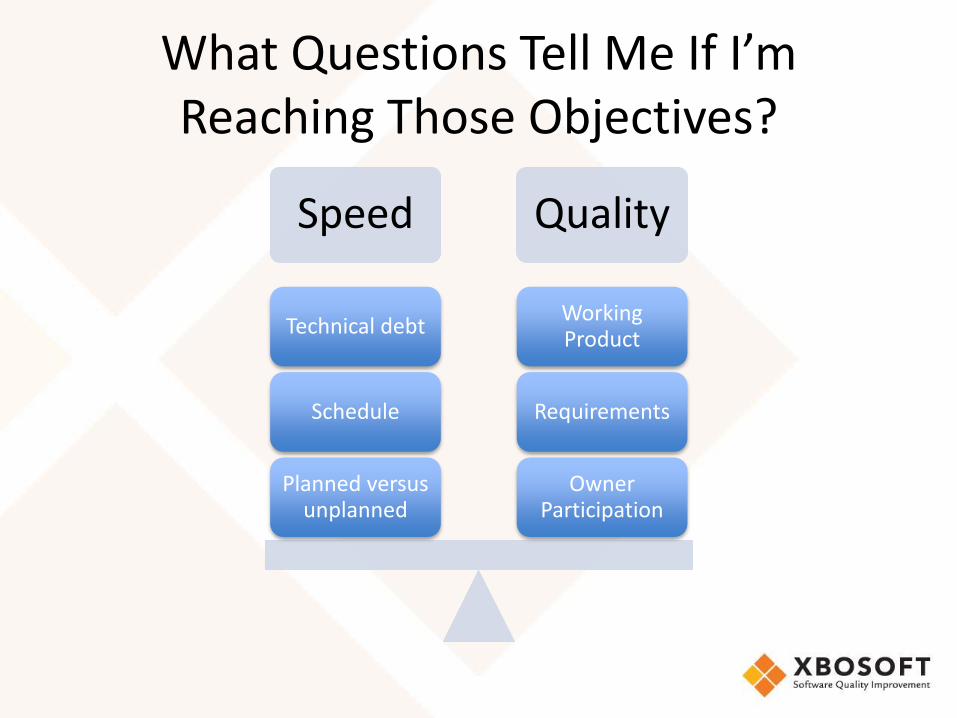
What Questions Tell Me If I’m Reaching Those Objectives?
Speed Quality
Owner Participation
Requirements
Working Product
Planned versus unplanned
Schedule
Technical debt
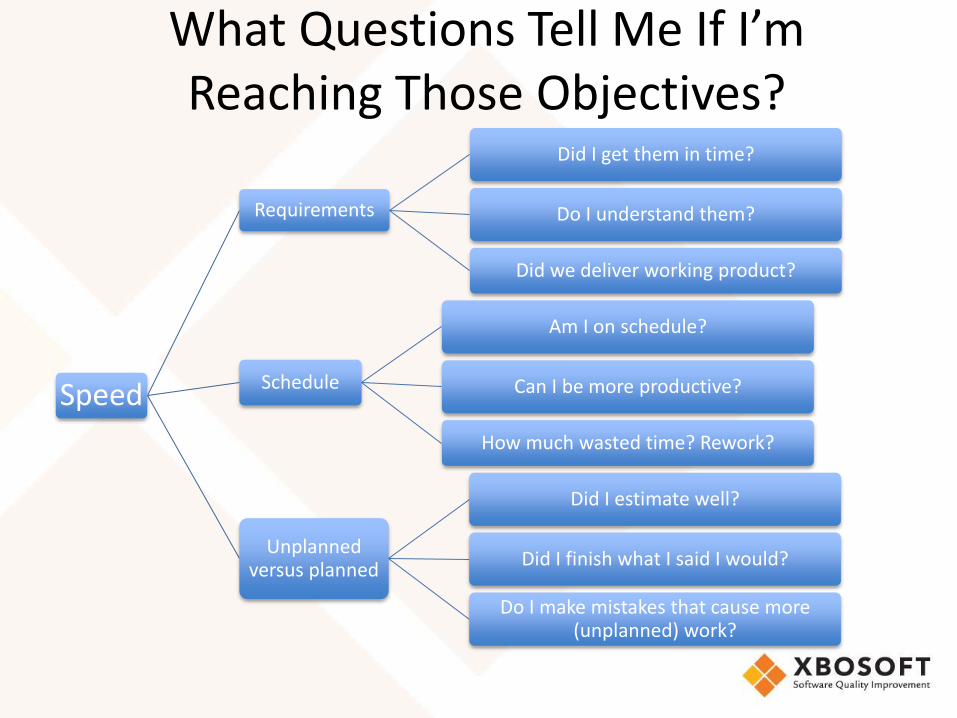
What Questions Tell Me If I’m Reaching Those Objectives?
Speed
Requirements
Did I get them in time?
Do I understand them?
Did we deliver working product?
Schedule
Am I on schedule?
Can I be more productive?
How much wasted time? Rework?
Unplanned versus planned
Did I estimate well?
Did I finish what I said I would?
Do I make mistakes that cause more (unplanned) work?
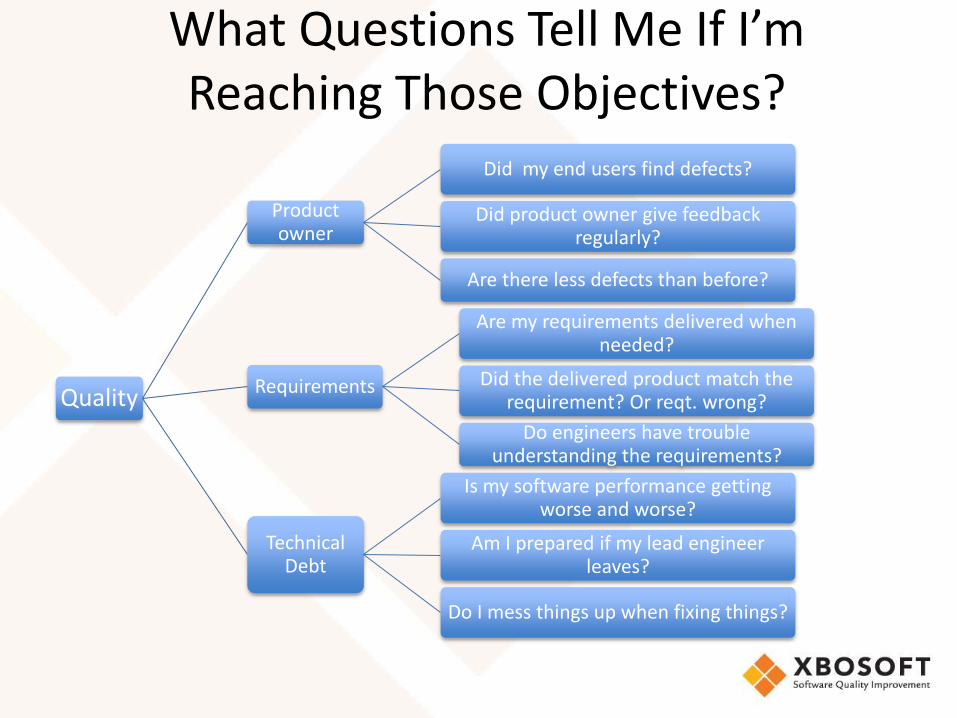
What Questions Tell Me If I’m Reaching Those Objectives?
Quality
Product owner
Did my end users find defects?
Did product owner give feedback regularly?
Are there less defects than before?
Requirements
Are my requirements delivered when needed?
Did the delivered product match the requirement? Or reqt. wrong?
Do engineers have trouble understanding the requirements?
Technical Debt
Is my software performance getting worse and worse?
Am I prepared if my lead engineer leaves?
Do I mess things up when fixing things?

METRICS THAT HELP US ANSWER THESE QUESTIONS!
ARE YOU READY FOR THE COUNTDOWN?

VELOCITY
10.
XBOSoft, Inc. All Rights Reserved. 32
Am I on schedule?
Did I estimate well?
Velocity
• Tracking our velocity over time tells us our progress and capacity and helps us forecast based on our capabilities (now and in the future).
• Measurement – Sum of all the approved estimates of the stories
• One point in time measurement has little meaning, so need to track over time or wrt another metric
• Metric – Velocity (T)-(T-1)/Velocity (T)
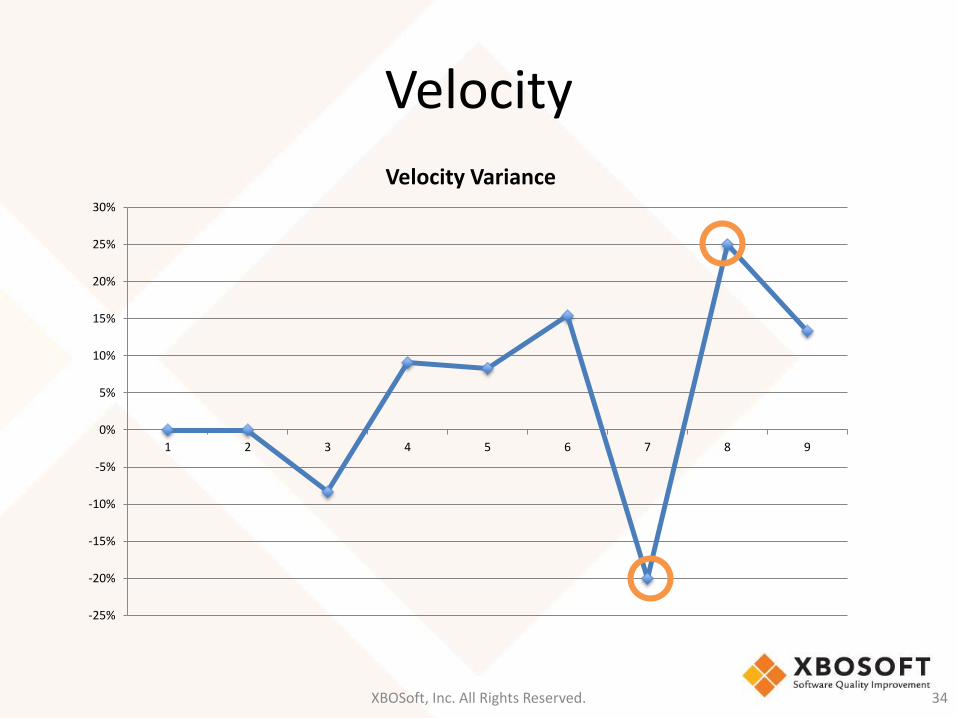
Velocity
XBOSoft, Inc. All Rights Reserved. 34
-25%
-20%
-15%
-10%
-5%
0%
5%
10%
15%
20%
25%
30%
1 2 3 4 5 6 7 8 9
Velocity Variance
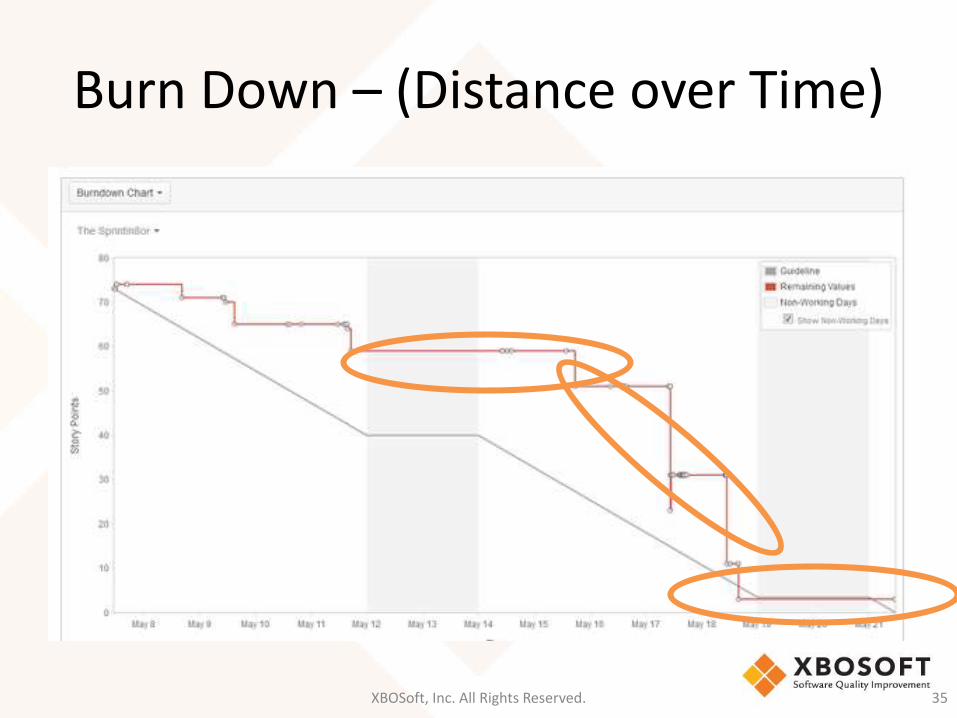
Burn Down – (Distance over Time)
XBOSoft, Inc. All Rights Reserved. 35
DEFECT REMOVAL EFFECTIVENESS
9.
XBOSoft, Inc. All Rights Reserved. 36
Did my end users find defects?
Are there less defects than before?
Defect Removal Effectiveness
• We don’t want the end user to find defects
• Any defect found by the user influences quality
• Metric – Defects in found in production during (90 day) period post release (DFP)/DFP + Defects found Pre-release
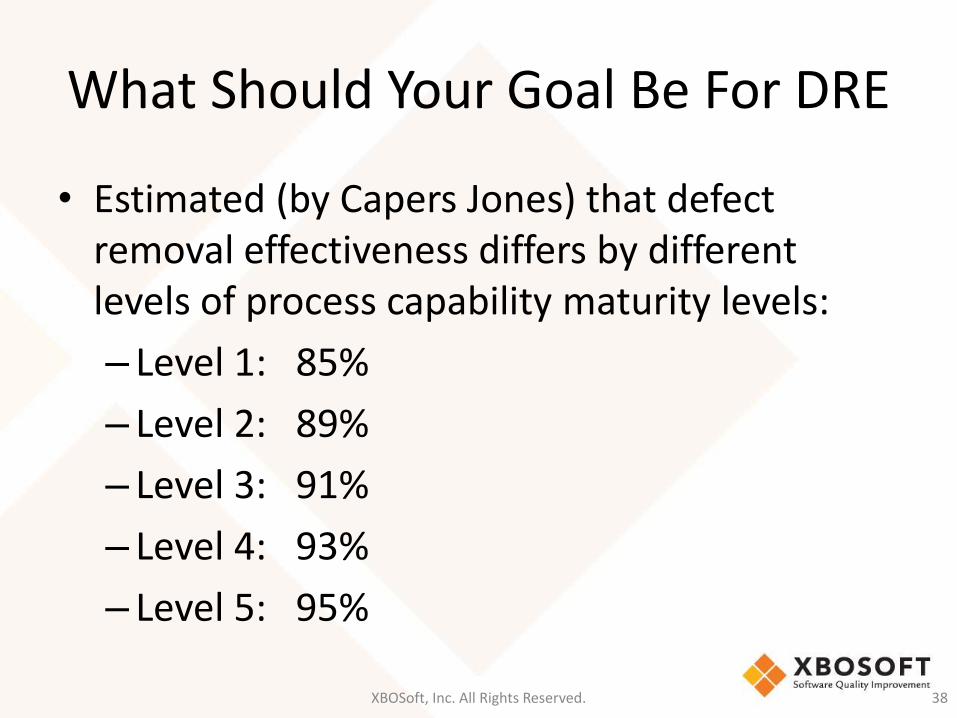
What Should Your Goal Be For DRE
• Estimated (by Capers Jones) that defect removal effectiveness differs by different levels of process capability maturity levels:
– Level 1: 85%
– Level 2: 89%
– Level 3: 91%
– Level 4: 93%
– Level 5: 95%
XBOSoft, Inc. All Rights Reserved. 38
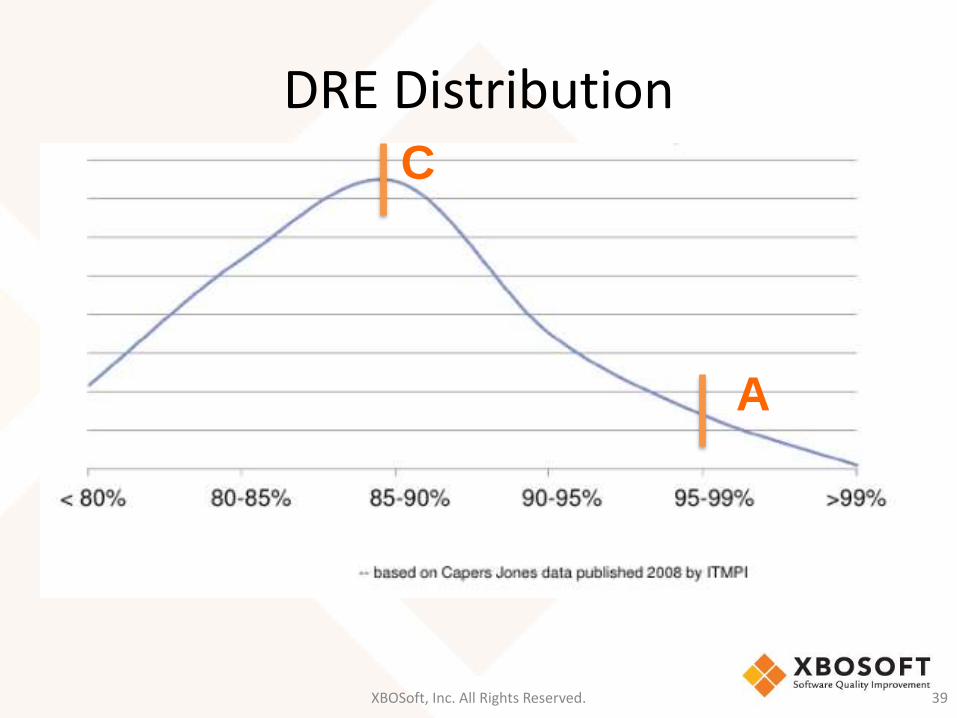
DRE Distribution
XBOSoft, Inc. All Rights Reserved. 39
C
A
ADDED WORK
8.
XBOSoft, Inc. All Rights Reserved. 40
Am I on schedule?
Am I overcommitting?
Is my rate of work sustainable?
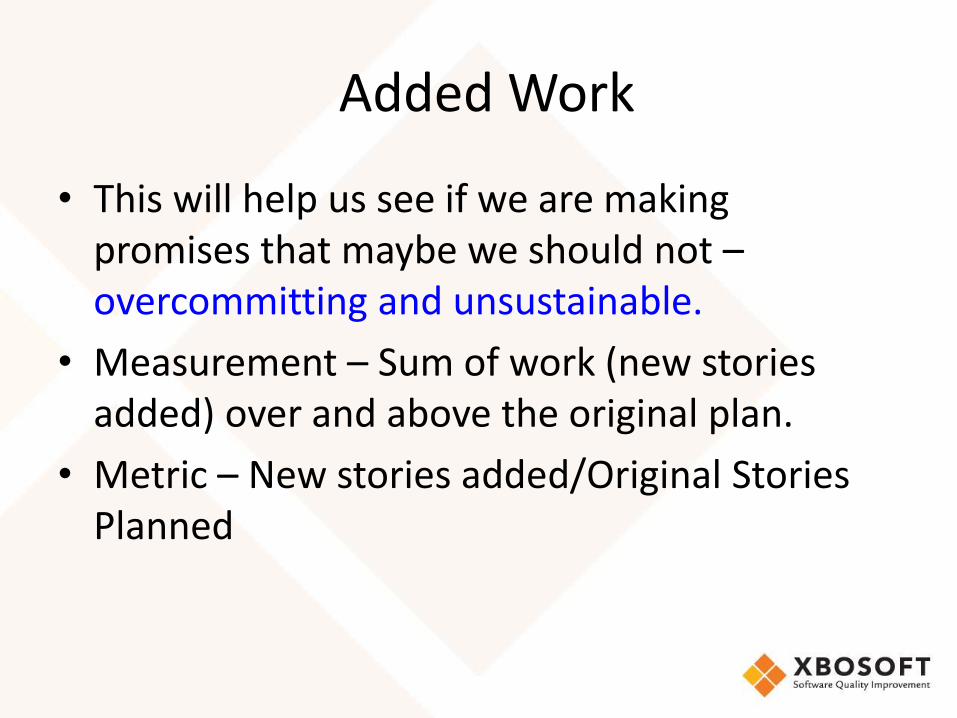
Added Work
• This will help us see if we are making promises that maybe we should not –overcommitting and unsustainable.
• Measurement – Sum of work (new stories added) over and above the original plan.
• Metric – New stories added/Original Stories Planned
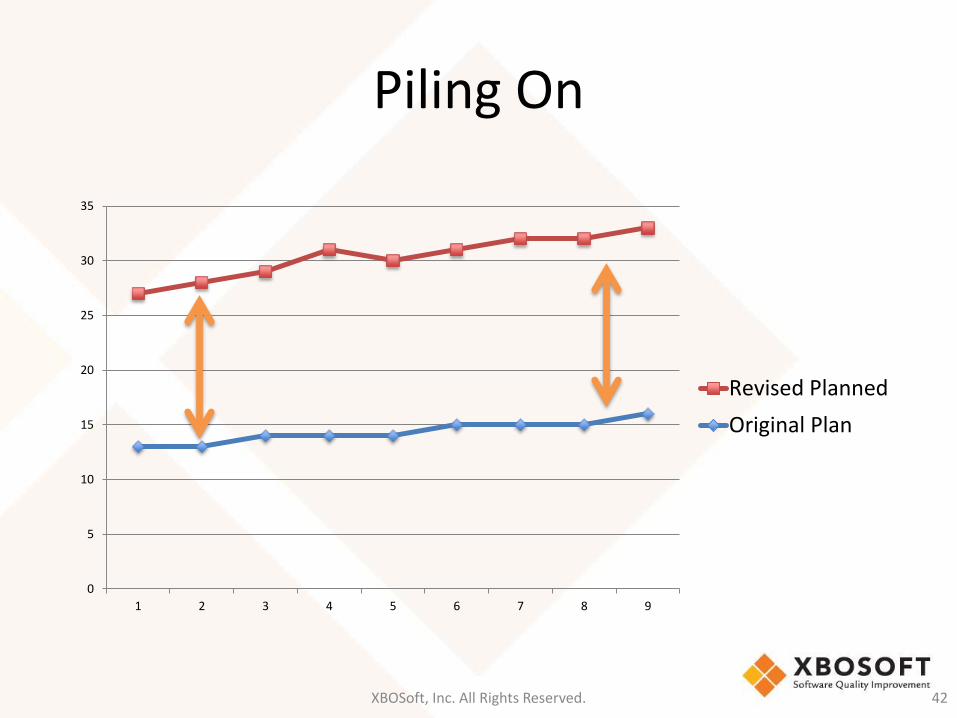
Piling On
XBOSoft, Inc. All Rights Reserved. 42
0
5
10
15
20
25
30
35
1 2 3 4 5 6 7 8 9
Revised Planned
Original Plan
WORK CATEGORY ALLOCATION
7.
XBOSoft, Inc. All Rights Reserved. 43
Am I allocating resources optimally?
Do I have trouble understanding requirements?
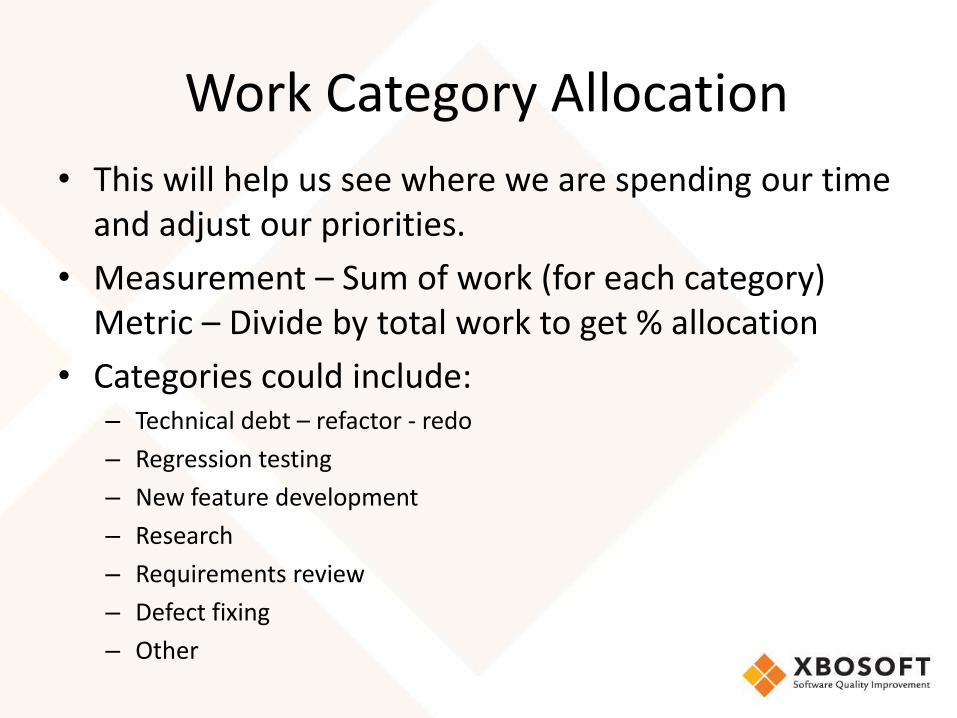
Work Category Allocation
• This will help us see where we are spending our time and adjust our priorities.
• Measurement – Sum of work (for each category) Metric – Divide by total work to get % allocation
• Categories could include:– Technical debt – refactor - redo
– Regression testing
– New feature development
– Research
– Requirements review
– Defect fixing
– Other
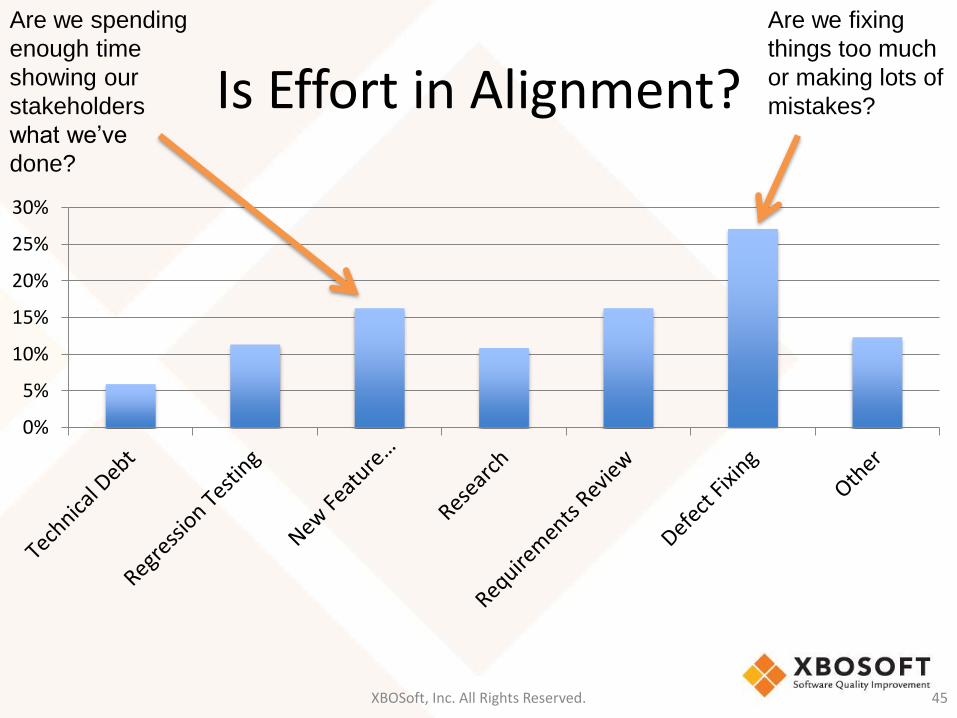
Is Effort in Alignment?
XBOSoft, Inc. All Rights Reserved. 45
0%
5%
10%
15%
20%
25%
30%
Are we spending
enough time
showing our
stakeholders
what we’ve
done?
Are we fixing
things too much
or making lots of
mistakes?
WORK SUSTAINABILITY
6.
XBOSoft, Inc. All Rights Reserved. 46
Do I have the right people on my team?
Did I estimate work well?
Can I attain quality sustainably?
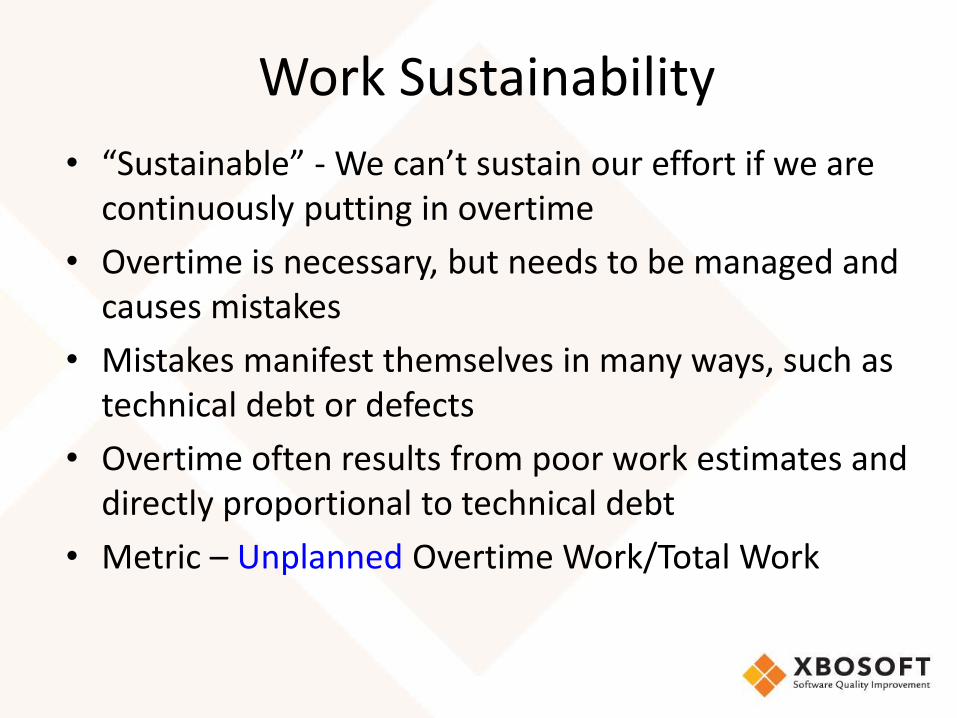
Work Sustainability
• “Sustainable” - We can’t sustain our effort if we are continuously putting in overtime
• Overtime is necessary, but needs to be managed and causes mistakes
• Mistakes manifest themselves in many ways, such as technical debt or defects
• Overtime often results from poor work estimates and directly proportional to technical debt
• Metric – Unplanned Overtime Work/Total Work
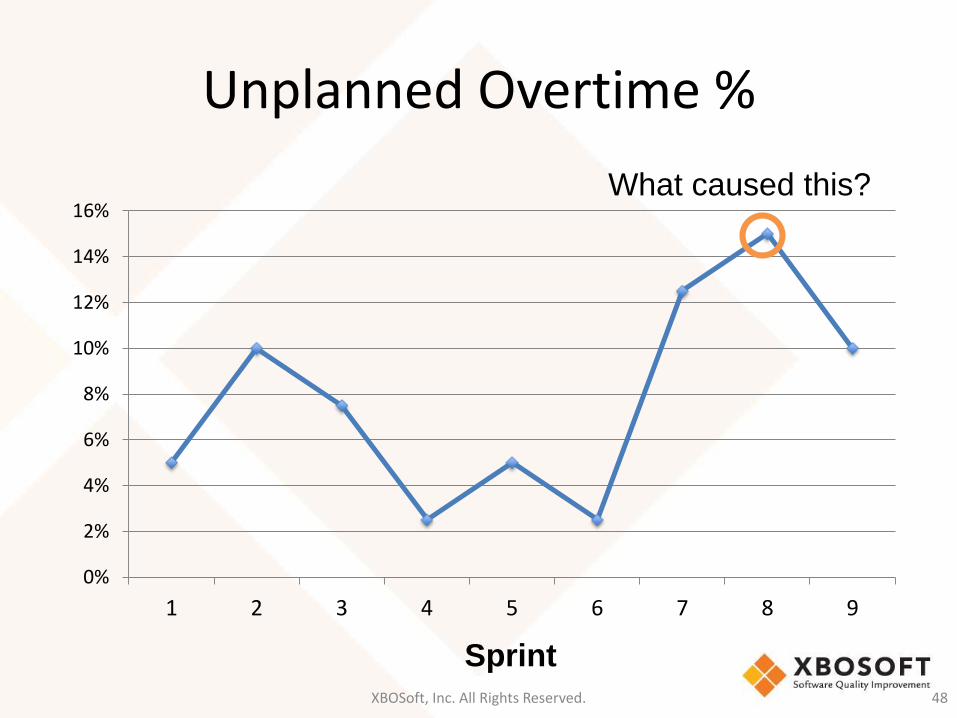
Unplanned Overtime %
XBOSoft, Inc. All Rights Reserved. 48
0%
2%
4%
6%
8%
10%
12%
14%
16%
1 2 3 4 5 6 7 8 9
Sprint
What caused this?
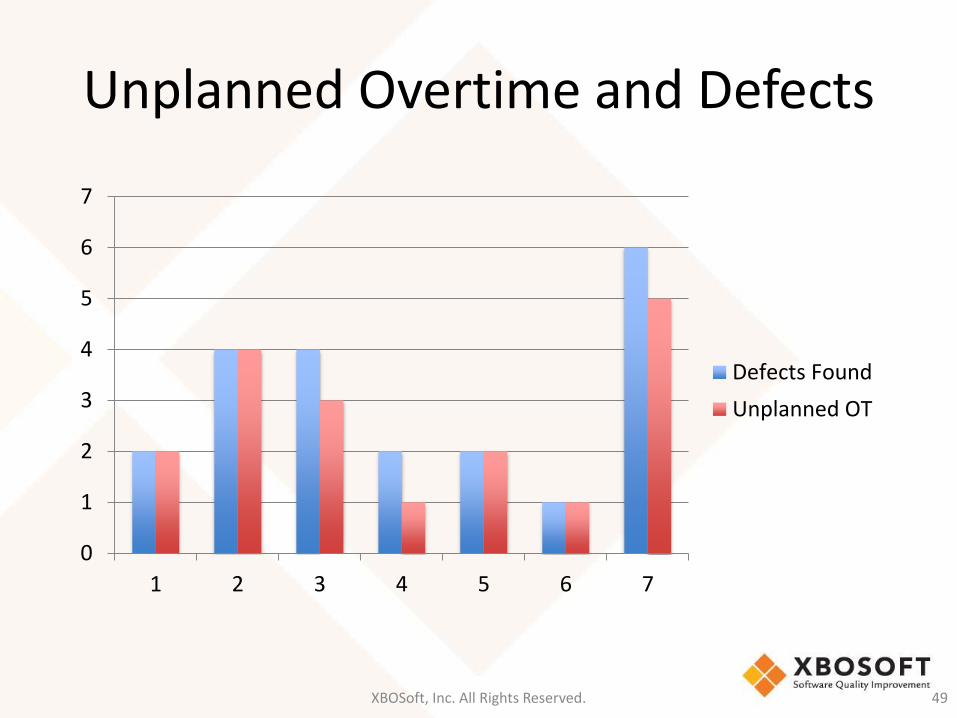
Unplanned Overtime and Defects
XBOSoft, Inc. All Rights Reserved. 49
0
1
2
3
4
5
6
7
1 2 3 4 5 6 7
Defects Found
Unplanned OT
DEFECT REWORK RATE
5.
XBOSoft, Inc. All Rights Reserved. 50
Is my technical debt accumulating?
Am I wasting time?
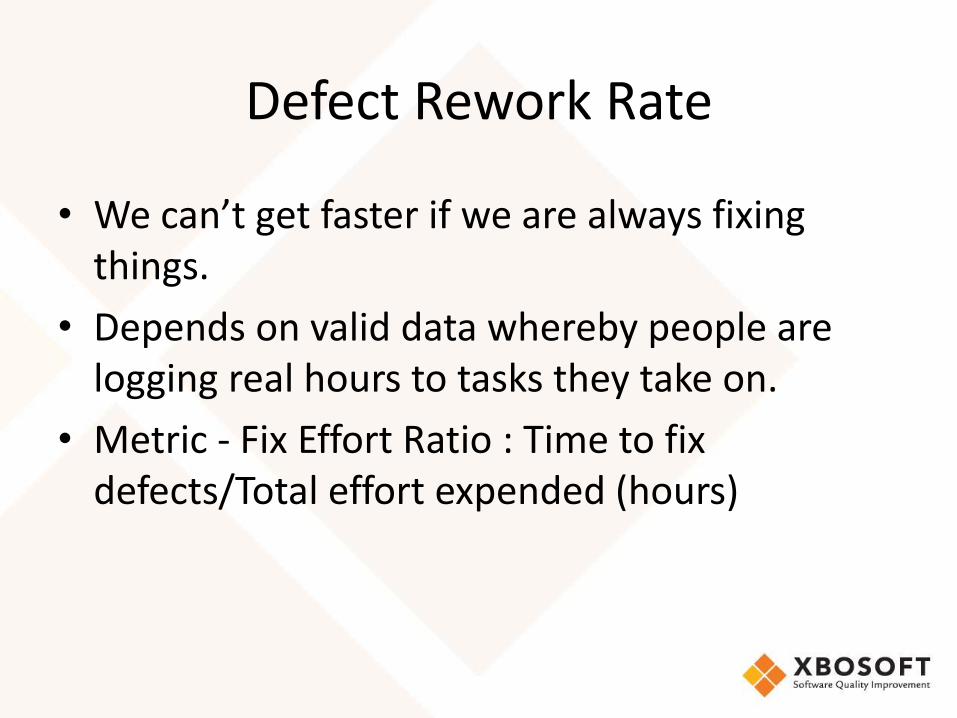
Defect Rework Rate
• We can’t get faster if we are always fixing things.
• Depends on valid data whereby people are logging real hours to tasks they take on.
• Metric - Fix Effort Ratio : Time to fix defects/Total effort expended (hours)
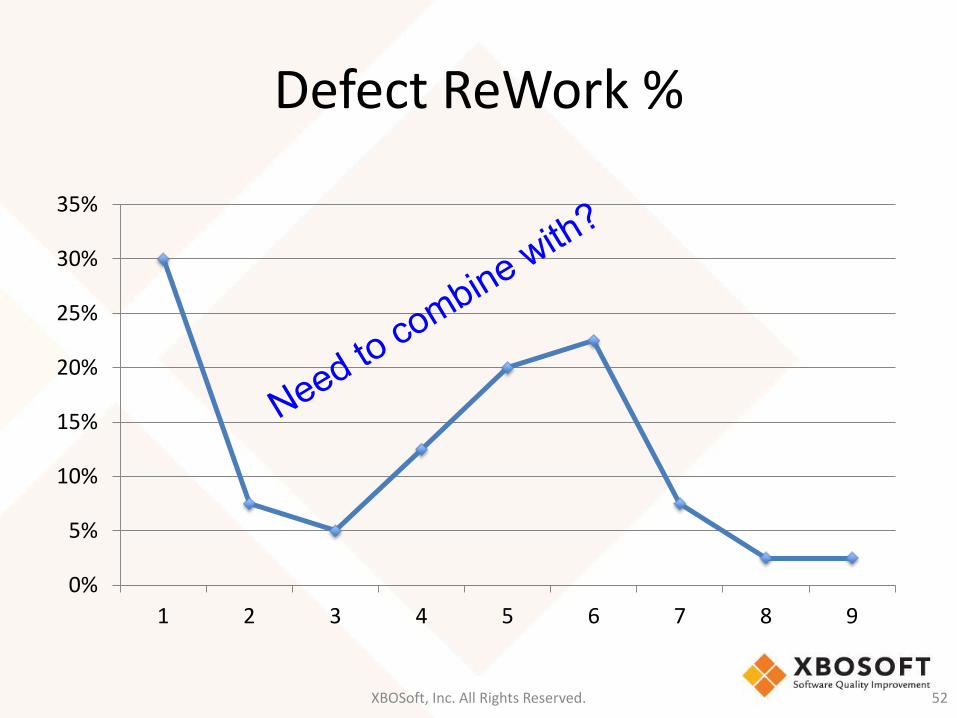
Defect ReWork %
XBOSoft, Inc. All Rights Reserved. 52
0%
5%
10%
15%
20%
25%
30%
35%
1 2 3 4 5 6 7 8 9
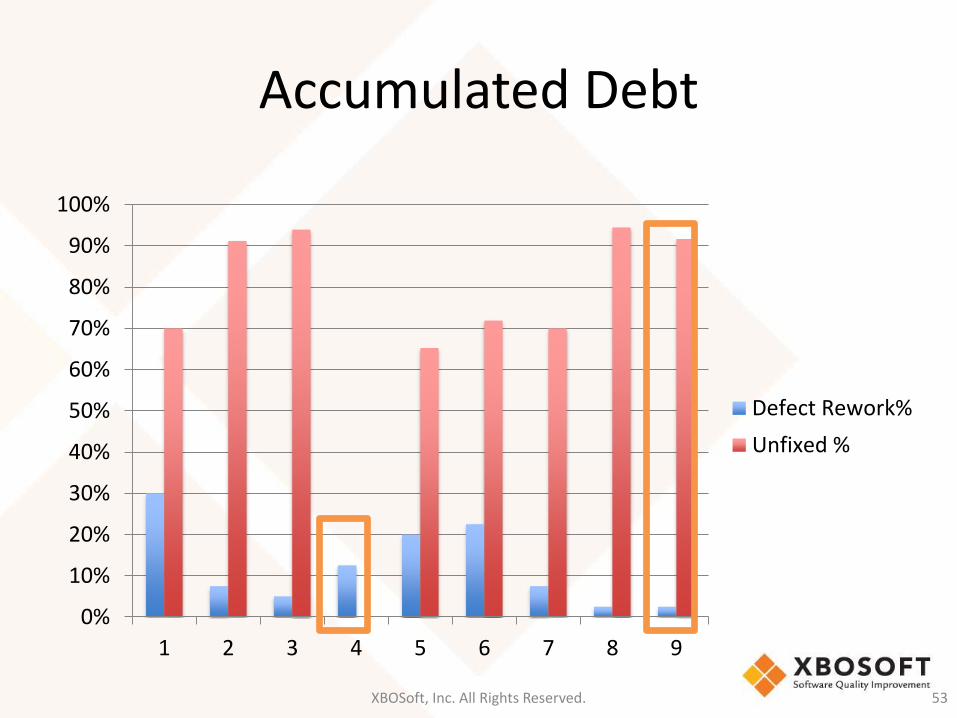
Accumulated Debt
XBOSoft, Inc. All Rights Reserved. 53
0%
10%
20%
30%
40%
50%
60%
70%
80%
90%
100%
1 2 3 4 5 6 7 8 9
Defect Rework%
Unfixed %
TOTAL UNEXPECTED WORK
4.
XBOSoft, Inc. All Rights Reserved. 54
What is throwing me off schedule?
Am I biting off too much?
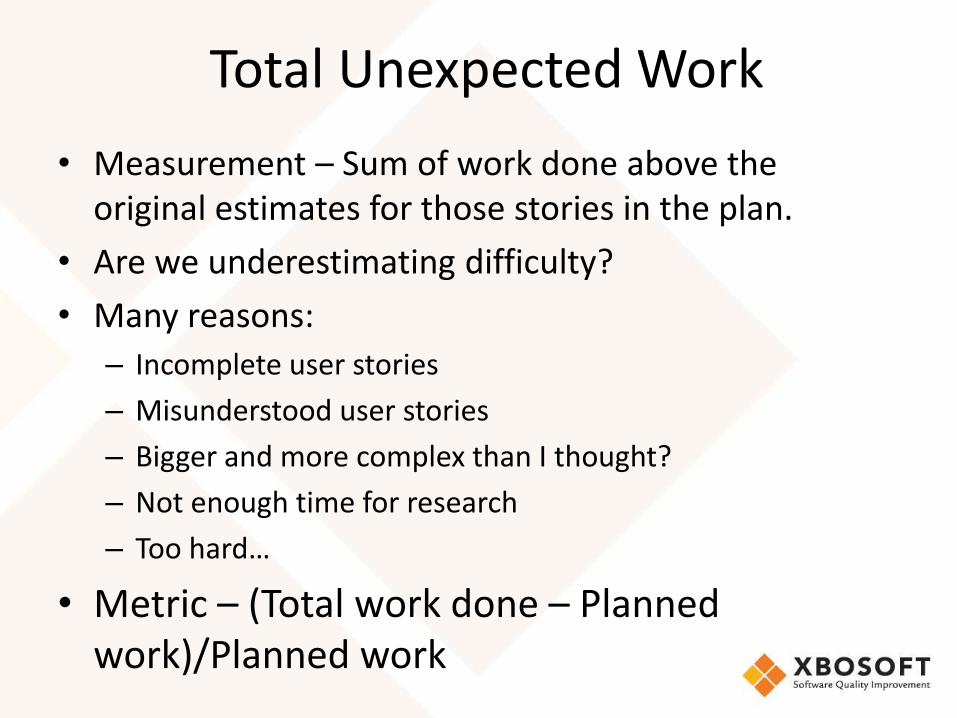
Total Unexpected Work
• Measurement – Sum of work done above the original estimates for those stories in the plan.
• Are we underestimating difficulty?
• Many reasons:
– Incomplete user stories
– Misunderstood user stories
– Bigger and more complex than I thought?
– Not enough time for research
– Too hard…
• Metric – (Total work done – Planned work)/Planned work
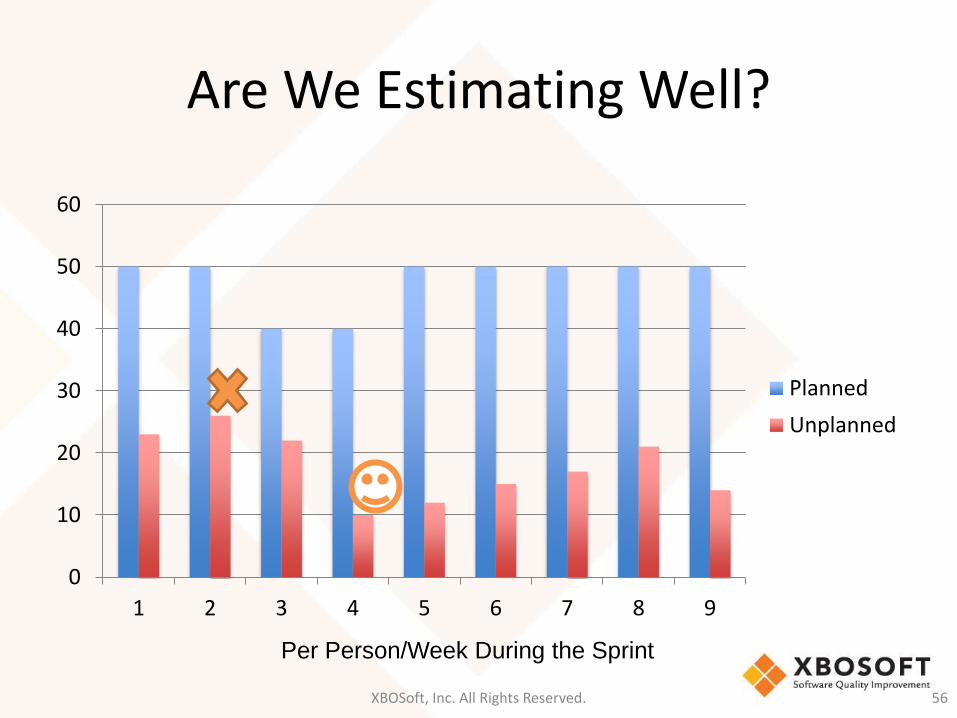
Are We Estimating Well?
XBOSoft, Inc. All Rights Reserved. 56
0
10
20
30
40
50
60
1 2 3 4 5 6 7 8 9
Planned
Unplanned
Per Person/Week During the Sprint
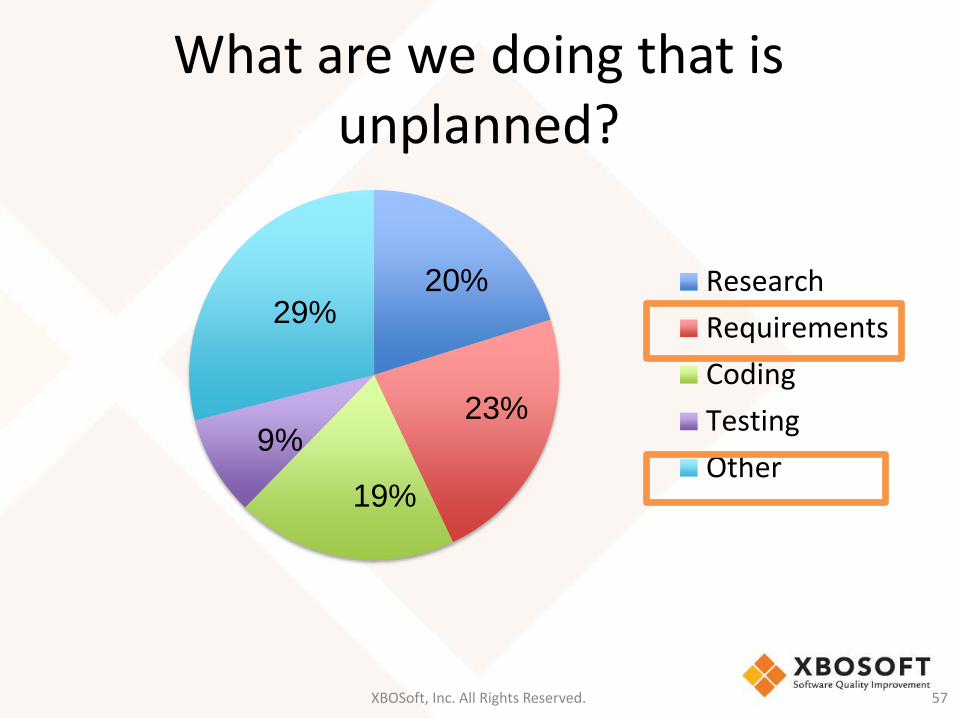
What are we doing that is unplanned?
XBOSoft, Inc. All Rights Reserved. 57
Research
Requirements
Coding
Testing
Other
29%
9%
19%
23%
20%
DEFECTS IN PRODUCTION AVG. FIX TIME
3.
XBOSoft, Inc. All Rights Reserved. 58
Are my customers/end users happy?
Is the architecture prohibiting me?
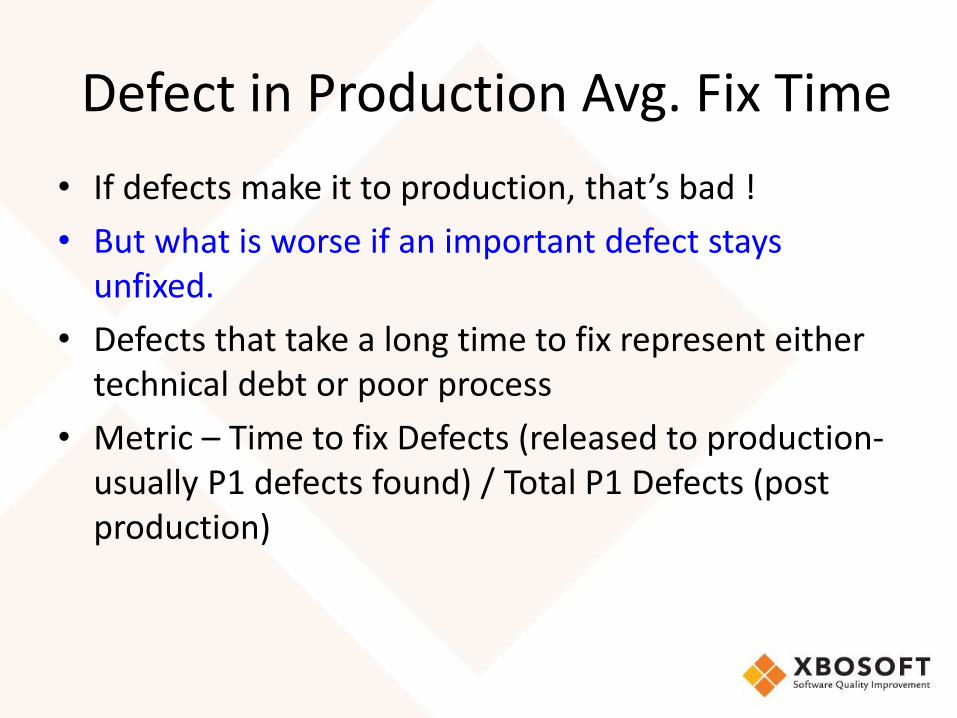
Defect in Production Avg. Fix Time
• If defects make it to production, that’s bad !
• But what is worse if an important defect stays unfixed.
• Defects that take a long time to fix represent either technical debt or poor process
• Metric – Time to fix Defects (released to production-usually P1 defects found) / Total P1 Defects (post production)
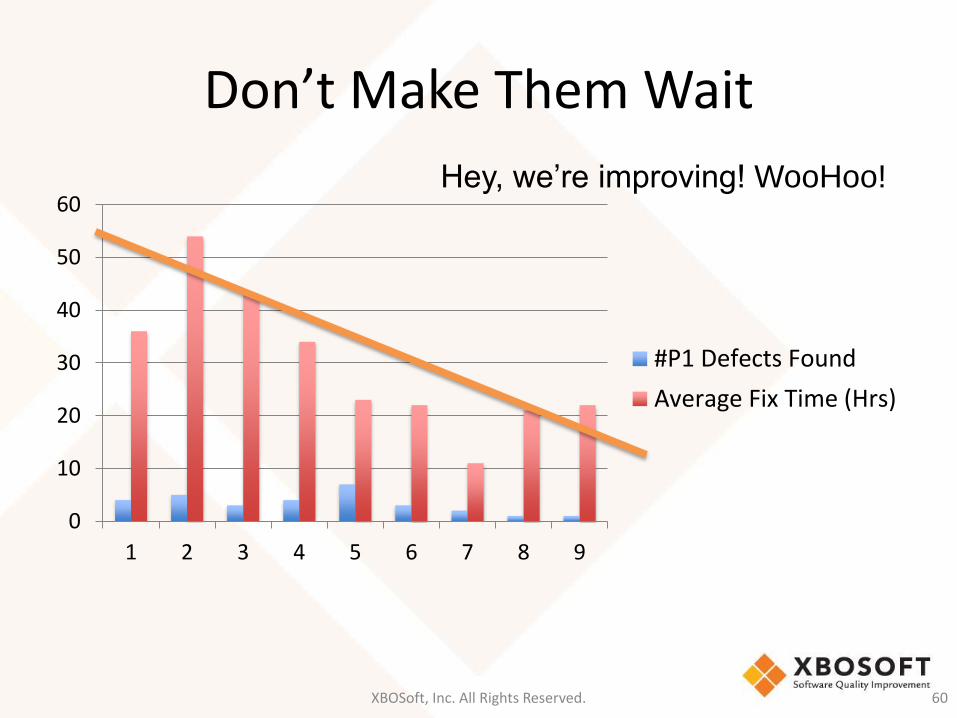
Don’t Make Them Wait
XBOSoft, Inc. All Rights Reserved. 60
0
10
20
30
40
50
60
1 2 3 4 5 6 7 8 9
#P1 Defects Found
Average Fix Time (Hrs)
Hey, we’re improving! WooHoo!
DEFECT CATEGORIZATION ALLOCATION %
2.
XBOSoft, Inc. All Rights Reserved. 61
Why are things breaking?
Can I get faster?
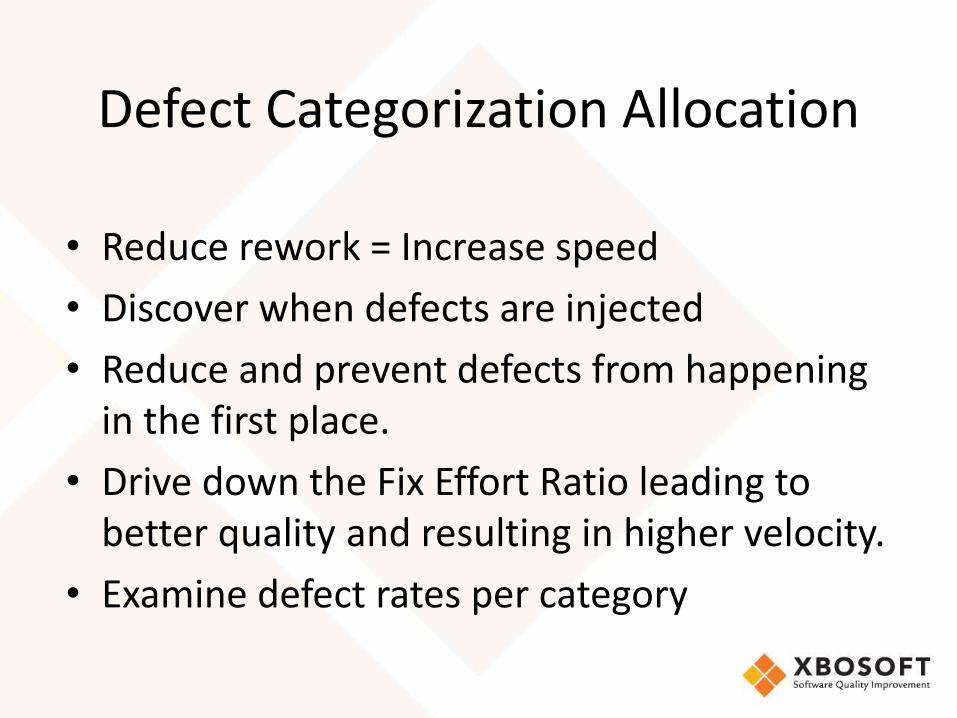
Defect Categorization Allocation
• Reduce rework = Increase speed
• Discover when defects are injected
• Reduce and prevent defects from happening in the first place.
• Drive down the Fix Effort Ratio leading to better quality and resulting in higher velocity.
• Examine defect rates per category
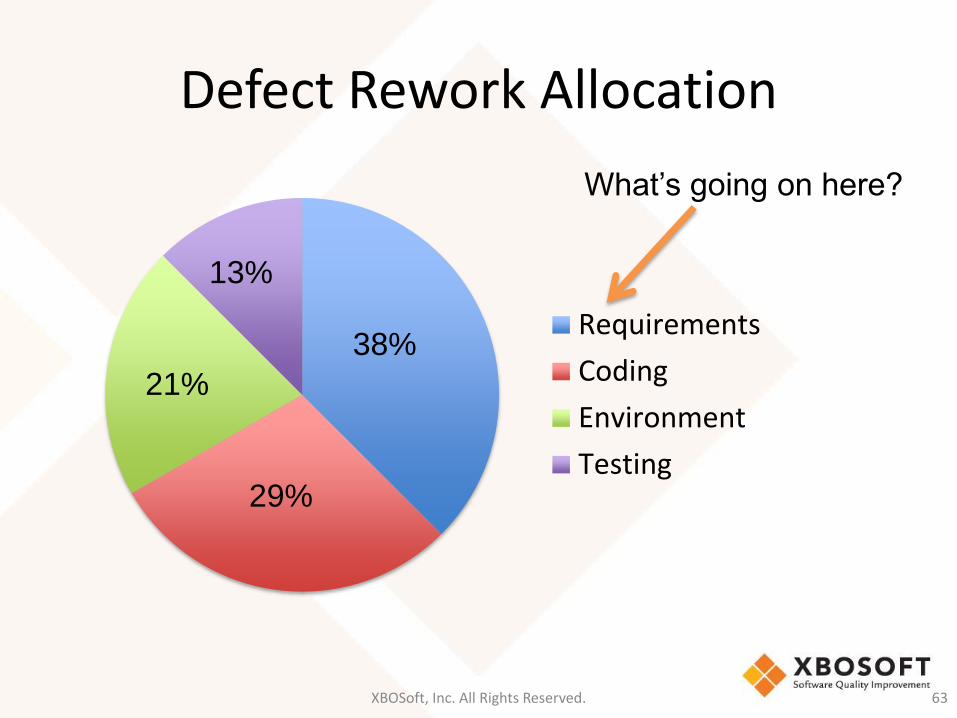
Defect Rework Allocation
XBOSoft, Inc. All Rights Reserved. 63
Requirements
Coding
Environment
Testing
38%
29%
21%
13%
What’s going on here?
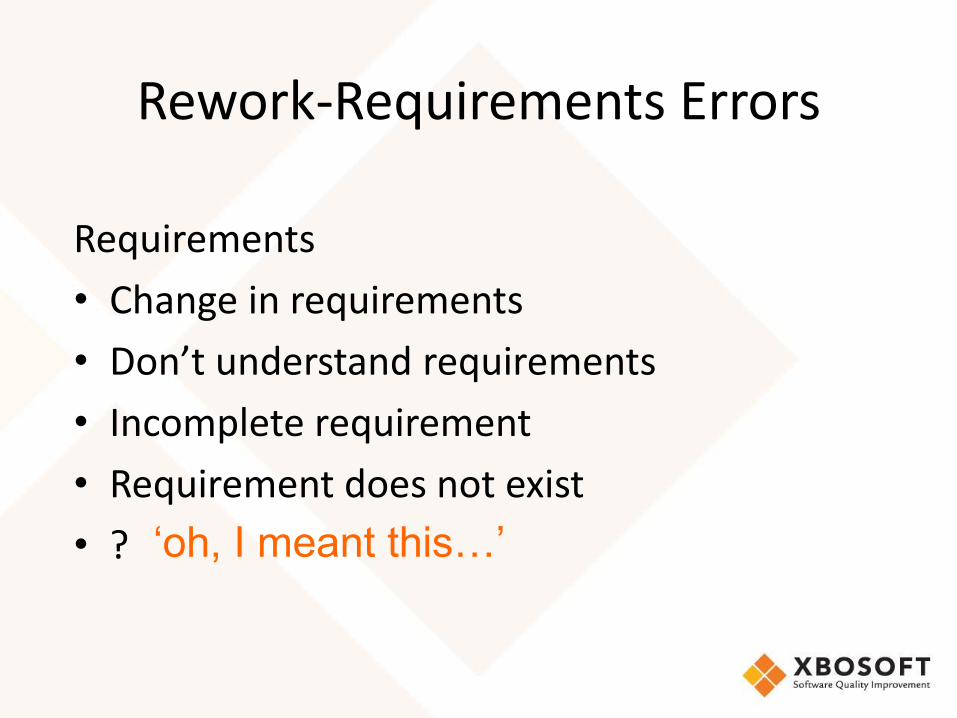
Rework-Requirements Errors
Requirements
• Change in requirements
• Don’t understand requirements
• Incomplete requirement
• Requirement does not exist
• ? ‘oh, I meant this…’

Poll
XBOSoft, Inc. All Rights Reserved. 65
WORKING SOFTWARE DELIVERY RATE
1.
XBOSoft, Inc. All Rights Reserved. 67
Am I delivering what I said I would?
Am I getting feedback from the PO?
Will I meet the release date?
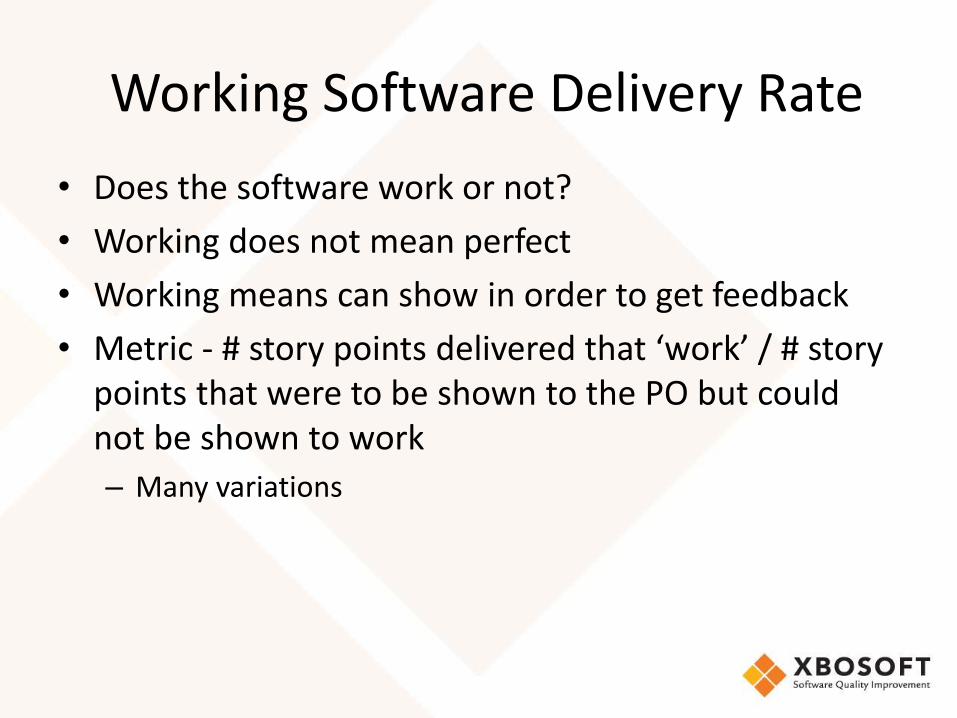
Working Software Delivery Rate
• Does the software work or not?
• Working does not mean perfect
• Working means can show in order to get feedback
• Metric - # story points delivered that ‘work’ / # story points that were to be shown to the PO but could not be shown to work
– Many variations
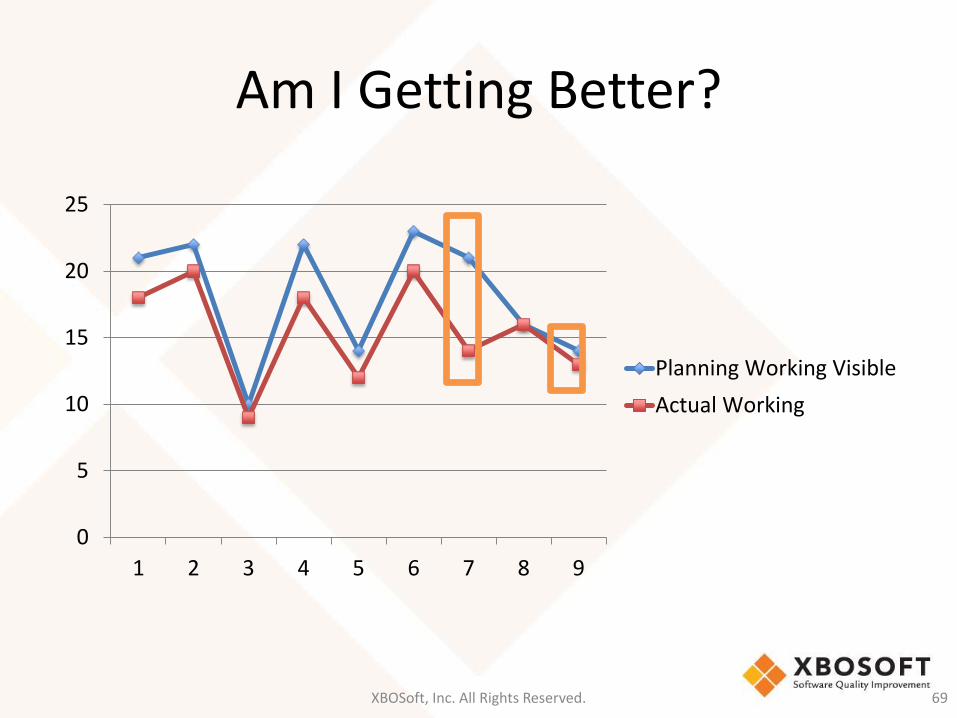
Am I Getting Better?
XBOSoft, Inc. All Rights Reserved. 69
0
5
10
15
20
25
1 2 3 4 5 6 7 8 9
Planning Working Visible
Actual Working
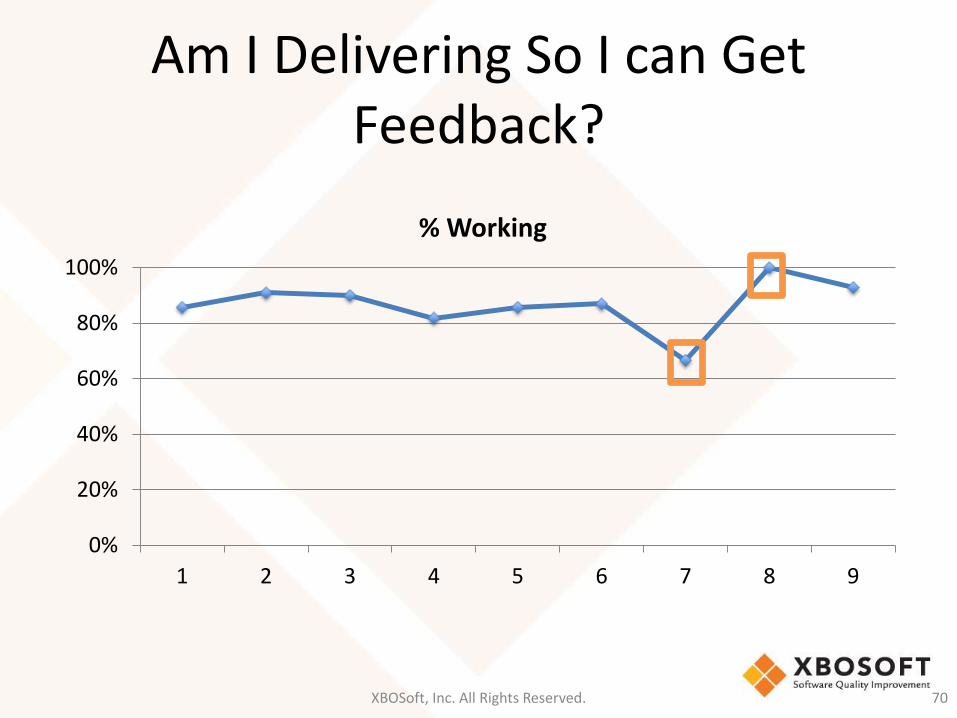
Am I Delivering So I can Get Feedback?
XBOSoft, Inc. All Rights Reserved. 70
0%
20%
40%
60%
80%
100%
1 2 3 4 5 6 7 8 9
% Working
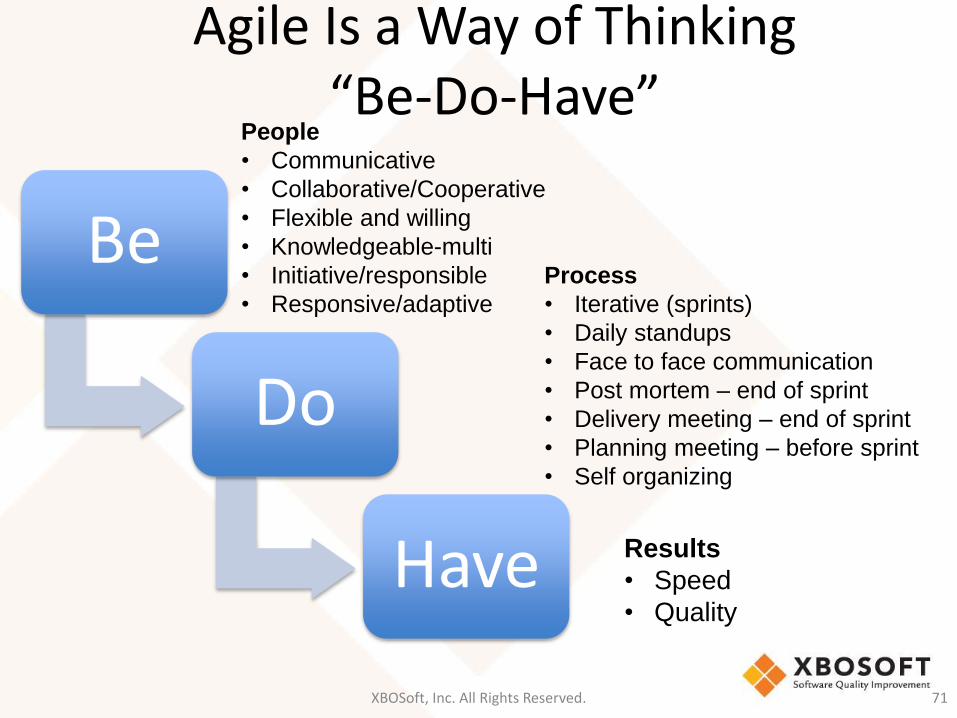
Be
Do
Have
XBOSoft, Inc. All Rights Reserved. 71
Process
• Iterative (sprints)
• Daily standups
• Face to face communication
• Post mortem – end of sprint
• Delivery meeting – end of sprint
• Planning meeting – before sprint
• Self organizing
People
• Communicative
• Collaborative/Cooperative
• Flexible and willing
• Knowledgeable-multi
• Initiative/responsible
• Responsive/adaptive
Results
• Speed
• Quality
Agile Is a Way of Thinking“Be-Do-Have”
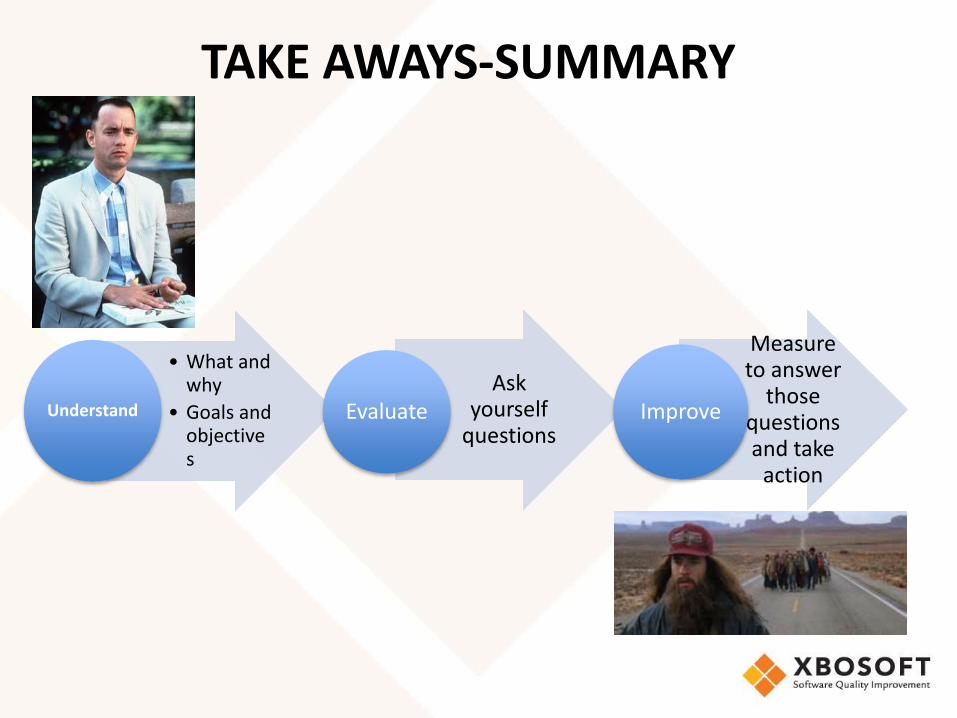
• What and why
• Goals and objectives
Understand
Ask yourself
questionsEvaluate
Measure to answer
those questions and take
action
Improve
TAKE AWAYS-SUMMARY
Post your questions on Twitter and we'll answer them @XBOSoft
Join us to keep updated on all our webinars, reports and whitepapers:
facebook.com/xbosoft
+xbosoft
linkedin.com/company/xbosoft
We post regularly on our blog – check us out!
http://xbosoft.com/software-quality-blog/
Why not download our free Whitepapers, available here:
http://xbosoft.com/knowledge-center/
You will receive an email with information on slides and recording. Any
further queries regarding our services or ideas for future webinars please
email us! [email protected]
Q+A
www.xbosoft.com
Our latest whitepaper
on Agile Metrics will
be released next week
so check back soon!


![Agile Metrics That Matter[1]](https://static.fdocuments.us/doc/165x107/55cf9b91550346d033a68ed5/agile-metrics-that-matter1.jpg)