The Incofish WP 8 Rashid Sumaila (& Team) Fisheries Economics Research Unit UBC Fisheries centre and...
34
The Incofish WP 8 Rashid Sumaila (& Team) Fisheries Economics Research Unit UBC Fisheries centre and University of Namibia [email protected] Incofish Mid-Term Workshop March 12-16, 2007
-
Upload
ellen-wilcox -
Category
Documents
-
view
221 -
download
5
Transcript of The Incofish WP 8 Rashid Sumaila (& Team) Fisheries Economics Research Unit UBC Fisheries centre and...

The Incofish WP 8
Rashid Sumaila (& Team)Fisheries Economics Research Unit
UBC Fisheries centreand
University of Namibia [email protected]
Incofish Mid-Term Workshop March 12-16, 2007

Outline
• Project objectives;
• Deliverables;
• Publications;
• Presentations and media;
• Fisheries subsidies;
• Further work.

Project objectives
• Provision of social and economic data to the project database;
• Valuation of marine ecosystem goods and services;
• Develop economic and social indicators of ineffective management;
• Develop policy options for sustainable coastal resources management;
• Write final Work Package report;• Publish at least 5 papers in the primary
literature.

Deliverable 1 Economic & Social Database
(Submission: Month 13, May 31, 2006)
• Economic and social data:
• Coastal stakeholders and social data;– Economic data
• Price;• Cost of fishing;• Non-market values;• Subsidies.
– Institutional data.

Deliverable 2Ecosystem values
Submission: Month 19, Nov. 30, 2006
• Market:– Fishery values;– Tourism/recreational values;
• Non-market:– Meta-analysis of available valuation results.
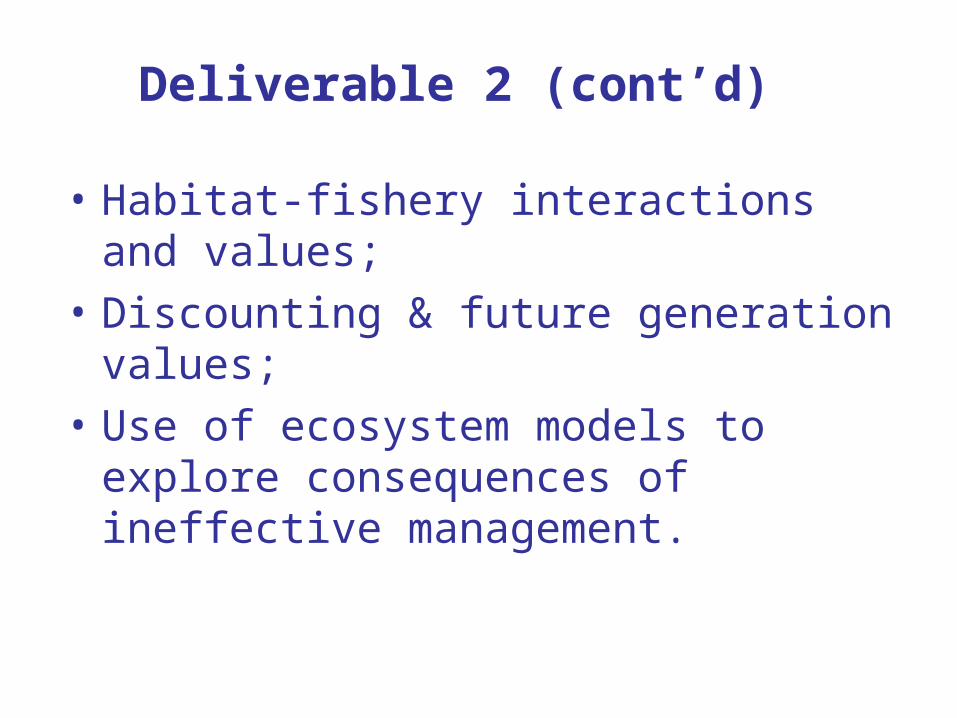
Deliverable 2 (cont’d)
• Habitat-fishery interactions and values;
• Discounting & future generation values;
• Use of ecosystem models to explore consequences of ineffective management.
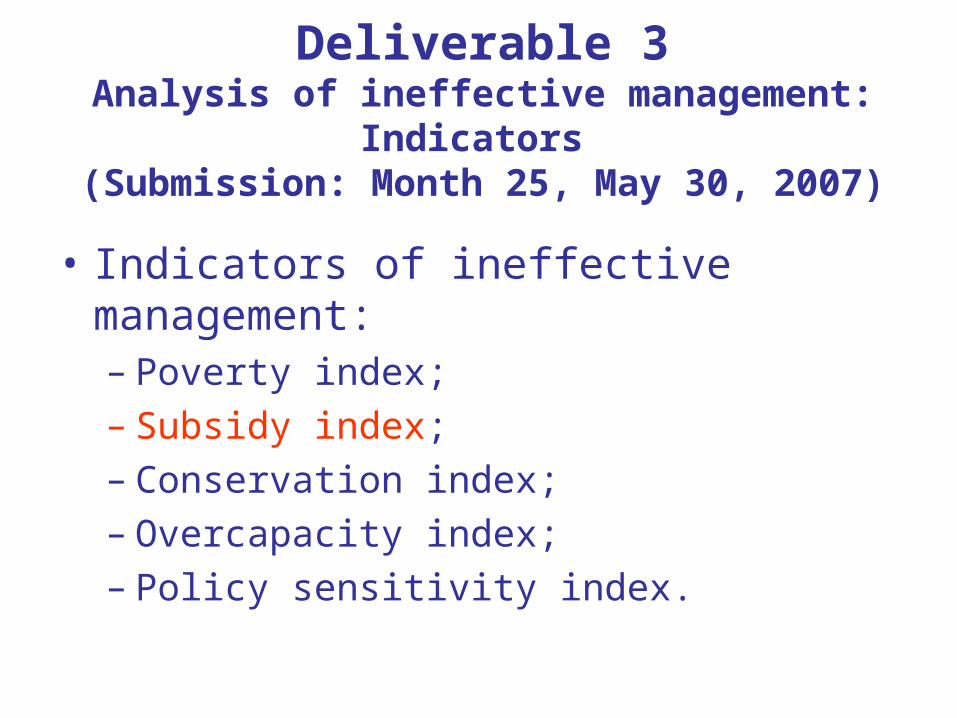
Deliverable 3Analysis of ineffective management: Indicators
(Submission: Month 25, May 30, 2007)
• Indicators of ineffective management:– Poverty index;– Subsidy index;– Conservation index;– Overcapacity index;– Policy sensitivity index.

Deliverable 4, 5 and 6
• Deliverable 4: Policy options (Submission: Month 31, Nov. 30, 2007);
• Deliverable 5: Final Report (Submission: Month 34, Feb. 28, 2008);
• Deliverable 6: 5 Scientific papers (Submission: Month 34, Feb. 28, 2008).
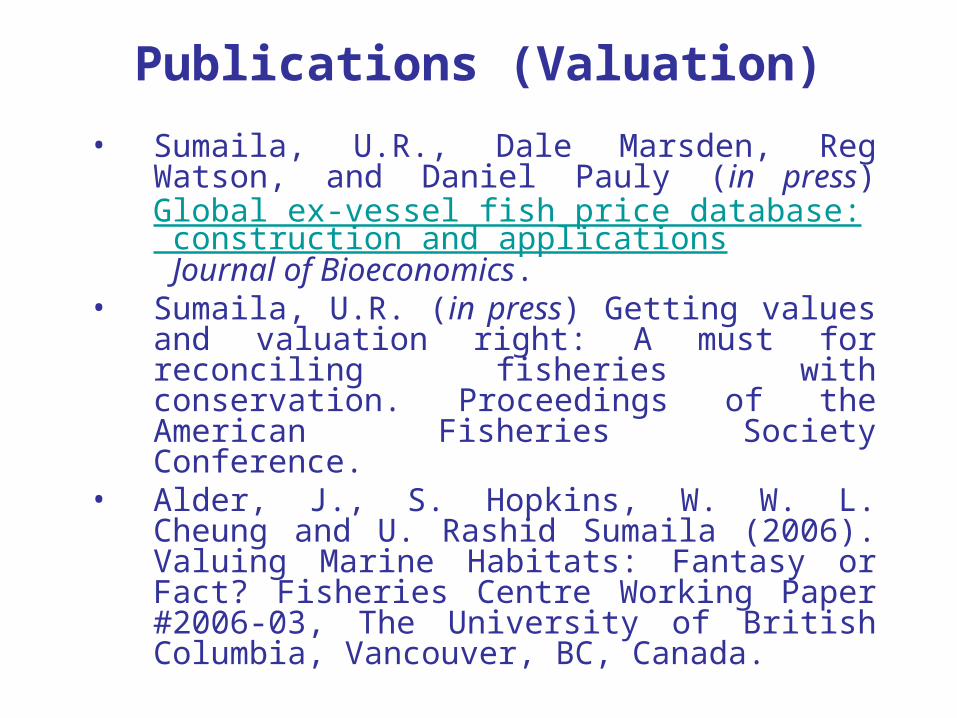
Publications (Valuation)
• Sumaila, U.R., Dale Marsden, Reg Watson, and Daniel Pauly (in press) Global ex-vessel fish price database: construction and applications Journal of Bioeconomics.
• Sumaila, U.R. (in press) Getting values and valuation right: A must for reconciling fisheries with conservation. Proceedings of the American Fisheries Society Conference.
• Alder, J., S. Hopkins, W. W. L. Cheung and U. Rashid Sumaila (2006). Valuing Marine Habitats: Fantasy or Fact? Fisheries Centre Working Paper #2006-03, The University of British Columbia, Vancouver, BC, Canada.

Publications (Subsidies)• Clark, C.M., G. Munro and U.R. Sumaila (in press).
Buyback, subsidies, the time consistency problem and the ITQ alternative. Land Economics.
• Khan, A., Sumaila, U.R., Watson, R., Munro, G., Pauly, D., 2006. The nature and magnitude of global non-fuel fisheries subsidies. Fisheries Centre Research Reports 14(6) , p. 1-34.
• Sumaila, U.R., L. Teh, Watson, R., P. Tyedmers, D. Pauly. 2006. Fuel subsidies to fisheries globally: Magnitude and impacts on resource sustainability. Fisheries Centre Research Reports 14(6), pp. 39-49.
• Sumaila, U.R., Khan, A., Teh, L., Watson, R., Tyedmers, P., Pauly, D. 2006. Subsidies to high seas bottom trawl fleet and the sustainability of deep sea benthic fish stocks. Fisheries Centre Research Reports 14(6), pp. 47-51.
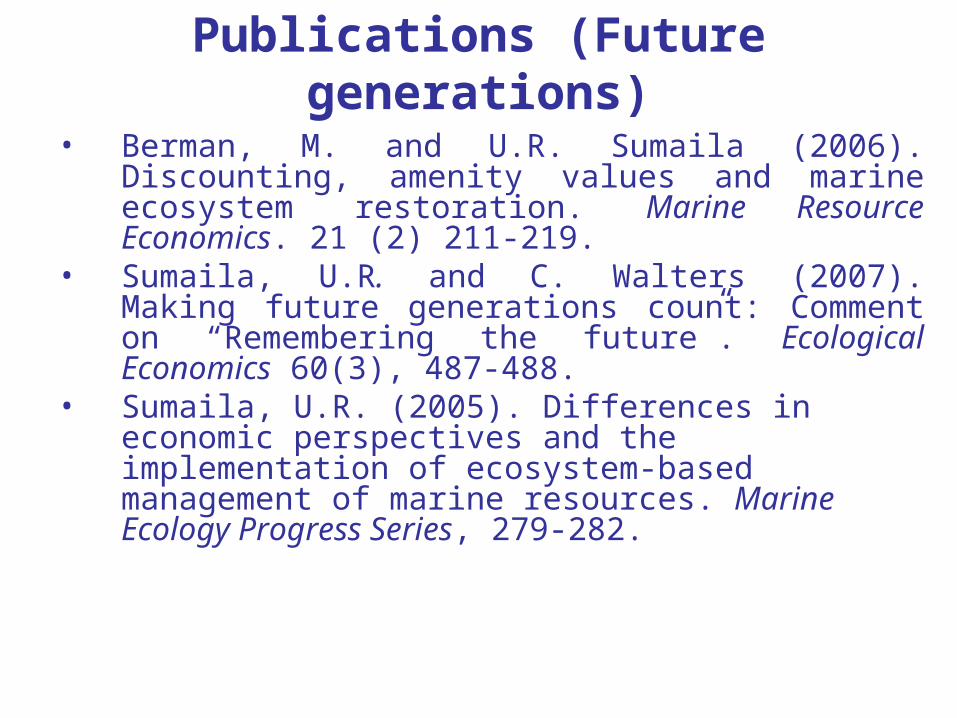
Publications (Future generations)
• Berman, M. and U.R. Sumaila (2006). Discounting, amenity values and marine ecosystem restoration. Marine Resource Economics. 21 (2) 211-219.
• Sumaila, U.R. and C. Walters (2007). Making future generations count: Comment on “Remembering the future”. Ecological Economics 60(3), 487-488.
• Sumaila, U.R. (2005). Differences in economic perspectives and the implementation of ecosystem-based management of marine resources. Marine Ecology Progress Series, 279-282.

Publications (General – developing countries)
• Sumaila, U.R. and K. Stephanus (2006). Declines in Namibia's pilchard catch: the reasons and consequences. In Rognvaldur Hannesson, Manuel Barange and Samuel F. Herrick Jr. Climate Change and the Economics of the World's Fisheries- Examples of small pelagic stocks. Edward Elgar, Cheltenham, UK, pp. 205-214.
• Perry, R.I. and U.R. Sumaila (2007). Marine ecosystem variability and human community responses: the example of Ghana, West Africa. Marine Policy 31(2) 125-134.
• Louise Teh and U. Rashid Sumaila (in press) Malthusian Overfishing in Pulau Banggi? Marine Policy.
Presentations and media
• Presentations:– Several, some high-powered.– Lots of media attention for our work.

Fisheries subsidies: A definition
Fishery subsidies are financial payments
from public entities to the fishing sector,
which help the sector make more profit than
it would otherwise.
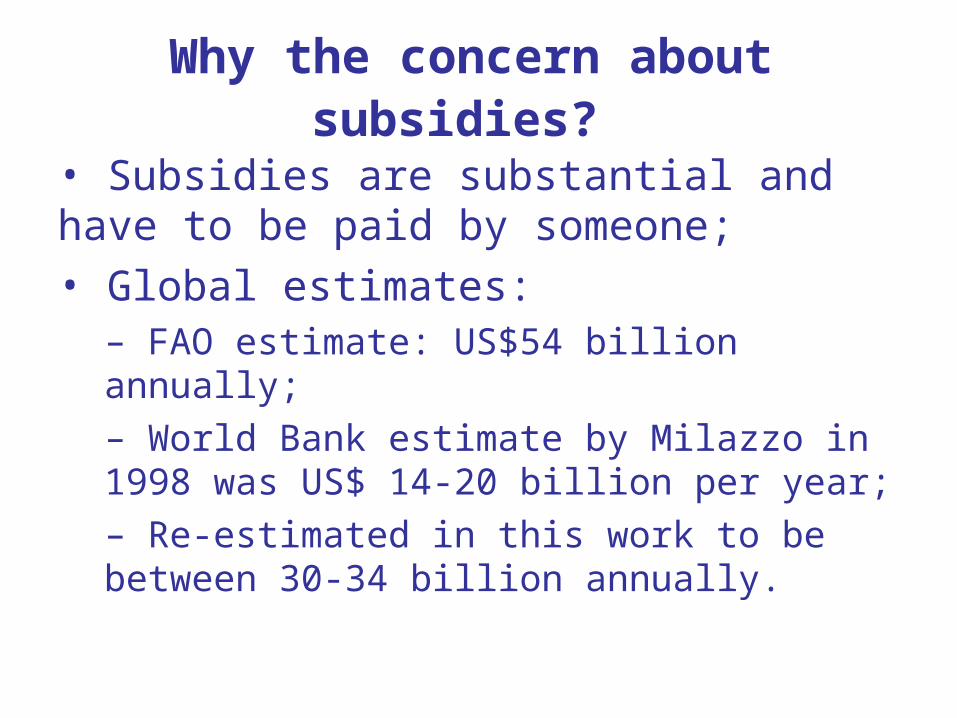
Why the concern about subsidies?
• Subsidies are substantial and have to be paid by someone;
• Global estimates:– FAO estimate: US$54 billion annually;– World Bank estimate by Milazzo in 1998 was US$ 14-20 billion per year;– Re-estimated in this work to be between 30-34 billion annually.

Why the concern about subsidies?
• Subsidies have socio-economic, distributional and trade impacts on fishing communities, regions and countries;
• Fisheries subsidies recognized world wide as contributing to overfishing.

Why the concern about subsidies?
• Overcapacity and overfishing• overcapitalization and subsidies
Fishing Intensity
19001900
19991999
Biomass Biomass
Courtesy V. Christensen
1.8-2.51.5-1.81.2-1.50.9-1.20.7-0.90.6-0.70.4-0.60.3-0.40.2-0.30.1-0.20-0.10-0
Biomass t·km-2
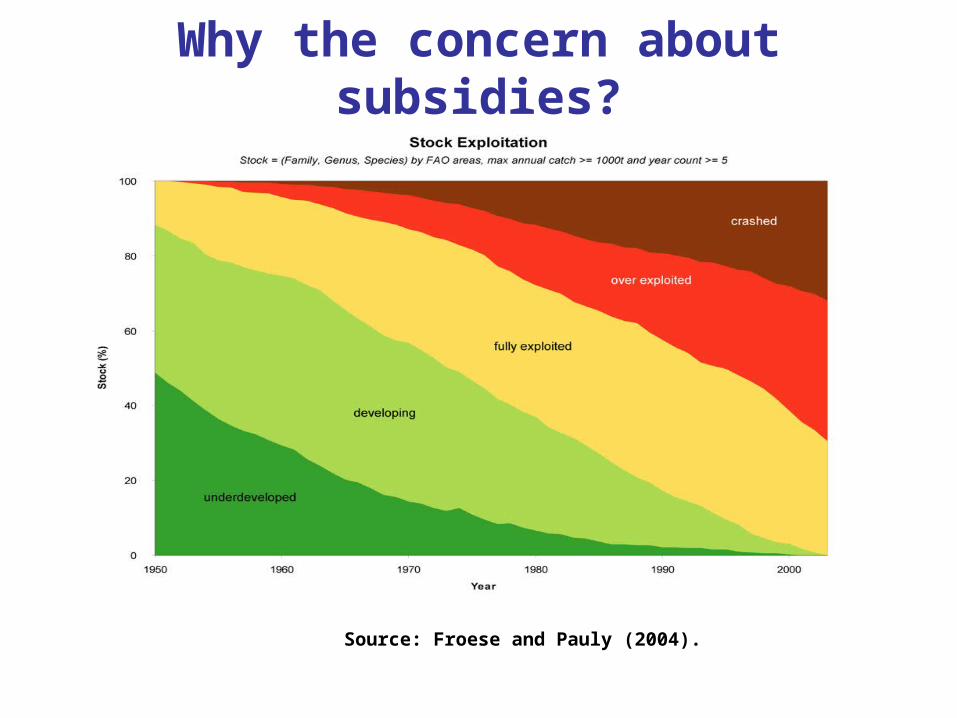
Why the concern about subsidies?
Source: Froese and Pauly (2004).

How subsidies induce overfishing
MEY
MSY Bionomic equilibrium (BE)
Total cost of fishing effort (TC)
Total Revenue (TR)
Fishing effort (E)
TR & TC ( $)
E1 E2 E3
Max. rent
TC1
TC2BE2
BE1
TR
TR& TC ($)
E3 E4 Fishing effort (E)
Cost-reducing subsidies
Gordon Schaefer bioeconomic model

Identifying & categorizing subsidies
• FAO (2002, 2004) guidelines;
• Milazzo (1998);
• OECD publications;
• Potential impact on fish stocks.

Identifying & categorizing subsidies
• Good subsidies (‘investment’ programs in fish stocks): • Fisheries management and services;
• Fisheries research and development.
• Bad subsidies (‘disinvestment’ programs in fish stocks):• Tax exemption programs;
• Foreign fishing access payments;
• Boat construction renewal and modernization programs;

Identifying & categorizing subsidies • Fishing port construction and renovation
programs; • Fishery development projects and support
services;• Marketing support, processing and storage
infrastructure programs, and• Fuel subsidies.
• Ugly subsidies (programs can be either ‘good’ or ‘bad’):• Fisher assistance packages;• Vessel buyback programs;• Rural fishers’ community development programs.

Computing subsidies
• Created a database of the 12 types of subsidies identified for 144 maritime countries for 1995 to 2005;
• Information for each country was filtered into 3 groups:– Group 1: Monetary value of subsidy available; – Group 2: No subsidy amount reported but it is
known that subsidies are provided;– Group 3: Either no information, or where we
know that no subsidies were provided.

Computing subsidies • Obtain a ratio of subsidies to countries’
landed value (LV) for Group 1;• Obtain developed & developing country
mean of this ratio for each subsidy type;• Use weighted averages to fill the gaps,
i.e., computed Group mean multiplied by LV for Group 2 countries;
• Sum subsidies for all countries (known and estimated amounts) to obtain global magnitude.

Total global subsidies
0 3 6 9 12 15 18 21 24 27 30 33 36
Fuel subsidies
Fisheries mngt & services
Fishing port construct. & renovation
Fish. develop. projects & services
Market., process., & storage infrast.
Fisher assistance
Boat construct., renewal & modern.
Tax exemption
Fisheries R & D
Fishing access agreements
Rural fisher community develop.
Vessel buyback
Global total
Subsidy amounts (USD billion)
Developing countries
Developed countries
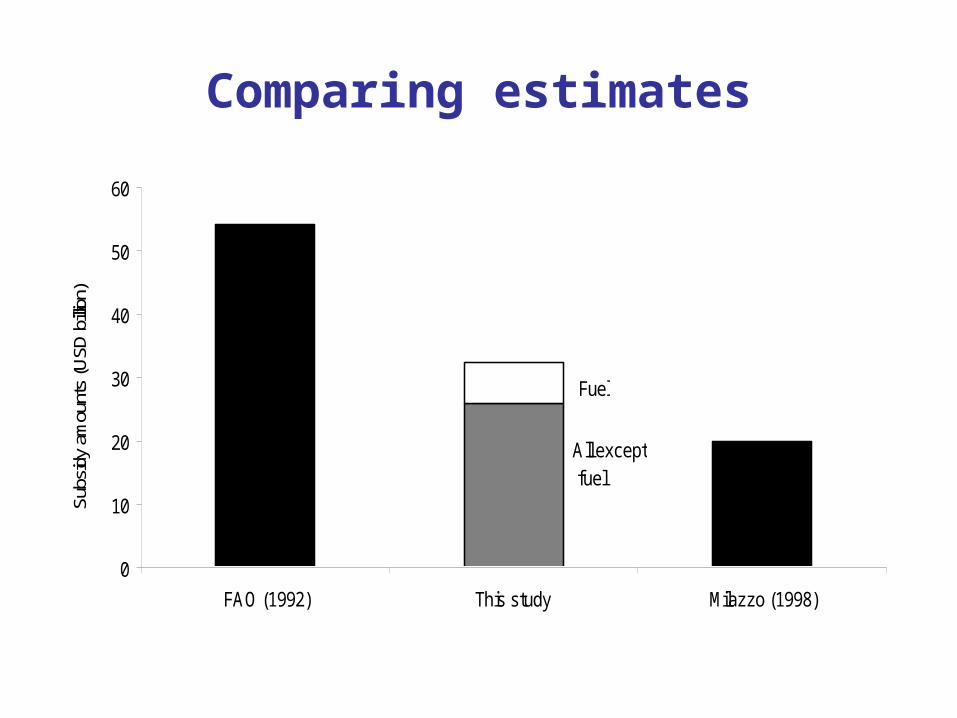
Comparing estimates
All except fuel
Fuel
0
10
20
30
40
50
60
FAO (1992) This study Milazzo (1998)
Subs
idy
amou
nts
(USD
billi
on)
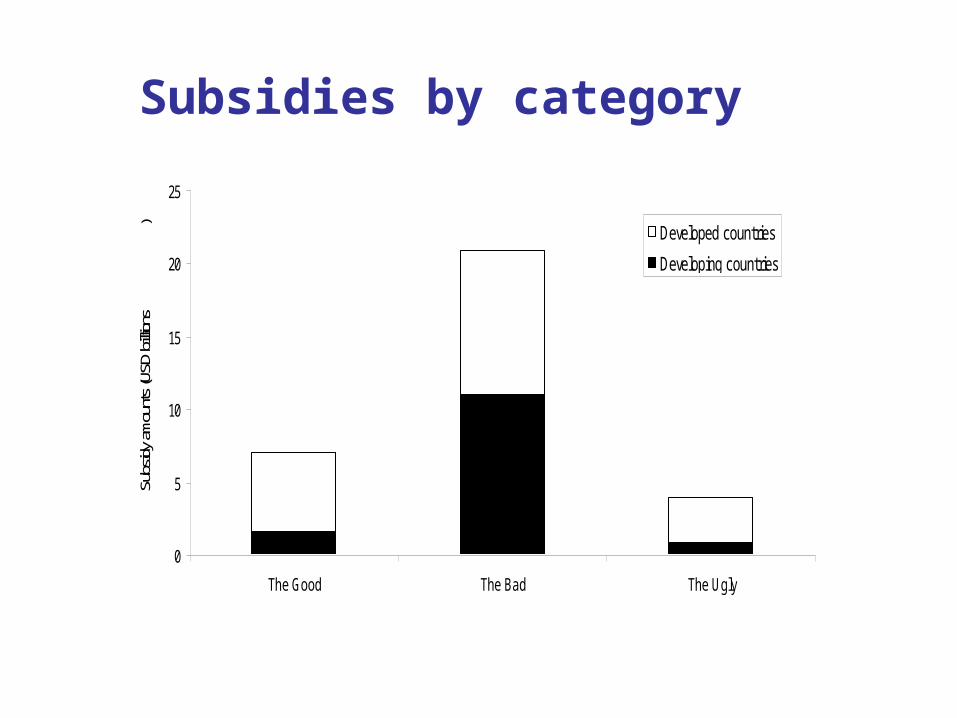
Subsidies by category
0
5
10
15
20
25
The Good The Bad The Ugly
Subs
idy a
mou
nts
(USD
billi
ons
) Developed countries
Developing countries
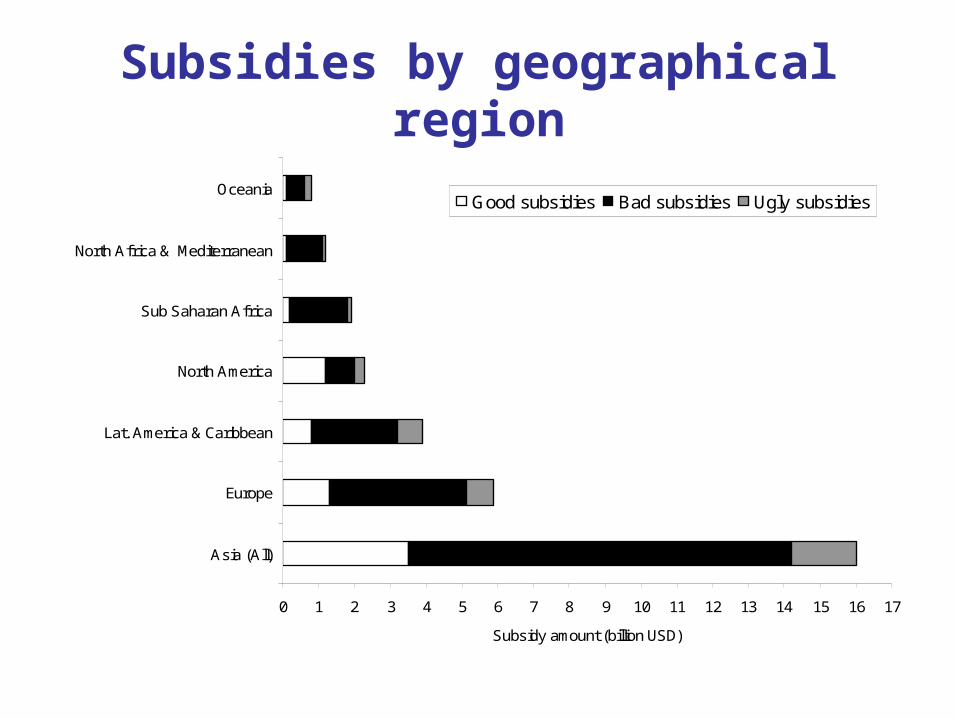
Subsidies by geographical region
0 1 2 3 4 5 6 7 8 9 10 11 12 13 14 15 16 17
Asia (All)
Europe
Lat. America & Caribbean
North America
Sub Saharan Africa
North Africa & Mediterranean
Oceania
Subsidy amount (billion USD)
Good subsidies Bad subsidies Ugly subsidies

Subsidies by major fishing nations
0
1
2
3
4
5
6
Japan EU China Russia USA Peru
Subs
idy a
mou
nt (U
SD b
illion)
.
Good subsidies Bad subsidies Ugly subsidies

Subsidy indices
• Percentage of ‘Bad’ subsidy to total subsidy’;
• Ratio of landed value/total subsidy;
• Number of fishers to per $1000 subsidy.

Indices: Top 10 performers
Countries% (Bad/Total
Subsidy) CountryLV/TotalSubsidy Country
# Fishers/$1000 Subsidies
New Z. 0.0 Nigeria 21 Nigeria 3523
Peru 1.0 New Z. 14 Indonesia 996
Nigeria 4.4 Chile 10 Egypt 626
Ireland 14.0 UK 8 Bangladesh 411
USA 20.7Netherla
nds 6 China 389
Sweden 22.2 Iceland 5 Vietnam 263
South Africa 27.6
Indonesia 5 India 242
Japan 28.7 Turkey 5 Sri Lanka 202
UK 33.8 Australia 5 Philippines 173
Canada 35.2 Sweden 5 Pakistan 128

Indices: Bottom 10 performers
Country
% (Bad/TotalSubsidy) Country
LV/TotalSubsidy Country
# Fishers/$1000 Subsidies
Namibia 87.4 Peru 0.8 France 7
India 87.6 Brazil 0.8 Peru 6
Taiwan 88.0 Bangladesh 0.6New Zealand 6
Spain 89.7 Ghana 0.5 Australia 4
Yemen 90.9 Latvia 0.5 Iceland 4
Thailand 92.1 Taiwan 0.4 Namibia 2
Brazil 94.0 Thailand 0.4 Argentina 2
Turkey 96.7 Japan 0.4 Canada 1
China 98.8 Denmark 0.2 Denmark 1
Malaysia 99.7 Ukraine 0.2 Angola 0

Further work
• Continue …– populating our databases;– developing our valuation approaches;– working on socio-economic indicators;– Collaborate with work package 7 on the global
cost of overfishing, and the conservation index;
– Working towards deliverables 4, 5 and 6.
• Present in a number of forthcoming meetings.

Thanks for your attention
EC Contract No. 003739