
The Herschel exploitation of local galaxy Andromeda (HELGA...
12
arXiv:1406.7649v3 [astro-ph.GA] 15 Sep 2014 Mon. Not. R. Astron. Soc. 000, 1–12 (2014) Printed 16 September 2014 (MN L A T E X style file v2.2) The Herschel exploitation of local galaxy Andromeda (HELGA) V: Strengthening the case for substantial interstellar grain growth L. Mattsson 1,2⋆ , H. L. Gomez 3 , A. C. Andersen 1 , M. W. L. Smith 3 , I. De Looze 4 , M. Baes 4 , S. Viaene 4 , G. Gentile 4,5 , J. Fritz 4 , L. Spinoglio 6 1 Dark Cosmology Centre, Niels Bohr Institute, University of Copenhagen, Juliane Maries Vej 30, DK-2100, Copenhagen Ø, Denmark 2 Nordita, KTH Royal Institute of Technology & Stockholm University, Roslagstullsbacken 23, SE-106 91, Stockholm, Sweden 3 School of Physics & Astronomy, Cardiff University, The Parade, Cardiff, CF24 3AA, UK 4 Department of Physics and Astronomy, University of Gent, Krijgslaan 281 - S 9, B-9000 Gent, Belgium 5 Department of Physics and Astrophysics, Vrije Universiteit Brussel, Pleinlaan 2, B-1050 Brussels, Belgium 6 Istituto di Astrofisica e Planetologia Spaziali (IAPS), Istituto Nazionale di Astrofisica (INAF), Via Fosso del Cavaliere 100, I-00133 Roma, Italy ABSTRACT In this paper we consider the implications of the distributions of dust and metals in the disc of M31. We derive mean radial dust distributions using a dust map created from Herschel images of M31 sampling the entire far-infrared peak. Modified blackbodies are fit to approximately 4000 pixels with a varying, as well as a fixed, dust emissivity index (β). An overall metal distribution is also derived using data collected from the literature. We use a simple analytical model of the evolution of the dust in a galaxy with dust contributed by stellar sources and interstellar grain growth, and fit this model to the radial dust-to-metals distribution across the galaxy. Our analysis shows that the dust-to-gas gradient in M31 is steeper than the metallicity gradient, suggesting interstellar dust growth is (or has been) important in M31. We argue that M31 helps build a case for cosmic dust in galaxies being the result of substantial interstellar grain growth, while the net dust production from stars may be limited. We note, however, that the efficiency of dust production in stars, e.g., in supernovae ejecta and/or stellar atmospheres, and grain destruction in the interstellar medium may be degenerate in our simple model. We can conclude that interstellar grain growth by accretion is likely at least as important as stellar dust production channels in building the cosmic dust component in M31. Key words: ISM: clouds – dust, extinction – ISM: evolution – galaxies: evolution – galaxies: individual: M31 – galaxies: ISM. 1 INTRODUCTION The life-cycle of dust is a complex process. It is expected that interstellar dust grains can grow by accretion in the interstel- lar medium (ISM; see, e.g., Ossenkopf 1993; Ormel et al. 2009; Hirashita & Kuo 2011) and there is observational evidence to suggest large grains are abundant in many Galactic molecular clouds (Kiss et al. 2006; Ridderstad et al. 2006; Chapman et al. 2009; Pagani et al. 2010; Steinacker et al. 2010). Micrometer-sized dust grains may form in carbon-rich atmospheres of asymptotic giant branch (AGB) stars (Mattsson & H¨ ofner 2011), and also in oxygen-rich AGB stars (H¨ ofner 2008; Norris et al. 2012), but it is more likely that large interstellar grains have grown to such sizes inside molecular clouds since large grains produced in stars may not remain that large due to sputtering and shattering in the ISM. In theory, shock-waves from supernovae (SNe) should destroy dust grains as these waves propagate through the ⋆ E-mail: [email protected] ISM, but the time-scale for such dust destruction is uncer- tain (McKee 1989; Draine 1990). Shock destruction of dust grains is likely efficient for carbon dust, but that may not nec- essarily be the case for silicates (Jones, Tielens & Hollenbach 1996; Jones 2004; Serra D´ ıaz-Cano & Jones 2008; Jones & Nuth 2011; Zhukovska & Henning 2013). Efficient dust destruction on short time-scales also appears inconsistent with the very high dust masses detected in high-z objects (Morgan & Edmunds 2003; Dwek et al. 2007; Gall, Andersen & Hjorth 2011; Mattsson 2011). But at least the carbon dust grains are predicted to survive in the ISM for typically not more than a few hundred Myr (Jones, Tielens & Hollenbach 1996; Jones 2004; Serra D´ ıaz-Cano & Jones 2008; Jones & Nuth 2011), which indi- cate a need for some kind of replenishment mechanism, rebuilding the dust component (Draine 1990, 2009; Mattsson et al. 2014). It is now established that core-collapse SNe are efficient dust and molecular factories (Rho et al. 2009; Kamenetzky et al. 2013) with large masses of cold dust detected in SN ejecta (see, e.g., Morgan et al. 2003; Dunne et al. 2009; Matsuura et al. c 2014 RAS
-
Upload
nguyenliem -
Category
Documents
-
view
219 -
download
0
Transcript of The Herschel exploitation of local galaxy Andromeda (HELGA...

arX
iv:1
406.
7649
v3 [
astr
o-ph
.GA
] 15
Sep
201
4
Mon. Not. R. Astron. Soc.000, 1–12 (2014) Printed 16 September 2014 (MN LATEX style file v2.2)
The Herschel exploitation of local galaxy Andromeda (HELGA) V:Strengthening the case for substantial interstellar graingrowth
L. Mattsson1,2⋆, H. L. Gomez3, A. C. Andersen1, M. W. L. Smith3, I. De Looze4,M. Baes4, S. Viaene4, G. Gentile4,5, J. Fritz4, L. Spinoglio6
1Dark Cosmology Centre, Niels Bohr Institute, University ofCopenhagen, Juliane Maries Vej 30, DK-2100, Copenhagen Ø, Denmark2Nordita, KTH Royal Institute of Technology& Stockholm University, Roslagstullsbacken 23, SE-106 91, Stockholm, Sweden3School of Physics& Astronomy, Cardiff University, The Parade, Cardiff, CF24 3AA, UK4Department of Physics and Astronomy, University of Gent, Krijgslaan 281 - S 9, B-9000 Gent, Belgium5Department of Physics and Astrophysics, Vrije Universiteit Brussel, Pleinlaan 2, B-1050 Brussels, Belgium6Istituto di Astrofisica e Planetologia Spaziali (IAPS), Istituto Nazionale di Astrofisica (INAF), Via Fosso del Cavaliere 100, I-00133 Roma, Italy
ABSTRACTIn this paper we consider the implications of the distributions of dust and metals in the disc ofM31. We derive mean radial dust distributions using a dust map created fromHerschelimagesof M31 sampling the entire far-infrared peak. Modified blackbodies are fit to approximately4000 pixels with a varying, as well as a fixed, dust emissivityindex (β). An overall metaldistribution is also derived using data collected from the literature. We use a simple analyticalmodel of the evolution of the dust in a galaxy with dust contributed by stellar sources andinterstellar grain growth, and fit this model to the radial dust-to-metals distribution across thegalaxy. Our analysis shows that the dust-to-gas gradient inM31 is steeper than the metallicitygradient, suggesting interstellar dust growth is (or has been) important in M31. We argue thatM31 helps build a case for cosmic dust in galaxies being the result of substantial interstellargrain growth, while the net dust production from stars may belimited. We note, however, thatthe efficiency of dust production in stars, e.g., in supernovae ejecta and/or stellar atmospheres,and grain destruction in the interstellar medium may be degenerate in our simple model. Wecan conclude that interstellar grain growth by accretion islikely at leastas important as stellardust production channels in building the cosmic dust component in M31.
Key words: ISM: clouds – dust, extinction – ISM: evolution – galaxies: evolution – galaxies:individual: M31 – galaxies: ISM.
1 INTRODUCTION
The life-cycle of dust is a complex process. It is expected thatinterstellar dust grains can grow by accretion in the interstel-lar medium (ISM; see, e.g., Ossenkopf 1993; Ormel et al. 2009;Hirashita & Kuo 2011) and there is observational evidence tosuggest large grains are abundant in many Galactic molecularclouds (Kiss et al. 2006; Ridderstad et al. 2006; Chapman et al.2009; Pagani et al. 2010; Steinacker et al. 2010). Micrometer-sizeddust grains may form in carbon-rich atmospheres of asymptoticgiant branch (AGB) stars (Mattsson & Hofner 2011), and alsoinoxygen-rich AGB stars (Hofner 2008; Norris et al. 2012), but it ismore likely that large interstellar grains have grown to such sizesinside molecular clouds since large grains produced in stars maynot remain that large due to sputtering and shattering in theISM.
In theory, shock-waves from supernovae (SNe) shoulddestroy dust grains as these waves propagate through the
⋆ E-mail: [email protected]
ISM, but the time-scale for such dust destruction is uncer-tain (McKee 1989; Draine 1990). Shock destruction of dustgrains is likely efficient for carbon dust, but that may not nec-essarily be the case for silicates (Jones, Tielens & Hollenbach1996; Jones 2004; Serra Dıaz-Cano & Jones 2008; Jones & Nuth2011; Zhukovska & Henning 2013). Efficient dust destructionon short time-scales also appears inconsistent with the veryhigh dust masses detected in high-z objects (Morgan & Edmunds2003; Dwek et al. 2007; Gall, Andersen & Hjorth 2011; Mattsson2011). But at least the carbon dust grains are predictedto survive in the ISM for typically not more than a fewhundred Myr (Jones, Tielens & Hollenbach 1996; Jones 2004;Serra Dıaz-Cano & Jones 2008; Jones & Nuth 2011), which indi-cate a need for some kind of replenishment mechanism, rebuildingthe dust component (Draine 1990, 2009; Mattsson et al. 2014).
It is now established that core-collapse SNe are efficientdust and molecular factories (Rho et al. 2009; Kamenetzky etal.2013) with large masses of cold dust detected in SN ejecta(see, e.g., Morgan et al. 2003; Dunne et al. 2009; Matsuura etal.
c© 2014 RAS

2 Mattsson et al.
2011; Gomez et al. 2012; Indebetouw et al. 2014) although thereare significant uncertainties associated with conversion fromfluxes to dust masses. It is also unclear how much of thedust actually survives and mixes with the ISM. Theoretical re-sults suggest 90% of the dust produced in SNe is destroyedby the reverse shock before it reaches the ISM, dependingon the interstellar gas density and the grain size distribution(Bianchi & Schneider 2007). Uncertain destruction rates, the lackof suitable (young, resolved) remnants, in combination with pos-sible foreground (or background) contamination from unrelateddust clouds along the line of sight, makes it difficult to confirmwhether massive-star SNe are dominant dust producers in galax-ies. Thus, even if the seed grains must be produced by stars, in-terstellar grain growth may still be needed (e.g. Dunne et al. 2011;Mattsson, Andersen & Munkhammar 2012; Asano et al. 2013), notonly as a replenishment mechanism, but also forproducingthe bulkof the cosmic dustmass. Independent estimates of the efficiency ofinterstellar grain growth are thus still important.
The dust-to-metals ratio in a galaxy may change over timeas the galaxy evolves, and this can be followed using sim-ple analytical relations based on closed-box chemical evolutionmodels with ‘instantaneous-recycling’ (Edmunds 2001; Mattsson2011; Mattsson, Andersen & Munkhammar 2012), or more com-plex modelling (e.g., Dwek 1998). Regardless of the complexityof the model, these works show that the dust abundance may notnecessarily follow the metal abundances in the ISM given differ-ent sources of dust and destruction. Because of the stellar ori-gin of both metals and dust grains, the dust-to-metals gradientalong a galactic disc can therefore be regarded as a diagnostic fornet dust growth or net destruction of dust in the ISM. Much ofthe dust mass may be the result of grain growth in the ISM andpassage of shocks from SNe may lead to destruction by sputter-ing. If growth is dominating in the ISM the dust-to-metals gradi-ent is negative and if destruction is dominating it will be positive(Mattsson, Andersen & Munkhammar 2012). If only stars produceall the dust (as well as metals) and there is no destruction ofdustin the ISM, the dust-to-metals gradient is essentially flat.The chal-lenge is acquiring data with enough accuracy, resolution and sensi-tivity to perform this kind of test.
In Mattsson & Andersen (2012), this diagnostic was used on asmall sample of galaxies from theSpitzerInfrared Nearby GalaxiesSurvey (SINGS), where dust gradients were found to be typicallysteeper than the corresponding metallicity gradients, suggestingvery little dust destruction and significant non-stellar dust produc-tion for most of these galaxies. The dust properties of the SINGSsample were derived from a set of ultraviolet (UV) and infrared (IR)radial profiles obtained withGALEX and Spitzercombined withoptical data (SDSSugriz) – in total 17 different photometric bands(Munoz-Mateos et al. 2009a,b). Dust masses were obtained byfit-ting standard spectral energy distribution (SED) models accordingto Draine & Li (2007) to the SEDs. However, the dust masses werederived from SEDs which lacked the long wavelength (beyond 160µm) observational data necessary to derive accurate dust masses,with possibility of considerable errors beyond the measurement er-rors, i.e., a model-dependent uncertainty due to insufficient con-straints from the data. Moreover, it should be noted that theinfor-mation regarding the dust distribution in the galaxy discs was lim-ited as it was derived from surface brightness profiles. But arisingtrend in dust-to-gas ratio versus metallicity has also recently beenfound on a global scale (Remy-Ruyer et al. 2014), which lends sup-port to the interpretation of Mattsson & Andersen (2012).
In the case of M31 (NGC 224; Andromeda) the situation is
much improved. The launch of the European Space Agency’sHer-schel Space Observatory, which observes in the range 55− 671µm(Pilbratt et al. 2010) with unprecedented sensitivity and angularresolution at these wavelengths, has produced a census of galaxiesas seen through theirdust mass. TheHerschelExploitation of LocalGalaxy Andromeda (HELGA) is a survey covering a∼ 5.5◦ × 2.5◦
area centred on M31 (further details of the HELGA survey can befound in Fritz et al. 2012). Recently, Smith et al. (2012) used theHELGA observations to investigate the distribution of dustemis-sion in M31 on spatial scales of∼140 pc, creating maps of thedust surface density and the dust emissivity index across the disk.Draine et al. (2014) have also usedHerscheldata (Groves et al.2012, Krause et al., in preparation) to constrain a detaileddustmodel of M31. The unprecedented quality and spatial detail of theHELGA dust map makes M31 the only large spiral galaxy with awell-constrained detailed dust distribution to date.
In this paper we use the HELGA dust map of M31 in com-bination with oxygen abundances obtained directly or indirectlyfrom the literature (Section 2). M31 is a good test case sincetheHELGA data provide extraordinary spatial resolution and detailand the metallicity of the disc can (due to its proximity) be con-strained by both metallicities of stars and planetary nebulae, aswell as Hii regions. Using a simple, well tested model of galacticdust evolution (Section 3), we evaluate the importance of interstel-lar grain growth relative to stellar dust production in our nearestneighbour (Section 4).
2 OBSERVATIONAL DATA AND TRENDS
Here we take a closer look at the HELGA data, derived bySmith et al. (2012) and evaluate the average radial trends ofdustemission across M31. We combine these results with a derivationof the metallicity gradient based on a compilation of oxygenabun-dance data from Hii regions, stars and planetary nebulae to inves-tigate the dust-to-metals gradient.
2.1 The dust and gas data sets
Herschelobservations of M31 were taken in parallel-mode withthe PACS (Poglitsch et al. 2010) and SPIRE (Griffin et al. 2010)instruments observing at 100, 160, 250, 350 and 500µm simulta-neously. Full details of the observing strategy and data reductioncan be found in Fritz et al. (2012). The final maps at each wave-length were created with pixel sizes of 2, 3, 6, 8 and 12 arcsecwithspatial resolution of 12.5, 13.3, 18.2, 24.5, 36.0 arcsec full widthat half-maximum for the 100, 160, 250, 350 and 500µm maps, re-spectively. In addition to theHerscheldata, the 70µm SpitzerMIPSmap published in Gordon et al. (2006) was also used as an upperlimit to constrain the shorter wavelength end of the SED.
Smith et al. (2012) used this data set to create a dust surfacedensity map of M31 by modified-blackbody fits to the FIR-SED foreach pixel (using the 70µm data as an upper limit to the hot dustcomponent). Only pixels with> 5σ were used in the fits. The fluxper unit area in each pixel was modelled as
µν =κνΣdBν(Td)
D2, (1)
whereBν is the Planck distribution and the emissivity/absorptivityof the dust grains is a power lawκν = κ0(ν/ν0)β. They assumed avalue for the coefficient κ0 = κ(350µm) of 0.192 m2 kg−1, whichcorresponds to a typical interstellar dust composition (Draine
c© 2014 RAS, MNRAS000, 1–12

HELGA V: the case for grain growth 3
2003). Keepingκ0 unchanged is, in principle, physically incon-sistent. But we chose to do so because it yields a conservativeslope of the dust profile1 A distance 0.785 Mpc was also assumed(McConnachie et al. 2005). In the SED fitting, Smith et al. (2012)initially used a fixed value of the dust emissivity index,β = 1.5(the slope of the long-wavelength tail of the effective absorptiv-ity/emissivity of the dust component) across the whole galaxy, butfound that with a fixed value it was impossible to adequately fit theSEDs.β was therefore allowed to vary across M31 [see Smith et al.(2012), fig. 7] with an estimated error inβ in any pixel of±0.31.It is worth noting that there is a degeneracy betweenκ0 and thedust-mass densityΣd in the above model. It is quite likely (if notcertain) that variations inβ correspond to variations inκ0, whichmeans that the assumedκ0 can put a bias on the resultant dust den-sityΣd. The decrease ofβwith increasing galactocentric distance inM31 can therefore mean that we are underestimating the dust massin its central parts. We will return to this issue later.
Smith et al. (2012) also created a dust-to-gas map of M31. Thegas map was obtained by combining the atomic (Hi) and molecu-lar (H2) maps (the sum of which is adopted as the ‘gas mass’).The atomic hydrogen was derived from the Hi moment-zero mappresented in Braun et al. (2009) and the molecular hydrogen wasderived from CO(J = 1-0) observations presented in Nieten et al.(2006) made with the IRAM 30m telescope (full details are pro-vided in Smith et al. 2012). Note that although the CO map re-quires correcting to H2 [the so-called X factor, here taken to beXCO = 1.9·1020 mol cm−2(K km s−1)−1], the correction may dependon the metallicity of the galaxy (e.g. Sandstrom et al. 2013). Giventhat the molecular gas in M31 is only 7% of the atomic hydrogengas, we note that this correction does not affect the conclusions ofthis work.
2.2 The dust and gas distribution
The SED fitting procedure described above resulted in three param-eters for each pixel across M31: the dust surface densityΣd, dusttemperatureTd and the dust emissivity indexβ. Combining withthe gas map, we also have the gas surface density in each pixelΣgas. We have binned the data in terms of consecutive radial annuli(each 2 kpc wide, deprojected assuming an inclination of 77 deg)and computed the mean value in each bin for all of these parame-ters. Based on the scatter in each radial bin, we have also computedthe 1-σ deviation from the mean values. The resultant binned dataare plotted on top of a radial projection of the dust map data in Fig.1. One can see in the upper panels that the dust is generally below20 K outside of the very centre (R > 1 kpc), with an odd ‘dip’ inthe grain temperatures between∼ 3− 15kpc (see top panel of Fig.1). The binnedβ-values change significantly over the disc from 1.2to 2.4 and as noted in Smith et al. (2012), increases initially outtoR ∼ 3 kpc, then decreases radially. Draine et al. (2014) have alsofound evidence of a varyingβ in M31.
1 The valueκ0 = κ(350µm) = 0.192 m2 kg−1 is taken from table 5 inDraine (2003) for a model withβ = 2. This makes sense for our constantβ = 1.8 model, but for varyingβ, the extrapolation does not quite hold. InM31 we have regions withβ > 2.0 (inner 5 kpc) and regions withβ < 2.0(outer regions). If we were to ‘correct’ the dust masses hereusingκ0 scaledwith β = 2.5 (the most extreme innerβ), κ0 would decrease by a factor of 2and we would get ahigherdust mass. In the outer regions, scalingκ0 withβ = 1 (most extreme outerβ), κ0 would increase by a factor of 3.5 and wewould get 3.5 timeslower dust masses. Thus, the dust-to-metals ratio forthe varyingβ case would become even steeper.
It is not unexpected for the dust emissivity index (β) to varyacross a galaxy, indeed this may tell us something about compo-sition of the dust at different galactocentric distances. Low values(β ∼ 1) would indicate that the dust component is dominated byamorphous carbonaceous dust (Andersen, Loidl & Hofner 1999),while higher values (β ∼ 2) indicate domination by silicates orgraphite (Draine & Lee 1984). The highest values (whereβ > 2)can be associated with the lowest dust temperatures, which suggeststheseβ-values may be explained by low-temperature effects in sili-cates. Coupeaud et al. (2011) have shown that low-temperature ef-fects occur in the laboratory at grain temperatures belowTd = 12 K,which is indeed lower than the lowest grain temperatures obtainedfrom the SED fits, but one should bear in mind that the grain tem-peratures obtained from the fits represent effective temperatures forthe whole dust component and not a specific dust species as in thelaboratory experiments. Moreover, it also suggests that interstel-lar silicates are not necessarily iron rich, because silicate speciessuch as pyroxenes ([Mg,Fe]SiO3) and olivine’s ([Mg,Fe]2SiO4) areheated more efficiently due to their higher absorptivity relative toiron-free silicates.
However, treatingβ as a free parameter means we are at a po-tential risk of parameter degeneracy between the dust temperatureTd and theβ-value (see discussion in Section 4.2.1). Smith et al.(2012) demonstrated that while there is aβ − Td degeneracy fromthe fitting algorithm this does not create any systematic offsets inthe value returned and therefore cannot explain the radial trends. Toexplore the possible effect on the dust-to-gas ratio along the disc,we have reconsidered the SED fitting to the HELGA dust map us-ing a fixedβ = 1.8. This value is a reasonable compromise, whichis appropriate for the local ISM in the Galaxy (Planck collaboration2011) and it is also in close agreement with the averageβ value ob-tained from the varying-β model. The resultant dust-to-gas profileis flatter forβ = 1.8 (Fig. 2), though there is a clear, approximatelyexponential, profile inΣd/Σgas along the disc of M31 regardless ofhow we treatβ (see Figs. 1 and 2, bottom panels). The dust temper-atures are also generally higher and the temperature gradient alongthe disc looks more as one would expect, i.e.,Td is essentially de-creasing monotonously with galactocentric distance. Thismeansthe odd ‘broken’ feature in the radialTd-profile is gone, withTd
simply decreasing with radius along the disc.
2.3 Metallicity gradient
In order to estimate the overall distribution of metals in M31we have gathered metallicity data from the literature for Hii re-gions (Dennefeld & Kunth 1981; Blair et al. 1991; Bresolin etal.1999; Zurita & Bresolin 2012), young stars (Venn et al. 2000;Smart et al. 2001; Trundle 2002; Lee et al. 2013) and planetarynebulae (Kwitter et al. 2012). We use the oxygen abundance (O/H)as a proxy for the overall metallicity. This works well for our pur-poses, but it is worth remembering that the conversion factor fromoxygen abundance to total abundance of metals is different in low-and high-metallicity environments (cf. O/Fe versus Fe/H in theGalaxy according to, e.g., Edvardsson et al. 1993). Here we adopt auniversal conversion factor, which is justified by the fact that M31has relatively similar O/H ratios (metallicity) across its disc (i.e.,the conversion factor can be treated as a constant). Thus, toobtainthe total metal fraction (metallicity)Z we first convert the numberabundances of oxygen into oxygen mass fractions using the relationXO = 12× (O/H) (Garnett et al. 2002), in which we have implicitlyassumedMgas = 1.33MH. Furthermore, for M31 we may assumethe oxygen typically makes up about a third of all metals (which is
c© 2014 RAS, MNRAS000, 1–12

4 Mattsson et al.
Figure 1. Temperature (top panel), emissivity indexβ (middle panel) anddust-to-gas ratio (bottom panel) for Andromeda as functions of galactocen-tric distance. The data (grey points) are taken from the original dust mapin Smith et al. (2012). The red filled circles with error bars show the meanvalues and 1σ-scatter in 2 kpc wide bins.
at the low end of the possible range, see e.g., Garnett et al. 2002,where 45-60% is the suggested value) and thusZ = 3×12× (O/H).An oxygen fraction as low as 40% (Z = 2.5× 12× (O/H)) is sim-ilar to the new solar value (see, e.g., Asplund et al. 2009), and aneven lower fraction is expected at super-solar metallicity. One thirdof oxygen is therefore a reasonable assumption, which also ensuresthat we do not underestimate the metal content of M31 (see Section2.4 for a discussion on why this is important). The adopted oxygenfraction is otherwise not critical in the present study.
Depending on the method of derivation, the derived abun-dance from emission spectra can vary significantly. In particu-lar, there is a well-known offset between strong-line calibrationsfrom empirical data and those based on photoionization modelsand, in general, we have to deal with the fact that oxygen abun-dances derived from emission spectra have no empiricalabsolutescale either. To obtain a homogenous set of oxygen abundancesfor the H ii regions, we have re-derived O/H using the empirical
Figure 2. Same as Fig. 1, but with properties obtained from a dust mapobtained with a constant emissivity indexβ = 1.8. Note the difference inthe dust-temperature profile compared to Fig. 1.
strong-line calibrations by Pilyugin, Vılchez & Thuan (2010) andPilyugin & Mattsson (2011), which are known to agree well withelectron-temperature based abundances. We use the ON-calibrationby Pilyugin, Vılchez & Thuan (2010) for all cases where the[O ii]λ3727+ λ3729 line is detected with sufficient signal-to-noise(S/N & 10). In the remaining cases we use the NS-calibration byPilyugin & Mattsson (2011), provided the [Sii]λ6717+ λ6731 linesare measured. We add also a 0.1 dex correction for dust depletion,which seems to appear in Hii regions above a certain metallicity(Izotov et al. 2006)2. Dust depletion cannot explain the dust-to-metals gradient, however.
In Fig. 4, we have plotted the resultant O/H ratios togetherwith corresponding ratios derived from stars and planetarynebulae.The empirical abundances for the Hii regions agree nicely with thestellar abundances. The abundances in Hii regions agree with theabundances derived for planetary nebulae in the outer disc.A linearfit to all the metallicity data (see black line in Fig. 4) yields,
log(O/H) + 12= 8.77− 0.0105 (R/kpc), (2)
suggesting the metallicity gradient is much flatter than thedust-to-gas gradient. The outermost data points in Fig. 4 suggest a flat gra-dient beyond a certain galactocentric distance. A ‘broken gradient’fit yields almost exactly the same slope as above forR< 23 kpc anda flat metallicity gradient beyondR = 23 kpc (see the blue dashedline in Fig. 4). Since we are, in this work, only interested inthe
2 The observed phenomenon is trends in Ne/O and Ar/O versus O/H. Neand Ar cannot be incorporated in dust, except in very small amounts as‘trapped’ gas inside large grains. The observed trends are therefore inter-preted as dust depletion. The Ne/O trend suggests a 0.1 dex correction atsolar metallicity.
c© 2014 RAS, MNRAS000, 1–12
HELGA V: the case for grain growth 5
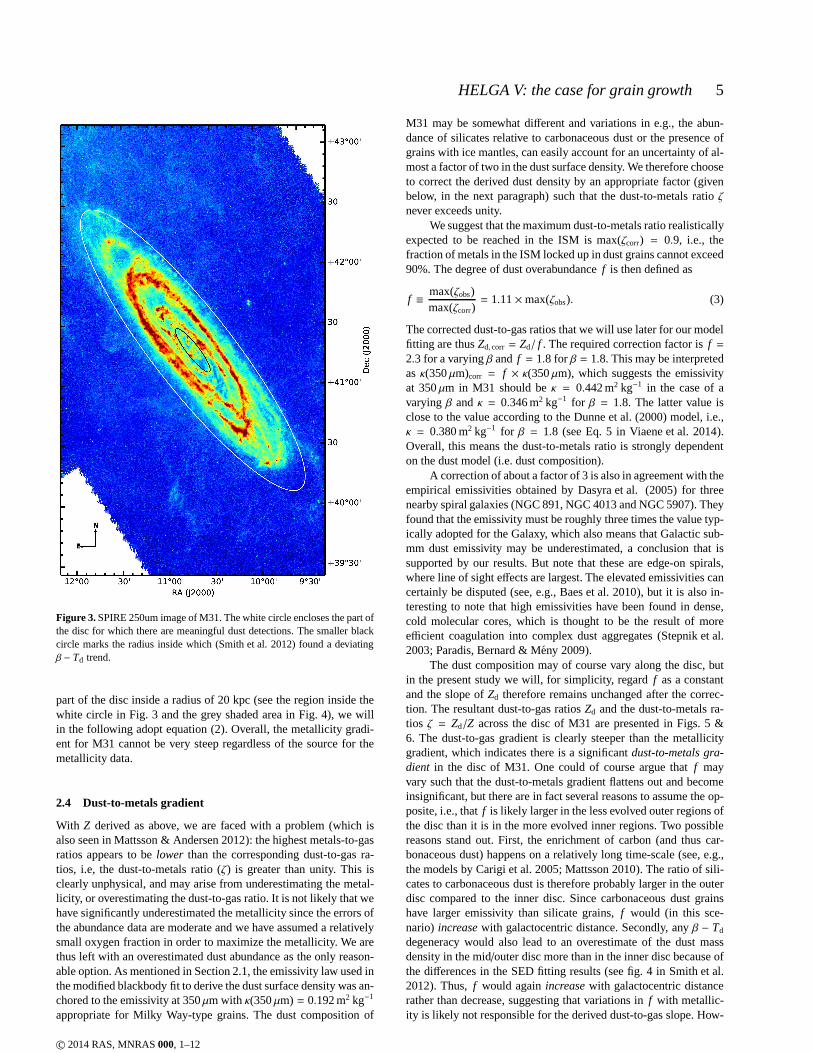
Figure 3.SPIRE 250um image of M31. The white circle encloses the part ofthe disc for which there are meaningful dust detections. Thesmaller blackcircle marks the radius inside which (Smith et al. 2012) found a deviatingβ − Td trend.
part of the disc inside a radius of 20 kpc (see the region inside thewhite circle in Fig. 3 and the grey shaded area in Fig. 4), we willin the following adopt equation (2). Overall, the metallicity gradi-ent for M31 cannot be very steep regardless of the source for themetallicity data.
2.4 Dust-to-metals gradient
With Z derived as above, we are faced with a problem (which isalso seen in Mattsson & Andersen 2012): the highest metals-to-gasratios appears to belower than the corresponding dust-to-gas ra-tios, i.e, the dust-to-metals ratio (ζ) is greater than unity. This isclearly unphysical, and may arise from underestimating themetal-licity, or overestimating the dust-to-gas ratio. It is not likely that wehave significantly underestimated the metallicity since the errors ofthe abundance data are moderate and we have assumed a relativelysmall oxygen fraction in order to maximize the metallicity.We arethus left with an overestimated dust abundance as the only reason-able option. As mentioned in Section 2.1, the emissivity lawused inthe modified blackbody fit to derive the dust surface density was an-chored to the emissivity at 350µm with κ(350µm) = 0.192 m2 kg−1
appropriate for Milky Way-type grains. The dust composition of
M31 may be somewhat different and variations in e.g., the abun-dance of silicates relative to carbonaceous dust or the presence ofgrains with ice mantles, can easily account for an uncertainty of al-most a factor of two in the dust surface density. We thereforechooseto correct the derived dust density by an appropriate factor(givenbelow, in the next paragraph) such that the dust-to-metals ratio ζnever exceeds unity.
We suggest that the maximum dust-to-metals ratio realisticallyexpected to be reached in the ISM is max(ζcorr) = 0.9, i.e., thefraction of metals in the ISM locked up in dust grains cannot exceed90%. The degree of dust overabundancef is then defined as
f ≡max(ζobs)max(ζcorr)
= 1.11×max(ζobs). (3)
The corrected dust-to-gas ratios that we will use later for our modelfitting are thusZd, corr = Zd/ f . The required correction factor isf =2.3 for a varyingβ and f = 1.8 for β = 1.8. This may be interpretedasκ(350µm)corr = f × κ(350µm), which suggests the emissivityat 350µm in M31 should beκ = 0.442 m2 kg−1 in the case of avarying β andκ = 0.346 m2 kg−1 for β = 1.8. The latter value isclose to the value according to the Dunne et al. (2000) model,i.e.,κ = 0.380 m2 kg−1 for β = 1.8 (see Eq. 5 in Viaene et al. 2014).Overall, this means the dust-to-metals ratio is strongly dependenton the dust model (i.e. dust composition).
A correction of about a factor of 3 is also in agreement with theempirical emissivities obtained by Dasyra et al. (2005) forthreenearby spiral galaxies (NGC 891, NGC 4013 and NGC 5907). Theyfound that the emissivity must be roughly three times the value typ-ically adopted for the Galaxy, which also means that Galactic sub-mm dust emissivity may be underestimated, a conclusion thatissupported by our results. But note that these are edge-on spirals,where line of sight effects are largest. The elevated emissivities cancertainly be disputed (see, e.g., Baes et al. 2010), but it isalso in-teresting to note that high emissivities have been found in dense,cold molecular cores, which is thought to be the result of moreefficient coagulation into complex dust aggregates (Stepnik etal.2003; Paradis, Bernard & Meny 2009).
The dust composition may of course vary along the disc, butin the present study we will, for simplicity, regardf as a constantand the slope ofZd therefore remains unchanged after the correc-tion. The resultant dust-to-gas ratiosZd and the dust-to-metals ra-tios ζ = Zd/Z across the disc of M31 are presented in Figs. 5 &6. The dust-to-gas gradient is clearly steeper than the metallicitygradient, which indicates there is a significantdust-to-metals gra-dient in the disc of M31. One could of course argue thatf mayvary such that the dust-to-metals gradient flattens out and becomeinsignificant, but there are in fact several reasons to assume the op-posite, i.e., thatf is likely larger in the less evolved outer regions ofthe disc than it is in the more evolved inner regions. Two possiblereasons stand out. First, the enrichment of carbon (and thuscar-bonaceous dust) happens on a relatively long time-scale (see, e.g.,the models by Carigi et al. 2005; Mattsson 2010). The ratio ofsili-cates to carbonaceous dust is therefore probably larger in the outerdisc compared to the inner disc. Since carbonaceous dust grainshave larger emissivity than silicate grains,f would (in this sce-nario) increasewith galactocentric distance. Secondly, anyβ − Td
degeneracy would also lead to an overestimate of the dust massdensity in the mid/outer disc more than in the inner disc because ofthe differences in the SED fitting results (see fig. 4 in Smith et al.2012). Thus,f would againincreasewith galactocentric distancerather than decrease, suggesting that variations inf with metallic-ity is likely not responsible for the derived dust-to-gas slope. How-
c© 2014 RAS, MNRAS000, 1–12

6 Mattsson et al.
Figure 4. Oxygen abundance as a function of galactocentric distance in M31. The solid black line shows the best log-linear fit to thefull set of metallicitydata, while the blue dashed line show the best-fitting ‘broken gradient’ with a constant O/H beyondR = 23 kpc. The grey shaded area marks the part of thedisc for which there is data for both metallicity and dust-to-gas ratio from the HELGA survey.
ever, the higherβ-values towards the inner disc may suggest theemissivity-law should be rescaled such that the overall emissivityis higher at small galactocentric distances. It is obviously not clearhow f may depend on galactocentric distance. Assuming that thedegree of dust overabundancef is constant withZ is therefore botha reasonable and conservative approach.
3 MODEL, INPUT AND FITTING
We have fitted the analytical models of dust-mass evolu-tion derived by Mattsson, Andersen & Munkhammar (2012) andMattsson et al. (2014), which are given in terms of the so-calledconfluent hypergeometric Kummer-Tricomi functions (Kummer1837; Tricomi 1947, see also Appendix A for further details aboutthe models) to the dust-to-gas profiles derived by Smith et al.(2012). We combine this with a metallicity profile derived fromabundances as a function of galactocentric distance (Fig. 4). Herewe briefly explain the parameters and the numerical routinesforfitting the data sets in Figs. 5 & 6 with the models listed in Table 1.
The model has four parameters: the effective dust yieldyd,the corresponding total metal yieldyZ, the grain-growth efficiencyǫ and the dust-destruction efficiencyδ. The metal yieldyZ needsto be fixed to the value obtained from the simple closed boxmodel. The closed box model is of course not a correct model ofhow the metallicity in late-type galaxies evolve. But as discussedin Mattsson, Andersen & Munkhammar (2012), it is a model thatworks in this context since gas flows should not affect thedust-to-metals ratiovery much. Using the observed O/H gradient (witha central value of O/H= 8.77) derived in this work (equation 2;Fig. 4) and the fact that the metallicity at a galactocentricdistance
R = 0.4 × R25 is known to be a good proxy for the typical metal-licity of a galaxy disc (Garnett et al. 2002), we have the followingrelationship (which follows from the simple closed-box model ofchemical evolution, see Pagel 1997) for the effective metal yield,
yZ =Z(R= 0.4× R25)
ln(1/µ), (4)
where µ is the global gas mass fraction of the galaxy. M31is a mature spiral galaxy with relatively little gas left in thedisc. Hence, we adopt a low mean gas-mass fraction ofµ =
0.12, which is based on various estimates found in the litera-ture (e.g., Pilyugin, Vılchez & Contini 2004; Worthey et al. 2005;Tamm et al. 2012). Furthermore, we assumeR25 = 102.07 arcmin(see Pilyugin, Vılchez & Contini 2004, and references therein)such that 0.4R25 = 9.32 kpc. Combined with the O/H gradient, thisgivesZ(R = 0.4 × R25) = 0.028 and thusyZ = 3.5 × 10⁻³. Theeffective stellar dust yieldyd andǫ are treated as free parameters.
There are reasons to believe dust destruction plays a relativelyminor role in the formation of a dust-to-metals gradient. This canbe motivated as follows. We have seen in Section 2 that there mustbe a significant dust-to-metals gradient in M31, which indicatessignificant dust growth in the ISM. M31 is also a galaxy wherethe metallicity is relatively similar across the disc and the dust-to-metals ratio may be close to unity in much of the inner parts (insidethe white circle in Fig. 3), which suggestsZ (1−Zd/Z) in equation.(A7) is small. Thus, we expectǫ ≫ δ sincedZd/dZmust be positiveand not too small in order for a dust-to-metals gradient to emerge.In caseǫ ≫ δ, it is fair to assume a model with a negligibleδ,since the net effect of dust destruction would be small comparedto the effect of grain growth anyway. We will therefore considermodels in whichδ = 0 as well as whereδ is a free parameter.
c© 2014 RAS, MNRAS000, 1–12
HELGA V: the case for grain growth 7
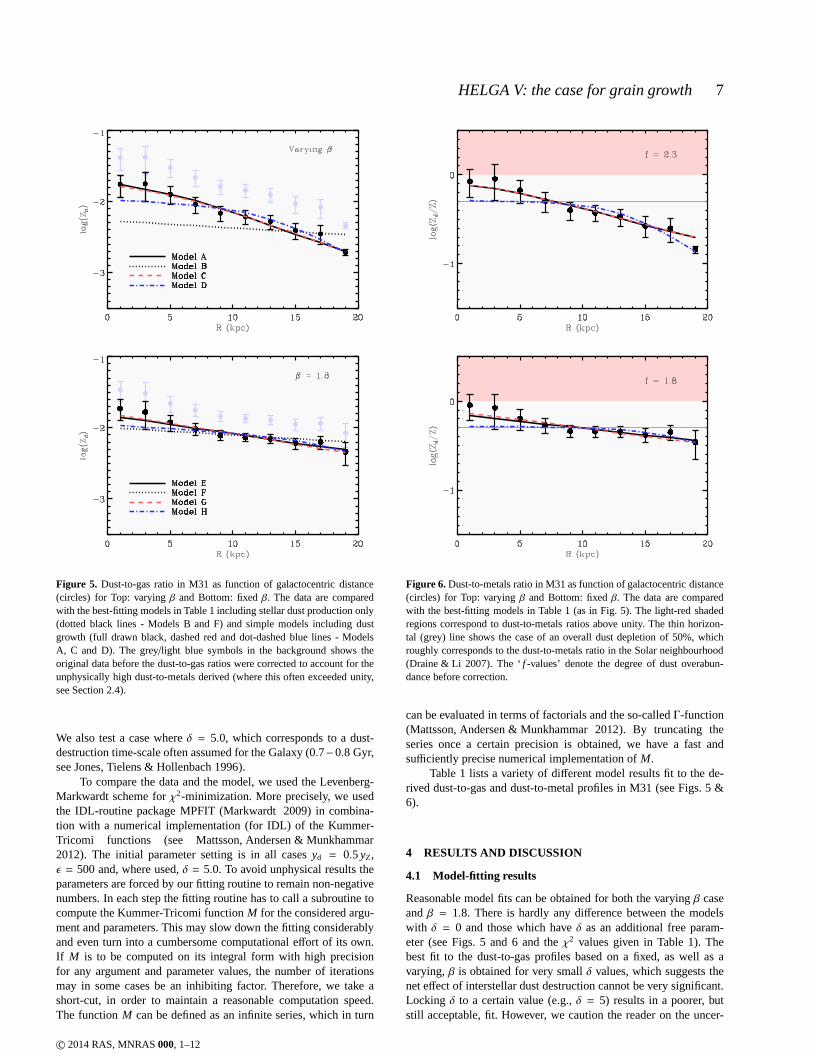
Figure 5. Dust-to-gas ratio in M31 as function of galactocentric distance(circles) for Top: varyingβ and Bottom: fixedβ. The data are comparedwith the best-fitting models in Table 1 including stellar dust production only(dotted black lines - Models B and F) and simple models including dustgrowth (full drawn black, dashed red and dot-dashed blue lines - ModelsA, C and D). The grey/light blue symbols in the background shows theoriginal data before the dust-to-gas ratios were correctedto account for theunphysically high dust-to-metals derived (where this often exceeded unity,see Section 2.4).
We also test a case whereδ = 5.0, which corresponds to a dust-destruction time-scale often assumed for the Galaxy (0.7−0.8 Gyr,see Jones, Tielens & Hollenbach 1996).
To compare the data and the model, we used the Levenberg-Markwardt scheme forχ2-minimization. More precisely, we usedthe IDL-routine package MPFIT (Markwardt 2009) in combina-tion with a numerical implementation (for IDL) of the Kummer-Tricomi functions (see Mattsson, Andersen & Munkhammar2012). The initial parameter setting is in all casesyd = 0.5yZ,ǫ = 500 and, where used,δ = 5.0. To avoid unphysical results theparameters are forced by our fitting routine to remain non-negativenumbers. In each step the fitting routine has to call a subroutine tocompute the Kummer-Tricomi functionM for the considered argu-ment and parameters. This may slow down the fitting considerablyand even turn into a cumbersome computational effort of its own.If M is to be computed on its integral form with high precisionfor any argument and parameter values, the number of iterationsmay in some cases be an inhibiting factor. Therefore, we takeashort-cut, in order to maintain a reasonable computation speed.The functionM can be defined as an infinite series, which in turn
Figure 6.Dust-to-metals ratio in M31 as function of galactocentric distance(circles) for Top: varyingβ and Bottom: fixedβ. The data are comparedwith the best-fitting models in Table 1 (as in Fig. 5). The light-red shadedregions correspond to dust-to-metals ratios above unity. The thin horizon-tal (grey) line shows the case of an overall dust depletion of50%, whichroughly corresponds to the dust-to-metals ratio in the Solar neighbourhood(Draine & Li 2007). The ‘f -values’ denote the degree of dust overabun-dance before correction.
can be evaluated in terms of factorials and the so-calledΓ-function(Mattsson, Andersen & Munkhammar 2012). By truncating theseries once a certain precision is obtained, we have a fast andsufficiently precise numerical implementation ofM.
Table 1 lists a variety of different model results fit to the de-rived dust-to-gas and dust-to-metal profiles in M31 (see Figs. 5 &6).
4 RESULTS AND DISCUSSION
4.1 Model-fitting results
Reasonable model fits can be obtained for both the varyingβ caseandβ = 1.8. There is hardly any difference between the modelswith δ = 0 and those which haveδ as an additional free param-eter (see Figs. 5 and 6 and theχ2 values given in Table 1). Thebest fit to the dust-to-gas profiles based on a fixed, as well as avarying,β is obtained for very smallδ values, which suggests thenet effect of interstellar dust destruction cannot be very significant.Locking δ to a certain value (e.g.,δ = 5) results in a poorer, butstill acceptable, fit. However, we caution the reader on the uncer-
c© 2014 RAS, MNRAS000, 1–12

8 Mattsson et al.
Table 1. Settings and resultant parameter values for the model fits.yd andyZ are the dust and metallicity yields, respectively, andτgr,max, τgr,min are themaximum and minimum values, respectively, of the grain-growth time-scaleτgr as defined in Appendix A (equation A5). All models haveyZ = 3.5 · 10−3. ǫandδ parameterize the grain growth and dust destruction efficiencies, respectively.
Model setting: Resultant parameter values: τgr,max τgr,min red.χ2
(β) (ǫ) (δ) (yd) (yd/yZ) (ǫ δ) (Gyr) (Gyr)
(A) Var. Free 0 3.06× 10⁻⁴ 3.83× 10⁻² 218 - 1.86 0.230 0.297(B) Var. 0 0 3.29× 10⁻³ 4.12× 10⁻¹ - - - - 8.92(C) Var. Free Free 3.10× 10⁻⁴ 3.88× 10⁻² 217 1.54× 10⁻⁸ 1.87 0.231 0.334(D) Var. Free 5.0 7.56× 10⁻⁶ 9.72× 10⁻⁴ 563 5.0 0.721 0.0891 0.745
(E) 1.8 Free 0 1.44× 10⁻³ 1.80× 10⁻¹ 123 - 3.30 0.408 0.278(F) 1.8 0 0 3.82× 10⁻³ 4.79× 10⁻¹ - - - - 0.929(G) 1.8 Free Free 1.10× 10⁻³ 1..38× 10−1 148 3.25× 10⁻⁶ 2.74 0.339 0.357(H) 1.8 Free 5.0 3.97× 10⁻⁵ 4.98× 10⁻³ 579 5.0 0.701 0.0866 0.722
tainty of the simplistic model we use here - conclusions about theoverall efficiency of dust destruction should not be drawn from thisresult. The parameter values given in Table 1 should be takenwitha grain of salt also because the fit is intrinsically uncertain. We havetried a boot-strap Monte Carlo approach to estimate the ‘errors’ ofthe fitting parameters, but due to various uncertainties in the ob-servational data, the resultant probability density functions (PDFs)cannot be used as constraints (despite 10000 iterations). The PDFsare patchy and multi-modal functions which give no meaningfulstatistical variance. But it is clear that one can easily vary each pa-rameter by at least a factor of 2 and still stay within the error barsof the data.
Regardless of whether we use a fixed or varyingβthere is a clear dust-to-metals gradient along the disc ofM31. This is indicative of significant interstellar dust growth(Mattsson, Andersen & Munkhammar 2012) and we do indeed ob-tain relatively largeǫ values from the fits (see Table 1). The dust-to-metals ratio along the disc of spiral galaxies is typically not con-stant, but M31 (with its flat metallicity distribution) seems to have asteeper gradient than most of the SINGS spirals of comparable size(Mattsson & Andersen 2012). The same phenomenon is seen alsoin global dust-to-gas ratios and at lower metallicities in the recentresults by Remy-Ruyer et al. (2014).
The favoured effective stellar dust yieldyd is in all cases withǫ , 0 quite small. Naively, one would interpret that as stellar dustproduction being rather insignificant, but as mentioned above, thesimplistic model we use cannot provide very precise quantitativeresults due to its simplicity. The lowyd-values may be due to apossible degeneracy between stellar dust production and interstellargrain destruction due to SNe in star-forming regions.
Since the HELGA dust map, in combination with the gas dis-tribution, allows us to get a good handle on the Kennicutt-Schmidt(K-S) law in the M31 disc (Ford et al. 2012), we have an oppor-tunity to estimate the grain-growth time-scaleτgr using a consis-tent data set. Using the K-S law derived by Ford et al. (2012) wehave calculated the growth time-scaleτgr from equation (A5) inthe same 2 kpc wide bins along the disc that we have used pre-viously. The resultantτgr as function of galactocentric distance isshown in Fig. 7 for the cases of variable and constant emissivityindex β, respectively, and the maximum and minimum values arealso listed in Table 1. As expected, because the growth time-scaleτgr is anti-correlated with the gas-mass density due to its implicitdependence on the star-formation efficiency (see equations A6 andA5), there is a minimum where the gas distribution has its max-imum (at R ∼ 11 kpc), but we also see a significant rise in the
inner disc. These properties are found both for the case witha freeemissivity indexβ and forβ = 1.8, i.e., the radial variation of thegrain-growth time-scale (according to the models) are qualitativelythe same. We note also that these grain-growth time-scales are inreasonable agreement with the results of more detailed models forthe Milky Way (e.g., Dwek 1998; Zhukovska, Gail & Trieloff 2008,who findτgr ∼ 0.5− 1.0 Gyr in the solar circle).
As discussed in Mattsson, Andersen & Munkhammar (2012),a dust-to-metals gradient can to some degree be the result ofmetallicity-dependent stellar dust production. More precisely, M-type giants (on the AGB) do not produce their own raw materialfor dust production, which will lead to metallicity dependence. Onecould also argue that the inner regions should have more of evolvedlow-and intermediate-mass stars that have turned into carbon starsand thus alter the silicate-to-carbon-dust ratio, which inturn mayaffect the dust gradient we derive and cause an apparent metallic-ity dependence. However, both these issues are important only if alarge fraction of the stellar dust is due to AGB stars. Since thereis more and more evidence suggesting that massive stars (whichproduce most of the metals) are efficient dust producers, this islikely not the case. At very low metallicity there may be a thresholdalso for massive stars, though (see the hypothesis by Mattsson et al.2014).
Despite it is technically possible that such metallicity de-pendences could lead to a dust-to-metals gradient, it can bepretty much ruled out by the result proved in Appendix A inMattsson, Andersen & Munkhammar (2012):
If the metallicity dependence of the effective stellar dust yieldyd islinear (yd ∝ Z) and the dust-to-metals gradient is steeper than themetallicity gradient, then the slope of the dust-to-metalsgradientcannot be explained by metallicity-dependent stellar dustproduc-tion.
This result is, in fact, more general than so and should hold evenif yd is not linear with metallicity, and lends support to the grain-growth scenario in the present case. We note that (compare the reddashed lines in Fig. 5 with the data points in Fig. 6) the metallicitygradient of M31 is much flatter than its dust-to-metals gradient ifthe emissivity indexβ is treated as a variable, while the difference isless ifβ = 1.8. Thus, because of the flatness of the metallicity gra-dient in M31, there is one qualitative conclusion that may bedrawnfrom the simple model fits we present: the new HELGA dust mapprovides a good case in favour of the grain-growth scenario.
c© 2014 RAS, MNRAS000, 1–12

HELGA V: the case for grain growth 9
4.2 Caveats
Despite the relatively firm qualitative results given above, there area couple of caveats which we have to discuss in some detail. First,we have the problem of how to treat the emissivity indexβ. Is it aconstant or a variable? Is it covariant with other parameters? Sec-ond, SED fitting can be done using various models of the SED. Arethere one or two grain temperatures that dominate or should weconsider a continuous range of grain temperatures? Below wetryto address these issues.
4.2.1 Dust-to-gas ratio: fixed versus varyingβ
The dust abundance data used in this paper are mainly taken fromSmith et al. (2012), who choose to treat the emissivity indexβ as afree parameter in their one-component SED fits, which is reason-able sinceβ may not be the same in every environment. However,there is a parameter degeneracy betweenβ and the dust temperatureTd, because both affects the long-wavelength slope of the modelSED (see Smith et al. 2012, in particular their fig. 6). As one caneasily see in Fig. 1 (middle panel) the meanβ values in the innerdisc exceedsβ = 2, which is the slope expected for silicate dust(Draine & Lee 1984). It is worth emphasizing what we have al-ready mentioned in Section 2.2: at very low temperaturesβ > 2 ispossible (Coupeaud et al. 2011), but, as discussed by Smith et al.(2012), theβ–Td relation has two branches associated with the in-ner and outer disc in M31. This could, in principle, be a result of theaforementioned degeneracy. If such a parameter-degeneracy prob-lem is present, it would likely put an unphysical (and clearly un-wanted) bias on the resultant dust abundances. Therefore, we haveexplored both fixed and varyingβ in this work.
The observed SEDs are generally better fit with a varyingβand the emissivity indexβ should indeed vary depending on theratio of carbonaceous to silicate dust: the time-scale of carbon en-richment is significantly longer than that of silicon, magnesium,oxygen and other elements relevant for silicate formation (see, e.g.,Carigi et al. 2005; Mattsson 2010) because it is believed that car-bon is mainly produced by relatively long-lived stars that becomecarbon stars on the AGB. This suggestsβ is lower in evolved partsof a galaxy than it is in younger parts. Theβ-trend with galacto-centric distance should thus be increasing since the outer parts areusually less evolved than the inner parts. The fact that populationsof cold grains may have largeβ may work against the formationof such a trend, given that the characteristic grain temperature de-creases with galactocentric distance, as one may naively assume.Adopting a constantβ over the whole disc may therefore not becompletely unjustified and, more importantly, it appears toprovidea lower limit to the steepness of the dust-to-gas gradient (cf. Figs.1 and 2).
4.2.2 Dust temperatures: why one-component fits are both goodand bad
Fitting a one-component modified blackbody model to the SEDmay not be an optimal way of estimating the dust mass. The valid-ity of such a model depends on properties of the dust components.Sometimes there can indeed be a single dominant dust componentconsisting of grains of similar temperature, in which case aone-component modified blackbody model is a very good approxima-tion. If there are two distinct dust populations with clearly differentgrains temperatures, such a model would be inadequate because asingle component cannot capture the characteristics of a ‘bimodal’
dust-temperature distribution. But in case the SED reflectsa dustcomponent with a continuous distribution of grain temperatures, asingle component is more representative than a two-component fit,which may overestimate the contribution from the coldest grains.An overestimate of the cold component will also cause an over-estimate of the dust mass, since cold grains emit significantly lessradiation per unit grain mass. Also, theHerscheldata provides noinformation about the SED beyond 500µm, which makes it diffi-cult to constrain the contribution from the coldest dust in amulti-temperature fit. As pointed out by Smith et al. (2012), to use amodel containing dust at more than one temperature in a reliableway, we would require additional data at longer wavelengths, e.g.,observations at∼ 850µm with SCUBA2 (but see also Viaene et al.2014).
With the above in mind, one may see the radial dust-temperature profiles in a different light: the radial dust-temperatureprofile, and the anomalous double-branchedβ − Td relation in par-ticular, does not necessarily reflect changes in the dust compositionand heating sources in different parts of the disc only, but also abias caused by assumptions about the dust temperatures underlyingthe SED model. The emissivity indexβ is in practice just a ‘shapeparameter’ for the SED model, which is also the direct reasonforthe parameter degeneracy mentioned in Section 4.2.1. In case oneis trying to fit a single temperature model with a varyingβ to a dustcomponent which in reality has a continuous distribution ofgraintemperatures, that procedure may forceβ to become smaller as theSED of a multi-temperature dust component is always wider than asingle-temperature component. Obviously, this effect will also leadto an incorrect estimate of the dust mass. Hence, despite thehighquality of theHerscheldata, the difficulty in finding a simple butgeneral and adequate model for the SEDs in order to obtain thedust map requires that one uses the radial dust distributions pre-sented here (and in Smith et al. 2012) with some caution. We note,however, that the slope of the dust-to-gas profile we obtained witha varyingβ, agrees well with the slope of the dust-to-gas profile inthe inner disc of M31 derived by Draine et al. (2014) using differ-ent data and SED fitting technique. Our result forβ = 1.8, on theother hand, is in better agreement with the outer slope of thedust-to-gas profile according to Draine et al. (2014). We believe the twoprofiles presented here (top panels of Figs. 1 and 2) comprises therange of variation one may expect due to the uncertainty of the SEDmodel.
5 SUMMARY AND CONCLUSIONS
We have derived and modelled distributions of dust and metals inthe disc of M31 with the purpose of finding indirect evidence tohopefully distinguish between one of the two competing dustpro-duction mechanisms in late-type galaxies: stellar dust productionand interstellar grain growth. The data together with simple mod-els point towards interstellar grains growth being the mostimpor-tant mechanism, although firm conclusions cannot be drawn due topossible degeneracies between formation and destruction of dustassociated with stars.
We have computed mean radial dust distributions from theHELGA dust map based on simple SED models with a varyingas well as a fixed emissivity indexβ as well as an overall metaldistribution derived using data collected from the literature. In asecond step, we used a simple analytical model of the evolutionof the dust component in a galaxy and fit this model to the radialdust-to-gas distribution. The dust-to-gas gradient in M31is steeper
c© 2014 RAS, MNRAS000, 1–12

10 Mattsson et al.
Figure 7. The grain-growth time-scale (relative to the mean value) asafunction of galactocentric distance for the models where interstellar graingrowth were considered. Models A, C and D (full-drawn line) correspondto the case with a freeβ and models E, G, H (dashed line) correspond toβ =1.8. The time-scales are normalized to the mean value because they onlydiffer by a constant factor, except when comparing the cases of constantand varyingβ, respectively.
than the metallicity gradient, i.e., there is a clear negative dust-to-metals gradient along the disc, and in such cases our model sug-gests dust growth must be the dominant dust-formation mechanismin the ISM of M31. Taken at face value, our model fit actually sug-gests the net stellar dust production is almost negligible and thebuild-up of the dust component in M31 should therefore be domi-nated by interstellar growth.
From the above we conclude that M31 is a strong case forcosmic dust being the result of substantial interstellar grain growth,while the net stellar dust production must be limited. The efficiencyof dust production in stars (most notably SNe) and the grain de-struction in the ISM may be degenerate, however. Consequently,we can only conclude that interstellar grain growth by accretion isat leastas important as stellar dust production channels in buildingthe cosmic dust component in nearby galaxies. However, our resultis in line with the recent (and more detailed) dust-evolution modelsof late-type dwarf galaxies by Zhukovska (2014), which favourslow condensation efficiencies in type II SNe combined with sub-stantial grain growth in the ISM. Thus, it seems worthwhile to con-struct a detailed model of the radial dust distribution of M31, whichis more independent of the metallicity gradient. We hope to returnto this in a future publication.
ACKNOWLEDGEMENTS
We thank the anonymous referee and the scientific editor (MikeBarlow) for their constructive comments which improved thefinalmanuscript.Herschelis an ESA space observatory with science in-struments provided by European-led Principal Investigator consor-tia and with important participation from NASA. Nordita is fundedby the Nordic Council of Ministers, the Swedish Research Coun-cil, and the two host universities, the Royal Institute of Technol-ogy (KTH) and Stockholm University. The Dark Cosmology Cen-tre is funded by the Danish National Research Foundation. HLG issupported by the Science and Technology Facilities Council. I. DeLooze is a postdoc researcher at the FWO-Vlaanderen (Belgium).
REFERENCES
Andersen A. C., Loidl R., Hofner S., 1999, A&A, 349, 243Asano R. S., Takeuchi T. T., Hirashita H. & Inoue A. K., 2013,EP&S, 65, 213
Asplund M., Grevesse N., Sauval A.J. & Scott P., 2009, ARA&A,47, 481
Baes M. et al., 2010, A&A, 518, L39Bianchi S. & Schneider R., 2007, MNRAS 378, 973Blair W. P., Kirshner R. P., & Chevalier R. A., 1982, ApJ, 254,50Bresolin F., Kennicutt R. C., & Garnett D. R., 1999, ApJ, 510,104Braun R., Thilker D. A., Walterbos R. A. M., & Corbelli E., 2009,ApJ, 695, 937
Carigi L., Peimbert M., Esteban C., & Garcıa-Rojas J. 2005,ApJ,623, 213
Chapman N. L., Mundy L. G., Lai S.-P. & Evans N. J. II, 2009,ApJ, 690, 496
Coupeaud A., Demyk K., & Meny C. et al., 2011, A&A, 535,A124
Dasyra K. M., Xilouris E. M., Misiriotis A. & Kylafis N. D., 2005,A&A, 437, 447
Dennefeld M., & Kunth D., 1981, AJ, 86, 989Draine B., 1990, in BlitzL., ed., ASP Conf. Ser. Vol. 12, The Evo-lution of the Interstellar Medium. Astron. Soc. Pac., San Fran-cisco , p. 193
Draine, B. T. 2003, ARA&A, 41, 241Draine B. T., 2009, in Henning Th., Grun E., Steinacker J., eds,ASP Conf. Ser. Vol. 414, Cosmic Dust: Near and Far. Astron.Soc. Pac., San Francisco, p. 453
Draine B. T. & Lee H. M., 1984, ApJ, 285, 89Draine B. T. & Li A. 2007, ApJ, 657, 810Draine B. T. et al., 2014, ApJ, 780, 172Dunne L., Eales S., Edmunds M., Ivison R., Alexander P., &Clements D. L., 2000, MNRAS, 315, 115
Dunne L. et al. 2009, MNRAS, 394, 1307Dunne L. et al. 2011, MNRAS, 417, 1510Dwek E., 1998, ApJ, 501, 643Dwek E., Galliano F. & Jones A.P., 2007, ApJ, 662, 927Edmunds M.G., 2001, MNRAS, 328, 223Edvardsson B., Andersen J., Gustafsson B., Lambert D. L., Nis-sen, P. E. & Tomkin, J., 1993, A&A, 275, 101
Ford G. et al., 2013, ApJ, 769, 55Fritz J. et al., 2012, A&A, 546, A34Gall C., Andersen A. C. & Hjorth J., 2011a, A&A, 528, A13Garnett, D.R., 2002, ApJ, 581, 1019Gomez H. L. et al., 2012, ApJ, 760, 96Gordon K. D. et al. 2006, ApJ, 638, L87Griffin M. J. et al. 2010, A&A, 518, L3Groves B. et al. 2012, MNRAS, 426, 892Hirashita H. & Kuo T.-M., 2011, MNRAS, 416, 1340Hofner S., 2008, A&A, 491, L1Indebetouw R. et al. 2014, ApJL, 782, L2Izotov Y. I., Stasinska G., Meynet G., Guseva N. G. &Thuan T.X., 2006, A&A, 448, 955
Jones, A. P. 2004, in ASP Conf. Ser. 309, Astrophysics of Dust.Astron. Soc. Pac., San Francisco, 347
Jones A. P. & Nuth J. A., 2011, A&A, 530, A44Jones A. P., Tielens A. G. G. M. & Hollenbach D. J., 1996, ApJ,469, 740
Kamenetzky J. et al. 2013, ApJ, 773, L34Kiss, Cs.,Abraham P., Laureijs R. J., Moor A. & Birkmann S. M.,2006, MNRAS, 373, 1213
c© 2014 RAS, MNRAS000, 1–12

HELGA V: the case for grain growth 11
Kummer E. E., 1837, J. reine Angew. Math., 17, 228Kwitter K. B., Lehman E. M. M., Balick B. & Henry R. B. C.,2012, ApJ, 753, 12
Larson R. B. 1998, MNRAS, 301, 569Lee C.-H. et al., 2013 ApJ, 777, 35McConnachie A. W., Irwin M. J., Ferguson A. M. N., Ibata R. A.,Lewis G. F., Tanvir N., 2005, MNRAS, 356, 979
McKee C. F., 1989, in Allamandola L. J., Tielens A. G. G. M.,eds, Proc. IAU Symp. 135, Interstellar Dust. Kluwer, Dordrecht,p. 431
Markwardt C.B., 2009, in Bohlender D., Durand D., & DowlerP., eds., ASP Conf. Ser., Vol. 411, Data Analysis Software andSystems XVIII, Astron. Soc. Pac., San Francisco, p.251
Matsuura M. et al., 2011, Science, 333, 1258Mattsson L., 2010, A&A, 515, A68Mattsson L., 2011, MNRAS, 414, 781Mattsson L. & Hofner S., 2011, A&A, 533, A42Mattsson L., Andersen A. C. & Munkhammar J. D., 2012, MN-RAS, 423, 26
Mattsson L. & Andersen A. C., 2012, MNRAS, 423, 38Mattsson L., De Cia A., Andersen A. C. & Zafar T., 2014, MN-RAS, 440, 1562
Morgan H.L. & Edmunds M.G., 2003, MNRAS, 343, 427Morgan H.L., Dunne L., Eales S.A., Ivison R.J., Edmunds M.G.,2003, ApJ, 597, L33
Munoz-Mateos J. C. et al. 2009a, ApJ, 701, 1965Munoz-Mateos J. C. et al., 2009b, ApJ, 703, 1569Nieten C., Neininger N., Guelin M., Ungerechts H., Lucas R.,Berkhuijsen E. M., Beck R., Wielebinski R, 2006, A&A, 453,459
Norris B. R. M., et al., 2012, Nature, 484, 220Ormel C. W. , Paszun D., Dominik C. & Tielens A. G. G. M.,2009, A&A, 502, 845
Ossenkopf V., 1993, A&A, 280, 617Pagani L., Steinacker J., Bacmann A., Stutz A. & Henning T.,2010, Science, 329, 1622
Pagel B.E.J., 1997, ”Nucleosynthesis and Chemical Evolution ofGalaxies”, Cambridge Univ. Press, Cambridge
Paradis D., Bernard J.-Ph. & Meny C., 2009, A&A, 506, 745Pilbratt G.L. et al., 2010, A&A, 518, L1Pilyugin L. S., Vılchez J. M. & Contini T., 2004, A&A, 425, 849Pilyugin L. S., Vılchez J. M. & Thuan T. X., 2010, ApJ, 720, 1738Pilyugin L.S. & Mattsson L., 2011, MNRAS, 412, 1145Planck collaboration, Planck early results XIX, 2011, A&A 536,A19
Poglitsch A. et al. 2010, A&A, 518, L2Remy-Ruyer A. et al. 2014, A&A, 563, A31Ridderstad M., Juvela M., Lehtinen K., Lemke D., & Liljestr¨omT., 2006, A&A, 451, 961
Rho J., Jarrett T. H., Reach W. T., Gomez H. & Andersen M.,2009, ApJ, 693, 39
Sandstrom K. M. et al., 2013, ApJ, 777, 5Serra D´az-Cano L. & Jones A. P., 2008, A&A, 492, 127Slavin J. D., Jones A. P., & Tielens A. G. G. M., 2004, ApJ, 614,796
Smartt S. J., Crowther P. A., Dufton P. L., Lennon D. J., KudritzkiR. P., Herrero A., McCarthy J. K. & Bresolin F., 2001, MNRAS,325, 257
Smith M. W. L. et al., 2012, ApJ, 756, 40Steinacker J., Pagani L., Bacman A. & Guieu S., 2010, A&A, 511,A9
Stepnik B. et al., 2003, A&A, 398, 551
Tamm A., Tempel E., Tenjes P., Tihhonova O., Tuvikene T., 2012,A&A, 546, A4
Tricomi F. G., 1947, Ann. Mat. Pura Appl.: Ser. Quarta, 26, 141Trundle C., Dufton P. L., Lennon D. J., Smartt S. J., & UrbanejaM. A., 2002, A&A, 395, 519
Venn K. A., McCarthy J. K., Lennon D. J., Przybilla N., KudritzkiR. P. & Lemke M., 2000, ApJ, 541, 610
Viaene S. et al. 2014, A&A, 567, A71Worthey G., Espaa A., MacArthur L. A. & Courteau S., 2005,ApJ, 631, 820
Zhukovska S., Gail H.-P. & TrieloffM., 2008, A&A, 479, 453Zhukovska S. & Henning T., 2013, A&A, 555, A99Zhukovska S., 2014, A&A, 562, A76Zurita A. & Bresolin F., 2012, MNRAS, 427, 1463
APPENDIX A: ANALYTICAL MODEL
In the present paper we use the analytical closed-box modeldescribed in Mattsson, Andersen & Munkhammar (2012);Mattsson & Andersen (2012); Mattsson et al. (2014), which isbased on the equation
∂Zd
∂Z=
yd + Zd(τ−1gr − τ
−1d )
yZ, (A1)
where Z and Zd are the metals-to-gas (metallicity) and dust-to-gas ratios, respectively,τd is the dust destruction time scale,τgr is the interstellar dust-growth time scale andyd, yZ de-note the yields (dust and metals, respectively, as defined inMattsson, Andersen & Munkhammar 2012).
According to McKee (1989) the dust destruction time-scalecan be parameterized as
τd =Σg
〈mISM〉RSN, (A2)
where〈mISM〉 is the effective gas mass cleared of dust by each SNevent, andRSN is the SN rate. The time scaleτd may be approxi-mated as (Mattsson, Andersen & Munkhammar 2012)
τ−1d ≈
δ
Σg
dΣs
dt, (A3)
where δ will be referred to as the dust destruction parameter,which is a measure of the efficiency of dust destruction.Σs andΣg denotes surface density by mass of stars and gas, respectively.Note that there no explicit dependence on the gas mass densityΣg or the stellar mass densityΣs. For a Larson (1998) IMF andmISM ≈ 1000M⊙ (Jones, Tielens & Hollenbach 1996; Jones 2004),then δ ≈ 10 (see Mattsson 2011) which can be regarded asan upper limit (Dwek et al. 2007; Gall, Andersen & Hjorth 2011).The dust-destruction efficiency δ can also be calibrated to theexpected dust-destruction timescale for the Galaxy, whichonecan assume is approximately 0.7 Gyr (Jones, Tielens & Hollenbach1996). Given that the effective Galactic gas-consumption rate is∼ 2 M⊙ pc−2 Gyr−1, and the gas density is∼ 8 M⊙ pc−2, which im-pliesδ ≈ 5 (Mattsson et al. 2014).
As discussed in Mattsson et al. (2014), one can modifythis timescale so that the indirect effects of grain shatteringare included. Small grains tend to be more easily destroyed(Jones & Nuth 2011; Slavin, Jones & Tielens 2004) and it is there-fore reasonable to assume the dust destruction time scale should de-pend on the amount of grain shattering as well. The shattering rateis to first order proportional to the square of the dust-graindensity
c© 2014 RAS, MNRAS000, 1–12
12 Mattsson et al.
in the ISM. Thus, we may approximate the destruction time scalewith the expression
τ−1d ≈
δ
Σg
Zd
Zd,G
dΣs
dt, (A4)
whereZd,G is the present-day Galactic dust-to-gas ratio.The timescale of grain growth can thus be expressed as (see
Mattsson, Andersen & Munkhammar (2012)]):
τgr = τ0(Z)(
1−Zd
Z
)−1
, (A5)
where, to first order,τ0 is essentially just a simple function of themetallicity and the growth rate of the stellar component, i.e.,
τ−10 =
ǫZΣg
dΣs
dt, (A6)
whereǫ is a free parameter of the model.Adopting the above scenario, with the dust-destruction
timescale defined as in Eq. (A4), we arrive at the equation
dZd
dZ=
1yZ
{
yd + Zd
[
ǫ
(
1−Zd
Z
)
Z − δZd
Zd,G
]}
, (A7)
whereyZ is the metal yield. With 06 yd 6 yZ as a basic require-ment, solutions for the dust-to-gas ratioZd in terms of the metal-licity Z can be expressed in terms of the confluent hypergeometricKummer-Tricomi functions of the first and second kind (denotedUand M), respectively (Kummer 1837; Tricomi 1947). We refer toMattsson, Andersen & Munkhammar (2012) for further detailsonhow such solutions are obtained. The solution to Eq. (A7) canbewritten
Zd =yd
yZ
M[
1+ 12
ydyZ
(
1+ 1Zd,G
δǫ
)
, 32 ; 1
2ǫZ2
yZ
]
M[
12
ydyZ
(
1+ 1Zd,G
δǫ
)
, 12 ; 1
2ǫZ2
yZ
] Z, (A8)
whereM(a,b; z) = 1F1(a, b; z) is the Kummer-Tricomi function ofthe first kind, which is identical to the confluent hypergeometricfunction 1F1(a,b; z) . For comparison, we will also consider thecase there is neither grain growth, nor destruction of dust in theISM i.e. ǫ = δ = 0. We then have the trivial solution,
Zd =yd
yZZ, (A9)
corresponding to dust produced only by stars (e.g. from SNe and/orAGB), or a scenario where the interstellar grain growth and dustdestruction are exactly balanced.
c© 2014 RAS, MNRAS000, 1–12


![arXiv:1911.03247v1 [astro-ph.CO] 8 Nov 2019Stefano Ettori1 ;2, Mauro Sereno1, Sandra Burkutean3, and Jack Sayers4 1 INAF, Osservatorio di Astrofisica e Scienza dello Spazio, via P.](https://static.fdocuments.us/doc/165x107/609b22aee3a5ee42797defdf/arxiv191103247v1-astro-phco-8-nov-2019-stefano-ettori1-2-mauro-sereno1-sandra.jpg)