
Characterization of High-Degree Modes using MDI, …sylvain/research/preprints/NSO.WS27/... ·...
5
**Volume Title** ASP Conference Series, Vol. **Volume Number** **Author** c **Copyright Year** Astronomical Society of the Pacific Characterization of High-Degree Modes using MDI, HMI and GONG data S.G. Korzennik, 1 A. Eff-Darwich, 2,3 T.P. Larson, 4 M.C. Rabello-Soares, 4,5 and J. Schou, 4,6 1 Harvard-Smithsonian Center for Astrophysics, Cambridge, MA, USA 2 Dept. Edafologia y Geologia, Univ. La Laguna, 38206, Tenerife, Spain 3 Instituto de Astrofisica de Canarias, 38205, Tenerife, Spain 4 Hansen Experimental Physics Laboratory, Stanford University, CA, USA 5 Now at Physics Department, Universidade Federal de Minas Gerais, Minas Gerais, Brazil 6 Now at Max Planck Institute for Solar System Research, Lindau, Germany Abstract. We present the first characterization of high-degree modes (i.e., up to 900 or 1000), using three instruments and three epochs corresponding to the 2001, 2002 and 2010 MDI Dynamics runs. For 2001, we analyzed MDI full-disk doppler- grams, while for 2002, we analyzed MDI and GONG full-disk dopplergrams, and for 2012 we analyzed MDI, GONG and HMI full-disk dopplergrams. These dopplergrams were spatially decomposed up to = 900 or 1000, and power spectra for all degrees and all azimuthal orders were computed using a high-order multi-taper, power spec- trum estimator. These spectra were then fitted for all degrees and all azimuthal orders, above = 100, and for all orders with substantial amplitude. Fitting at high degrees generates ridge characteristics, characteristics that do not correspond to the underlying mode characteristics. We used a sophisticated forward modeling to recover the best possible estimate of the underlying mode characteristics (mode frequencies, as well as linewidths, amplitudes and asymmetries). We present the first attempt to apply this method to three instruments and three epochs. The derived sets of corrected mode char- acteristics (frequencies, line widths, asymmetries and amplitudes) are presented and compared. 1. Introduction The inclusion of high-degree modes ( up to 1000) has the potential to better constrain the outer 4% of the solar interior. Rabello-Soares et al. (2000) have shown what addi- tional constraints on the solar stratification can be derived when including high-degree modes, while Korzennik & Eff-Darwich (1999) have shown which improvements can be expected when deriving the solar internal rotation. Since individual modes merge into ridges at high degrees (> 300 for f-modes, > 200 for low order p-modes), one can only fit ridges at higher degrees. The resulting ridge characteristics (˜ ν, ˜ Γ, ˜ A,˜ α) are not the underlying mode characteristics (see Korzennik et al. 2004). Our approach is to fit ridges at high degrees and correct the ridge characteristics, using a precise and 1
Transcript of Characterization of High-Degree Modes using MDI, …sylvain/research/preprints/NSO.WS27/... ·...

**Volume Title**ASP Conference Series, Vol. **Volume Number****Author**c©**Copyright Year** Astronomical Society of the Pacific
Characterization of High-Degree Modes using MDI, HMI andGONG data
S.G. Korzennik,1 A. Eff-Darwich,2,3 T.P. Larson,4 M.C. Rabello-Soares,4,5 andJ. Schou,4,6
1Harvard-Smithsonian Center for Astrophysics, Cambridge, MA, USA2Dept. Edafologia y Geologia, Univ. La Laguna, 38206, Tenerife, Spain3Instituto de Astrofisica de Canarias, 38205, Tenerife, Spain4Hansen Experimental Physics Laboratory, Stanford University, CA, USA5Now at Physics Department, Universidade Federal de Minas Gerais, MinasGerais, Brazil6Now at Max Planck Institute for Solar System Research, Lindau, Germany
Abstract. We present the first characterization of high-degree modes (i.e., ` up to900 or 1000), using three instruments and three epochs corresponding to the 2001,2002 and 2010 MDI Dynamics runs. For 2001, we analyzed MDI full-disk doppler-grams, while for 2002, we analyzed MDI and GONG full-disk dopplergrams, and for2012 we analyzed MDI, GONG and HMI full-disk dopplergrams. These dopplergramswere spatially decomposed up to ` = 900 or 1000, and power spectra for all degreesand all azimuthal orders were computed using a high-order multi-taper, power spec-trum estimator. These spectra were then fitted for all degrees and all azimuthal orders,above ` = 100, and for all orders with substantial amplitude. Fitting at high degreesgenerates ridge characteristics, characteristics that do not correspond to the underlyingmode characteristics. We used a sophisticated forward modeling to recover the bestpossible estimate of the underlying mode characteristics (mode frequencies, as well aslinewidths, amplitudes and asymmetries). We present the first attempt to apply thismethod to three instruments and three epochs. The derived sets of corrected mode char-acteristics (frequencies, line widths, asymmetries and amplitudes) are presented andcompared.
1. Introduction
The inclusion of high-degree modes (` up to 1000) has the potential to better constrainthe outer 4% of the solar interior. Rabello-Soares et al. (2000) have shown what addi-tional constraints on the solar stratification can be derived when including high-degreemodes, while Korzennik & Eff-Darwich (1999) have shown which improvements canbe expected when deriving the solar internal rotation. Since individual modes mergeinto ridges at high degrees (` > 300 for f-modes, ` > 200 for low order p-modes), onecan only fit ridges at higher degrees. The resulting ridge characteristics (ν, Γ, A, α) arenot the underlying mode characteristics (see Korzennik et al. 2004). Our approach isto fit ridges at high degrees and correct the ridge characteristics, using a precise and
1

2 Korzennik et al.
Figure 1. Gap-filled Dynamics 2001/MDI power spectrum, displayed on a log-arithmic scale, for the zonal modes (m = 0). The dots represent the fitted ridges(black) or modes (green).
sophisticated ridge modeling procedure. We use a high-order sine multi-taper spectralestimator to smooth out the realization noise and fit ridges 100 ≤ ` ≤ 1000 or 900,using a multi-step least-squares minimization, and for all ` and all m.
We present the result of our analysis of six data sets acquired by 3 instrumentsover 3 co-eval epochs. We reduced the MDI data acquired during the 2001, 2002 and2010 Dynamics runs (90, 98 and 67-days long each), GONG data for the co-eval 2002and 2010 epochs, and HMI data for the co-eval 2010 epoch.
We corrected the ridge characteristics to derive mode estimates using a precise andsophisticated model of the ridge, (see Korzennik et al. 2013, and references therein).This model use the effective leakage matrix that is appropriate for each instrument.
2. Results
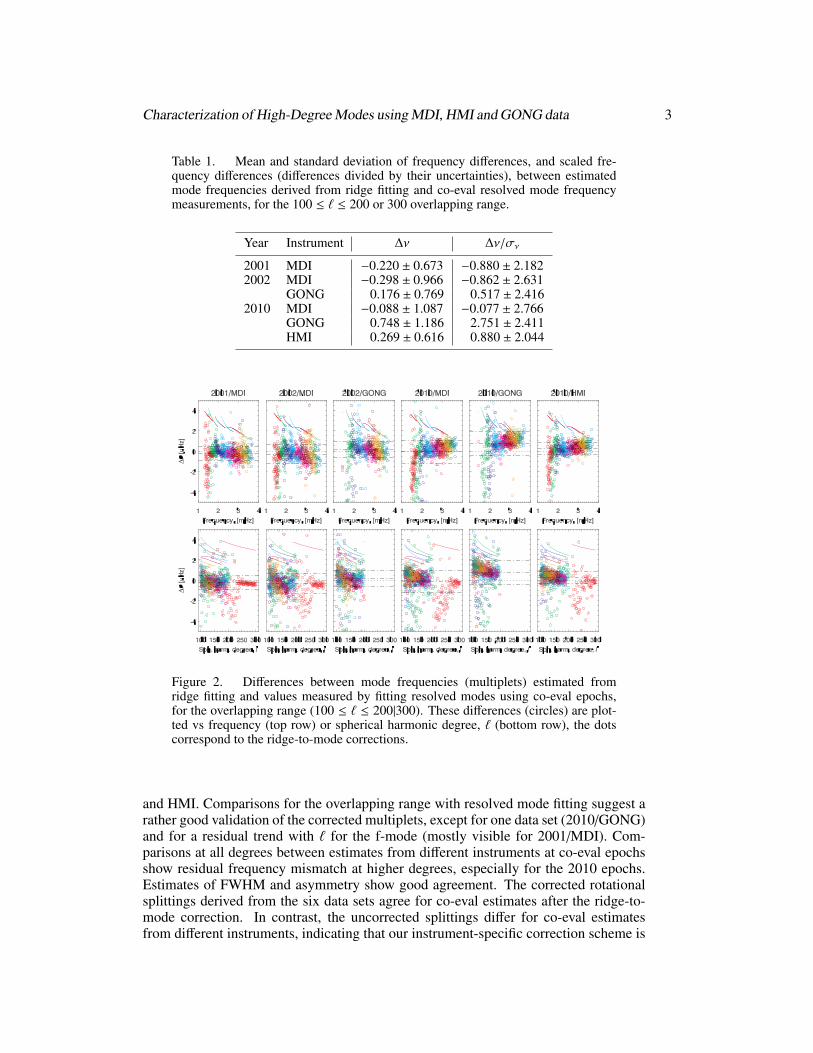
We first compare the mode frequencies for the overlap range between mode fitting andridge fitting. Indeed, at low and intermediate degree modes are resolved and individ-ually fitted (green dots in Figure 1). The high-order sine-multitaper used to estimatepower spectra for our ridge fitting also merged the individual modes into a power ridgeat intermediate degrees, allowing us to fit ridges down to ` = 100 (black dots in Fig-ure 1). That comparison is shown in Figure 2 and in Table 1. The figure shows thefrequency differences for all six data sets, the table presents the mean and standard de-viation of the differences, and of the scaled differences, i.e., differences divided by theiruncertainties.
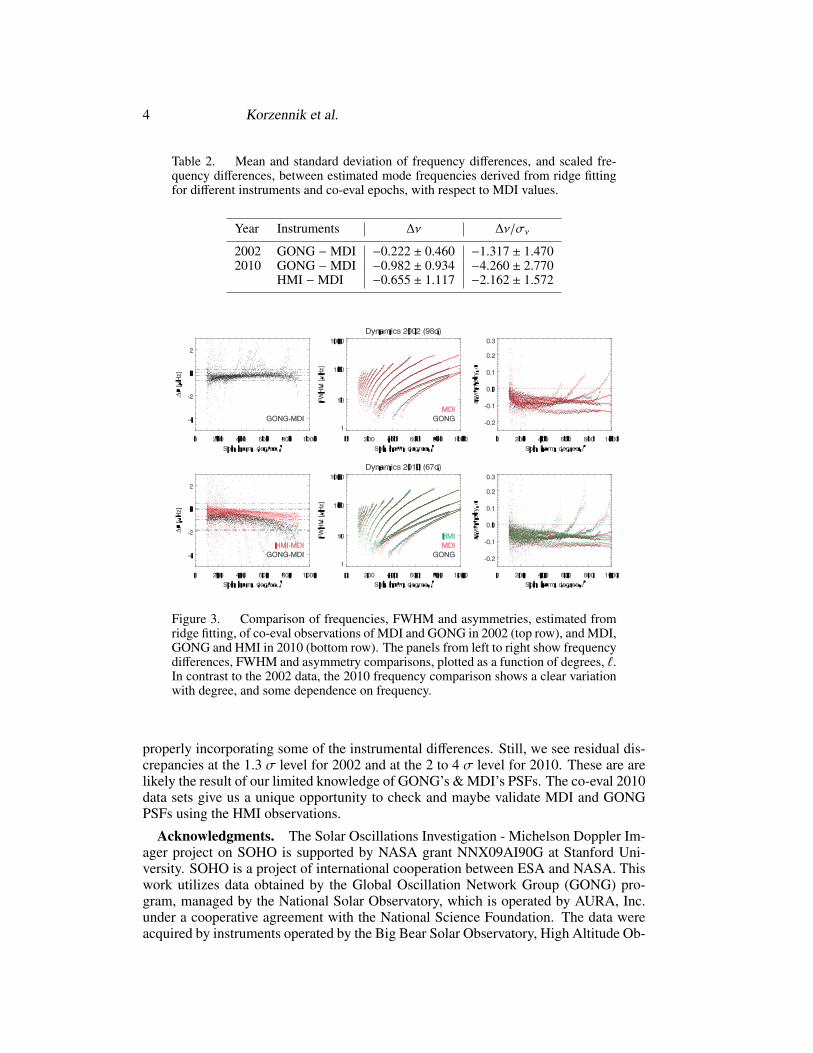
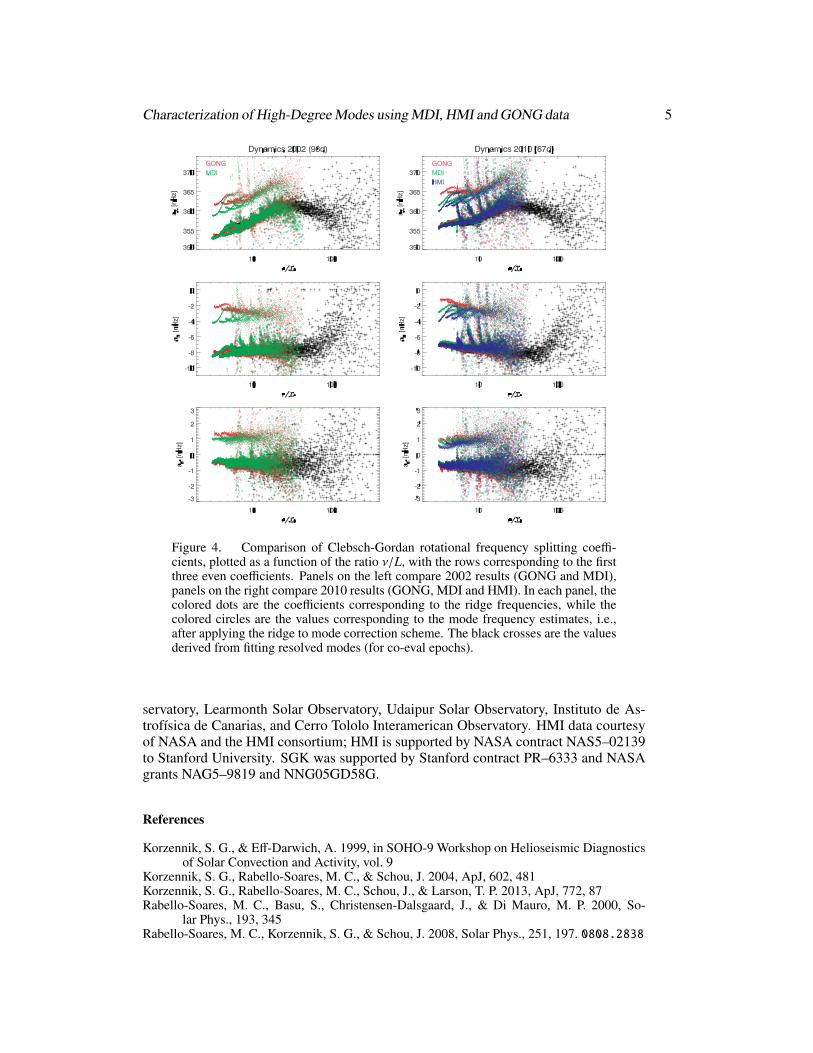
Figure 3 compares the frequencies, FWHM and asymmetries estimated for eachinstrument and co-eval epoch, with respect to MDI values. Table 2 presents the meanand standard deviation of the frequencies, and scaled frequencies differences. Figure 4compares the rotational splittings estimated for each instrument and co-eval epoch.
3. Conclusions
We have successfully implemented our high degree ridge fitting and ridge-to-modecorrection methodology for all three major helioseismic instruments: GONG, MDI
Characterization of High-Degree Modes using MDI, HMI and GONG data 3
Table 1. Mean and standard deviation of frequency differences, and scaled fre-quency differences (differences divided by their uncertainties), between estimatedmode frequencies derived from ridge fitting and co-eval resolved mode frequencymeasurements, for the 100 ≤ ` ≤ 200 or 300 overlapping range.
Year Instrument ∆ν ∆ν/σν
2001 MDI −0.220 ± 0.673 −0.880 ± 2.1822002 MDI −0.298 ± 0.966 −0.862 ± 2.631
GONG 0.176 ± 0.769 0.517 ± 2.4162010 MDI −0.088 ± 1.087 −0.077 ± 2.766
GONG 0.748 ± 1.186 2.751 ± 2.411HMI 0.269 ± 0.616 0.880 ± 2.044
Figure 2. Differences between mode frequencies (multiplets) estimated fromridge fitting and values measured by fitting resolved modes using co-eval epochs,for the overlapping range (100 ≤ ` ≤ 200|300). These differences (circles) are plot-ted vs frequency (top row) or spherical harmonic degree, ` (bottom row), the dotscorrespond to the ridge-to-mode corrections.
and HMI. Comparisons for the overlapping range with resolved mode fitting suggest arather good validation of the corrected multiplets, except for one data set (2010/GONG)and for a residual trend with ` for the f-mode (mostly visible for 2001/MDI). Com-parisons at all degrees between estimates from different instruments at co-eval epochsshow residual frequency mismatch at higher degrees, especially for the 2010 epochs.Estimates of FWHM and asymmetry show good agreement. The corrected rotationalsplittings derived from the six data sets agree for co-eval estimates after the ridge-to-mode correction. In contrast, the uncorrected splittings differ for co-eval estimatesfrom different instruments, indicating that our instrument-specific correction scheme is
4 Korzennik et al.
Table 2. Mean and standard deviation of frequency differences, and scaled fre-quency differences, between estimated mode frequencies derived from ridge fittingfor different instruments and co-eval epochs, with respect to MDI values.
Year Instruments ∆ν ∆ν/σν
2002 GONG −MDI −0.222 ± 0.460 −1.317 ± 1.4702010 GONG −MDI −0.982 ± 0.934 −4.260 ± 2.770
HMI −MDI −0.655 ± 1.117 −2.162 ± 1.572
Figure 3. Comparison of frequencies, FWHM and asymmetries, estimated fromridge fitting, of co-eval observations of MDI and GONG in 2002 (top row), and MDI,GONG and HMI in 2010 (bottom row). The panels from left to right show frequencydifferences, FWHM and asymmetry comparisons, plotted as a function of degrees, `.In contrast to the 2002 data, the 2010 frequency comparison shows a clear variationwith degree, and some dependence on frequency.
properly incorporating some of the instrumental differences. Still, we see residual dis-crepancies at the 1.3 σ level for 2002 and at the 2 to 4 σ level for 2010. These are arelikely the result of our limited knowledge of GONG’s & MDI’s PSFs. The co-eval 2010data sets give us a unique opportunity to check and maybe validate MDI and GONGPSFs using the HMI observations.
Acknowledgments. The Solar Oscillations Investigation - Michelson Doppler Im-ager project on SOHO is supported by NASA grant NNX09AI90G at Stanford Uni-versity. SOHO is a project of international cooperation between ESA and NASA. Thiswork utilizes data obtained by the Global Oscillation Network Group (GONG) pro-gram, managed by the National Solar Observatory, which is operated by AURA, Inc.under a cooperative agreement with the National Science Foundation. The data wereacquired by instruments operated by the Big Bear Solar Observatory, High Altitude Ob-
Characterization of High-Degree Modes using MDI, HMI and GONG data 5
Figure 4. Comparison of Clebsch-Gordan rotational frequency splitting coeffi-cients, plotted as a function of the ratio ν/L, with the rows corresponding to the firstthree even coefficients. Panels on the left compare 2002 results (GONG and MDI),panels on the right compare 2010 results (GONG, MDI and HMI). In each panel, thecolored dots are the coefficients corresponding to the ridge frequencies, while thecolored circles are the values corresponding to the mode frequency estimates, i.e.,after applying the ridge to mode correction scheme. The black crosses are the valuesderived from fitting resolved modes (for co-eval epochs).
servatory, Learmonth Solar Observatory, Udaipur Solar Observatory, Instituto de As-trofısica de Canarias, and Cerro Tololo Interamerican Observatory. HMI data courtesyof NASA and the HMI consortium; HMI is supported by NASA contract NAS5–02139to Stanford University. SGK was supported by Stanford contract PR–6333 and NASAgrants NAG5–9819 and NNG05GD58G.
References
Korzennik, S. G., & Eff-Darwich, A. 1999, in SOHO-9 Workshop on Helioseismic Diagnosticsof Solar Convection and Activity, vol. 9
Korzennik, S. G., Rabello-Soares, M. C., & Schou, J. 2004, ApJ, 602, 481Korzennik, S. G., Rabello-Soares, M. C., Schou, J., & Larson, T. P. 2013, ApJ, 772, 87Rabello-Soares, M. C., Basu, S., Christensen-Dalsgaard, J., & Di Mauro, M. P. 2000, So-
lar Phys., 193, 345Rabello-Soares, M. C., Korzennik, S. G., & Schou, J. 2008, Solar Phys., 251, 197. 0808.2838


![arXiv:0808.2505v1 [astro-ph] 18 Aug 2008Alessandro Chieffi Istituto Nazionale di Astrofisica - Istituto di Astrofisica Spaziale e Fisica Cosmica, Via Fosso del Cavaliere, I-00133,](https://static.fdocuments.us/doc/165x107/6099e33e2c74c94cbf5f03d5/arxiv08082505v1-astro-ph-18-aug-2008-alessandro-chieif-istituto-nazionale-di.jpg)
![arXiv:1710.05456v1 [astro-ph.HE] 16 Oct 2017 · PDF file22INAF-Istituto di Astrofisica Spaziale e Fisica Cosmica di Bologna, via Gobetti 101, 40129, Bologna, Italia ... Savchenko](https://static.fdocuments.us/doc/165x107/5a781bc47f8b9a4b538e765d/arxiv171005456v1-astro-phhe-16-oct-2017-22inaf-istituto-di-astrosica.jpg)

![arXiv:1911.03247v1 [astro-ph.CO] 8 Nov 2019Stefano Ettori1 ;2, Mauro Sereno1, Sandra Burkutean3, and Jack Sayers4 1 INAF, Osservatorio di Astrofisica e Scienza dello Spazio, via P.](https://static.fdocuments.us/doc/165x107/609b22aee3a5ee42797defdf/arxiv191103247v1-astro-phco-8-nov-2019-stefano-ettori1-2-mauro-sereno1-sandra.jpg)


![Instituto de Cosmologia Relatividade Astrofisica …arXiv:1302.7248v1 [gr-qc] 28 Feb 2013 The Quasi-Maxwellian Equations ofGeneral Relativity: Applications tothe PerturbationTheory](https://static.fdocuments.us/doc/165x107/5f49d23a2fee1040c97c8817/instituto-de-cosmologia-relatividade-astroisica-arxiv13027248v1-gr-qc-28-feb.jpg)


