
The ever-growing current account deficit is a matter of...
52
The ever-growing current account deficit is a matter of great worry for India and urgent steps need to be taken to keep it under control For Private Circulation Volume 1 Issue 84 08th Jul ’13
Transcript of The ever-growing current account deficit is a matter of...

The ever-growing current account deficit is a matter of great worry for India and urgent steps need to be taken to keep it under
control
For Pr ivate Circulat ion Volume 1 Issue 84 08th Jul ’13


It’s simplified...Beyond Market 08th Jul ’13 3
DB Corner – Page 5
Paving The WayThe FM has assured that he would take steps to revive investor sentiment, but he has a tough task ahead of him nonetheless – Page 6A Widening GapThe ever-growing current account deficit is a matter of great worry for India and urgent steps need to be taken to keep it under control – Page 8Going DownhillThe bottom line of many companies with a higher dollar debt in their balance sheet is likely to take a hit following the depreciation of the Indian rupee – Page 12False Alarm?Investors need not worry about tapering of QE as the probability of this event taking place will depend a lot on whether the US economy will recover or not – Page 15Survival InstinctFarmers must adapt to change and alter their methods of cultivating crops so that their reliance on monsoons will reduce greatly and they will be self-sufficient – Page 18In An Advantageous PositionThe growth of mortgage finance companies offers investors ample opportu-nity to invest in them – Page 22On The Same PlaneBy asking banks to treat restructured loans at par with NPAs, the RBI is aiming at improving the health of the banking sector – Page 25The Bliss Of SolitudeWith more and more senior citizens seeking solitariness and independence, realty companies are cashing in on this opportunity by building retirement homes to meet the needs of this segment – Page 28
Technical Outlook For The Fortnight – Page 31
KPIT Cummins Infosystems Ltd: Nurturing Its Core StrengthTactful acquisitions by KCIL have led to a strong foothold in focus verticals and is helping the company to steer ahead of competition – Page 32
Heading NorthwardsInvestors can look at investing in the world’s largest equity markets through US equity funds due to a revival in the markets – Page 36
Fantastic StochasticApart from giving buy and sell signals, Stochastic is a great tool to ascertain if a stock is in an oversold or overbought position – Page 40Quick ThrillsMuch like 20-20 in cricket, day trading too involves some 20 frequently occur-ring terms, which when used appropriately can benefit traders to a large extent – Page 42
Important Jargon For The Fortnight – Page 45
Volume 1 Issue: 84, 08th Jul ’13
Editor-in-Chief & Publisher: Rakesh BhandariEditor: Tushita NigamSenior Sub-Editor: Kiran V Uchil
Art Director: Sachin KambleJunior Designer: Sagar Padwal
Marketing & Operations:Divya Bhurat, Shreelatha Gollavathini
We, at Beyond Market welcome your views, comments and feedback. Do help us to grow better as per your liking. This is our attempt to reach you better while crossing horizons...
Web: www.nirmalbang.com [email protected] No: 022 - 3926 8047
HEAD OFFICE Nirmal Bang Financial Services Pvt LtdSonawala Building, 25 Bank Street, Fort, Mumbai - 400001 Tel. 022-3926 7500/7501
CORPORATE OFFICE B-2, 301/302, Marathon Innova,Off Ganpatrao Kadam Marg,Lower Parel (W), Mumbai - 400 013Tel: 022 - 3926 8000/8001
Research Team: Sunil Jain, Kunal Shah,Dipesh Mehta, Anand Shendge, Manav Chopra, Vikas Salunkhe, Amrita Burde

It’s simplified...Beyond Market 08th Jul ’134
Tushita NigamEditor
Till a while back, the Indian economy was trying to surface above inflationary pressures while battling a host of other issues at hand. Of these, the growing current account deficit
continues to be a big cause of worry for the country. This, coupled with a depreciating rupee has added to its woes as questions are being raised as to whether the government is doing enough to bridge the current account deficit and arrest the falling economic growth of the
country through the formulation of effective policies and streamlining of finances.
Read our cover story to understand how serious the issue of a burgeoning current account deficit is, its impact on the country’s economy and measures to prevent it. We have attempted to help you decipher and understand the depth of the problem at hand.
On a positive note, the Finance Minister has assured that required steps will be taken to reduce to negative impact of various factors on the economy, thus reviving investor
sentiment. There is an article in the current issue on this topic too.
Besides these, there are articles also on the impact of the depreciating Indian rupee on companies with high dollar debt, possibilities of the US Federal
Reserve tapering the quantitative easing programme and its impact on investors, the need for farmers in India to evolve and change with times
to reduce their dependency on seasonal monsoons, the growth of the mortgage finance industry in India, SEBI’s new norms that require
restructured loans to be treated at par with non-performing assets, which will eventually help improve the state of the banking sector and the growing retirement homes segment
in the country.
Do not miss the Beyond Learning section as it features two very interesting articles. While
one is on 20 important things to look out for during day trading, the other is on stochastic, a tool commonly used by
market analystS.

Stocks like Lupin Ltd (LTP: `850.70), Reliance Industries Ltd (LTP: `861.65), UCO Bank Ltd (LTP: `65.10), IndusInd Bank Ltd (LTP: `473.75), Bata India Ltd (LTP: `866.35), Tata Global Beverages Ltd (LTP: `143.40), CESC Ltd (LTP: `358.60), Atul Ltd (LTP: `321) and IndiaBulls Real Estate Ltd (LTP: ̀ 64) look good from investment and trading perspectives.
In the coming fortnight, Q1 FY14 results of India Inc are likely to be released. But the street is not having high expectations from these results as a number of companies may be affected by the depreciation of the Indian currencY.
It’s simplified...Beyond Market 08th Jul ’13 5
Disclaimer It is safe to assume that my clients and I may have an investment interest in the stocks/sectors discussed. Investors are required to take an independent decision before investing. Investment in equity is subject to market risk. Our research should not be considered as an advertisement or advice, professional or otherwise. The investor is requested to take into consideration all the risk factors including their financial condition, suitability to risk return profile and the like and take professional advice before investing.
he past fortnight was tumultuous for the global economy. In the US, the Fed Chairman Ben
Bernanke said they could start tapering fiscal stimulus measures through the first half of next year if unemployment rate improves or inflation edges closer to 2%. Following this announcement, FIIs began withdrawing funds from across the world, including India. This led to a further depreciation of the rupee.
Also, political uncertainty in European nations like Portugal and Italy is still a concern. While two key members of the PM’s cabinet have resigned in a disagreement over austerity measures in Portugal shaking the government, a coalition partner of the government has
T threatened to withdraw support due to the slow pace of reforms in Italy.
In India, the Reserve Bank of India kept key rates unchanged in the monetary policy review announced in June, despite inflation being below 5% owing to high current account deficit (CAD). The government is taking several initiatives to reduce gold imports to rein in CAD.
However, good rainfall across the country has been a positive amidst all this gloom.
Markets look good and traders and investors can consider partial buying at current levels and on declines. The Nifty has support at the 5,740 level. It looks good above the 5,910 level with a target around the 6,180 level.
Markets look good and traders and investors can consider
partial buying at current levels and on declines.
Sensex: 19,410.84Nifty: 5,836.95
(as on 4th Jul ’13)

The FM has assured that he would take steps to revive investor sentiment, but he has a tough task ahead of him nonetheless
ill as late as the middle of last decade, it was thought that India’s economy would take wings on the
back of a double-digit GDP growth to become a global economic super-power by 2050, if not earlier.
But the global economic crisis of 2008-09 affected all - the developed as well as the emerging economies, of which India is one.
Consequently growth slowed down, stock markets tanked, investments dried-up, work lay-offs occurred and a feeling of pessimism gripped the world economy.
India too was affected and went through a period of slowdown. However, it has recovered enough in
T the last two years to spur optimism once again.
Though the after effects of the 2008 global economic meltdown, has pockmarked the global economy, it can safely be said that India is in a comparatively better position vis-à-vis some of its peers and even some of the developed economies.
India’s GDP growth is likely to be in the region of 5% and a growth of even 5%, though admittedly lower than what was predicted, is still not a bad position for the country to be in, given the condition of both the global as well as domestic environments.
However, there is no room for complacency. The direction and pace of growth will depend heavily on how
the government steers the economy. The Union Finance Minister P Chidambaram has painted a reasonably optimistic picture a few days ago and promised positive action to spur growth.
The Indian economy still retains its strong economic fundamentals but the blip on the radar in the form of a contraction in its latest Index of Industrial Production (IIP) is a matter of concern.
The government would do well to speed up clearances stuck with various ministries as well as give a special emphasis to the agriculture, manufacturing as well as infrastructure sectors.
The latest IIP figures (April) reveal
PAVINGTHE WAY
It’s simplified...Beyond Market 08th Jul ’136

It’s simplified...Beyond Market 08th Jul ’13 7
last few years playing truant, this sector has taken a beating, resulting in lower demand in rural areas.
However, this year there are gladdening signs as the monsoon has arrived on time. Several states in the country have witnessed encouraging rainfall and indications are that this year Indian farmers will have reasons to cheer.
A good performance by the agricultural sector will not only push up demand in rural areas but will also help moderate food grains and vegetable/fruit prices, thereby pulling down inflation.
A heartwarming development in the last few weeks has been the decline in the rate of inflation.
For long, India was plagued by high inflation, which resulted in the central bank adopting a tight monetary policy. This resulted in high interest rates as well as a dampened investment climate.
Now, with inflation easing (presently at a 43-month low) hopes of a rate cut by India’s central bank have risen though it will have to factor in a depreciating rupee, which will push up import costs.
Rate cuts are, however, a certainty going forward, if not immediately, and along with other government initiatives could help propel growth in the mid-term.
For some time it was being felt that the Indian government was struck by policy paralysis.
However, the Union Finance Minister’s assurance recently to take steps to revive investor sentiment has come at the right time and should act as the necessary tonic to boost the investor confidence.
Fiscal consolidation, easing of foreign direct investments (FDI) caps in some sectors like retail, aviation and insurance, continuing the process of disinvestment and increasing government expenditure are some of the steps he outlined.
It is heartening to note that the government is not blind to the need for further economic reforms.
A 5% growth in the prevailing global circumstances is not a cause for alarm but if the authorities remain blind to the need for further economic reforms, then a slowing economy could totally offset all the advantages India enjoys as a potential economic superpower - that of abundant natural resources and favourable demographics, coupled with a huge internal demand potential. Therefore, under no condition should growth be allowed to slip below 5%.
India’s journey towards becoming an economic superpower is on course, despite the occasional blips in the last two to three years.
With the global economy not yet entirely recovered and growth moderated to around 5% to 6%, India’s economic miracle may take a little longer to achieve.
But even this moderate growth rate of 5% to 6% over the next three-year period will be enough to help build the platform for India to take the giant leap forward towards becoming an economic superpower by 2050.
The successful conclusion of the journey, however, solely hinges on how the authorities steer India in the next three years.
A high degree of statesmanship will need to be displayed to act wisely and take tough decisions as and when they are needeD.
only a 2.3% growth and has been described as ‘disappointing’ by no less a person than the Planning Commission Deputy Chairman Montek Singh Ahluwalia. The reason is not too far to seek.
Industry segments which constitute the engines of growth - mining, manufacturing, power as well as capital goods sectors - are all faring rather dismally.
There is, therefore, a pressing need for the government to monitor the manufacturing sector and take steps to facilitate its growth.
The infrastructure sector too needs an impetus with projects under implementation to be strictly monitored for on-schedule completion. The new infrastructure projects are not coming up as speedily as expected mainly on account of paucity of funds.
High interest rates are the prime deterrent though the silver lining here is that with inflation beginning to decline, the Reserve Bank of India (RBI) is likely to adopt an increasingly accommodative monetary policy.
This could make funds available for investors at reasonable interest rates resulting in higher investments, which in turn, would perk-up growth.
Another critical factor will be speedy clearances of projects by the government. This will not only buoy investor sentiment but also clearly signal the government’s intent to eradicate red tape and push ahead with economic reforms.
Agriculture, another strong contributor to the country’s GDP, has lagged behind in the last few years as it is heavily dependent on the monsoons. With the monsoons in the

The ever-growing current account deficit is a matter of great worry for India and urgent steps need to be taken to keep it under
control
It’s simplified...Beyond Market 08th Jul ’138

It’s simplified...Beyond Market 08th Jul ’13 9
fund CAD, experts think. So, why has CAD garnered so much attention? Why does it need to be fixed? Has India not been a CAD country in the past? The answer to this is the perennial nature of the country’s CAD.
A country that is progressing will always import more for its needs. However, India has increased its CAD even as its growth slowed.
Higher CAD means higher demand for foreign currencies to settle its import liabilities. This will put pressure on the rupee and weaken its value as it happened in recent weeks. This means the country will need to pay more for imports.
India’s CAD has moved from 0.6% of GDP in 2001 to an estimated 5% in 2012, while GDP growth has only slowed in this period. In fact in the past decade India enjoyed a surplus on current account in the years 2002, 2003 and 2004.
GLOBAL COMPARISION
India also has been an outlier if compared with few countries across the world. Russia and China have surpluses. While Chinese surplus has plummeted over the years as its focus shifted to imports rather than exports, other Asian countries have surpluses on current account or they have a modest deficit.
Apart from India, South Africa and Brazil have large current account deficits, but not to the extent of India’s figure. It is no wonder then that currencies of these economies have corrected in recent weeks.
At around $93 billion, India’s CAD in 2012 was second only to that of the US in absolute terms and higher than that of the UK, Canada and France.
NATURE OF INDIA’S CAD
The problem with higher CAD is that India has done little to control its import bill. It has done little to boost exports. And it has done little to get rid of its dependence on volatile capital flows to fill the overall balance of payments gap. Let us discuss each in some detail.
IMPORTS
India imports around 80% of its crude oil requirement. With crude oil comprising around 30% of the overall import bill, a slight change in international prices impacts the trade deficit in India. Depreciation of the Indian rupee against the dollar also has a negative impact on the landing cost of oil.
It is estimated that a US$1/barrel increase in crude increases trade deficit by US $900 million. Annual imports of oil are up by 10% but domestic production is up by only 2% over the last seven years. This situation is unlikely to change, unless domestic production of oil increases or alternative fuel like shale gas or renewable energy sources like solar or wind are tapped. The other major import item also the
igh current account deficit (CAD) and the extent of its funding is perhaps the most
daunting concern for India today.
The Indian rupee, which is closely linked to CAD and capital flows into India, has depreciated sharply as compared to the US dollar in the recent times.
Economists and analysts have warned about deteriorating CAD situation. Even the Reserve Bank of India (RBI) has said that higher CAD is a major risk to the Indian economy and we need to be ‘vigilant’ about global uncertainty, which might impact capital flows and thus worsen CAD.
The Indian government has been working overtime to fix the CAD issue. The government’s approach has been to boost exports, contain non-productive imports like gold and make the environment conducive for foreign investments.
All this will lead to a better CAD number. CAD moved from 3.9% of GDP in Q1FY13, to 5.4% in Q2FY13. It touched a record figure of 6.7% of GDP in Q3FY13. For Q4FY13, current account deficit narrowed sharply to 3.6%, which analysts say is indeed an aberration.
Slowdown in domestic activity led to a slowdown in non-oil and non-gold components of imports in the fourth quarter. With this Q4 number, CAD for FY13 stands at 4.8%.
However, with revision and some last-minute additions, analysts expect the CAD print for FY13 to be 4.5-5% of the GDP.
The recent sell-off in the equity and debt markets, which has taken a toll on the rupee, will impact overall capital inflow, thus its ability to fully
H
Source: Print And Wire Service
7.74.81.91.61.6
67.85.4
54.1
GDPGrowth
(Most Recent)
CAD(2012)
1.7-4.1-2.52.3
-5.3-1.93.2
16.96.7
ChinaIndiaBrazil RussiaSouth AfricaIndonesia Philippines ThailandVietnam Malaysia
Global Comparison

It’s simplified...Beyond Market 08th Jul ’1310
most controversial in recent times is gold. Its share in the total import bill has been increasing.
It comprises of more than 10% of overall imports. India’s’ liking for gold is because of high domestic inflation, lack of awareness about other financial products, negative real rate on their bank deposits and traditional values attached to this precious metal.
According to the World Gold Council, India imported a whopping 891 tonnes of the yellow metal in 2012. Despite increasing the import duty from 4% to 8% in the past two years, the purchase of the yellow metal continues unabated.
For both oil and gold, the recent plunge in prices has come as a blessing in disguise for India. Analysts don’t expect prices of oil to increase in a dramatic way due to shale gas discoveries in the US, which has curbed demand.
Going forward, analysts expect the Indian crude basket to average around US $100 per barrel for the next two years. Further, increase in domestic fuel prices will lead to moderation in demand, which will help correct the trade deficit.
For gold, cultural factors will lead to more demand due to fall in prices. However, demand from investors who take refuge in gold will fall as gold prices plummet and they take a hit on their investments.
Falling inflation and introduction of inflation-indexed bonds will see further demand destruction in the yellow metal, thus reducing CAD.
Further measures taken by the RBI and the government like restricting import of gold on a consignment basis by banks only to meet genuine needs of exporters of gold jewellery and restrict the facility of advances against the security of gold coins will bode well in curbing gold imports in
our country.
EXPORTS
India’s exports have been on a downward spiral since the global meltdown started in 2008.
Further, exports of services, especially information technology, which was the saving grace in the past decade has been hit by the global slowdown. There has also been a marked decline in exports of engineering goods, textiles as well as iron ore.
It helps to say here that India has done little to diversify in terms of export products or export geography. Therefore, for exports from a country to pick up a lot depends on developments in the exporting nation.
Further, few analysts have also argued that Indian exporters are losing their competitiveness, even with a depreciated rupee.
Source: Commerce Ministry
25.5826.2630.8424.1624.51
Exports2013 ($ billions) Imports Deficit
45.5841.1
41.1641.9544.65
19.914.910.317.820.1
JanuaryFebruaryMarchAprilMay
Exports And Imports In India
Source: Commerce Ministry
79.731.939.649.8
2061.917.9
7.122.1
FY08ITEM (US$, %) FY09 FY11
91.530.614.848.516.2-2.822.8
7.627.8
105.828.621.951.7
1416.342.511.543.4
FY10
86.830.2-5.144.515.5-8.229.610.329.8
FY12
154.931.744.666.113.520.961.312.554.1
Crude Oil% Of Total%YOYCapital Goods%Of Total%YOYGold &Silver%Of Total%YOY
Import Items

It’s simplified...Beyond Market 08th Jul ’13 11
CAPITAL FLOWS
It is a well-known fact that India funds CAD with foreign capital flows. If capital flows dip, India has to pay from its hard earned foreign exchange reserve. The capital account comprises of NRI deposits, ECBs, FDIs and FIIs. India on a sustained manner needs these flows.
Over the last few months, the government has taken several steps to boost dollar inflows. NRI deposit rates have been de-regulated, ECB norms have been relaxed, FII limits in debt securities have been increased.
Further, the government has started liberalizing FDI norms in a few
sectors. In the first five months of 2013, FIIs have invested $15 billion. If quantitative easing by the US Federal Reserve is not stopped, more money is likely to flow into India.
Critics have, however, argued that using hot money inflows to fill CAD leaves our external sector vulnerable. If FIIs pull out money due to adverse situations in the home country, it might cause balance of payments risk.
India has a foreign exchange reserve to cover imports for 6 months. While this might not raise eyebrows, if compared with reserves in 2008 when India had an import cover of around 14 months, the current situation might look deplorable.
IN A NUTSHELL
To sum up, the only way to contain CAD at 2.5% of the GDP as desired by the government is to increase the domestic production of oil and coal and restrain the consumption of gold. And to increase production, India must get policies and priorities right so that it finances CAD instead of paying from its hard-earned reserves.
India is testing waters by loosening FDI caps and is trying to improve environment for investments. Further, India also needs to improve its competitiveness as major export destinations are in trouble and India needs to diversify, both in terms of geography and exports of productS.
37.222.826.419.712.123.319.411.911.9
FY08ITEM (US$, %) FY09 FY11
4725.726.3
2815.342.2
2010.9
3.2
58.123.152.340.516.139.524.2
9.721.9
FY10
38.121.4
-18.929
16.33.6
19.911.1-0.9
FY12
66.922
13.946.915.446.9
289.2
22.7
Engnn Products% Of Total%YOYGems & Jewellery% Of Total%YOYTextile% Of Total%YOY
Export Items
What Is BOP?
BOP is a financial statement, which keeps track of incoming and outgoing money from a nation. It is sometimes vaguely referred to as an external sector. BOP has two parts: current account and capital account. Current account in turn is divided into balance of trade (exports minus imports of goods and services); factor income (interest and dividends from international loans and investments); net transfer payments (such as foreign aid, gift, donation).
For simplicity, current account can also be divided into visible (oil, gold, coal, ore, etc) and invisible (cash transfer, dividend, interest, import and export of services, etc) products.
On the other hand, capital account shows all the inflows and outflows of capital. The capital account records purchases and sales of assets such as stocks, bonds and land. Some of the components of capital account are foreign direct investment (FDI), foreign portfolio investment (FPI) and external commercial borrowing (ECB). A nation can run into surplus or deficit on one or both of the accounts. Surplus on one account can offset the deficit on the other account.
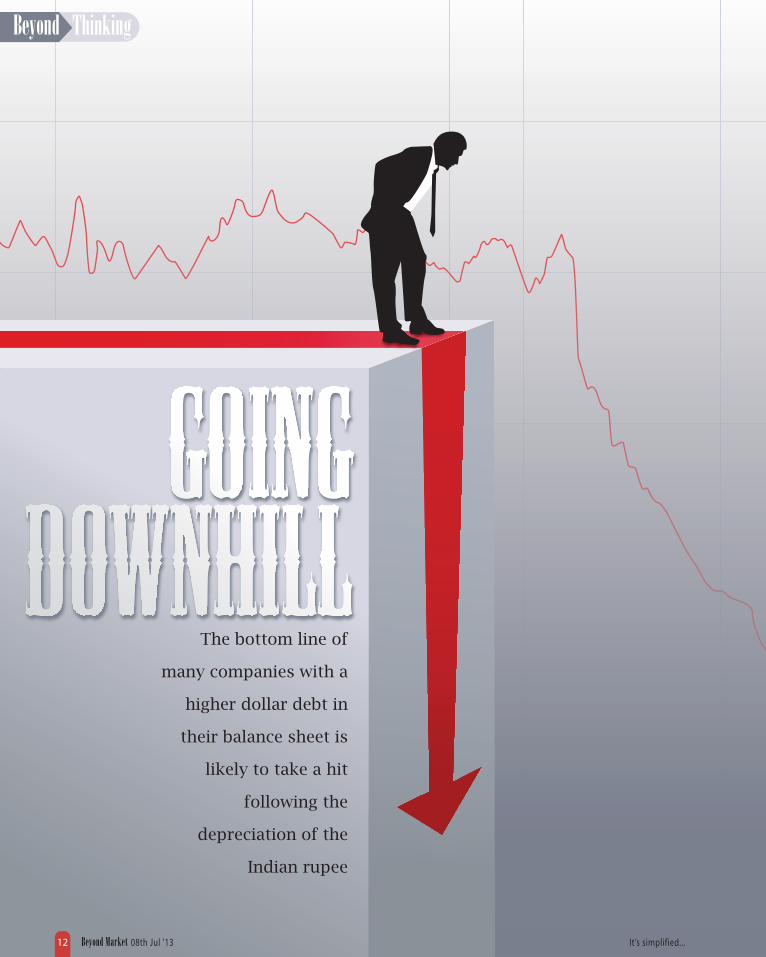
The bottom line of
many companies with a
higher dollar debt in
their balance sheet is
likely to take a hit
following the
depreciation of the
Indian rupee
It’s simplified...Beyond Market 08th Jul ’1312

It’s simplified...Beyond Market 08th Jul ’13 13
reported in the profit and loss statement. This is popularly known as translation gain or translation loss in the analyst community.
For example, assume that a company has a foreign unhedged US dollar debt of $100 million as of 31st Mar ’13 and has not changed by 31st June. However, during this time period the `/$ exchange rate has moved upwards by 10% from `55/$ to `60.5/$. In this case the company would report a loss of `550 million (100*(60.5 – 55)).
If the debt amount in rupee term increases, then the company has to report a loss and vice-versa. Obviously, with a falling rupee the debt amount would surely increase in the coming quarter and the bottom line of many companies with a higher dollar debt in their balance sheet, would take a hit.
When these companies will announce their quarterly results by the end of the June quarter, the profit is likely to be knocked-off by the translation loss that these companies have suffered.
Since the analyst and investor community tracks quarterly earnings results closely and the stock also reacts to these results, sometimes momentarily though, it would be helpful for investors to keep an eye on these companies.
The remaining section in this article lists out some of the top companies from different sectors with a potential for maximum impact on their quarterly profit and loss statement.
Tata Steel, the largest steel company in the country, has foreign currency convertible unhedged debt (FCCB) amount of $547 million on a standalone basis. The negative impact of depreciating rupee due to this much debt would be approximately `200 crore on the company’s profit
and loss statement.
As such the fundamentals of this company don’t look too good at this point of time and this additional burden would surely pull down the bottom line of the company.
Steel Authority of India Ltd (SAIL), another top steel producer in the country, has around `3,500 crore of foreign currency loans as of the last financial year end. The company reported foreign exchange loss to the tune of `307 crore for the quarter ended December ’12. During this time period, the Indian currency depreciated by 5.8%. Assuming that there had been no changes in the company’s accounting policy and debt amount on its balance sheet, the foreign exchange loss for April-June ’13 quarter is likely to be little more than `350 crore.
This is close to 7% to 8% of the company’s average quarterly net profit for the last few quarters. Considering the difficult environment of the steel sector, this would also hit hard on the company’s financials.
JSW Steel is another steel company with higher foreign debt and is likely to be impacted significantly in this quarter. The company has a total long-term loan and borrowings of around `4,000 crore at the end of the last financial year.
The company reported a foreign exchange translation loss of `267 crore in the third quarter ending December’13. Assuming that the amount of foreign debt has not changed since December’12, the company is likely to take a hit of around `320 crore for the June quarter this year. This could potentially wipe off the entire net profit and may push the bottom line of the company into the red.
ver the past few years, the Reserve Bank of India (RBI) has managed to maintain a high interest
rate regime to keep a check on inflation figures.
The difficult macroeconomic scenario in the US and across developed economies had kept the dollar interest rate at a lower level during the same time period.
Those Indian companies which were looking at expanding their business during this high interest rate regime opted for forex debt, mainly dollar, instead of rupee debt. Others who already had dollar loans continued to hold them.
While the benchmark interest rates in the US were hovering at around 2.5%, the interest rates were surging upwards in India. The interest rates in India were in the range of 7% to 8.5% during this time period. Lured by lower interest rates, easy availability and a hunger for overseas expansion, many companies in India raised significant amounts of foreign debt. Everything worked well till the time the rupee started depreciating significantly against the US dollar. The Indian rupee has depreciated more than 25% in the last two years. With the falling rupee, the debt burden of these companies started swelling up.
The debt is part of the balance sheet and since most of these companies are listed in India, their balance sheets are required to be reported in rupee terms.
As per accounting treatment, the dollar debt needs to be converted into rupee terms and the difference in the unhedged debt amount from the end of last reporting period to the end of current reporting period, has to be
O

It’s simplified...Beyond Market 08th Jul ’1314
Out of the three steel companies listed in this article, this one will be the most badly hit.
Tata Power, one of the country’s largest power producers, also has good amount of foreign debt on its balance sheet. As per its 2011-12 annual report, the company had close to `1,800 crore of foreign currency loan. As a result of this, it incurred forex loss of `42 crore in the quarter ending December '12.
With the current rupee depreciation, it is expected to incur roughly `50 crore of forex loss in this quarter. Though this is unlikely to impact the bottom line significantly, roughly one-tenth of the profit before tax will be wiped off because of this.
Aurobindo Pharma, a leader in the Indian pharmaceuticals industry, is also a potential candidate to look at. The company had foreign currency loan of little more than `5,000 crore
at the end of the financial year.
The company took a hit of `64 crore in the third quarter due to currency exchange losses. And this amount is likely to go up to `75 crore in this quarter and would account for almost half of the net profit. It means the company’s June quarter earnings would be hit badly.
The above companies are just a few of the examples and there are many more such companies from various other sectors. For instance, Bharti Airtel, the largest telecom player in India, has close to 70% of its debt denominated in US dollar.
In FY13 the company reported a forex loss of `275 crore and a `2,655 crore charge to Currency Fluctuation Reserve, on account of 4.7% depreciation in INR.
As the debt profile has not changed much since the end of FY13, the
impact of forex fluctuation in FY14E would be more or less similar to that in FY13. With current 6.8% depreciation in this quarter, there would be an impact of at least `400 crore on profit before tax.
Some other examples include Idea Cellular, Reliance Communication and Alok Industries, among others. The list of companies is not limited to large caps alone. It also includes companies from the mid-cap and small-cap space.
Instead of focusing purely on exact numbers, investors should look at the overall fundamentals of the company. If the forex loss is a small component of the profit, then the stock market may not react very negatively.
But in cases where the company’s forex loss is more than half of the overall profit or has the potential to push the bottom line into the red, investors need to be more watchfuL.
Micro analysis. Mega gains.Trading at Nirmal Bang is based on extensive research and in-depth
analysis, where we focus on the smallest of details and turn them into
an advantage for you.
Over the years, the analytical approach coupled with decades of
experience has helped us maximize returns for our investors and
thereby inspire con�dence in them.
EQUITIES* | DERIVATIVES* | COMMODITIES | CURRENCY* | MUTUAL FUNDS^ | IPOs^ | INSURANCE^ | DP* www.nirmalbang.com
REGD. OFFICE: Sonawala Building, 25 Bank Street, Fort, Mumbai - 400 001. Tel: 022 - 39267500 / 7501; Fax: 022 - 39267510 CORPORATE OFFICE: B-2, 301/302, Marathon Innova, O� Ganpatrao Kadam Marg, Lower Parel (W), Mumbai - 400 013. Tel: 022 - 39268000 / 8001; Fax: 022 - 39268010Disclaimer: Insurance is a subject matter of solicitation. Mutual Fund investments are subject to market risk. Please read the scheme related document carefully before investing. Please read the Do’s and Don’ts prescribed by Commodity Exchange before trading. The PMS Service is not o�ering for commodity segment. *Through Nirmal Bang Securities Pvt. Ltd. ^Distributors #Prepared by Research Analyst of Nirmal Bang Commodities Pvt. Ltd.
SMS ‘BANG’ to 54646 | Contact at: 022-3926 9404 | e-mail: [email protected]

Investors need not worry
about tapering of QE as the
probability of this event
taking place will depend a lot
on whether the US economy
will recover or not
uantitative easing, better known as QE has become the buzzword around the world ever since the Lehman crisis
and the global financial meltdown began in 2008-09. It is nothing but an unconventional method of monetary policies wherein the central banks of various countrys’ resort to money supply so that they can stimulate the economy by generating lost demand in the economy.
Since QE1 was started in November ’08 (post the global financial crisis), QE has stayed with the markets around the world for almost five years now. Importantly not just the US, the central banks across the world, including those in Europe and Japan too have resorted to QE to stimulate demand as well as revive their respective economies.
Most economists and experts believe that this has helped a lot in terms of recouping lost demand and arresting the looming threat of deflation. Importantly, the markets across the world have rejoiced. It has helped different asset classes, especially the equity markets to post decent returns.
Q
It’s simplified...Beyond Market 08th Jul ’13 15
It’s simplified...Beyond Market 08th Jul ’1316
mortgage-backed securities and another $175 billion of agency debt purchases. However that led to the beginning of QE2 in November ’10.
The Fed continued to buy more securities till QE2 ended in June ’11. It is considered that during this period the Federal Reserve had printed additional $600 billion.
QE3, which started around September ’12, was even more aggressive and open ended. As an open ended operation, the Fed is considered to be pumping around $40 billion every month in order to purchase mortgage-backed securities.
This is apart from Operation Twist, where it swaps short-term debt with long-duration securities. At the same time the Fed has also said that it would maintain interest rates at near zero till mid-2015.
So far it is believed that the Fed has printed about $3 trillion and continues to print an additional $85 billion each month. The liquidity has helped to a great extent and today the US economy is recovering and employment is improving.
CAN IT GO AWAY?
The purpose of quantitative easing is to revive demand, generate enough employment and maintain them for a period of time. Once the economic machine becomes self sustaining and grows along with employment generation and improvement in consumer confidence, there is less need for liquidity infusion.
Many consider QE as steroids, which are given to patients for early recovery. However, if a patient is recovering, he cannot be kept on steroids forever. Similarly, if the economy recovers, then typically the responsibility will shift from
government sector to private sector, which will then automatically take care of growth.
But before the private sector could play any role, the Fed wants to make sure that the economy is in a good condition. It makes sense that once the economy improves, there is a need to taper down quantitative easing.
However, there is one section of economists who call the US economic recovery fragile and the debt which is created to support quantitative easing will ultimately cause a long-term damage to the economy.
Because of less reliance on recovery, there is a feeling that QE might continue much beyond what is being told by the Fed. Many economists believe that these are structural issues, which will keep the US economy lower for a longer period.
They also compare the present situation in the US with Japan’s lost decade, where despite huge government spending and lower interest rates, Japan grew much lower for a very long period.
WHY DOES IT MATTER?
Many consider QE as too much easy money being supplied at a very low rate. In the US, short-term rates are near 0.3% which is almost zero. Because of huge money pumping a lot of this has found its way into equities and other asset classes because of higher yield.
Emerging debt and equity markets have attracted a lot of this money because they offered 7% to 8% yield (debt). In the last few years these markets and various other asset classes have rejoiced these extraordinary flows coming in from the US and other developed markets like Japan and Europe, thus helping
TAPERING EFFECT
Unlike in the past, today QE is in news for different reasons. How effective and sustainable these measures are is still a debatable issue. But for the first time after Federal Reserve chairman Ben Bernanke signalled a possible tapering down of QE, the world markets have taken cues and adjustments are taking place between various asset classes and markets. This has led to outflow of money from developing and emerging markets, thereby, impacting their currencies.
On 19th Jun ’13 at the Federal Open Market Committee (FOMC) meet, Bernanke said that if the US economy and the job market continue to show improvement in the coming months, a gradual tapering down of bond purchases could start later this year with continued reductions next year until they stop around mid-2014.
This is the second time in recent times that Bernanke has talked about tapering down of QE. Markets seem to have taken this news more seriously, which led to sudden selling in global equity markets and various other asset classes.
However, Fed chief Ben Bernanke reiterated that although the US economy is recovering with the GDP growth at around 2.4%, one needs to see this continuing in the near future and the employment rate should also remain healthy along with the desired rate of inflation.
If these things are fulfilled only then is there a need for tapering down of QE. Meanwhile, the Fed will continue to pursue its $85 billion purchasing programme every month.
QE1 which stayed with us till March ’10 was concluded with a total of $1.25 trillion in purchases of

It’s simplified...Beyond Market 08th Jul ’13 17
them to perform well.
Even when domestic investors were not investing, foreign investors kept on buying and that took the markets higher and higher. Some of these inflows are termed as dollar carry trade, yen carry trade and some others consider it leveraged money.
This effectively means that investors borrow at low cost or almost at zero cost and then invest the same money in assets and markets which offer higher yield. Generally, they hedge the downside risk. So, what they make is net gain.
For instance, assume that a person borrows at 1% in the US for six months. To hedge the currency risk he incurs another 3% to 4% on hedging. So, the net cost for him may not be more than 4% to 5%.
Even at that cost if you invest in emerging market debt, you will still make a clean 2% to 3%. And if you invest in equity the hedging cost
could go up slightly higher but the returns could be far greater.
This is just one very plain strategy. But there are many such complicated strategies that investors around the world employ to make quick money. This is precisely the reason news flow about QE impacts the flow of short-term money, easy money or leveraged money, causing short-term problems for the markets.
Only time will tell if QE will go away or stay. Meanwhile, it is believed that investors should not worry. If QE is going to be withdrawn, it will be only happen if the economy recovers, which in itself is good news because recovery in the economy will take care of markets and liquidity.
On the contrary if QE stays, there is no doubt that it will boost asset prices and markets, which will not be a healthy sign in the long run because debt levels will go up and questions could be raised about the solvency of the government itself.
In the short-term, tapering down of QE could impact sentiments. It is considered that on the back of these news flows a lot of volatility in the stock, currency and commodities markets and this is possible in the coming months.
Further, it is not good news for the Indian markets because it impacts sentiments and perceptions given that the emerging markets are considered to be risky in uncertain times.
If the US continues to spend, the world will be assured of more liquidity in the markets, which is particularly good for emerging economies like India. However, this will pose new challenges for central banks in emerging economies as higher liquidity will boost inflation, impact the currencies as well as interest rates.
Increase in the flow of money, particularly cheap money, will lead to a further spike in prices of various commodities globallY.
EQUITIES | DERIVATIVES | COMMODITIES* | CURRENC Y | MUTUAL FUNDS # | IPOs # | INSURANCE # | DPDisclaimer: Insurance is a subject matter of solicitation. Mutual Fund investments are subject to market risk. Please read the scheme related document carefully before investing. Please read the Do’s and Don’ts prescribed by Commodity Exchange before trading. The PMS Service is not o�ering for commodity segment. *Through Nirmal Bang Commodities Pvt. Ltd. #Distributors
SMS ‘BANG’ to 54646Contact at: 022-3926 9404, E-mail: [email protected]
BSE SEBI REGN No. INB011072759, INF011072759 & INE011072759, NSE SEBI REGN No. INB230939139, INF230939139 & INE230939139 DP SEBI REGN. No NSDL: IN-DP-NSDL-136-2000, CDS(I)l: IN-DP-CDSL-37-99, AMFI REGN. No. arn-49454 NCDEX REGN. NO. 00362, FMC Code-0075, MCX REGN. No. 16590, FMC Code-MCX/TCM/CORP/0490, MCX SX-INE260939139, PMS-INP000002981
Registered O�ce: 38-B, Khatau Building, 2nd Floor, Alkesh Dinesh Mody Marg, Fort, Mumbai - 400 001. Tel: 264 1234 / 3027 2000 / 2005; Fax: 30272006Corporate O�ce: B-2, 301/302, 3rd Floor, Marathon Innova, O� Ganpatrao Kadam Marg, Lower Parel (W), Mumbai - 400 013. Tel.: 39268000 / 8001 Fax: 39268010

his is one annual guest whose visit is awaited with bated breath by each and every Indian - from a
farmer to a policymaker. Just when the sweltering sun gets the better of us in the month of June, a cold whiff of wet air comes across as manna from heaven. We speak of none other than the south west monsoons that mark the onset of rains in India.
Come June and newspapers are rife with front page updates about the onset of monsoons and editors and policymakers wax eloquent in editorials about the impact of the monsoons on the country.
REASON TO CHEER BUT WILL IT LAST?
It is not just about raincoats and gum boots, our economy too is heavily reliant on the monsoon as the quantum of rains decide the course of action policymakers will need to take for the rest of the year.
The RBI Governor D Subbarao in a
TFarmers must adapt to
change and alter their
methods of cultivating
crops so that their
reliance on monsoons will
reduce greatly and they
will be self-sufficient
It’s simplified...Beyond Market 08th Jul ’1318

high current account deficit, high inflation and low growth hanging over the head of policymakers, they can hardly afford scanty rains.
But even as dark clouds loom over the horizon, experts are slightly apprehensive. They will be keenly keeping a tab on the month of July as it is during this period that most sowing of summer crops takes place.
Some weather experts are now saying that the eastern side of the Indian Ocean, which is experiencing a rise in temperature, may just soak up moisture from the monsoon clouds and play spoilt sport. If these predictions turn out to be true, we could have another major problem staring in our face in the year that has been promising.
HOW IT STACKS UP
In India monsoon is considered very important as we are an agrarian economy. Consider some statistics. Nearly 50% of the output from farms is a result of crops that are sown in the
June to September period each year.
The agriculture sector contributes to close to 15% of our GDP and agriculture is heavily dependent on monsoons. And agriculture provides employment to a staggering 58% of the entire population. Nearly 75% of rainfall in our country occurs between the months of June and September.
India has 5,50,000 villages and more than 70% of our country’s population is directly or indirectly dependent on agriculture for their livelihood The agrarian populace is mainly dependent on the kharif crop (or the summer crop), which relies heavily on monsoon rains. Crops such as rice, lentils, oilseeds and cotton are sown during this period.
South-west monsoons bring most of the annual rainfall over large parts of India. Whenever there is a dip in rainfall, its subsequent ripple effect is inevitable. Normal to good monsoon ensures that the country has enough food grains and this means that food prices are under control. Not just that,
public appearance recently stated how he and his fellow policymakers would ‘chase monsoons like farmers’ and that the monsoon outlook would be a key determinant in the forthcoming monetary policy reviews.
No wonder news of normal monsoons in the Indian subcontinent this year has managed to uplift economic confidence albeit marginally although there is an all pervasive gloom in the international markets.
As per news reports, rains across the country are already at a surplus of 20% and the months of July and August are expected to be even better.
A recent research report by Ipsos, an international research firm, states that economic confidence of India rose by 3% in the month of May shortly after reports expressing the likelihood of a normal monsoon were published.
Official reports say rainfall in India will be as good as 98%. This year the monsoons are crucial for more reasons than one. With the sword of
SURVIVALINSTINCT
It’s simplified...Beyond Market 08th Jul ’13 19
It’s simplified...Beyond Market 08th Jul ’1320
it also has a tempering impact on inflation besides keeping the import burden under control.
A weak monsoon on the other hand, pushes prices of food and other essential commodities, stokes inflation and lends a hand to hoarders who create havoc in the marketplace, causing harm to everyone.
In the past 40 years India was besieged with five major droughts. The worst and the most severe of these droughts were in 1972 and 2009 when rainfall deficiency was at 24% and 23% (anything below 90% rainfall between June and September is considered to be a drought-like situation). The other years when drought hit India were in 1979, 1987 and 2002.
Even though 5 out of 40 years seems like a small number, the average impact of scanty monsoons in these five years has been staggering.
Food production came down by 10.30% as kharif crop production came down by close to 14%. Even winter crop (rabi crop) saw quite a significant impact as it came down by close to 7%.
If there is anything close to a drought in the current fiscal year, we could have more trouble on our hands. Not only will food production drop by close to 10%, we might see nearly 0.7% being shaved off of our GDP growth rate.
Also, the fiscal deficit that has pretty much become the bane of the existence of policymakers now could worsen if the government is forced to introduce drought relief measures.
HAVE LESSONS BEEN LEARNT?
Even though there are insurance policies against scant monsoons, only
a handful of the 24 crore farmers in India can afford them or have even heard of them and are still dependent on the rain Gods for a bountiful crop.
If there is a drought-like situation, not just farmers but the entire economy spirals out of control. As recently as 2009, India faced a severe drought as it received only 77% of its annual rainfall, which was the third worst drought from the period (1901-2009).
Therefore, the question that needs to be asked is whether any lessons have been learnt so far or do we as a nation still depend on the mercy of the rain God? Apparently, yes. There have been slow but steady structural changes in the agricultural sector.
Over the past 40 odd years, the share of agriculture’s contribution to the economy has come down from a whopping 43% to 15%. This has been possible because industrial output has been increasing hand in hand with the rise of the service sector.
Over the years, several efforts have been made in the farmlands of India. For instance, in drought-prone areas, farmers are being educated to move away from staples and concentrate on cash crops.
Besides, alternative varieties of produce that consume less water have been customized for such areas and seed banks have been created to assist farmers. Technology too has been put to best use in such drought-prone areas.
In many drought prone hinterlands of the country rubber dams are being deployed. These rubber dams are not only cost effective but are also highly efficient as they can store water for use during droughts as well as act as a water proofing element.
Local authority bodies (government
and zila parishads) are now proactive in organizing camps, advisory bodies and meets for farmers that help them in getting to know better hedges against scanty rains.
MILES TO GO
Having said that, it would be no exaggeration to say that only the surface has been scratched. The marginal farmers (those who own one or two hectares of land) still hang on to seasonal rains and are often ignorant about these alternative ways of protecting themselves against scanty monsoons.
Therefore, when drought hits, they are the worst impacted and often take extreme steps like ending their lives because they simply cannot bear the pressures any longer. Farm insurance and formal credit remain far out of their reach and they still remain in the clutches of local moneylenders.
While we can be aware of such grave issues, it is up to the authorities to focus their attention on these marginal farmers who form a bulk of the agricultural workforce in India. Just providing subsidies and creating seed banks is not enough.
The need of the hour is education of the farming community in the country. Farmers need to be made aware of techniques of sowing alternative cash crops, rainwater harvesting and microfinance facilities, among others.
Widespread education over time will result in bringing down the over-dependency on seasonal rains in India. While we will still look heavenwards and wait for the benevolence of the skies for rains, at least our future generations will not have to worry about the availability of food grains at right prices if there are scanty rains in the countrY!


The growth of
mortgage finance
companies offers
investors ample
opportunity to
invest in them
It’s simplified...Beyond Market 08th Jul ’1322

It’s simplified...Beyond Market 08th Jul ’13 23
are perceived to be less risky as compared to other businesses such as banking, insurance and broking in the broader financial services domain. The Indian mortgage market has grown at a compounded annual growth rate (CAGR) of 16% over the past five years. A point to note is that over the same period of time, the Indian economy and the global economy have been slowing down. However, this does not indicate that the best days of housing finance industry are over.
According to a recent Credit Suisse report, the Indian mortgage business is nearly 9 to 11 years behind other emerging markets.
For example, while Indian mortgage penetration stands at 8% of India’s gross domestic product (GDP), the same is at 14% and 11% in case of China and Thailand, respectively at the end of CY12. The level of penetration was 8% for China in the year 2002 and for Thailand in 2004.
Simply put, as India continues to grow, young population with its rising income levels and reducing family size will keep fuelling housing demand as urbanization increases.
The Indian population’s median age is little over 25 years, which is lower than most other emerging nations. Also, there is a sustained uptick in urbanization of India.
Nearly 25% of the total population of India was living in urban areas in 2001 and now the number has moved up to 30%. This sets the stage for rising demand for housing. Housing finance companies stand to benefit from this development and the best is yet to come. While investors may buy into the long-term investment argument there
are some medium- and short-term positive developments that are adding juice to the investment opportunity. One such development is the recent softening of interest rates.
On the one hand, lower interest rates mean more affordability for mortgage seekers, which results in more demand for mortgages, and on the other hand it pulls down the cost of funding for housing finance companies, which in turn increases the net interest margin.
For example, coupon payable on HDFC’s non-convertible debentures has gone below 9%, which was quoting above 10% in December ’11. LICHF too has seen lower fund raising costs, as coupon payable by NCD issued by LICHF goes below 9% as compared to more than 10% in May ’11.
Lower interest rates also make it easy for existing home loan takers to service their home loans. This ensures lower non-performing assets in future as well.
A point to note is home loan as a credit portfolio observes lowest delinquencies in India, thanks to the emotional attachment a home loan customer has with his home - it is the last loan he would default on. Tax incentives associated with home loan is another factor that supports demands for mortgages.
In an extant structure a home loan borrower enjoys deduction up to `1,50,000 each financial year towards the interest paid on his home loan and `1,00,000 towards repayment of principal each financial year. This brings down the effective rate of interest for home loan borrowers.
As the country goes for parliamentary elections next year, there is a high
helter is a basic need of human beings. For Indians, home - to be precise - owned home is an emotional need
too. Owning a house is high on the agenda of Indians after they start earning their livelihood. For many, owing a house is a qualifying condition for marriage.
Even if they acquire a house, there is a tendency to look for another one - call it second home or an investment. Indians prefer real assets to paper assets – land, houses, shops, gold over shares, debentures and mutual funds.
They, however, prefer to own something that they can touch and feel. Naturally, house is a classic ‘investment candidate’ for many of them as they do understand what it takes to own one and how to benefit from it - in terms of rents as well as capital appreciation. All these factors drive the demand for houses in India, no matter the price at which the house is quoted. And the sky-high prices, such as those prevailing in the Indian real estate market for almost half a decade now, ensure that the leverage becomes the means to own a house in most of the cases. And the obvious beneficiaries of this hunger to own a house are housing finance companies.
This makes mortgage - housing finance - business a lucrative investment opportunity for investors who are keen to have an exposure in the India growth story.
And the empirical evidence too shows that long-term investors in mortgage business such as Housing Development Finance Corporation (HDFC) and LIC Housing Finance (LICHF) have smartly outperformed the broader markets.
More importantly these businesses
S

It’s simplified...Beyond Market 08th Jul ’1324
probability that the limits are liberally enhanced, thus creating a better pitch for mortgages. In the present context, many would point out the rising competition from commercial banks and insist that banks could be a better alternative to housing finance companies. Their argument is that banks offer a better investment opportunity as compared to housing finance companies.
All the aggression shown by banks has almost reached a nadir and there is little scope for banks to compete on the basis of ‘interest rate’ with housing finance companies as banks’
lending rates have hit base rates.
Housing finance companies raise their funds through bond markets that are far more efficient in reflecting lower interest rates as compared to retail fixed deposits, which are sticky in nature.
Banks cannot cut interest rates on fixed deposits as quickly as housing finance companies who can reduce the coupon payable on bonds issued by them. In addition to this, banks have a corporate loan book too. Blame the policy paralysis prevalent till the end
of CY12 or the paralysed Indian economy, many corporate loan accounts have gone in for corporate debt restructuring and the non- performing assets too are burgeoning.
Not many investors would want to own a lending business with concerns on the asset quality. Housing finance companies thus can be seen as a pure play on the India growth story with minimum asset quality concerns.
Savvy market participants can utilize the current volatility in the equity markets to accumulate stocks from the mortgage finance sector from a long-term growth perspectivE.
The most intelligent strategy in Chess is to be ready with the
next move. Similarly, currency trading involves moves that
are a combination of knowledge and skill, backed by years of
experience.
Currency Derivatives Trading with us keeps you a few steps
ahead, always.
Registered O�ce: Nirmal Bang Securities Private Limited. 38-B, Khatau Building, 2nd Floor, Alkesh Dinesh Mody Marg, Fort, Mumbai - 400001. Tel: 3926 8600 / 01; Fax: 3926 8610Disclaimer: Insurance is a subject matter of solicitation. Mutual Fund investments are subject to market risk. Please read the scheme related document carefully before investing. Please read the Do’s and Don’ts prescribed by Commodity Exchange before trading. Through Nirmal Bang Securities Pvt. Ltd. *Through Nirmal Bang Commodities Pvt. Ltd. #Distributors investment in securities is subject to market risk. investment in securities is subject to market risk
EQUITIES | DERIVATIVES | COMMODITIES* | CURRENC Y | MUTUAL FUNDS# | IPOs# | INSURANCE# | DP
Contact: 022-39268088 | e -mail: [email protected] | www.nirmalbang.com

By asking banks to treat restructured loans at par with NPAs, the RBI is aiming at improving the health of the banking sectorON THE
SAME PLANE
n an attempt to bring in more transparency in the banking system and to bring India at par with global best practices
in provisioning, the central bank recently unveiled a new set of norms for restructured assets. This means banks and non-banking financial companies (NBFCs) have till the year 2015 to bring all their restructured assets under the same ambit as that of non-performing assets (NPAs) and
I make similar provisions for them.
From 1st Apr’15 not only would restructured loans be considered at par with NPAs, provisioning for them would also be higher at 5% as compared to 2.75% currently. Tightening of provisioning norms has left corporate India not too happy as they are already in a bind as the economy is not in the pink of health now. And if the GDP numbers are an
indication, then things will not improve in a hurry. THE CORPORATE CRIB
In a situation such as this, tightening of provisioning norms is being translated as higher commitments on behalf of promoters, and it is being felt that far fewer corporations would be willing to restructure their assets. SMEs in particular would find it
It’s simplified...Beyond Market 08th Jul ’13 25

It’s simplified...Beyond Market 08th Jul ’1326
over these new provisioning norms as these norms mean that profitability of these lenders will take a hit in the short- to medium-term. Initial calculations reveal that the banks collectively could take a hit of `13,000 crore on their bottom-line in the next two years or so. Estimates by banking sector analysts show that loan recasts have been happening at the rate of `5,000 to 7,000 crore in a single month. With provisioning being raised to 5% from 2.75%, additional provisioning costs could be to the tune of `6,000 crore. This is assuming that the pace of recasts remains the same.
INVESTOR CONSIDERATION
According to domestic rating agency, Crisil, over the next two years provisioning costs would increase by `15,000 crore, and that in turn, could impact profitability of banks by around 7% to 8%.
The larger worry is that of public sector banks who comprise a lion’s share of the restructured assets in the industry. To cite some examples, Punjab National Bank’s restructured assets stand at 9.6% of its loan book, Central Bank (14%) and Indian Overseas Bank (10%).
Comparatively speaking, private sector banks are at a better position. For instance, the restructured assets at HDFC Bank are at a mere 0.3% of its loan book, Axis Bank at 2.4% and ICICI Bank at 1.5%. Of course, it is not entirely the fault of public sector lenders that they have a higher proportion of restructured assets.
Being in the public sector has more often than not been a disadvantage for banks as they have, under pressure from ruling political parties, been coerced into lending to projects that they are not very convinced about.
Private sector banks do not have to succumb to such pressures and could perhaps be far more discerning about their choice.
Public sector bankers as of now are, however, putting up a brave front and several banking heads have spoken at public gatherings and assured that the actual hit on the earnings of their banks would be far less than it appears to be from these initial back of envelope calculations.
They claim that these provisioning norms though they come in at a time when there are several other issues in the economy, need to be taken in the stride and the impact though significant will still be manageable.
As for investors in banks though these numbers seem daunting, analysts say that there is nothing much to be alarmed about. The main reason they cite is that while examining banks, analysts already treat restructured loans as non performing loans.
Provisioning at par means that there will be lesser cash flow for these banks, but in essence it will not have a big impact on their valuations. The ability of these banks to raise capital subsequently is, therefore, not questionable at all.
This is going to be an important consideration when the Basel III regime kicks in. But for now investors in banking stocks need not read too much into these new provisioning norms as it has already been factored into the valuations.
If anything, the new norms augur well as it is a move aimed at improving the health of the banking sector. It’s a bit like putting the banking system on a treadmill if you will! The initial pain is inevitable, but at the end of the day it will be a much healthier and fitter banking systeM.
doubly difficult as they would now be required to give in a personal guarantee like a house or their personal wealth.
So far, corporates were being given some concession even if they were not in a position to keep their commitments on repayments.
The standard practice in the banking sector has been to ‘evergreen’ an account. This means that a fresh loan would be issued on the basis of the ‘relationship’ that the bankers and the corporates shared. Evergreening is a practice where a new loan is given to repay the old loan. This is detrimental to the health of the banking system as it leads to a much bigger mess eventually.
The central bank can hardly be blamed as it is trying to put an end to practices such as these. Even though corporates have severely criticized the timing of the central bank, the RBI has in fact been very logical and prudent in making these moves. Contrary to what corporates may be saying, it has gone ahead and even made some concessions.
For instance, the banking authority has made an exception for infrastructure projects that suffer because of administrative delays for years on end.
Keeping in mind that several banks lend to infrastructure projects, the RBI has said that they need not be treated at par with NPAs. But this concession brings into light the banking system’s over exposure to the infrastructure segment. But that is a different issue altogether.
HOW BANKS ARE COPING
For now, not just Indian corporations but banks too are losing their sleep


hildhood and old age have a lot of things in common. Both require proper attention and care,
sometimes more so in old age. Not long ago, Indian society used to be joint family-oriented where the younger generation used to take care of the older generation.
However, times have changed and the joint family system has been replaced by nuclear families.
The trend today is that senior citizens want to live an independent life without being dependent on their children. With this changing face of society came the concept of retirement homes. Popular in the Western world, the concept is slowly but steadily taking a foothold in India as well.
C Worldwide, senior or retirement housing is a $25 billion industry.
According to a report by real estate consultancy firm, Jones Lang LaSalle India (JLL India), in the US alone, there are over 2,000 senior housing projects with over 5,00,000 residents.
The concept of senior housing has taken time to come to India because of the negative implications of separate housing for senior citizens. These homes were taken to be synonyms for abandonment of old people in India.
With the passage of time, perceptions have changed. “We have lived our life according to our wish, now we want to let our children live their life according to their wish,” is a common sentiment now among senior citizens
The Bliss Of Solitude
in urban India. And so they have opted for retirement housing.
Other reasons are improved finances with respect to the earlier generation, breaking up of joint families and improved life expectancies. Above all, most senior citizens want to live their retirement years in peace with less stress and worries.
Earlier, two kinds of retirement homes were prevalent in India – assisted living and palliative care. Assisted living is for those individuals who require physical or medical help. These are mostly run by non-profit organizations (NGOs). Palliative care is for those with debilitating illnesses.
However, most companies are focussing on a third type of retirement
It’s simplified...Beyond Market 08th Jul ’1328

other requirements. These units come with all the modern amenities and architectural specs such as grab-bars in bathrooms, anti-skid tiles, low-height shelves, bigger balconies for sunlight keeping in mind the age-group. Some bigger units also have nurse/servant rooms, primary healthcare facility on campus, etc.
Though the architectural layout of these units is different, the cost structure of developing a senior living project is similar to that of any standard residential project.
However, the cost of operating a senior living project is higher compared to building and selling residential apartments on the same plot as they include continuation of support facilities such as healthcare, mess, club, wellness and gymnasium by the developer.
Units in these housing projects come in all configurations and sizes - 1BHK, 2BHK and 3BHK as well as studio apartments and villas from 500 sq ft studio apartments to 2,500 sq ft 3 BHKs as well as villas. The price range for these units varies from `25 lakh to `1 crore.
The price is positioned in the affordable segment, as residents of these projects will be senior citizens with limited income resources, but that does not imply that the luxury segment is not available.
With more and more senior
citizens seeking solitariness
and independence, realty
companies are cashing in on
this opportunity by building
retirement homes to meet the
needs of this segment
living category called independent living where senior citizens are reasonably healthy and can manage on their own.
These homes are built for senior citizens keeping in mind their various needs regarding social security, healthcare, administrative, food and
It’s simplified...Beyond Market 08th Jul ’13 29

It’s simplified...Beyond Market 08th Jul ’1330
Many lifestyle-oriented senior citizens are opting for luxury units which can cost from `60 lakh to `1 crore. The price may not be a criteria but age is. A citizen should be minimum 55 years of age to be able to live in these projects.
According to a JLL India report, there are currently about 30 existing senior living projects in India and 32 more are in the pipeline.
Out of 30 existing projects, most of them are in south India, namely: 2 in Kochi, 3 in Chennai, 3 in Coimbatore, 7 in Bengaluru, 3 in Pune, 2 in Goa, 2 in Kolkata and 1 each in Hyderabad, Mumbai, Bhopal, Jaipur, Delhi, Nagpur and Punjab.
Realty experts are of the opinion that South India is a preferred location for senior citizens due to pleasant weather, lesser crime rate compared to North India, abundant greenery, open spaces and end-user driven realty market.
Also, maximum number of NRI population belongs to South India who are looking to settle in their own country after retirement.
A report published by Population Foundation of India suggests that the maximum percentage of 65+ population are from the southern states, that is Andhra Pradesh, Tamil Nadu, Karnataka and Kerala.
Experts believe that more projects will start mushrooming near metros like Delhi and Chennai. According to JLL India report, the demand for senior housing unit is approximately 3,00,000 homes.
Inspite of the fact that 32 more projects are in the pipeline, the available units fall short of demand. Currently, the number of senior citizens in India is 98 million, which
is expected to grow to 240 million in 2050, due to high life expectancies. The projection is lucrative for realty companies to cash in on.
For example, Max India, through group firm Antara Senior Living Pvt Ltd, has announced a senior living project with an investment of `240 crore. Tata Housing is not far behind. It has launched a project called Riva in Bengaluru which will consist of 187 apartments.
One of the pioneers in the retirement homes segment, Ashiana Housing, which has existing projects in Bhiwadi, Jaipur and Lavasa, is planning three more projects in Kolkata and south India.
Similarly, UCC Care Pvt Ltd, which has luxury residential units in Faridabad called the Golden Estate is further expanding the project to cities like Mohali, Bengaluru, Hyderabad and Gurgaon.
Buyers who wish to live in these housings have three models to choose from in terms of payment – outright buys, long lease and rentals.
According to industry experts, outright buys is the best option for a buyer as it gives maximum flexibility where the person can lease it out, live there for a lifetime or can give it to his/her heir.
The buyer also has the option to sell it if there is appreciation in unit price. However, few projects come under a condition where a buyer can not sell the house until the completion of certain years.
Many real estate developers offer long lease programmes to senior citizens wherein the person pays a one time deposit as well as a monthly fee. After paying the deposit, the person is entitled to live in that
particular dwelling for a lifetime, though only a part of the deposit amount is refundable. Mumbai-based Dignity Lifestyle offers long lease programmes. This type of model is suitable for those people who can’t afford to buy a house, but in comparison to outright buys, it is less flexible as the person cannot sell the property and also a part of his income is stuck in the property taken on lease.
Another catch is that sometimes a person cannot get immediate refund of the deposit he has paid after the handover of unit and can get the amount only after the unit has been registered by a new occupant.
For example, Dignity Lifestyle has a lock in period of 12 months after the handover of the cottage. The cheapest model is rental where a person does not have to pay any upfront deposit.
However, many experts believe this model defeats the purpose of retirement housing as it lacks the stability factor.
The typical time frame of rentals offered is a short period of 1-6 months. A person also has the option of renting a house purchased by another senior citizen.
Sometimes developers offer all three models in a project. For example, Melur Meadows offers retirement homes in a monthly rental range of `3,500 to `7,000, whereas for lease model a deposit of `8 lakh and monthly maintenance of around `1,000 is required. For outright purchase, these units range from `10 lakh to `35 lakh, with recurring costs being separate.
Now, let’s see how this trend in retirement homes sector pans out across India over a period of timE.

It’s simplified...Beyond Market 08th Jul ’13 31
he Nifty lost 5% in the June series on account of negative global cues. The equity markets world over
remained under pressure in June due to apprehension that the US Federal Reserve may scale back debt purchase by early next year.
Emerging markets are the worst affected due to the probable tapering of QE3. The Indian market is one of the most affected emerging markets (due to QE3 tapering) as the large current account deficit threatens to worsen the problem.
India’s current account deficit is financed by the continuous flow of FIIs, which was affected by the news of probable tapering of QE3.
This scenario also resulted in the Indian currency touching a lifetime low of 60.71 per dollar on 27th June. The rupee has lost more than 10% against the USD since the start of the month of May.
The wholesale price-based inflation decreased to 4.70% in the month of May. The street expected the May WPI to be 4.88%. The 4.70% increase in WPI was the lowest increase in more than three years.
The IIP for the month of April came in at 2% against expectations of 2.7%. But the Reserve Bank of India (RBI) kept the policy rate unchanged in June.
A weak rupee, uncertainty in the global economies and high food inflation were attributed to the RBI’s decision to keep key rates unchanged. The apex bank left the policy repo rate unchanged at 7.25% and the cash reserve ratio (CRR) steady at 4%.
TTECHNICAL OUTLOOK FOR THE FORTNIGHT
On the Derivatives front, Nifty rollovers stood way below its 3-month average of 58% at 47% at a cost of only 0.08%. On the Nifty Options front, for the July series’, highest OI build-up was witnessed near 5600PE and 6000CE, followed by 5500PE and 5900 CE. These levels will act as support and resistance for Nifty’s July expiry. India VIX, which measures the immediate 30-day volatility in the stock markets has been very choppy of late and is trading in a very broad range of 16-22 (currently at 19) (as on 3rd July)).
As predicted in our earlier editions, VIX achieved the target of 21 last month. Going forward, we expect VIX to consolidate within this new range of 18-21 and volatility traders can adopt a “sell on rise and buy on dips strategy” on it.
The Nifty index rallied from the June ’13 lows of 5,580 and advanced to test the level of 5,900. The Nifty has an immediate resistance area, which indicates that 5,850-5,900 is a crucial hurdle to be crossed immediately.
Recently a reversal pattern was formed on the daily charts as it coincided with the falling trend line drawn from the highs of January ’13.
The Nifty has been in a downtrend since the past few months and the index has closed below the crucial support of the 5,850 level, with a falling gap, which indicates a continuation in the downtrend.
The volumes and breath in the recent rise observed a few divergences, indicating some signs of exhaustion. One should maintain a sell-on-rise
approach and expect the markets to test the levels of 5,700 and 5,650 in the near term.
The Nifty mid-cap space is likely to face selling pressure as it continues to be in a bear structure.
Bank Nifty faces immediate resistance around the 11,600-11,700 levels on the upside as it coincides with the falling window pattern. The index has closed below the important support of 11,500 level and can decline to the 11,100 to 10,800 levels.
The overall parameter on the daily chart indicates that the decline is not yet done and one can expect a further descent in the near term. We maintain a negative bias in the PSU and banking space as most of the stocks are in a bear trend.
There is absence of any sort of divergence in momentum indicators, which indicates lower levels in the near future.
OPTIONS STRATEGY: SHORT STRANGLE ON NIFTY (JULY SERIES)
It can be initiated by ‘selling 5900CE and 5600PE of the July series’. The net combined premium inflow comes to around `100, which is also the maximum profit (that is if the Nifty February series expires between 5,600-5,900).
The break-even stands at 6,000-5,500. There is unlimited loss beyond the break-even range. Traders can square off their strategy when the combined rate of the Strangle comes below 50 and can keep a stop loss at the breakeven point, whichever of the two is earlieR.

Tactful acquisitions by KCIL
have led to a strong foothold
in focus verticals and is
helping the company to steer
ahead of competition
eadquartered in Pune, KPIT Cummins Infosystems (KCIL) was incorporated in 1990 as KPIT Infosystems. Later in 2002, it merged with Cummins Infotech and formed
KPIT Cummins Infosystems. Cummins is the company’s top client and contributes almost 17% to the topline.
KCIL is a leading product engineering and IT consulting company, which provides IT and consulting solutions to automotive and transportation, manufacturing and energy and utilities companies.
The company focuses on select strategic business units (SBUs) - integrated enterprise solutions, auto and engineering and SAP.
It is a technology partner to over 165 global corporations including Original Equipment Manufacturers (OEMs), semiconductor companies and automotive Tier I companies. As on 31st Mar ’13, KPIT Cummins Infosystems Ltd had 8,321 employees.
H
NURTURINGITS CORE
STRENGTH
KPIT Cummins Infosystems Ltd:
It’s simplified...Beyond Market 08th Jul ’1332

It’s simplified...Beyond Market 08th Jul ’13 33
Source: Company Data
Source: Company Data, Nirmal Bang Research
Source: Company Data
INVESTMENT RATIONALE
Tactful Acquisitions Have Led To A Strong Foothold In Focus Verticals
KCIL has been actively acquiring companies with strong domain expertise in areas of automotive engineering, electronics, SAP and Oracle, JD Edward Solutions, etc in the last 5 to 6 years.
It acquired CG Smith Software Pvt Ltd (2006), Sparta Consulting (2009), CPG Solutions (2010), In2Soft GmBH (2010) and Systime (2011). The acquisition of CG Smith helped the company to strengthen its automotive vertical.
While eSparta enhanced the company’s SAP consulting practices, CPG and SYSTIME acquisitions have helped the company to widen the Oracle services offerings and its geographic presence. During the same period (FY07-FY12), KCIL’s revenues and profits grew at a CAGR of 26.5% and 23.6%, respectively.
A major part of this growth of the company is attributed to
Automotive Vertical To Be A Major Revenue Growth Catalyst
USA has been facing a slowdown in its economy, which has badly hampered sectors like automotive engineering and manufacturing in the US.
More than 75% of KCIL’s revenues come from the US and continual client budget cuts and delayed decision making had affected the company’s automotive vertical.
However, the US economy is now on the road to recovery and the US automotive industry is bullish about the coming year and expects a fairly steady continuation of growth momentum in both the economy and in vehicle sales, going forward. This is a positive for KCIL as this segment contributes almost 39% to 40% to the topline.
Moreover, impelled by technological advancement and consumer demand, electronics constitutes the fastest growing segment in the global auto parts industry.
According to Scotiabank Global Auto Report, worldwide sales of automotive electronic technology is expected to ascend from $189 billion in 2012 to $274 billion by 2017. Being an automotive solutions software vendor, KCIL will benefit from this.
With a view to enter the market for fuel-efficient automobiles, KCIL has built an in-house fuel-efficient hybrid automotive solution (Revolo) in a 50:50 JV with Bharat Forge, which is in the trial phase for about more than 40 vehicles.
The results of these trials have been encouraging both on the fuel efficiency as well as emissions front and once this
75.92%
12.95%
11.13%
USAEuropeRoW
Geography-wise Revenue Split
39%
34%
14%
13%Automo ve &Transporta onManufacturingEnergy & U li esOthers
Vertical-wise Revenue Split
318.2 463.7 583.5793.15 731.6
987.0
1500.0
2238.6
0.0
500.0
1000.0
1500.0
2000.0
2500.0
FY06 FY07 FY08 FY09 FY10 FY11 FY12 FY13
Revenue Growth Trend (` Cr.)
these acquisitions. The company has a revenue target of USD 1 billion by FY17 with EBITDA margins of 18%.

It’s simplified...Beyond Market 08th Jul ’1334
solution commercializes, it would be a major catalyst to KCIL’s revenues.
Continual Growth In Client Addition Assures Good Growth Potential
In order to reduce the dependence on its top client Cummins, which has not been doing too well since the past few quarters and to reduce the risk of client concentration, KCIL has been focusing on acquiring new clients and mining the existing ones. Its active customers have grown from 152 in Q3FY11 to 183 in Q4FY13.
On the other hand, revenue contribution from its top client has come down from 24.8% in Q3FY11 to 16.6% in Q4FY13, while contribution from its non-Cummins accounts have been increasing during the same period.
Moreover, customers with a revenue run rate of more than 1 million have also increased from 40 to 78 in the same period. KCIL is a gold partner to SAP and platinum partner to Oracle. Its strong relationship with such global partners and improving client metrics across all verticals showcases the company’s ability to acquire new clients and provides good revenue visibility.
Source: Company Data
Source: Company Data
SAP SBU On A Road To Recovery
KCIL’s SAP SBU caters to all the three verticals - automotive and transportation, manufacturing and energy and utilities. Within this, SBU, North America has been witnessing good traction in the utilities segment, while APAC has a pipeline building up in the manufacturing and automotive segment.
Over the last few years, KCIL has been investing in creation of industry-specific solutions and currently has SAP-certified solutions for automotive, energy and utilities, industrial manufacturing, Hi-Tech, wholesale distribution and CPG verticals. However, since the last three quarters, it has been facing some slowdown in the SAP business because of which the revenue contribution to topline had come down from 32% in Q1FY13 to 26% in Q4FY13. This was due to the technology reset that took place within SAP ecosystem as SAP HCM was being replaced by SAP SuccessFactors.
The company has now resolved this concern by developing expertise and capabilities in these new technologies by adding 25 Successfactors-certified consultants under a business transfer agreement with US-based SuccessFactors specialist company named Learn 2 Perform (L2P). The management is confident of strong growth in this SBU, going forward and has already had a few wins in Q4FY13. We believe that the association with L2P will help KCIL to capture the growth potential in this business segment.
RISKS AND CONCERNS
Currency Volatility
A major part of KCIL’s revenues are exposed to USD/INR movement. Any significant appreciation in rupee will hamper the company’s financials.
Geographic Concentration
More than 85% of the company’s revenues are derived from the US and Europe where the economies of these countries are facing fiscal problems and prolonged slowdown, respectively.
Decline In Cummins Contribution
Revenues from the company’s top client Cummins has always been a safety cushion for the company and this has been declining since the past few quarters, which can be
144 147152 155 159 163 165 169 172 176 178 183
3 3
5
3
4 4
2
4
3
4
2
5
0
1
2
3
4
5
6
020406080
100120140160180200
Q1F
Y11
Q2F
Y11
Q3F
Y11
Q4F
Y11
Q1F
Y12
Q2F
Y12
Q3F
Y12
Q4F
Y12
Q1F
Y13
Q2F
Y13
Q3F
Y13
Q4F
Y13
No. Of Ac ve Customers No. Of Customers Added
Active Clients Growth Chart
20.65%
24.02% 24.76%
21.00% 20.65%
22.58% 23.92%
19.5%
20.6% 19.7% 19.1%
16.6%
0.00%
5.00%
10.00%
15.00%
20.00%
25.00%
30.00%
Q1F
Y11
Q2F
Y11
Q3F
Y11
Q4F
Y11
Q1F
Y12
Q2F
Y12
Q3F
Y12
Q4F
Y12
Q1F
Y13
Q2F
Y13
Q3F
Y13
Q4F
Y13
Decreasing Contribution From Top Clients(Cummins) To The Top Line

It’s simplified...Beyond Market 08th Jul ’13 35
Source: Company Data, Nirmal Bang Research
987
34.90%
148.4
-8.10%
41.1
107.3
3.8
6.74
0
110.3
15.5
-0.2
0
94.6
5.3
17.8
22.6
3.5
33.9
0.7
FY11Particulars (` in cr)
1500
52.00%
216.6
45.90%
44.5
172.1
7.3
13.8
10
188.6
43.7
-3.1
3.5
145.4
8.2
17.8
14.7
2.9
40
0.7
FY12
2238.6
49.20%
364.1
68.10%
47.2
317
14
-17
-1.3
284.7
76.6
-8.6
-0.5
199
10.9
17.8
11.1
2
58.2
0.8
FY13
Revenues
% Change
Ebitda
% Change In EBIDTA
Depreciation & Amortization
Operating Income
Interest
Other Income
Exceptional Item
PBT
Tax
Minority Interest
Share Of Profit From Associates
Rep PAT
Rep EPS
No Of Shares (Crs)
Price Earnings (x)
Price / Book Value (x)
BV Per Share
Dividend Per Share
Financials
Source: Company Data, Nirmal Bang Research
17.6
585.4
1.1
11.5
5.7
10.7
5.1
81.6
94.2
75.9
20
908.7
89.1
37.3
28.1
3.6
130
0
0.2
75.5
2.7
47.7
228.8
208
33
24.9
908.7
FY11Financial Health (` In Cr)
35.6
676.8
32.7
66.9
0.8
26.4
10.3
147
175.7
99.9
56
1328.1
133.9
32.9
9.2
9.3
362.3
21.7
3.5
70.4
3.4
36.5
423.3
147.3
58.1
16.4
1328.1
FY12
38.6
997.5
27.2
145.9
0
0.1
14.2
175.3
190.4
126
69.6
1784.8
138.5
37.7
5.9
18.4
442.3
11.8
6.9
115.5
3.2
203.6
467.3
192.1
59.3
82.3
1784.8
EQUITY AND LIABILITIES
Share Capital
Reserves & Surplus
Share Appl & MI
Non-Current Liabilities
Long-term Borrowings
Deferred Tax Liabilities
Other Long-term Liabilities
Long-term Provisions
Current Liabilities
Short-term Borrowings
Trade Payables
Other Current Liabilities
Short-term Provisions
TOTAL
ASSETS
Non-Current Assets
Tangible Assets
Intangible Assets
Capital Work-in-progress
Intangible Assets Under Devp
Goodwill
Non-current Investments
Deferred Tax Assets
Long-term Loans And Advances
Other Non-current Assets
Current Assets
Current Investments
Trade Receivables
Cash And Cash Equivalents
Short-term Loans And Advances
Other Current Assets
TOTAL
Financialsdetrimental to the company’s revenues. However, KCIL is successfully mining it’s non- Cummins customers.
IN A NUTSHELL
Concerns regarding the weakness in Cummins account has been taken care of by increasing the share of non-Cummins account. Moreover, SAP business is back on track and with recovery seen in the key market – USA, the management is confident of good traction in the automotive business, as well. Thus, the resolution of ongoing concerns, coupled with improvement in discretionary spend and a strong deal pipeline has resulted in the management guiding for 14% to 16% dollar revenue growth in FY14. The stock is currently trading at a trailing P/E of 11.1x on FY13 EPS and looks attractivE.
FY13
Samurai MarketIt is a slang term for the stock market in Japan. Samurai market is usually used by non-residents of Japan, with reference to the Japanese warrior - the samurai. The term Samurai market was used in business slang but has become widely accepted, much like the ‘Yankee market’ referred to the US markets and the ‘bulldog market’ referred to the UK market.


It’s simplified...Beyond Market 08th Jul ’13 37
supplement your overall portfolio?
The answer is very straightforward. As mentioned earlier, the US equity markets are showing signs of recovery and the major point to invest in US funds is that through investment in US funds, one can invest in global companies like Apple, Berkshire Hathway, General Electric and Microsoft, which will in the real sense diversify the portfolio of investors.
The Dow Jones index is at an all-time high. Broader indices like the S&P 500 and the NASDAQ 100 are also near their all-time highs.
Here is a list of three funds available for Indian investors that invest predominantly in the US equity markets. Select your fund and be a part of the world’s largest economy.
Motilal Oswal MOst Shares Nasdaq-100 ETF
Investment Style
It is one of the first fund houses to realize the potential of the US markets when it was coming out of recession and the scheme was launched way back in March ’11. Since then the fund has given a superior one-year return of over 25% and 17%, respectively.
The strategy of the fund is very simple. It invests in securities which are constituents of the NASDAQ-100 Index in the same proportion as the Index. The NASDAQ-100 Index consists of the 100-largest US and global non-financial companies that are listed on the NASDAQ Stock Exchange Market.
The Index reflects companies across major industry groups including computer hardware and software, telecommunications, retail/wholesale
trade and biotechnology. It however does not contain securities of financial companies including the investment companies.
FT India Feeder-Franklin US Opportunities Fund
Investment Style
It is the second fund to come out with an US-dedicated fund and was launched in January ’12. With a corpus of over `190 crore it has managed to give returns of over 23% in the last one year.
As the name suggests, it is a feeder fund which invests in units of Franklin US Opportunities Fund and in equity securities of US companies believed to possess sustainable growth characteristics and which meet growth, quality as well as valuation criteria.
These include small, medium and large capitalization companies with strong growth potential across a wide range of sectors that have exceptional growth potential and are fast growing and innovative companies.
This mutual fund also invests in sectors showing an above average growth or growth potential as compared with the overall economy. And fund managers at Franklin plan to hold their investment from medium to long term.
Through its underlying fund, this feeder fund concentrates on quality stocks in high growth sectors such as information technology (IT), healthcare, consumer discretionary as well as industrials.
ICICI Prudential Bluechip EquityInvestment Style
Unlike FT India Feeder Fund, this fund invests directly into the
fter lying low for almost three years, the world’s largest equity markets - the United States - made
a strong bounce back recently. Positive corporate earnings, coupled with strong jobs reports and improvement in the housing market has boosted the prospects of the US markets in the past few weeks.
Though recently the Federal Reserve Chairman Ben Bernanke indicated plans to withdraw quantitative easing (QE), which led to a crash in most global markets. But experts argue that extraction of stimulus is a fundamental sign of optimism in the US recovery, which is all set to look reasonable in the distant future.
With the US equity markets on the path to recovery, Indian investors have a greater chance to be part of the US markets and invest through US equity funds.
Currently, there are three funds from Franklin Templeton, DSP BlackRock and ICICI Prudential Equity. Other fund houses such as Reliance MF, PineBridge India MF and JP Morgan MF have filed offer documents with market regulator, Securities and Exchange Board of India (SEBI) to launch US-dedicated funds.
But you must be thinking why to invest in the US or whether it makes any sense to diversify your portfolio in such a manner. Can US equity funds be a good investment option to
A
Investors can look at invest-
ing in the world’s largest
equity markets through US
equity funds due to a revival
in the markets
’

Now, Commodity Trading Is No More A Puzzle.Commodity trading can be confusing especially if one
is inexperienced and lacks the necessary skills to trade
successfully. At Nirmal Bang, our team of seasoned
analysts with years of experience and in-depth
knowledge can help you spot the underlying clues and
create the investment strategies that best suit your
commodity trading requirements.
EQUITIES* | DERIVATIVES* | COMMODITIES | CURRENCY* | MUTUAL FUNDS^ | IPOs^ | INSURANCE^ | DP* www.nirmalbang.com
REGD. OFFICE: Sonawala Building, 25 Bank Street, Fort, Mumbai - 400 001. Tel: 022 - 39267500 / 7501; Fax: 022 - 39267510 CORPORATE OFFICE: B-2, 301/302, Marathon Innova, O� Ganpatrao Kadam Marg, Lower Parel (W), Mumbai - 400 013. Tel: 022 - 39268000 / 8001; Fax: 022 - 39268010BSE SEBI REGN No. INB011072759, INF011072759 & INE011072759, NSE SEBI REGN No. INB230939139, INF230939139 & INE230939139 DP SEBI REGN. No NSDL: IN-DP-NSDL-136-2000, CDS(I)l: IN-DP-CDSL-37-99, AMFI REGN. No. arn-49454 NCDEX REGN. NO. 00362, FMC Code-0075, MCX REGN. No. 16590, FMC Code-MCX/TCM/CORP/0490, MCX SX-INE260939139, PMS-INP000002981
Disclaimer: Insurance is a subject matter of solicitation. Mutual Fund investments are subject to market risk. Please read the scheme related document carefully before investing. Please read the Do’s and Don’ts prescribed by Commodity Exchange before trading. The PMS Service is not o�ering for commodity segment. *Through Nirmal Bang Securities Pvt. Ltd. ^Distributors #Prepared by Research Analyst of Nirmal Bang Commodities Pvt. Ltd.
It’s simplified...Beyond Market 08th Jul ’1338
securities of the US markets and is positioned as an US-centric fund investing in bluechip stocks listed on the New York Stock Exchange or Nasdaq. This bluechip fund by ICICi will follow a combination of both - top down as well as bottom approach of investing.
Moreover, the portfolio of the fund will be tilted towards large-cap companies selected from within the constituents of its benchmark - S&P 500 index.
For researching equities, the fund will depend on Morningstar Equity Research Services and intends to benefit from its expertise, efficiency, quality and consistent and disciplined research approach for building its equity portfolio.
It is unlikely to face any fund-specific risk apart from the general market risk of the US stock markets. In the current calendar year, the fund has managed to give 20% returns and was launched in July ’12.
DSP BlackRock US Flexible Equity
Investment Style
This fund is similar to FT Feeder India Fund - Franklin US Opportunities as it invests in units of US Flexible Equity Fund.
The fund has a flexible investment approach as its underlying fund signifies that it will have the flexibility to either invest in growth or value investment characteristic securities, depending upon what the market outlook is like.
The fund will construct its portfolio on the basis of BlackRock’s quantitative and fundamental investing. The underlying fund will invest at least 70% of its total assets in equity securities of companies domiciled in, or exercising the predominant part of their economic activity, in the US.
As the name suggests, ‘flexible’ refers to the fact that the mutual fund can
invest in either value or growth stocks. The fund is likely to closely replicate the broad route and scale of the broad US markets.
IN A NUTSHELL
Before getting into investing in any international funds the factor of currency risks cannot be ignored. Unlike the domestic equity funds in India, long-term capital gains from international funds are not tax-free. Therefore, before redeeming the funds, one has to look at the tax angle.
The taxation is similar to non-equity Indian funds. However, high markets and taxation should not discourage you from starting to invest in such international funds.
Investors should not invest a lump sum amount. Instead, they should go through systematic investment plans (SIPs) for such funds. Thematic funds should never be the top priority for investors but it should supplement your portfolio on the whole.


pen any technical charting software and you are sure to be bombarded with a
plethora of indicators, oscillators as well as techniques.
Most common of these are candlestick patterns, Elliot waves, gaps, breakout patterns, relative strength index and on-balance volume, among others.
However, there is another widely followed and quite effective momentum oscillator known as Stochastics, which is used by a huge contingent of chartists.
While we do not really need to plot this on the chart manually (it is all done by the software on the computer), we have to understand the rationale behind it and learn how to interpret it.
An oscillator developed by George Lane as early as the 1950s, Stochastic is basically an indicator for taking short-term positions in the markets.
Stochastic mainly tells whether a security is oversold or overbought. It also gives buy and sell signals. It is an
O This form of calculation is known as fast stochastics.
But many analysts found this type of calculation to be too sensitive to price change and many a times it gave false buy or sell signals and was found to be of not much use from a day-trading point of view.
So, a version of Fast stochastics, known simply as Slow Stochastics was invented.
Here the %D line of fast stochastics is taken as the %K line (of this slow stochastics). And the 3-day simple moving average of this new %K line forms the %D line.
Just think of it as a slow train and a fast train. While a fast train is quick, it misses quite a few stations on its way to the destination, a slow train on the other hand, albeit sluggish, touches all its stations on the route and also reaches its destination.
All these calculations look confusing, don’t they? Believe us, they are.
But don’t rack you brains over it. It is just for your knowledge; it is all automated and in the software.
indicator which shows momentum and the relationship between the closing price of a security and the price range of the security over a predetermined time period.
STOCHASTICS EXPLAINED
Stochastics consists of two lines - %K (fast line) and %D (slow line). These lines are plotted or oscillate within the range of 0 to 100 on the chart.
Calculations
Generally a 14-period is used for calculation of Stochastics. It can be anything from 14 days, 14 weeks or 14 months according to the need and trading system of the trader.
%K Line = 100 x (C –L14)/ (H14-L14)
Where, C = most recent closing priceL14 = lowest price of the stock in the past 14 trading sessions.H14 = highest price of the stock in the past 14 trading sessions.
While,%D Line = 3-period moving average of %K
Fantastic StochasticApart from giving buy and sell signals, Stochastic is a great tool
to ascertain if a stock is in an oversold or overbought position
It’s simplified...Beyond Market 08th Jul ’1340

INTERPRETATION
a. Overbought/OversoldWhen either the %K or the %D line goes above 80, it is considered to be in the overbought zone and a sell position can be initiated. When the lines are below 20, they are considered to be in the oversold zone, and a buy position can be initiated.
This is just the first indicator and an individual should wait for other indicators listed below before initiating a buy or a sell position.
b. IntersectionIf in the overbought zone (above 80), the %K line moves/crosses below the %D line, it is a sign of weakness and the stock may be going down. Alternatively, if in the oversold zone (below 20), the %K line moves/ crosses above the %D line, then it is a sign of strength and the stock may be going up.
c. Divergence To study divergence, the %D line is
important. If the stock is moving in the upward direction but the %D line is moving in the downward direction, then it is a bearish sign. Similarly, if the stock is moving in the downward direction, but the %D line is moving in the upward direction, it then is a bullish sign.
d. ShapeIf the stochastic forms a narrow top or a narrow bottom, it signals weakness of the bull or bears and a trend reversal. If the stochastic forms a broad top or a broad bottom, then it signals strength and continuation of the trend.
e. ConjunctionRemember, stochastic works best when used in conjunction with other analytic techniques. And if there is any contradiction between the underlying trend and the signals generated by stochastic, one should refrain from taking any position and wait until the stochastic and the underlying trend are in agreement to initiate a tradE.
RATIONALE
The main assumptions when using stochastic is that a stock will trade near the top of the trading range in an uptrend or near the low of the predetermined trading range during a downtrend in the market.
On the chart, the stochastic oscillator turns down if the stock has made an intraday high but fails to close near the top. It signifies weakness and signals a ‘sell’.
Conversely, the oscillator turns up, if the stock has made an intraday low but fails to close near the bottom. It signifies strength and signals a ‘buy’.
Stochastic oscillator is plotted as two lines, the %K line (fast line) and %D line (slow line).
Usually the %K line is Blue in colour and the %D line is Red in most charting softwares. But, in some softwares, the %K line is a solid line and the %D line a dotted line.
Overbought 80%
Oversold 20%
BUY
When %K line moves above the %Dline in the oversold zone, it is a buysignal
%K line (Blue)
%D line (Red)
When the %K line moves belowthe %D line in the overbrought zoneit is a sell signal
SELL
It’s simplified...Beyond Market 08th Jul ’13 41

sk any expert or stalwart of cricket what does he prefer Test cricket or 20-20, the answer would
be unanimously in favour of the former, considered to be the real gentleman’s game. While others may scoff at 20-20, there is no denying the popularity of this form of cricket, the recent controversy notwithstanding.
On the same lines, every stock market expert is of a strong opinion that stock market investments should be from a long-term perspective of 3 to 5 years and that the faster version of day trading is not the right way to play this market.
A But we all know that the edge- of-the-seat excitement, triumphs and tragedies as well as the sheer adrenaline rush of day trading cannot be diminished.
Just as the 20-20 format is essential to bring in fans, advertisement revenues and add glamour quotient to the game, day trading too is essential to help generate volumes as well as liquidity in the stocks and attract newer market players.
Just as the rules and strategies of Test cricket are different from 20-20, so is the research and analysis that is used for long- and medium-term investing,
QuickThrillsMuch like 20-20 in
cricket, day trading too
involves some 20
frequently occurring
terms, which when used
appropriately can
benefit traders to a
large extent
It’s simplified...Beyond Market 08th Jul ’1342

It’s simplified...Beyond Market 08th Jul ’13 43
down the most on the trading day). Although it may not remain the same the next day, it indicates which stocks have maximum buying or selling interest and can then be analysed on other parameters.
4. Upper/Lower Circuit
Upper circuit means that there are no sellers in the stock, only buyers. Lower circuit means that there are no buyers in the stock, only sellers.
Usually such stocks are expected to continue the same trend and hit upper or lower circuit the next day as well. One should wait for buyers/sellers to return to such stocks before entering or exiting them. 5. Stocks Closing At/Near The Day’s High/Low
A stock closing at its highest point or lowest point of the day usually means the bulls or the bears were strong enough to take the stock to the high/low point and keep it there till the end of the day.
It signals strength of the bulls or bears and these stocks can be expected to open in the same direction the following day as well.
6. Most Active Stocks
This shows the stocks that have made significant moves both in terms of value as well as volume. Any move of the stock either upwards or downwards with high volumes usually implies that there is greater interest of market participants and the move of the stock and the trend is expected to continue in the direction of the move for the next session.
7. 52-week High/Low
This shows the stocks that are trading at the highest or the lowest point of
the year.
While on one hand it signifies that the stock has broken out of the range and is ready for a new move in the direction of the breakout, on the other hand it can also be interpreted that the stock is now in an overbought/oversold zone and there is a high chance of reversal.
It would be prudent to wait before taking any position until a definite pattern emerges.
8. Bulk And Block Deals
Such deals are usually undertaken by large hands such as institutions, insurance companies, mutual funds, high net worth investors, etc, and, hence, from that point of view helps one understand where institutional interest lies.
9. Sector Buzz
This gives an idea of the sectors which are leading the market up and which are dragging them down.
If pharma and FMCG stocks are taking the market up and banking and auto stocks are dragging it down, it can be assumed that investors are being cautious and investing in safer haven and taking out money from high-beta and rate-sensitive sectors.
10. FII And DII figures
These are the most important numbers in the market since these are institutions which decide the direction of the market. These figures show whether FIIs or DIIs have been net buyers or net sellers in the market.
11. Open Interest (OI)
Open interest simply means the number of future or options positions that are not closed or remain unsettled
which cannot be applied to day trading strategy.
Day trading analysis relies mainly on the data of the previous day’s trading summary. The previous day’s market movements both in the cash as well as the derivatives market serve as an indicator of how the markets are likely to open on the following day.
TRADING DATA
Most of this data is easily available on various financial/stock market- related websites under the heading daily statistics, end-of-day statistics or analytical tools.
1. Advance/Decline Ratio
This number helps one understand the ratio of the number of stocks moving up to the number of stocks going down in the entire market.
It helps to understand the overall breadth of the markets, that is, if the number of advancing stocks far outweigh the number of declining stocks, then the underlying trend is bullish and vice versa.
2. Turnover
This shows the total volume on important exchanges in all segments, that is, cash and derivatives. Turnover is very important because it tells you whether the markets are falling or rising on high or low volume.
Also, it tells you how much percentage of the day’s trade is cash (delivery) and how much is the derivatives segment.
3. Top Gainer/Top Losers
The first and foremost thing to check out is the list of top gainers (stocks that have gone up the most) and the top losers (stocks that have gone
It’s simplified...Beyond Market 08th Jul ’1344
at the end of the day. If the OI is up and stock price is also up, then it is a bullish sign. If OI is down and stock price is up, it is a bearish view.
If OI is up but stock price is down, then too it is a bearish view. And finally if OI is down, and the stock price is down, then it is a bullish sign.
12. Put-Call Ratio
It is the ratio obtained by dividing the total number of put options traded by the total number of call options traded. If the ratio is increasing, it means that investors are buying more puts than calls and, hence, the outlook is bearish or they are not sure about the markets and are buying put options as a hedging tool in case of a sell off.
13. Moving Averages
Stocks that have moved above their 30-day, 50-day, 200-day moving averages mean that they have managed to trade and close above these historic levels and are expected to move upwards and vice versa.
14. Volume
Volume is the most important entity to consider while entering or exiting any stock. A stock that is going up with huge volumes can be expected to continue in that direction. Whereas a stock that is going up on thin volumes, does not show strength and the move is not expected to last and it
can be a reversal.
15. Positive/Negative Breakout
When stocks move out of a confirmed resistance or support level, it is known as a breakout.
If the breakout is on the upside (above the resistance), it is known as a positive breakout and the stock can be expected to go up. If the breakout is on the downside (below the support), it is known as a negative breakout and the stock can be expected to go down.
16. Higher Tops-Higher Bottoms/ Lower Tops And Lower Bottoms
When the chart pattern shows the formation of higher tops and higher bottoms, it means that the stock opened higher than the previous day’s high and closed higher than the previous day’s low, and thus it signifies an uptrend.
Similarly, if it shows lower tops and lower bottoms, then it means that the stock is in a downtrend.
Some other bullish patterns are inverted head and shoulder, double and triple bottom patterns, ascending triangles, etc. Some of the bearish patterns are head and shoulder pattern, double and triple top patterns and descending triangle.
17. Corporate Action
Company-specific actions such as
bonus, splits, rights issues, dividends, quarterly results, etc all have an impact on the stock price. Keep tab of important dates such as record dates, result dates, ex-dates, AGMs, etc, so as not to get caught on the wrong foot.
18. Exchange & Regulator Actions
Actions taken by exchanges and regulators can impact stock prices greatly. Stocks taken in and out of key indices, stocks put in F&O ban, stocks shifted to T-to-T segment, penal actions, fines, etc.
19. Global Markets
Whatever anybody says, the decoupling theory just does not pan out. In this world of globalization, happenings from around the world affect our markets to some extent.
Have a look at how the different world markets have done since the close of our markets to the next opening of our markets. These include the European markets (afternoon and evening), the US markets (night), the Asian markets (next morning).
20. News
Finally news, whether it is good or bad, is the most powerful force and has the power to change a trend overnight. Especially those announced after the present day’s market hours! Therefore, always keep your eyes and ears opeN.
Lipstick Effect
A theory that states that during periods of recession or economic downturn, consumers will avoid purchases of expensive items and seek material solace in smaller indulgences, such as premium lipstick. It is also known as the ‘leading lipstick indicator’. The lipstick effect is one of the reasons that the restaurant and entertainment industries typically do well amid recessions. Cash-strapped consumers want to treat themselves to something that will allow them to forget their financial problems. Therefore, they often settle for dining out and going to a movie.

FITCH’S UPWARD REVISION ON INDIA’S CREDIT OUTLOOK
Ratings agency, Fitch on 12th June revised India’s sovereign rating outlook from ‘negative’ to ‘stable,’ while affirming its BBB- rating. This came as a pleasant surprise to many. Both, bond and foreign exchange markets reacted positively to the announcement.
The announcement was a sentiment booster for the equity markets. To recall, ever since last June when ratings agencies lowered their outlook on India, the government has been pitching for an upgrade with the ratings agencies. Let us see what prompted Fitch to revise the outlook and what other agencies are up to.
What Are Ratings Agencies?
Ratings agencies tell you the credit worthiness of a debt issuer. These agencies tell you the likelihood of default of large-scale borrowers like company, financial institutions or a sovereign nation. Apart from quantitative and qualitative parameters, even judgement of the analyst plays an important role in assigning a score by the ratings agency to the borrower.
The score ranges from excellent to poor. Excellent would mean strong capacity of the issuer to meet financial obligations, while poor means high chances of payment default. India is one notch above the poor rating or ‘junk status.’ as it is widely called.
Further, the agencies also tell you the outlook, signalling the potential direction of the overall ratings. Lowering an outlook is generally considered to be the first step towards a downgrade and upward revision would mean chances of upgrade in the future. The outlook varies from positive to stable to negative depending on the agency.
IMPORTANT JARGONFOR THE FORTNIGHT
What Is The Impact Of Lower Rating?
Lower credit ratings result in higher borrowing costs as the borrower is deemed to carry a higher risk of default. A low credit score of a nation would mean companies and financial institutions of that nation will also have to bear higher debt costs due to high country risk. Usually ratings of different agencies move in tandem. Big investors like pension funds and endowment funds are risk averse to countries with lower ratings.
What Prompted Fitch To Revise Outlook?
Fitch cited governments’ efforts towards fiscal consolidation as one of the most important reasons for this upward revision in the outlook. To recall, FY13 fiscal deficit was contained at 4.9%, much below expectations, while FY14 print is expected to be 4.8%. The finance ministry has been working overtime to achieve this target through fuel price reforms and other measures. Fear of fiscal slippages has also reduced.
Efforts towards addressing “structural impediments” to investment and economic growth, pronounced signs of easing inflationary pressures and relative strength in India’s external situation despite current account deterioration were cited as important factors driving Fitch’s decision. Contained fiscal deficit and slowdown in inflation also helped, cited the ratings agency.
What Are Other Agencies Up To?
After Fitch’s outlook upgrade, two out of three agencies have a stable outlook on India, barring S&P which still has a negative outlook. It usually takes six months to two years for an agency to upgrade or downgrade the rating post revision on the outlook.
S&P’s: On 17th May this year, S&P reiterated its negative outlook on India. The agency said that there is a one-third
It’s simplified...Beyond Market 08th Jul ’13 45

chance of a ratings downgrade. The agency listed high fiscal deficit and heavy government borrowing as the main drag on India’s rating, but said India’s position has improved over the past year. S&P in March said that the Union Budget was a non event and there was potential for the government to exceed its budgeted spending.
Moody’s: On 18th March this year, Moody’s said that high food inflation is a negative for India’s sovereign ratings. Post-budget Moody’s said that the budget offered a ‘realistic’ plan to meet the country’s fiscal deficit target and should be credit positive for its sovereign ratings.
Concerns Of These Rating Agencies?
As 2014 is an election year, the agencies do not expect the momentum on reform measures to continue. Remember, since last August after P Chidambaram took over as finance minister numerous reforms were announced. Further, they are also worried about slowdown in investment cycle, which could impact growth in the future.
What Are The Controversial Provisions And Their Impact On The IT Sector?
The bill in its current form is severely damaging to the Indian IT sector. Following are a few of the provisions.
Local Hiring: If 15% of workforce of a company is on Visa, then the bill requires the company to locally hire 25%, 35% and 50% of the total workforce in FY14, FY15 and FY16, respectively.Impact: This would result in increase in onsite wage as local talent would be scarce. Further, utilization of workforce will reduce as currently employees are redeployed to a new location after the project is completed. Re-deployment would not be possible with local hires.
Doubling Of Visa Fees: According to the Senate Bill, if an employer has more than 50% of its employees on H-1B or L-1 visas, they would be required to pay $10,000 fee per additional worker from the existing $5,000.Impact: This will impact margins of IT companies. However, since local hires will go up, it will be partly compensated by lower number of visas required, going forward. It will affect most of the large Indian IT services companies including TCS, Infosys and Wipro.
Outplacement Clause: The outplacement clause is perhaps the most damaging provision for Indian IT players as it stipulates that firms with over 15% of their employees on H-1B visas cannot deploy their human resource in client companies. It is widely believed in the industry that this clause will be diluted. Impact: Indian IT companies generally place Indian low cost tech professionals on H-1B visas at client locations. Now, with this provision, it hits at the core of the Indian outsourcing business model.
Other Provisions: Indian firms also need to give a list to the US Department of Labour on how many H-1B permits they have got and how they are being deployed. Impact: This will increase the IT company’s administrative workload and will involve numerous procedural issues.
IN A NUTSHELL
Big Indian IT companies get a major chunk of their revenue from the US. While the bill in the current form impacts their margins and executive strategies, experts in the field believe that few provisions will get diluted in the reconciled version. Industry body, Nasscom is also stepping up its lobbying efforts in the US for a watered down version of the existing Senate versioN.
Stocks of IT sector have not gained much even as recent rupee depreciation is considered good for the sector. This is because of the policy overhang of the United States immigration bill. On 27th June, the US Senate approved a comprehensive series of immigration reform. The bill in the present form is negative for the IT sector because of few killer provisions.
What Is The Timeline?
There are two versions of the bill: one prepared by the Senate and the other prepared by the House of Representatives. Both the Senate and the House form the US Congress.
For a bill to become a law, both the versions will have to be reconciled. The reconciled version is sent back to the Senate and the House for final voting before it goes for the President’s nod and becomes a law.
The Senate version, which has many controversial clauses as compared to the House’s version, got approved on 27th June. The Houses’ version will be discussed and voted by late July. Software companies are hoping that the final version will not be too harsh for them. Analysts are of the view that the implementation of the US Immigration Bill is still 6‐9 months away.
THE US IMMIGRATION BILL AND IT SECTOR
It’s simplified...Beyond Market 08th Jul ’1346

Date:22nd June ’13.Venue: Hotel Holiday Inn,
Mumbai.
LEARN THE ART OFCOMMODITY INVESTING
LEARN THE ART OFCOMMODITY INVESTING
Exchange Partner
BeyondPresent
&
It’s simplified...Beyond Market 08th Jul ’13 47

It’s simplified...Beyond Market 08th Jul ’1348
BEYOND MANDIVISITS MUMBAI
Experts urge investors to prepare themselves for tough times in the commodity markets
As part of its investor education drive, Nirmal Bang Commodities Pvt Ltd, in association with ZEE Business, had organized Beyond Mandi, the one-of-its-kind investor education camp at Hotel Holiday Inn in Mumbai on the 22nd of June.
The camp was held with the aim to educate traders and investors in the art of investing in commodities by bringing market participants and industry experts on a common platform and thus helping the former to take right decisions through sharp acumen and guidance.
The panel of experts embodied Mr Ramesh Abhishek, Chairman of Forward Markets Commis-sion (FMC); Mr Kishore Bang, Vice Chairman and Managing Director, Nirmal Bang Group; Mr Anjani Sinha, MD and CEO of the National Spot Exchange Ltd (NSEL), Mr Kunal Shah, Head, Commodity Research, Nirmal Bang Commodities Pvt Ltd and Mr Samir Ahluwalia, Editor, Zee Business.
Mr Amish Devgan, the anchor commenced the event by introducing the panelists and explaining the objective behind the camp.
Mr Ramesh Abhishek kick started the event as the first speaker. He began by explaining that the commodity futures market has evolved with time and there is a lot of scope for it in the future as well. He told the audience that any investor who deals in the commodity market will have two considerations, one is safe and sound invest-ment and the other is good returns. For this reason the commodity market should be fully regulated with minimum risk and the investor in turn should take informed decisions so as to earn good profits.
He then informed the audience about the initiatives taken by future exchanges so as to make the commodity market smooth as well as safe. “KYC requirements have been more streamlined; SMS and email alerts are sent to customers after all trades and quarterly settlements and robust margining risk management system is made available to them. Moreover, various steps have been taken to improve dealing in agricultural commodities,” he said.
Mr Ramesh Abhishek,Chairman, Forward Markets Commission (FMC)
Mr Amish Devgan, Commodity Editor andAnchor, Zee Business

It’s simplified...Beyond Market 08th Jul ’13 49
Mr Kishore Bang,Vice Chairman and Managing Director,Nirmal Bang Group
This was followed by a panel discussion between Mr Ramesh Abhishek, Mr Kishore Bang, Mr Anjani Sinha and Mr Samir Ahluwalia. All of them acknowledged the growing importance of commodities as a new asset class among retail investors. During the panel discussion when asked to elaborate on the impact of the Commodity Transaction Tax (CTT) on commodities trading, Mr Kishore Bang said, “Commodity market is at a very nascent stage and there is less awareness about the same. Also, the commodities market is a traders market, where arbitrageurs and jobbers work on a thin margin. CTT will decrease their volumes as well as liquidity, which will ultimately impact the commodities market. Therefore, CTT will have a major impact on the commodities market.”
While agreeing to the fact that stock broking houses prefer equity markets to commodi-ties, he elucidated by reiterating that the commodities market is a traders market and is at a very nascent stage. “The commodities market in India still doesn’t have options such as Index trading, Options and Portfolio Management Services, which can allow brokers to design products for their clients. But for the time being we just have futures trading and delivery-based trading has just started in commodities. Whereas, equity markets have a lot of products available and there is high investment and extensive research. Therefore, brokers have much more penetration in the equity markets than the commodities markets,” explained Mr Bang.
Mr Anjani Sinha highlighted the fact that commodities market is a combination of various types of market participants like jobbers, hedgers, speculators amongst others. “CTT will have a major impact on jobbers because the percentage of jobbers is very high in the futures market,” said Mr Sinha.
According to Mr Sinha the future of commodities market is bright as this market will always have relevance in the society. But, some new things must be done so as to improve it and make it better. He further said that the introduction of the Forward Contract Regula-tion Amendment (FCRA) Bill will help in the introduction of index trading and option trading. “At a lot of place, there is a need to develop aggregators model,” elaborated Mr Anjani Sinha.

It’s simplified...Beyond Market 08th Jul ’1350
Mr Kunal Shah, Head of CommodityResearch, Nirmal Bang.
Taking the discussion forward, Mr Kunal Shah, the next speaker talked about the dos and don’ts of the commodity market and what trading strategy should be adopted. He also spoke about the macro economic scenario, the reasons for high volatility in the commod-ity markets and its significance and the outlook of certain commodities.
He said, “At the centre of all the macroeconomic events happening in the world economy is the US Federal Reserve’s announcement to end quantitative easing and also high liquidity in Japan.”
According to Mr Shah, the dollar will be much stronger than the yen in times to come and that is why there is a lot of turnaround in the currency market. These fluctuations in the currency markets according to him have a big impact on the commodities markets.
He also mentioned that the slowdown in the Chinese economy is the biggest threat to the commodities market. This will be aggravated due to the discontinuation of quantitative easing by the US Fed Reserve. He presented charts and figures to quantify his claim.
Mr Shah spoke about the measures taken by the US central bank and highlighted the GDP of US and Europe. He also discussed the GDP and industrial production of China and Japan’s response to infusion of liquidity into its economy.
Towards the end of the talk, he told investors to brace themselves for tough times ahead for gold and crude oil. He also offered his outlook on commodities such as crude oil, nickel, copper, coriander, cumin seeds, castor seeds and soya bean.
The session concluded with an interactive session of questions and answers between the audience and the speakers at the commodity camP.