The effects of English language development curriculum ...The effects of English language...
49
The effects of English language development curriculum materials on students’ English proficiency Castañeda v. Pickard (1981) mandated that educational programs for emergent bilinguals be tested for program efficacy. Since English language development (ELD) curricular materials are one part of an instructional program, we assess this mandate by examining the effectiveness of ELD materials in Texas. Using local linear matching, we find that schools that do not purchase any ELD curricula have significantly lower English language proficiency scores relative to schools that purchase state-adopted ELD materials. These results are robust across various matching models—inverse probability weights with regression adjustment, kernel matching, and nearest neighbor matching--and a comparative interrupted time series design. There is no significant difference between schools that adopt the two most popular ELD curricula—Rigby On Our Way to English and National Geographic Reach. This study suggests that emergent bilinguals (EBs) who attend schools that have instructional materials that explicitly foreground English language proficiency standards outperform those in schools that do not have such materials. Suggested citation: Le, Quynh Tien, and Morgan Polikoff. (2020). The effects of English language development curriculum materials on students’ English proficiency. (EdWorkingPaper: 20-222). Retrieved from Annenberg Institute at Brown University: https://doi.org/10.26300/fhbb-bt82 Quynh Tien Le San Francisco Unified School District Morgan Polikoff University of Southern California VERSION: April 2020 EdWorkingPaper No. 20-222
Transcript of The effects of English language development curriculum ...The effects of English language...
The effects of English language development curriculum materials on students’ English proficiency
Castañeda v. Pickard (1981) mandated that educational programs for emergent bilinguals be tested for program efficacy. Since English language development (ELD) curricular materials are one part of an instructional program, we assess this mandate by examining the effectiveness of ELD materials in Texas. Using local linear matching, we find that schools that do not purchase any ELD curricula have significantly lower English language proficiency scores relative to schools that purchase state-adopted ELD materials. These results are robust across various matching models—inverse probability weights with regression adjustment, kernel matching, and nearest neighbor matching--and a comparative interrupted time series design. There is no significant difference between schools that adopt the two most popular ELD curricula—Rigby On Our Way to English and National Geographic Reach. This study suggests that emergent bilinguals (EBs) who attend schools that have instructional materials that explicitly foreground English language proficiency standards outperform those in schools that do not have such materials.
Suggested citation: Le, Quynh Tien, and Morgan Polikoff. (2020). The effects of English language development curriculum materials on students’ English proficiency. (EdWorkingPaper: 20-222). Retrieved from Annenberg Institute at Brown University: https://doi.org/10.26300/fhbb-bt82
Quynh Tien LeSan Francisco Unified School District
Morgan PolikoffUniversity of Southern California
VERSION: April 2020
EdWorkingPaper No. 20-222

THE EFFECTS OF ENGLISH LANGUAGE DEVELOPMENT CURRICULUM 1
The effects of English language development curriculum materials on students’ English proficiency
THE EFFECTS OF ENGLISH LANGUAGE DEVELOPMENT CURRICULUM 2
Abstract
Castañeda v. Pickard (1981) mandated that educational programs for emergent bilinguals be
tested for program efficacy. Since English language development (ELD) curricular materials are
one part of an instructional program, we assess this mandate by examining the effectiveness of
ELD materials in Texas. Using local linear matching, we find that schools that do not purchase
any ELD curricula have significantly lower English language proficiency scores relative to
schools that purchase state-adopted ELD materials. These results are robust across various
matching models—inverse probability weights with regression adjustment, kernel matching, and
nearest neighbor matching--and a comparative interrupted time series design. There is no
significant difference between schools that adopt the two most popular ELD curricula—Rigby
On Our Way to English and National Geographic Reach. This study suggests that emergent
bilinguals (EBs) who attend schools that have instructional materials that explicitly foreground
English language proficiency standards outperform those in schools that do not have such
materials.
THE EFFECTS OF ENGLISH LANGUAGE DEVELOPMENT CURRICULUM 3
Emergent bilinguals1 are one of the fastest growing and one of the most underserved
student populations in the United States (Capps et al. 2005; Genesee, Lindholm-Leary, Saunders,
and Christian 2005; National Education Association 2008). Since 2000, the emergent bilingual
(EB) population in American public schools has grown by 28% (National Center for Education
Statistics 2019) and now accounts for 9.6% of all public school students in the United States. Of
all EBs in the United States, 78% are Hispanic, and the majority qualify for free or reduced
lunch. Emergent bilinguals are “triply segregated”—more likely to attend schools with other
EBs, minorities, and low-income students (Orfield 2001; Orfield and Lee 2006; Ríos-Aguilar and
Gándara 2012). Results from the 2019 National Assessment of Educational Progress show that
EB-non EB achievement gaps are as large as gaps for students who do and do not receive free or
reduced-price lunch.
To improve the educational outcomes of EBs, federal court cases have required that
programs for EBs be effective. Castañeda v. Pickard (1981) mandated that educational programs
for EBs be based on sound educational theory, implemented effectively, and tested for program
efficacy. Since research has shown that textbooks influence the content and methods that
teachers use in the classroom (Alajmi 2009, 2012; Robitaille and Travers 1992), English
language development (ELD) textbooks can play an integral role in program efficacy. This paper
addresses the third mandate in the Castañeda v. Pickard (1981) ruling by measuring the
1 Following Burke, Morita-Mullaney, and Singh (2016), we use the term emergent bilingual in lieu of the following:
English language learner (ELL), English as a second language (ESL), and limited English proficient (LEP). Scholars
have objected to the terms “limited English proficient” and “English language learner” (Garcia 2009) due to its
deficit-framing of the linguistic abilities of emergent bilinguals. The terms also suggest that English proficiency is
the only desired outcome for this population of students (Menken and Solorza, 2014). Referring to this group of
students by an additive name that does not focus on its limitations is an important step towards the decentering of
English monolingual norms. Similar to Burke et al. (2016), we use the term emergent bilingual with two exceptions.
First, the terms ELL, ESL, and LEP may be used when referencing federal and state laws. Second, the terms ELL, ESL,
and LEP may be used in the literature review if the authors of the studies use the terms.
THE EFFECTS OF ENGLISH LANGUAGE DEVELOPMENT CURRICULUM 4
relationship between ELD curriculum materials and EBs’ English proficiency. Though Texas’
educational policies refer to English language development as English as a second language, we
use the term ELD in this study to refer to language programs provided to EBs to attain English
proficiency. ELD is a more accurate term because English may not necessarily be the second
language of EBs.
The association between textbook quality and student achievement has important
implications for local education agencies. Since the costs of textbooks across publishers are quite
similar, districts have the potential to increase student achievement at minimal marginal cost
(Chingos & Whitehurst, 2012). Furthermore, efforts to improve the achievement of EBs by
making better curriculum choices may face fewer challenges compared to other alternatives (e.g.,
extending the school day, increasing the number of bilingually-certified teachers), which may be
less feasible or politically palatable. Though a few studies have looked at the relationship
between mathematics textbooks and student achievement (Agodini et al. 2010; Bhatt and Koedel
2012; Bhatt, Koedel and Lehmann 2013; Blazar et al. 2019; Koedel et al. 2017), no studies have
examined the effect of ELD textbooks on the English proficiency of EBs. This study seeks to fill
this gap by answering the following research questions:
1.) To what extent do English proficiency outcomes differ between schools purchase any
ELD curricular materials and schools that purchase state-adopted curricular materials?
2.) To what extent do ELL English proficiency outcomes differ between schools that use the
two most popular ELD curricular materials (Rigby and National Geographic)?
Background Information
Research on Textbook Efficacy
THE EFFECTS OF ENGLISH LANGUAGE DEVELOPMENT CURRICULUM 5
The choice of curriculum materials can significantly affect student achievement. Five
recent rigorous, empirical studies examine the relationship between textbooks and student
academic outcomes. First, Agodini et al. (2010) use a randomized control trial across 12 districts
to compare the effects of four elementary mathematics on student achievement in grades 1 and 2.
The authors find that math curricula correspond to large differences in student academic
achievement. For example, by the end of grade 2, certain curricula were associated with an
increase of 0.17 standard deviations in student test scores. Three quasi-experimental studies use
matching techniques in Indiana (Bhatt and Koedel 2012), Florida (Bhatt, Koedel, and Lehmann
2013), and California (Koedel et al. 2017) and find positive effects of one of the studied
elementary mathematics textbooks in each state (on the order of .05 to .10 standard deviations
per year, and larger for low-income students). The largest and most recent study (Blazar et al.
2019), in contrast, found no impacts of elementary mathematics textbooks across six states.
Together, these findings imply that the choice of textbook, at least in elementary mathematics,
may have direct impacts on student achievement. Though a few studies have looked at the
relationship between mathematics textbooks and student achievement, to our knowledge no
studies have examined the effect of ELD textbooks on EBs’ English language proficiency. This
study would be the first to use quasi-experimental methods to assess the effectiveness of ELD
instructional materials.
State Textbook Adoptions
In the United States, some state conduct state-level textbook adoptions (which are
typically advisory for schools and districts) and some states allow for complete local control of
textbook purchases (Zeringue et al. 2010). Texas is one of the two largest states, and it conducts
an advisory state adoption (meaning the state puts out a list of approved materials but districts
THE EFFECTS OF ENGLISH LANGUAGE DEVELOPMENT CURRICULUM 6
can purchase materials on or off the list). Historically, publishers were thought to tailor their
books to the needs and preferences of the Texas State Board of Education and concentrate their
selling efforts in Texas (Bowler 1978; Stein et al. 2001). However, it should be noted that Texas’
national influence on textbook adoption may have waned since the adoption of Common Core
State Standards (CCSS). While forty-two states and the District of Columbia have adopted the
CCSS, Texas has not.
District Textbook Adoptions
Once the Texas State Board of Education decides which instructional materials are
approved by the state, district leaders can decide which curricula they want to adopt for their
particular district. Textbook adoptions in Texas districts (except in charter schools) are uniform
adoptions at the district level, meaning that all schools in the district use the same materials
(Texas Education Agency 2015). Unlike in other subjects, districts are not mandated to purchase
any ELD textbooks at all, and they can also purchase on or off the state-approved list (Texas
Education Agency 2011). Given the great flexibility that districts have over ELD textbook
adoption, it is important to understand how the extra autonomy has impacted the English
proficiency of EBs.
Prior research has shown that district leaders consult a variety of sources to make
textbook adoption decisions. Using data from over 150 interviews with curriculum decision-
makers in eight states, Zeringue et al. (2010) found that district leaders had limited information
on textbook efficacy and, therefore, tended to make adoption decisions based on other factors
such as teacher acceptance and advice from neighboring districts. In addition, Zeringue et al.
(2010) found that 80% of curriculum leaders sought out information about textbook use,
THE EFFECTS OF ENGLISH LANGUAGE DEVELOPMENT CURRICULUM 7
effectiveness, and acceptance of the materials. Thus, if more research was available regarding
textbook efficacy, curriculum leaders may use this information to make better choices.
ELD Textbooks in Texas
The 2011-2012 school year is the most recent ELD textbook adoption cycle in the state of
Texas. During this adoption cycle, the state released a list of seven state-approved ELD
curricula. Of the seven, two are online programs and five are traditional, textbook curricula. The
textbooks vary along several dimensions including number of lessons on forms of English,
opportunities to learn new vocabulary words, and the ratio of listening/speaking activities to
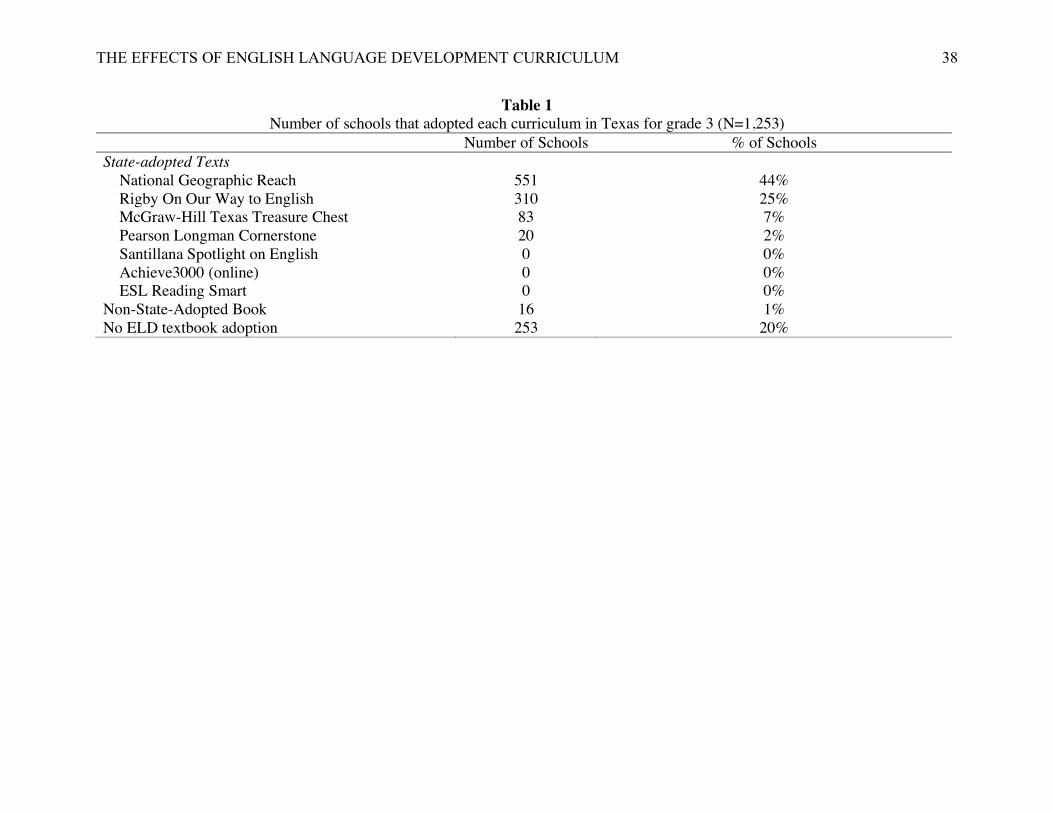
reading/writing activities. Of the five traditional curricula, Rigby On Our Way to English and
National Geographic Reach are the most popular, comprising 69% of adoption patterns in Texas
(see Table 1).
With 515 schools across 48 districts adopting National Geographic Reach, it is the most
frequently adopted ELD curricula and represents 44% of adoptions. The author of this book also
authored the widely-used Sheltered Instruction Observation Protocol (SIOP), which is designed
to improve instruction for EBs. National Geographic Reach was first published in 2011. A
student anthology in the National Geographic Reach series is usually divided into eight units.
Each unit includes multiple opportunities to use language frames, share aloud with a partner,
learn conversational and academic vocabulary, and practice language-learning strategies (e.g.,
predicting, rereading and retelling). The anthology includes a mix of fiction and non-fiction
texts.
With 313 schools across 37 districts adopting Rigby On Our Way to English, it is the
second most popular ELD curricula in Texas. Rigby is a registered trademark of Houghton
Mifflin Harcourt. On Our Way to English is marketed as a comprehensive ELD program that
THE EFFECTS OF ENGLISH LANGUAGE DEVELOPMENT CURRICULUM 8
focuses on academic language, vocabulary development, content-based instruction, and oral
language. The text is typically divided into eight units with each unit providing opportunities to
engage with fiction and non-fiction texts. On Our Way to English was first published in 2011
and is available in a Texas-specific version and a national version. In contrast, a Texas-specific
version of National Geographic Reach does not exist.
Data
The data for the proposed study come from the state of Texas. Texas serves roughly
5,400,000 students across approximately 1,250 public school districts. The racial composition of
students in Texas’ public schools is as follows: 53% Hispanic, 27% White, 13% Black, 4%
Asian, and 2% multiracial (National Center for Education Statistics 2019). Roughly 17% of
students in Texas’ public schools are identified as English language learners.
Texas is an ideal state for the study of English language development curriculum
materials on EBs’ English proficiency for several reasons. First, Texas is home to approximately
900,000 EBs, the second highest number of EBs in the United States.2 Second, the textbook
adoption process is centralized in Texas, which allows for a more manageable analysis. Third,
Texas has a large number of school districts, which allows for adequate statistical power for
student achievement analyses. Fourth, since Texas grants great autonomy to districts over ELD
textbook adoption, there is variation in the kinds of ELD instructional materials that are adopted.
In the years under study, districts in Texas report using 7 different state-approved ELD curricula
and 21 different non-state-approved ELD curricula.
Textbook information was collected from districts using the Texas Education Agency
(TEA) online data portal. The TEA collects information, which is publicly available through
2 With over 1.5 million EBs, California has the highest number of EBs in the United States (National Center for Education Statistics, 2019).
THE EFFECTS OF ENGLISH LANGUAGE DEVELOPMENT CURRICULUM 9
Freedom of Information Law (FOIL) request, on instructional materials allotment (IMAT). We
obtained ELD textbook purchases for the years 2011-2015. The following textbook information
is available for each district: publisher, textbook title, subject, grades used, unit price, quantity of
units purchased, and adoption year. We found 418 districts on the IMAT list for years 2011-
2015, which left 810 districts with missing information on ELD textbook adoption.
Since the IMAT report only captures purchases made using state funds, it does not
capture instructional materials that were purchased using local funds nor instructional materials
that were purchased prior to 2011. Therefore, it cannot be assumed that districts that are not on
the 2011-2015 IMAT list did not purchase ELD instructional materials. The other 810 districts
might have purchased ELD textbooks prior to 201l. Alternatively, these 810 districts may not
have purchased any ELD instructional materials. To obtain information on ELD instructional
materials for the remaining 810 districts, we submitted Public Information Requests to each
district with missing ELD textbook information and received responses from 737 districts,
yielding an overall district response rate of 94%.
Analytic Sample
We focus out analysis on elementary schools in Texas that serve EBs. Since the study
focuses on elementary English language development books, we drop middle and high schools
from the sample as elementary ELD textbooks are intended for elementary-aged students and are
typically not purchased for older students. In addition, elementary schools that do not have EBs
(n = 82) are excluded from the study since they do not have a need for ELD curricular materials.
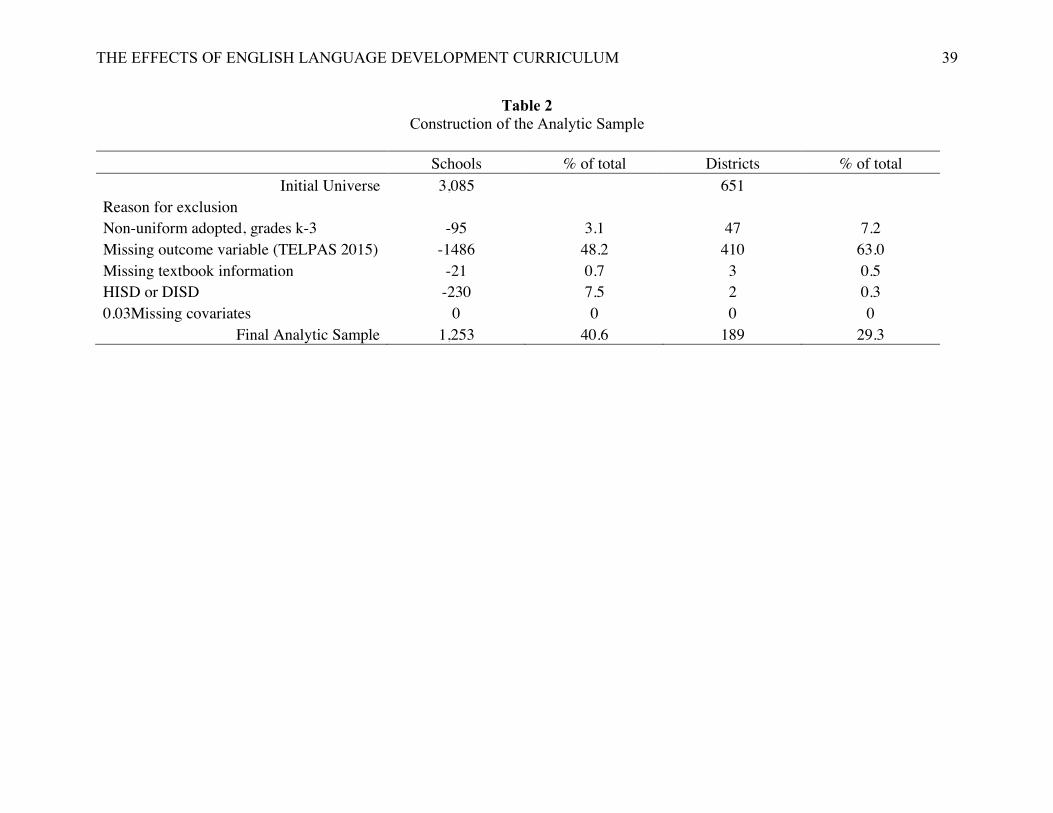
Table 2 provides details about the construction of the analytic sample starting with the
universe of schools in Texas that are eligible for the study (N=3,085). After four exclusion
THE EFFECTS OF ENGLISH LANGUAGE DEVELOPMENT CURRICULUM 10
criteria were applied3, 1,253 elementary schools (41%) remain in the sample. First, schools that
did not adopt the same ELD curriculum in grades K-3 were dropped from the sample. Roughly
three percent of schools were excluded because they indicated using more than one ELD
curricula in grades K-3. Though it is possible to examine mixed-treatment effects, there are too
few schools for an effective analysis.
Second, elementary schools that did not report English language proficiency scores for
spring 2015 were eliminated from the study. There are two scenarios in which the TEA would
mask Texas English Language Proficiency Assessment System (TELPAS) scores: 1.) when few
students in a group are evaluated and it may be possible to identify particular students or 2.)
when all the students in a group have the same result (Texas Education Agency 2015). Masking
refers to the use of special symbols to conceal data to protect student confidentiality. Due to
masking of student data, 48% of schools did not report TELPAS scores for spring 2015 and
were, thus, dropped from the study.
Third, less than one percent of schools were eliminated from the study due to missing
information regarding ELD adoption. Specifically, 21 schools or 0.7% of the sample were
dropped due to missing ELD textbook information. Though public information requests were
submitted to all districts in Texas with missing ELD textbook information, 3 districts out of the
remaining districts in the study did not respond. These 3 districts represent 21 schools. Given
these data restrictions, the results from this study are only generalizable to elementary schools in
Texas that adopted the same ELD curriculum in grades K-3, reported TELPAS scores in spring
2015, and reported ELD textbook adoption.
3 The four exclusion criteria used in this study are similar to the ones used in Koedel et al.’s (2017) study on the effectiveness of math textbooks in California.
THE EFFECTS OF ENGLISH LANGUAGE DEVELOPMENT CURRICULUM 11
Fourth, Houston Independent School District (HISD) and Dallas Independent School
District (DISD) were dropped because both districts are much larger than all other districts in the
state which made it difficult to find comparable matches. After dropping HISD and DISD from
the sample, 1,253 schools and 191 districts remain. The final analytic sample retains 41% of the
universe of schools and 29% of the universe of districts.
ELD Textbook Adoption Patterns
In the final analytic sample, we find that the majority of elementary schools in Texas that
service EBs purchase state-adopted ELD materials (see Table 1). While roughly 1% of the final
analytic sample purchased materials that were not on the state-adopted list, 79% of schools
purchased materials on the state-adopted list. Approximately 20% of schools in the final sample
did not purchase any ELD materials even though they did have students identified as ELL in
their school. Of the ELD materials on the state-adopted list, National Geographic Reach and
Rigby On Our Way to English were the most popular with 69% of schools in the final analytic
sample purchasing from one of these two publishers.
School-Level Variables
Though ELD textbook adoption typically occurs at the district level, we match at the
school level for two reasons. First, matching is a “data hungry” process that requires a large
sample size (Heckman, Ichimura and Todd 1998). Second, schools within the same district can
vary greatly in their demographics, test scores, teacher experience, etc. Conducting the analysis
at the school level allows us to adjust for both school- and district-level characteristics (Bhatt and
Koedel 2012; Bhatt, Koedel and Lehmann 2013).
School-level data are drawn from the Texas Education Agency online data portal.
Information about students and teachers are available at the school level. With regards to
THE EFFECTS OF ENGLISH LANGUAGE DEVELOPMENT CURRICULUM 12
teachers, the following information is available: experience, gender, race, and credential type. In
terms of students, the following information is available at the school level: race, gender,
free/reduced price lunch eligibility, special education eligibility, English language learner status,
district average math and reading score on the State of Texas Assessments of Academic
Readiness (STAAR), and district average English language proficiency scores on the TELPAS
(Texas English Language Proficiency Assessment System). Since the last year of ELD textbook
adoption in Texas was the 2011-2012 school year, we use achievement and demographic data
from 2010-2011 to match schools.
Outcome Variables
School-average composite scores on the spring 2015 TELPAS assessment serve as the
outcome variable. The TELPAS assessment is delivered on a yearly basis to monitor EBs’
progress in attaining English proficiency. Since there are four language modalities—listening,
speaking, writing, and reading—the TELPAS exam is divided into four sections. Students are
given a rating of 1-4 on each subtest where 1 represents Beginning, 2 represents Intermediate, 3
is Advanced, and 4 represents Advanced High (TEA, 2016). In order to arrive at the composite
score, TEA weights each section as follows: listening (0.10), speaking (0.10), reading (0.50), and
writing (0.30). Using student-level TELPAS scores, we create school-average composite
TELPAS scores which are approximately normally distributed (see Figure 1).
Since the STAAR reading assessment may appear to be very similar to the TELPAS
exam, we briefly clarify the differences between the two assessments and justify using TELPAS
scores as the outcome variable. While the reading portion of the STAAR assesses students’
mastery of content standards for English language arts, the TELPAS assessment focuses on
language standards—not content standards. The reading portion of the STAAR assessment only
THE EFFECTS OF ENGLISH LANGUAGE DEVELOPMENT CURRICULUM 13
measures reading abilities and does not include a listening and speaking portion. Since the
TELPAS exam covers all four language modalities (listening, speaking, reading, and writing),
the TELPAS is better positioned to assess English proficiency. Increased English proficiency
may lead to greater access to content standards; therefore, it is possible that increases in TELPAS
scores lead to increases in STAAR reading scores. However, since TELPAS scores are a more
direct measure of English proficiency than STAAR reading scores, we use TELPAS scores as
the outcome variable.
Research Design
To model the association between various ELD curriculum materials and EBs’ English
proficiency, we use local linear matching. Bhatt and Koedel (2012) used a similar matching
approach to evaluate relative curriculum effectiveness in the state of Indiana. Since districts can
self-select into the treatment (i.e., the ELD textbook), selection bias may affect our coefficient
estimates. Matching on school characteristics reduces group differences across all the observed
variables used in the propensity score equation (Shadish, Cook & Campbell, 2002). Matching
can allow for causal inferences if the conditional independence assumption is met (Heckman,
Ichmura and Todd 1997; Rosenbaum and Rubin 1983).
The conditional independence assumption requires that potential outcomes be
independent of textbook choice conditional on the observables. In other words, the assumption
requires that all relevant variables be included in the model. The conditional independence
assumption will not be satisfied if unobserved characteristics influence both the treatment and
the outcome. By using an estimated propensity score, we can match schools based on their
observable characteristics to minimize the likelihood that unobserved characteristics may
influence the outcome. Matching has two main advantages over a simple regression analysis.
THE EFFECTS OF ENGLISH LANGUAGE DEVELOPMENT CURRICULUM 14
First, matching has fewer restrictions on functional form (Black and Smith 2004). Second,
matching can more accurately predict the relationship between covariates and the outcome
variable by restricting the influence of noncomparable treatment and control units (Black and
Smith 2004).
Of schools that adopt ELD materials in the final analytic sample, 92% adopted new ELD
curricula in 2011-2012. Thus, third graders in 2014-2015 will have potentially been exposed to
the ELD curricula for four years. If an ELD curriculum is effective, then districts using this
curriculum should have higher TELPAS scores for their ELLs compared to districts that did not
adopt this particular curriculum.
Following Bhatt and Koedel (2012), we use the term “total treatment effects” to account
for the possibility of the estimates capturing systematic differences between treatment and
control schools. For example, if one curriculum has a teacher’s guide that is easier to navigate,
the estimates will reflect this difference. Based on the series of falsification tests we conducted
for the study, we find little evidence to suggest that there are systematic differences between
treatment and control schools. However, it should be noted that the estimates from this study will
capture “total treatment effects.”
Propensity Score Estimation
In order for propensity score matching to yield unbiased estimates of the effectiveness of
ELD textbooks, two types of covariates should be included: 1.) pretest measures of the outcome
variable and 2.) direct measures of the selection process (Cook and Steiner 2010; Glazerman,
Levy and Myers 2003; Steiner and Cook 2013). The first type of covariate is easily obtainable
through TEA. We include school average TELPAS composite scores from spring 20114 (pre-
4 The higher the correlation between pretest and posttest, the greater the bias reduction (Steiner & Cook, 2013). The correlation between school-average TELPAS scores in 2011 and school-average TELPAS scores in 2015 is 0.43.
THE EFFECTS OF ENGLISH LANGUAGE DEVELOPMENT CURRICULUM 15
adoption) in the selection model. The second type of covariate is slightly harder to obtain.
Steiner and Cook (2013) suggest investigating the actual selection process before starting the
study because the omission of important variables can seriously increase bias in the estimates
(Heckman, Ichimura and Todd 1997). Shadish and Steiner (2010) recommend interviewing
relevant individuals to identify factors that influence selection into treatment and studying the
pertinent research literature. In addition, economic theory and previous empirical findings should
guide the choice of variables to include in the propensity score estimation5 (Caliendo and Sabine,
2008).
Heckman et al. (1997) find that selection models that include variables related to
treatment assignment are better able to predict treatment assignment than models that only
include demographic characteristics like education and race. The covariates that are used to
estimate the propensity score should include all of the key factors affecting both the outcome
variable and the treatment assignment (Smith and Todd 2005). When creating a list of covariates
for the propensity score estimation, there is a tradeoff between bias and variance. Including an
irrelevant variable can lead to increased variance, while excluding a potentially important
confounder can lead to increased bias (Heckman, Ichimura and Todd 1997; Stuart 2010).
We investigate the selection mechanism using two methods. First, we conduct in-depth
interviews with 28 district leaders in Texas which we describe in the following paragraphs.
Second, we review previous research on textbook effectiveness to identify potential covariates
(Rubin 2001).
District Leader Interviews
5 We use a binomial logistic model for all research questions to estimate the propensity score.
THE EFFECTS OF ENGLISH LANGUAGE DEVELOPMENT CURRICULUM 16
To understand the factors influencing ELD textbook adoption, we conducted 28 in-depth
interviews with district leaders using structured open-ended interviewing protocols. We focus on
district leaders because textbook adoption typically occurs at the district level in the state of
Texas. The districts selected for interviews represented variation along two dimensions:
percentage of EBs (e.g., low and high) and ELD textbook adoption patterns (4 possible
patterns)—yielding 8 total cells. Using proportional stratified sampling, we selected 2-8 districts
from each cell, giving a total of 28 districts. Interviews lasted approximately 45 minutes and
were audio recorded and transcribed. Interview data were analyzed using NVivo software.
In the initial cycle of interview data review, which required at least three readings of the
full transcript, we used structural codes, which entail little interpretation. Structural coding “acts
as a labeling and indexing device, allowing researchers to quickly access data likely to be
relevant to a particular analysis from a larger data set” (Namey et al. 2008, 141). Though
interviews covered a range of topics, including program model for EBs, we subjected the entire
transcript to this initial coding, since district leaders spoke about instructional materials in
response to questions not directly about instructional materials (e.g., bilingual model). The first
cycle of coding revealed 27 structural codes related to ELD textbook adoption. These structural
codes were further categorized and analyzed in the second stage of review.
In the second cycle of coding, the primary goal is to create categorical, thematic, and
conceptual organization from the array of codes that emerged from first cycle coding (Saldana
2013). We used pattern coding in the later stages of data analysis to group codes into a smaller
number of themes. Five main factors emerge from the interview data. The following list of
factors shape district leaders’ decisions around ELD textbook adoption: number of EBs,
academic achievement of EBs, district leaders’ beliefs about second language acquisition, district
THE EFFECTS OF ENGLISH LANGUAGE DEVELOPMENT CURRICULUM 17
budget, and program model for EBs. We briefly discuss each of these factors in the paragraphs
that follow.
One factor that district leaders take into consideration when deciding which ELD
curriculum to adopt is the number of EBs in their district. Six out of 28 district leaders cited EB
enrollment as a factor for ELD textbook adoption. For example, a curriculum facilitator in
district 15 states that “the number of students that we have identified [as ESL]” is a major
determinant in whether or not ELD materials are purchased. This district leader elaborates, “If
there’s a high number of students then, of course, the need [for ELD instructional materials]
would be greater. But if there is a low number of students then our expert teachers in the
bilingual department will be able to modify their instruction to meet the needs of their ESL or
ELL students.” For this particular district, bilingual teachers are expected to meet the linguistic
needs of EBs in the event that ELD materials are not purchased. To model the treatment
assignment, we include the number of EBs—at both the school and district level—in the
propensity score.
Second, district leaders consider EBs’ academic achievement when making curricular
decisions. Eight out of 28 district leaders report EBs’ test scores (e.g., scores on the STAAR test,
scores on language proficiency tests) as a factor that influences ELD textbook adoption. District
Leader 18 shares, “We’re a pretty successful district when you look at state scores. What we
have found is that a lot of the times the basals don’t get you where you need to get. We pull from
a lot of different resources.” Since this district leader seems to be satisfied by her district’s test
scores, she does not see a need to purchase ELD materials. Instead, she believes that the district’s
current curriculum, which seems to be a mixture of various resources, is sufficient to meet the
needs of the students. Furthermore, District Leader 12 looks at “proficiency projections as well
THE EFFECTS OF ENGLISH LANGUAGE DEVELOPMENT CURRICULUM 18
as grade-level means” to determine whether or not ELD materials need to be purchased. We
include pre-treatment school and district average reading achievement on the Texas Assessment
of Knowledge and Skills6 (TAKS) and TELPAS in the estimation of the propensity score.
A third factor that that influences ELD materials purchasing is district leaders’ beliefs
about second language acquisition. Thirteen out of 28 district leaders use their beliefs about
second language acquisition to make decisions about ELD materials. Some leaders believe that
second language learning is not much different from first language learning; thus, EBs do not
need additional materials. For instance, District Leader 10 states, “We don’t have a particular
program that we offer or provide for [EBs]…We just rely on good instruction.” This district did
not purchase any ELD curricular materials because school administration believes that the
instruction that all students receive should be effective for EBs as well. Since it is difficult to
directly assess district leaders’ beliefs about second language acquisition for every district in
Texas, we adjust for the following Census characteristics at the district level: median income and
the percentage of non-English speakers in the district. Since beliefs about language learning may
vary based on professional status (Horwitz, 1999), we include median income to proxy for
professional status. As classroom and social peers influence learning (Arnold 1999), we include
the percentage of non-English speakers in the district as a means of capturing the variation in
beliefs about second language acquisition.
Fourth, cost is another factor that districts weigh in their decision to purchase ELD texts.
Sixteen out of 28 district leaders report that cost is an important consideration in ELD materials
purchasing. An elementary school principal from District 21 states, “We are a small, rural
district. So we also have to think about using our money wisely too…the main thing we have to
6 In spring 2012, the TAKS exam was replaced by the STAAR.
THE EFFECTS OF ENGLISH LANGUAGE DEVELOPMENT CURRICULUM 19
make sure of is that it’s something we can afford. Price would be the big decision-maker.” Along
the same lines, District Leader 15 states that “the budget is always a factor.” We include district
per pupil revenue along with district instructional expenditures to capture each district’s financial
ability to purchase ELD materials.
Fifth, a district’s program model for EBs emerges as another factor influencing ELD
materials purchasing. Eight out of 28 district leaders state that the district’s program model for
EBs impacts whether or not ELD materials are adopted. Districts that have bilingual programs
are less likely to purchase ELD texts because they are already purchasing texts in other
languages, usually Spanish, for their EBs which reduces the amount of money that is available
for ELD texts. In addition, districts that have bilingual programs also have bilingual teachers and
some districts use bilingual teachers’ knowledge of second language acquisition to supplant ELD
instructional materials. In the propensity score estimation, we include a dichotomous variable
indicating the presence of a bilingual program.
In addition to district leader interviews, prior research on textbook adoption can help to
model the selection mechanism (Caliendo and Sabine 2008; Heckman, Ichimura and Todd
1997). For instance, Bhatt and Koedel (2012), in modeling the association between textbook
adoption and achievement, use the following covariates in their propensity score model:
enrollment, attendance rates, demographics (race, language status, free lunch status),
achievement outcomes from prior years, per pupil expenditures, and Census measures (e.g.,
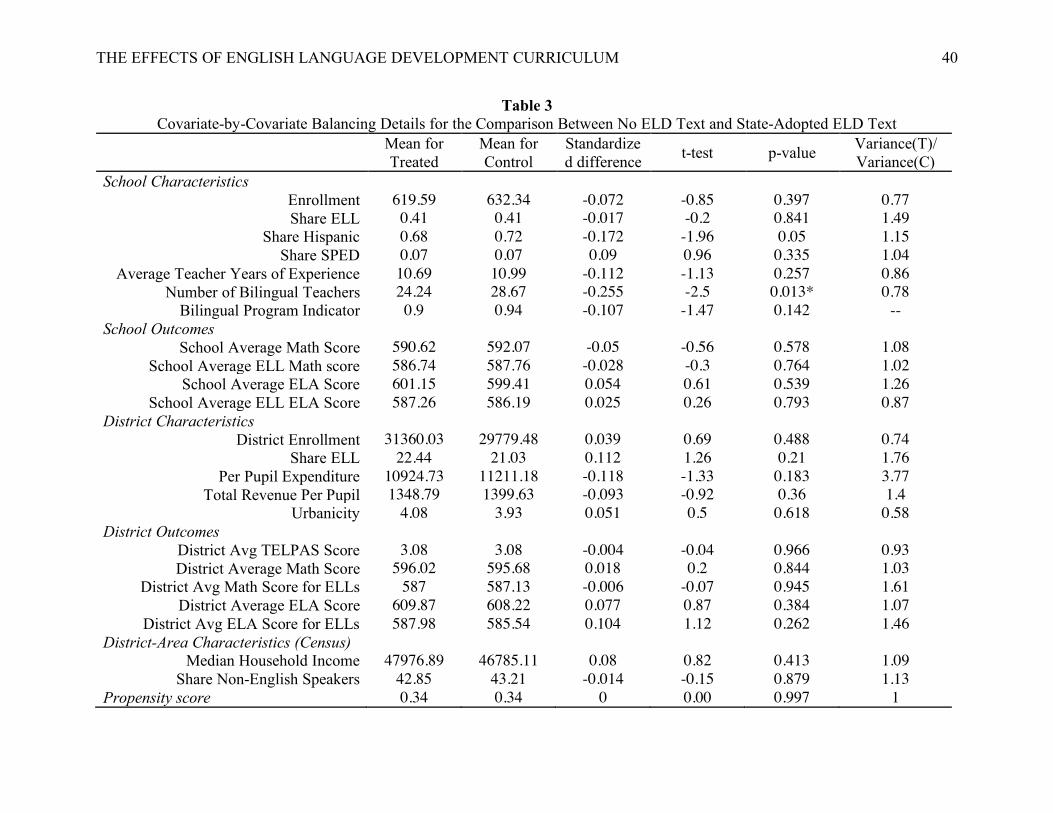
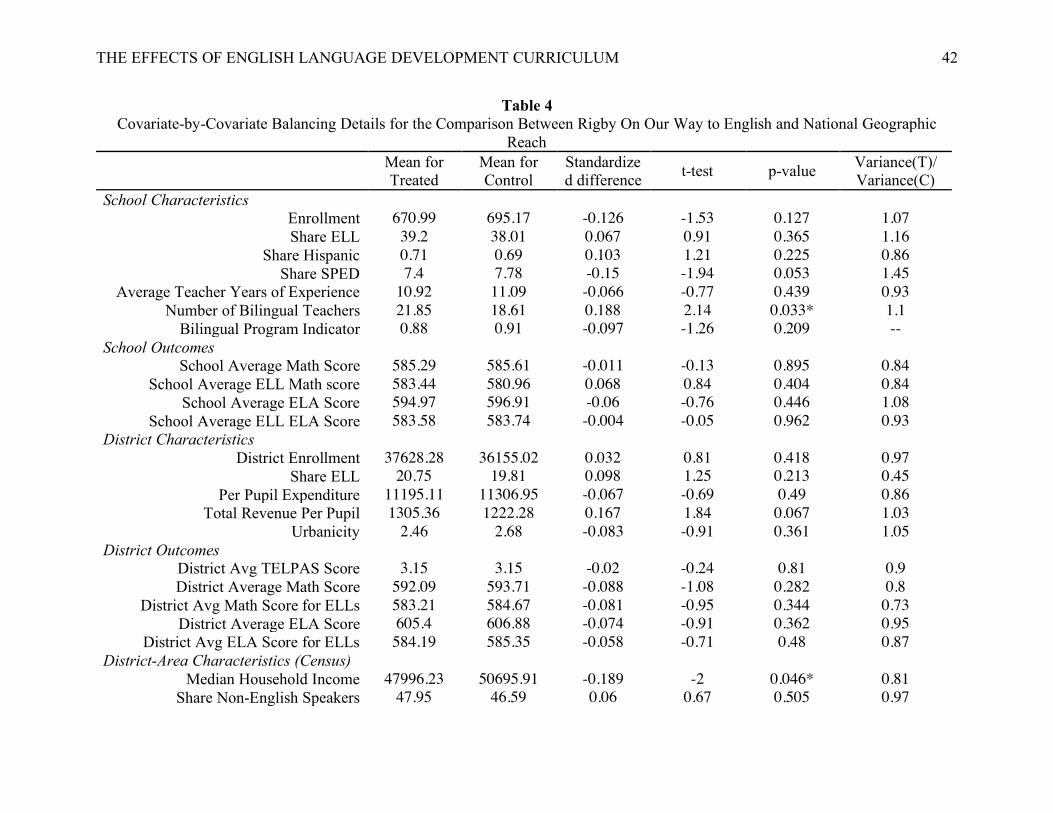
median household income, share of adults with a high school diploma). Table 3 contains the final
list of covariates used to estimate the propensity score.
Balancing Tests
THE EFFECTS OF ENGLISH LANGUAGE DEVELOPMENT CURRICULUM 20
We test for covariate balance using three different tests. Multiple tests are used because
there is no clearly preferred test for balance, and different tests may yield different results (Smith
and Todd, 2005b). Since there are two research questions, the propensity score must be
calculated separately. While the first propensity score measures the probability of not choosing
an ELD text, the second propensity score measure the likelihood of adopting Rigby On Our Way
to English. For this reason, covariate balancing is assessed twice (Table 3 and 4).
Following Rubin (2001), we calculate the standardized difference in the mean propensity
score in the two groups. To minimize bias, the standardized difference should be zero or close to
zero. Though there are no formal criteria for evaluating standardized differences, Rosenbaum
and Rubin (2001) suggest that values greater than 0.20 should be interpreted as large. The
standardized difference for the propensity score is 0.001 for both research questions.
Second, we calculate the variance ratios of the propensity score distribution in the
treatment and control groups (Rubin 2001). To minimize bias, the variance ratios should ideally
lie between 0.8 and 1.25. Variance ratios smaller than 0.5 or greater than 2.0 are considered
extreme (Rubin 2001). The variance ratio of the propensity scores are 1.00 for both research
questions.
We extend the first two balancing tests to include individual covariates. Though Rubin
(2001) recommends balancing on propensity score alone, we also calculate the standardized
difference and variance ratio for each covariate in the propensity score model. By doing so, we
can gain a more robust understanding of the comparability of the control and treatment groups.
For the first research question, we find that the variance ratio for all covariates is in the range of
acceptability [0.5, 2.0] except for district per pupil expenditure which has a variance ratio of
3.77. State-adopters have a wider range of per pupil expenditures than non-adopters. For the
THE EFFECTS OF ENGLISH LANGUAGE DEVELOPMENT CURRICULUM 21
second research question, the variance ratio for share of EBs is 0.45 which is slightly outside the
range of acceptability. Schools that adopt National Geographic Reach have a larger range of
percentage of EBs compared to school that adopt Rigby On Our Way to English. The absolute
value of the standardized difference is less than 0.20 for all covariates except for the number of
bilingual teachers which has a standardized difference of -0.26. For the first research question,
non-adopters, on average, have 29 bilingual teachers while state-adopters average 24 bilingual
teachers per campus.
Third, we present results from hypothesis tests. Though hypothesis tests and p-values
should not be used as measures of balance (Ho, Imai, King and Stuart 2007; Stuart 2010), they
are still common in balancing tests. Results from hypothesis testing may be misleading since
small differences in means may be statistically significant in a large sample. Though results from
hypothesis tests are not given much consideration, we present them to create a more robust
understanding of covariate balance. For the first research question, treatment and control schools
differ significantly on one variable—number of bilingual teachers. For the second research
question, treatment and control schools differ significantly on two variables—number of
bilingual teachers and median household income.
Overall, these tests suggest that the individual covariates and the propensity scores are
well balanced between treated and control units. The standardized difference for the propensity
score is 0.001 the variance ratio is 1 for both balancing tests.
Matching Algorithm
Matching algorithms assume that the outcome variable is independent of treatment
assignment conditional on a set of observable characteristics (Smith and Todd 2005). In addition,
it is assumed that for all conditioning variables, there is a positive probability of assignment to
THE EFFECTS OF ENGLISH LANGUAGE DEVELOPMENT CURRICULUM 22
treatment or control conditions. This assumption implies that a match can be found for all treated
cases. Matching estimators perform well in replicating the results of a randomized control trial
when the following criteria are met: 1.) the same data sources are used for both control and
treated units, 2.) control and treated units reside in the same labor market, and 3.) the data
contain a rich set of covariates that impact both treatment assignment and the outcome variable
(Heckman, Ichimura and Todd 1997; Heckman et al. 1998; Smith and Todd 2005). There is
strong evidence suggesting that all three conditions are met in this study. First, covariates and
outcome variables are the same for both treatment and control schools and is also measured in
the same way for both groups. Second, all treatment and control schools reside in the same
geographic area—Texas. Third, conditioning variables adjust for a wide array of
characteristics—reading and math achievement, English proficiency, teacher quality,
demographic characteristics, and median household income. Since these foundational
requirements have been met, it is appropriate to proceed with matching.
We choose local linear matching (LLR) over other matching methods for three main
reasons. First, local linear matching can reduce variance relative to other matching techniques
because it relies on more information. While common matching techniques like nearest neighbor
matching only use a few observations from the comparison group to construct the counterfactual,
local linear matching uses a weighted average of comparison units near the treatment unit. Since
more information is used, there is lower variance which leads to more precise estimates of the
treatment effect. Second, local linear matching includes a linear term in the propensity while
kernel matching does not. This added intercept is an advantage whenever there are gaps in the
propensity score. Lastly, local linear matching relies on weaker assumptions compared to other
matching approaches. Rosenbaum and Rubin’s (1983) framework for propensity score matching
THE EFFECTS OF ENGLISH LANGUAGE DEVELOPMENT CURRICULUM 23
requires strongly ignorable treatment assignment and common support; kernel-based matching
methods such as local linear matching replaces these two assumptions with weaker ones
(Heckman et al. 1998). Instead of assuming strongly ignorable treatment assignment, Heckman
and colleagues only require that the outcome under the control condition for the treated cases to
be independent of the treatment assignment, conditional on observed covariates (Guo and Fraser
2010). Instead of assuming full independence, Heckman and colleagues impose mean
independence. Though local linear matching is our method of choice, we also include results
from kernel matching, inverse probability weighting with regression adjustment (IPW-RA), and
nearest neighbor matching with 1, 2, and 3 neighbors (which will be abbreviated K1, K2, and
K3, respectively).
Following Dehejia and Wahba (2002), we trim the sample as needed to determine the
support region. There are no control units below the minimum propensity score for treated units
for either research question. We also assess for common support by visually inspecting a
probability density distribution of the propensity score in both groups. Lechner (2000b) argues
that common support can be assessed visually, and there is no need to implement more
complicated, formal processes. Estimated density functions of the propensity scores for treatment
and control schools (available upon request) show strong evidence of common support.
Results
Research Question 1: Non-Adopters vs. State-Adopters
Using local linear matching, we compare the effect of not purchasing an ELD text to the
effect of purchasing a state-adopted ELD text. We find that elementary schools that do not
purchase any elementary ELD texts score 0.30 standard deviations lower on school-average
THE EFFECTS OF ENGLISH LANGUAGE DEVELOPMENT CURRICULUM 24
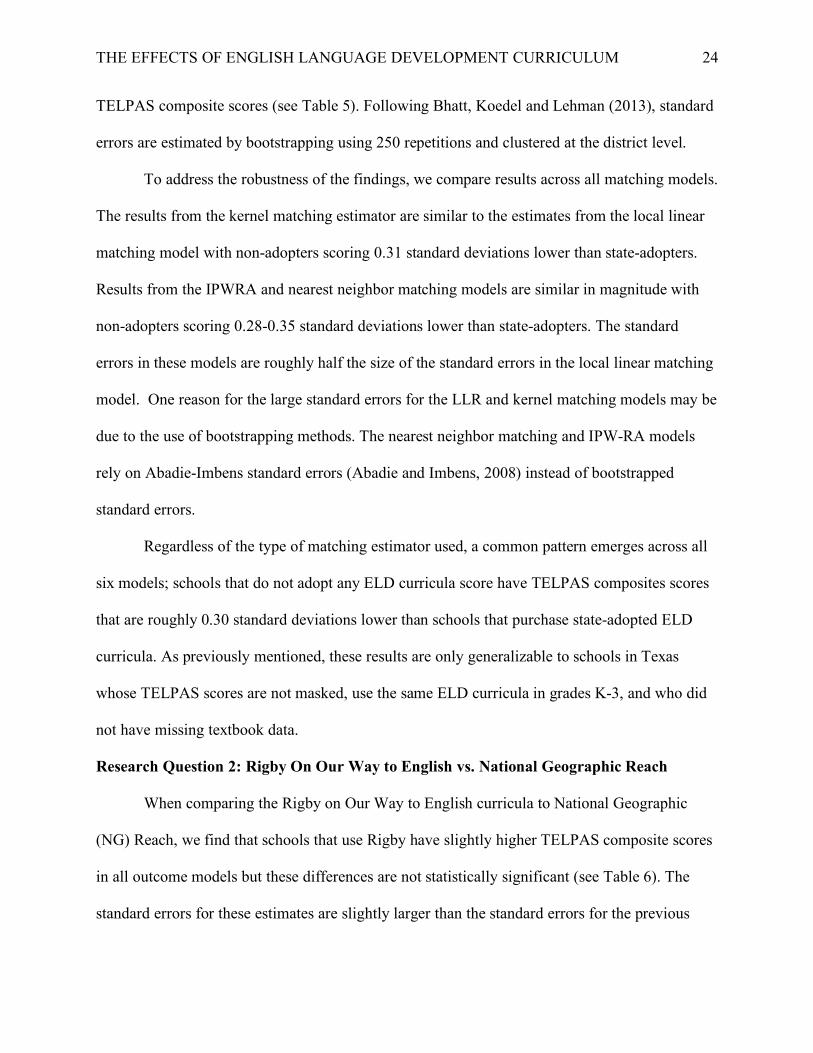
TELPAS composite scores (see Table 5). Following Bhatt, Koedel and Lehman (2013), standard
errors are estimated by bootstrapping using 250 repetitions and clustered at the district level.
To address the robustness of the findings, we compare results across all matching models.
The results from the kernel matching estimator are similar to the estimates from the local linear
matching model with non-adopters scoring 0.31 standard deviations lower than state-adopters.
Results from the IPWRA and nearest neighbor matching models are similar in magnitude with
non-adopters scoring 0.28-0.35 standard deviations lower than state-adopters. The standard
errors in these models are roughly half the size of the standard errors in the local linear matching
model. One reason for the large standard errors for the LLR and kernel matching models may be
due to the use of bootstrapping methods. The nearest neighbor matching and IPW-RA models
rely on Abadie-Imbens standard errors (Abadie and Imbens, 2008) instead of bootstrapped
standard errors.
Regardless of the type of matching estimator used, a common pattern emerges across all
six models; schools that do not adopt any ELD curricula score have TELPAS composites scores
that are roughly 0.30 standard deviations lower than schools that purchase state-adopted ELD
curricula. As previously mentioned, these results are only generalizable to schools in Texas
whose TELPAS scores are not masked, use the same ELD curricula in grades K-3, and who did
not have missing textbook data.
Research Question 2: Rigby On Our Way to English vs. National Geographic Reach
When comparing the Rigby on Our Way to English curricula to National Geographic
(NG) Reach, we find that schools that use Rigby have slightly higher TELPAS composite scores
in all outcome models but these differences are not statistically significant (see Table 6). The
standard errors for these estimates are slightly larger than the standard errors for the previous
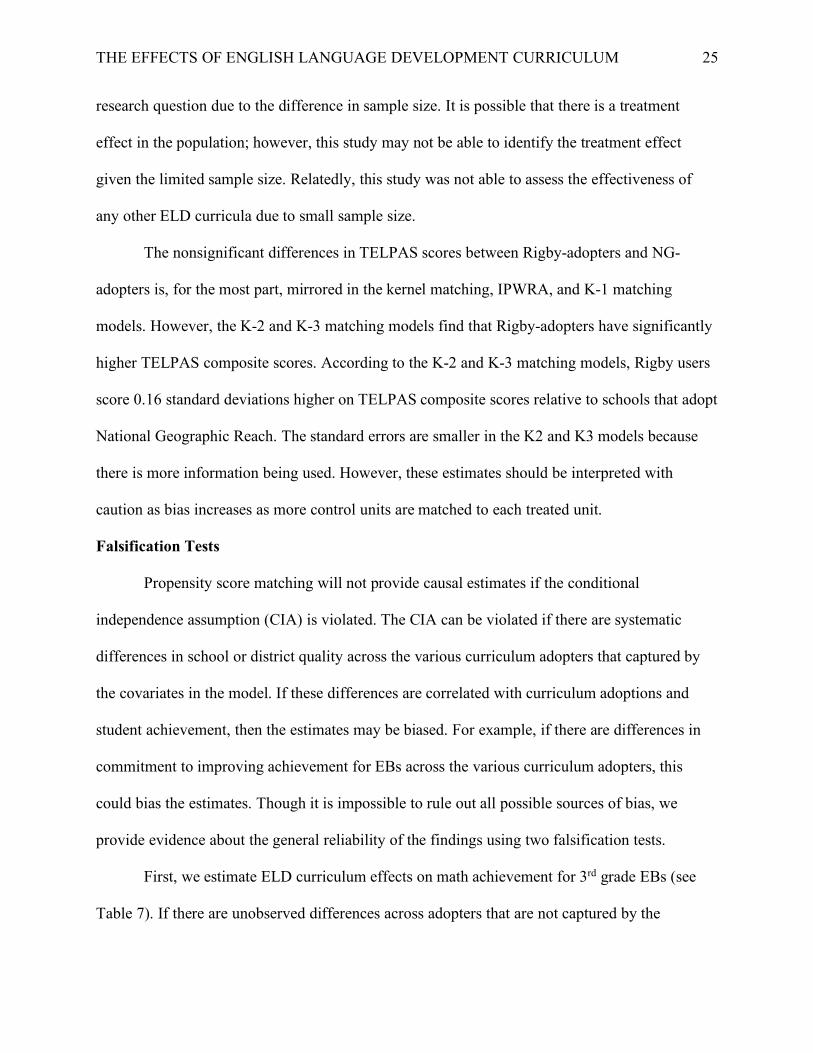
THE EFFECTS OF ENGLISH LANGUAGE DEVELOPMENT CURRICULUM 25
research question due to the difference in sample size. It is possible that there is a treatment
effect in the population; however, this study may not be able to identify the treatment effect
given the limited sample size. Relatedly, this study was not able to assess the effectiveness of
any other ELD curricula due to small sample size.
The nonsignificant differences in TELPAS scores between Rigby-adopters and NG-
adopters is, for the most part, mirrored in the kernel matching, IPWRA, and K-1 matching
models. However, the K-2 and K-3 matching models find that Rigby-adopters have significantly
higher TELPAS composite scores. According to the K-2 and K-3 matching models, Rigby users
score 0.16 standard deviations higher on TELPAS composite scores relative to schools that adopt
National Geographic Reach. The standard errors are smaller in the K2 and K3 models because
there is more information being used. However, these estimates should be interpreted with
caution as bias increases as more control units are matched to each treated unit.
Falsification Tests
Propensity score matching will not provide causal estimates if the conditional
independence assumption (CIA) is violated. The CIA can be violated if there are systematic
differences in school or district quality across the various curriculum adopters that captured by
the covariates in the model. If these differences are correlated with curriculum adoptions and
student achievement, then the estimates may be biased. For example, if there are differences in
commitment to improving achievement for EBs across the various curriculum adopters, this
could bias the estimates. Though it is impossible to rule out all possible sources of bias, we
provide evidence about the general reliability of the findings using two falsification tests.
First, we estimate ELD curriculum effects on math achievement for 3rd grade EBs (see
Table 7). If there are unobserved differences across adopters that are not captured by the
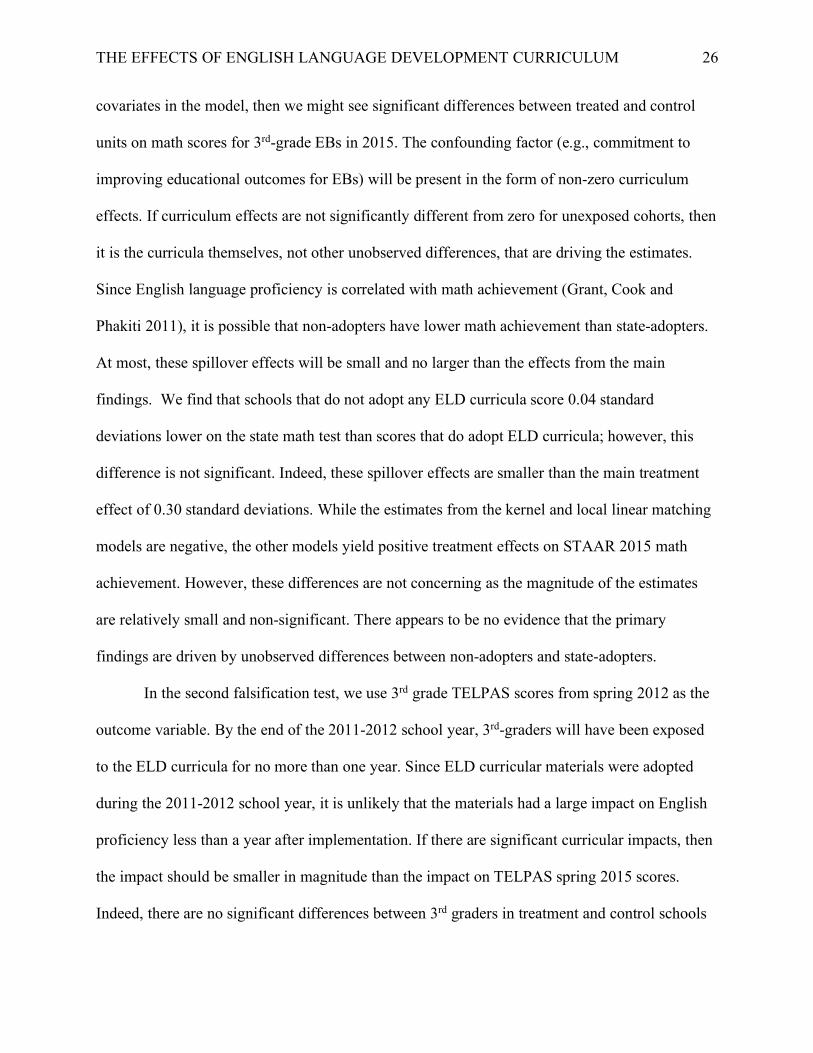
THE EFFECTS OF ENGLISH LANGUAGE DEVELOPMENT CURRICULUM 26
covariates in the model, then we might see significant differences between treated and control
units on math scores for 3rd-grade EBs in 2015. The confounding factor (e.g., commitment to
improving educational outcomes for EBs) will be present in the form of non-zero curriculum
effects. If curriculum effects are not significantly different from zero for unexposed cohorts, then
it is the curricula themselves, not other unobserved differences, that are driving the estimates.
Since English language proficiency is correlated with math achievement (Grant, Cook and
Phakiti 2011), it is possible that non-adopters have lower math achievement than state-adopters.
At most, these spillover effects will be small and no larger than the effects from the main
findings. We find that schools that do not adopt any ELD curricula score 0.04 standard
deviations lower on the state math test than scores that do adopt ELD curricula; however, this
difference is not significant. Indeed, these spillover effects are smaller than the main treatment
effect of 0.30 standard deviations. While the estimates from the kernel and local linear matching
models are negative, the other models yield positive treatment effects on STAAR 2015 math
achievement. However, these differences are not concerning as the magnitude of the estimates
are relatively small and non-significant. There appears to be no evidence that the primary
findings are driven by unobserved differences between non-adopters and state-adopters.
In the second falsification test, we use 3rd grade TELPAS scores from spring 2012 as the
outcome variable. By the end of the 2011-2012 school year, 3rd-graders will have been exposed
to the ELD curricula for no more than one year. Since ELD curricular materials were adopted
during the 2011-2012 school year, it is unlikely that the materials had a large impact on English
proficiency less than a year after implementation. If there are significant curricular impacts, then
the impact should be smaller in magnitude than the impact on TELPAS spring 2015 scores.
Indeed, there are no significant differences between 3rd graders in treatment and control schools
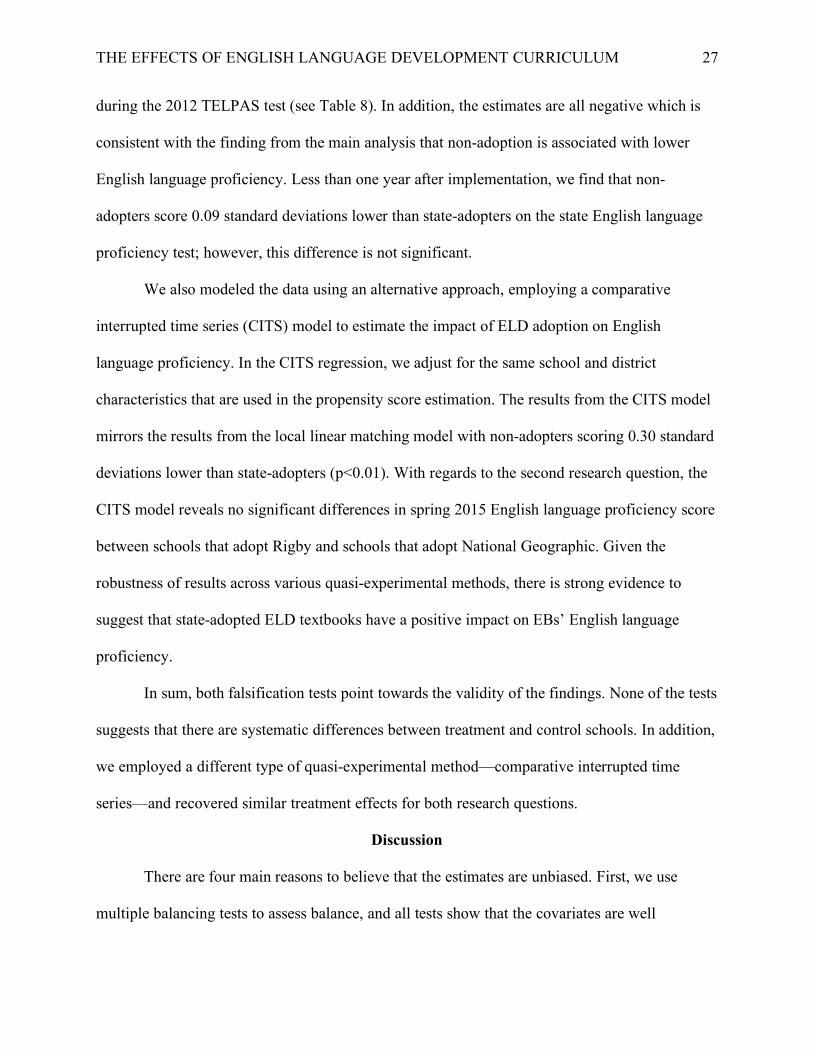
THE EFFECTS OF ENGLISH LANGUAGE DEVELOPMENT CURRICULUM 27
during the 2012 TELPAS test (see Table 8). In addition, the estimates are all negative which is
consistent with the finding from the main analysis that non-adoption is associated with lower
English language proficiency. Less than one year after implementation, we find that non-
adopters score 0.09 standard deviations lower than state-adopters on the state English language
proficiency test; however, this difference is not significant.
We also modeled the data using an alternative approach, employing a comparative
interrupted time series (CITS) model to estimate the impact of ELD adoption on English
language proficiency. In the CITS regression, we adjust for the same school and district
characteristics that are used in the propensity score estimation. The results from the CITS model
mirrors the results from the local linear matching model with non-adopters scoring 0.30 standard
deviations lower than state-adopters (p<0.01). With regards to the second research question, the
CITS model reveals no significant differences in spring 2015 English language proficiency score
between schools that adopt Rigby and schools that adopt National Geographic. Given the
robustness of results across various quasi-experimental methods, there is strong evidence to
suggest that state-adopted ELD textbooks have a positive impact on EBs’ English language
proficiency.
In sum, both falsification tests point towards the validity of the findings. None of the tests
suggests that there are systematic differences between treatment and control schools. In addition,
we employed a different type of quasi-experimental method—comparative interrupted time
series—and recovered similar treatment effects for both research questions.
Discussion
There are four main reasons to believe that the estimates are unbiased. First, we use
multiple balancing tests to assess balance, and all tests show that the covariates are well
THE EFFECTS OF ENGLISH LANGUAGE DEVELOPMENT CURRICULUM 28
balanced. The standardized difference of the propensity score is nearly zero and the variance
ratio is close to 1. Second, we include pretest measures of the outcome variable, which some
researchers argue is the most important factor in propensity score analysis (Shadish and Steiner
2010). Third, through interviewing district leaders in Texas, we are able to study the selection
process. This allows us to choose a rich set of relevant covariates to estimate the propensity
score. Fourth, the treatment effect remains robust across various matching models and a CITS
regression.
It is also important to discuss what this study is not suggesting. This study does not
suggest that off-list ELD materials, or ELD materials that are not on the state-adopted list, are
ineffective for ELD instruction. Off-list ELD curricula such as EL Achieve and Carousel of
IDEAS may also be effective but due to small sample size we were not able to evaluate the
effectiveness of off-list texts.
Conclusion
This study makes two contributions to the research literature on curricular effectiveness.
This study is the first to assess the effectiveness of ELD curricular materials at the state level.
Prior studies on textbook effectiveness have focused on math textbooks. Furthermore, this study
makes use of a unique dataset comprised of ELD curricular materials adoptions in the state of
Texas. No prior studies have looked at curricular effectiveness in Texas. Texas is an appropriate
state for the proposed study as it services the second highest number of EBs in the United States.
Second, the study contributes to the larger research literature on English language
development which is sparse. Saunders, Goldenberg, and Marcelletti (2008) conduct the most
comprehensive review of ELD instructional practices and find that little research examines the
effects of ELD instruction on EBs’ academic achievement. In fact, since ELD research is so
THE EFFECTS OF ENGLISH LANGUAGE DEVELOPMENT CURRICULUM 29
scant, the authors had to rely on second language research in other fields to inform their ELD
guidelines. For example, some of the studies included in their synthesis focused on English
learners in Quebec, Canada. This study contributes directly to the research literature on ELD
because it focuses on English language learners in the United States.
The current study is not able to capture the variation across and within districts with
regards to ELD curriculum implementation. It is likely that the impact of ELD curriculum on
EBs’ achievement is mediated by the degree of implementation. If there is a significant
relationship between degree of implementation and EBs’ academic outcomes, then it is important
to understand the nature of that relationship. Furthermore, if implementation fidelity is mediated
by certain factors (e.g., practitioners’ beliefs about second language acquisition), then it is of
import to identify these mediating factors so that barriers to implementation can be addressed.
Qualitative data from interviews with district leaders reveal that there is confusion about
the purpose of ELD instruction and how it differs from instruction for monolingual English-
speakers. For instance, some district leaders believe that instruction for EBs is “just good
teaching” (JGT), and, therefore, there is no need to purchase materials specifically for EBs. In
other words, whatever works for monolingual English-speakers is sufficient to address the
academic and linguistic needs of EBs. This finding is not new as previous research has found
that a “just good teaching” approach is not adequate to meet the academic and linguistic needs of
EBs (De Jong and Harper 2005). Ten years after De Jong and Harper coined the term JGT to
describe this phenomenon, we find that the JGT view of teaching EBs is still pervasive. In short,
we reiterate De Jong and Harper’s (2005) call to explicitly include EBs at all levels of
educational policy and practice. If there are expectations that content standards be explicitly and
rigorously addressed, the same expectation should exist for English language proficiency
THE EFFECTS OF ENGLISH LANGUAGE DEVELOPMENT CURRICULUM 30
standards. Otherwise, a double standard exists based on language which is effectively a proxy for
national origin (Lau v. Nichols, 1974).
Castañeda v. Pickard (1981) mandated that educational programs for EBs be tested for
program efficacy, which is what we attempt to do in this study. Using local linear matching, we
find that students in non-adopting districts have lower English proficiency relative to those in
state-adopting districts. Schools that do not have curricula that foreground English language
proficiency should consider obtaining instructional materials that explicitly address forms of
English, provide ample opportunities to develop all four language modalities, and integrate
conversational and academic language. Though there is evidence to suggest that ELD
instructional materials can improve English language proficiency, much more work needs to be
done to adequately meet the academic and linguistic needs of EBs (e.g., tracking of EBs,
resegregation efforts that concentrate EBs in low-income schools). Implementing high quality
ELD curricula is only one part of an educational agenda that seeks to redress educational
inequities faced by emergent bilinguals.
THE EFFECTS OF ENGLISH LANGUAGE DEVELOPMENT CURRICULUM 31
References
Abadie, Alberto, and Guido W. Imbens. 2008. "On the failure of the bootstrap for matching
estimators." Econometrica 76 (6): 1537-1557.
Agodini, Roberto, Barbara Harris, Sally Atkins-Burnett, Sheila Heaviside, Timothy Novak, and
Robert Murphy. 2010. "Achievement Effects of Four Early Elementary School Math
Curricula: Findings from First Graders in 39 Schools. (NCEE 2011-4001). Washington,
DC: National Center for Education Evaluation and Regional Assistance, U.S. Department
of Education, Institute of Education Sciences.
Alajmi, Amal Hussain. 2009. "Addressing computational estimation in the Kuwaiti curriculum:
teachers’ views." Journal of Mathematics Teacher Education 12 (4): 263-283.
Alajmi, Amal Hussain. 2012. "How do elementary textbooks address fractions? A review of
mathematics textbooks in the USA, Japan, and Kuwait." Educational Studies in
Mathematics 79 (2): 239-261.
Arnold, Jane. 1999. Affect in language learning. Cambridge, MA: Cambridge University Press.
Bhatt, Rachana, and Cory Koedel. 2012. "Large-Scale Evaluations of Curricular Effectiveness
The Case of Elementary Mathematics in Indiana." Educational Evaluation and Policy
Analysis 34 (4): 391-412.
Bhatt, Rachana, Cory Koedel, and Douglas Lehmann. "Is curriculum quality uniform? Evidence
from Florida." Economics of Education Review 34: 107-121.
Black, Dan A., and Jeffrey A. Smith. 2004. "How robust is the evidence on the effects of college
quality? Evidence from matching." Journal of Econometrics 121 (1): 99-124.
Blazar, David, Blake Heller, Thomas J. Kane, Morgan Polikoff, Douglas Staiger, Scott Carrell,
Dan Goldhaber, Douglas Harris, Rachel Hitch, Kristian L. Holden, and Michal
THE EFFECTS OF ENGLISH LANGUAGE DEVELOPMENT CURRICULUM 32
Kurlaender. 2019. Learning by the book: Comparing math achievement growth by
textbook in six Common Core states. Cambridge, MA: Center for Education Policy
Research, Harvard University.
Bowler, Mike. 1978. "Textbook publishers try to please all, but first they woo the heart of
Texas." The Reading Teacher 31 (5): 514-518.
Burke, April M., Trish Morita-Mullaney, and Malkeet Singh. "Indiana Emergent Bilingual
Student Time to Reclassification: A Survival Analysis." American Educational Research
Journal 53 (5): 1310-1342.
Caliendo, Marco, and Sabine Kopeinig. 2008. "Some practical guidance for the implementation
of propensity score matching." Journal of economic surveys 22 (1): 31-72.
Capps, Randy, Michael Fix, Julie Murray, Jason Ost, Jeffrey S. Passel, and Shinta Herwantoro.
2005. The New Demography of America’s Schools: Immigration and the No Child Left
Behind Act. Washington, DC: Urban Institute.
Castañeda v. Pickard. 1981. 648 F.2d 989 (5th Cir.).
Chingos, Matthew M., and Grover J. Whitehurst. 2012. Choosing blindly: Instructional
materials, teacher effectiveness, and the Common Core. Washington, DC: Brookings
Institution.
Cook, Thomas D., and Peter M. Steiner. 2010. "Case matching and the reduction of selection
bias in quasi-experiments: The relative importance of pretest measures of outcome, of
unreliable measurement, and of mode of data analysis." Psychological methods 15 (1):
56.
THE EFFECTS OF ENGLISH LANGUAGE DEVELOPMENT CURRICULUM 33
De Jong, Ester J., and Candace A. Harper. 2005. "Preparing mainstream teachers for English-
language learners: Is being a good teacher good enough?." Teacher Education
Quarterly 32 (2): 101-124.
Dehejia, Rajeev H., and Sadek Wahba. "Propensity score-matching methods for nonexperimental
causal studies." Review of Economics and statistics 84, (1): 151-161.
Education Week (2011). English-Language Learners. Accessed October 2, 2015,
http://www.edweek.org/ew/issues/english-language-learners/.
García, Ofelia. 2009. "Emergent Bilinguals and TESOL: What's in a Name?." Tesol Quarterly 43
(2): 322-326.
Genesee, Fred, Kathryn Lindholm-Leary, William Saunders, and Donna Christian. 2005.
"English language learners in US schools: An overview of research findings." Journal of
Education for Students Placed at Risk 10 (4): 363-385.
Glazerman, Steven, Dan M. Levy, and David Myers. 2003. "Nonexperimental versus
experimental estimates of earnings impacts." The Annals of the American Academy of
Political and Social Science 589, (1): 63-93.
Grant, Rosalie, H. Gary Cook, and Aek Phakiti. 2011. "Relationships between Language
Proficiency and Mathematics Achievement." Madison, WI: WIDA Consortium.
Guo, Shenyang, and Mark W. Fraser. 2010. "Propensity score analysis: Statistical methods and
analysis." Thousand Oaks, CA: Sage Publishing.
Heckman, James J., Hidehiko Ichimura, and Petra E. Todd. 1997. "Matching as an econometric
evaluation estimator: Evidence from evaluating a job training programme." The review of
economic studies 64 (4): 605-654.
THE EFFECTS OF ENGLISH LANGUAGE DEVELOPMENT CURRICULUM 34
Heckman, James J., Hidehiko Ichimura, and Petra Todd. 1998. "Matching as an econometric
evaluation estimator." The Review of Economic Studies 65 (2): 261-294.
Ho, Daniel E., Kosuke Imai, Gary King, and Elizabeth A. Stuart. 2007. "Matching as
nonparametric preprocessing for reducing model dependence in parametric causal
inference." Political analysis 15 (3): 199-236.
Horwitz, Elaine K. 1999. "Cultural and situational influences on foreign language learners'
beliefs about language learning: A review of BALLI studies." System 27 (4): 557-576.
Koedel, Cory, Diyi Li, Morgan S. Polikoff, Tenice Hardaway, and Stephani Wrabel. 2017.
“Mathematics curriculum effects on student achievement in California.” AERA Open 3
(1): 1-22.
Krashen, Stephen. "Second language acquisition." Second Language Learning : 19-39.
Lau vs. Nichols. 1974. "414 US 563, 94S."
Menken, Kate, and Cristian Solorza. 2014. "No child left bilingual accountability and the
elimination of bilingual education programs in New York City schools." Educational
Policy 28 (1): 96-125.
Namey, Emily, Greg Guest, Lucy Thairu, and Laura Johnson. 2008. "Data reduction techniques
for large qualitative data sets." Handbook for team-based qualitative research (2008):
137-161.
National Center for Education Statistics. 2019. Digest of education statistics. Washington, DC:
Author.
National Clearinghouse for English Language Acquisition. 2008. English Learner Resources.
Accessed September 21, 2015, http://www.ncela.us/data/dataclearinghouse.
THE EFFECTS OF ENGLISH LANGUAGE DEVELOPMENT CURRICULUM 35
National Education Association. 2008. English Language Learners Face Unique Challenges.
Washington, D.C.: National Education Association.
Orfield, Gary, and Chungmei Lee. 2006. "Racial transformation and the changing nature of
segregation." Cambridge, MA: Harvard Civil Rights Project.
Orfield, Gary. 2001. "Schools more separate: Consequences of a decade of resegregation."
Cambridge, MA: Harvard Civil Rights Project.
Rios-Aguilar, Cecilia, and Patricia Gandara. 2012. "Horne v. Flores and the future of language
policy." Teachers College Record 114 (9)” 1-13.
Robitaille, David F., and Kenneth J. Travers. 1992. “International studies of achievement in
mathematics.” In D. A. Grouws (Ed.), Handbook of research in mathematics teaching
and learning (pp. 687–709). New York, NY: Macmillan.
Rosenbaum, Paul R., and Donald B. Rubin. 1983. "The central role of the propensity score in
observational studies for causal effects." Biometrika 70 (1): 41-55.
Rubin, Donald B. 2001. "Using propensity scores to help design observational studies:
application to the tobacco litigation." Health Services and Outcomes Research
Methodology 2 (3-4): 169-188.
Saldaña, Johnny. 2013. The coding manual for qualitative researchers. Thousand Oaks, CA:
Sage.
Saunders, William, Claude Goldenberg, and David Marcelletti. 2013. "English Language
Development: Guidelines for Instruction." American Educator 37 (2): 13-39.
Shadish, William R., and Peter M. Steiner. 2010. "A primer on propensity score
analysis." Newborn and Infant Nursing Reviews 10 (1): 19-26.
THE EFFECTS OF ENGLISH LANGUAGE DEVELOPMENT CURRICULUM 36
Shadish, William R., Thomas D. Cook, and Donald T. Campbell. 2002. Experimental and quasi-
experimental designs for generalized causal inference. Boston, MA: Wadsworth Cengage
Learning.
Smith, Jeffrey A., and Petra E. Todd. 2005. "Does matching overcome LaLonde's critique of
nonexperimental estimators?." Journal of econometrics 125 (1): 305-353.
Stein, Carol Stuen, Douglas Carnine, Roger M. Long, Marcy. 2001. "Textbook evaluation and
adoption." Reading & Writing Quarterly 17 (1): 5-23.
Steiner, Peter M., and David Cook. 2013. "Matching and propensity scores." The Oxford
handbook of quantitative methods vol 1: 237-259.
Stuart, Elizabeth A. 2010. "Matching methods for causal inference: A review and a look
forward." Statistical science: a review journal of the Institute of Mathematical
Statistics 25, (1): 1-21.
Texas Education Agency. 2011. “Textbook funding and adoption process gets overhauled.”
Texas Education Agency. Accessed February 3, 2016,
http://www.tea.texas.gov/WorkArea/DownloadAsset.aspx?id=2147502085
Texas Education Agency. 2014. “Reports and Data.” Accessed October 1, 2015,
http://tea.texas.gov/Reports_and_Data/.
Texas Education Agency. 2015a. “A Brief Overview of the Adoption Process.” Accessed
October 1, 2015, http://tea.texas.gov/interiorpage.aspx?id=2147485614.
Texas Education Agency. 2015b. “Interpreting Assessment Reports.” Accessed September 27,
2016, http://tea.texas.gov/student.assessment/interpguide/
Texas Education Agency. 2016. “Texas English Language Proficiency Assessment System.”
Texas Education Agency.
THE EFFECTS OF ENGLISH LANGUAGE DEVELOPMENT CURRICULUM 37
Zeringue, Julie Koehler, Deborah Spencer, June Mark, Katherine Schwinden, and M. A. Newton.
2010. "Influences on mathematics textbook selection: What really matters." San Diego,
CA: NCTM Research Pre-session.
THE EFFECTS OF ENGLISH LANGUAGE DEVELOPMENT CURRICULUM 38
Table 1 Number of schools that adopted each curriculum in Texas for grade 3 (N=1,253) Number of Schools % of Schools
State-adopted Texts National Geographic Reach 551 44% Rigby On Our Way to English 310 25% McGraw-Hill Texas Treasure Chest 83 7% Pearson Longman Cornerstone 20 2% Santillana Spotlight on English 0 0% Achieve3000 (online) 0 0% ESL Reading Smart 0 0% Non-State-Adopted Book 16 1% No ELD textbook adoption 253 20%
THE EFFECTS OF ENGLISH LANGUAGE DEVELOPMENT CURRICULUM 39
Table 2 Construction of the Analytic Sample
Schools % of total Districts % of total
Initial Universe 3,085 651 Reason for exclusion Non-uniform adopted, grades k-3 -95 3.1 47 7.2 Missing outcome variable (TELPAS 2015) -1486 48.2 410 63.0 Missing textbook information -21 0.7 3 0.5 HISD or DISD -230 7.5 2 0.3 0.03Missing covariates 0 0 0 0
Final Analytic Sample 1,253 40.6 189 29.3
THE EFFECTS OF ENGLISH LANGUAGE DEVELOPMENT CURRICULUM 40
Table 3 Covariate-by-Covariate Balancing Details for the Comparison Between No ELD Text and State-Adopted ELD Text
Mean for Treated
Mean for Control
Standardized difference t-test p-value Variance(T)/
Variance(C) School Characteristics
Enrollment 619.59 632.34 -0.072 -0.85 0.397 0.77 Share ELL 0.41 0.41 -0.017 -0.2 0.841 1.49
Share Hispanic 0.68 0.72 -0.172 -1.96 0.05 1.15 Share SPED 0.07 0.07 0.09 0.96 0.335 1.04
Average Teacher Years of Experience 10.69 10.99 -0.112 -1.13 0.257 0.86 Number of Bilingual Teachers 24.24 28.67 -0.255 -2.5 0.013* 0.78
Bilingual Program Indicator 0.9 0.94 -0.107 -1.47 0.142 -- School Outcomes
School Average Math Score 590.62 592.07 -0.05 -0.56 0.578 1.08 School Average ELL Math score 586.74 587.76 -0.028 -0.3 0.764 1.02
School Average ELA Score 601.15 599.41 0.054 0.61 0.539 1.26 School Average ELL ELA Score 587.26 586.19 0.025 0.26 0.793 0.87
District Characteristics District Enrollment 31360.03 29779.48 0.039 0.69 0.488 0.74
Share ELL 22.44 21.03 0.112 1.26 0.21 1.76 Per Pupil Expenditure 10924.73 11211.18 -0.118 -1.33 0.183 3.77
Total Revenue Per Pupil 1348.79 1399.63 -0.093 -0.92 0.36 1.4 Urbanicity 4.08 3.93 0.051 0.5 0.618 0.58
District Outcomes District Avg TELPAS Score 3.08 3.08 -0.004 -0.04 0.966 0.93 District Average Math Score 596.02 595.68 0.018 0.2 0.844 1.03
District Avg Math Score for ELLs 587 587.13 -0.006 -0.07 0.945 1.61 District Average ELA Score 609.87 608.22 0.077 0.87 0.384 1.07
District Avg ELA Score for ELLs 587.98 585.54 0.104 1.12 0.262 1.46 District-Area Characteristics (Census)
Median Household Income 47976.89 46785.11 0.08 0.82 0.413 1.09 Share Non-English Speakers 42.85 43.21 -0.014 -0.15 0.879 1.13
Propensity score 0.34 0.34 0 0.00 0.997 1
THE EFFECTS OF ENGLISH LANGUAGE DEVELOPMENT CURRICULUM 41
Note. *p<0.05; **p<0.01; ***p<0.001
THE EFFECTS OF ENGLISH LANGUAGE DEVELOPMENT CURRICULUM 42
Table 4 Covariate-by-Covariate Balancing Details for the Comparison Between Rigby On Our Way to English and National Geographic
Reach Mean for
Treated Mean for Control
Standardized difference t-test p-value Variance(T)/
Variance(C) School Characteristics
Enrollment 670.99 695.17 -0.126 -1.53 0.127 1.07 Share ELL 39.2 38.01 0.067 0.91 0.365 1.16
Share Hispanic 0.71 0.69 0.103 1.21 0.225 0.86 Share SPED 7.4 7.78 -0.15 -1.94 0.053 1.45
Average Teacher Years of Experience 10.92 11.09 -0.066 -0.77 0.439 0.93 Number of Bilingual Teachers 21.85 18.61 0.188 2.14 0.033* 1.1
Bilingual Program Indicator 0.88 0.91 -0.097 -1.26 0.209 -- School Outcomes
School Average Math Score 585.29 585.61 -0.011 -0.13 0.895 0.84 School Average ELL Math score 583.44 580.96 0.068 0.84 0.404 0.84
School Average ELA Score 594.97 596.91 -0.06 -0.76 0.446 1.08 School Average ELL ELA Score 583.58 583.74 -0.004 -0.05 0.962 0.93
District Characteristics
District Enrollment 37628.28 36155.02 0.032 0.81 0.418 0.97 Share ELL 20.75 19.81 0.098 1.25 0.213 0.45
Per Pupil Expenditure 11195.11 11306.95 -0.067 -0.69 0.49 0.86 Total Revenue Per Pupil 1305.36 1222.28 0.167 1.84 0.067 1.03
Urbanicity 2.46 2.68 -0.083 -0.91 0.361 1.05 District Outcomes
District Avg TELPAS Score 3.15 3.15 -0.02 -0.24 0.81 0.9 District Average Math Score 592.09 593.71 -0.088 -1.08 0.282 0.8
District Avg Math Score for ELLs 583.21 584.67 -0.081 -0.95 0.344 0.73 District Average ELA Score 605.4 606.88 -0.074 -0.91 0.362 0.95
District Avg ELA Score for ELLs 584.19 585.35 -0.058 -0.71 0.48 0.87 District-Area Characteristics (Census)
Median Household Income 47996.23 50695.91 -0.189 -2 0.046* 0.81 Share Non-English Speakers 47.95 46.59 0.06 0.67 0.505 0.97
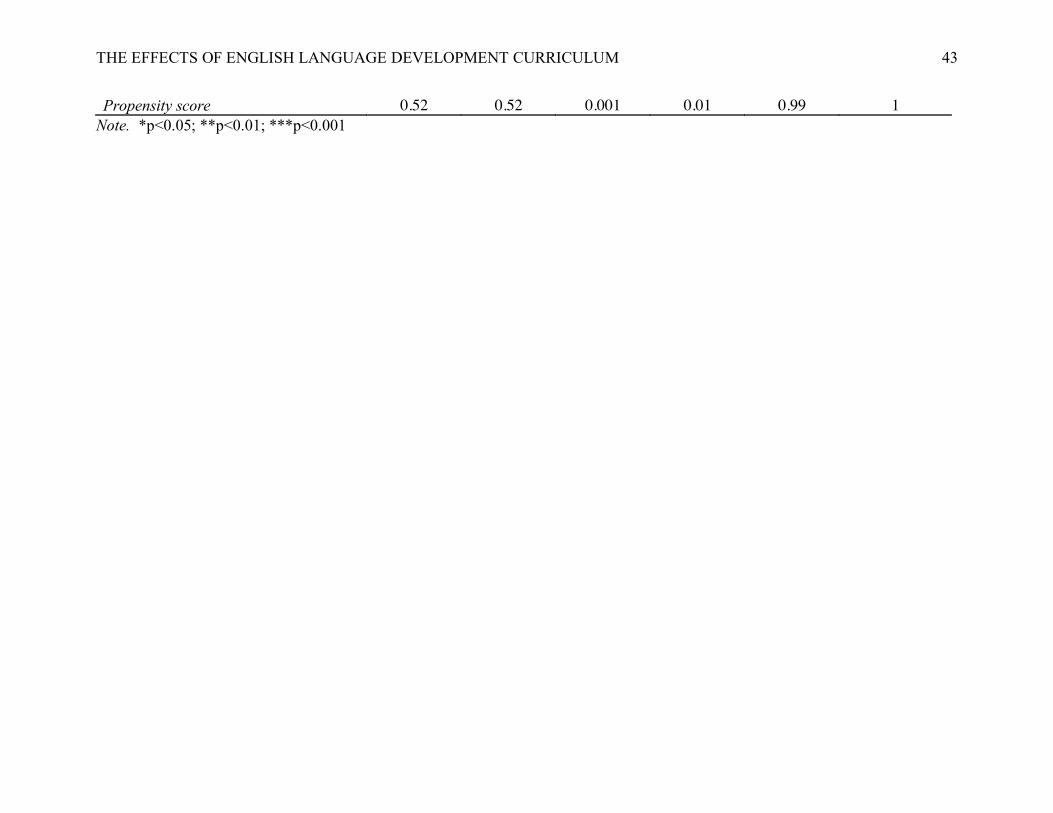
THE EFFECTS OF ENGLISH LANGUAGE DEVELOPMENT CURRICULUM 43
Propensity score 0.52 0.52 0.001 0.01 0.99 1 Note. *p<0.05; **p<0.01; ***p<0.001

THE EFFECTS OF ENGLISH LANGUAGE DEVELOPMENT CURRICULUM 44
Table 5 Average treatment effects of non-adoption relative to state-adopted ELD instructional materials
on TELPAS spring 2015 composite scores LLR Kernel IPWRA K1 K2 K3 Treatment effect -0.30* -0.31* -0.35*** -0.28*** -0.33*** -0.35***
(0.15) (0.15) (0.07) (0.09) (0.08) (0.07)
N (schools) 1,024 1,024 1024 1024 1024 1024 Note. Standard errors are in parentheses. Standard errors are estimated by bootstrapping using 250 repetitions and clustered at the district level for the local linear and kernel matching models. Robust standard errors are calculated for K1 matching and IPWRA models. *p<0.05; **p<0.01; ***p<0.001
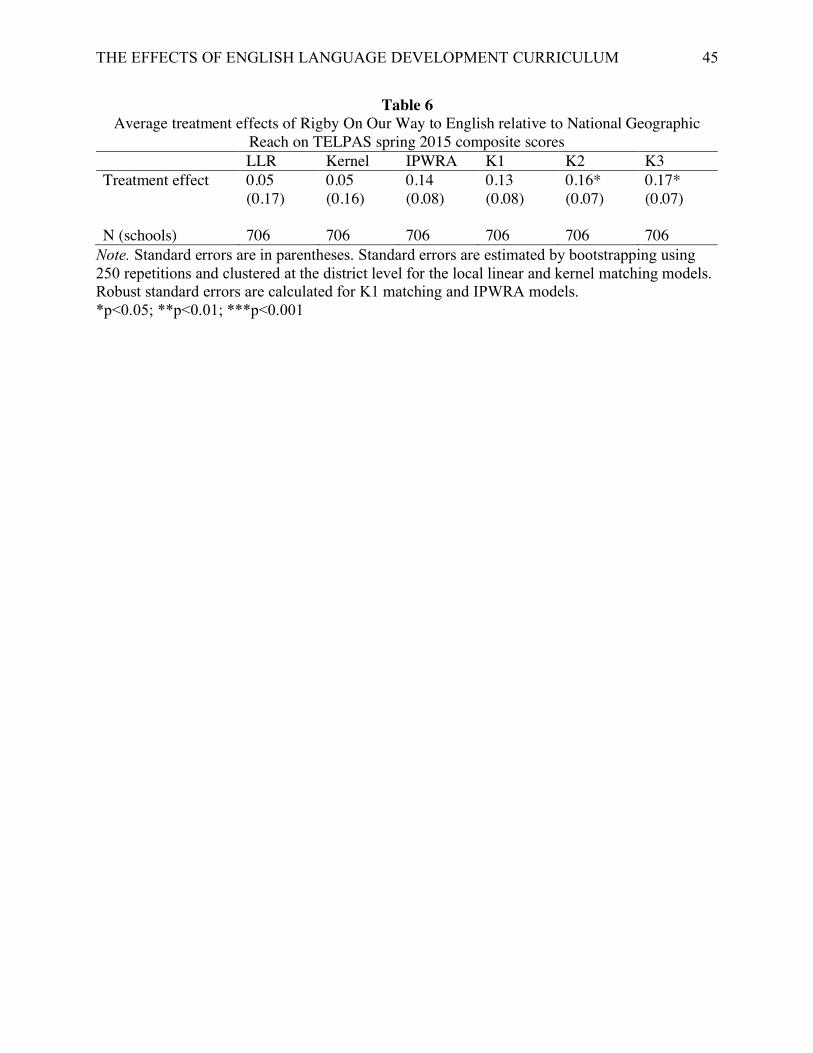
THE EFFECTS OF ENGLISH LANGUAGE DEVELOPMENT CURRICULUM 45
Table 6 Average treatment effects of Rigby On Our Way to English relative to National Geographic
Reach on TELPAS spring 2015 composite scores LLR Kernel IPWRA K1 K2 K3 Treatment effect 0.05 0.05 0.14 0.13 0.16* 0.17*
(0.17) (0.16) (0.08) (0.08) (0.07) (0.07)
N (schools) 706 706 706 706 706 706 Note. Standard errors are in parentheses. Standard errors are estimated by bootstrapping using 250 repetitions and clustered at the district level for the local linear and kernel matching models. Robust standard errors are calculated for K1 matching and IPWRA models. *p<0.05; **p<0.01; ***p<0.001
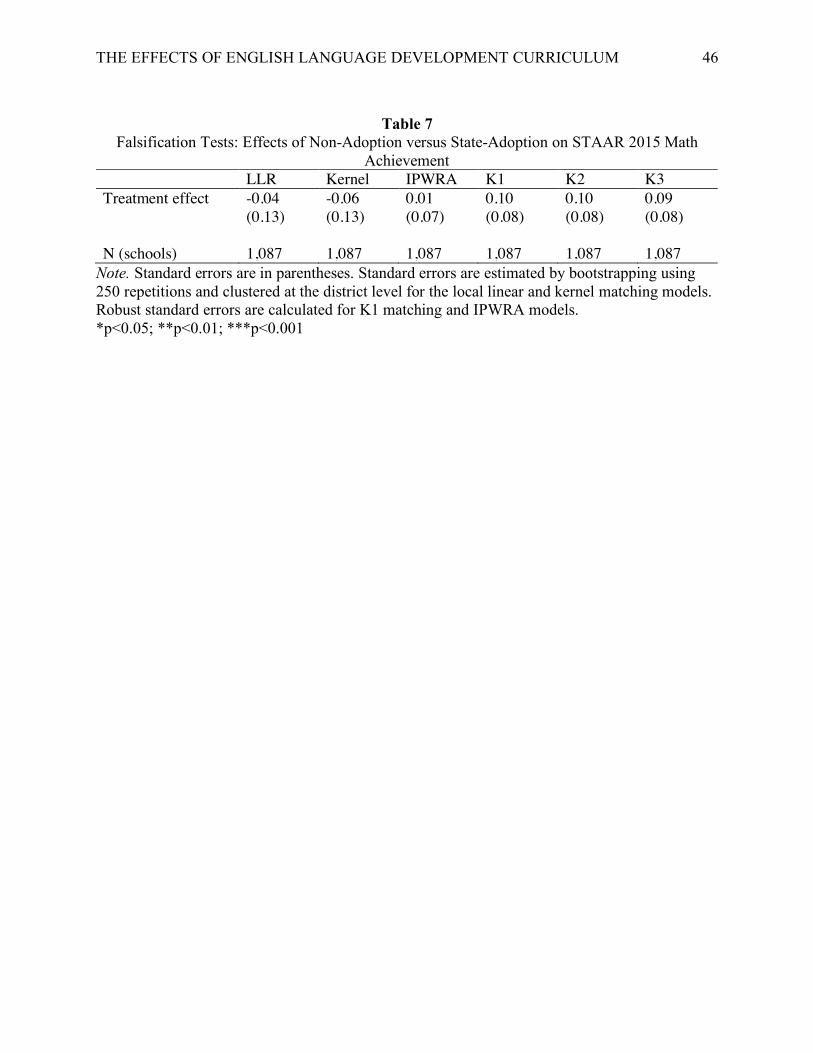
THE EFFECTS OF ENGLISH LANGUAGE DEVELOPMENT CURRICULUM 46
Table 7
Falsification Tests: Effects of Non-Adoption versus State-Adoption on STAAR 2015 Math Achievement
LLR Kernel IPWRA K1 K2 K3 Treatment effect -0.04 -0.06 0.01 0.10 0.10 0.09
(0.13) (0.13) (0.07) (0.08) (0.08) (0.08)
N (schools) 1,087 1,087 1,087 1,087 1,087 1,087 Note. Standard errors are in parentheses. Standard errors are estimated by bootstrapping using 250 repetitions and clustered at the district level for the local linear and kernel matching models. Robust standard errors are calculated for K1 matching and IPWRA models. *p<0.05; **p<0.01; ***p<0.001

THE EFFECTS OF ENGLISH LANGUAGE DEVELOPMENT CURRICULUM 47
Table 8 Falsification Tests: Effects of Non-Adoption versus State-Adoption on 2011-2012 3rd-grade
TELPAS Composite Scores LLR Kernel IPWRA K1 K2 K3 Treatment effect -0.09 -0.06 -0.02 -0.05 -0.06 -0.07
(0.16) (0.16) (0.08) (0.09) (0.08) (0.08)
N (schools) 1,037 1,037 1,037 1,037 1,037 1,037 Note. Standard errors are in parentheses. Standard errors are estimated by bootstrapping using 250 repetitions and clustered at the district level for the local linear and kernel matching models. Robust standard errors are calculated for K1 matching and IPWRA models. *p<0.05; **p<0.01; ***p<0.001
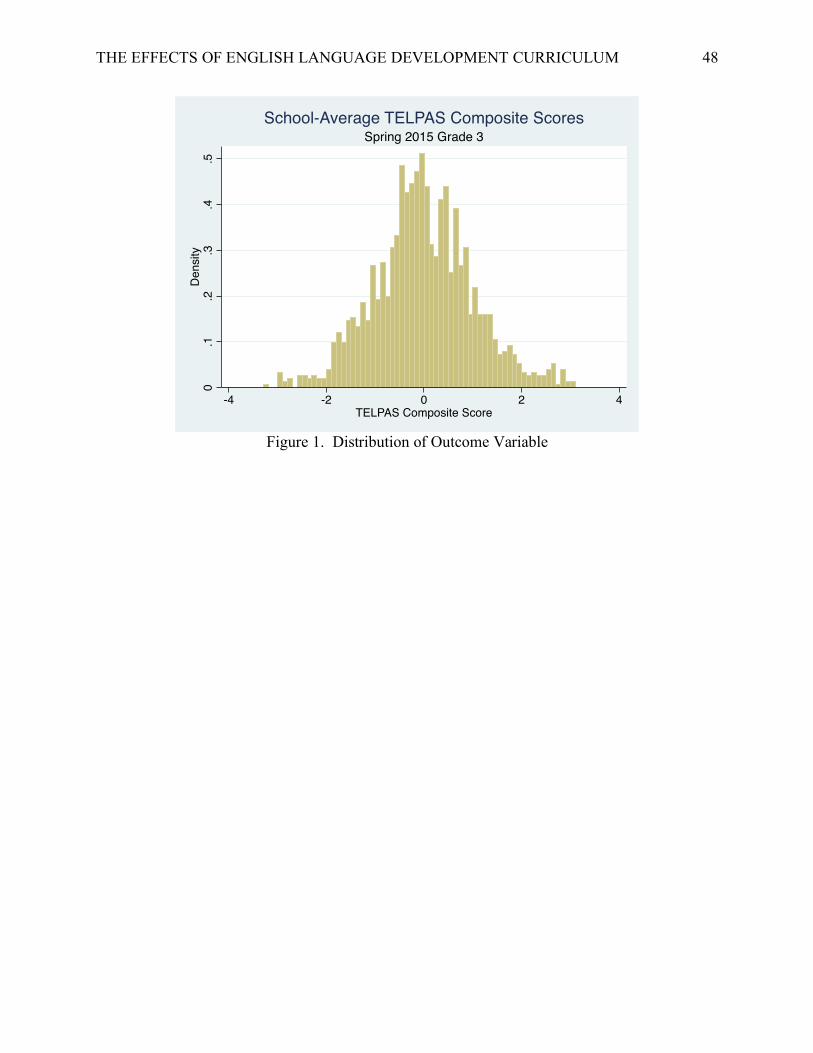
THE EFFECTS OF ENGLISH LANGUAGE DEVELOPMENT CURRICULUM 48
Figure 1. Distribution of Outcome Variable
0.1
.2.3
.4.5
Den
sity
-4 -2 0 2 4TELPAS Composite Score
Spring 2015 Grade 3School-Average TELPAS Composite Scores