
The Economic Impact of Kentucky’s Oil and Gas Industry …eec.ky.gov/Documents/Impact of the Oil...
25
The Economic Impact of Kentucky’s Oil and Gas Industry on Kentucky’s Economy Presented by: Andrew V. McNeill Executive Director – KOGA Research Conducted by: Dr. Paul Coomes, Professor Emeritus of Economics - University of Louisville
Transcript of The Economic Impact of Kentucky’s Oil and Gas Industry …eec.ky.gov/Documents/Impact of the Oil...

The Economic Impact of Kentucky’s Oil and Gas Industry on Kentucky’s Economy
Presented by: Andrew V. McNei l l Execut ive Director – KOGA
Research Conducted by: Dr. Paul Coomes, Professor Emeritus of Economics - Univers ity of Louisvi l le

Gas Production – Kentucky Counties 2010
Source: Special thanks to Brandon Nuttall at KGS for supplying county-level data to create map. Data edited by Paul Coomes, Ph.D.

16,563
16,290
17,152
17,670
14,632
10,000
11,000
12,000
13,000
14,000
15,000
16,000
17,000
18,000
19,000
2007 2008 2009 2010 2011
Producing Gas Wells - Kentucky
Total
Number of Producing Gas Wells: 2007-2011
Source: EIA – www.eia.doe.gov

0.0
50.0
100.0
150.0
200.0
250.0
300.0
350.0
400.0P
ike
Flo
yd
Kn
ott
Let
cher
Per
ry
Mar
tin
Har
lan
Les
lie
Cla
y
Kn
ox
Bel
l
Wh
itle
y
Mag
off
in
Joh
nso
n
Law
ren
ce
Top 5 Counties = 72% of Statewide Production
Top 15 Natural Gas Producing Counties: 2001-2011
Source: Kentucky Geological Survey
Bcf
100 Bcf

Oil Production – Kentucky Counties 2010
Source: Special thanks to Brandon Nuttall at KGS for supplying county-level data to create map. Data edited by Paul Coomes, Ph.D.

3,197,924
2,000,000
2,200,000
2,400,000
2,600,000
2,800,000
3,000,000
3,200,000
3,400,000
Total Barrels 2001 – 2012 = 31,059,015
Total
Average= 2,588,251 bbl
Annual Oil Production: 2001-2012
Source: Kentucky Geological Survey http://kgs.uky.edu/kgsmap/OGProdPlot/OGProduction.asp and EIA.DOE.GOV
2,170,807

0
500
1,000
1,500
2,000
2,500
3,000
3,500
4,000
Hen
der
son
Un
ion
Lee
Les
lie
Mu
hle
nb
erg
Per
ry
Let
cher
Ho
pki
ns
Web
ster
Dav
iess
Mag
off
in
Wo
lfe
Oh
io
Clin
ton
War
ren
Ad
air
McL
ean
Pik
e
Har
lan
Bel
l
Thousand Barrels
1 million barrels
Top 20 Oil Producing Counties: 2001-2011
Top 20 Counties = 85.5% of Statewide Production
Source: Kentucky Geological Survey

$-
$10,000,000
$20,000,000
$30,000,000
$40,000,000
$50,000,000
20
01-
02
20
02
-03
20
03-
04
20
04
-05
20
05-
06
20
06
-07
20
07-
08
20
08
-09
20
09
-10
20
10-1
1
20
11-1
2
Nat Gas Severance
Oil Production Severance
1 million barrels 1 million barrels 1 million barrels
Avg / Year = $33,091,108
Source: Kentucky Geological Survey
Source: Kentucky Dept of Revenue
$ 50,585,729
Oil & Gas: Annual Severance Taxes

$2,449,082.22
$2,511,858.15
$2,841,098.28
$2,968,596.08
$3,024,619.22
$3,083,791.29
$5,019,457.37
$7,175,184.44
$8,696,690.45
$8,918,344.25
$- $4,000,000.00 $8,000,000.00
Bell
Hopkins
Perry
Muhlenberg
Webster
Letcher
Leslie
Lee
Union
Henderson
Oil Production Severance
Oil ProductionSeverance
Oil Production Severance Tax 2002-2012
Source: Kentucky Dept of Revenue

$6,611,827
$6,817,976
$8,355,619
$8,508,261
$16,457,174
$20,235,584
$24,344,182
$31,400,917
$48,303,955 $90,947,616
$0 $25,000,000 $50,000,000 $75,000,000 $100,000,000
CLAY
BELL
LESLIE
KNOX
MARTIN
PERRY
LETCHER
KNOTT
FLOYD
PIKE
Nat Gas Severance
Nat Gas Severance
Natural Gas Severance: By County 2002-2012
Source: Kentucky Dept of Revenue

2418
1367
1230
1097
920
550
$12.69
$3.80 $4.80
$4.54
$2.46
* $4.17
$-
$2.00
$4.00
$6.00
$8.00
$10.00
$12.00
$14.00
0
500
1000
1500
2000
2500
2008 2009 2010 2011 2012 2013
Permits Issued
Horizontal Permits
Wells Completed
Henry Hub Price
Kentucky Oil & Gas: 5 Year Trend
Source: KY Division of Oil and Gas Henry Hub Prices Based upon June of each year. *Exception = April 2013

4652
6074 5963
7231 8106
0
1000
2000
3000
4000
5000
6000
7000
8000
9000
2007 2008 2009 2010 2011
Total
Total
Oil and Gas Extraction: Jobs
Source: Bureau of Economic Analysis www.bea.gov

1013 1092 1000 883 873
3639
4982 4963
6348 7233
0
1000
2000
3000
4000
5000
6000
7000
8000
9000
2007 2008 2009 2010 2011
Proprietors
Wage & Salary
NAISC 211 – Oil and Gas Extraction
Source: Bureau of Economic Analysis www.bea.gov

• Fireborn Energy
• Interest in 220 wells in Kentucky.
• Vice-President • Staking Locations
• Leasing Acreage
• Finance & Management
Industry Snapshot: Wes Cate

• Hay Exploration
• Operations Manager
• B.A. Economics
• M.B.A.
Industry Snapshot: Monica Sturgill

• Attorney at Law
• Viking Exploration LLC
• 11 Natural Gas Wells
• 2 Oil Wells
Industry Snapshot: C.V. Reynolds

Oil & Gas Employment Trends: Wage and Salary Employees
1013
1092
1000
883 873
692 734
657
573
524 615 569
551
446 384
300
400
500
600
700
800
900
1000
1100
1200
2007 2008 2009 2010 2011
211
213112
213111
Henry Hub = $2.46
Oil & Gas Extraction*
Support Activities
Drilling Oil and Gas Wells
Jobs
Year
* Wage & Salary Employees
• * Wage and Salary only. Doesn’t include “Proprietors”. • Source: Kentucky Office of Employment & Training
Henry Hub = $12.69

NAISC Sector Name “Jobs”
211 Oil and Gas Extraction (Proprietors) 7,233
211 Oil and Gas Extraction (Wage & Salary) 873
213111 Drilling Oil and Gas Wells 384
213112 Support Activities for Oil and Gas Operations 524
TOTAL 9,014
An Industry Snapshot: “Jobs”
• Source: Kentucky Office of Employment & Training – 2011 Figures & Bureau of Economic Analysis (BEA) www.bea.gov

NAISC Sector Name “Jobs”
2212 Natural Gas Distribution 790
324110 Petroleum Refineries 680
486110 Pipeline Transportation (Crude Oil) 59
486210 Pipeline Transportation (Natural Gas) 844
32512 Industrial Gas Manufacturing 242
TOTAL (Downstream) 2,615
An Industry Snapshot: “Jobs” (Downstream)
• Source: Kentucky Office of Employment & Training – 2011 Figures & Bureau of Economic Analysis (BEA) www.bea.gov

Sector Name Total Wages Avg. Annual Wage
Oil and Gas Extraction (Wage & Salary) $53,956,295 $61,788
Drilling Oil and Gas Wells $17,310,996 $45,042
Support Activities for Oil and Gas Operations $28,102,028 $53,681
Total Oil & Gas Wages (2011) $99,369,319
Average Annual Wage (2011) $55,794
An Industry Snapshot: Wages
• Source: Kentucky Office of Employment & Training – 2011 Figures & Bureau of Economic Analysis (BEA) www.bea.gov
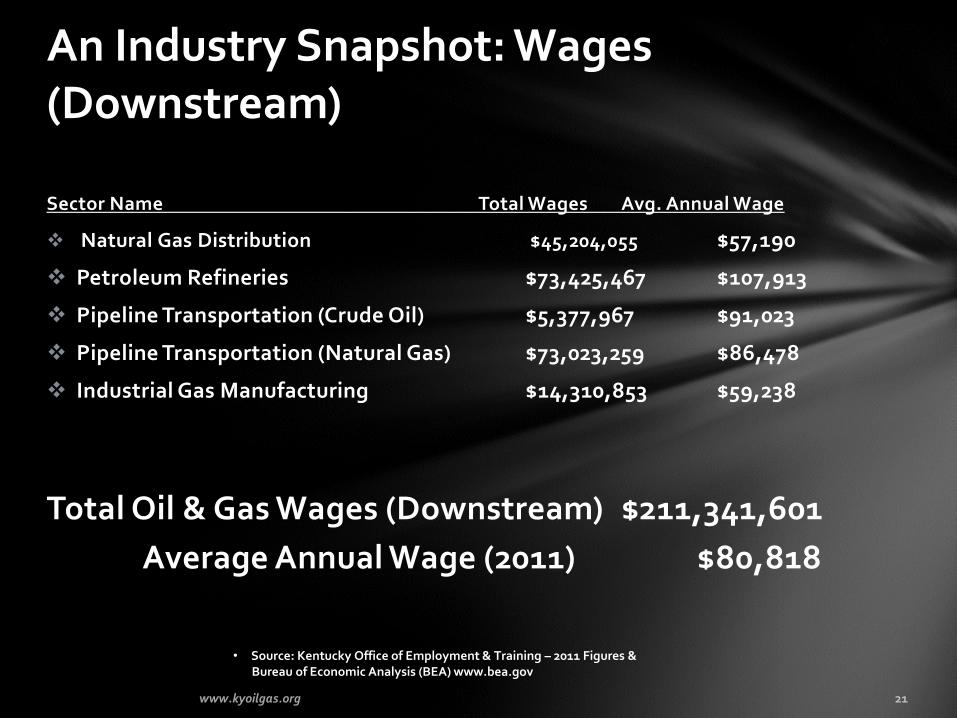
Sector Name Total Wages Avg. Annual Wage
Natural Gas Distribution $45,204,055 $57,190
Petroleum Refineries $73,425,467 $107,913
Pipeline Transportation (Crude Oil) $5,377,967 $91,023
Pipeline Transportation (Natural Gas) $73,023,259 $86,478
Industrial Gas Manufacturing $14,310,853 $59,238
Total Oil & Gas Wages (Downstream) $211,341,601
Average Annual Wage (2011) $80,818
An Industry Snapshot: Wages (Downstream)
• Source: Kentucky Office of Employment & Training – 2011 Figures & Bureau of Economic Analysis (BEA) www.bea.gov

$0
$200,000,000
$400,000,000
$600,000,000
$800,000,000
$1,000,000,000
211213111
213112
$984,609,000
$116,957,000
$317,702,000
Total Value ofShipments
Capital Expenditures
Total = $1.4 billion
2007 Economic Census
211 – Oil and Gas Extraction 213111 – Drilling Oil and Gas Wells 213112 – Support Activities for Oil and Gas Operations

• Total Output (Value of Production)
• Intermediate Expenditures $299,198,8001
• Employee Compensation $ 64,025,090
• Proprietor Income $384,060,700
• Other Property Income $236,971,400
• Indirect Business Taxes $124,551,700
Total Output (Value of Production) = $1,108,807,700
Kentucky Oil and Gas Industry: Total Output (2010)
Source: IMPLAN version 3.0 of Kentucky, using 2010 county-level data. 1 Ex. Support services for oil and gas operations, leasing of nonfinancial intangible assets, valves and fittings, etc.

• Public education about safe hydraulic fracturing practices
• Increased EPA and ESA regulation affecting Kentucky’s industry
• Dry gas prices in a dry gas state
• Planning for potential discovery of shale-like resources.
Opportunities & Challenges for the Oil and Gas Industry Moving Forward

Kentucky Oil & Gas Association www.kyoilgas.org
@kyoilgas
The Economic Impact of the Oil & Gas Industry on Kentucky’s Economy
Presented by: Andrew V. McNeill Executive Director – KY Oil and Gas Association
Research Conducted by: Dr. Paul Coomes, Professor Emeritus of Economics - University of Louisville


![Crude Assay Report · 15 Vacuum Gas Oil Cuts - Gas Oil [325-370°C] 15 16 Vacuum Gas Oil Cuts - Gas Oil 1[370 - 540°C] 16 17 Vacuum Gas Oil Cuts - Heavy Vacuum Gas Oil [370 - 548°C]](https://static.fdocuments.us/doc/165x107/5e68681c2598ff04995c67bc/crude-assay-report-15-vacuum-gas-oil-cuts-gas-oil-325-370c-15-16-vacuum-gas.jpg)